22
Effective Mobile Engagement Report 2016 A study examining customer engagement with organizations via mobile devices
Effective Mobile Engagement Report 2016 A study examining customer engagement with organizations via mobile devices
2 | Effective Mobile Engagement Report 2016
Contents
Summary of Key Findings 3
Mobile Commerce Puts Pressure on Support 4
Mobile Purchasing is Increasing 4
Broken Engagement 4
Seeking Better Assistance 5
Organizations Should Encourage Engagement 5
Human Touch 6
Why Mobile Matters to Your Business 7
Mobile Engagement Satisfaction is Declining 8
Shopping via Mobile Devices 10
How Much Time and Money is Spent When Shopping Using Mobile Devices? 10
Issues Limiting Mobile Spending 10
Impact of the Internet of Things 12
Adoption of IoT is Growing 12
Conclusion 14
Appendix 1: Country Differences 15
Appendix 2: Age Differences 18
Scope of Research/Methodology 21
Research Methodology 21
Aims of the Research 21
3 | Effective Mobile Engagement Report 2016
Mobile devices are an important
part of the shopping experience
More than half (53%) of respondents report that they often or always use their mobile device to research products or services before buying
them.
And 44% often or always use their mobile device to purchase these products or services.
A bad mobile experience can have a huge impact
Following a bad mobile experience, 85% of respondents say that they are unlikely or only somewhat likely to do business with the same
organization again. So what can organizations do to provide their customers with a good mobile experience?
Customers must be able to make direct contact with companies
More than two in five (44%) rank ease of finding support options/contact us information as the most important factor to ensure a good mobile experience…
…and more than seven in ten (72%) report that they have abandoned a mobile experience at some point in the last year because mobile engagement was too difficult to initiate.
Customers use FAQs, but with limited success
53% of respondents report that they always or usually look for FAQs on a retailer’s website or app when they need to get a question answered…
…but only 24% of these respondents report that the FAQs were very successful in answering their question.
Customers want to contact a real person
Nine in ten (91%) agree that there should always be a way to contact a real person during any mobile experience.
Consumers have a mixed response to proactive chat invites
The vast majority (74%) report that they are open to the offer of help if they received a proactive chat invitation while on a mobile website.
However, 26% report that they would be
annoyed by this.
The Internet of Things is likely to encourage in-app communication with organizations
Of respondents who have an app for an internet-connected device, 91% have used the app to engage directly with the company to ask a question or seek support.
Summary of Key Findings
4 | Effective Mobile Engagement Report 2016
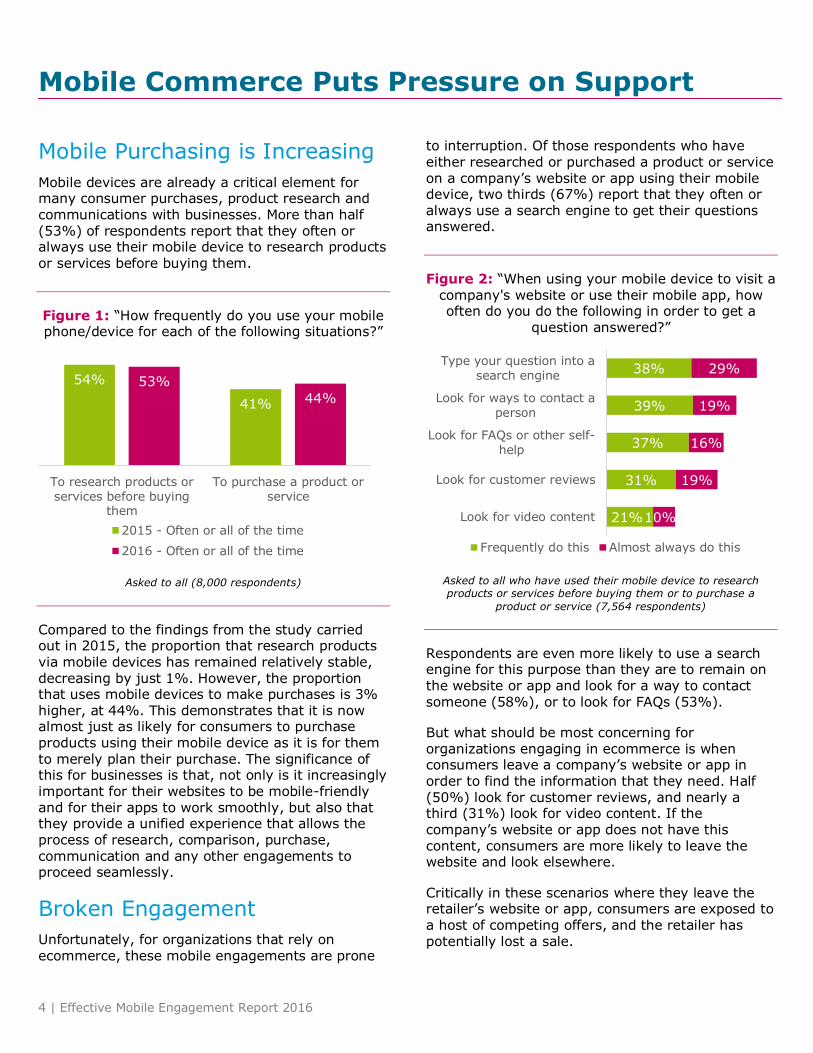
Mobile Purchasing is Increasing
Mobile devices are already a critical element for many consumer purchases, product research and communications with businesses. More than half (53%) of respondents report that they often or always use their mobile device to research products
or services before buying them.
Figure 1: “How frequently do you use your mobile phone/device for each of the following situations?”
Asked to all (8,000 respondents)
Compared to the findings from the study carried out in 2015, the proportion that research products
via mobile devices has remained relatively stable, decreasing by just 1%. However, the proportion that uses mobile devices to make purchases is 3% higher, at 44%. This demonstrates that it is now almost just as likely for consumers to purchase products using their mobile device as it is for them
to merely plan their purchase. The significance of this for businesses is that, not only is it increasingly important for their websites to be mobile-friendly and for their apps to work smoothly, but also that they provide a unified experience that allows the process of research, comparison, purchase,
communication and any other engagements to proceed seamlessly.
Broken Engagement
Unfortunately, for organizations that rely on
ecommerce, these mobile engagements are prone
to interruption. Of those respondents who have
either researched or purchased a product or service on a company’s website or app using their mobile device, two thirds (67%) report that they often or always use a search engine to get their questions answered.
Figure 2: “When using your mobile device to visit a company's website or use their mobile app, how often do you do the following in order to get a
question answered?”
Asked to all who have used their mobile device to research products or services before buying them or to purchase a
product or service (7,564 respondents)
Respondents are even more likely to use a search engine for this purpose than they are to remain on the website or app and look for a way to contact someone (58%), or to look for FAQs (53%).
But what should be most concerning for organizations engaging in ecommerce is when consumers leave a company’s website or app in order to find the information that they need. Half (50%) look for customer reviews, and nearly a third (31%) look for video content. If the company’s website or app does not have this content, consumers are more likely to leave the website and look elsewhere.
Critically in these scenarios where they leave the retailer’s website or app, consumers are exposed to a host of competing offers, and the retailer has potentially lost a sale.
54%
41%
53%
44%
To research products orservices before buying
them
To purchase a product orservice
2015 - Often or all of the time
2016 - Often or all of the time
21%
31%
37%
39%
38%
10%
19%
16%
19%
29%
Look for video content
Look for customer reviews
Look for FAQs or other self-help
Look for ways to contact aperson
Type your question into asearch engine
Frequently do this Almost always do this
Mobile Commerce Puts Pressure on Support
5 | Effective Mobile Engagement Report 2016
But why are mobile customers not getting their needs met from a company’s website or app?
Seeking Better Assistance
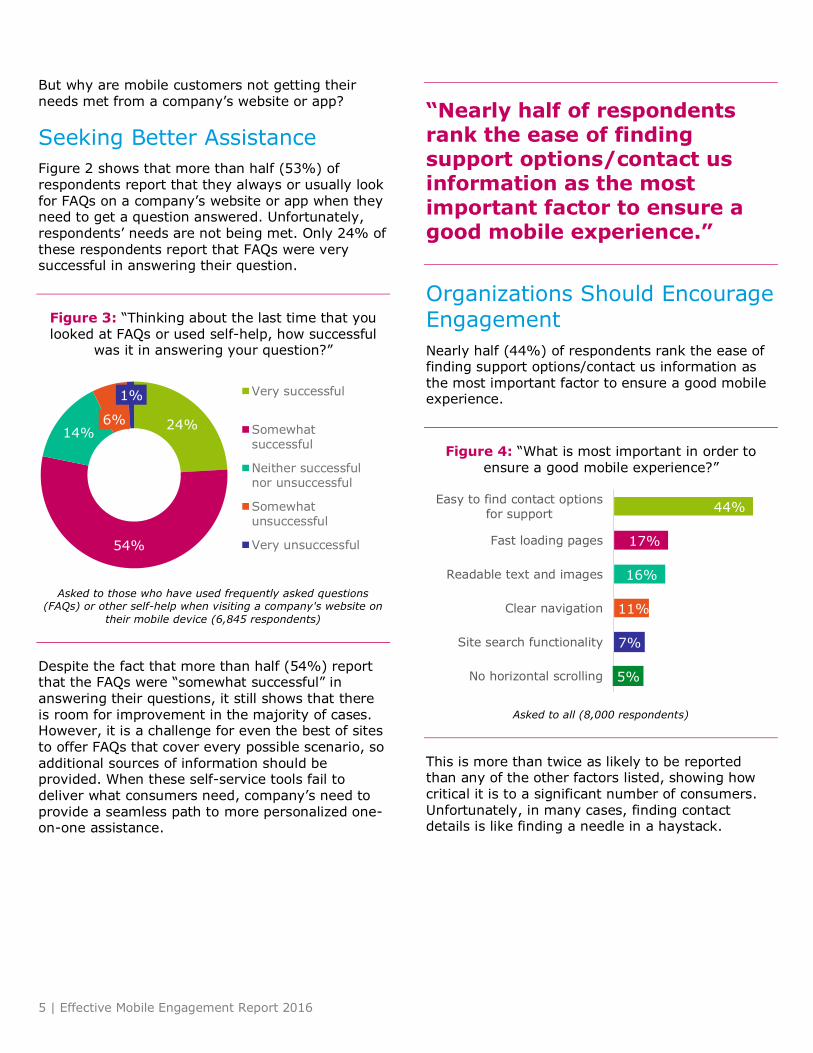
Figure 2 shows that more than half (53%) of respondents report that they always or usually look for FAQs on a company’s website or app when they need to get a question answered. Unfortunately, respondents’ needs are not being met. Only 24% of
these respondents report that FAQs were very successful in answering their question.
Figure 3: “Thinking about the last time that you looked at FAQs or used self-help, how successful
was it in answering your question?”
Asked to those who have used frequently asked questions (FAQs) or other self-help when visiting a company's website on
their mobile device (6,845 respondents)
Despite the fact that more than half (54%) report that the FAQs were “somewhat successful” in answering their questions, it still shows that there is room for improvement in the majority of cases. However, it is a challenge for even the best of sites to offer FAQs that cover every possible scenario, so
additional sources of information should be provided. When these self-service tools fail to deliver what consumers need, company’s need to provide a seamless path to more personalized one-on-one assistance.
“Nearly half of respondents rank the ease of finding support options/contact us information as the most important factor to ensure a good mobile experience.”
Organizations Should Encourage Engagement
Nearly half (44%) of respondents rank the ease of finding support options/contact us information as the most important factor to ensure a good mobile experience.
Figure 4: “What is most important in order to ensure a good mobile experience?”
Asked to all (8,000 respondents)
This is more than twice as likely to be reported than any of the other factors listed, showing how critical it is to a significant number of consumers. Unfortunately, in many cases, finding contact details is like finding a needle in a haystack.
24%
54%
14% 6%
1% Very successful
Somewhatsuccessful
Neither successfulnor unsuccessful
Somewhatunsuccessful
Very unsuccessful
5%
7%
11%
16%
17%
44%
No horizontal scrolling
Site search functionality
Clear navigation
Readable text and images
Fast loading pages
Easy to find contact optionsfor support
6 | Effective Mobile Engagement Report 2016
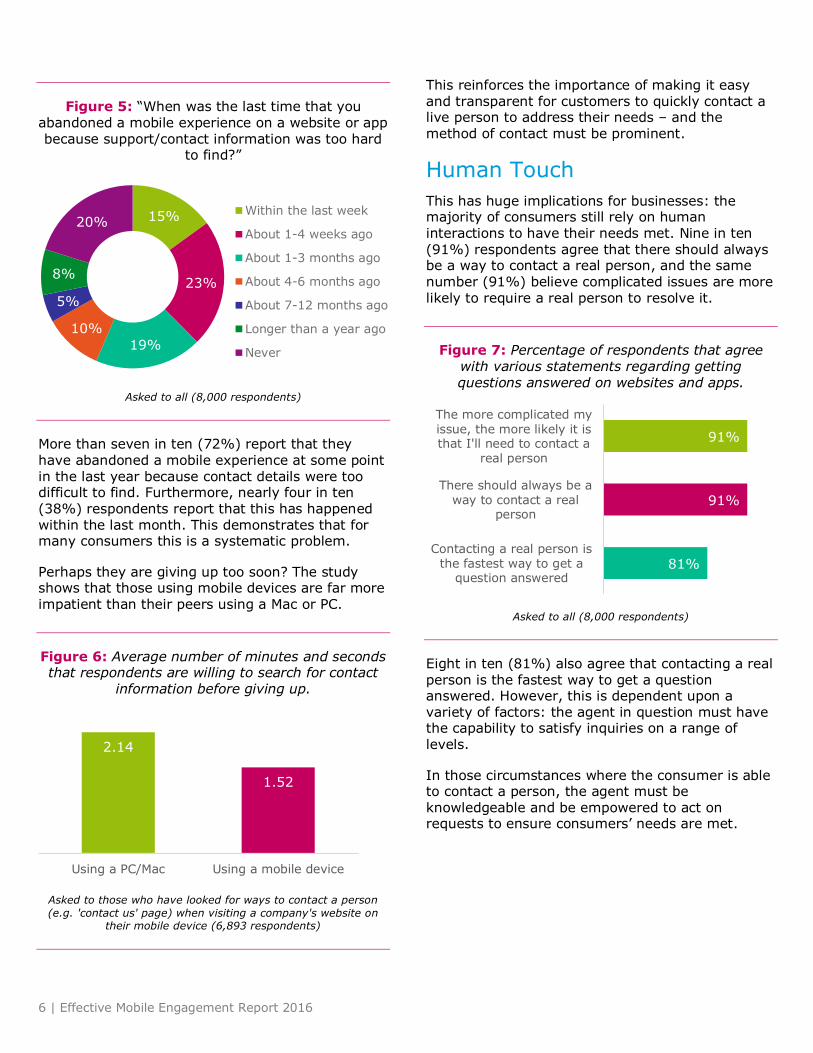
Figure 5: “When was the last time that you abandoned a mobile experience on a website or app because support/contact information was too hard
to find?”
Asked to all (8,000 respondents)
More than seven in ten (72%) report that they
have abandoned a mobile experience at some point in the last year because contact details were too difficult to find. Furthermore, nearly four in ten (38%) respondents report that this has happened within the last month. This demonstrates that for many consumers this is a systematic problem.
Perhaps they are giving up too soon? The study shows that those using mobile devices are far more impatient than their peers using a Mac or PC.
Figure 6: Average number of minutes and seconds that respondents are willing to search for contact
information before giving up.
Asked to those who have looked for ways to contact a person
(e.g. 'contact us' page) when visiting a company's website on their mobile device (6,893 respondents)
This reinforces the importance of making it easy and transparent for customers to quickly contact a live person to address their needs – and the method of contact must be prominent.
Human Touch
This has huge implications for businesses: the majority of consumers still rely on human interactions to have their needs met. Nine in ten
(91%) respondents agree that there should always be a way to contact a real person, and the same number (91%) believe complicated issues are more likely to require a real person to resolve it.
Figure 7: Percentage of respondents that agree with various statements regarding getting questions answered on websites and apps.
Asked to all (8,000 respondents)
Eight in ten (81%) also agree that contacting a real person is the fastest way to get a question answered. However, this is dependent upon a variety of factors: the agent in question must have the capability to satisfy inquiries on a range of levels.
In those circumstances where the consumer is able to contact a person, the agent must be knowledgeable and be empowered to act on requests to ensure consumers’ needs are met.
15%
23%
19%
10%
5%
8%
20% Within the last week
About 1-4 weeks ago
About 1-3 months ago
About 4-6 months ago
About 7-12 months ago
Longer than a year ago
Never
2.14
1.52
Using a PC/Mac Using a mobile device
81%
91%
91%
Contacting a real person isthe fastest way to get a
question answered
There should always be away to contact a real
person
The more complicated myissue, the more likely it isthat I'll need to contact a
real person
7 | Effective Mobile Engagement Report 2016
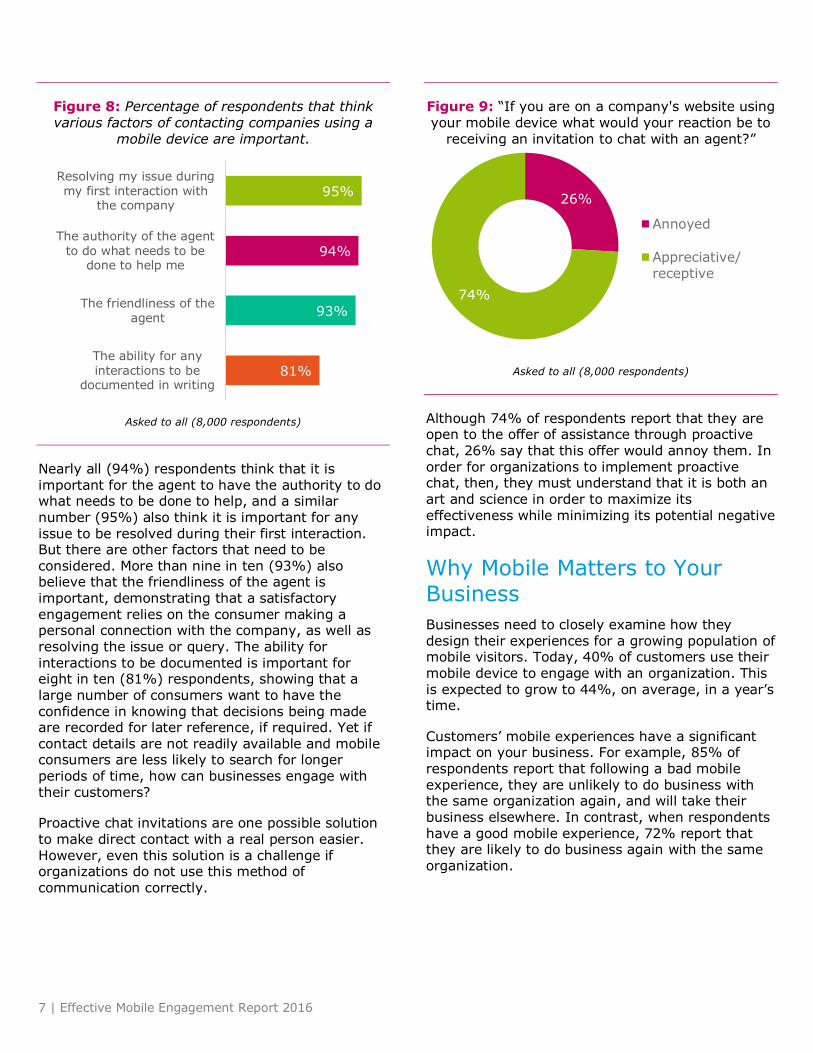
Figure 8: Percentage of respondents that think various factors of contacting companies using a
mobile device are important.
Asked to all (8,000 respondents)
Nearly all (94%) respondents think that it is important for the agent to have the authority to do what needs to be done to help, and a similar number (95%) also think it is important for any issue to be resolved during their first interaction. But there are other factors that need to be
considered. More than nine in ten (93%) also believe that the friendliness of the agent is important, demonstrating that a satisfactory engagement relies on the consumer making a personal connection with the company, as well as resolving the issue or query. The ability for
interactions to be documented is important for eight in ten (81%) respondents, showing that a large number of consumers want to have the confidence in knowing that decisions being made are recorded for later reference, if required. Yet if contact details are not readily available and mobile consumers are less likely to search for longer periods of time, how can businesses engage with their customers?
Proactive chat invitations are one possible solution to make direct contact with a real person easier.
However, even this solution is a challenge if organizations do not use this method of communication correctly.
Figure 9: “If you are on a company's website using your mobile device what would your reaction be to
receiving an invitation to chat with an agent?”
Asked to all (8,000 respondents)
Although 74% of respondents report that they are open to the offer of assistance through proactive
chat, 26% say that this offer would annoy them. In order for organizations to implement proactive chat, then, they must understand that it is both an art and science in order to maximize its effectiveness while minimizing its potential negative impact.
Why Mobile Matters to Your Business
Businesses need to closely examine how they design their experiences for a growing population of mobile visitors. Today, 40% of customers use their mobile device to engage with an organization. This is expected to grow to 44%, on average, in a year’s time.
Customers’ mobile experiences have a significant impact on your business. For example, 85% of respondents report that following a bad mobile experience, they are unlikely to do business with the same organization again, and will take their business elsewhere. In contrast, when respondents have a good mobile experience, 72% report that they are likely to do business again with the same
organization.
81%
93%
94%
95%
The ability for anyinteractions to be
documented in writing
The friendliness of theagent
The authority of the agentto do what needs to be
done to help me
Resolving my issue duringmy first interaction with
the company 26%
74%
Annoyed
Appreciative/receptive
8 | Effective Mobile Engagement Report 2016
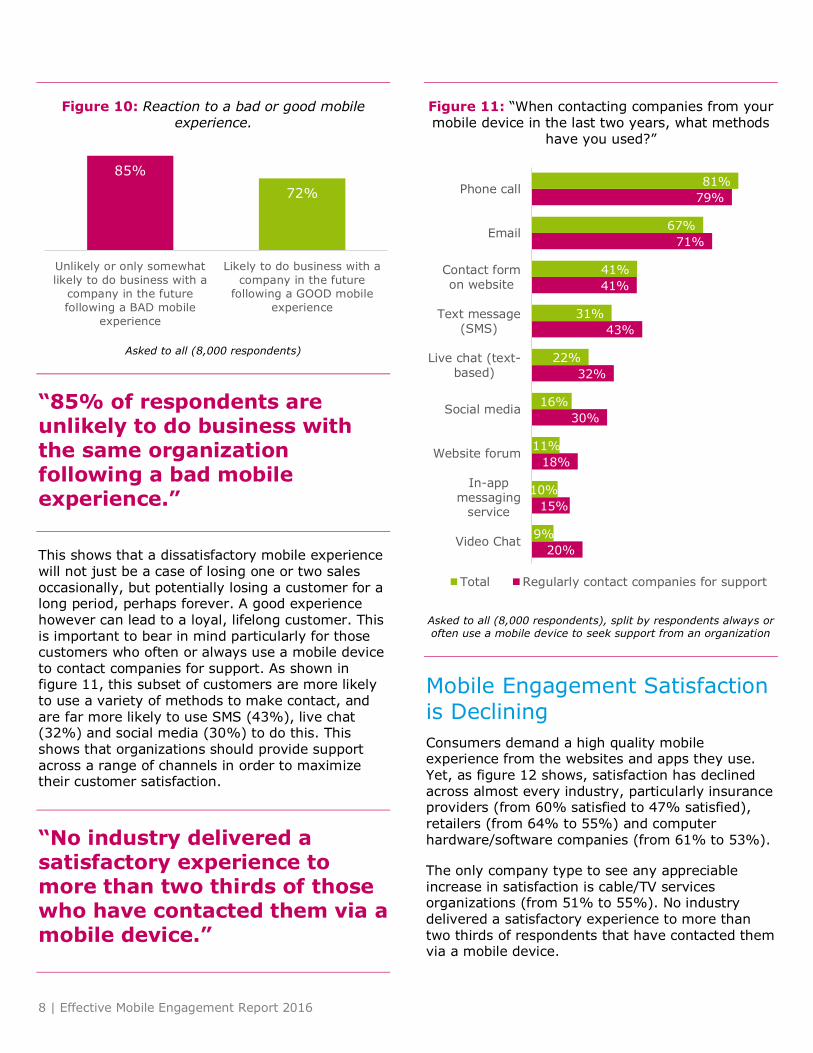
Figure 10: Reaction to a bad or good mobile experience.
Asked to all (8,000 respondents)
“85% of respondents are unlikely to do business with the same organization following a bad mobile experience.”
This shows that a dissatisfactory mobile experience will not just be a case of losing one or two sales occasionally, but potentially losing a customer for a long period, perhaps forever. A good experience however can lead to a loyal, lifelong customer. This is important to bear in mind particularly for those customers who often or always use a mobile device to contact companies for support. As shown in figure 11, this subset of customers are more likely to use a variety of methods to make contact, and are far more likely to use SMS (43%), live chat (32%) and social media (30%) to do this. This shows that organizations should provide support
across a range of channels in order to maximize their customer satisfaction.
“No industry delivered a satisfactory experience to more than two thirds of those who have contacted them via a mobile device.”
Figure 11: “When contacting companies from your mobile device in the last two years, what methods
have you used?”
Asked to all (8,000 respondents), split by respondents always or often use a mobile device to seek support from an organization
Mobile Engagement Satisfaction is Declining
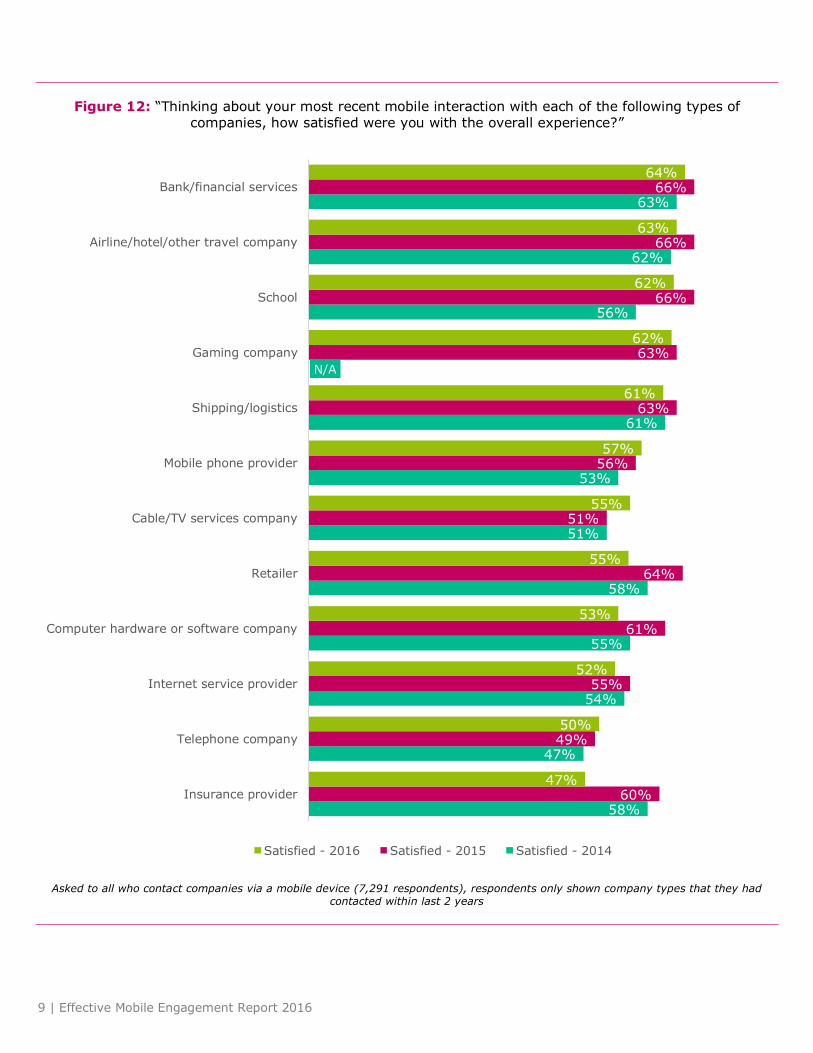
Consumers demand a high quality mobile experience from the websites and apps they use. Yet, as figure 12 shows, satisfaction has declined across almost every industry, particularly insurance providers (from 60% satisfied to 47% satisfied), retailers (from 64% to 55%) and computer hardware/software companies (from 61% to 53%).
The only company type to see any appreciable increase in satisfaction is cable/TV services organizations (from 51% to 55%). No industry delivered a satisfactory experience to more than two thirds of respondents that have contacted them via a mobile device.
85%
72%
Unlikely or only somewhat
likely to do business with a
company in the future
following a BAD mobile
experience
Likely to do business with a
company in the future
following a GOOD mobile
experience
20%
15%
18%
30%
32%
43%
41%
71%
79%
9%
10%
11%
16%
22%
31%
41%
67%
81%
Video Chat
In-appmessaging
service
Website forum
Social media
Live chat (text-based)
Text message(SMS)
Contact formon website
Phone call
Total Regularly contact companies for support
9 | Effective Mobile Engagement Report 2016
Figure 12: “Thinking about your most recent mobile interaction with each of the following types of companies, how satisfied were you with the overall experience?”
Asked to all who contact companies via a mobile device (7,291 respondents), respondents only shown company types that they had contacted within last 2 years
58%
47%
54%
55%
58%
51%
53%
61%
N/A
56%
62%
63%
60%
49%
55%
61%
64%
51%
56%
63%
63%
66%
66%
66%
47%
50%
52%
53%
55%
55%
57%
61%
62%
62%
63%
64%
Insurance provider
Telephone company
Internet service provider
Computer hardware or software company
Retailer
Cable/TV services company
Mobile phone provider
Shipping/logistics
Gaming company
School
Airline/hotel/other travel company
Bank/financial services
Satisfied - 2016 Satisfied - 2015 Satisfied - 2014
10 | Effective Mobile Engagement Report 2016
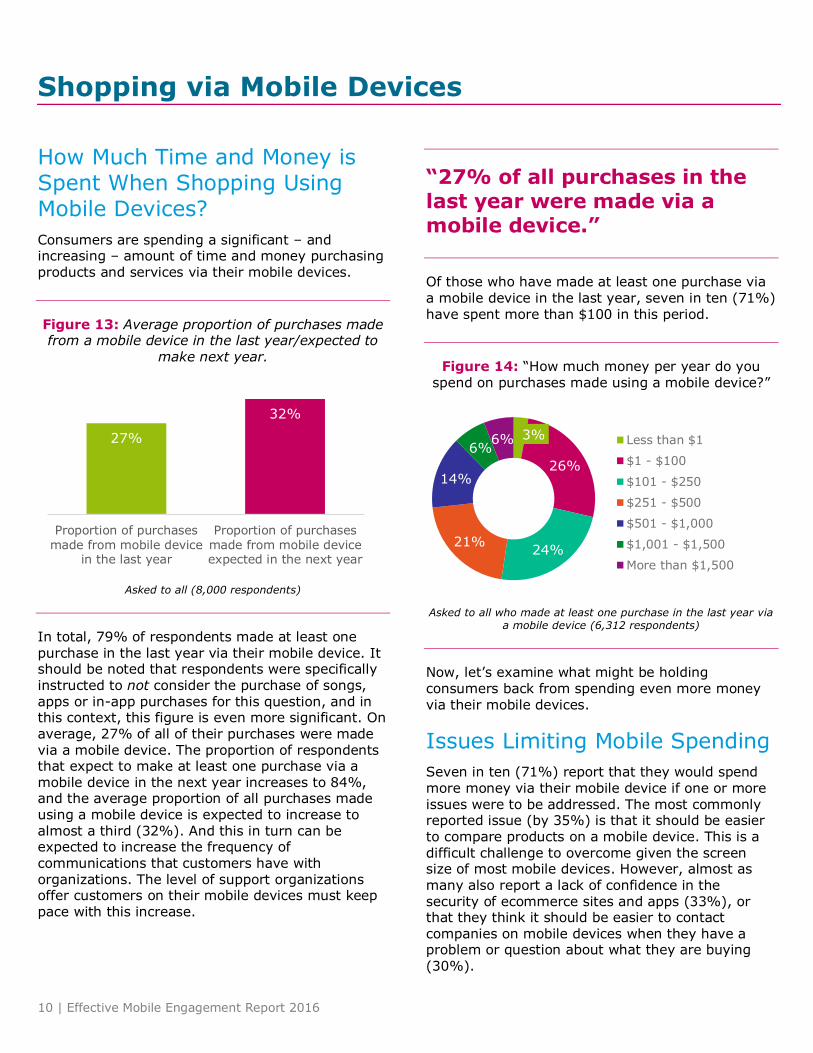
How Much Time and Money is Spent When Shopping Using Mobile Devices?
Consumers are spending a significant – and increasing – amount of time and money purchasing products and services via their mobile devices.
Figure 13: Average proportion of purchases made from a mobile device in the last year/expected to
make next year.
Asked to all (8,000 respondents)
In total, 79% of respondents made at least one
purchase in the last year via their mobile device. It should be noted that respondents were specifically instructed to not consider the purchase of songs, apps or in-app purchases for this question, and in this context, this figure is even more significant. On average, 27% of all of their purchases were made via a mobile device. The proportion of respondents that expect to make at least one purchase via a mobile device in the next year increases to 84%, and the average proportion of all purchases made using a mobile device is expected to increase to almost a third (32%). And this in turn can be expected to increase the frequency of
communications that customers have with organizations. The level of support organizations offer customers on their mobile devices must keep pace with this increase.
“27% of all purchases in the last year were made via a mobile device.”
Of those who have made at least one purchase via a mobile device in the last year, seven in ten (71%) have spent more than $100 in this period.
Figure 14: “How much money per year do you spend on purchases made using a mobile device?”
Asked to all who made at least one purchase in the last year via a mobile device (6,312 respondents)
Now, let’s examine what might be holding consumers back from spending even more money via their mobile devices.
Issues Limiting Mobile Spending
Seven in ten (71%) report that they would spend more money via their mobile device if one or more issues were to be addressed. The most commonly reported issue (by 35%) is that it should be easier to compare products on a mobile device. This is a
difficult challenge to overcome given the screen size of most mobile devices. However, almost as many also report a lack of confidence in the security of ecommerce sites and apps (33%), or that they think it should be easier to contact companies on mobile devices when they have a problem or question about what they are buying
(30%).
27%
32%
Proportion of purchasesmade from mobile device
in the last year
Proportion of purchasesmade from mobile deviceexpected in the next year
3%
26%
24% 21%
14%
6% 6% Less than $1
$1 - $100
$101 - $250
$251 - $500
$501 - $1,000
$1,001 - $1,500
More than $1,500
Shopping via Mobile Devices
11 | Effective Mobile Engagement Report 2016
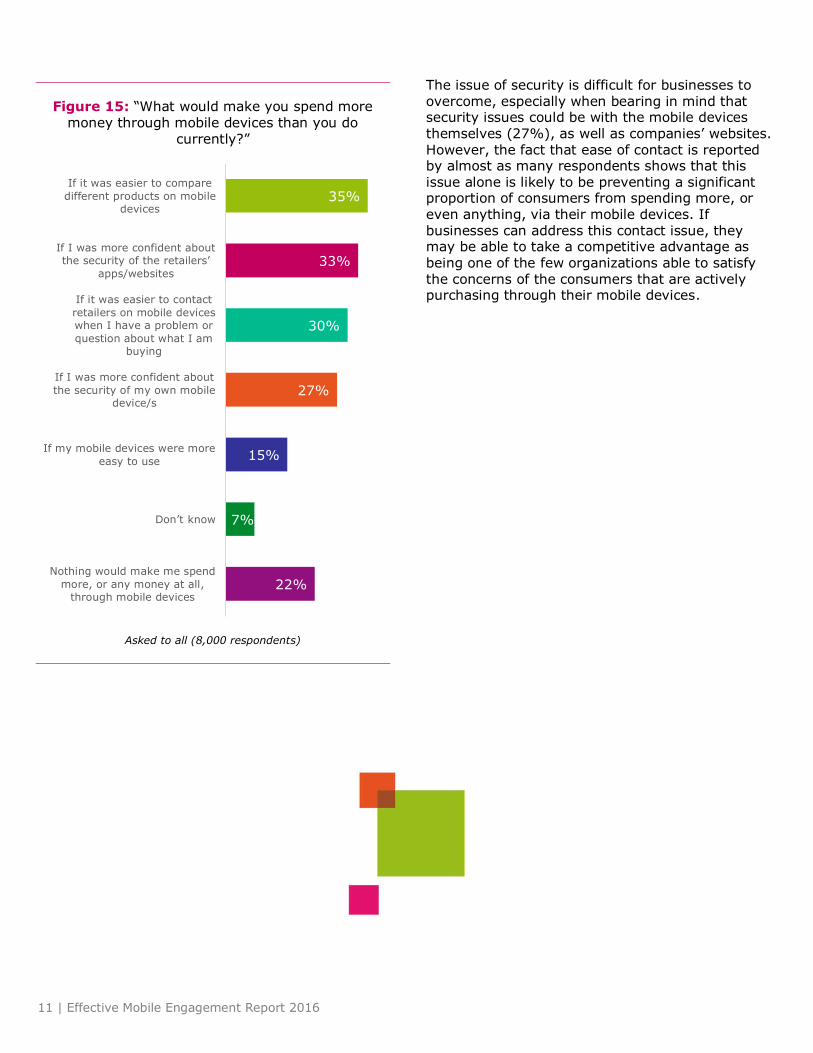
Figure 15: “What would make you spend more money through mobile devices than you do
currently?”
Asked to all (8,000 respondents)
The issue of security is difficult for businesses to overcome, especially when bearing in mind that security issues could be with the mobile devices themselves (27%), as well as companies’ websites.
However, the fact that ease of contact is reported by almost as many respondents shows that this issue alone is likely to be preventing a significant proportion of consumers from spending more, or even anything, via their mobile devices. If businesses can address this contact issue, they may be able to take a competitive advantage as
being one of the few organizations able to satisfy the concerns of the consumers that are actively purchasing through their mobile devices.
22%
7%
15%
27%
30%
33%
35%
Nothing would make me spend
more, or any money at all,through mobile devices
Don’t know
If my mobile devices were more
easy to use
If I was more confident about
the security of my own mobiledevice/s
If it was easier to contact
retailers on mobile deviceswhen I have a problem or
question about what I ambuying
If I was more confident about the security of the retailers’
apps/websites
If it was easier to compare
different products on mobiledevices
12 | Effective Mobile Engagement Report 2016
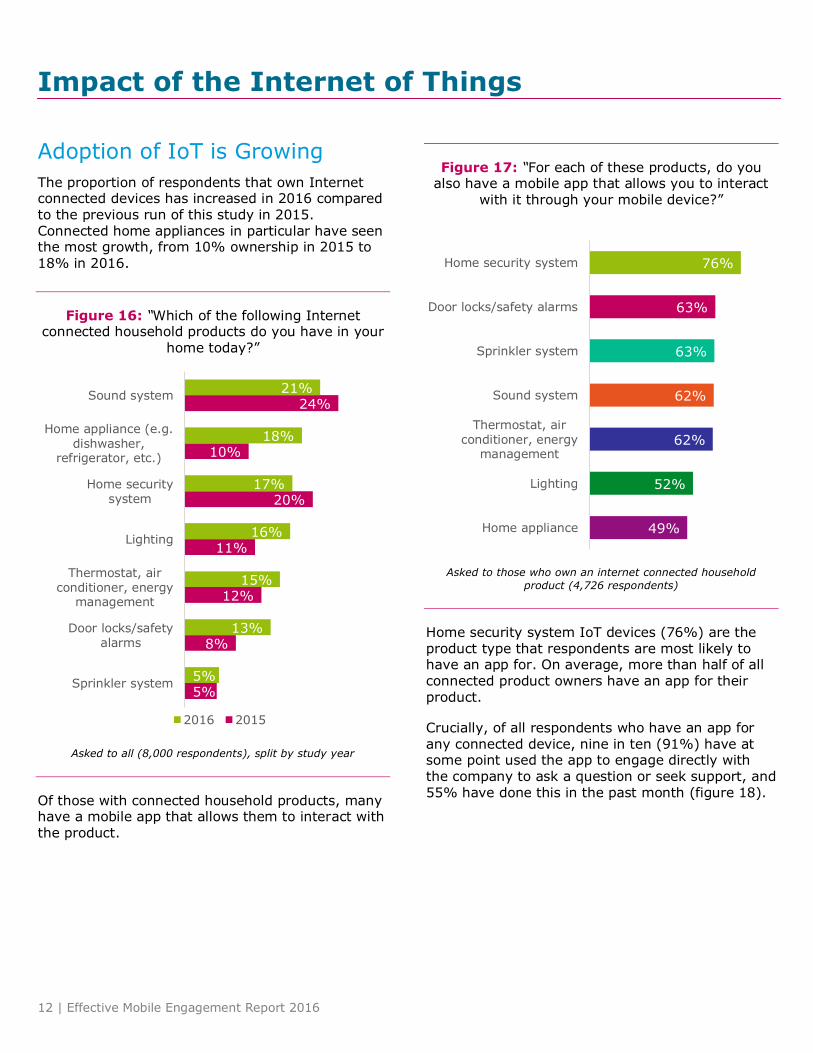
Adoption of IoT is Growing
The proportion of respondents that own Internet connected devices has increased in 2016 compared to the previous run of this study in 2015. Connected home appliances in particular have seen the most growth, from 10% ownership in 2015 to
18% in 2016.
Figure 16: “Which of the following Internet connected household products do you have in your
home today?”
Asked to all (8,000 respondents), split by study year
Of those with connected household products, many have a mobile app that allows them to interact with the product.
Figure 17: “For each of these products, do you also have a mobile app that allows you to interact
with it through your mobile device?”
Asked to those who own an internet connected household
product (4,726 respondents)
Home security system IoT devices (76%) are the product type that respondents are most likely to have an app for. On average, more than half of all connected product owners have an app for their product.
Crucially, of all respondents who have an app for any connected device, nine in ten (91%) have at some point used the app to engage directly with the company to ask a question or seek support, and 55% have done this in the past month (figure 18).
5%
8%
12%
11%
20%
10%
24%
5%
13%
15%
16%
17%
18%
21%
Sprinkler system
Door locks/safetyalarms
Thermostat, airconditioner, energy
management
Lighting
Home securitysystem
Home appliance (e.g.dishwasher,
refrigerator, etc.)
Sound system
2016 2015
49%
52%
62%
62%
63%
63%
76%
Home appliance
Lighting
Thermostat, airconditioner, energy
management
Sound system
Sprinkler system
Door locks/safety alarms
Home security system
Impact of the Internet of Things
13 | Effective Mobile Engagement Report 2016
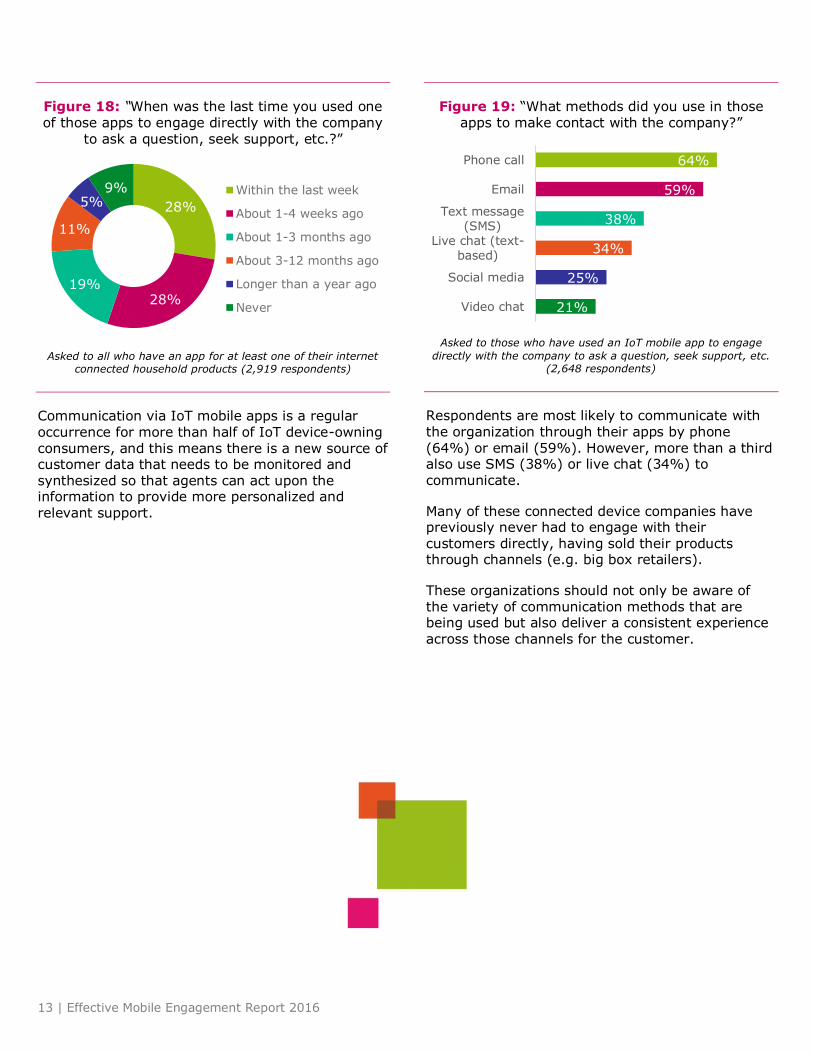
Figure 18: “When was the last time you used one of those apps to engage directly with the company
to ask a question, seek support, etc.?”
Asked to all who have an app for at least one of their internet connected household products (2,919 respondents)
Communication via IoT mobile apps is a regular occurrence for more than half of IoT device-owning consumers, and this means there is a new source of customer data that needs to be monitored and synthesized so that agents can act upon the information to provide more personalized and relevant support.
Figure 19: “What methods did you use in those apps to make contact with the company?”
Asked to those who have used an IoT mobile app to engage
directly with the company to ask a question, seek support, etc. (2,648 respondents)
Respondents are most likely to communicate with the organization through their apps by phone (64%) or email (59%). However, more than a third also use SMS (38%) or live chat (34%) to communicate.
Many of these connected device companies have previously never had to engage with their customers directly, having sold their products through channels (e.g. big box retailers).
These organizations should not only be aware of the variety of communication methods that are being used but also deliver a consistent experience across those channels for the customer.
28%
28% 19%
11%
5% 9% Within the last week
About 1-4 weeks ago
About 1-3 months ago
About 3-12 months ago
Longer than a year ago
Never 21%
25%
34%
38%
59%
64%
Video chat
Social media
Live chat (text-based)
Text message(SMS)
Phone call
14 | Effective Mobile Engagement Report 2016
Mobile devices are an established part of
consumers’ engagement with companies. More than half of consumers are using their mobile devices to research products or services that they are considering purchasing or to seek support. Almost as many are actually using them to make purchases, leading to more engagement. And those
who regularly contact companies using mobile devices use a variety of methods.
Yet, organizations have until now merely viewed mobile engagement as an extension of their current customer engagement strategy; one more channel
to bolt onto the rest. But mobile engagement is much more than this. The increasing connectivity of these devices has created a heightened sense of urgency in customers to have their needs met in that instant.
Prior to purchase, there are many different options for research that customers can pursue if they need to get a question answered – and that includes the option of leaving the retailer’s website or app altogether. The increasing power and connectivity of these devices allow consumers to change their focus easily and quickly, from one application or
webpage to another. One of the most critical moments where this change can happen is when consumers have a query but cannot find the appropriate contact details to have the query answered. A large number of mobile engagements have broken at this point, and sales and good faith
are likely to have been lost as a result.
If the organization can manage to keep the customer on their website or in their app, the challenges do not stop there. FAQs are an often-used resource, but respondents are likely to report
that they are not completely satisfied with the help they provide. The idea of receiving a proactive chat invite while on a website or app provokes a mixed response: nearly three quarters (74%) of respondents would be open to help, but more than a quarter (26%) would be annoyed, indicating a need for organizations to approach proactive communications with intention. Nearly all customers believe that the option to contact a real person is a requirement for a mobile website, and most have high expectations as to what such agents should be able to achieve. Organizations will need to work hard if they are to satisfy their customers over this wide range of touch-points.
“The increasing power and connectivity of these devices has created a heightened sense of urgency on behalf of the consumer to have their needs met in that moment.”
Mobile communication with businesses is a
significant engagement point for more than half of consumers, and accounts for almost half of engagements, on average. How successful these engagements are can have a huge impact on whether a consumer decides to make a purchase. More than four in ten purchases are made via
mobile devices – and the average consumer that does so makes hundreds of dollars in purchases via mobile devices each year. Therefore, it is vital that organizations are fully aware of how a bad mobile experience can have a huge impact upon the likelihood of a return sale. Consumers demand a
good and quick mobile experience, or they will go elsewhere, now and in the future.
Phone calls and emails dominate mobile communication when it comes to communicating with companies through websites or apps
(unsurprisingly), but a significant proportion of consumers also use SMS and live chat. Organizations cannot ignore these channels, commonly used by the (ever-increasing) proportion of Internet of Things adopters who manage their IoT products through mobile apps.
Organizations face a tough challenge in coping with this growing proportion of customers who are using a greater variety of ways to communicate through their mobile devices. Organizations need to treat mobile engagement as an opportunity to interact purposefully and proactively with customers. By
understanding the unique behaviors of their mobile customers and what drives their satisfaction, businesses can tailor the experience to their needs and proactively support customers through their journey. The organizations who excel in this endeavour will be rewarded in this hyper-connected
digital world.
Conclusion
15 | Effective Mobile Engagement Report 2016
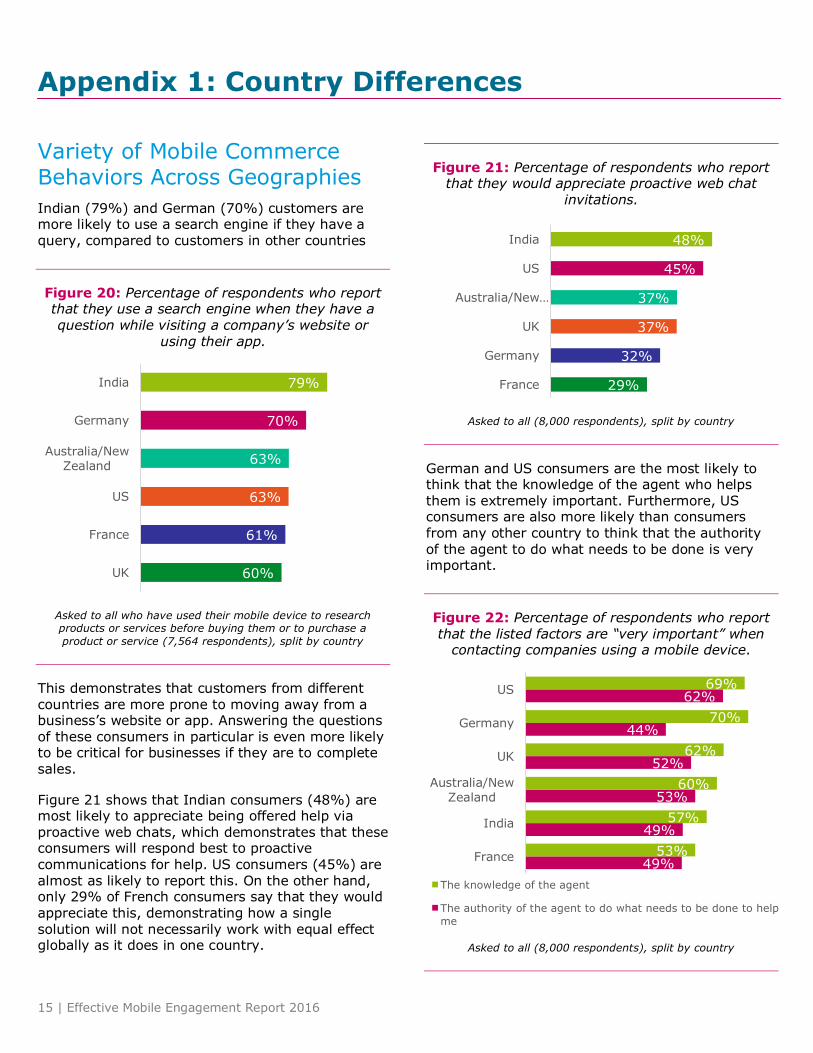
Variety of Mobile Commerce Behaviors Across Geographies
Indian (79%) and German (70%) customers are more likely to use a search engine if they have a query, compared to customers in other countries
Figure 20: Percentage of respondents who report that they use a search engine when they have a question while visiting a company’s website or
using their app.
Asked to all who have used their mobile device to research products or services before buying them or to purchase a
product or service (7,564 respondents), split by country
This demonstrates that customers from different countries are more prone to moving away from a business’s website or app. Answering the questions of these consumers in particular is even more likely to be critical for businesses if they are to complete sales.
Figure 21 shows that Indian consumers (48%) are most likely to appreciate being offered help via proactive web chats, which demonstrates that these consumers will respond best to proactive
communications for help. US consumers (45%) are almost as likely to report this. On the other hand, only 29% of French consumers say that they would appreciate this, demonstrating how a single solution will not necessarily work with equal effect globally as it does in one country.
Figure 21: Percentage of respondents who report that they would appreciate proactive web chat
invitations.
Asked to all (8,000 respondents), split by country
German and US consumers are the most likely to think that the knowledge of the agent who helps them is extremely important. Furthermore, US consumers are also more likely than consumers from any other country to think that the authority of the agent to do what needs to be done is very important.
Figure 22: Percentage of respondents who report that the listed factors are “very important” when
contacting companies using a mobile device.
Asked to all (8,000 respondents), split by country
60%
61%
63%
63%
70%
79%
UK
France
US
Australia/NewZealand
Germany
India 29%
32%
37%
37%
45%
48%
France
Germany
UK
Australia/New…
US
India
49%
49%
53%
52%
44%
62%
53%
57%
60%
62%
70%
69%
France
India
Australia/NewZealand
UK
Germany
US
The knowledge of the agent
The authority of the agent to do what needs to be done to help
me
Appendix 1: Country Differences
16 | Effective Mobile Engagement Report 2016
This demonstrates that US consumers are more likely to be demanding than consumers in other countries, when it comes to the agent’s knowledge and their ability to act on requests. In contrast,
German consumers are demanding of agents when it comes to their knowledge, but are far less likely to feel that the agent needs to have authority to take action on any requests.
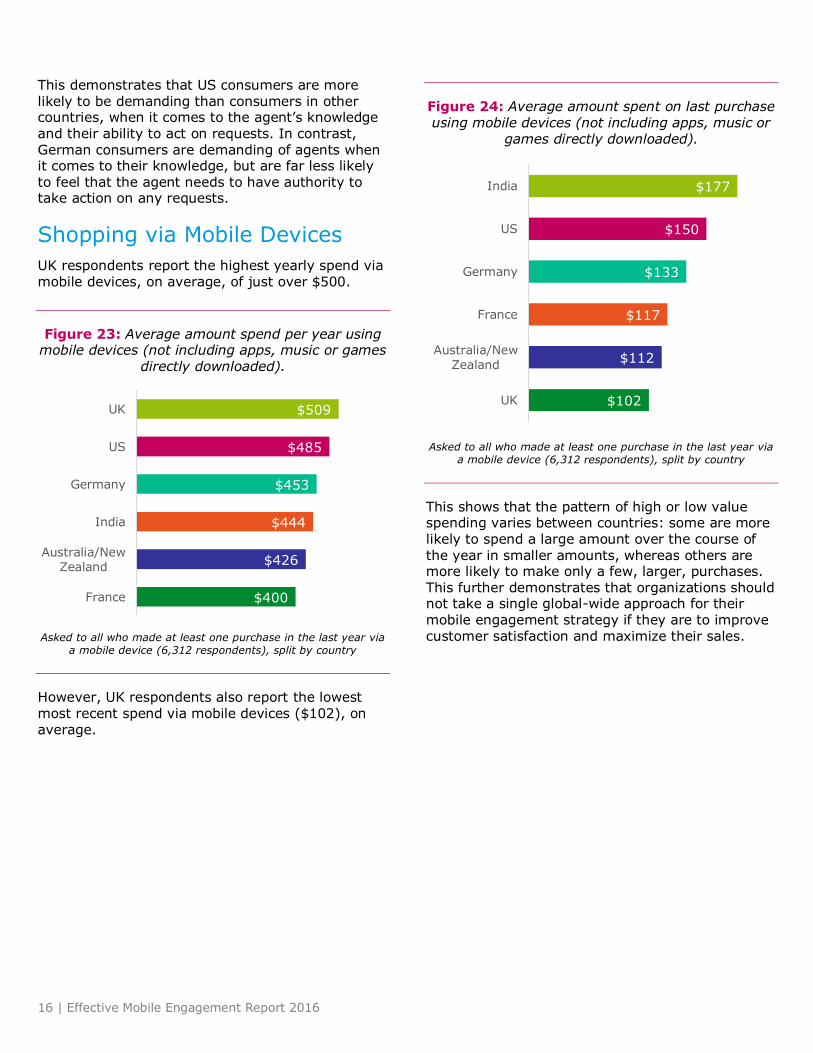
Shopping via Mobile Devices
UK respondents report the highest yearly spend via mobile devices, on average, of just over $500.
Figure 23: Average amount spend per year using mobile devices (not including apps, music or games
directly downloaded).
Asked to all who made at least one purchase in the last year via a mobile device (6,312 respondents), split by country
However, UK respondents also report the lowest most recent spend via mobile devices ($102), on average.
Figure 24: Average amount spent on last purchase using mobile devices (not including apps, music or
games directly downloaded).
Asked to all who made at least one purchase in the last year via a mobile device (6,312 respondents), split by country
This shows that the pattern of high or low value spending varies between countries: some are more likely to spend a large amount over the course of
the year in smaller amounts, whereas others are more likely to make only a few, larger, purchases. This further demonstrates that organizations should not take a single global-wide approach for their mobile engagement strategy if they are to improve customer satisfaction and maximize their sales.
$400
$426
$444
$453
$485
$509
France
Australia/NewZealand
India
Germany
US
UK$102
$112
$117
$133
$150
$177
UK
Australia/NewZealand
France
Germany
US
India
17 | Effective Mobile Engagement Report 2016
Impact of the Internet of Things
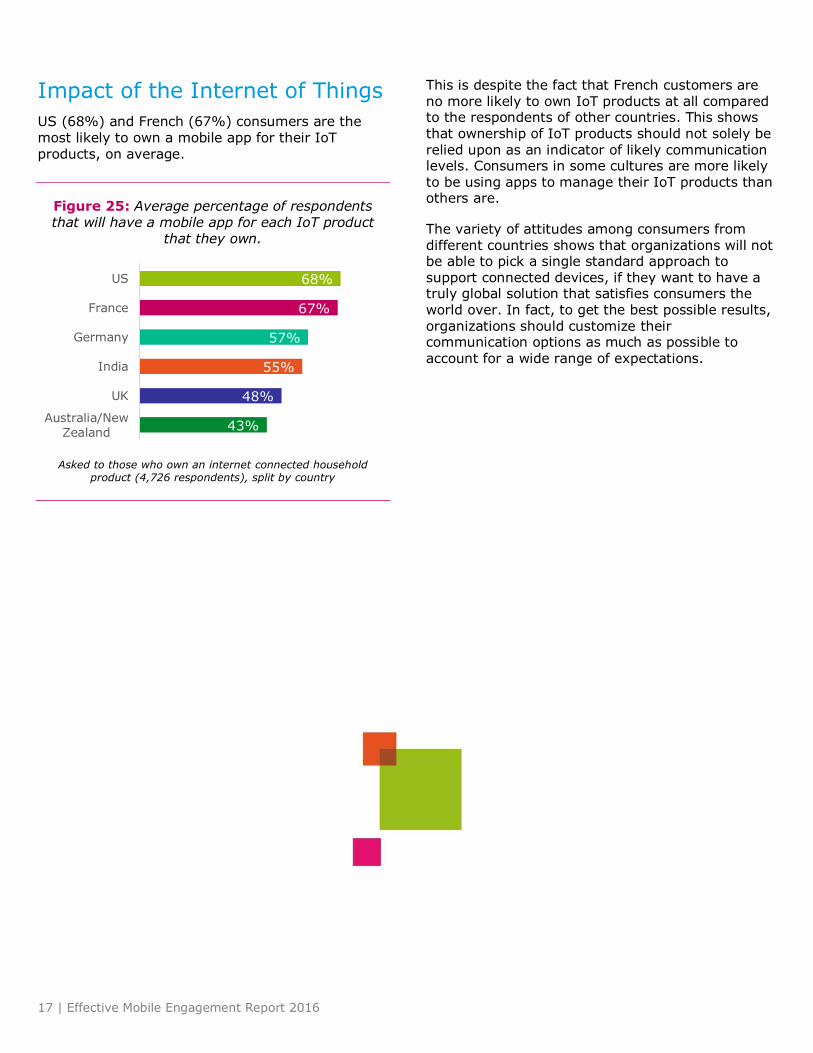
US (68%) and French (67%) consumers are the most likely to own a mobile app for their IoT
products, on average.
Figure 25: Average percentage of respondents that will have a mobile app for each IoT product
that they own.
Asked to those who own an internet connected household product (4,726 respondents), split by country
This is despite the fact that French customers are no more likely to own IoT products at all compared to the respondents of other countries. This shows that ownership of IoT products should not solely be
relied upon as an indicator of likely communication levels. Consumers in some cultures are more likely to be using apps to manage their IoT products than others are.
The variety of attitudes among consumers from different countries shows that organizations will not be able to pick a single standard approach to support connected devices, if they want to have a truly global solution that satisfies consumers the world over. In fact, to get the best possible results, organizations should customize their communication options as much as possible to
account for a wide range of expectations.
43%
48%
55%
57%
67%
68%
Australia/NewZealand
UK
India
Germany
France
US
18 | Effective Mobile Engagement Report 2016
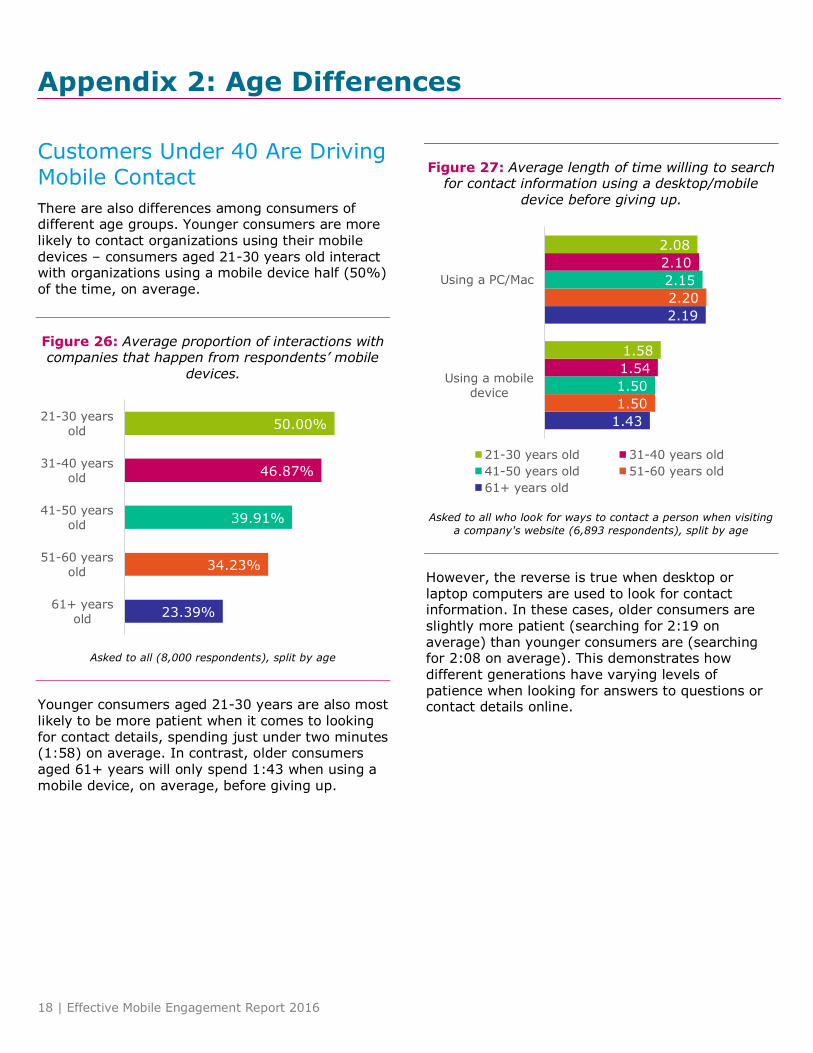
Customers Under 40 Are Driving Mobile Contact
There are also differences among consumers of different age groups. Younger consumers are more likely to contact organizations using their mobile
devices – consumers aged 21-30 years old interact with organizations using a mobile device half (50%) of the time, on average.
Figure 26: Average proportion of interactions with companies that happen from respondents’ mobile
devices.
Asked to all (8,000 respondents), split by age
Younger consumers aged 21-30 years are also most likely to be more patient when it comes to looking for contact details, spending just under two minutes (1:58) on average. In contrast, older consumers aged 61+ years will only spend 1:43 when using a mobile device, on average, before giving up.
Figure 27: Average length of time willing to search for contact information using a desktop/mobile
device before giving up.
Asked to all who look for ways to contact a person when visiting
a company's website (6,893 respondents), split by age
However, the reverse is true when desktop or laptop computers are used to look for contact information. In these cases, older consumers are slightly more patient (searching for 2:19 on average) than younger consumers are (searching for 2:08 on average). This demonstrates how different generations have varying levels of patience when looking for answers to questions or contact details online.
23.39%
34.23%
39.91%
46.87%
50.00%
61+ yearsold
51-60 yearsold
41-50 yearsold
31-40 yearsold
21-30 yearsold
1.43
2.19
1.50
2.20
1.50
2.15
1.54
2.10
1.58
2.08
Using a mobiledevice
Using a PC/Mac
21-30 years old 31-40 years old
41-50 years old 51-60 years old
61+ years old
Appendix 2: Age Differences
19 | Effective Mobile Engagement Report 2016
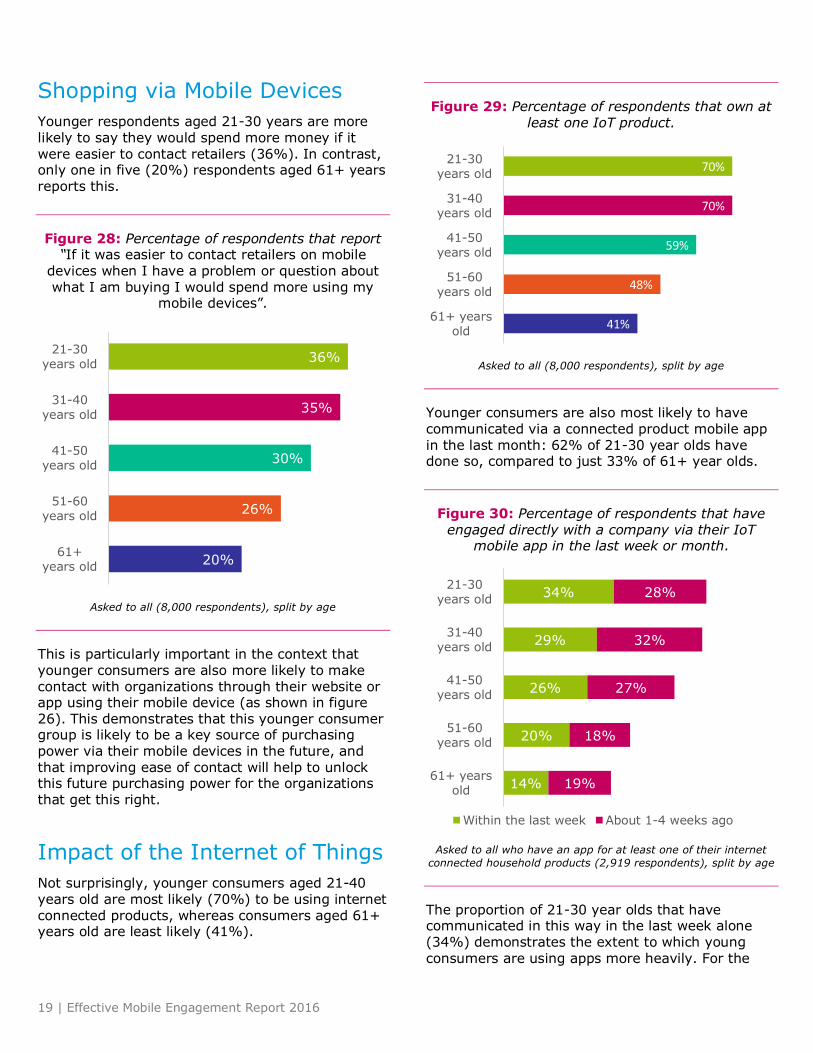
Shopping via Mobile Devices
Younger respondents aged 21-30 years are more likely to say they would spend more money if it
were easier to contact retailers (36%). In contrast, only one in five (20%) respondents aged 61+ years reports this.
Figure 28: Percentage of respondents that report “If it was easier to contact retailers on mobile
devices when I have a problem or question about what I am buying I would spend more using my
mobile devices”.
Asked to all (8,000 respondents), split by age
This is particularly important in the context that younger consumers are also more likely to make contact with organizations through their website or app using their mobile device (as shown in figure 26). This demonstrates that this younger consumer group is likely to be a key source of purchasing power via their mobile devices in the future, and
that improving ease of contact will help to unlock this future purchasing power for the organizations that get this right.
Impact of the Internet of Things
Not surprisingly, younger consumers aged 21-40 years old are most likely (70%) to be using internet connected products, whereas consumers aged 61+ years old are least likely (41%).
Figure 29: Percentage of respondents that own at least one IoT product.
Asked to all (8,000 respondents), split by age
Younger consumers are also most likely to have communicated via a connected product mobile app in the last month: 62% of 21-30 year olds have done so, compared to just 33% of 61+ year olds.
Figure 30: Percentage of respondents that have engaged directly with a company via their IoT
mobile app in the last week or month.
Asked to all who have an app for at least one of their internet
connected household products (2,919 respondents), split by age
The proportion of 21-30 year olds that have communicated in this way in the last week alone (34%) demonstrates the extent to which young
consumers are using apps more heavily. For the
20%
26%
30%
35%
36%
61+years old
51-60years old
41-50years old
31-40years old
21-30years old
41%
48%
59%
70%
70%
61+ yearsold
51-60years old
41-50years old
31-40years old
21-30years old
14%
20%
26%
29%
34%
19%
18%
27%
32%
28%
61+ yearsold
51-60years old
41-50years old
31-40years old
21-30years old
Within the last week About 1-4 weeks ago
20 | Effective Mobile Engagement Report 2016
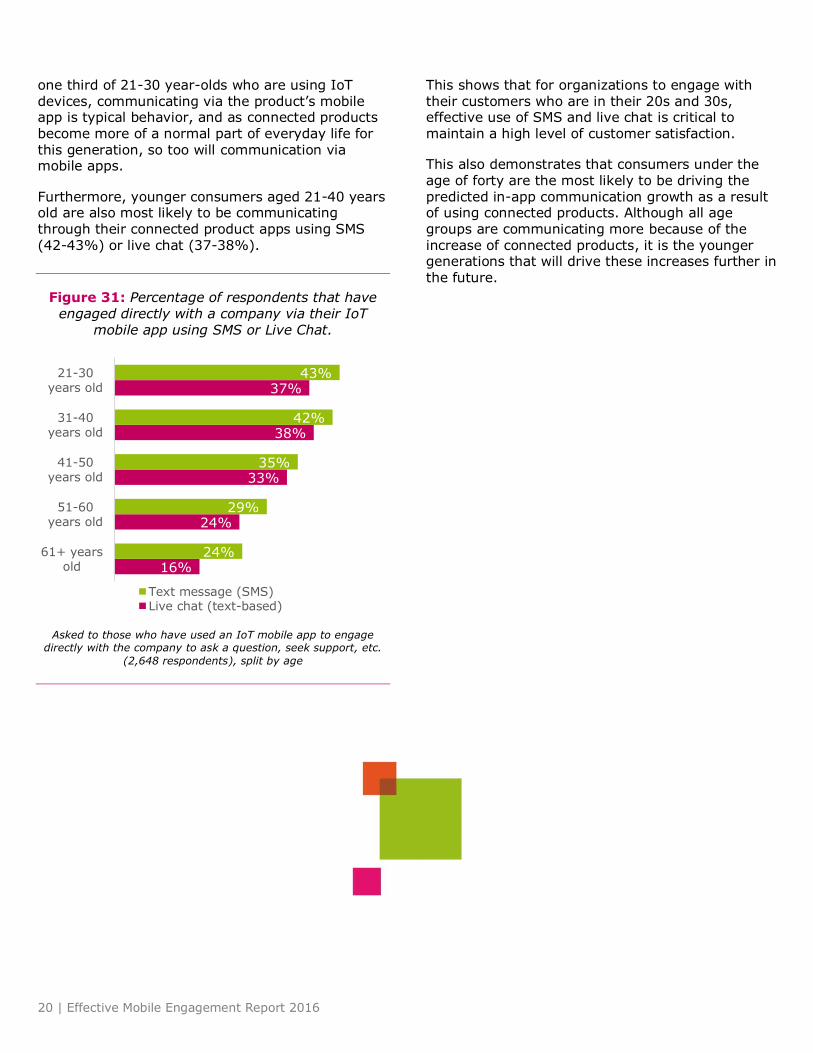
one third of 21-30 year-olds who are using IoT devices, communicating via the product’s mobile app is typical behavior, and as connected products become more of a normal part of everyday life for
this generation, so too will communication via mobile apps.
Furthermore, younger consumers aged 21-40 years old are also most likely to be communicating through their connected product apps using SMS (42-43%) or live chat (37-38%).
Figure 31: Percentage of respondents that have engaged directly with a company via their IoT
mobile app using SMS or Live Chat.
Asked to those who have used an IoT mobile app to engage directly with the company to ask a question, seek support, etc.
(2,648 respondents), split by age
This shows that for organizations to engage with their customers who are in their 20s and 30s, effective use of SMS and live chat is critical to maintain a high level of customer satisfaction.
This also demonstrates that consumers under the age of forty are the most likely to be driving the predicted in-app communication growth as a result of using connected products. Although all age groups are communicating more because of the increase of connected products, it is the younger generations that will drive these increases further in the future.
16%
24%
33%
38%
37%
24%
29%
35%
42%
43%
61+ yearsold
51-60years old
41-50years old
31-40years old
21-30years old
Text message (SMS)Live chat (text-based)
21 | Effective Mobile Engagement Report 2016
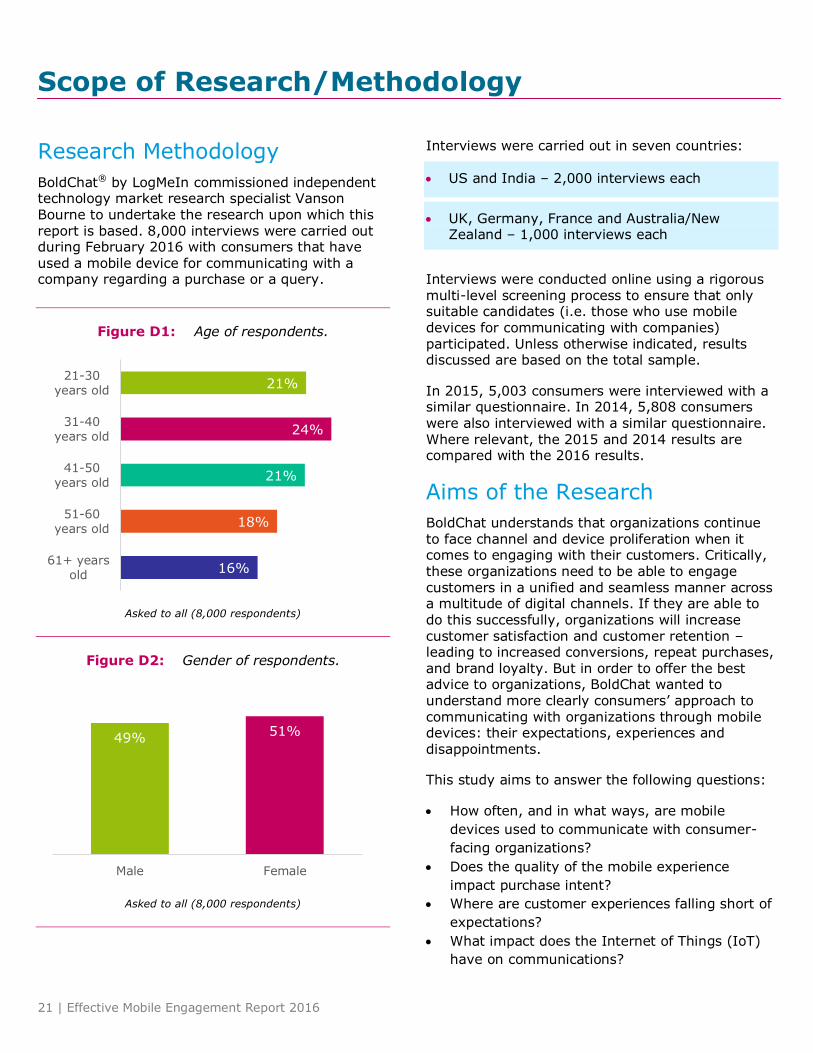
Research Methodology
BoldChat® by LogMeIn commissioned independent technology market research specialist Vanson Bourne to undertake the research upon which this report is based. 8,000 interviews were carried out during February 2016 with consumers that have
used a mobile device for communicating with a company regarding a purchase or a query.
Figure D1: Age of respondents.
Asked to all (8,000 respondents)
Figure D2: Gender of respondents.
Asked to all (8,000 respondents)
Interviews were carried out in seven countries:
US and India – 2,000 interviews each
UK, Germany, France and Australia/New Zealand – 1,000 interviews each
Interviews were conducted online using a rigorous multi-level screening process to ensure that only suitable candidates (i.e. those who use mobile devices for communicating with companies) participated. Unless otherwise indicated, results discussed are based on the total sample.
In 2015, 5,003 consumers were interviewed with a similar questionnaire. In 2014, 5,808 consumers were also interviewed with a similar questionnaire. Where relevant, the 2015 and 2014 results are compared with the 2016 results.
Aims of the Research
BoldChat understands that organizations continue to face channel and device proliferation when it comes to engaging with their customers. Critically, these organizations need to be able to engage customers in a unified and seamless manner across a multitude of digital channels. If they are able to do this successfully, organizations will increase customer satisfaction and customer retention – leading to increased conversions, repeat purchases, and brand loyalty. But in order to offer the best advice to organizations, BoldChat wanted to understand more clearly consumers’ approach to communicating with organizations through mobile devices: their expectations, experiences and disappointments.
This study aims to answer the following questions:
How often, and in what ways, are mobile
devices used to communicate with consumer-
facing organizations?
Does the quality of the mobile experience
impact purchase intent?
Where are customer experiences falling short of
expectations?
What impact does the Internet of Things (IoT)
have on communications?
16%
18%
21%
24%
21%
61+ yearsold
51-60years old
41-50years old
31-40years old
21-30years old
49% 51%
Male Female
Scope of Research/Methodology
22 | Effective Mobile Engagement Report 2016
About BoldChat® by LogMeIn:
BoldChat® by LogMeIn is a market-leading live chat and customer engagement solution that helps businesses
quickly and effectively engage customers across online, mobile and social channels. BoldChat includes integrated multichannel communications technologies like live chat, video chat, email management, SMS management, Twitter management, co-browsing and self-service, giving customer service teams a single solution for managing customer conversations. As a result, organizations can provide a better overall customer experience, improving conversions, building loyalty and boosting CSAT like never before. For more information, visit www.boldchat.com.
About Vanson Bourne:
Vanson Bourne is an independent specialist in market research for the technology sector. Our reputation for robust and credible research-based analysis is founded upon rigorous research principles and our ability to seek opinions in all major markets. For more information, visit www.vansonbourne.com.


