EFFECTS OF AN ASSESSMENT – SUPPORTED INSTRUCTIONAL MODEL (ASIM) ON STUDENTS ACADEMIC ACHIEVEMENT AND INTEREST IN SECONDARY SCHOOL MATHEMATICS IN NIGER STATE BY YUSUF MOHAMMED PG/MED/04/35362 A RESEARCH WORK PRESENTED TO THE DEPARTMENT OF SCIENCE EDUCATION, IN PARTIAL FULFILLMENT OF THE REQUIREMENT FOR THE AWARD OF MASTER DEGREE IN MEASUREMENT AND EVALUATION.
Transcript
EFFECTS OF AN ASSESSMENT – SUPPORTED INSTRUCTIONAL MODEL (ASIM) ON
STUDENTS ACADEMIC ACHIEVEMENT
AND INTEREST IN SECONDARY SCHOOL
MATHEMATICS IN NIGER STATE
BY
YUSUF MOHAMMED
PG/MED/04/35362
A RESEARCH WORK PRESENTED TO THE DEPARTMENT OF SCIENCE EDUCATION, IN PARTIAL FULFILLMENT OF THE REQUIREMENT FOR THE AWARD OF MASTER
DEGREE IN MEASUREMENT AND EVALUATION.
2
SUPERVISOR: PROF. B.G. NWORGU
UNIVERSITY OF NIGERIA, NSUKKA
MAY, 2011
3
TITLE PAGE
EFFECTS OF AN ASSESSMENT INSTRUCTIONAL MODEL (ASIM) ON STUDNETS’
ACADEMIC ACHIEVEMENT AND INTEREST IN SECONDARY SCHOOL MATHEMATICS
IN NIGER STATE.
A THESIS PRESENTED
TO
THE DEPARTMENT OF SCIENCE EDUCATION,
UNIVERSITY OF NIGERIA NSUKKA.
IN PARTIAL FULFILMENT OF THE REQUIREMENTS FOR THE AWARD OF MASTERS
DEGREES IN MEASUREMENT AND EVALUATION
BY
YUSUF MOHAMMED
4
PG/MED/04/35362
MAY, 2011
5
APPROVAL PAGE
This thesis has been approved for the Department of Science Education
APPENDIX K .......................................................................................................................... 132
APPENDIX L ........................................................................................................................... 134
APENDIX M ............................................................................................................................ 135
APPENDIX N ......................................................................................................................... 136
13
APPENDIX O ......................................................................................................................... 137
14
LIST OF TABLES
Tables
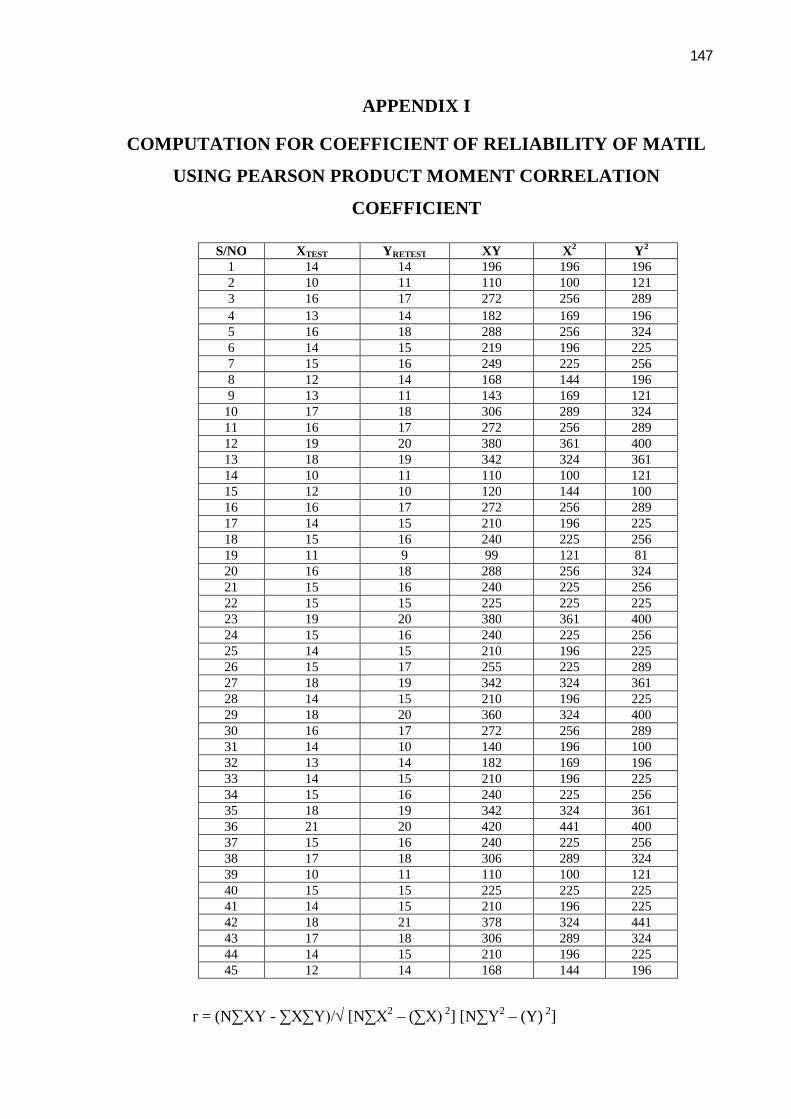
1 Mean Achievement scores and Standard Deviation of Experimental and Control groups in pretest and posttest (MATIL) 55
2 Mean Achievement scores and standard deviation of both High and Low ability students of the experimental group. 56
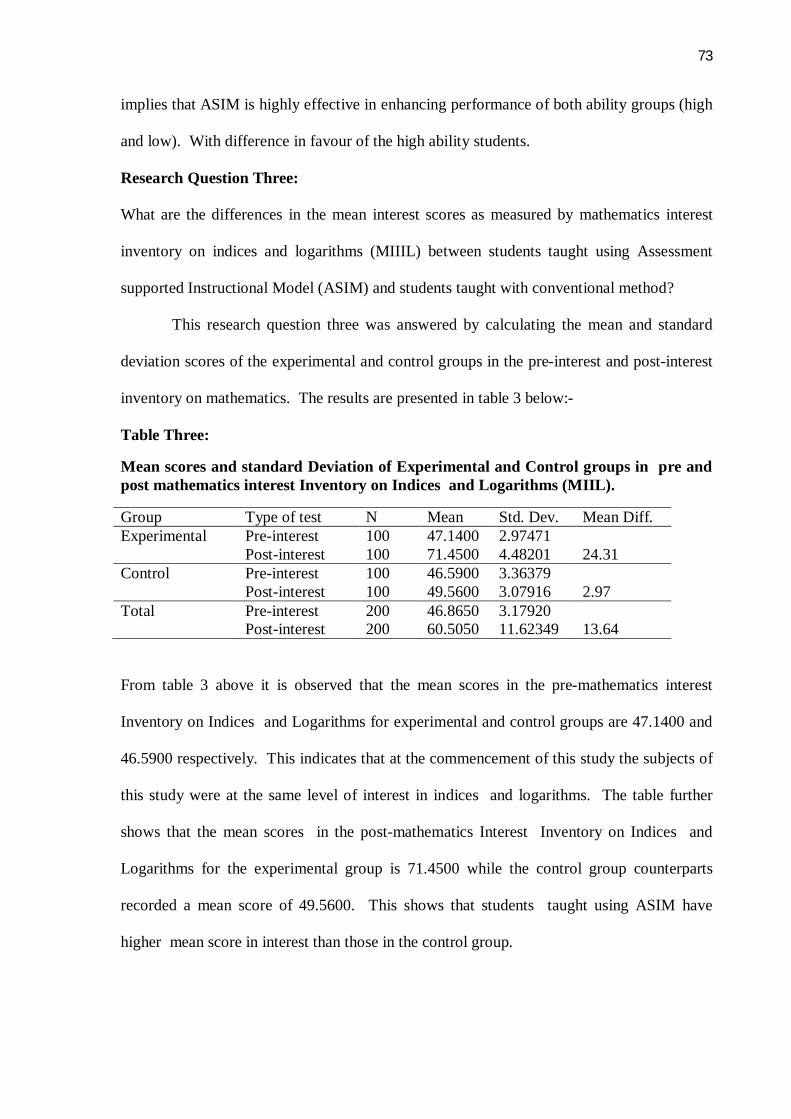
3 Mean scores and standard Deviation of Experimental and Control groups in pre and post mathematics interest Inventory on Indices and Logarithms (MIIL). 57
4 Mean Interest scores and Standard Deviation of both High and Low ability students for Experimental group in the PreMIIIL and PostMIIIL. 58
5: Analysis of Covariance (ANCOVA) Result on Students Post-test in MATIL 60
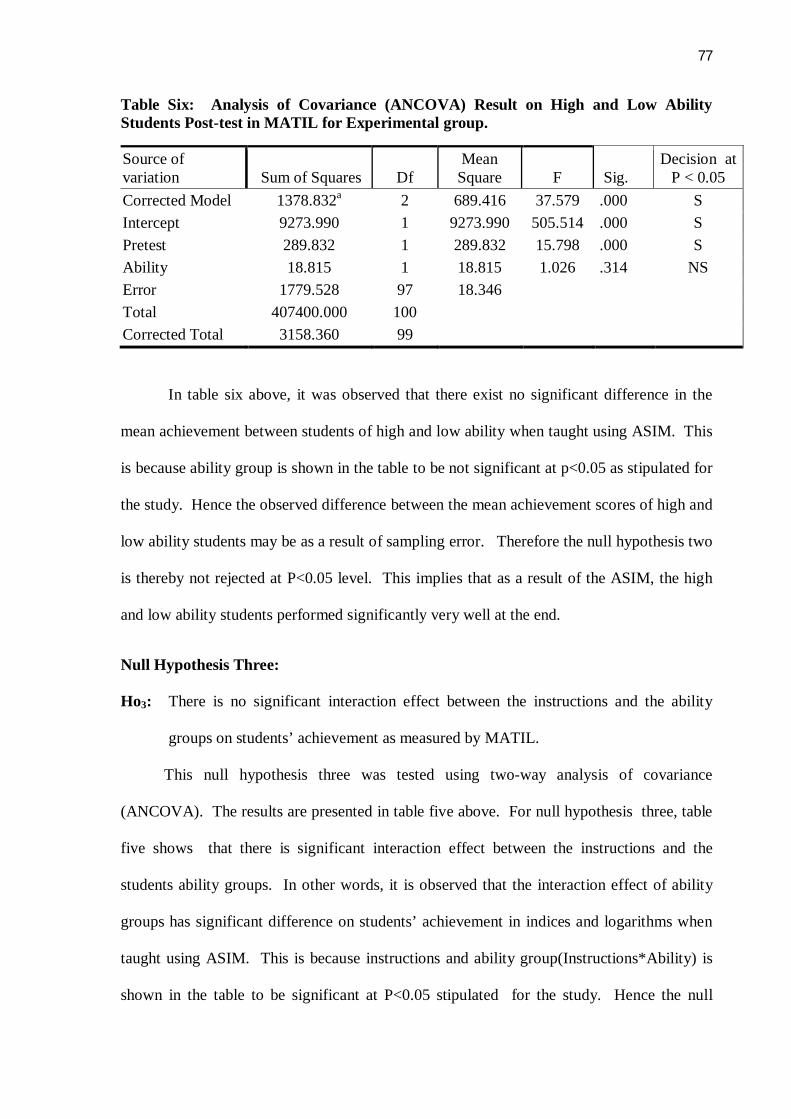
6. Analysis of covariance (ANCOVA) Result on High and Low ability students post-
test in MATIL for Experimental group. 60
7: Analysis of Covariance (ANCOVA) Result on Students Post-test in Post-MIIIL 61
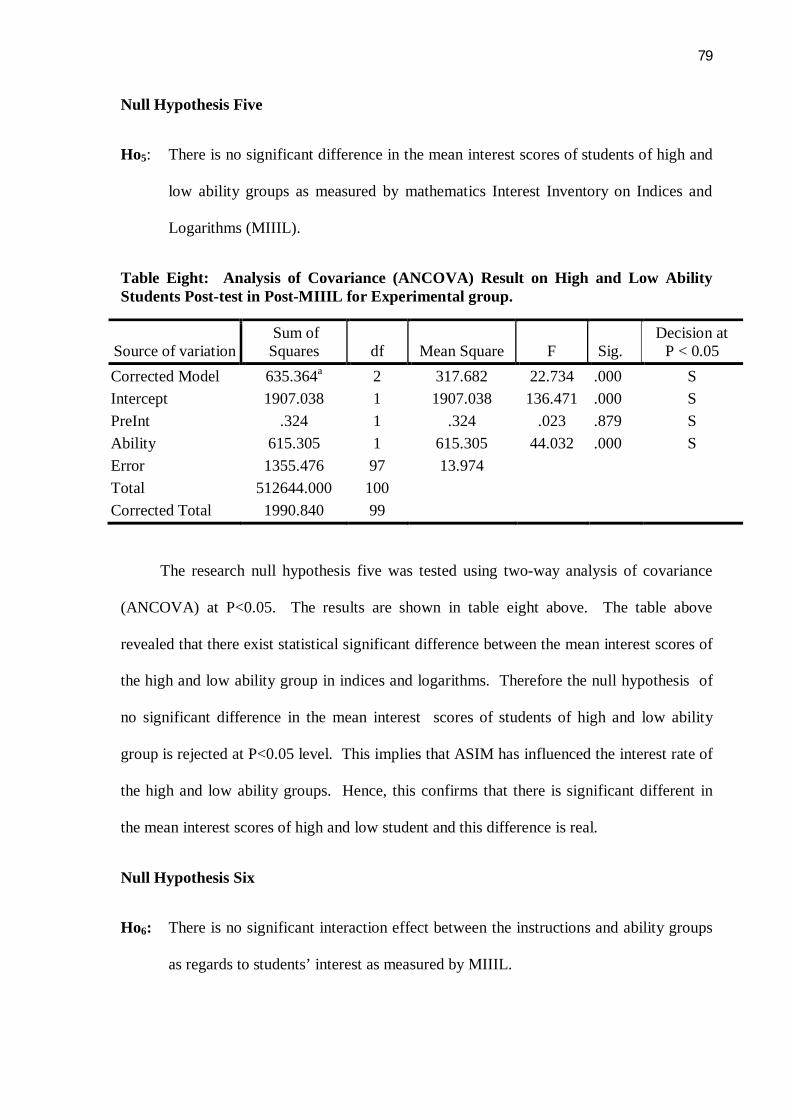
8. Analysis of covariance (ANCOVA) Result as High and Low ability students post-test
in post MIIIL for experimental group. 62
15
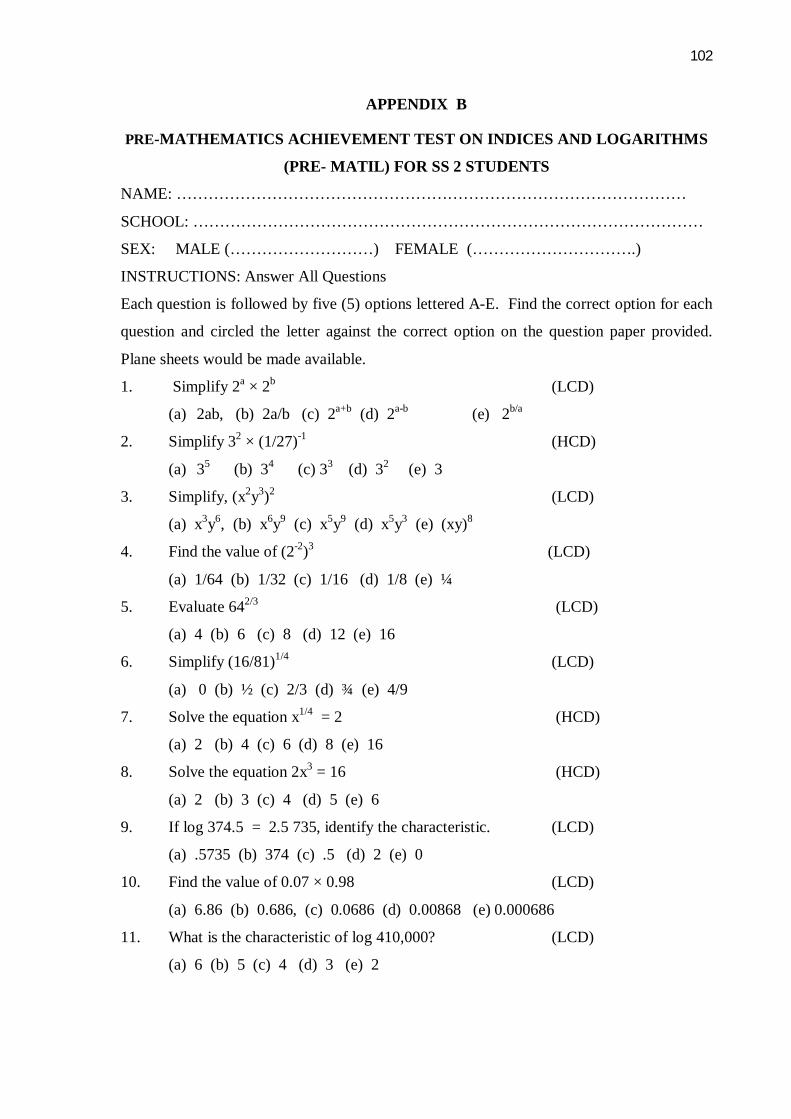
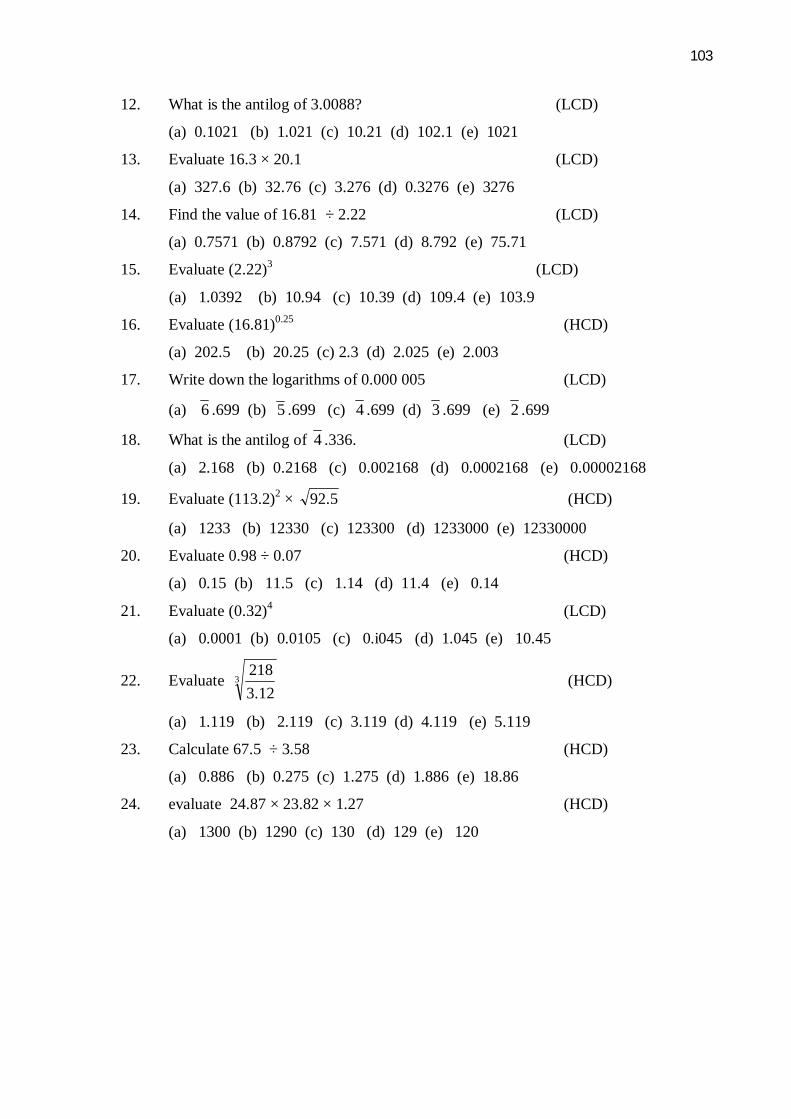
ABSTRACT
This study is designed to find out the effectiveness of an assessment Supported Instructional Model (ASIM) on (SS 2) students’ achievement and interest in indices and logarithms. It also tried to determine whether any of the ability groups (high and low) gained more than the other from the model. Non equivalent control group quasi-experimental designed was employed in the study. The study was guided by four (4) research questions and six (6) null hypotheses. A sample of two hundred (200) SS 2 students was assigned to experimental and control groups. The experimental and control groups were taught indices and logarithms using assessment supported instructional model (ASIM) and convention method respectively. Two researcher-constructed instruments – Mathematics Achievement Test on Indices and Logarithms (MATIL) of 24 items and Mathematics Interest Inventory on Indices and Logarithms (MIIIL) of 25 items were used for data collection. Mean and standard Deviation were used to answer the research questions while ANCOVA was used to test null hypotheses at p < 0.05. The results revealed among others that ASIM was more effective in fostering achievement and facilitating interest in indices and logarithms. That the high ability students benefited more significantly than the low ability students in both achievement and interest in indices and logarithms, from ASIM. Interaction effect between
16
instructions and ability groups was significant in achievement and interest as revealed by the study. The findings had tremendous implication curriculum planners, teacher educators, teachers and the learners. Based on the findings recommendations were forwarded.
17
CHAPTER ONE
INTRODUCTION
Background of the Study
Teaching is a unique and dynamic profession. This is because education is a veritable
instrument and the cornerstone for the building and sustenance of any nation. Whatever a
nation becomes depends on the type and quality of education provided for her citizenry
because no nation can rise above her education system. Since the school is the mirror of the
society and an agent of social change (Ukeje, 1997), teaching becomes a process of nation
building and the teacher an architect of nation building. This implies that the future of any
nation depends on the professional qualification and competence of the classroom teacher,
because there exists a strong tie between his/her instructional activities, the eventual
outcome of his/her instruction and the development of the nation. Hence the responsibility
of a teacher is made more comprehensive by the fact that his/her effectiveness is measured
in terms of how much the learners will benefit from his/her professional expertise or be led
astray by those actions of his/her that undermine professionalism,
Nigerian government is very much aware of the importance of education in general
and science education in particular for her technological advancement and thus stipulates a
ratio of sixty to forty (60–40) in favour of science and technology related courses in the
conventional universities, eighty to twenty (80–20) in universities of technology and
seventy to thirty (70-30) in polytechnics (Ogunleye, 1999). Other efforts to give science
education befitting consideration include: the reintroduction of ministry of science and
technology in 1985 by government which formulated the science and technology policy
which led to the establishment of Federal University of Technology (FUT) and Federal
University of Agriculture (FUA); the establishment of science schools at federal and state
1
18
level; and the establishment of Federal College of Education (Technical) in the country
between 1987 and 1989.
However, positive advancement in science and technology cannot be achieved without
effective and efficient mathematics education. Hence the importance of mathematics
education in science and technology cannot be overlooked. For instance Ukeje (1997) stated
that “the increasing importance and attention given to mathematics stems from the fact that
without mathematics there is no science, without science there is no modern technology and
without modern technology there is no modern society”. This implies that mathematics is
not only the queen of science and technology, but also an indispensable single element in
modern societal development.
With all the importance of mathematics education to Nigerian economy, for many
years mathematics has witness a flood of persistent high failure. And this sordid situation
made the Nigerian government to be very unhappy. Various examination reports have tried
to identify factors, which could have contributed to the observed poor performance. The
general consensus using WAEC chief examiners report of 2009 is that the poor performance
in mathematics is as a result of remarkable lack of well organized human resources,
teaching materials and facilities in teaching and learning mathematics at secondary
education (Badru, 2004). In the same vein, Betiku (2002) stated that a cluster of variables
has been implicated as responsible for the dismal performance of students. According to
Betiku, these include: Government related variables; Curriculum related variables;
Examination body related variables; Teacher related variables; Students related variables;
Home related variables and Textbooks related variables.
STAN (1992) on the other hand identified prominent problems of teaching
mathematics as (i) acute shortage of qualified professional mathematics teachers; (ii)
exhibition of poor knowledge of mathematics contents by many mathematics teachers; (iii)
19
overcrowded mathematics classrooms; (iv) adherence to old teaching methods despite the
exposure to more viable alternatives; (v) students negative attitudes towards mathematics;
and (vi) undue emphasis on syllabus coverage at the expense of meaningful learning of
mathematics concepts, just to mention but a few.
In an elaborate attempt to improve the study of mathematics, Nigerian government
made the teaching and learning of mathematics compulsory at primary, secondary, and
higher education levels in science related disciplines. This is because man cannot do without
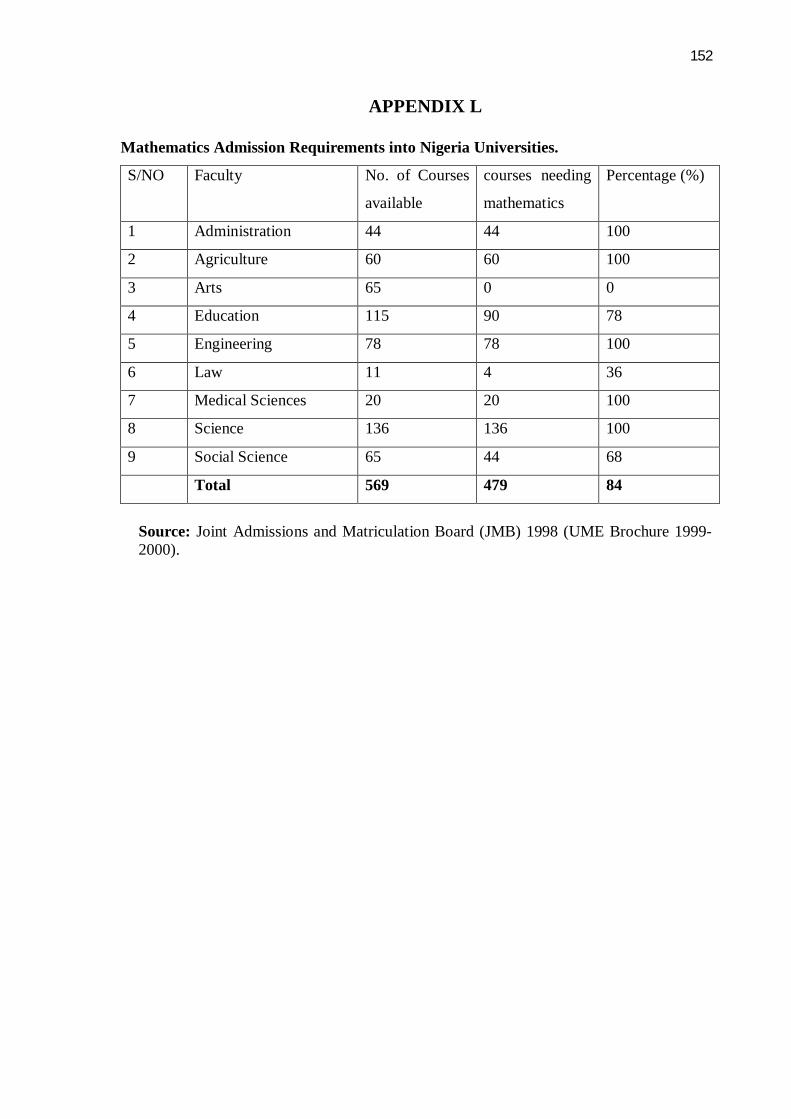
mathematics in all his endeavours. According to JAMB Brochure (2009/2010) only one out
of nine faculties in Nigerian Universities does not require credit in O level mathematics. The
table in appendix L justifies the statement above.
The mathematics curriculum for secondary students was planned in consonance with
the broad aims and objectives of secondary education as spelt out by National Policy on
Education (FRN 2004). In order to reflect these aims and objective, Federal Ministry of
Education drew up the general objectives of mathematics education to include the
following:
i. To generate interest in mathematics and to provide the solid foundation for everyday
living.
ii. To develop computational skills;
iii. To foster the desire and ability to be accurate to degree relevant to the problem at
hand;
iv. To develop precise, logical and abstract thinking.
v. To develop the ability to recognize problems; and to solve them with related
mathematical knowledge.
vi. To provide necessary mathematical background for further education.
vii. To stimulate and encourage creativity (Obodo, 2004).
20
There are various good teaching methods mathematics teacher would need in order to
accomplish the aims and objectives of secondary mathematics education as drawn by the
Federal Ministry of Education. These methods according to Obodo (2004) include: problem
solving approach, discovery approach, target task approach and laboratory approach. The
approaches can facilitate effective teaching and learning of mathematics, if properly
employed and administered by professionally competent mathematics teachers. They will
also go a long way to enhance both achievement and interest in mathematics.
The above could be achieved if the right calibers of teachers are produced. That is why
Federal Republic of Nigeria (2004) in recognition of the importance of education in the
education process pointed out that one of the objectives of teacher education is in the
production of highly motivated, conscientious and efficient classroom teachers for all levels
of our educational system. The aim is to provide teachers with emotional, intellectual and
professional background adequate for their assignment and make them adequate to changing
situations. This implies that teachers should possess unique qualities, which include:
dedication, honesty, intelligence, love, humility, and ability to impact knowledge and ideas
that will help in shaping the behaviours of students towards the derived goals of the nation.
The ability to teach effectively is of prime concern to educators. The teaching methods
used for effective teaching consist of varying and complex sets of skills and activities. One
scheme for defining the characteristics of effective teaching according to Knox and Morgan
(1985) is to categorize behaviours identified as effective into five (5) broad categories:
Teaching ability; professional Competence; Evaluation/Assessment of Students;
Interpersonal Relationship: and Personality traits. In null shell, these five identified broad
categories of behaviours are all concerning the principal actor of instruction (the teacher).
According to Fajemidagba (2001), effective teaching has three components: -
preparation, execution and assessment. Preparation phase is the planning stage at which
21
instructional objectives and suitable instructional materials are selected. The planned lesson
is actually delivered using relevant instructional strategies at the execution stage. At the
assessment stage, the teacher determined the achievement of the intended objectives. From
the foregoing discussion, it can be deduced that effective teaching or instruction cannot be
divorced from assessment. In other words, assessment and instructional strategies are
integral part of teaching and learning process. This is because there is no effective teaching
without assessment just like there will be no assessment without teaching taking place.
Researches have shown that teachers’ influences affect student’s achievement, interest
and attitudes towards science subjects in general and mathematics in particular. Obodo
(2004) among others observed that the behaviour of some mathematics teachers deviates
from the expected normal behaviour of teachers. They tend to exhibit very queer
characteristics which scare many students away from studying mathematics. Some
mathematics teachers create the impression to students that mathematics is difficult and not
meant for everybody to study except for those with exceptional endowment like themselves
who teach the subject.
Alio (2000) and Ozofor (2001) have also shown that achievement level of students in
science subjects in general is affected by such factors as ability and interest. Aiken (1985)
defined achievement as the level of knowledge, skills or accomplishment in the area of
endeavour. While Lawal (2001) stated that achievement tends to focus on the principles,
rules, tenets, facts, and formulae which learners have mastered as a result of the teacher’s
instructional decision-making activities in various subjects. Whereas Ezike and Obodo
(2004) defined interest as the feeling of intentness, concern or curiosity about an object. It
could be defined as the quality that arouses concern or curiosity, which holds a child
attention on an object. It therefore, implies that interest can be regarded as the situation or
condition of wanting to enquire or learn about some phenomena. While ability according to
22
Schunk (2004) is the quality or skill required to do or act mentally or physically. It therefore
implies that ability has to do with efficacy and competency of an individual to carry out
activities successfully using his/her skills. Educationally, ability has to do with what a
person has acquired through specific study training in a given instructional sequence in the
classroom and what he/she is capable of doing if exposed to certain educational programme.
According to him ability can group into high ability group and low ability group.
In view of the above, an urgent need to instantly find ways for improving the teaching
and learning of mathematics is very much necessary. Efforts could be geared towards
evolving new strategies and total transformation of the mathematics education programmes.
Such efforts should include among others the integration of assessment and instructional
strategies as integral part of teaching and learning of mathematics.
Assessment, according to Stevens (1972) in Ogunniyi (2000) is a process of assigning
numbers, letter grades, or words to characteristics or attributes of objects, person and events
according to certain formulation or rules. Assessment and instructional strategies are
integral part of teaching and learning mathematics. Thus, as learning is comprehensive,
therefore the methods of teaching and assessment for mathematics should themselves be
comprehensive. Assessment in education is concerned primarily with finding out whether
the expected changes in the learners’ behaviour have occurred or not. If not then why and
how can it occur? Whereas instructional assessment is primarily concerned with how well
an instructional programme was designed, developed, implemented and how well it is being
managed. This implies that instructional assessment is concerned with determining the
strengths and weaknesses of specific instructional programme, determining whether or not
students have acquired certain skills and whether or not a particular teaching method
adopted was effective.
23
In the late 70s, students were wrongly assessed by their teachers for the purpose of
selection, promotion and certification of learners N.T.I. (2008). Tests were administered to
students terminally. Such tests are usually used for judgmental purposes and determining
the progress the learner has made towards the goal in the given period (Ogunniyi2000). As a
result of the criticism against the old method of assessing learners, a new method of
assessment called “Continuous Assessment” emerged. The principal aim of this program is
to adequately assess learners, to discover their latent skills, knowledge and abilities through
administration of tests at various times with a view of collecting information with respect to
the cognitive, affective and psychomotor domains.
In its present state continuous assessment demands extra involvement from the
classroom teacher than ever before. It is pertinent to note that some of the classroom
teachers, due to their ignorance of the meaning and purpose of continuous assessment see it
as a programme capable of wasting their time, energy and materials. In an attempt to satisfy
the demands of head teachers and inspectors of education, a good number of the classroom
teachers do administer tests to their students just to impress the school heads.
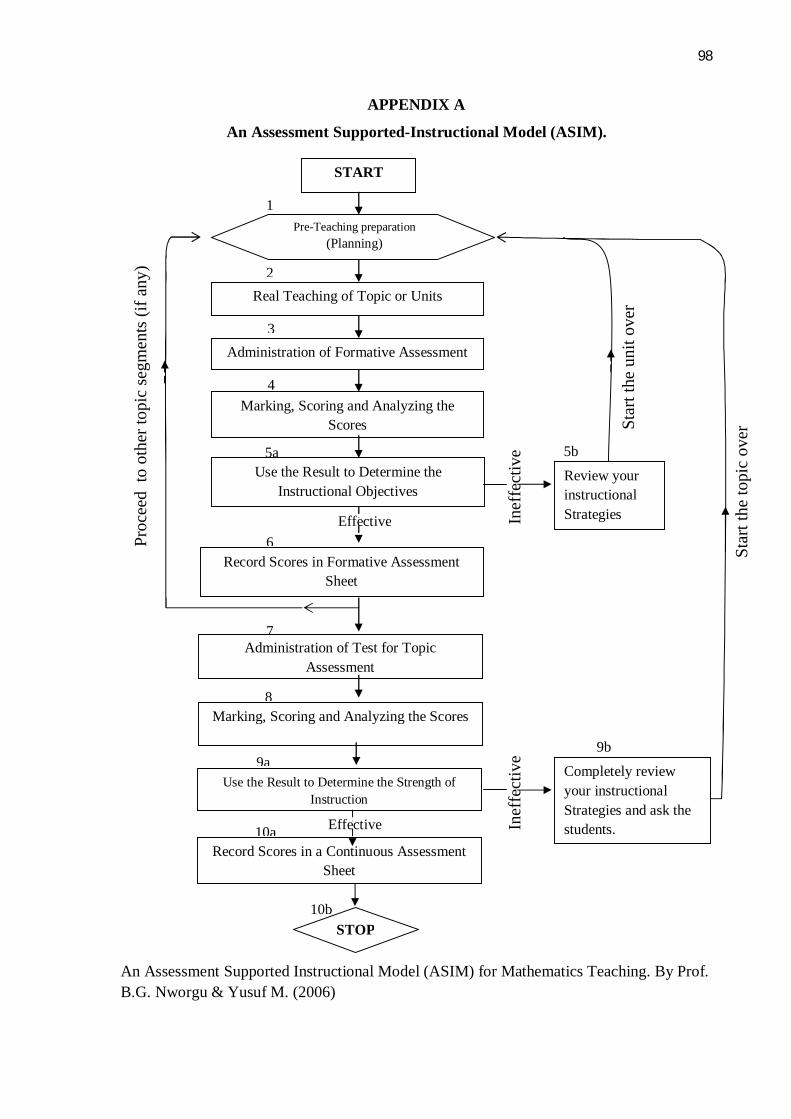
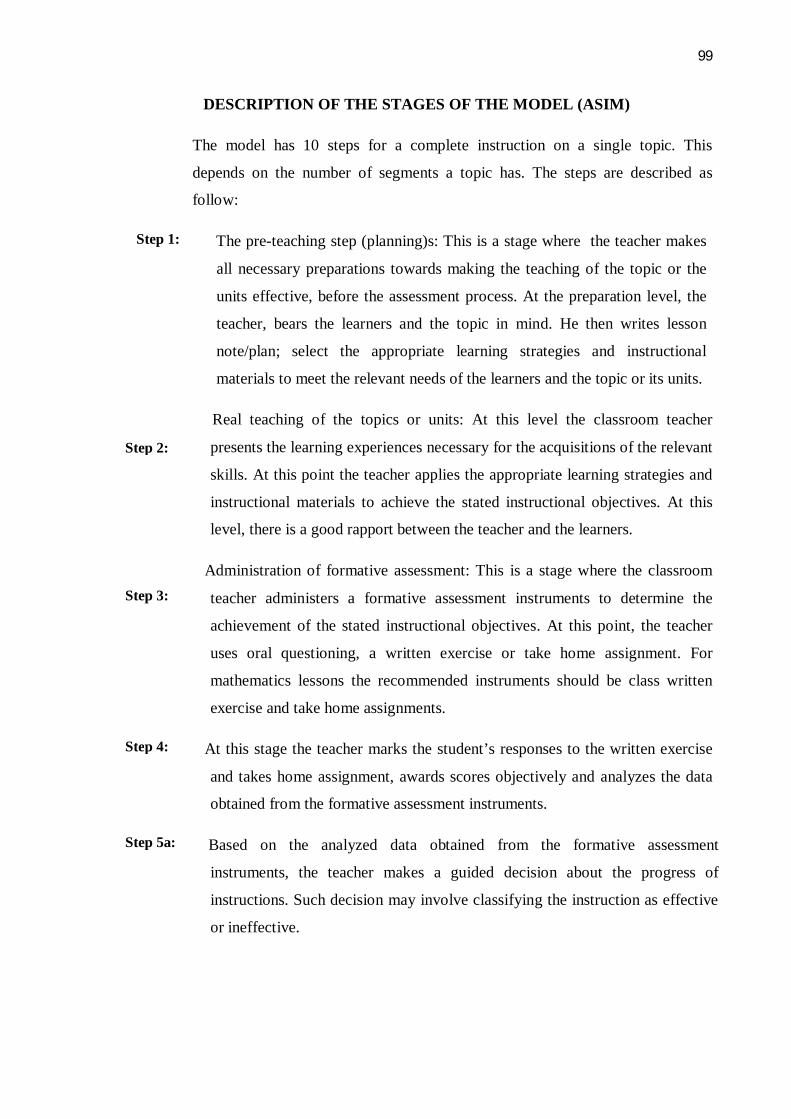
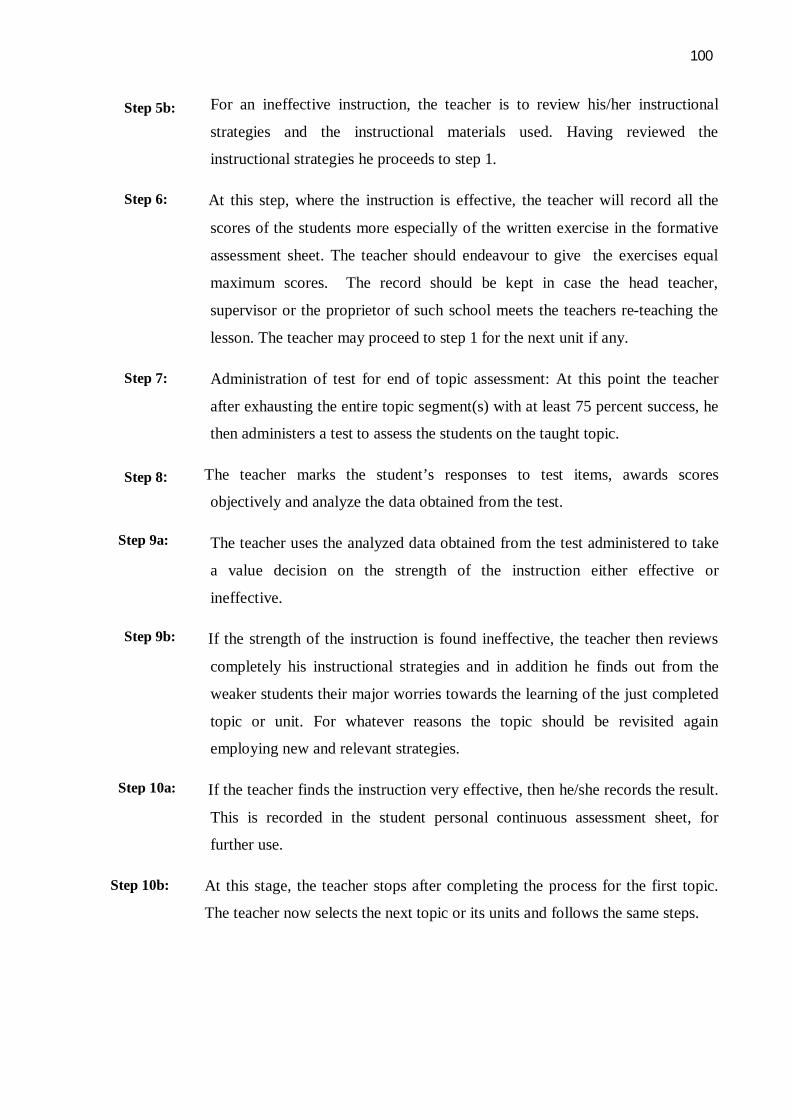
Assessment-Supported Instructional Model (ASIM) is model design with the primary
aims of using the students’ assessment result to improve instructions. The model consists
the following steps:
pre teaching preparation; real teaching of the topic/units; administration of formative assessment; marking, scoring and analyzing the scores; using the Result to determine the instructional objectives; review your instructional strategies if ineffective; record scores in formative assessment sheet if effective; Proceed to other topic segments (if any) if none ; administration of test for topic assessment; marking, scoring and analyzing the scores; use the result to determine the strength of instruction; completely review your instructional strategies and ask the students if ineffective; record scores in a Continuous Assessment Sheet if effective. For the details see appendix A.
24
Assessment-Supported Instructional Model (ASIM) is a system of instruction which
is a total deviation from the conventional system of instruction. According to Fakomogbon
(2001) conventional system of instruction engages the teacher as “Mr. or Mrs. Know All”
with regards to the learning of students. This system of instruction is known and called
teacher-centered. This is because it makes the teacher to: (a) act as essential link between a
student and what is to be learned, (b) select what a student should learn, and (c) select the
method(s) by regarding students in a class as more or less uniform groups of learners.
The inference therefore is that presently mathematics teachers in the secondary
school system do conduct assessment after mathematics instruction terminally for the
purpose of selection, promotion and certification of learners. It is therefore, paramount that
mathematics teachers should adopt new strategies which integrate assessment and
instruction for mathematics lessons. And so this work sets out to develop and use a model
known as Assessment-Supported Instructional Model (ASIM) that can improve the
teaching and learning mathematics.
Statement of the Problem
Nigeria as a developing nation has seen scientific and technological advancement as a
means to achieve national development. The realization of the contribution of science,
technology and mathematics (STM) to national development has given rise to an accelerated
emphasis on the provision of qualitative, adequate and sound education in STM in Nigeria
today more than ever before.
Despite the relative importance of mathematics, it is very disappointing to note that the
students’ performance in the subject in both internal and external examinations has
remained consistently poor (Amazigo, 2000: Agwagah, 2001: Ojaleye, 2001). Records have
shown that mass failure in mathematics in these examinations is real and the trend of
students’ performance in the subject has been on the decline (Salau, 1995). Some
25
researchers have attributed the observed poor achievement to students’ difficulty in
understanding of mathematics as well as students’ lack of interest in science generally.
Others have however blamed the situation on the methods employed by teachers, which
have been described as dull, uninteresting and ineffective (Ali, 1986, Nworgu 1997).
Alio (2000) and Ozofor (2001) have also shown that achievement level of students in
science subject in general is affected by such factors as ability and interest. Ability
according to Schunk (2004) is the quality or skills required to do or act mentally or
physically. It therefore implies that ability has to do what a person has acquired through
specific study training in a given instructional sequence in the classroom. Hence students
may be of low or high ability as the result of such training.
Sufficient research evidences have shown that science teachers in general and
mathematics teachers in particular consistently make use of various ineffective methods of
teaching probably because of the relative ease of the use of such methods (Ali, 1986, &
Ezeh 1992). This, therefore, calls for the need to explore many other techniques, which will
not only be easy in usage but will be very effective in the realization of the goals of science
education in general. Hence, a study of this nature aiming at finding out the effects of an
assessment oriented instructional model on student’s achievement and interest has an
immense promise for the improvement of the status of science, technology and mathematics
(STM) teaching in Nigeria. The work of Harlem (2003) on enhancing inquiry through
formative assessment revealed that formative assessment during teaching enhances better
achievement in sciences. The problem of the study put in a question form is thus: What
would be the effect of an Assessment-Supported Instructional Model (ASIM) on students’
academic achievement and interest in secondary school mathematics?
26
Purpose of the Study
The main purpose of this study is to determine the effects of an Assessment -
Supported Instructional Model (ASIM) on student’s achievement and interest in secondary
school mathematics in Niger state of Nigeria. Specifically, the study will accomplish the
following objectives:
1. Ascertain the effects of Assessment–Supported Instructional Model (ASIM) on
students’ mathematics achievement.
2. Determine the mean achievement scores of students of high and low ability groups
taught mathematics using assessment supported instructional model (ASIM).
3. Examine the interaction effect between the instructions and students mental ability
groups on achievement in mathematics.
4. Determine the effects of Assessment-Supported Instructional Model (ASIM) on the
student’s interest in school mathematics.
5. Ascertain the mean interest scores of students of high and low ability groups taught
mathematics using assessment supported instructional model.
6. Examined the interaction effect between the instructions and students ability groups on
interest in mathematics.
Significance of the Study
Every education research is carried out with the primary aim of coming up with the
possible solutions to the problem at hand. The finding of research work would be use to
improve the teaching and learning process. Hence, this study is carried out with the hope
that it may come up with something meaningful towards improving the teaching and
learning process as well.
It is hoped that, if it is ascertained that the Assessment-Supported Instructional Model
(ASIM) improves student’s achievement and interest in mathematics at secondary school
27
level, then mathematics teachers can employ and use it as vital device for improving and
sustaining achievement and interest of students in school mathematics.
It is also hoped that findings of this study will also help the teacher in enhancing the
teaching learning process in the classroom. This is because the model is not only aiming at
the performance of the students during lesson but also giving the teacher an insight of
whether his/her stated objectives are achieved or not and if not why?. In this respect the
model will serve as a good guide to the mathematics teachers for improving his/her
techniques for the maximum realization of the instructional aims and objectives.
Assessment-Supported Instructional Model (ASIM) as the name implies is an
assessment-oriented model. If it proves effective, then issue of fear on the part of students at
the mention of quiz, test or examination would be completely reduced if not eliminated.
This will encourage students to practice and understand the subject and not to read it for the
sake of passing examination.
Also if the findings of this study prove effective by recording high achievement and
interest in secondary school mathematics, it may have implication for teacher education
institutions such as universities (Faculty of education), College of Education, National
Teachers Institute (NTI), and Polytechnics (Department of Vocational Teacher Education).
They may include the model into the pre-service and the in-service training of teachers in
general and mathematics teachers in particular.
Similarly, the result of this study may be of great importance to school administrators,
curriculum planners and classroom teachers other than mathematics teachers. The
administrators may encourage teachers to use the models. The curriculum planners may
incorporate the model as an integral part of teaching strategies. And other subject teachers
may wish to use the model in order to improve on the achievement and interest level of their
student in their various subjects.
28
It is finally hoped that this study will serve as an importance resource material for
intending researchers of this nature.
Scope of the Study
In its scope, the study will be concerned with the effects of an Assessment-Supported
Instructional Model (ASIM) on students’ academic achievement and interest in secondary
school mathematics. This will cover Kontagora Educational Zone of Niger State.
The study would be based on the current Senior Secondary II (SS2) students (males and
females). The content coverage for the study includes indices and logarithms while the
period for conducting the study is second term. The researcher selected SS 2 students, the
aforementioned topics and the term for the following reasons:
i. The students are free from any external or internal examination (NECO, WAEC or
promotion exams) being in second term;
ii. The topics are very much relevant to the students and are selected as provided in the
iii. The knowledge of the student logical reasoning and problem solving would be
examind through the selected topics.
Iv At this level the students are in a readiness position to react towards or against related
activities in reasoning and interest sustainable.
Research Questions
To successfully investigate the effects of an Assessment-Supported Instructional
Model (ASIM) on students’ academic achievement and interest in school mathematics
(indices and logarithms), the following research questions were raised:
1. What are the differences in the mean achievement scores as measured by Mathematics
Achievement Test on Indices and Logarithm (MATIL) between students taught using
29
Assessment-Supported Instructional Model (ASIM) and students taught with the
conventional method?
2. What is the mean mathematics achievement scores of high and low ability students
taught mathematics using the ASIM?
3. What are the differences in the mean interest scores as measured by Mathematics
Interest Inventory on Indices and Logarithm (MIIIL) between students taught using
Assessment Supported Instructional Model (ASIM) and students taught with
conventional method?
4. What is the mean mathematics interest scores of high and low ability students taught
mathematics using the ASIM?
Hypotheses
The following hypotheses were formulated for the study and would be tested at P ˂ 0.05
level of significance:
1. There is no significant difference in the mean achievement scores of students taught
using Assessment Supported Instructional Model (ASIM) and those taught with
conventional methods as measured by Mathematics Achievement Test on Indices and
Logarithm (MATIL)
2. There is no significant difference in the mean achievement scores of students of high
and low ability groups taught mathematics using ASIM as measured by MATIL.
3. There is no significant interaction effect between the instructions and ability groups on
student’s achievement as measured by MATIL.
4. There is no significant difference in the mean interest scores of students taught using
Assessment Supported Instructional Model (ASIM) and those taught with
conventional method as measured by Mathematics Interest Inventory on Indices and
Logarithm (MIIIL)
30
5. There is no significant difference in the mean interest scores of students of high and
low ability groups taught mathematics using ASIM as measured by Mathematics
Interest Inventory
6. There is no significant interaction effect between the instructions and ability groups on
student’s interest in mathematics as measured by MIIIL.
31
CHAPTER TWO
REVIEW OF RELATED LITERATURE
In this chapter review of related literature has been organized and presented under the
following major sub-headings.’
Conceptual Framework
Concept of Assessment
The role of assessment in teaching/instruction
Integrating instruction and assessment
Assessment Practices in the past
Concept of instruction
Concept of interest
Measurement of interest in mathematics
Mathematics and poor academic achievement
Theoretical Framework
Associationist and Behaviourist learning theories .
Empirical Related Studies
Studies on assessment.
Studies on interest in mathematics
Studies on achievement in mathematics
Summary of Literature Review
Conceptual Framework
Concept of assessment.
In educational programmes, there is always the need at certain periods of time to have
a kind of appraisal or reappraisal of the programmes situation. This provides a basis for
15
32
deciding whether the approaches adopted should be developed further, improved upon or
dropped. This could be achieved through educational measurement and evaluation.
Classroom assessment, according to McMillan (2007) can be defined as the collection,
evaluation and use of information to help teachers make decisions that improve student
learning. This implies that assessment is more than testing or measurement, which is a
familiar term that has been used extensively in discussing how students are evaluated:
In educational measurement and evaluation, four basic terms are employed in relation
to learners attributes. These include: test, measurement, assessment and evaluation. A test,
in the formal schooling system according to Anikweze (2005) is used to designate any kind
of device for measuring ability, achievement; interest and other traits. Harbor-Peters (1999)
see tests as instruments/devices for measurement. While Agwagah (2004) contends that test
is the procedure or device or instrument used in obtaining information concerning a person’s
characteristics. A test therefore provides a basis for the quantification of an individual’s
behaviour.
Measurement as defined by Gronlund (1981) is the quantitative description of
learners’ behaviour. Ebel (1972) in Anikweze (2005:58) defined measurement “as a process
of assigning numbers to individual members of a set of objects or persons for the purpose of
indicating differences among them in the degree to which the characteristics being measured
differ”. Hence, measurement in education is the quantitative description of pupils change in
behaviour. Therefore, measurement can be seen as the process of using a device (test) to
obtain data, in a quantitative form concerning the characteristics of an individual or object.
According to Bell and Cowie (2001) assessment is a synonym for evaluation. To them,
it requires both a description of and judgment regarding whatever phenomenon is being
assessed, be it students learning, teacher’s teaching, school climate, state-level commitment
and support or any other education related construct. Obioma (1991) defines assessment as
33
the process of using the result obtained from measurement to take relevant decisions about a
programme being assessed. Assessment according to Chauban (1979) in Anikweze (2005) is
the practical application of measurement. And just as all testing could be subsumed under
measurement, so could all measurement be subsumed under assessment.
Evaluation on the other hand was defined by Aikin (1970) in Anikweze (2005:60) as
“the process of ascertaining the decisions to be made, selecting related information and
collecting and analyzing information in order to report summary data useful to decision
makers in selecting among alternatives”. Ebel (1972) in Anikweze (2005) sees evaluation as
a judgment of merit based solely on measurement encompassing both quantitative and
qualitative and description of a person’s behaviour plus value judgment regarding
desirability or worth of that behaviour.
From the aforementioned discussion one will note that the process of evaluation
involves testing, measurement, and or assessment for the collection of essential information
that enables an individual to make precise and justifiable judgment (on the past) and
predictive decision (on the future) about whatever is being evaluated. Thus, evaluation does
not only lead to the determination of “where” and “how” an individual has arrived but it
also determine ‘where next’. As evaluation, assessment also facilitates future planning
especially with regards to attainment of defined objectives.
Therefore, the relationship between testing, measurement, assessment and evaluation
is very strong in the sense that objective evaluation demands rational assessment and
realistic assessment demands accurate measurement just as dependable measurement
demands objective, testing. Since one of the major concerns of this research work is
assessment, readers should not be confused when in place of assessment the researcher uses
evaluation. This is because in the course of defining assessment and evaluation it was
established by some authorities that assessment is synonym for evaluation. This argument
34
was supported by Agwagah (2004) where she stated that “thus, while assessment is
concerned with norm reference, evaluation is concerned with domain (criterion) referencing.
However assessment and evaluation suggest judgment and decision based on data and
observation.
Assessment is an integral part of the teaching and learning process. It provides
teachers and learners with necessary information about the extent to which educational
objectives have been achieved. No matter the controversy surrounding the use of assessment
scores, assessment still remain central to the issue of accountability in the educational
setting. The crucial nature of assessment necessitates the application of all seriousness in
instrument development, administration procedure, scoring and interpretation of scores from
a variety of tests, and other measurement instruments.
Assessment as defined by NTI (2008) as the process of organizing test data into
interpretable forms on a number of factors. Data are obtained using a wide variety of
instruments which include: test, questionnaire and observation. In general, several tests of
different types and testing different aspects of the child’s learning (cognitive, affective and
psychomotor) are needed in order to complete an assessment. That is assessment of learning
focuses on important factors and a number of measurement methods or techniques in order
to arrive at a mark or judgment in respect of the pupils’ progress in a particular subject, just
like evaluation.
The roles of assessment in teaching/ instruction
The roles/functions of assessment cannot be overlooked. Mehrens and Lehmann
(1975) in Nworgu (2003), Gronlund (1981) and Thorndike and Hagen (1977) in Agwagah
(2004) classified the functions of measurement and evaluation (assessment) into:
instructional functions, administrative functions, guidance functions and research functions.
35
Instructional functions of measurement and evaluation has to do with how
measurement and evaluation help to improve the effectiveness of teaching and learning.
According to Nworgu (2003), assessment serves the following specific functions:
Determining the entry characteristics of the students; ascertaining the extent to which the instructional objectives have been achieved; setting realistic objectives feedback on the efficacy of the teacher’s instructional methods and material; increasing students’ motivation to learn; development of good study habits; identification of students’ strengths and weaknesses.
Administrative functions of measurement and evaluation, relate to the ways in which
measurement and evaluation help the school heads in taking decisions about activities that
affect the entire school. Agwagah (2004) identified the following as the administrative
functions of measurement and evaluations: “Classification; placement; selection;
certification; providing information for outside agencies, curriculum development and
planning; and improvement of public relation.
Guidance functions of measurement and evaluation has to do with the way data
obtained from measurement and evaluation contributes to the success of guidance
programmes of the school. In this line, Nworgu (2003) identified three (3) guidance
functions of measurement and evaluation. These include: proper academic development;
making proper vocational decisions; and proper socio-personal development.
Research functions of measurement and evaluation is very vital because evaluation
techniques are used often than not in educational research. In conducting research on the
evaluation of teaching or strategies for improving instructional techniques or the revision of
curriculum content, tests may be employed as aids (Agwagah, 2004).
Hence, evaluation is an integral part of teaching and learning process just as
continuous assessment is to teaching and learning process because it provides basic data for
taking relevant educational decisions. The decisions may be instructional, administrative,
guidance or research oriented.
36
McMillan (2003) identified four essential components to implementing classroom
assessment, these components include: purpose, measurement, evaluation and use.
Purpose:
The first step in any assessment is to clarify the specific purpose of gathering the
information. This means a clear vision is needed of what and why are you doing the
assessment? What will be the gained from it? What teacher decision making is enhanced by
the information gathered through the assessment? A teacher will need to consider these
kinds of questions to fully integrate assessment with instruction.
Measurement:
McMillan (2003) defined measurement as a systematic process of assigning members to
behaviours or performance. It is used to determine how much of a trait, attribute, or
characteristics an individual possesses. This implies that measurement is the process by
which traits, characteristics or behaviours are differentiated. And the process can be formal
and quantitative. This definition was supported by Anikweze (2005) where he defines
measurement as a process of assigning numbers to individual members of a set of objects or
person for the purpose of indicating differences among them in the degree to which the
characteristics being measured differ. Hence measurement in education is both quantitative
and qualitative description of the learner’s change in behaviour.
Evaluation:
Once measurement is used to gather data, a teacher will need to place some degree of
value on different numbers and observation’s based on specific frame of reference. This
process according to McMillan (2003) is known as evaluation. Anikweze (2005) defined
evaluation as the process of ascertaining the decisions to be made, selecting related
information and collecting and analyzing information in order to report summary data useful
to decision makers in selecting among alternatives. This means that evaluation is a judgment
37
of merit based solely on measurement, because it encompasses both quantitative and
qualitative description of a person’s behaviour plus value judgment regarding desirability or
worth of that behaviour.
Use:
The final stage of implementing assessment is how the evaluation is used. The use of
test scores and other information is closely tied to the decisions teachers must make to
provide effective instruction, to the purpose of assessment and to the needs of students and
parent (McMillan, 2007). These decisions depend on when they are made. Their uses can be
categorized into: diagnosis, grading and instruction. Similarly, Agwagah (2004) and
Nworgu (2003) classified the functions of assessment into: instructional functions,
administrative functions, guidance functions and research functions.
Since the primary aim of this study is to establish ground of integrating instructions
and assessment, in other words this study is targeted towards using classroom assessment to
improve the teaching and learning process (instructions) more emphasis will be on the
instruction function (use of assessment). The following are the advantage of continuous
assessment in education enterprises as identified by Ajidagba (2001):
It is less stressful to students;
It does not summarily penalize students;
It encourages students to work hard by enabling them to know their performance
level,
It encourages the use of a variety of problem-solving skills;
It makes it easy for teacher to develop and use different approaches to teaching;
It serves as a measure that forces students to sit up for serious academic and non-
academic activities instead of playing;
38
With reference to academic work, continuous assessment has the potentials to
reduce the rate of memorization which students employ during final examination.
Integrating Instruction and Assessment
The role of an effective teacher is not only to impact knowledge and skills to learners
and assess them as well, but the role extend to a level of reaching decisions reflectively,
based on evidence gathered through assessment, reasoning and experience. Hence an
effective instruction cannot do without assessment. According to McMillan (2007), over the
past two decades, researches on teacher decision making, cognitive students’ motivation and
other topics have changed what is known about the importance of assessment for effective
teaching. For instance, a finding by Brookhart (2001) shows that teachers continually assess
their students relative to leaning goals and adjust their instruction on the basis of the
information gathered. Another important finding is that assessment of students not only
documents what students know and can do but also influences learning. This implies that
assessment that enhances learning is as important as assessment that documents learning.
Therefore, the outcome of such researches resulted into the development of new purposes,
methods and approaches to students’ assessment.
McMillan (2007) opined that it is helpful to conceptualize teacher decision making by
when decisions are made- before, during or after instruction-and then examine how
assessment affects choices at each time. This means that assessment is a systematic process
which begins right from the preparatory stage of instruction to its end. To further illustrate
how assessment is involved in each stage of the instruction process, McMillan present the
relationship as in the diagram below
39
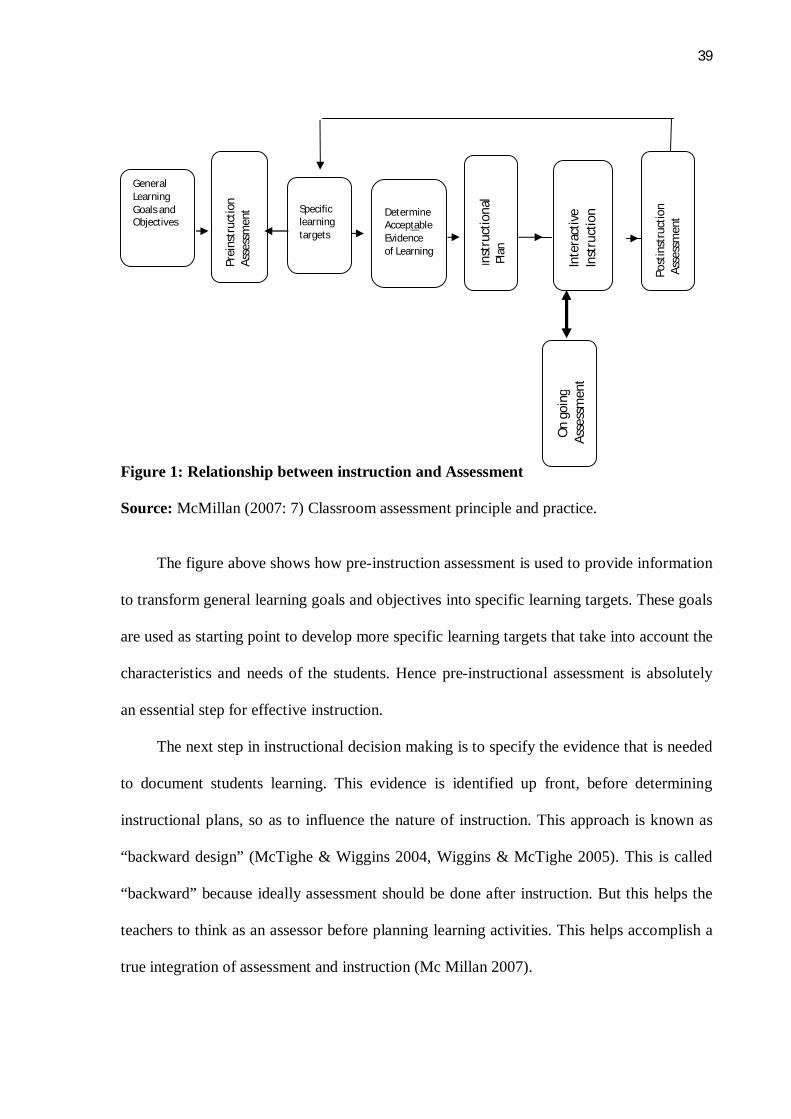
Figure 1: Relationship between instruction and Assessment
Source: McMillan (2007: 7) Classroom assessment principle and practice.
The figure above shows how pre-instruction assessment is used to provide information
to transform general learning goals and objectives into specific learning targets. These goals
are used as starting point to develop more specific learning targets that take into account the
characteristics and needs of the students. Hence pre-instructional assessment is absolutely
an essential step for effective instruction.
The next step in instructional decision making is to specify the evidence that is needed
to document students learning. This evidence is identified up front, before determining
instructional plans, so as to influence the nature of instruction. This approach is known as
“backward design” (McTighe & Wiggins 2004, Wiggins & McTighe 2005). This is called
“backward” because ideally assessment should be done after instruction. But this helps the
teachers to think as an assessor before planning learning activities. This helps accomplish a
true integration of assessment and instruction (Mc Millan 2007).
Specific learning targets
Determine Acceptable Evidence of Learning
Ins
truc
tiona
l
P
lan
I
nter
activ
e
I
nstr
uctio
n
Pos
tins
truc
tion
A
sses
smen
t
On
goin
g
Ass
essm
ent
Pr
eins
truc
tion
Ass
essm
ent
Ass
essm
ent
General Learning Goals and
Objectives
40
Once acceptable evidence is identified, selection of instructional strategies and
activities to meet the target follows. This entails the experiences the teacher wants to pass
onto the learners and how they are accomplished. This stage leads to the next step which
involves interactive instruction. Also assessment is done during instruction known as
ongoing assessment which takes place during the teaching process. After instruction, then
more formal assessment of learning targets is conducted known as postinstruction
assessment. This provides information for grading students, evaluation teaching and
evaluating curriculum and school programmes.
Assessment practices in the past:-
Most of Nigerian schools still operate the traditional assessment practices of the last
century. This involves assessing pupils with the sole aim of preparing them for
examinations (NTI 2008). Emphasis is placed on obtaining high marks without regard for
understanding or the ability to apply the concepts learnt in solving real-life problems.
This type of assessment is referred as conventional form of assessment (Ogunniyi
1992). In the conventional form, tests are given at certain intervals. These may be
fortnightly, terminally and or yearly. Such tests are usually used for judgmental purposes
and they are to determine the progress the learner has made towards the goal in a given
period. These judgments usually have far-reaching effects on the individual learner. It is a
kind of summative evaluation of the learners achievement which the information obtained
there from are not used to guide the teacher to improve learning and neither do the students
to learn any thing from their mistakes.
The dominant use of this kind of assessment leads teachers, to concentrate on
assessing the ability of pupils to reproduce “fact” or steps in solving problems. This then
implies that little or no attention is given to the “higher mental tasks” thinking and
application of skills. Hence students lack the ability to apply the knowledge in real world; to
41
analyze the information; to synthesize new information based on what was learned; and to
evaluate the outcome of knowledge applied.
In effect, the traditional or conventional assessment practices that operate in the past in
Nigerian schools have the following negative effects as out lined by NTI (2008).
• Too much emphasis on the outcome of final external examination leads teachers to
concentrate on trying to cover the syllabus, without regard to whether the pupils
understand what is taught. This kind of teaching has resulted in the children finishing
schools without the ability to read, write, do arithmetic and acquire the basic life skills.
• Teachers do not focus on formative assessment and this has the effect of not correcting the
mistakes that children make in learning. For this reasons, they may form many wrong
concepts which are not detected in time. These are prevalent in the learning of English
where pronunciations and grammar are often distorted.
• Since pupils are not given prompt feedback on the progress they are making in learning,
they are not able to plan for their learning and this could lead to lack of motivation to learn.
Prompt feedback on learning help to keep pupils interested in learning.
• Assessment of specialized skills and competencies is often neglected. Practical abilities and
skills such as the use of equipment and tools, designing and fabrication of
implements/equipment etc. cannot be effectively assessed through written tests. Over
emphasis on written test does not ensure adequate coverage of the curriculum.
Concept of Instruction:
The concept of “instruction” which one often meet in educational discussion has clear
connotation and carries with it also, a number of derogatory implications. Instruction,
according to Daramola (2001), represents the passing on of information. The emphasis here,
according to him is upon what is communicated and its importance and not upon either the
instructor or the pupil. The emphasis in instruction is upon the factual material which is
42
clearly understood by the instructor, has been ordered for presentation by him/her and is
represented to the pupil.
Gagne (1970) sees instruction as being only one aspect of education, albeit an
important aspect to be considered if one wishes to improve educational practice. For
instance, administrative matters and general inter-personal relationship do not directly
involve the process of instruction per se. But that instruction is a central part of education.
Hence, instruction mainly involves the arrangement of those conditions which facilitate
learning. Some of the features to be considered in designing instruction exist within the
learner, that is internal and others involve conditions in the environment that is external to
the learner (Daramola 2001). Thus, the teacher is concern with some combination of internal
conditions (what the learners have already leant, what aptitudes and limitations that are
pertinent to the present learning and so on) and external conditions (how materials are
sequenced, how they are presented to the learners, what kinds of feedback and so forth)
which will facilitate attainment of the desired educational objectives.
According to Fajemidagba (2001), an instructional system cannot afford to be void
of instruction objectives. Hence teacher education programmes, whether is competency-
based or performance-based are hinged party on the ability of teachers to develop
behaviourally stated instructional objectives in a developmental fashion. Teachers are
therefore, expected to state instructional objective in terms of learner’s performance.
Instruction usually sets forth rules concerning the optimal way of achieving knowledge or
skill (Olorundare 2001).
In its elementary form, instruction itself has two main objectives: - that the child
learns a rule and that the child to be able to apply such rules over a wide range of
apparently disparate circumstances, that is to achieve maximum transfer. Instruction also
serves two purposes: - it produces changes in the adjustmental behaviour of the learner by
43
helping him/her to acquire concepts; it also makes the learner think and learn
independently. Instruction can also be seen as a multimedia process between two
anchoring point: - the learner and a body of knowledge with the teachers as the monitor
even though, he/she is a participant in the information-processing system (Ziman 1978).
In the instructional process the teacher’s main task is to promote and facilitate
meaningful learning. A teacher would not have completed his instruction task until he/she
has determined the performance of his/her learners (Danmole 2001). Hence, assessment of
students/learners learning outcome is imperative in the instructional process. This is because
the depth of student’s knowledge as a result of instruction, obtained in school can be
identified when the analysis of data collected from assessment and evaluation has been
done.
Concept of Interest
Interest has been defined differently by different authors. Interest is described as the
attraction, which forces or compels a child to respond to a particular stimulus (Obodo 2002).
This implies that any particular stimulus that is attractive or stimulating will make the child
develop interest on it. That is in a classroom situation, a child will be attentive during lesson
if he/she is very much interested in that particular lesson. According to Harbor-Peters
(2002) interest comes as a result of curiosity and eagerness to learn and not by force.
Nna (2002) strongly opined that interest is a state of mental and emotional readiness
on the part of an individual to respond to an educational situation in a manner that gives first
place to the interest of a society and profession. This implies that interest is that internal
state of an individual that influences his/her personal actions. While Taylor (1999) opined
that interest leads individual to make a variety of choices with respect to the activities in
which he/she engages. He/she shows preference to some and aversion to others. This
44
definition assumes that interest in mathematics implies the reactions, impression and
feelings an individual has to mathematics and mathematics related tasks.
Obodo, (2004) pointed out that the type of interest a student brings to the classroom is
very important. This then means if a student has developed positive interest towards a
particular subject he/she not only enjoys studying it but would also derive satisfaction from
the knowledge of the subject. According to Nworgu (1992), interest is one particular class
of attitude that is always positive and one associated with object or activities that are need-
satisfying and pleasure giving support him.
Interest is defined as a tendency to seek out and participate in a type of activity
(Thorndike and Hagen 1977). Interest is a classified human sentiment which goes along
with value, attitudes, and other forms of human preference. It is a preferential treatment
given to a particular activity. In the words of Chauham (1978), interest means to make a
difference. It explains why an organism tends to favour some situations and thus reacts to
them in a very selective manner.
Strong (1943) as cited by Akano (1999) described interest as a response of liking, and
aversion, (a response of disliking). To him, interest is present when one is aware of an
object or better when one is aware of his/her set of disposition towards the object. This
implies that a person likes the object when he/she is prepared to react towards it; similarly a
person dislikes the object when he/she wishes to let it alone or gets away from it.
Super (1949) in Akano (1999) elaborated four (4) types of interest based on general
principle of life and on the nature of an individual especially on the personality needs of an
individual. These types of interest are:
i. expressed interest
ii. manifest interest
iii. tested interest
45
iv. inventory interest.
Expressed Interest: - This has to do with an expression of personal interest in relation to
material things. In this regard an individual express his/her like, dislike or even indifference
toward the object in question.
Manifest Interest: - This has to do with interest in recreational activities. It involves not
only expression of interest in activities but also active participation in those activities for
which one professed a positive response. In school situation for instance, a child who
expressed interest in a particular game or subject, would often be seen participating actively
in that particular game or subject. The child thereby manifests his/her interest.
Tested Interest: - As the name implies, this has to do with the interest that is measured and
tested through the use of objective tests. It is aimed at improving the creational selection in
various jobs, to provide vocational guidance in vocational selection and keeping into
consideration the individual’s future success.
Inventory Interest: - This looks more like a check list. It involves the weighing of an
individual’s preference response which may be - like, indifferent, or dislike. Scoring of the
individual’s responses is used to determine the patterns of individual’s interest.
With the above background in mind, teachers should always have at the back of their
minds the interest of their learners on various subjects. Hence the issue of subject interest
comes in. Subject interest refers to an individuals (learner’s) like, dislike or indifference
responses towards the school various subjects. Therefore, this interest may be expressed or
professed and behaviourally manifested. This is concerned with assessing learner’s interest
as expressed or inventoried.
Harbor-Peters (2002) defined interest as a motivational construct. That it spurs one
into action and gives sense of direction to ones activities. It is a disposition, attitude, or
feeling of an individual towards activity, object, person, things or event which manifests
46
behaviourally in the extent the person likes to participate in activity or interact with the
object. It was explained that interest is manifested in likes, dislikes, intentness, concern, and
curiosity about an object, withdrawal and total participation or devotedness (Kurumeh
2004).
Interest is perceived in relation to internal state of mind or reactions to external
environment or disposition to experience (Smith 1990). And interest was defined as the
readiness to react toward or against a situation, person or things in a particular manner. For
instance, interest in mathematics is a predisposition to respond to mathematics rather than
the actual capability or response to mathematics. Interest is very importance in the area of
learning of mathematics because it facilitate effective concentration by learners in the
mathematics topics they have develop positive interest. Obodo (2004) pointed out the fact
that interest is indispensable for learning especially mathematics and hence many hold the
view that there is no real education of which ever kind without interest. This is because
interest serves a facilitator, motivator, or compelling force that energizes an individual to
action. Although, the importance of interest in learning cannot be over emphasized, however
excessive interest in anything more especially mathematics topics may have adverse effect
on the educator’s aim as much as its complete absence.
According to Badmus (2002) interest can be dichotomized into two kinds. These are
basic interest and occupational interest. Basic interest has to do with the kind of thing an
individual likes to do, while occupational interest has to with, the degree to which an
individual is similar in likes and dislikes to other individuals who are happily employed in a
certain occupation. These two have led to different methods of measurement and assessment
in that domain. They also viewed interest in relation to state of motivation, which direct and
redirect activity towards a particular goal and these are resultants of emotional (affective)
and motivational (appetitive) processes. Interest in mathematics views from these
47
perspectives is the mental and emotional disposition of individuals to engage in
mathematics related studies and activities. To this end, it means that interest is not a
spontaneous response rather it evolves from mental and cognitive process.
The place of interest in the learning cannot be overlooked. The development of interest
in learning mathematics has for long been accepted as an integrated and objective aspect in
mathematics and mathematics teaching. In view of the above, mathematics teachers should
therefore, strive to make mathematics lessons objectives (be they cognitive skills, factual
knowledge or attitudes and values) pleasant and interesting to the learners. Interests are not
innate but learned (Ale 2000). As such the development of interest should be based on
previous experiences of the individuals as it is expressed in mathematics.
Researches carried out recently on students’ interest in science and mathematics
education have shown that students’ interest in science and mathematics is quite poor
(Odunisi 1994). According to Nna (2002) the poor interest culminated in the dwindling
enrolment in mathematics institutions and in poor performance of students at secondary
school level. Nna also noted that student’s interest in science has always contributed to
scholastic achievement in sciences.
From the discussion above, it become imperative that mathematics educators should
seek for various ways of fostering and enhancing the interest of learners in this
indispensable subject mathematics. There are various ways that this sordid situation can be
rescued. One among various ways is the use of reliable teaching strategy which will
encompass constant assessment and feedback to students learning in mathematics.
Measurement of Interest in Mathematics:
A resourceful and good mathematics teacher must be very much interested and
concerned on what his/her students learn and also how and why learn such content of
experience. This will assist the teacher in identifying activities which students like or
48
dislike. This in return leads to the idea of interest. The teacher should have knowledge of
measuring students’ interest; hence the assistance of interest inventories is very much
necessary. Mathematics teachers should try at all cost to make their lesson’s objectives
practical, meaningful, pleasant and interesting to the learners. In doing this the teacher
should have wider understanding of the subject and various strategies that will make
mathematics lesson real and appealing to students. This will make for meaningful learning
to take place. This is because students interest can influence how well they learn and what
they learn (Harbor-Peters, 2002).
As stated earlier, interest in students are not innate but learnt (Nworgu, 1992). So
mathematics teachers should strongly bear the above in mind and provide meaningful and
interesting activities. The interest an individual has depends on the kinds of activities he/she
select to occupy his/her leisure time when allowed unrestricted choices.
To measure interest involve sampling, activities related directly or indirectly to some interest’s objects. The test constructor has to specify the traits, skills or knowledge needed for the task of measuring interests and then prepare the items. Because the items are selected and keyed on a logical (rational) basis rather than on empirical grounds, the procedure is called logical construction. The list of these activities, traits or knowledge is called interests inventory. The inventory is then administered on the students whose interests are being determined. The students in turn select from the list, the particular activities they agree with (Mehrens and Lehman, 1984 and Harbor-Peters, 2002).
In mathematics learning, the interest of students can be measured by identifying and
listing the relevant aspects of the mathematics curriculum contents, activities, traits, skills,
knowledge, objects and materials in the teaching and learning mathematics. Through the use
of any of these techniques, student’s interest in mathematics can be measured. Such
techniques include: observation, interview, questionnaire and even test where and when
necessary. Specifically questionnaire in form of interest inventory is used by many
researchers-in the process of conducting their research work. And this study will not be
exceptional.
49
In measuring student’s interest in education, Odo, Okonkwo and Amenaghawen
(1990) identified five approaches that can be used. If students are made to write an account
of the activities in learning mathematics in which they derive greatest pleasure and those
they have least pleasure. In this vein expressed interest is considered. When direct
observation is done by teachers, parents and peer groups, on the amount of time spent in
various activities, through this means, the degree of pleasure, displeasure and narrowness of
interest could be observed. Hence, manifest interest is the outcome. If experimental situation
could be set up in which students are required to participate in various activities, when they
are assessed in the experiment then measured interest is also manifest interest. Similarly if
students are engage in a project and they are assessed, this is tested interest. Finally if a
questionnaire is employed to measure interest, inventoried interest come up.
Mathematics teachers are left with many options to choose among the various methods
mentioned above to measure student’s learning interest in mathematics. They should always
relate learning activities to the students’ interest in mathematics. Mathematics teachers
should also bear in mind some unresolved problems in the assessment of all non-cognitive
outcomes in the process of measuring student’s interest in mathematics. Some of these
problems include problems of definitions, response set, faking reliability and validity test
and sex bias (Kurumeh 2004).
Mathematics and poor academic achievement
In the teaching and learning process in general and mathematics in particular, the
teacher’s main task is to promote and facilitate meaningful learning. A teacher would not
have completed his task until he/she has determined the performance level of the students.
Hence, evaluation of students learning outcomes is imperative in the instructional process.
For quite some time now mathematics education in Nigeria has recorded poor
performance and achievement at the primary and secondary school levels which in return
50
affects the enrolment rate of students in the tertiary institutions to read mathematics or
mathematics related courses. There has been so much concern and outcry from many
quarters about the poor performance of students in mathematics (Lawal, 2001). From the
WAEC results in many secondary schools, the percentage of failures each year out
numbered the percentage of successful candidates. As mentioned earlier this situation has an
adverse effect on enrolment of students for mathematics and mathematics related subjects in
tertiary institution as well as the nation’s scientific and technological advancement. What
could be the possible causes of this ugly situation?
Many factors have been found from various studies as being responsible for hindering
of improving achievement in mathematics among secondary school student. Hembree
(1990) and Ma (1999), associated poor mathematics achievement to the presence of
mathematics anxiety. On the other hand, it has been noted that the architect of instruction
(the teacher) plays a vital role in determining mathematics achievement. According to
Dossel (1993) and Stuart (2000), a warm atmosphere in the classroom and the ability of the
teacher to build self-confidence increases achievement in mathematics.
Ibraheem and Ogunnusi (2001) pointed to the multiplicity of factors that range from
shortage of qualified teachers, at all levels, poor teaching methods, low level of student’s
interest in mathematics, non-encouragement of research activities in mathematics,
government lukewarm attitude to mathematics education to societal non-chalant attitude
towards mathematics. Obodo (1990) and Agwagah (1993) stated that mathematics teaching
today still follow traditional pattern which is identified to be ineffective and a major factor
responsible for the poor performance of students in mathematics.
In the words of Obodo (1991), the causes of poor performance in mathematics could
be attributed o the student’s problem of language and poor mathematical background. He
noted that mathematics is a language of size, orders and symbols and it is taught in a foreign
51
language (English). Both students and teachers are faced with problem of not understanding
these two languages thereby resulting in poor performance. Again he explained that poor
background which students carry right from primary school affects them in secondary
because one builds from foundation. He lamented that most primary school teachers do not
cover their scheme of work for mathematics and this creates a loophole in secondary
mathematics. Other causes he mentioned include lack of qualified mathematics teachers, use
of uninspiring methods, non payment of teachers’ salaries, difficult nature of mathematics,
and non usability and non applicability of mathematics in student’s culture.
Obodo (2001) pointed to inappropriate assessment practices with instruments whose
validity is questionable by WAEC as part of the problem causing the general poor
performance in mathematics education. Students performed poorly not only because
mathematics is difficult to be understood but because many teachers handle mathematics
perfunctorily. Presentation of mathematics by teachers as a difficult collection of formulae
that need to be crammed will succeed in discouraging students from offering the subject.
Furthermore, the wrong notion among the students in their elementary stage of schooling
that mathematics is difficult contributed to the very low quality of performance in
mathematics. Government, on the other hand contributes to poor performance in
mathematics by shortage supply of man power, facilities, text book and instructional
materials which cannot be improvised by the teachers. Also constant changes of educational
policy by government have played a vital role in the production of poor performance.
From the discussion so far, the major factors responsible for poor performance of
students in mathematics education include: the teachers, the students, and the government,
the parents and the society at large. Each of these factors affected the performance in one
way or another. For instance the parent’s inability to provide their children with adequate
52
learning materials such as textbooks, exercise books etc has an adverse effect on student’s
performance in general.
Efforts have been forwarded so as develop strategies to improve on this poor
performance in mathematics some of these strategies include target task approach, by
Harbor-Peters (1992) use of computer-aided instruction by Ozofor (1993), ethno
mathematics approach by (Kurumeh 2004) and many others. This study would use
assessment supported instructional model to improve students’ achievement in mathematics.
Theoretical Framework
Associationist and Behaviourist Learning Theories
Edward Thorndike’s (1922) associationism and the behaviourism of Hull (1943),
Skinner (1938, 1954) and Gagne (1965) were the dominant learning theories for the greater
part of the 20th century. Their views of how learning occurs focused on the most elemental
building blocks of knowledge. Thorndike was looking for constituent bonds or connections
that would produce desired responses for each situation. Similarly, behaviourists studied the
contingencies of reinforcement that would strengthen or weaken stimulus-response
associations. The following quotation from Skinner (1954) is illustrative:
The whole process of becoming competent in any field must be divided into a very large number of very small steps, and reinforcement must be contingent upon the accomplishment of each step. This solution to the problem of creating a complex repertoire of behaviour also solves the problem of maintaining the behaviour in strength . . . . By making each successive step as small as possible, the frequency of reinforcement can be raised to a maximum, while the possibly aversive consequences of being wrong are reduced to a minimum (p. 94).
Although it is not possible to give a full account of these theories here, several key
assumptions of the behavioristic model had consequences for ensuing conceptualizations of
teaching and testing, these include: 1. Learning occurs by accumulating atomized bits of
knowledge; 2. Learning is sequential an hierarchical; 3. Transfer is limited to situations with
53
a high degree of similarity; 4. Tests should be used frequently to ensure mastery before
proceeding to the next objective; 5. Tests are the direct instantiation of learning goals: and 6.
Motivation is externally determined and should be as positive as possible (Greeno, Collins,
For all learning theories, the idea of transfer involves generalization of learning to new
situations. Yet because behaviourism was based on the building up of associations in
response to a particular stimulus, there was no basis for generalization unless the new
situation was very similar to the original one. Therefore, expectations for transfer were
limited; if a response were desired in a new situation, it would have to be taught as an
additional learning goal.
Testing played a central role in behaviourist instructional systems. To avoid learning
failures caused by incomplete mastery of prerequisites, testing was needed at the end of
each lesson, with re-teaching to occur/ until a high level of proficiency was achieved. In
order serve this diagnostic and prescriptive purpose, test content had to be exactly matched
to instructional content by means of the behavioural objective. Because learning
components were tightly specified, there was very limited inference or generalization
required to make a connection between test items and learning objectives. Behaviourists
worked hard to create a low-inference measurement system so that if students could answer
the questions asked, it was poof that they had fully mastered the learning objective. The
belief that tests could be made perfectly congruent with the goals of learning had pervasive
effects in the measurement community despite resistance from some. For decades, many
measurement specialists believed that achievement tests only required content validity
evidence and did not see the need for empirical confirmation that a test measured what was
intended. Behaviouristic assumptions also explain why, in recent years, advocates of
measurement-driven instruction were willing to use test scores themselves to prove that
teaching to the test improved learning, while critics insisted on independent measures to
verify whether learning gains were real (Koretz, Linn, Dunbar,& Shepard, 1991).
Behaviourist viewpoints also have implications for assessment in classroom. For example,
when teachers check on learning by using problems and formats identical to those used for
55
initial instruction, they are operating from the low inference and limited transfer
assumptions of behaviourism.
Behaviourism also makes important assumptions about motivation to learn. It assumes
that individuals are externally motivated by the pursuit of rewards and avoidance of
punishments. In particular, Skinner’s (1954) interpretation of how reinforcement should be
used to structure learning environments had far-reaching effects on education. As expressed
in the earlier quotation, it was Skinner’s idea that to keep the learner motivated, instruction
should be staged to ensure as much success as possible with little or no negative feedback. It
is this motivational purpose, as much as the componential analysis of tasks that led to the
idea of using assessment supported instructional model in enhancing the teaching and
learning of mathematics.
Empirical Related studies:
Viable researches were been carried out by various researchers on how to improve the
teaching ad learning of mathematics globally. In some of these researches, variables such as
assessment, achievement, interest, retention, anxiety, ability and many others in relation to
the teaching and learning of mathematics and other science subjects were considered. In this
section review are done in the following:
• Studies on assessment
• Studies on interest in mathematics
• Studies on achievement in mathematics
Studies on assessment
The assessment that occur everyday in science classrooms in general and mathematics
in particular is often overlooked. Teachers commonly view assessment as something apart
from their regular teaching, serving the purpose of assigning grades (Shavelson and Seal,
2003). However, teachers must assess their students while learning is in progress. This will
56
make instruction to be effective because the information gained will have effect on the
entire instruction. This process of assessing students when learning is in progress is called
formative assessment. Black & William (1998) defined formative assessment as “all those
activities undertaken by teachers and or by their students, which provide information to be
used as feedback to modify the teaching and learning activities in which they engaged”.
A study conducted by Butler (1988) using 11-year old students from four schools in
Israel, twenty four (24) from the top quartile of their own class in test of mathematics and
language, and twenty four (24) from the bottom quartile. Students complete written tasks
that were not related to the regular curriculum. After the experiment, post-test performance
indicated that scores on the tasks increased most significantly among the three sets of
students. The only significant difference between the high and low performing students was
found in terms of interest; students with lower score also showed lower interests.
In a controlled study, White & Frederiksen (1998) explored how peer and self-
assessment could help to build students’ understanding of scientific inquiry. Students from
science classes were randomly assigned to conditions half of the students were used as
experimental groups while the rest half as the control groups. The two groups were allowed
equal time for the observation. The experimental groups that engaged in the formative
assessment process performed better. Perhaps most notable, however is the fact that lower
performing students in the experimental groups showed the greatest improvement in
performance when compared to control groups.
Report of the Director Improving Educational Quality Project (IEQP, 2003) shows
that a feasibility study was developed and implemented on continuous assessment in
Malawi. The study was carried out using 21 schools in the Ntcheu District of Malawi. The
focus was on standard 2 English, Mathematics and Chichewa. The study came up with
57
valuable finding that led to the production and adoption of continuous assessment manual
that evolved in Malawi.
A study on continuous assessment was conducted by Harbor-Harbor (1999) with the
primary aim of assessing effectiveness of continuous assessment practices in Nigerian
schools, using 1,200 NCE teachers on sandwich programme as the subjects of the study.
The subjects were exposed to five items unstructured questionnaire. The results showed that
continuous assessment is a better substitute to the one-shot final examinations for its
capability to fight examination malpractices and improve students’ performance. The result
further revealed that the qualities of C.A. are in order and that it serves the purpose of
diagnostic and motivation. It was discovered that teachers do not practice continuous
assessment system properly due to large students’ population and lack of time on the
teachers’ part. Among other recommendations, the researcher recommended that continuous
assessment should remain as the main Nigerian evaluation strategy. From the above, there is
the need to emphasize the importance of quantitative experimental studies, to determine
causality in educational research. This will encourage the use of assessment to improve the
learning situations.
Studies on Interest in Mathematics
Mathematics is an indispensable thing to the entire life of the human races. In Nigeria,
it is one of the core subjects in both the primary and Senior Secondary School Curricula.
Nevertheless, student’s show little or no interest in the subject which in returns brought
about poor achievement. These have forced researchers to undertake various studies in order
to come up with ways of improving student’s interest in mathematics. One of such studies is
the one carried out by Harbor-Peters (1990). She conducted a study comparing the effect of
the Target-task, delayed formalization and expository models of teaching on achievement,
retention and interest of junior secondary school (JSS 2) students in algebra. A sample of
58
four hundred and seventy seven (477) JSS 2 students was randomly selected from four (4)
junior secondary schools in Enugu education zone of Enugu State. The design of her study
was non-equivalent quasi-experimental. The finding revealed that the target-task approach
was the most effective in producing interest of students in algebra.
In another development, Alio (2000) investigated on the effect of Polya’s language
technique in teaching problem solving in mathematics. The research design was quasi-
experimental. A twenty-five (25) – items multiple choice achievement test with
mathematics interest scale were administered before and after the treatment to a sample of
three-hundred and twenty (320) SS 2 students who were assigned to experimental and
control groups. The findings analyzed using analysis of covariance (ANCOVA) revealed
that student’s interest towards problem solving in mathematics was significantly affected by
being exposed to the new method (Polya’s language techniques).
Again Ozofor (2001) conducted a study titled “the effect of two modes of computer and
aided instruction on students’ achievement and interest in Enugu State”. Ozofor, sample out
ten (10) intact classes and assigned them to experimental and control groups. The data
collected were analyzed using analysis of variance (ANCOVA) p<0.05. The study revealed
the following that:
1. Subjects in the experimental group achieved higher mean interest score in the
mathematics inventory scale than those in the control group.
2. The interaction effect between interest scores and method on the students has been
significant.
In addition, Kurumeh (2004) also conducted a study on the effects of ethno-
mathematics approach on student’s achievement and interest in geometry and mensuration
for junior secondary students in Anambra State. A sample of four hundred (400) JS 1
students was drawn from a sample of eight (8) intact classes which were assigned to
59
experimental and control groups of four (4) intact classes each. The researcher employed
mean, standard deviation and analysis of variance (ANCOVA) to analyze the collected data.
The study revealed that ethno-mathematics approach is more effective in fostering and
facilitating achievement and interest in students in geometry and mensuration than the
conventional method. Hence, the issue of interest in mathematics generally is nothing to
play with, because it may facilitate or hinder students’ achievement in the subject.
Studies on achievement in mathematics
Doing mathematics involves many things but nothing is mathematics until it is
proved. Current school mathematics curricular naturally places some emphasis on
developing skills on mathematical reasoning (Almeida 1996). The development of
reasoning ability is one of the major goals of mathematics education, and mathematics as
reasoning is one of the objectives of the standards created by the National Council of
Teachers of Mathematics.
A study was conducted by Thijsse (2002), using a structured teaching approach to
address mathematics anxiety for grade eight students in South Africa. The researcher noted
that mathematics anxiety and instructional techniques are the major problems that affect
achievement in mathematics. A high level of anxiety in mathematics is associated with a
lower level of achievement. It therefore implies the need for effective studies on the
prevention of mathematics anxiety and the need for teachers to be more aware of how
mathematics anxiety is engendered and how it can be prevented.
Thijsse purposed to investigate the effects of the “Kumon” programme as a structured
intervention programme. According to the researcher, Kumon programme is a simple,
methodical approach to learning which provides an effective means of discovering and
developing the untapped potentials of every child to the maximum. The researcher
specifically wanted to:
60
i. Investigate the relationship between mathematics anxiety and mathematics
achievement.
ii. Investigate the relationship between mathematics anxiety and different teaching
methods.
iii. Investigate whether a structured approach to teaching mathematics will affect
fluency in basic arithmetical skills, which will have an effect on mathematics
anxiety.
The subjects for the study at the initial take up consists of sixty-eight (68) grade eight
learners which later dropped, as a result of the application of the study orientation-
questionnaire in mathematics (SOM) and Kumon P4 diagnostic test. The questionnaire was
used to identify learners with high level of mathematics achievement. Of these learners
thirteen (13) were identified as having high mathematics anxiety. From these learners, ten
(10) were randomly chosen and were assigned to both experimental and control groups of
five (5) each. Instruments used for the study included the study orientation questionnaire in
mathematics (SOM), Kumon diagnostic mathematics test, analysis of school marks and
interview. Major finding of the study are
1. That both the control and experimental groups showed decrease in anxiety.
2. That there was increase in achievement as a result of treatment on experimental
group.
3. That there was improvement on achievement in terms of mathematics speed,
accuracy and school test marks etc.
There are several studies conducted from different parts of Nigeria on mathematics
achievement. What necessitated these studies is the nature and trend of studies conducted
using West African School Certificate (WASC) result showed a high rate of poor
61
mathematics achievement manifested by Nigerian students at the secondary level (Lassa
1986).
In another study, Kurumeh (2004), examined the effect of ethno-mathematics
approach on student’s achievement and interest in geometry and mensuration for Junior
Secondary Students in Ogidi Aguata Education zones of Anambra State. A sample of four
hundred (400) JS 1 students was drawn. Treatment and control groups were randomly
assigned to four (4) intact classes each, totaling eight (8) intact classes. The data collected
were analyzed using mean, standard deviation and Analysis of Covariance (ANCOVA). The
findings revealed that, ethno-mathematics approach is more effective than the conventional
method in fostering and facilitating achievement and interest in students in geometry and
mensuration. It is very much clear from the above reviews that mathematics educators are
very much concerned with changes and improvement in the methods of mathematics
instruction and students achievement in mathematics. However, assessment approach was
not used to solve this sordid situation. In view of the above, this study is designed to effect
change in mode of mathematics instructions.
Summary of Literature Review
In this chapter effort has been made to review as much as possible literature related
to this study. The researcher reviewed the literature for the under brand heading namely
conceptual frame work, theoretical frame work and empirical studies. Under the theoretical
frame work, theories found to be more relevant were associationist and behaviourist learning
theories. Associationist and behaviourist theories of thorndilee and skinner were found most
suitable because of the of the students used in the study. That SS 2 students. Since the
study is interested in the constant use of assessment tools such as tests in learning, their
views of how learning occurs focused on the most elemental building blocks of knowledge.
As the associationist look forward for constituent bonds or connections that would produce
62
desired responses for each situation, the behaviourist apply the contingencies of
reinforcement that would strengthen or weaken stimulus-response association… Several key
assumptions of the behaviourist model had consequences for ensuring conceptualizations of
teaching and testing which is the major focus for this study. Few among their assumptions
are: learning occurs by accumulating atomized bits of knowledge, test should be used
frequently to ensure mastery before proceeding to the next objectives, tests are the direct
instantiation of learning goals and motivation is externally determined and should be as
positive as possible. With the above assumptions it was observed that these assumptions
will serve a basis for this study. This is because in this study series of assessment would
be administered and these might improve the learning of indices and logarithms.
The conceptual framework, which aimed at emphasizing on the various concepts that
are relevant to this study were discussed. These include the role of assessment in teaching,
integrating instruction and assessment, interest as factor in determining achievement in
mathematics, and the issue of mathematics and poor achievement. The review also focused
on some empirical research findings on assessment, interest and achievement in
mathematics. However, many studies have been carried out in the area of assessment, but
none of these researchers conducted studies on an assessment supported instructional model
to the best knowledge the researcher. Hence, this study is geared towards filling this gap.
Therefore, the primary aim of this study is to investigate the effect of an assessment
supported instructional model (ASIM) on students’ academic achievement and interest in
indices and logarithms.
63
CHAPTER THREE
RESEARCH METHOD
This chapter discussed the research method used for the study. This chapter describes
the research design, area of the study, population of the study, sample and sampling
techniques, instrument for data collection, validation of the instrument, trial testing of
instrument, reliability of the instrument, training of mathematics teachers as research
assistants, experimental procedure, control of extraneous variables and method of data
analysis.
Research Design
The design of the study is quasi-experimental in nature. In specific terms, the study is
non-equivalent control group design. Quasi-experiment is an experiment where
randomization of subjects to experimental and control groups is not possible (Nworgu,
2006). Intact classes were therefore used for the study. The intact classes were randomly
assigned to experimental and control groups respectively. The use of intact classes was
necessary in order not to disrupt the normal class periods. The study was specifically pretest
posttest non equivalent control group design. The design is diagrammatically presented as
shown below:
Group Pretest Treatment Post test
E O1 X O2
C O1 ~ X O2
Key:
E = Stands for experimental group
C = Stands for control group
O1 = Pretest
O2 = Post test
X = Treatment administered to experimental group
~ X = Treatment administered to control group
47
64
Area of the Study:
This study was carried out in Kontagora Education zone in Niger State, Nigeria. The
zone comprises three (3) local government areas, namely: Kontagora, Mariga and Mashegu
local government. Kontagora education zone is located in one of the three geo-political
zones (Senatorial District) of the state known as zone ‘C’. Kontagora education zone was
chosen in order ensure maximum supervision by the researcher, this is because research
assistants were used during the conduct of the experimentation.
Population of the Study
The population of this study comprises all senior secondary two (SS 2) students (both
males and females) in Kontagora education zone, Niger State. The population includes all
the twelve (12) senior secondary schools in the zone comprising of eight hundred and thirty
seven (837) male and four hundred and sixty-eight (468) female making a total number of
one thousand, three hundred and five (1305) senior secondary two (SS 2) students.
Sample and Sampling Techniques
The sample of this study comprised of Kontagora Education zone which was
ramdomly drawn from the three (3) existing education zones in the geo-political zone
(Senatorial District). The sample also comprised of two (2) senior secondary schools and
four (4) intact classes. This implies that two intact classes were selected from each of the
two (2) randomly drawn schools in the zone. Therefore, the sample of this study comprised
of two hundred (200) SS 2 students ( males and females).
The researcher adopted a multi-stage sampling technique. In the first place simple
random sampling technique was used to draw Kontagora education zone out of the three (3)
education zones in the Senatorial District. Secondly purposive sampling method was also
used to draw the two (2) schools. The two randomly selected schools were similar in terms
of student’s gender, teachers’ qualification and stream of intact classes (two arms each).
65
These intact classes from each randomly selected school were assigned to experimental and
control groups respectively. The two randomly selected schools are government secondary
school Kontagora and Model Secondary School Kontagora.
Instruments for Data Collection
Instruments that were used for this study are made up of:
Mathematic Achievement Test on Indices and Logarithms (MATIL) which include pre-
MATIL and Post-MATIL and Mathematics Interest Inventory on Indices and Logarithms
(MIIIL) developed by the researcher.
MATIL was used as achievement test to measure students’ achievement in indices and
logarithms. This instrument consisted of twenty-four (24) multiple choice items with five
(5) options. These items were selected from the contents of indices and logarithms.
The items in the instrument were constructed in accordance with SS 2 mathematics
curriculum. The blue print was subdivided into content dimension and ability process
dimension of the test items. Content dimension will contain units to be taught in the study
while the ability process dimension will consists of Lower Cognitive Domain (LCD) and
Higher Cognitive Domain (HCD). These were contained in both the Pre-MATIL and Post-
MATIL as shown in the appendix B & C.
Mathematics Interest Inventory on Indices and Logarithms (MIIIL) was used to assess
students’ interest in indices and logarithms. The interest inventory consisted of twenty-five
(25) items. Each item was rated on a 4-point scale with the following response type: -
Strongly Agree (SA); Agree (A); Disagree (D) and Strongly Disagree (SD). Some items
were positively cued while others negatively cued with different scores respectively. (See
appendix D).
66
Validation of Instruments
The instruments were taken to the project supervisor and two experts, (one from
measurement and evaluation and the other from mathematics education) in the Science
Education Department Faculty of Education, University of Nigeria Nsukka for validation.
The Mathematics Achievement Test on Indices and logarithms (MATIL) were subjected to
both face and content validation. The test blue print and the items in Mathematics Interest
Inventory on Indices and Logarithms (MIIIL) were all face validated. In addition the items
in the Mathematics Achievement Test on Indices and Logarithms (MATIL) were subjected
to content validation. The content validation of MATIL was done with strict adherence to
the test blue print so as to ensure that the test items reflected all details on the test blue print.
The validation experts were requested to:
(a) Scrutinize the test items for suitability and clarity.
(b) Add any other items(s) which is/are relevant but was not included in the instrument.
(c) Remove irrelevant or ambiguous statements in order to improve the strength and the
structure of the items.
In deed one test item was removed in MATIL reducing the number of test items to
twenty-four (24). This to ensure each topic was equally represented. In the case of MIIIL all
the twenty-five questionnaire items survived with very little modification based on the
comments and suggestions of these experts. The table of specification (blue print) was
prepared by the researcher and this serves as guide in the construction of MATIL. The table
of specification for MATIL.is shown in appendix M
Trial Testing
A trial testing of the research instruments (Mathematics Achievement Test on
Indices and Logarithms (MATIL) and Mathematics Interest Inventory on Indices and
Logarithms (MIIIL) was conducted using forty-five (45) SS 2 students from Government
67
Secondary School (G. S. S.) Sahon-Rami a school in a different local government but within
the same Education zone (Kontagora). This school was not among the selected schools for
the study. The trial testing was done after the instruments were validated in 2007. The
pretest (PRE-MATIL) and the (MIIIL) was first administered to the sample (45 SS 2
students) and the answered scripts and the completed questionnaires were collected. The
scripts were marked over 24 while the questionnaires based on a 4 points Likert scale see
appendix H.
Reliability of the Instrument
The reliability coefficients of the instruments (MATIL and MIIIL) were determined
and computed using the scores of the students obtained after the trial testing. These are
shown as follows:
The data collected from the trial testing were used to ascertain the temporal stability and
internal consistency of the MATIL and as well the internal consistency of the MIIIL. The
temporal stability of MATIL was determined using the test retest approach, while the
internal consistency of the same instrument was determined using Kuder-Richardson
formula 20 (K-R 20). Ezeh, (2005) suggested the use of test retest approach in determining
temporal stability and Kudder-Richardson formula 20 for determining the internal
consistency of tests that are scored dichotomously. In the place MIIIL, internal consistency
was determined using Cronbach Alpha (α). According to Ezeh (2005) the best method for
determining the reliability coefficient of an instrument having non-dichotomous items is
through Cronbach Alpha method.
The test instrument (MATIL) was administered twice to the subject at the interval of
three (3) weeks. The scores obtained were later subjected to Pearson product moment
correlation coefficient, where the coefficient value of 0.65 was obtained. (See appendix I)
68
for the details. Kudder-Richardson (K-R 20) was used to determine the internal consist
reliability. The coefficient value of 0.63 was obtained (see Appendix J). Similarly the
internal consistency of the MIIIL was determined, using Cronbach Alpha (α). The reliability
coefficient of 0.83 was obtained (see Appendix K).
Experimental Procedure
Since the study involves a natural setting, the conduct of the study took place during
normal school periods, using normal school time-table. The first thing done was to
administer a pre-test. This involved the administration of both MATIL and MIIIL before the
commencement of the days’ lessons. There after the research assistants (regular
mathematics class teachers) used the prepared lesson plan and the model.
The researcher had prepared two sets of lesson plans for teaching the topics set out for
the study. The plans were prepared in accordance with the test blue print. The first set of the
lesson plans was for the control group. It contained fifteen (15) lesson plans which lasted for
three (3) weeks. The other set of the lesson plans were for the experimental group. It was
prepared in such a way to address the theme of this study (ASIM). In addition to the lesson
plans for the experimental group, the researcher also designed a model known as assessment
supported instructional model (ASIM) which was used for the experimental group. The
model and the two sets of lesson plans are seen in appendix A, E and F respectively.
To avoid deviation on the part of the research assistants from the prepared lesson
procedure, the researcher from time to time do visits the schools during the processes of the
experiment. At the end of three (3) weeks the teachers were given the MATIL and the
MIIIL to administer the post-test of both instruments. This was to enable the researcher
evaluate the effectiveness of the model. The MATIL consists of twenty-four (24) items as
such the scripts were first marked based on 24 marks and later converted to hundred percent
69
for better and easier computation of the mean and standard deviation. While the MIIIL was
scored on a 4-point scale. The data was collected and used for further analysis.
Control of Extraneous Variables
The following steps were taken by the researcher to minimize the influence of some
extraneous variables on the study.
(a) Initial group difference: The researcher ensured that any school with ability
streaming of students such as gifted school was not used for the study. Also Analysis
of Covariance (ANCOVA) was used to check the issue of initial group difference.
(b) Teacher Variable: In order to control teacher variable the following were done:
(i) The researcher ensured that the two (2) teachers that were used as research assistants
from the randomly drawn schools were mathematics educators of the same or
equivalent qualifications and working experience.
(ii) The research assistants (regular teachers) were given uniform training by the
researcher on the use of the model for both experimental and control group.
(iii) Lesson plans prepared by the researcher were made available to the participating
teachers to reduce teachers’ effort on the lesson preparation.
(iv) The researcher was the custodian of all the test instruments until their needs arises.
(c) Pre-test Sensitization: In order to minimize pre-test sensitization the following
were done:
(i) Since the same MATIL items used for pre-testing and post-testing, the researcher
restructured or reshuffled the numbering of the test items in the post-test.
(ii) The researcher withdrew all the instrument items (MATIL and MIIIL) from the
students and the research assistants after first encounter.
70
(iii) The time between the pre-testing and the post-testing was not less than three (3)
weeks.
(d) Subjective Interaction: To minimize this variable the research assistants were
instructed to give no assignments and or notes to the students. This will be to avoid
exchange of ideas outside the classrooms.
(e) Hawthorne Effect: This is a situation whereby the performance of research subjects
is affected due to the fact that the subjects are conscious of the facts that they are
involved in an experiment. In order to reduce this problem, the researcher used the
normal classroom teachers in the schools normal setting using the school normal
lectures’ time-table.
Method of Data Collection
The research assistants who were the normal mathematics class teachers
administered the PRE-MATIL and the PRE-MIIIL before the commencement of the
teaching. The PRE-MATIL papers and PRE-MIIIL papers were collected and given to the
researcher to do the marking and the results were kept. Three (3) weeks after the real
classroom teaching using the two methods the students were tested again with the same
instrument which was restructured numerically and the scripts were collected by the
researcher for marking and recording. The results were tabulated for analysis.
Method of Data Analysis
The data collected for this study were analyzed as follows: Mean and standard
deviation were used to answer all the researcher questions raised. Null hypotheses
formulated for this study were tested using analysis of covariance (ANCOVA) at p< 0.05
level of significance using pre-test as covariate.
71
CHAPTER FOUR
RESULTS
In this chapter, the results of this study were presented in the following order:
1. Answering the research questions raised
2. Testing the null hypotheses formulated to guide the study
Answering Research Questions
Research Question One
What are the differences in the mean achievement scores as measured by
mathematics Achievement Test on Indices and Logarithm (MATIL) between students
taught using Assessment supported Instructional Model (ASM) and students taught with the
conventional method?
This research question was answered by computing the mean and the standard
deviation of the experimental and control respondents in the pretest and post-test. The
results are shown in table 1 below.
Table One: Mean Achievement scores and Standard Deviation of Experimental and Control groups in pretest and posttest (MATIL)
Group Type of test N Mean Std. Dev. Mean Diff. Experimental Pretest
Posttest 100 100
37.8100 63.6800
1.22801 6.76103
26.0500
Control Pretest Posttest
100 100
39.1100 39.8300
1.17567 9.76704
0.7200
Total Pretest Posttest
200 200
38.4500 51.7550
1.20087 1.43837
13.3050
From table one above the mean for pretest (MATIL) for the experimental group is 37.8100
with standard deviation of 1.22801, while those of the control group are 39.1100 with
standard deviation of 1.17567. This implies that at the commencement of this study, the
subjects were at the same level in the knowledge of indices and logarithms.
55
72
However, in the post-test (MATIL) as seen in table one the mean scores for
experimental group is 63.6800 with a standard deviation of 5.76103, while that of the
control group is 39.8300 with standard deviation of 9.76704. The mean scores of students
taught using ASIM (experimental group) is 63.6800 which is higher than those taught
using conventional method (control group) which is 39.8300. This shows that the use of
assessment supported instructional model have more impact on students’ achievement
positively more than their counterparts.
Research Question Two
What is the mean mathematics achievement scores of high and low ability students taught
mathematics using the ASIM? The above question was answered using mean and standard
deviation scores. These scores are calculated for the high and low ability groups in both
experimental and control groups. The results are presented in Table 2 below.
Table Two Mean Achievement scores and standard deviation of both High and Low ability groups of the experimental group. Group Type of
test Ability Group
N Mean Std. Dev.
Mean Diff.
Experimental Pretest Posttest
High Low Total
50 50 100
47.9400 27.6800 37.8100
5.04029 8.35791 1.22801
20.2600
High Low Total
50 50 100
67.0800 60.2800 63.6800
4.28495 5.01036 5.76103
6.800
Table two above shows that in the experimental group, the pretest mean scores of the high
ability group is 47.9400 as against 27.6800 for the low ability groups. Whereas the table
shows that in the posttest, the high ability and low ability students recorded means scores of
67.0800 and 60.2800 respectively in the experimental group. This shows that high ability
group performs better than the low ability group. With the results obtained above, it can be
observed that the low ability groups have performed wonderfully well in the posttest. This
73
implies that ASIM is highly effective in enhancing performance of both ability groups (high
and low). With difference in favour of the high ability students.
Research Question Three:
What are the differences in the mean interest scores as measured by mathematics interest
inventory on indices and logarithms (MIIIL) between students taught using Assessment
supported Instructional Model (ASIM) and students taught with conventional method?
This research question three was answered by calculating the mean and standard
deviation scores of the experimental and control groups in the pre-interest and post-interest
inventory on mathematics. The results are presented in table 3 below:-
Table Three:
Mean scores and standard Deviation of Experimental and Control groups in pre and post mathematics interest Inventory on Indices and Logarithms (MIIL).
Group Type of test N Mean Std. Dev. Mean Diff. Experimental Pre-interest
Post-interest 100 100
47.1400 71.4500
2.97471 4.48201
24.31
Control Pre-interest Post-interest
100 100
46.5900 49.5600
3.36379 3.07916
2.97
Total Pre-interest Post-interest
200 200
46.8650 60.5050
3.17920 11.62349
13.64
From table 3 above it is observed that the mean scores in the pre-mathematics interest
Inventory on Indices and Logarithms for experimental and control groups are 47.1400 and
46.5900 respectively. This indicates that at the commencement of this study the subjects of
this study were at the same level of interest in indices and logarithms. The table further
shows that the mean scores in the post-mathematics Interest Inventory on Indices and
Logarithms for the experimental group is 71.4500 while the control group counterparts
recorded a mean score of 49.5600. This shows that students taught using ASIM have
higher mean score in interest than those in the control group.
74
Research Question Four:
What is the mean mathematics Interest scores of high and low ability students taught
mathematics using the ASIM?
This research question four was answered by computing the mean and standard
deviation scores for high and low ability in experimental and control groups. The results are
presented in table four below.
Table Four: Mean Interest scores and Standard Deviation of both High and Low ability groups for Experimental in the PreMIIIL and PostMIIIL. Group Type of test Ability Group N Mean Std. Dev. Mean Diff. Experimental Pre-interest
Post-interest
High Low Total
50 50 100
47.6000 46.6800 47.1400
2.15710 3.57680 4.48201
0.9200
High Low Total
50 50 100
73.9600 68.9400 71.4500
4.16477 3.22243 4.48201
5.02
From table four above the mean interest scores in the Pre-MIIIL for high and low ability
groups are 47.6000 and 46.6800 respectively for the experimental group. This is a clear
indication that the subjects for this study have the same level of interest in indices and
logarithms before the commencement of this study.
Furthermore, it is observed from the same table (table four) above that the mean
interest scores of the post-MIIIL for the high ability group is 73.9600 and for the low ability
group is 68.9400 for the experimental group. Based on the mean interest scores of the post-
MIIIL for the high and low ability students, it can be concluded that ASIM appear to have
positive effect on both the high and low ability students. This is because the two ability
groups have recorded above average. Although the high ability performed better than the
low ability groups.
75
Testing Hypotheses:
Null Hypothesis One
Ho1: There is no significant difference in the mean achievement scores of students taught
using Assessment supported Instructional Model (ASIM) and those taught with
conventional methods. (P<0.05)
This research Null Hypothesis one was tested using two-way analysis of covariance
(ANCOVA). The results are shown in table five below.
Table Five: Analysis of Covariance (ANCOVA) Result on Students Post-test in MATIL
Source of variation Sum of squares
DF Mean squares
F Sig. Decision at P < 0.05
Corrected Model 37485.977 4 9371.494 495.911 .000 S Intercept 9361.116 1 9361.116 495.362 .000 S Pre-test 1213.962 1 1213.962 64.239 .000 S Instructions 29290.427 1 29290.427 1.550 .000 S Ability 386.298 1 386.298 20.442 .000 S Instruction*Ability 1285.137 1 1285.137 68.006 .000 S Error 3685.018 195 18.898 Total 576887.000 200 Corrected Total 41170.995 199
For the null hypothesis one, table five revealed that the observed difference
between the mean scores of the experimental and control groups is significant at 0.05 level
for this study. This shows that there is a significant difference between those taught using
Assessment supported Instructional Model (ASIM) and those taught using conventional
approach in favour of the ASIM. Therefore the null hypothesis is rejected at p<0.05.
Null Hypothesis Two:
Ho2: There is no significant difference in the mean achievement scores of students of high
and low ability groups as measured by MATIL.
Research null hypothesis two was tested using two-way analysis of covariance
(ANOVA). Table six contains the result.
76
77
Table Six: Analysis of Covariance (ANCOVA) Result on High and Low Ability Students Post-test in MATIL for Experimental group.
Source of variation Sum of Squares Df
Mean Square F Sig.
Decision at P < 0.05
Corrected Model 1378.832a 2 689.416 37.579 .000 S Intercept 9273.990 1 9273.990 505.514 .000 S Pretest 289.832 1 289.832 15.798 .000 S Ability 18.815 1 18.815 1.026 .314 NS Error 1779.528 97 18.346 Total 407400.000 100 Corrected Total 3158.360 99
In table six above, it was observed that there exist no significant difference in the
mean achievement between students of high and low ability when taught using ASIM. This
is because ability group is shown in the table to be not significant at p<0.05 as stipulated for
the study. Hence the observed difference between the mean achievement scores of high and
low ability students may be as a result of sampling error. Therefore the null hypothesis two
is thereby not rejected at P<0.05 level. This implies that as a result of the ASIM, the high
and low ability students performed significantly very well at the end.
Null Hypothesis Three:
Ho3: There is no significant interaction effect between the instructions and the ability
groups on students’ achievement as measured by MATIL.
This null hypothesis three was tested using two-way analysis of covariance
(ANCOVA). The results are presented in table five above. For null hypothesis three, table
five shows that there is significant interaction effect between the instructions and the
students ability groups. In other words, it is observed that the interaction effect of ability
groups has significant difference on students’ achievement in indices and logarithms when
taught using ASIM. This is because instructions and ability group(Instructions*Ability) is
shown in the table to be significant at P<0.05 stipulated for the study. Hence the null
78
hypothesis of no significant interaction effect between the instruction and ability group is
therefore rejected at P<0.05 level.
Null Hypothesis Four:
Ho4: There is significant difference in the mean interest scores of students taught using
Assessment Supported Instructional Model (ASIM) and those taught with
conventional method as measured by mathematics Interest Inventory on Indices and
Logarithms (MIIIL).
The null hypothesis four was tested using a two-way analysis of covariance (ANCOVA).
The results are presented in table six below:
Table Seven: Analysis of Covariance (ANCOVA) Result on Students Post-test in Post-MIIIL
Source of variation Sum of squares DF Mean squares
F Sig. Decision at P < 0.05
Corrected Model 24766.211 4 6191.553 569.564 .000 S Intercept 2074.337 1 2074.337 190.819 .000 S Pre-interest 131.356 1 131.356 12.084 .001 S Instructions 23466.269 1 23466.269 2.159 .000 S Ability 429.213 1 429.213 39.484 .000 S Instruction*Ability 166.022 1 166.022 15.272 .000 S Error 2119.784 195 10.871 Total 759057.000 200 Corrected Total 26885.995 199
For the null hypothesis four, table seven above revealed that the observed difference
between the mean interest scores of the experimental and the control groups is significant at
0.05 level (P<0.05) for this study. This indicates that there is a statistical significant
difference in interest between students taught using Assessment Supported Instructional
Model (ASIM) and those taught using conventional approach. This is in favour of ASIM.
Therefore, the null hypothesis is rejected at P<0.05.
79
Null Hypothesis Five
Ho5: There is no significant difference in the mean interest scores of students of high and
low ability groups as measured by mathematics Interest Inventory on Indices and
Logarithms (MIIIL).
Table Eight: Analysis of Covariance (ANCOVA) Result on High and Low Ability Students Post-test in Post-MIIIL for Experimental group.
Source of variation Sum of Squares df Mean Square F Sig.
Decision at P < 0.05
Corrected Model 635.364a 2 317.682 22.734 .000 S Intercept 1907.038 1 1907.038 136.471 .000 S PreInt .324 1 .324 .023 .879 S Ability 615.305 1 615.305 44.032 .000 S Error 1355.476 97 13.974 Total 512644.000 100 Corrected Total 1990.840 99
The research null hypothesis five was tested using two-way analysis of covariance
(ANCOVA) at P<0.05. The results are shown in table eight above. The table above
revealed that there exist statistical significant difference between the mean interest scores of
the high and low ability group in indices and logarithms. Therefore the null hypothesis of
no significant difference in the mean interest scores of students of high and low ability
group is rejected at P<0.05 level. This implies that ASIM has influenced the interest rate of
the high and low ability groups. Hence, this confirms that there is significant different in
the mean interest scores of high and low student and this difference is real.
Null Hypothesis Six
Ho6: There is no significant interaction effect between the instructions and ability groups
as regards to students’ interest as measured by MIIIL.
80
The null hypothesis above was tested using two-way analysis of covariance
(ANCOVA). The results are shown above in table seven
This table also revealed that interaction exist between the instructions and the ability
groups(Instructions*Ability)in students mean interest scores and that this interaction effect
is significant at P < 0.05. In other words it is observed from table seven that the interaction
effect of the ability groups has significant difference on students’ interest as measured by
MIIIL. This is because the table clearly shows instruction and ability groups to be
significant at P<0.05 stipulated for the study. It therefore implies that the null hypothesis of
no significant interaction effect between the instructions and the ability groups as regards to
students interest as measured by MIIIL is rejected at P<0.05.
Summary of Finding:
Based on the analysis of the result presented in this chapter, the following major
findings were made:
1. There was significant difference in the mean achievement scores for students in
the experimental group and their control group counterparts in indices and
logarithms as measured by MATIL.
2. There was no significant difference in the mean achievement scores of students
of high and low ability groups as measured by MATIL. The students of the low
ability group significantly score as high as their group counterparts.
3. There was significant interaction between instructions and ability groups in
students mean achievement scores in indices and logarithms. This implies that if
ASIM is used in teaching indices and logarithms to students of high ability
group, their performance will be enhanced and more students will excel in
examination
81
4. There was a significant difference in the mean interest scores of students in the
experimental group and their control group counterparts in indices and
logarithms. The experimental group had higher mean interest scores than their
control group counterparts. The difference is statistically significant.
5. There was significant difference in the mean interest scores of students of high
ability and low ability groups. In experimental group, the mean interest scores of
the high ability group is greater than their low ability group counterparts.
6. interaction effect between instructions and ability groups on students mean
interest scores was significant statistically in indices and logarithms. There
existed significant relationship between ability groups and ASIM.
This chapter discussed the results, implications, limitations, recommendations
suggestions for further studies and summary of the study.
Discussion of Findings
The findings of this study revealed that Assessment Supported Instruction Model
(ASIM) had significant effect on students’ achievement in indices and logarithms. The
experimental group had higher mean achievement score (63. 6800). This indicated that
ASIM affected students’ achievement more positively than the conventional method. This
implies that the use of ASIM was more positive and effective in enhancing and facilitating
students’ achievement in indices and logarithms than the use of the conventional method.
The finding of this study is in agreement with the work of Harlem (2003) on
enhancing inquiry through formative assessment, which revealed that formative assessment
during teaching enhance better achievement in sciences. Also the result of this study is in
line with the study conducted by Butter (1988) which showed after the post-test
performance indicated that scores on the tasks increased most significantly among the three
sets of students.
The result of this study is in total support of the work of White and Frederiksen
(1998), where the experimental groups that engaged in the formative assessment process
performed better. Even the lower ability students in the experimental group showed the
greatest improvement in performance when compared to their counterparts in the control
group.
65
83
Looking at the difference in achievement of the subjects in the topics with the mean
scores of the experimental groups higher than those of the control group, this could be
attributed to the constant assessment given to the experimental group. It is not surprising
because the anxiety of test writing has been reduced if not completely eliminated on the part
of the experimental groups. The assessment process leads the students to develop self-
confidence, self-esteem and enthusiasm in solving problems in indices and logarithms
which might have resulted from the fact that the students get assess to the results of the
assessment.
The result of the use of Assessment supported Instructional Model which brings about a
tremendous improvement in the achievement of the experiment group has supported Skinner
(1954) which states that “The whole process of becoming competent in any field must be
divided into a very large number of very small steps, and reinforcement must be contingent
upon the accomplishment of each step …”
The study revealed that students of the high ability group obtained mean achievement
scores of 67.0800 which is greater than those in the low ability group which is 60.2800. it
was observed also that students of high ability group recorded higher mean interest scores of
73.9600 which is greater than those in the low ability group (68.9400). This implies that the
use of assessment supported Instructional model in teaching indices and logarithms
enhanced achievement and interest among the ability groups.
The analysed result also revealed that interaction effect between instruction and
ability group (Instruction * Ability) was significant, in both the achievement and interest
level of the student. This implies that the use of assessment-supported instructional model
is effective and efficient in facilitating and fostering achievement and interest in students in
indices and logarithms.
84
Conclusion
The findings of this study served the bases for forwarding the following conclusion:
1. Use of assessment supported instructional model (ASIM) affected students’
achievement positively more than the use of conventional in the teaching indices and
logarithms.
2. Assessment-Supported Instructional Model (ASIM) has showed significant
differential achievement among the high and the low ability group. The high ability
students score higher than the low ability students. Also there was significant
differential achievement among the low ability group from the experimental and the
control groups.
3. There was significant interaction between instructions (methods) and ability group
(Instruction * Ability) on students achievement in indices and logarithms. Hence
ASIM is more effective in fostering achievement among high and low ability
students than the conventional method.
4. The Assessment Supported Instructional Model (ASIM) was more, effective in
stimulating and sustaining students’ interest in indices and logarithms than the
conventional method. The difference between their mean interest was statistically
significant and in favour of the experimental groups.
5. Assessment Supported Instructional Model (ASIM) was relatively more efficacious
in enhancing the interest of the high ability students. The observed difference in the
mean interest scores was highly significant statistically.
6. There was significant interaction between Instructions (method) and ability group
(Instruction * ability) on students’ interest in indices and logarithms. Hence, this
approach was more effective in fostering interest in high and low ability students
than the conventional approach.
85
Implication of the Study
The findings of this study have some implications for the curriculum planners, the
teacher educators, the teacher and the learner.
The findings of this study call on the curriculum planners to bear in mind the role of
classroom assessment as it affects teaching and learning process to include within the
existing subjects content of the curriculum the strategies that will enhance integrating
assessment into classroom instruction. This they do by re-examining the existing units of
the subject matter taught in schools by identifying their societal needs and instructional
elements. This will not only make indices and logarithms more enjoyable to teach but will
make virtually all mathematics topics more interesting to learn leading to greater
achievement, and meaningful to learners and the general public.
The findings of this study calls on teacher educators to intensify the knowledge of
assessment to the teachers to be. This they do by encouraging student teachers to adopt
assessment supported instructional model during their teaching practice exercise. Also in
the micro-teaching the students should be taught how to use the model. This will make the
teachers to develop the spirit of continuous assessment effectively because it will enhance
achievement and sustenance of interest on the part of the learners.
The finding of this study calls on the mathematics teachers to adopt assessment
supported instructional model as a strategy in their teaching. Like students, teachers are
affected by the nature of the assessment they give their students. Just as students learn
depending on the assessment, teachers tend to teach to the test. A goal of high-quality
assessments is that they will lead to better information and decision making about students.
In the findings of this study, it is understood that the students learn and study in a
way that is consistent with the assessment task. Assessment Supported Instructional Model
86
(ASIM) also have clear implication on student motivation. Student motivation is best
conceptualized in the context of student learning more especially as it is a process whereby
goal-directed activity is instigated. Motivation also increases when the assessment tasks are
relevant tot eh students’ backgrounds and goals, challenging to give students individualized
feedback about their performance. Authentic assessment provides more active learning
which increases motivation. Hence giving students multiple assessments rather than a
single assessment lessens fear and anxiety. Finally, the student teacher relationship is
influenced by nature of assessment. When teachers construct assessment carefully and
provide feedback to learners, the relationship is strengthened.
Recommendations
Based on the findings of this study, the researcher made the following recommendations.
i. Assessment supported instructional model should be adopted in our school system.
The use of ASIM will result into making mathematics less difficult motivating and
interesting to learners and challenge the learners intellect. It usage will reduce the
fear students have and hatred for mathematics and as well reduce examination
anxiety and examination malpractices among students. The model is assessment
oriented, Hence it will not only improve performance and sustain interest in
students of mathematics but it will serve as a veritable tool for instruction decision
making by the teacher. This is because the model is organized in such a way that
the teacher will not only use the result of the assessment in grading the students
but use the results to determine the strength and or weakness of his/her instruction.
ii. Assessment Supported Instructional Model (ASIM) should be made available and
accessible to all science teachers in general and mathematics teachers in particular.
They should be trained on how to use the model. The training could be done
through various avenue such as organizing workshops, seminars, conferences, in-
87
service training and re-fresher courses. Doing this will provide teaches will
necessary tool for revitalizing the teaching of mathematics which will in return
stimulate and sustain students’ interest in learning indices and logarithms in
particular and mathematics in general resulting into higher mathematics
achievement.
iii. Since assessment supported instructional model had proven to be effective in
teaching and learning of indices and logarithms, there is the need to sensitize
teachers on its usefulness and importance. National mathematical centre Abuja
(NMC), Federal and state governments should endeavour to organize workshop on
innovation in teaching and learning and induce ASIM as one of the new
innovations. There is no doubt about assessment supported instructional model
being a new innovation with the existence of continuous assessment in our
schools, it should be noted that assessment through the model is administered
during unit lesson segment and not at the end of term or semester.
iv. With the nature students-teacher ratios in our schools today one will wonder how
ASIM will work well. At this junction the researcher recommends the involvement
of the students themselves in the assessment process. This will hasten the scoring
process and the students will get the feedback on time.
Limitation of the Study.
The limitations of this study include:-
1. There may have been some interaction among subjects since the school was used for
both experimental and control groups inspite the use of some control measures by
the researcher. This interaction may have introduced some extraneous variables
affecting the result of the study.
88
2. The research assistants used are the regular mathematics teachers who were
considered based on same qualification and experience. Other factors that could
have affected the result of the study were personality, age and classroom
environment.
3. Schools selected for the study were drawn from one education zone out of the three
education zones in the senatorial district of the state.
4. The schools selected for the study were drawn an equal number intact class.
Different result could have been obtained if the school used have more than 2 intact
classes.
5. The assignment of the experimental condition to co-education school is another
limitation. Had the researcher considered single sex schools different result could
have been obtained.
6. The length of time for the study was short. If the period for the study was longer,
the result of the study could have been different.
7. The same instruments used for pre-test and post were restructured (number wise). If
not the result could have been affected.
Suggestion for further Research
Based on the findings and limitations of this study the following topics are suggested
for further research.
a. Replication of same study can: (i) be done in other education zones within or outside
the state (ii) be carried out among junior secondary school students and (iii) be
undertaken over a longer period time.
b. Parallel studies could be carried out which would include other topics in
mathematics. For instance, geometry, statistics word problems and number and
numeration.
89
c. Effects of Assessment supported instructional model (ASIM) on students’
achievement, retention and interest in mathematics.
d. Effects of assessment Supported Instructional Model in some topics in Biology,
Chemistry or Physics.
Summary of the Study
As the name of this study imply it was carried out to investigate the effect of an
assessment Supported Instructional Model (ASIM) on students academic achievement and
interest in secondary school (SS 2) in indices and logarithms. The study employed a non-
equivalent control group (Quasi-experimental) design. A sample of two hundred (200) SS 2
students drawn from two (2) Senior Secondary Schools within Kontagora Education Zone
of Nigeria State were used. \the two randomly selected schools were co-educational and
have two (2) arms of SS2 intact class each. Therefore four (4) intact classes were used for
the study. Two (2) intact classes were assigned to the experimental group while remaining
two (2) intact classes were assigned to control group.
The experimental group was taught indices and logarithms using Assessment
Supported Instructional Model (ASIM) while convention method was used to teach the
control group. Research assistants who were the regular mathematics teachers were trained
by the researcher to do the teaching and administration of the two research constructed
instruments to the students. The instruments were validates by experts of mathematics
education and measurement and evaluation and their reliability coefficients calculated.
The four (4) research questions and six (6) null hypotheses were tested using mean,
standard deviation and analysis of covariance (ANCOVA) at P < 0.05 respectively. (ASIM)
is more effective than the conventional method in fostering achievement and facilitating
interest in students in indices and logarithms. That the use of ASIM showed significant
difference on achievement and interest of students of high and low ability groups, with the
90
high ability group performing more significantly than their counterparts in both achievement
and interest. It was observed that the interaction between instructions and ability groups
(Instruction x ability) in both achievement and interest were significant. Finally, the
researcher recommended that assessment supported instructional model (ASIM) should be
adopted our school system in teaching all the science subjects. Also as part of the
recommendation, teachers should be trained on how to the model through workshops etc.
The researcher suggested that replication of the study should be carried on in other places
and in other disciplines.
91
REFERENCES
Agwagah, U.N.V. (1993). Instruction in Mathematics Reading as a factor in students’ achievement and interest in world problem solving. Unpublished Ph.D. Thesis University of Nigeria Nsukka.
Agwagah, U.N.V (2001). The teaching of Number bases in junior secondary schools
Mathematics. The use of the base board. ABACUS. The Journal of Mathematical Association of Nigeria (Mathematics Education series) 26(1) 1-7.
Agwagah, U.N.V. (2004). Sustaining Development in Secondary school Mathematics
through constructivist framework: A model lesson plan. Journal of the Mathematical Association of Nigeria (ABACUS).
Aiken, L.R. (1985) Psychology Testing and Assessment (4th ed) University of specific
Aiiyn and Bason Inc. Boston. Ajidagba, U.A. (2001). The use of continuous assessment. In I.O. Abimbola (Eds).
Fundamental Principles and Practice of Instruction: A book of reading (403–410). Ilorin: Belodan (Nig) Enterprises.
Akano, B.U. (1999) Development and preliminary validation of physics interest
inventory. Unpublished M ed these, Faculty of Education University of Nigeria Nsukka.
Ale, S.O (2000). An Address of Welcome for Workshop at National Mathematics Centre
Abuja 2nd – 5th Oct. Ali, A. (1986). Nigerian Scientists and Science teachers educator perception of the
processes and products of science. Journal of Science teachers Association of Nigeria 24(1 & 2) 134 – 142.
Alio, B.C. (2000). The effect of Polya’s language technique in teaching problem solving
in mathematics as secondary school students interest. Annual conference proceeding of mathematics of Nigeria. 15-40 Sept.
Allington, R.L (1991). Children who find learning to read difficult: School responses to
diversity. In E.H, Hiebert (Ed.), Literacy for a diverse society: Perspectives, practices, and policies (pp.237-252). New York: Teachers College Press. Retrieved on 16th June 2010 from http://www.sciencedirec.com/science?.ob=articleURL&-udi=B6V9B
Amazigo, J.C. (2000). Mathematics Phobia: Diagnosis and prescription. First annual
lecture, National Mathematical; centre Abuja, Nigeria. July. Anikweze, C.M (2005). Measurement and Evaluation for Teacher Education. Enugu:
Snaap Press Limited. Aremu, O. D. (2006) A Simplified Approach to Learning Process. Kaduna: Joe Achas Press
92
Badru, A.K. (2004). Students’ performance in Mathematics as correlates of their performances on other Basic science subject. In conference proceeding of the 45th Annual Conference of STAN held at Asaba. Pgs. 188-191.
Bell, B. & Cowie, B. (2001). Formative Assessment and Science Education. Dordrecht.
Netherlands: Kluwer Academic Publishers. Betiku, O.F. (2002). Cognitive Style and Mathematical attainment of SS II Students in
Lagos State. The Nigerian Teacher Today, A Journal of Teacher Education. 10(1) 37-52.
Black, P. & William, D. (1998). Assessment and Classroom Learning. Assessment in
Education 5(1) 7–74. Retrieved on June 18 2006 from http://www7.nationalacademics.org/base/furtak-commissioned-paper.pdf.
Bloom, B.S. (Ed.). (1956). Taxonomy of educational objectives. The classification of educational goals. New York: David McKay Company. Retrieved on 16th June 2010 from http://www.sciencedirec.com/science?.ob=articleURL&-udi=B6V9B
Bodmus, G.A. (2002). Interest and attitudes as correlated of mathematics achievement of
secondary school students. Unpublished paper. Faculty of Education, University of Benin.
Brookhart, S.M. (2001) Successful students’ formative and summative uses of
assessment information. Assessment in Education, 8(2), 153 – 169. Butter, R. (1998). Enhancing and understanding intrinsic motivation; the effects of task-
involving and ego-involving evaluation on interest and performance, British Journal of Educational Psychology 58. 1–14. Retrieved on June 18 2006 from http://www7.nationcademics.org/base/furtak-commissioned-paper.pdf.
Ltd. Cohern, W.W. (1996). Constructivist and non-western science Education Research.
Journal of Science Education. 4(3) 287-301. Danmole, B.T. (2001). Alternative assessment techniques. In I.O. Abimbola (Eds).
Fundamental Principles and Practice of Instruction: A book of reading (355 – 388). Ilorin: Belodan [Nig] Enterprises
Daramola, C.O. (2001). Sociological foundation of instruction. In I.O. Abimbola (Eds).
Fundamental Principles and Practice of Instruction: A book of reading (51 – 59). Ilorin: Belodan [Nig] Enterprises
Dossel, S. (1993). Mathematics anxiety. Australian Mathematics teacher, 49(1) 4-8.
Ezeh, D.N. (1992). Effects of study Questions as advance organizers on Students’ Achievement, Retention and interest in Integrated Science. Unpublished Ph.D. Thesis University of Nigeria Nsukka.
93
Ezeh, D.N. (2005). What to Write and How to Write, A step-by-step Guide to educational Research Proposal and Report. Enugu: Pearl and Gold Publishers.
Ezike, R.O. & Obodo, G.C (2004). The Teaching of mathematics in schools and colleges. Eha-Amufu.
Fajemidagba, M.O. (2001). Psychological foundation of instruction. In I.O. Abimbola (Eds.) Fundamental Principles and Practice of Instruction: A book of reading (41 – 49). Ilorin: Belodan [Nig] Enterprises.
Fakomogbon, M.A. (2001). Innovation in teaching/ learning III: Dalton plan and Keller plan. In I.O. Abimbola (Eds.) Fundamental Principles and Practice of Instruction: A book of reading (41 – 49). Ilorin: Belodan [Nig] Enterprises.
Federal Ministry of Education (EME), (1979). National Curriculum for Senior Secondary School. Lagos: Government Press.
Federal Republic of Nigeria (2004) National policy on Education. Lagos: NERDC Press.
Gagne, R.M. (1965). The conditions of learning. New York: Rinehard & Winston. Gates, A.I. & Bond, G.L. (1936). Reading readiness: A study of factors determining success and failure in beginning reading. Teachers College Record, 37, 679 – 685. Retrieved on 16th June 2010 from http://www.sciencedirec.com/science?.ob=articleURL&udi=B6V9B
Gagne, R.M. (1970) Some New Views of Learning and Instruction. New York: Phi Delta Kappan.
Greeno, J.G., Collins, A.M., & Resnick, L.B.(1996). Cognition and learning. In D.C. Berliner & R.C. Calfee (Eds.), Handbook of educational psychology (pp. 15 – 46). New York: Simon & Schuster Macmillan. Retrieved on 16th June 2010 from http://www.sciencedirec.com/science?.ob=articleURL&udi=B6V9B
Gronlund, N.E. (1981) Measurement and Evaluation in Teaching. New York: Macmillan Publishing Co.
Harbor-Peters, V.F. (1990). The target task and formal method of presenting some secondary school geometry concepts. Their effect on retention._Journal of Studies in Curriculum_JOSIC 1(1) 93 – 97.
Harbor-Peters, V.F.A. (1992). Model Mathematics project and its applications to mathematics Instruction. Abacus Journal of Mathematics Association of Nigeria. 22(1) 79 – 90.
Harbor-Peters, V.F.A. (2000). Mathematics Language for the new millennium: Implication to the society. Proceedings of Annual conference of Mathematics Association of Nigeria MAN.
94
Habor-Peters, V.F.A. (2002). Generating and sustaining interest in mathematics classroom. In Animalu, A.O.E. & Harbor-Peters, V.F.A. (eds). Proceedings of the workshop for Re-training Mathematics Teachers at the University of Nigeria Secondary School Nsukka 9th – 11th, December, Enugu
Hembree, R. (1990). The nature, effects and relief of mathematics anxiety. Journal for Research in Mathematics Education. 21(1): 33-46.
Hohnessen, D.H. (1991). A manifesto for a constructivist Approach to technology in Higher education (online).
Ibraheem, A.G. & Ogunnusi, O.S. (2001). The effect of Mathematics education on science and technology in Annual Conference Proceeding of MAN Sept.
Koretz, D., Linn, R.L., Dunbar, S.B., & Shepard, L.A. (1991). The effects of high stakes testing an achievement: Preliminary findings about generalization across tests. Paper presented at the annual meeting of the American Educational Research Association, Chicago, IL. Retrieved on 16th June 2010 from http://www.sciencedirec.com/science?.ob=aeticleURL&-udiB6V9B
Kurumeh, M.S.C. (2004). Effects of Ethno-mathematics Approach to on Students’ achievement and interest in geometry and menstruation. Unpublished Ph.D. Thesis. University of Nigeria Nsukka.
Lassa, P.N. (1986). Entrepreneurship education for socio-economic and industrial
development in Nigeria. A Keynote address presented during National Conference in entrepreneurship education at FCET. Umunze. Sept (6 – 8).
Lawal, F.K. (2001). Enrolment of female students in science, Technology and Mathematics related subjects in Nigerian schools: Some Impediments. In the 42nd Annual Conference proceedings of STAN 178 – 181.
Ma, X. (1999). A meta-analysis of the relationship between anxiety toward mathematics and achievement in mathematics. Journal for Research in Mathematics Education 30(5) 520 – 540.
McMillan, J.H. (2003) Understanding and improving teachers’ classroom assessment decision making. Educational Measurement: Issues and Practice, 22(4),34 – 43.
McMillan, J.H. (2007) Classroom Assessment Principles and Practice for Effective Standards-Based Instruction. Boston: Pearson Education, Inc.
McTighe, J. & Wiggins, G.P. (2004). Understanding by Design: Professional Development Workbook. Alexandria, VA: Association for Supervision and Curriculum Development.
Mehrens, A.W. & Lehmann, I.J. (1984) Measurement and Evaluation in Education and
Psychology. New York: Halt, Fine Hart and Winto Inc. National Teachers Institute (2008) Manual for the Training of Newly Recruited Teachers in
Niger State. Kaduna: N.T.I.
95
Nworgu, B.G. (1992). Educational Measurement and Evaluation Theory and Practice Nsukka: Hallman Publishers.
Nworgu, B.G. (1997). Methods and Media in Science Instruction. A lead paper presented at the Annual Conference of the Enugu State Branch of the Association for promoting quality Education in Nigeria held at University of Nigeria Nsukka (March 10th – 14th).
Nworgu, B.G. (2003) Educational Measurement and Evaluation Theory and Practice Nsukka: Hallman publishers.
Nworgu, B.G. (2006) Educational Measurement and Evaluation Theory and Practice Nsukka: Hallman Publishers.
Obioma, G.O. (1988). Some foundations of Mathematics education. Monograph series. I, Faculty of Education, University of Nigeria Nsukka
Obodo, G.C. (1990). The different effects of three teaching models on performance of junior secondary school students in some algebraic concepts. Unpublished Ph.D. dissertation, Faculty of Education, University of Nigeria Nsukka.
Obioma, G.O (1991). Concrete models as generators of interest of learning some 3-dimensional shapes. Journal of the Science Teachers Association of Nigeria. (STAN). 27(1) 40 – 46.
Obodo, G.C. (1991). Implementation of the JS. Mathematics Curriculum in Nigeria. Problem and Remediation. Journal of Students in Education II(I) January.
Obodo, G.C. (2001). Promoting mathematical teaching and learning in school. An essential factor for UBE in Nigeria. Annual Conference proceeding of Mathematics Association of Nigeria MAN.
Obodo, G.C. (2002). Developing position attitude and interest of Mathematics students in Nigeria secondary schools. A paper presented at National Mathematics Centre Abuja during the summit workshop 4th – 6th Oct.
Obodo, G.C. (2004). Generating students’ interest in mathematics. A paper presented on the UMC/PTDF workshop for secondary school teachers from 8th – 14th Feb. At Awka, Anambra State held at Igwebuike Grammar School.
Odo, I.O., Okonkwo, A.E. & Amenaghawen, E.E. (1990). Development and Validation of Physics interest inventory. Unpublished B.Sc. Thesis. University of Nigeria Nsukka.
Odunusi, T.O. (1994). The study of the attitude of some Nigeria science students towards science and science teaching. Journal of STAN 22(2) 166 – 173.
Ogunleye, A.O. (1999). Prospect and problems in physics education in Nigerian Secondary schools 1960 – 1995.
Ogunniyi, M.B. (2000). Understanding Research in the Social Sciences. Ibadan: University Press Plc.
Ojalaye, O. (2001). Relationship between problem solving test and tests percentage intelligence. Abacus The Journal of MAN 26(1) 59 – 69.
96
Olorundare, S. (2001). Philosophical Foundation of Instruction. In I.O. Abimbola (Eds). Fundamental Principles and Practice of Instruction: A book of reading (23-40). Ilorin: Belodan (Nig.) Enterprises
Ozofor, N.M. (1993). Effects of Target task approach on SS III students achievement on conditional probability. Unpublished M.Ed. thesis, Faculty of Education University of Nigeria Nsukka.
Ozofor, M.N. (2001). Effect of two models of computer aided instruction on students’ achievement and interest in statistics and probability. Unpublished Ph.D. Thesis University of Nigeria, Nsukka.
Salau, M.O. (1995). An Analysis of students enrollment and performance in mathematics at the senior school certificate level. Journal of Studies in Curriculum 5 & 6 (1&2): 1 – 8.
Salau, M.O. (1996). A survey of the qualification of Nigerian secondary school science and mathematics. Journal of Science Teachers Association of Nigeria Teachers 1 (1 & 2) 37 – 45.
Schunk, D.H.(2004) Learning theories. An educational perspective (4th ed.). Upper Saddle River, NJ: Pearson Education Inc.
Shavelson, R.J. & The Standford Education Assessment Laboratory (SEAL) (2003). On the integration of Formative Assessment in Teaching and learning with implications of Teacher Education. Paper presented at the Biannual Meeting of the European Association for Research on earning and Instruction. Padova, Italy. Retrieved on June 18 2006 from http://www7.nationalacademics.org/base/furtak-commissioned-paper.pdf.
Shepard, L.A.. (1991a). Negative policies for dealing with diversity: When do assessment and diagnosis turn into sorting and segregation? In E.H. Hiebert (ed.), Literacy for a diverse society: Perspectives, practices, and policies. New York: Teachers College Pres. Retrieved on 16th June 2010 from http://www.sciencedirec.com/science?.ob=articleURL&-udi=B6V9B
Shulman, L.S., & Quinlan, K.M. (1996). The comparative psychology of school subjects. In D.C. Berliner & R.C. Calfee (Eds.), Handbook of educational psychology (pp. 399 – 422). New York: Simon & Schuster Macmillan. Retrieved on 16th June 2010 from http://www.sciencedirec.com/science?.ob=articleURL&-udi=B6v9B
Skinner, B.F. (1938). The behaviour of organisms: An experimental analysis. New York: Appleton-Century-Crofts. Retrieved on 16th June 2010 from http://www.sciencedirec.com/science?.ob=aeticleURL&-udi=B6V9B
Skinner, B.F. (1954). The science f learning and the art of teaching. Harvard Educational Review, 24, 86–97. Retrieved on 16th June 2010 from http://www.sciencedirec.com/science?.ob=articleURL&-udi=B6V9B
Smith, N.L. (1990). Metaphor of evaluation sources of new methods. California: Sage Inc. STAN (1992). Raising the Standard of Performance in Public Examination in Sciences,
Technology and Mathematics. STAN Position Paper No. 4, Ibadan STAN.
97
Stuart, V. (2000). Mathematics curse or Mathematics anxiety? Teaching Children Mathematics 6(5): 330-335.
Taylor, P.C. (1999, Feb) Whose interests are being served in cross-cultural science education? Paper presented at the web based NARST 99 workshop. Culture students in Science Education: Students’ indigenous culture: versus the culture of science. Retrieved on May 17 2007 from http://www.oulkedu.hk/cridal/misc/10 steculture.html.
Thijsse, L.J (2002). The Effect of a Structured Teaching method on Mathematics anxiety and achievement of Grade Eight Learners. Unpublished (M ed) Theses University of South Africa.
Thorndike, E.L. (1922). The psychology of arithmetic. New York: Macmillan. Retrieved on
16th June 2010 from http://www.sciencedirec.com/science?.ob=articleURL&-udi=B6V9B
Ukeje, B.O (1997). To achieve vision 2010 through mathematics. A paper presented at 34th annual conference of MNA Abuja Nigeria.
White, B.Y. & Federicksen, J.R. (1998) Inquiry, Modeling, and Metacognition: Making Science Accessible to All Students. Cognition and Instruction. 16(1), 113-118.
Wiggins, G.P. & McTighe, J. (2005). Understanding by Design (2nd ed). Washington, DC: Association for Supervision and Curriculum Development
Wilson, J. (1997). Philosophy and Educational Research. National Foundation for Educational Research in England and Wales (NFER).
Ziman, J. (1978). Reliable Knowledge. London Cambridge University Press.
98
APPENDIX A
An Assessment Supported-Instructional Model (ASIM).
An Assessment Supported Instructional Model (ASIM) for Mathematics Teaching. By Prof. B.G. Nworgu & Yusuf M. (2006)
Real Teaching of Topic or Units
Administration of Formative Assessment
Marking, Scoring and Analyzing the Scores
Use the Result to Determine the Instructional Objectives
Record Scores in Formative Assessment Sheet
Administration of Test for Topic Assessment
Marking, Scoring and Analyzing the Scores
Use the Result to Determine the Strength of Instruction
Record Scores in a Continuous Assessment Sheet
Pre-Teaching preparation (Planning)
2
3
4
5a
6
7
8
9a
10a
START
1
Effective
Effective
STOP 10b
Inef
fect
ive
Review your instructional Strategies
Inef
fect
ive
Completely review your instructional Strategies and ask the students.
9b
5b
Star
t the
topi
c ov
er St
art t
he u
nit o
ver
Proc
eed
to o
ther
topi
c se
gmen
ts (i
f any
)
99
DESCRIPTION OF THE STAGES OF THE MODEL (ASIM)
The model has 10 steps for a complete instruction on a single topic. This
depends on the number of segments a topic has. The steps are described as
follow:
The pre-teaching step (planning)s: This is a stage where the teacher makes
all necessary preparations towards making the teaching of the topic or the
units effective, before the assessment process. At the preparation level, the
teacher, bears the learners and the topic in mind. He then writes lesson
note/plan; select the appropriate learning strategies and instructional
materials to meet the relevant needs of the learners and the topic or its units.
Real teaching of the topics or units: At this level the classroom teacher
presents the learning experiences necessary for the acquisitions of the relevant
skills. At this point the teacher applies the appropriate learning strategies and
instructional materials to achieve the stated instructional objectives. At this
level, there is a good rapport between the teacher and the learners.
Administration of formative assessment: This is a stage where the classroom
teacher administers a formative assessment instruments to determine the
achievement of the stated instructional objectives. At this point, the teacher
uses oral questioning, a written exercise or take home assignment. For
mathematics lessons the recommended instruments should be class written
exercise and take home assignments.
At this stage the teacher marks the student’s responses to the written exercise
and takes home assignment, awards scores objectively and analyzes the data
obtained from the formative assessment instruments.
Based on the analyzed data obtained from the formative assessment
instruments, the teacher makes a guided decision about the progress of
instructions. Such decision may involve classifying the instruction as effective
or ineffective.
Step 1:
Step 2:
Step 3:
Step 4:
Step 5a:
100
For an ineffective instruction, the teacher is to review his/her instructional
strategies and the instructional materials used. Having reviewed the
instructional strategies he proceeds to step 1.
At this step, where the instruction is effective, the teacher will record all the
scores of the students more especially of the written exercise in the formative
assessment sheet. The teacher should endeavour to give the exercises equal
maximum scores. The record should be kept in case the head teacher,
supervisor or the proprietor of such school meets the teachers re-teaching the
lesson. The teacher may proceed to step 1 for the next unit if any.
Administration of test for end of topic assessment: At this point the teacher
after exhausting the entire topic segment(s) with at least 75 percent success, he
then administers a test to assess the students on the taught topic.
The teacher marks the student’s responses to test items, awards scores
objectively and analyze the data obtained from the test.
The teacher uses the analyzed data obtained from the test administered to take
a value decision on the strength of the instruction either effective or
ineffective.
If the strength of the instruction is found ineffective, the teacher then reviews
completely his instructional strategies and in addition he finds out from the
weaker students their major worries towards the learning of the just completed
topic or unit. For whatever reasons the topic should be revisited again
employing new and relevant strategies.
If the teacher finds the instruction very effective, then he/she records the result.
This is recorded in the student personal continuous assessment sheet, for
further use.
At this stage, the teacher stops after completing the process for the first topic.
The teacher now selects the next topic or its units and follows the same steps.
Step 5b:
Step 6:
Step 7:
Step 8:
Step 9a:
Step 9b:
Step 10a:
Step 10b:
101
This model has implication for Mathematics teacher in the sense that the teacher
has to be knowledgeable enough to handle simple statistics of the Student Continuous
Assessment (C.A) scores, because a subject may have as many C.A scores as the
number of topics in the subject. As the issue of 40% C.A should be handled with
carefulness, thoroughness and excellent record keeping which involves conversion to
40% at the end of the term, semester or session. The teacher should know that the future
of the students is affected by teacher’s success or failure in the discharge of his
responsibility as a role model.
102
APPENDIX B
PRE-MATHEMATICS ACHIEVEMENT TEST ON INDICES AND LOGARITHMS
(PRE- MATIL) FOR SS 2 STUDENTS
NAME: ……………………………………………………………………………………
SCHOOL: ……………………………………………………………………………………
SEX: MALE (………………………) FEMALE (………………………….)
INSTRUCTIONS: Answer All Questions
Each question is followed by five (5) options lettered A-E. Find the correct option for each
question and circled the letter against the correct option on the question paper provided.
Plane sheets would be made available.
1. Simplify 2a × 2b (LCD)
(a) 2ab, (b) 2a/b (c) 2a+b (d) 2a-b (e) 2b/a
2. Simplify 32 × (1/27)-1 (HCD)
(a) 35 (b) 34 (c) 33 (d) 32 (e) 3
3. Simplify, (x2y3)2 (LCD)
(a) x3y6, (b) x6y9 (c) x5y9 (d) x5y3 (e) (xy)8
4. Find the value of (2-2)3 (LCD)
(a) 1/64 (b) 1/32 (c) 1/16 (d) 1/8 (e) ¼
5. Evaluate 642/3 (LCD)
(a) 4 (b) 6 (c) 8 (d) 12 (e) 16
6. Simplify (16/81)1/4 (LCD)
(a) 0 (b) ½ (c) 2/3 (d) ¾ (e) 4/9
7. Solve the equation x1/4 = 2 (HCD)
(a) 2 (b) 4 (c) 6 (d) 8 (e) 16
8. Solve the equation 2x3 = 16 (HCD)
(a) 2 (b) 3 (c) 4 (d) 5 (e) 6
9. If log 374.5 = 2.5 735, identify the characteristic. (LCD)
S/ N Items SA S D SD 1 Indices is very interesting to me 2 I do not enjoy logarithms lessons 3 Logarithms is very interesting to me 4 I hate logarithms lesson because of 4 figure table 5 Indices is one of the topics I like most in mathematics 6 Logarithms is one of the topic I hate most in mathematics 7 Indices lessons are not dull and boring to me 8 I like answering questions during indices lessons 9 Solving problems in indices and logarithms is very interesting to me 10 I am less attentive during indices and logarithms lessons 11 I am excited whenever I solved logarithms problems correctly 12 At the sight of four-figure table I become uncomfortable 13 Lessons on logarithms and indices are not motivative to me 14 I complete for high scores wit other students in indices 15 I always ask questions during indices lessons 16 I hate logarithms lesson because of the way the teacher teaches 17 I am punctual to indices and logarithms lessons 18 I do not like spending time practicing logarithms 19 I always enjoy doing correction to home work on indices 20 Logarithms and indices are not important to student’s life 21 I enjoy practicing indices in school 22 I like to learn more about indices 23 Solving problems in logarithms using four-figure table is boring 24 I am happier studying indices alone 25 Learning of indices and logarithms are very useful to me
109
110
APPENDIX E
LESSON PLAN FOR EXPERIMENTAL GROUP
Name of School-------------------------------------------------------------------------------
Class: SS 2
Subject: Mathematics
Topic: Indices (First Four Laws)
Behavioural Objectives: At the end of the lesson students should be able to apply the first four laws of indices correctly to solve with ease and 75% success some indices problems.
Previous Knowledge/Entry Behaviour: Students have learnt repeated multiplication and successive division of numbers.
Introduction: The teacher introduces the lesson by asking these motivating questions based on the previous knowledge:
(i) Multiply 3 by 3 by 3 (ii) How many groups of two are the in 12? Ans. 27 Ans. 6
Presentation:
Step 1: The teacher explains the meaning of indices as the shortest way of writing repeated multiplication using the same number and writes the first four laws of indices for the students.
Step II: The teacher explains each law with specific example as follows:
Remarks: The stated objectives HAVE BEEN/HAVE NOT BEEN achieved.
LESSON TWO
Topic: Indices (Product of Indices)
Time: 40 mins.
Behavioural Objectives: At the end of the lesson students should be able to apply the principles of the “products of indices” correctly to solve with ease and 75% success some problems on indices.
Previous Knowledge/Entry Behaviour: Students were introduced to the first four laws of indices.
Introduction: The teacher introduces the lesson by asking the following motivating questions based on the previous knowledge: (1) Name any law of indices you know. (ii) The law x0 = 1: What is its limitation?
Presentation
Step 1: The teacher explains all that the products is all about using the following example: Simplify (α2)3 i.e. (α2)3 = α2 × α2 × α2 = α2+2+2 = α2×3 = α3.
Step II: The teacher leads the students through the following examples: Simplify the following:
Step III: The teacher gives the students the following as class work:
Exercise. Simplify the following:
(i) (-4b2)3 (ii) (a3b)4 (iii) -3(de3)4 (iv) (3-2)-3
112
The teacher involves the students in marking and verifies.
Evaluation/Assessment: The teacher gives the students Quiz.
QUIZ
Answer all Questions in 5 minutes.
(i) (3-2) (ii) (3n5)3 (iii) (-d5)4 (iv) 4
23
x-)(-x
Remarks: The stated objectives HAVE BEEN/HAVE NOT BEEN achieved.
LESSON THREE
Topic: Indices (Fractional Indices)
Time: 40 mins.
Behavioural Objectives: At the end of the lesson students should be able to apply the principles of “fractional indices” to correctly solve with ease and 75% success some problems on indices.
Entry Behaviour: Students have learnt how to solve problems on indices using the principles of “product of indices”.
Introduction: The teacher introduces the lesson by asking the following motivating questions based on the previous knowledge:
(i) What is the difference between (-3a2)2 and –(3a2)2
Presentation:
Step I: The teacher explains the idea of fractional indices using the following examples (i) and (ii) 3
(i) = square root of α. (ii) 3 b = cube root of b.
but × = α but 3 b × 3 b × b = b
let = αx let 3 b by
then αx xαx = × = α1 then by x by × by = b1 α2x = α1 b3y = b1
(ii) 2x = 1 and x = ½ 3y = 1 and y = 1/3
Thus = 21
Thus 3 b = 31
b
Step II: The teacher leads the students through the following examples:
Step III: The teacher now allows the students to do the following class work.
Simplify: 43
8116
(ii) 3 62 (iii) 1691 (iv) 0.04 ½ . The teacher allows students to
exchange their books and mark after 5 minutes.
Evaluation/Assessment
The teacher gives the students the following as quiz.
QUIZ
Answer all questions in 5 minutes. Simplify
(i) (26)-2/3 (ii) 1252/3 (iii) 2x1/2 × 3x-5/2 (iv) 82/3
Remarks: The stated objectives HAVE BEEN/HAVE NOT BEEN achieved.
LESSON FOUR
Topic: Indices (Decimal Indices)
Time: 40 mins.
Behavioural Objectives: At the end of the lesson students should be able to apply the principles of decimal indices correctly to solve with ease and 75% success some problems on indices.
Previous Knowledge: Students were taught indices with fractional index.
Introduction: The teacher introduces the lesson by asking the following motivating
questions based on their previous knowledge: Simplify (i) 21
41 (ii) 2 × 2-3
Presentation:
Step I: The teacher explains all that are needed in dealing with decimal indices. Such as reading the question to clarify things, converting decimals to fraction then the operation. This is done with the aid of this example:
Simplify (2.25)1.5.
Solution – change the decimals to fractions i.e. (2.25)1.5 = (2 41 )1 ½
= 833
827 2
3 49 4
9 3323
114
Step II: The teacher leads the students through the following examples:
Simplify (i) (0.25)0.5 (ii) (16/9)-25.
Solution:
(i) 1 0.5 21 4
1 41 (0.25) 2
10.5
(ii) 25525.2
43 3
4 916 9
16 916 9
16( 23
21
Step III: The teacher gives the students the following class work: Simplify the following:
(i) 160.75 (ii) (0.05)0.5. After 5 minutes the teacher involves the students in marking while he verifies the results.
Evaluation/Assessment: The teacher assess the lesson by giving students the following quiz:
QUIZ
Answer all questions in 5 Minutes.
Simplify the following
(i) (1/25)0.5 (ii) (0.27)2/3 (iii) (9/25)0.5 (iv) (27/9)0.5 Remarks: The stated objectives HAVE BEEN/HAVE NOT BEEN achieved.
LESSON FIVE
Topic: Indices (Equations in indices)
Time: 40 mins.
Behavioural Objectives: At the end of the lesson, the students should be able to solve simple equations in indices correctly with ease and 75% success.
Entry Behaviour: Students have learnt a lot about indices.
Introduction: The teacher introduces the lesson by asking the following motivating questions: Name any law of indices you know.
Presentation:
Step I: The teacher explains to the students how to solve equations that contains indices using the following example: Solve the following equations:
Remarks: The stated objectives HAVE BEEN/HAVE NOT BEEN achieved.
LESSON SIX (TEST)
Topic: Test on Indices
Time: 40 minutes
Behavioural Objectives: At the end of the Units, Students should be able to answer all the test questions on indices with ease and 75% success.
Previous Knowledge: Students were taught necessary materials on indices for one week.
Introduction: The teacher introduces the lesson by instructing the students to write their names and numbers on the provided sheets and clear away their table for the test.
Presentation
Step I: The teacher distributes to the students test question papers.
116
Step II: The teacher now reads the instructions to the students concerning the test and time to stop as written on the question papers.
Step III: The teacher commands the students to start after the necessary instructions.
Test on Indices.
Instructions: Answer all questions in 30 minutes.
1. Simplify the following (i) 22 × 23 (ii) (1/4)-2 (iii) 15 × 104 ÷ (3 × 10⁻²) (iv) 23 × (1/6)-1
2. Simplify the following (a) (3-2)2 (b) (-C3)2 (c) (x2y2)4 (d) α6/(-α)4
3. Simplify the following (a) 8-2/3 (b) 1252/3 (c) (16/81)1/4 (d) (2x)1/2 × (2x3)3/2
Conclusion: The teacher concludes by collecting all their scripts and later calls on the students to mention the difficult question so as to solve them together. Based on their performance in the end of the topic test, the teacher then decides on the success of the teaching and the learning process.
LESSON SEVEN
Topic: Logarithms (Introduction)
Time: 40 mins.
Teaching/Instructional Aids: Four Figure Tables
Behaviour Objectives: At the lesson, students should be able to (i) establish the relationships between indices and logarithms and (ii) convert some indices to logarithms correctly with ease and 75% success.
Entry Behaviour: Students have learnt a lot about indices.
Introduction: The teacher introduces the lesson by asking the following motivating questions: (i) Mention any law of indices you know (ii) When does x0 = 1 holds?
Presentation
Step I: The teacher writes some numbers and expressed them in the power 10 using the following examples: i.e.
Step II: The teacher leads students to mention some numbers other than 10 that can be expressed in powers e.g. 8 = 2 × 2 × 2 = 23
27 = 3×3×3 =33 etc. He then explains the relationships between indices and logarithms (i.e. logarithms means power).
Power Logarithms
1000 = 103 Log 1000 = 3
100 = 102 Log 100 = 2
10 = 101 Log 10 = 1
1 = 100 Log 1 = 0
Step III: The teacher gives the students the following class work: Convert the following in indices and logarithms: (i) 100,000. (ii) 32 (iii) 81 (iv) 8
1 .
After 5 minutes the teacher orders of exchange and marking of exercise books by the students.
Evaluation/Assessment: The teacher assesses the students through the following quiz.
QUIZ
Answer all questions in 5mins:
Write the following as indices and logarithms.
(i) 10,000 (ii) 243 (iii) 0.2 (iv) 271
Remarks: The stated objectives HAVE BEEN/HAVE NOT BEEN achieved.
LESSON EIGHT
Topic: Logarithms (Introduction to Four-Figure Tables)
Time: 40 mins.
Teaching/Instructional Aids: Four-Figure Tables
Behavioural Objectives: At the end of the lesson students should be able to use correctly four-figure table to find the logarithms of some numbers with ease and 75% success.
Entry Behaviour: Students were introduced to the idea of logarithms of numbers.
118
Introduction: The teacher introduces the lesson by asking the following motivating questions based on the students entry behavior: Convert 0.125 to indices then logarithms.
Presentation
Step I: The teacher explains to the students how to use the tables to find the logarithms of Ii) 3.7 and (ii) 37. Thus:
(i) 3.7 lies between 1 and 10, therefore log 3.7 lies between 0 and 1 log 3.7 = ---- from the table 5682 appear immediately after 37 thus log. 3.7 = 0.5682.
Step III: The teacher gives classroom activities to students.
Find the logarithms of (i) 560 (ii) 10.65 (iii) 37500 the teacher orders for exchange and marking of the exercise books by the students after 5 minutes.
Evaluation/Assessment: The teacher assesses the lesson through the following quiz.
QUIZ
Answer all questions in 5 minutes:
Find: (i) log 418,000 (ii) log 6,000,000 (iii) Log 7.248
(iv) log. 1.903.
Remarks: The stated objectives HAVE BEEN/HAVE NOT BEEN achieved.
LESSON NINE
Topic: Logarithms (Ani-logarithms of Numbers)
Time: 40 mins.
Teaching/Instructional Aids: Four Figure Tables
Behaviour Objectives: At the end of the lesson students should be able to use four-figure tables correctly to find the antilogarithms of some logarithms with ease and 75% success.
119
Entry Behaviour: Students were introduced to logarithms tables.
Introduction: The teacher introduces the lesson by asking the following questions based on the previous knowledge of the students: Give the characteristics of the following numbers: (i) 2006 (ii) 6,000.000 (iii) 3.7
Presentation
Step I: The teacher explains to the students how to use the Antilogarithms tables with following examples: Use antilog tables to find 102.7547. Thus: 102.7547 is the number whose logarithm is 2.747. The fractional part is .7547, and .7547 in the antilog tables gives 5684. The integer part is 2. This shows that there are three digits before the decimal point. Hence 102.7547 = 568.4.
Step II: The teacher leads the students through the following examples:
Write down the numbers whose logarithms are:
(i) 0.9517 (ii) 5.3914
Solutions (i) 8.947 (ii) 246,200
Step III: The teacher gives the students class work. Thus: Using the tables find the numbers whose logarithms are:
(i) 2.1714 (ii) 3.7142 (iii) 6. The teacher asks students to exchange their exercise books after 5 minutes and mark. While he does the verification.
Evaluation/Assessment: The teacher assesses the students through the following quiz.
QUIZ:
Answer all questions in 5minutes.
Write down the numbers whose logarithms are: (i) 0.7142 (ii) 3.4485 (iii) 6.2983
Remarks: The stated objectives HAVE BEEN/HAVE NOT BEEN achieved.
LESSON TEN
Topic: Logarithms (Multiplication & Division Using base 10)
Time: 40 mins.
Behavioural Objectives: At the end of the lesson students should be to perform multiplication and division of logarithms using base 10 correctly with ease and 75% success.
120
Previous Knowledge: Students have learnt how to find both the logarithms and antilogarithms of numbers.
Introduction: The teacher introduces the lesson by asking the following motivating questions based on students previous knowledge: (i) How many digits will be there in the number whose logarithms is 2.0088 (ii) find the number.
Presentation:
Step I: The teacher explains the principles involve in the multiplication and division of logarithms with the aids of the following examples: (i) Evaluate 34.83 × 5.427 (ii) 4562 ÷ 98.76. Thus: you should always recall the laws of indices in calculation using logarithms. Hence
Remarks: The stated objectives HAVE BEEN/HAVE NOT BEEN achieved.
121
LESSON ELEVEN
Topic: Logarithms (Power and Roots using base 10)
Time: 10 mins.
Teaching/Instructional Aids: Four – Figure Tables
Behavioural Objectives: At the end of the lesson students should be able to perform power and roots operations on logarithms using base 10 correctly with ease and 75% success.
Previous Knowledge: Students have learnt multiplication and division of logarithms using 10 as the base.
Introduction: The teacher introduces the lesson by asking the students the following motivating questions based on their previous knowledge:
Evaluate: 18.18 ÷ 9 using tables.
Presentation
Step I: The teacher explains the procedures required in calculating powers and roots of logarithms via the following examples:
Step II: The teacher leads the students through the following
Examples: Use tables to calculate: (i) 5.0372 (ii) 5 31.60
Solutions (i) 25.37 (ii) 1.995
Step III: The teacher gives the students the following class work:
Use tables to calculate: (i) 2.9383 (ii) 26.21 . The teacher involves the students in the marking after 5 minutes period. ( Exchange and mark the exercises).
Evaluation/Assessment: The teacher assesses the students via the following quiz.
122
QUIZ
Answer all questions in 5 minutes: - Use logarithms tables to calculate:
(a) 2.962 (b) 7.2143 (c) 26.21 (d) 3 8.927
Remarks: The stated objectives HAVE BEEN/HAVE NOT BEEN achieved.
LESSON TWELVE
Topic: Logarithms (Multiplication and Division Using Tabular Methods)
Time: 40 mins.
Teaching/Instructional Aids: Four – Figure Tables
Behavioural Objectives: At the end of the lesson students should be able to perform multiplication and division of logarithms using tabular methods correctly with ease and 75% success.
Entry Behaviour: Students have learnt multiplication and division of logarithms using 10 as the base.
Introduction: The teacher introduces the lesson by asking the students the following motivating questions based on their previous knowledge: Write the following in base 10:- (i) 34.83 (ii) 5.427 solutions: (i) 34.83 = 101.5420 (ii) 5.427 = 100.7346
Presentation:
Step I: The teacher explains how to perform operations in logarithms without referring to base 10 with the aids of the following example: Evaluate
(i) 34.83× 5.427 (ii) 4,562 ÷ 98.76.
(i) (ii)
2.2766189.10.73465.4271.542034.83
LogNo
1.664646.191.994698.763.65924562
LogNo
:. 34.832 × 5.427 = 189.1 :. 4562 ÷ 98.76 = 46.17
Step II: The teacher leads the students through the following examples
Calculate: (i) 42.87 × 23.82 (ii) 218 ÷ 3.12
Solutions: (i) 1021 (ii) 69.87
123
Step III: The teacher gives the students the following as class work:
Calculate: (i) 6.26 × 23.83 (ii) 14.28 × 843.7
(iii) 1200 ÷ 85.25 (iv) 95.32 ÷ 8.971.
After a period of 5 minutes he allows the students to exchange and mark their exercise books, while he verifies the result.
Evaluation/Assessment: The teacher assesses the lesson by administering the following quiz to the students:
QUIZ
Answer all questions in 6 minutes.
Calculate:- (a) 409 × 6.932 (b) 8.4 × 19.7 × 51.5
(c) 675.2 ÷ 35.81 (d) (403.79.62)
Remarks: The stated objectives HAVE BEEN/HAVE NOT BEEN achieved.
LESSON THIRTEEN
Topic: Logarithms (Powers and Roots Using Tabular Method)
Time: 40 mins.
Teaching/Instructional Aids: Four – Figure Tables
Behavioural Objectives: At the end of the lesson students should be able to perform calculate the powers and roots of logarithms using tabular method correctly with ease and 75% success.
Previous Knowledge: Students have learnt to calculate power and roots of logarithms using 10 as the base.
Introduction: The teacher introduces the lesson by asking the following motivating questions: Explain the steps involve in evaluating 53.753 using base 10. The expected steps are:. (i) determine the characteristics (ii) determine the mantissa, (iii) express the number to indices in base 10 (iv) multiply the power by 3 and (v) find the antilog of the new power.
Presentation:
Step I: With the aid of following examples the teacher explains all the procedures involved in calculating the powers and roots of logarithms as follows: Evaluate (a) (3.55)4 (b) 5 000,40 solutions.
124
(a) (b)
9204.076.9856021.4000,40
LogNo
2.200858.840.55023.55
Log No54
:. 3.554 = 158.8 :. 40,0005 = 8.326
Step II: The teacher leads the students through the following example:-
Evaluate (5.68)3 × 94100 correct to 2 significant figures.
Solutions:
4.749756190 2.4868 2 4.973654100
2.2629 3 0.7543(5.68) Log No
3
:. (5.68)3 × 94,100 = 56,000 to 2 s.f.
Step III: The teacher gives the students the following class work.
Evaluate the following:- (i) 9.214 (ii) 93.65
The teacher orders the students to exchange and mark their books.
Evaluation/Assessment: The teacher assesses the lesson through the following test quiz.
Remarks: The stated objectives HAVE BEEN/HAVE NOT BEEN achieved.
LESSON FOURTEEN
Topic: Logarithms OF Numbers less than 1
Time: 40 mins.
Teaching/Instructional Aids: Four – Figure Tables
Behavioural Objectives: At the end of the lesson students should be able to find the logarithms of numbers less than 1 correctly with ease and with 75% success.
125
Entry Beahviour: Students have learnt how to find the logarithms of numbers greater than 1.
Introduction: The teacher introduces the lesson by asking the students the following motivating question based on their previous knowledge: give the characteristics of the following numbers:
(i) 374.5 (ii) 46,200 (iii) 12.34 (iv) 1,234,000.
Presentation:
Step I: The teacher explains to the students that the logarithms of numbers less than 1 are found by using negative powers of 10. The teacher uses the following examples:
Step III: The teacher gives the students the following as class work. Write down the logarithms of the following:-
(i) 0.000197 (ii) 0.000 00032 (iii) 0.0084. As usual they exchange and mark their books.
Evaluation/Assessment: The teacher assesses the lesson through the following test (quiz).
QUIZ
Answer all questions in 5 minutes.
(1) Write down the logarithms of the following numbers: (a) 0.000 004 (b) 0.0011 (c) 0.00041
(2) Use antilog tables to write down the numbers whose logarithms are: (a) .49972 (b) .89394
126
Remarks: The stated objectives HAVE BEEN/HAVE NOT BEEN achieved.
LESSON FIFTEEN
Topic: Multiplication and division with numbers less than 1
Time: 40 mins.
Teaching/Instructional Aids: Four – Figure Tables
Behavioural Objectives: At the end of the lesson students should be able to perform multiplication and division of some logarithms with numbers less than 1 correctly with ease and with 75% success.
Entry Beahviour: Students have learnt to write down the logarithms of numbers less than 1.
Introduction: The teacher introduces the lesson by asking the following motivating questions based on their previous knowledge:-
- What are the integers of the following: 0.000 009 (ii) 0.000347
Presentation:
Step I: With the aid of the following example the teacher explains all the steps needed in multiplying and dividing numbers less than 1 using logarithms: Evaluate
(a) 0.7685 × 0.03415 (b) 0.7685 ÷ 341.5.
Solutions
(i) (ii)
.419120.02625
.533420.3415
.885710.7685Log No
2.53340.0022512.53340.3415
.885710.7685Log No
Step II: The teacher leads the students through the following
Examples: Evaluate: (i) 0.0824 × 6.51 (ii) 6.802 ÷ 0.094
Remarks: The stated objectives HAVE BEEN/HAVE NOT BEEN achieved.
LESSON SIXTEEN
Topic: Powers and Roots of Numbers Less Than 1
Time: 40 mins.
Teaching/Instructional Aids: Four – Figure Tables
Behavioural Objectives: At the end of the lesson, students should be able to calculate the powers and roots of logarithms with numbers less than 1 correctly with ease and 75% success.
Entry Beahviour: Students can perform multiplication and division of number less than 1.
Introduction: The teacher introduces the lesson by asking the following motivating questions ::-
- Simplify the following: (i) .45 .23 (ii) 2..3 - .75
Presentation:
Step I: With the aid of the following examples, the teacher explains all its requires in finding the powers and roots of numbers less than 1: Thus Evaluate: (a) (0.085)3, 4 0.0007
Solution.
(a) (b)
.211310.16274 4.84510.0007
.92940.0007LogNo
.788240.00061413.92942(0.085)
.929420.085LogNo
43
:. (0.085)3 = 0.0006141 :. 4 0.0007 = 0.1627
Step II: The teacher leads the students through the following examples:
Remarks: The stated objectives HAVE BEEN/HAVE NOT BEEN achieved.
LESSON SEVENTHEEN
Topic: Test on Logarithms
Time: 40 mins.
Behavioural Objectives: At the end of the unit lecture, students should be able to answer all the questions given on logarithms with ease and success.
Previous Knowledge: Students were taught necessary materials on logarithms for a period of two (2) weeks.
Introduction:- The teacher introduces the lesson by asking students to write their names and number on their answer scripts.
Presentation:
Step I: The teacher distributes the question papers to the students and asks them not to start.
Step II: The teacher reads the instructions clearly to the students which include when to start and stop.
Step III: The teacher commands the students to start.
129
TEST ON LOGARITHMS
Instruction: Answer all questions Time allowed 40 minutes
1. Write the following as indices and logarithms (a) 1000 (b) 1/32
2. Find (a) Log 418,000 (b) Log 2.3 3. Write the antilog of the following: (a) 0.714 (b) 2.008 4. Use base 10 to evaluate (a) 15.2 × 30 (b) 16.8 ÷ 2.2. 5. Use base 10 to evaluate as 7.123 (b) 4 145 6. Write down the logarithms of the following: (a) 0.00 0003 (b) 0.0086 7. Write down the antilog of the following:- (a) .3361 (b) 00314 8. Evaluate the following:- (a) 0.67 × 0.98 (b) 0.56÷0.094 9. Evaluate the following:- (a) 0.254 (b) 3 0.066 10. In a tabular form calculate: (a) 40.9 × 6.93 (b) 67.5 ÷ 3.58
Conclusion: The teacher concludes by commanding the students to stop while the teacher collects all the answered scripts.
130
APPENDIX F
LESSON PLAN FOR CONTROL GROUPS
Name of School-------------------------------------------------------------------------------
Class: SS 2
Subject: Mathematics
Topic: Indices (First Four Laws)
Behavioural Objectives: At the end of the lesson students should be able to apply the first four laws of indices correctly to solve with ease and 75% success some indices problems.
Previous Knowledge/Entry Behaviour: Students have learnt repeated multiplication and successive division of numbers.
Introduction: The teacher introduces the lesson by asking these motivating questions based on the previous knowledge:
(ii) Multiply 3 by 3 by 3 (ii) How many groups of two are the in 12? Ans. 27 Ans. 6
Presentation:
Step 1: The teacher explains the meaning of indices as the shortest way of writing repeated multiplication using the same number and writes the first four laws of indices for the students.
Step II: The teacher explains each law with specific example as follows:
Step III: The teacher allows the students to do the following:
Simplify: (i) rxr0 × r-5 (ii) 22 × 1
61
(iii) 190 (iv) x3 ÷ x-3
Ans. (i) r-4 = r1 4 (ii) 24 (iii) 1 (iv) x6 The teacher involves the students in
marking (exchange and mark) while he verifies.
131
LESSON TWO
Topic: Indices (Product of Indices)
Time: 40 mins.
Behavioural Objectives: At the end of the lesson students should be able to apply the principles of the “products of indices” correctly to solve with ease and 75% success some problems on indices.
Previous Knowledge/Entry Behaviour: Students were introduced to the first four laws of indices.
Introduction: The teacher introduces the lesson by asking the following motivating questions based on the previous knowledge: (1) Name any law of indices you know. (ii) The law x0 = 1: What is its limitation?
Presentation
Step 1: The teacher explains all that the products is all about using the following example: Simplify (α2)3 i.e. (α2)3 = α2 × α2 × α2 = α2+2+2 = α2×3 = α3.
Step II: The teacher leads the students through the following examples: Simplify the following:
Step III: The teacher gives the students the following as class work:
Exercise. Simplify the following:
(i) (-4b2)3 (ii) (a3b)4 (iii) -3(de3)4 (iv) (3-2)-3
The teacher involves the students in marking and verifies.
LESSON THREE
Topic: Indices (Fractional Indices)
Time: 40 mins.
Behavioural Objectives: At the end of the lesson students should be able to apply the principles of “fractional indices” to correctly solve with ease and 75% success some problems on indices.
132
Entry Behaviour: Students have learnt how to solve problems on indices using the principles of “product of indices”.
Introduction: The teacher introduces the lesson by asking the following motivating questions based on the previous knowledge:
(ii) What is the difference between (-3a2)2 and –(3a2)2
Presentation:
Step I: The teacher explains the idea of fractional indices using the following examples (i) and (ii) 3
(iii) = square root of α. (ii) 3 b = cube root of b.
but × = α but 3 b × 3 b × b = b
let = αx let 3 b by
then αx xαx = × = α1 then by x by × by = b1 α2x = α1 b3y = b1
(iv) 2x = 1 and x = ½ 3y = 1 and y = 1/3
Thus = 21
Thus 3 b = 31
b
Step II: The teacher leads the students through the following examples:
Step III: The teacher now allows the students to do the following class work.
Simplify: 43
8116
(ii) 3 62 (iii) 1691 (iv) 0.04 ½ . The teacher allows students to
exchange their books and mark after 5 minutes.
LESSON FOUR
Topic: Indices (Decimal Indices)
Time: 40 mins.
Behavioural Objectives: At the end of the lesson students should be able to apply the principles of decimal indices correctly to solve with ease and 75% success some problems on indices.
Previous Knowledge: Students were taught indices with fractional index.
133
Introduction: The teacher introduces the lesson by asking the following motivating
questions based on their previous knowledge: Simplify (i) 21
41 (ii) 2 × 2-3
Presentation:
Step I: The teacher explains all that are needed in dealing with decimal indices. Such as reading the question to clarify things, converting decimals to fraction then the operation. This is done with the aid of this example:
Simplify (2.25)1.5.
Solution – change the decimals to fractions i.e. (2.25)1.5 = (2 41 )1 ½ =
833
827 2
3 49 4
9 3323
Step II: The teacher leads the students through the following examples:
Simplify (i) (0.25)0.5 (ii) (16/9)-25.
Solution:
(iii) 1 0.5 21 4
1 41 (0.25) 2
10.5
(iv) 25525.2
43 3
4 916 9
16 916 9
16( 23
21
Step III: The teacher gives the students the following class work: Simplify the following:
(i) 160.75 (ii) (0.05)0.5. After 5 minutes the teacher involves the students in marking while he verifies the results.
LESSON FIVE
Topic: Indices (Equations in indices)
Time: 40 mins.
Behavioural Objectives: At the end of the lesson, the students should be able to solve simple equations in indices correctly with ease and 75% success.
Entry Behaviour: Students have learnt a lot about indices.
Introduction: The teacher introduces the lesson by asking the following motivating questions: Name any law of indices you know.
134
Presentation:
Step I: The teacher explains to the students how to solve equations that contains indices using the following example: Solve the following equations:
(i) x1/3 = 4 (ii) 2a-1/2 = 14
Solutions:
(ii) X1/3 = (ii) 2a-1/2 = 14 (x1/3)3 = 43 a-1/2 = 7 (x1/3)3 = 43 a1/2 = 7 X1/3×3 = 64 (a-1/2)-2 = 7-2 X = 64 a = 1/49
Step II: The teacher leads the students through the following examples:
Solve:
(ii) 8x = 32 (ii) (i)x-2/3 = 9
Solution: (i) x = 5/3 (ii) x = 271
Step III: The teacher gives the students the following as class work:
Solve (i) a ½ = 2 (ii) a-1 = 2 (iii) 2x3 = 54 (iv) 9x = 27.
The teacher commands the students to exchange their exercise books and mark while he verifies the results after 5 minutes.
LESSON SIX
Topic: Logarithms (Introduction)
Time: 40 mins.
Teaching/Instructional Aids: Four Figure Tables
Behaviour Objectives: At the lesson, students should be able to (i) establish the relationships between indices and logarithms and (ii) convert some indices to logarithms correctly with ease and 75% success.
Entry Behaviour: Students have learnt a lot about indices.
Introduction: The teacher introduces the lesson by asking the following motivating questions: (i) Mention any law of indices you know (ii) When does x0 = 1 holds?
135
Presentation
Step I: The teacher writes some numbers and expressed them in the power 10 using the following examples: i.e.
Step II: The teacher leads students to mention some numbers other than 10 that can be expressed in powers e.g. 8 = 2 × 2 × 2 = 23
27 = 3×3×3 =33 etc. He then explains the relationships between indices and logarithms (i.e. logarithms means power).
Power Logarithms
1000 = 103 Log 1000 = 3
100 = 102 Log 100 = 2
10 = 101 Log 10 = 1
1 = 100 Log 1 = 0
Step III: The teacher gives the students the following class work: Convert the following in indices and logarithms: (i) 100,000. (ii) 32 (iii) 81 (iv) 8
1 .
After 5 minutes the teacher orders of exchange and marking of exercise books by the students.
LESSON SEVEN
Topic: Logarithms (Introduction to Four-Figure Tables)
Time: 40 mins.
Teaching/Instructional Aids: Four-Figure Tables
Behavioural Objectives: At the end of the lesson students should be able to use correctly four-figure table to find the logarithms of some numbers with ease and 75% success.
Entry Behaviour: Students were introduced to the idea of logarithms of numbers.
Introduction: The teacher introduces the lesson by asking the following motivating questions based on the students entry behavior: Convert 0.125 to indices then logarithms.
Presentation
Step I: The teacher explains to the students how to use the tables to find the logarithms of Ii) 3.7 and (ii) 37. Thus:
136
(iii)3.7 lies between 1 and 10, therefore log 3.7 lies between 0 and 1 log 3.7 = ---- from the table 5682 appear immediately after 37 thus log. 3.7 = 0.5682.
Step III: The teacher gives classroom activities to students.
Find the logarithms of (i) 560 (ii) 10.65 (iii) 37500 the teacher orders for exchange and marking of the exercise books by the students after 5 minutes.
LESSON EIGHT
Topic: Logarithms (Ani-logarithms of Numbers)
Time: 40 mins.
Teaching/Instructional Aids: Four Figure Tables
Behaviour Objectives: At the end of the lesson students should be able to use four-figure tables correctly to find the antilogarithms of some logarithms with ease and 75% success.
Entry Behaviour: Students were introduced to logarithms tables.
Introduction: The teacher introduces the lesson by asking the following questions based on the previous knowledge of the students: Give the characteristics of the following numbers: (i) 2006 (ii) 6,000.000 (iii) 3.7
Presentation
Step I: The teacher explains to the students how to use the Antilogarithms tables with following examples: Use antilog tables to find 102.7547. Thus: 102.7547 is the number whose logarithm is 2.747. The fractional part is .7547, and .7547 in the antilog tables gives 5684. The integer part is 2. This shows that there are three digits before the decimal point. Hence 102.7547 = 568.4.
Step II: The teacher leads the students through the following examples:
Write down the numbers whose logarithms are:
(iv) 0.9517 (ii) 5.3914
137
Solutions (i) 8.947 (ii) 246,200
Step III: The teacher gives the students class work. Thus: Using the tables find the numbers whose logarithms are:
(i) 2.1714 (ii) 3.7142 (iii) 6. The teacher asks students to exchange their exercise books after 5 minutes and mark. While he does the verification.
LESSON NINE
Topic: Logarithms (Multiplication & Division Using base 10)
Time: 40 mins.
Behavioural Objectives: At the end of the lesson students should be to perform multiplication and division of logarithms using base 10 correctly with ease and 75% success.
Previous Knowledge: Students have learnt how to find both the logarithms and antilogarithms of numbers.
Introduction: The teacher introduces the lesson by asking the following motivating questions based on students previous knowledge: (i) How many digits will be there in the number whose logarithms is 2.0088 (ii) find the number.
Presentation:
Step I: The teacher explains the principles involve in the multiplication and division of logarithms with the aids of the following examples: (i) Evaluate 34.83 × 5.427 (ii) 4562 ÷ 98.76. Thus: you should always recall the laws of indices in calculation using logarithms. Hence
Step II: The teacher leads the students through the following.
Examples: Evaluate (i) 2.413 × 3.092 (ii) 9.475 ÷ 6.13.
Solutions: (i) 7.461 (ii) 1.545.
Step III: The teacher gives the students class work. Thus:
138
Evaluate: (i) 98.15 × 7.264 (ii) 46.31 ÷ 8.742.
(v) 3.338 × 2.074 (iv) 45.80 ÷ 6.3992.
The teacher orders the students to exchange and mark their exercise books after 5 minutes exercise.
LESSON TEN
Topic: Logarithms (Power and Roots using base 10)
Time: 10 mins.
Teaching/Instructional Aids: Four – Figure Tables
Behavioural Objectives: At the end of the lesson students should be able to perform power and roots operations on logarithms using base 10 correctly with ease and 75% success.
Previous Knowledge: Students have learnt multiplication and division of logarithms using 10 as the base.
Introduction: The teacher introduces the lesson by asking the students the following motivating questions based on their previous knowledge:
Evaluate: 18.18 ÷ 9 using tables.
Presentation
Step I: The teacher explains the procedures required in calculating powers and roots of logarithms via the following examples:
Step II: The teacher leads the students through the following
Examples: Use tables to calculate: (i) 5.0372 (ii) 5 31.60
Solutions (i) 25.37 (ii) 1.995
139
Step III: The teacher gives the students the following class work:
Use tables to calculate: (i) 2.9383 (ii) 26.21 . The teacher involves the students in the marking after 5 minutes period. ( Exchange and mark the exercises).
LESSON ELEVEN
Topic: Logarithms (Multiplication and Division Using Tabular Methods)
Time: 40 mins.
Teaching/Instructional Aids: Four – Figure Tables
Behavioural Objectives: At the end of the lesson students should be able to perform multiplication and division of logarithms using tabular methods correctly with ease and 75% success.
Entry Behaviour: Students have learnt multiplication and division of logarithms using 10 as the base.
Introduction: The teacher introduces the lesson by asking the students the following motivating questions based on their previous knowledge: Write the following in base 10:- (i) 34.83 (ii) 5.427 solutions: (i) 34.83 = 101.5420 (ii) 5.427 = 100.7346
Presentation:
Step I: The teacher explains how to perform operations in logarithms without referring to base 10 with the aids of the following example: Evaluate
(i) 34.83× 5.427 (ii) 4,562 ÷ 98.76.
Solution:
(i) (ii)
2.2766189.10.73465.4271.542034.83
LogNo
1.664646.191.994698.763.65924562
LogNo
:. 34.832 × 5.427 = 189.1 :. 4562 ÷ 98.76 = 46.17
Step II: The teacher leads the students through the following examples
Calculate: (i) 42.87 × 23.82 (ii) 218 ÷ 3.12
Solutions: (i) 1021 (ii) 69.87
140
Step III: The teacher gives the students the following as class work:
Calculate: (i) 6.26 × 23.83 (ii) 14.28 × 843.7
(vi) 1200 ÷ 85.25 (iv) 95.32 ÷ 8.971.
After a period of 5 minutes he allows the students to exchange and mark their exercise books, while he verifies the result.
LESSON TWELVE
Topic: Logarithms (Powers and Roots Using Tabular Method)
Time: 40 mins.
Teaching/Instructional Aids: Four – Figure Tables
Behavioural Objectives: At the end of the lesson students should be able to perform calculate the powers and roots of logarithms using tabular method correctly with ease and 75% success.
Previous Knowledge: Students have learnt to calculate power and roots of logarithms using 10 as the base.
Introduction: The teacher introduces the lesson by asking the following motivating questions: Explain the steps involve in evaluating 53.753 using base 10. The expected steps are:. (i) determine the characteristics (ii) determine the mantissa, (iii) express the number to indices in base 10 (iv) multiply the power by 3 and (v) find the antilog of the new power.
Presentation:
Step I: With the aid of following examples the teacher explains all the procedures involved in calculating the powers and roots of logarithms as follows: Evaluate (a) (3.55)4 (b) 5 000,40 solutions.
(a) (b)
9204.076.9856021.4000,40
LogNo
2.200858.840.55023.55
Log No54
:. 3.554 = 158.8 :. 40,0005 = 8.326
Step II: The teacher leads the students through the following example:-
Evaluate (5.68)3 × 94100 correct to 2 significant figures.
141
Solutions:
4.749756190 2.4868 2 4.973654100
2.2629 3 0.7543(5.68) Log No
3
:. (5.68)3 × 94,100 = 56,000 to 2 s.f.
Step III: The teacher gives the students the following class work.
Evaluate the following:- (i) 9.214 (ii) 93.65
The teacher orders the students to exchange and mark their books.
LESSON THIRTEEN
Topic: Logarithms OF Numbers less than 1
Time: 40 mins.
Teaching/Instructional Aids: Four – Figure Tables
Behavioural Objectives: At the end of the lesson students should be able to find the logarithms of numbers less than 1 correctly with ease and with 75% success.
Entry Beahviour: Students have learnt how to find the logarithms of numbers greater than 1.
Introduction: The teacher introduces the lesson by asking the students the following motivating question based on their previous knowledge: give the characteristics of the following numbers:
(i) 374.5 (ii) 46,200 (iii) 12.34 (iv) 1,234,000.
Presentation:
Step I: The teacher explains to the students that the logarithms of numbers less than 1 are found by using negative powers of 10. The teacher uses the following examples:
Step III: The teacher gives the students the following as class work. Write down the logarithms of the following:-
(i) 0.000197 (ii) 0.000 00032 (iii) 0.0084. As usual they exchange and mark their books.
LESSON FOURTEEN
Topic: Multiplication and division with numbers less than 1
Time: 40 mins.
Teaching/Instructional Aids: Four – Figure Tables
Behavioural Objectives: At the end of the lesson students should be able to perform multiplication and division of some logarithms with numbers less than 1 correctly with ease and with 75% success.
Entry Beahviour: Students have learnt to write down the logarithms of numbers less than 1.
Introduction: The teacher introduces the lesson by asking the following motivating questions based on their previous knowledge:-
- What are the integers of the following: 0.000 009 (ii) 0.000347
Presentation:
Step I: With the aid of the following example the teacher explains all the steps needed in multiplying and dividing numbers less than 1 using logarithms: Evaluate
(b) 0.7685 × 0.03415 (b) 0.7685 ÷ 341.5.
143
Solutions
(i) (ii)
.419120.02625
.533420.3415
.885710.7685Log No
2.53340.0022512.53340.3415
.885710.7685Log No
Step II: The teacher leads the students through the following
Examples: Evaluate: (i) 0.0824 × 6.51 (ii) 6.802 ÷ 0.094
Students exchange their books for marking after the exercise.
.
LESSON FIFTEEN
Topic: Powers and Roots of Numbers Less Than 1
Time: 40 mins.
Teaching/Instructional Aids: Four – Figure Tables
Behavioural Objectives: At the end of the lesson, students should be able to calculate the powers and roots of logarithms with numbers less than 1 correctly with ease and 75% success.
Entry Beahviour: Students can perform multiplication and division of number less than 1.
Introduction: The teacher introduces the lesson by asking the following motivating questions ::-
- Simplify the following: (i) .45 .23 (ii) 2..3 - .75
Presentation:
Step I: With the aid of the following examples, the teacher explains all its requires in finding the powers and roots of numbers less than 1: Thus Evaluate: (a) (0.085)3, 4 0.0007
144
Solution.
(a) (b)
.211310.16274 4.84510.0007
.92940.0007LogNo
.788240.00061413.92942(0.085)
.929420.085LogNo
43
:. (0.085)3 = 0.0006141 :. 4 0.0007 = 0.1627
Step II: The teacher leads the students through the following examples:
RAW SCORES FOR MATHEMATICS ACHIEVEMENT TEST OVER 100%
EXPERIMENTAL GROUP CONTROL GROUP HIGH ABILITY LOW ABILITY HIGH ABILITY LOW ABILITY S/No PRETEST POSTTEST PRETEST POSTTEST S/No PRETEST POSTTEST PRETEST POSTTEST
EXPERIMENTAL GROUP CONTROL GROUP HIGH ABILITY LOW ABILITY HIGH ABILITY LOW ABILITY S/No. PREMIIL POSTMIIL PREMIIL POSTMIIL S/No. PREMIIL POSTMIIL PREMIIL POSTMIIL