I School Of Graduate Studies Department Of Earth Sciences ENVIRONMENTAL ANALYSIS OF A HYDROLOGIC SYSTEM THE CASE OF TINISHU AKAKI RIVER, WESTERN ADDIS ABABA, ETHIOPIA. AS PARTIAL FULFILLMENT FOR THE DEGREE OF MASTER OF SCIENCE IN GEO ENVIRONMENTAL SYSTEMS ANALYSIS Abdulshikur Mohammed 2007
Transcript
I
School Of Graduate Studies
Department Of Earth Sciences
ENVIRONMENTAL ANALYSIS OF A HYDROLOGIC
SYSTEM THE CASE OF TINISHU AKAKI RIVER, WESTERN
ADDIS ABABA, ETHIOPIA.
AS PARTIAL FULFILLMENT FOR THE DEGREE OF MASTER OF SCIENCE IN GEO ENVIRONMENTAL SYSTEMS ANALYSIS Abdulshikur Mohammed 2007
II
Acknowledgement
First of all I would like to praise almighty Allah for the strength he bestows on me
to start and finish this work successfully.
I would like to express my heart felt and warmest gratitude to my advisors, Dr. Asfawossen Asrat and Dr. Worash Getaneh for rendering their invaluable supervision, support and guidance for the accomplishment of this work.
I am also grateful to, the rest of the stuff members of the department of Earth Sciences, Addis Ababa University for the timely cooperation they have been giving whenever I needed. I am greatly indebted to the stuffs of the MoWR, federal EPA, AAEPB, MoH, AAWSA and Leather and Leather Technology Institute for their sincere provision of secondary data and documents that help for the successful accomplishment of this work. I am very grateful to members of the Water Works Design and Supervision
Laboratory for their kind reception and keen interest to share their knowledge
and experience, which really helped me to grasp deep knowledge of analyzing
physical and chemical parameters of the waters.
I would like to extend my heart felt gratitude and admiration to my family and relatives for their day to day encouragement and support during my study with out reservation. I am also Thankful to Dr. Berhanu Gizaw, Dr. Tilahun A. and all my friends for their kind assistance and moral support. Finally, the generous support and contribution of all my families and relatives are deeply acknowledged and will be emphasized in all cases of my future life.
III
Table of Contents Pages
Acknowledgment II Table of Contents III List of Tables V List of Figures VI List of Appendices VII Abbreviations IX Abstract X
1. INTRODUCTION .............................................. Error! Bookmark not defined. 1.1. Water Pollution ..............................................Error! Bookmark not defined. 1.2 Description of the Study Area.........................Error! Bookmark not defined.
1.2.1 Location and Hydrology............................Error! Bookmark not defined. 1.2.2 Climatic Features ........................................Error! Bookmark not defined. 1.2.3 The Geologic Settings ...............................Error! Bookmark not defined.
1.2.3A. The Stratigraphic Sequences ..........Error! Bookmark not defined. 1.2.3A.1 Alaji Basalts .......................................Error! Bookmark not defined. 1.2.3A.2. Entoto Silicics...................................Error! Bookmark not defined. 1.2.3A.3. Addis Ababa Basalts ......................Error! Bookmark not defined. 1.2.3A.4. Nazareth Group ................................Error! Bookmark not defined. 1.2.3A.4.1 Lower Welded Tuff ........................Error! Bookmark not defined. 1.2.3A.4.2 Aphanitic Basalt.............................Error! Bookmark not defined. 1.2.3A.4.3 Upper Welded Tuff ........................Error! Bookmark not defined. 1.2.3A.4.4 Young Trachyitic Flow .................Error! Bookmark not defined. 1.2.3A.5 Young Olivine Porphyritic (Bofa) Basalt .. Error! Bookmark not defined.
1.2.3B. The Geologic Structures .......................Error! Bookmark not defined. 1.3 Water use and supply .......................................Error! Bookmark not defined. 1.4 The Importance of Tinishu Akaki River (TAR) .......... Error! Bookmark not defined. 1.5 Land Use and Land Cover ...............................Error! Bookmark not defined. 1.6 Statements and Justifications of the Problem ......... Error! Bookmark not defined. 1.7 Literatures Review .............................................Error! Bookmark not defined. 1.8 Previous Works...................................................Error! Bookmark not defined.
2. OBJECTIVES ................................................... Error! Bookmark not defined. 2.1 General Objective...............................................Error! Bookmark not defined. 2.2 Specific Objectives ............................................Error! Bookmark not defined. 2.3 Limitations............................................................Error! Bookmark not defined.
3. METHODOLOGY ............................................. Error! Bookmark not defined. 3.1 Spatial [DO] Pattern Analysis .........................Error! Bookmark not defined.
3.1.1 The upstream (Head Water)......................Error! Bookmark not defined. 3.1.2 The Midstream (incremental inflow) ......Error! Bookmark not defined. 3.1.3 The down Stream (reach)..........................Error! Bookmark not defined.
3.2 Temporal [DO] Pattern Analysis.....................Error! Bookmark not defined.
IV
3.2.1 The low flow /Dry season..........................Error! Bookmark not defined. 3.2.2 The Moderate flow/ Small rainy seasonError! Bookmark not defined. 3.2.3 The high flow/ Heavy rainy season ........Error! Bookmark not defined.
3.3 [Do] Pattern For Different Effluents Discharge Scenarios ..............Error! Bookmark not defined.
3.3.1 Peak Discharge Scenario..........................Error! Bookmark not defined. 3.3.2 Little or No Discharge Scenario ..............Error! Bookmark not defined.
3.4 DO Sources and Sinks ......................................Error! Bookmark not defined. 3.4.1 Produce DO /Sources and ........................Error! Bookmark not defined. 3.4.2 Consume DO/ Sinks. ..................................Error! Bookmark not defined.
4. MAJOR SOURCES OF POLLUTANTS ........... Error! Bookmark not defined. 4.1 Industrial Sources ..............................................Error! Bookmark not defined.
4.1.1 Types and Distribution of the Industries in Ethiopia ................Error! Bookmark not defined. 4.1.2 Waste Treatment Status of the Industries.......... Error! Bookmark not defined.
4.2 Municipal Sources .............................................Error! Bookmark not defined. 4.2.1 Municipal Solid Waste ...............................Error! Bookmark not defined. 4.2.2 Municipal Liquid Waste .............................Error! Bookmark not defined.
4.3 Medical Waste .....................................................Error! Bookmark not defined. 4.4 Pharmaceutical Waste ......................................Error! Bookmark not defined. 4.5 Miscellaneous Waste Sources........................Error! Bookmark not defined.
4.5.1 Agricultural Sources ..................................Error! Bookmark not defined. 4.5.2 Slaughter Houses .......................................Error! Bookmark not defined. 4.5.3 Chemicals .....................................................Error! Bookmark not defined. 4.5.4 Laundry Chemicals.....................................Error! Bookmark not defined. 4.5.5 Fuel Stations and Garages .......................Error! Bookmark not defined.
5. DISSOLVED OXYGEN DEPLETION ALONG TAR ........Error! Bookmark not defined.
5.1 Spatio-Temporal [DO] Pattern.........................Error! Bookmark not defined. 5.2 Industrial Discharge Scenarios and DO Patterns of TAR ...............Error! Bookmark not defined.
5.2.1 DO trend With Little or No Industrial effluents Discharge .......Error! Bookmark not defined. 5.2.2 DO Trend With Peak Effluents Discharge ScenarioError! Bookmark not defined.
5.3 Processes and Conditions Based Account For DO Patterns along TAR ...............................................................................Error! Bookmark not defined.
5.3.1. The Increase In Temperature, Salinity, and Microbial Population along TAR................................................................Error! Bookmark not defined. 5.3.2. The Increase in Chloride and Heavy Metals and the Decrease Along TAR ............................................Error! Bookmark not defined. 5.3.3 Instances Of Biochemical and Physical Factors In Control of [DO] Patterns....................................................................Error! Bookmark not defined.
5.4 Consequences of Reduced [DO] Levels Along TAR .....Error! Bookmark not defined.
V
6. DISCUSSION AND INTERPRETATION .......... Error! Bookmark not defined. 7. CONCLUSIONS AND RECOMMENDATIONS Error! Bookmark not defined.
7.1 Conclusions .........................................................Error! Bookmark not defined. 7.2 Recommendations .............................................Error! Bookmark not defined.
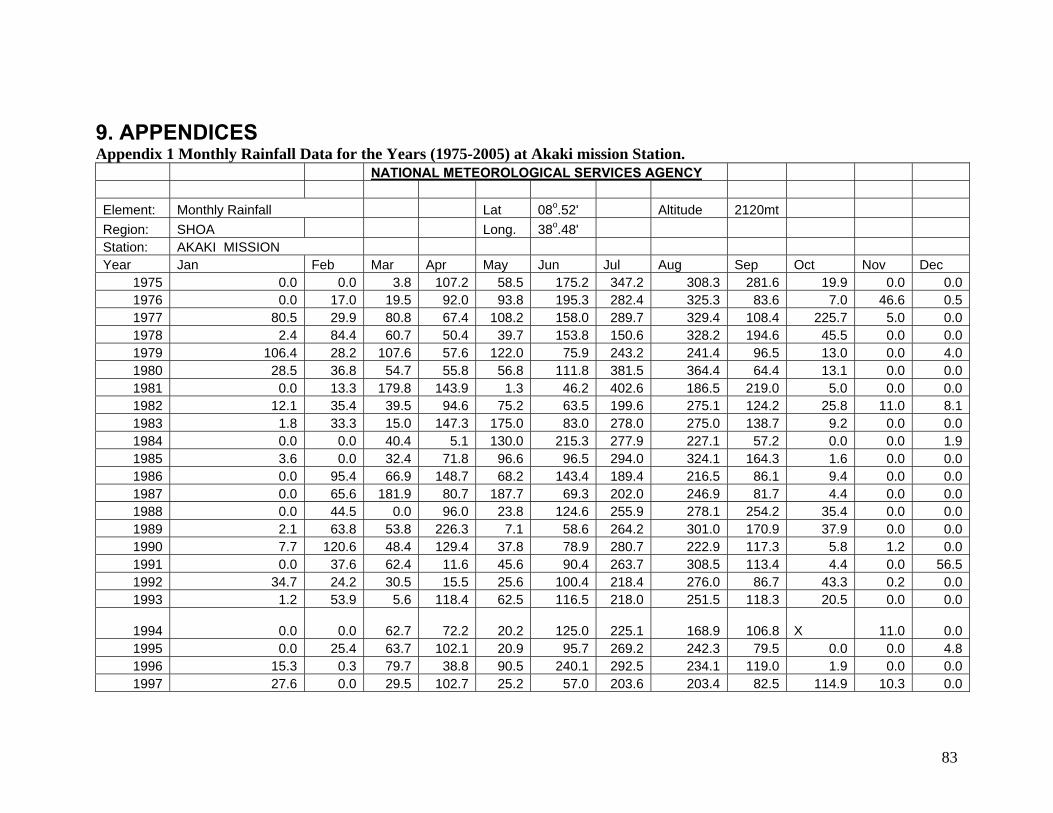
8. REFERENCES ................................................. Error! Bookmark not defined. 9. APPENDICES……………………………………………………………………….83
VI
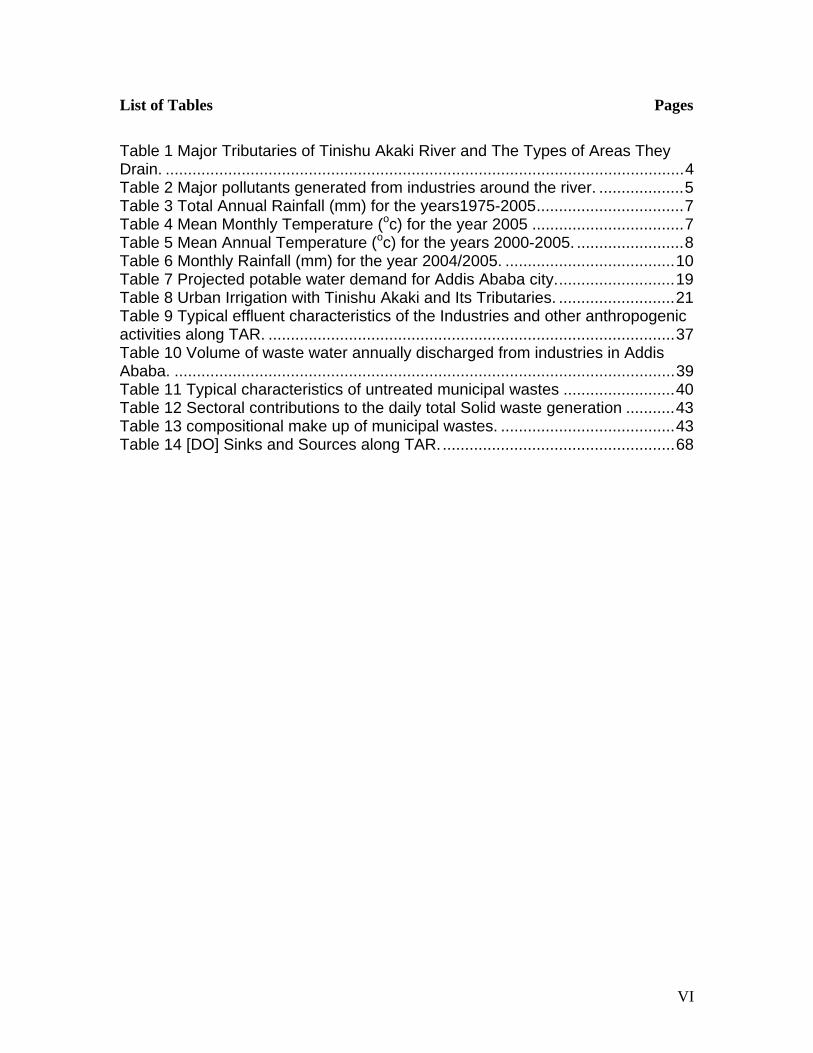
List of Tables Pages
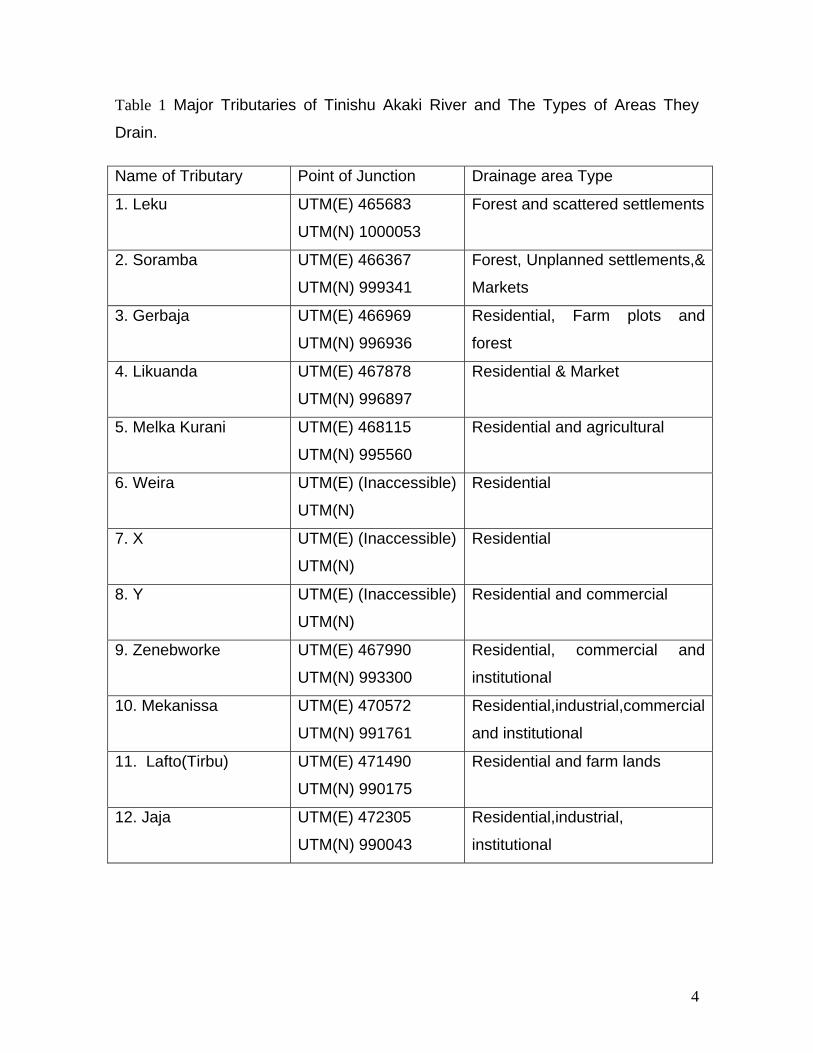
Table 1 Major Tributaries of Tinishu Akaki River and The Types of Areas They Drain. ....................................................................................................................4 Table 2 Major pollutants generated from industries around the river. ...................5 Table 3 Total Annual Rainfall (mm) for the years1975-2005.................................7 Table 4 Mean Monthly Temperature (oc) for the year 2005 ..................................7 Table 5 Mean Annual Temperature (oc) for the years 2000-2005. ........................8 Table 6 Monthly Rainfall (mm) for the year 2004/2005. ......................................10 Table 7 Projected potable water demand for Addis Ababa city...........................19 Table 8 Urban Irrigation with Tinishu Akaki and Its Tributaries. ..........................21 Table 9 Typical effluent characteristics of the Industries and other anthropogenic activities along TAR. ...........................................................................................37 Table 10 Volume of waste water annually discharged from industries in Addis Ababa. ................................................................................................................39 Table 11 Typical characteristics of untreated municipal wastes .........................40 Table 12 Sectoral contributions to the daily total Solid waste generation ...........43 Table 13 compositional make up of municipal wastes. .......................................43 Table 14 [DO] Sinks and Sources along TAR.....................................................68
VII
List of Figures Pages
Figure 1 The Study Area..……………………………………………………………..3
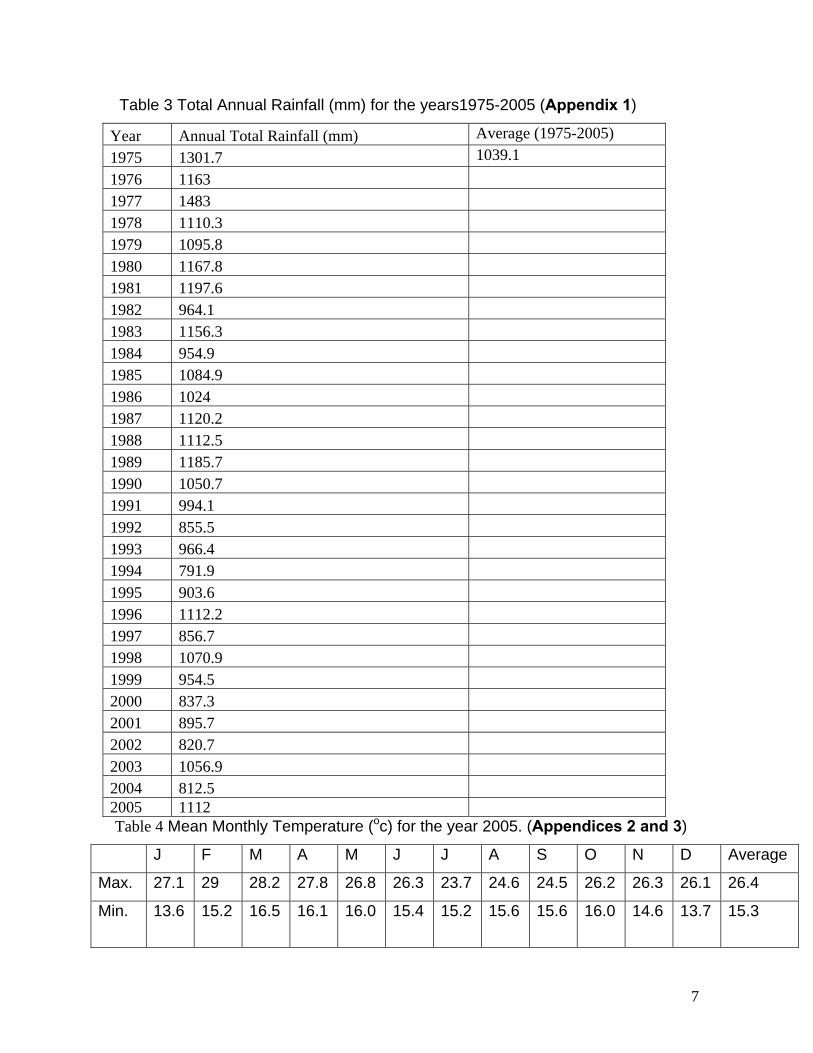
Figure 2 Mean Max and Min Temperatures of the year 2005……………………..8
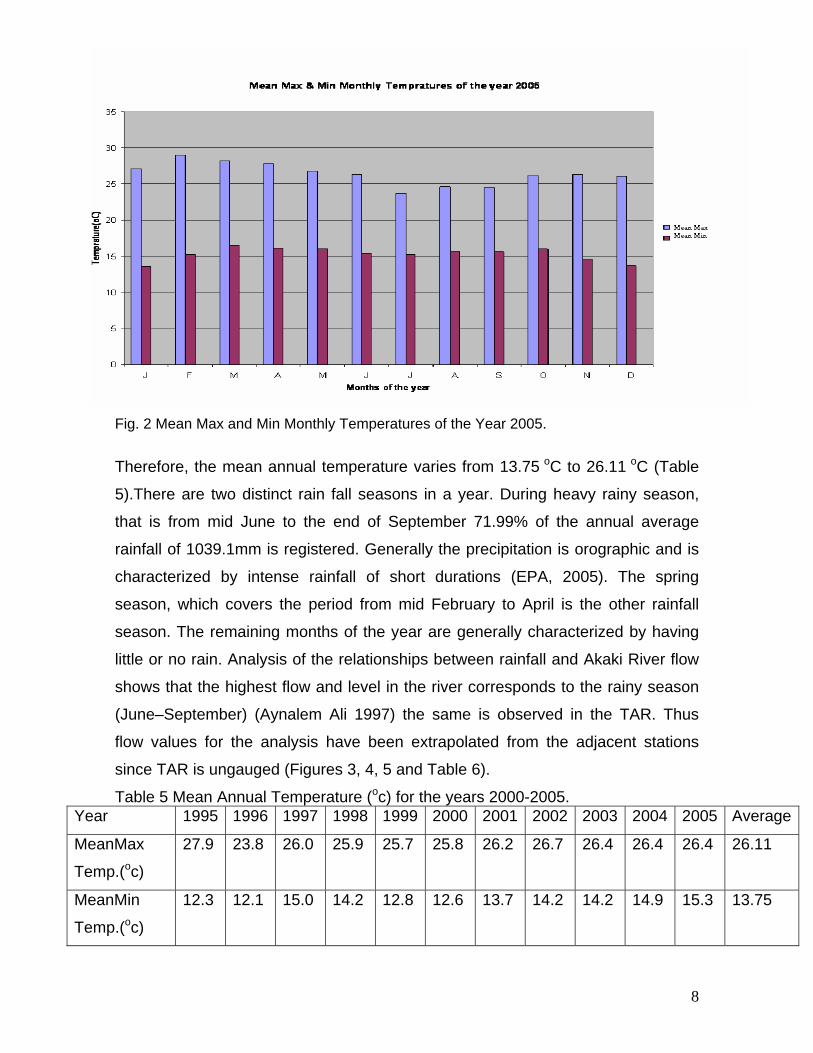
Figure 3 Rainfall Patterns for months of the year 2004/5…………………………..9
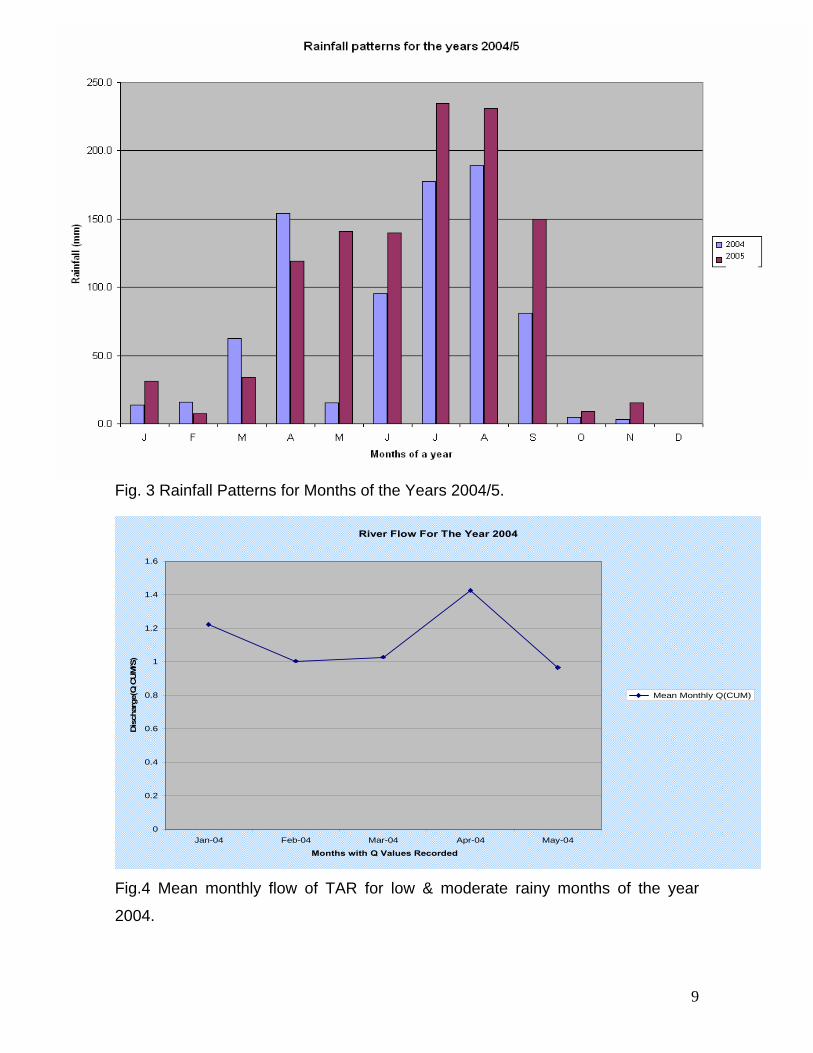
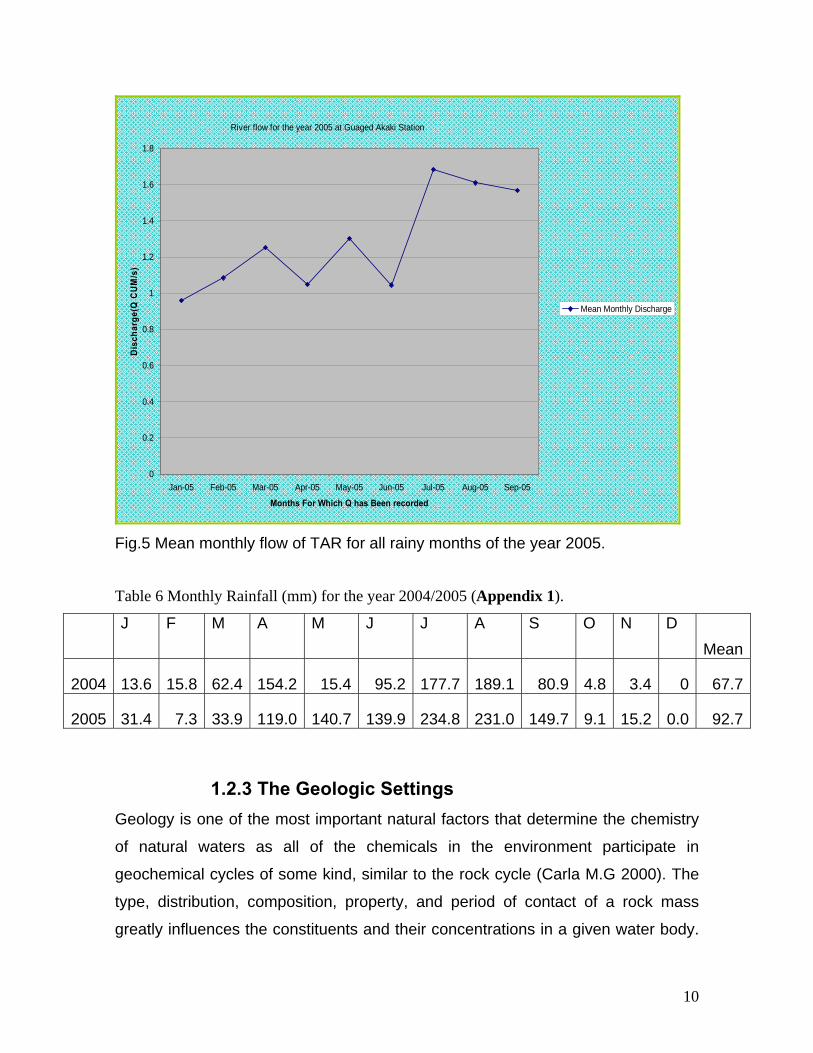
Figure 4 Mean monthly flow of TAR for low & moderate rainy months of the year 2004......................................................................................................................9 Figure 5 Mean monthly flow of TAR for all rainy months of the year 2005..........10 Figure 6 The geologic map of Addis Ababa ........................................................13 Figure 7b People using TAR for bathing .............................................................19 Figure 7a People using TAR for bathing .............................................................19 Figure 7c People using TAR for bathing .............................................................19 Figure 7d People using TAR for bathing .............................................................19 Figure 8 Land Use and Land Cover Map of the study area ................................22 Figure 9 Population growth in Addis Ababa City (immigration not considered)...40 Figure 10 Storm Drain Feeding Tributary Shankla at a bridge near Ethiomarble42 Figure 11 Solid wastes dumped in the TAR valley..............................................44 Figure 13 The 1997 Dry (low flow) Season DO pattern along TAR ....................48 Figure 14 The 1997 Wet (high flow) season DO pattern along TAR...................49 Figure 15 The 1999 Short rainy (moderate flow) season DO pattern along TAR50 Figure 16 Moderate Flow DO Pattern Along TAR...............................................51 Figure 17 The 2000 Dry (low flow) DO Pattern Along TAR.................................52 Figure 18 The 2002-2003 Dry (low flow) seasons DO Pattern Along TAR .........53 Figure 19 The 2003-2004 Dry (Low Flow) season DO pattern Along TAR. ........54 Figure 20 The 2005-2006 high and moderate flow seasons DO patterns along TAR.....................................................................................................................55 Figure 22 Little or No Industrial effluents discharge Scenario DO pattern along TAR.....................................................................................................................57 Figure 23 DO pattern along TAR before and after Industrial effluents release ...58 Figure 24 Peak industrial effluents discharge scenario DO pattern along TAR. .59 Figure 25 TDS Increment in the downstream direction (Based on1999 data).....60 Figure 26 TDS Increment in the downstream direction. (Based on 2007 Data) ..61 Figure 27 Downward increasing temperature (Based on 1999 data) ..................61 Figure 28 Downward increasing temperature (Based on 2007 data) ..................62 Figure 29 Microbial Population growth................................................................63 Figure 30 increasing metals concentration (Based on EPA 2006 data) ..............64 Figure 31 A generally increasing chloride concentration (Based on EPA 2006 data)....................................................................................................................64 Figure 32 A declining BOD5 trend to wards the downstream (based on 2003-04 data)....................................................................................................................65 Figure 36 COD In control of the DO pattern along TAR ....................................71 Figure 37 Temperature in control of DO along TAR............................................72 Figure 38 Ammonia in response to [DO] pattern along TAR...............................73 Figure 39 Phosphate in response to [DO] depletion along TAR. ........................74
VIII
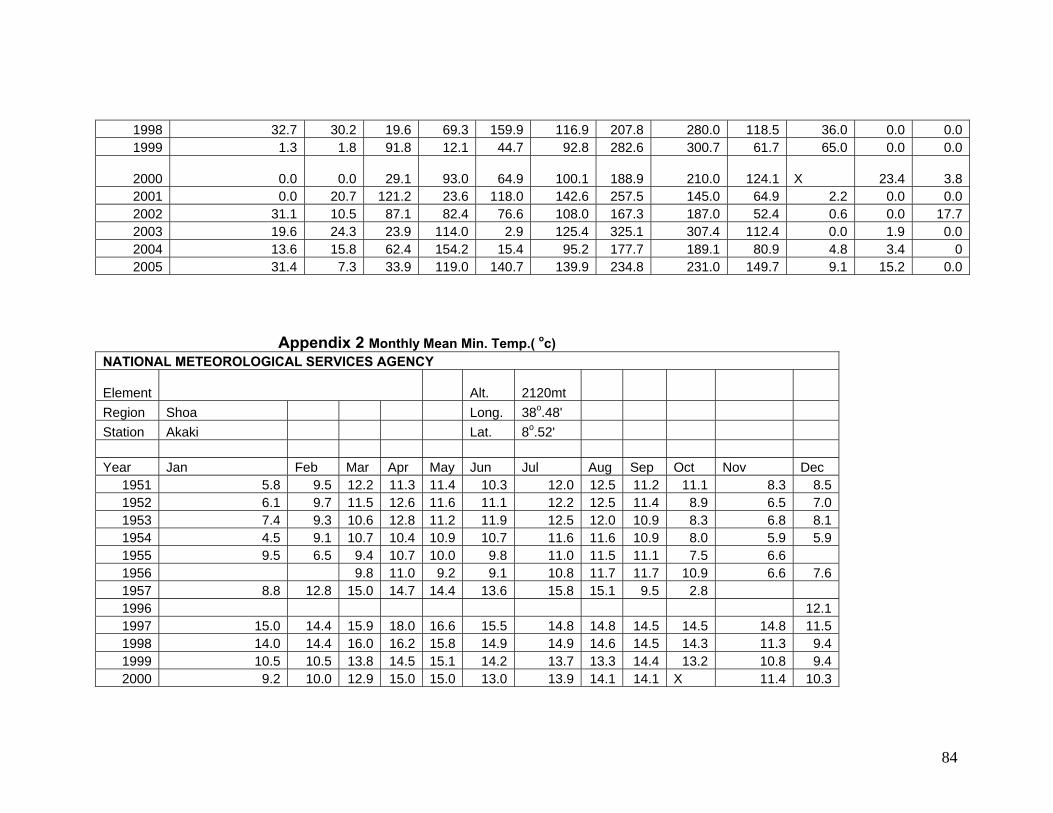
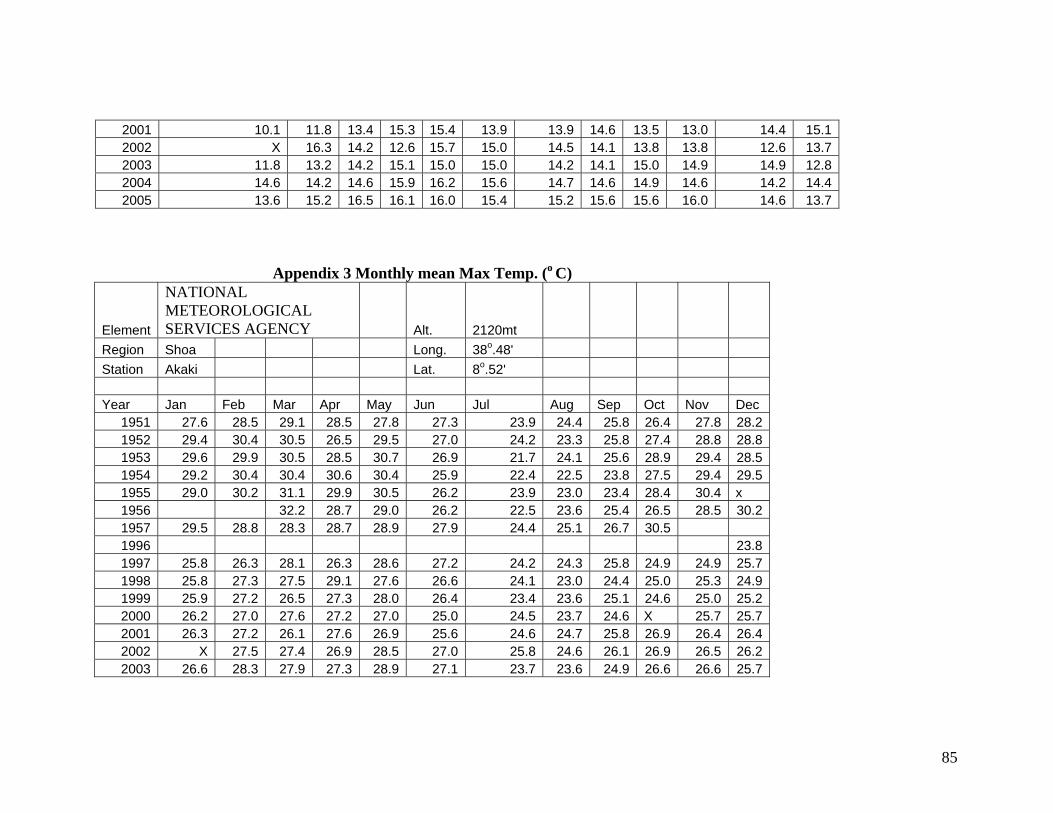
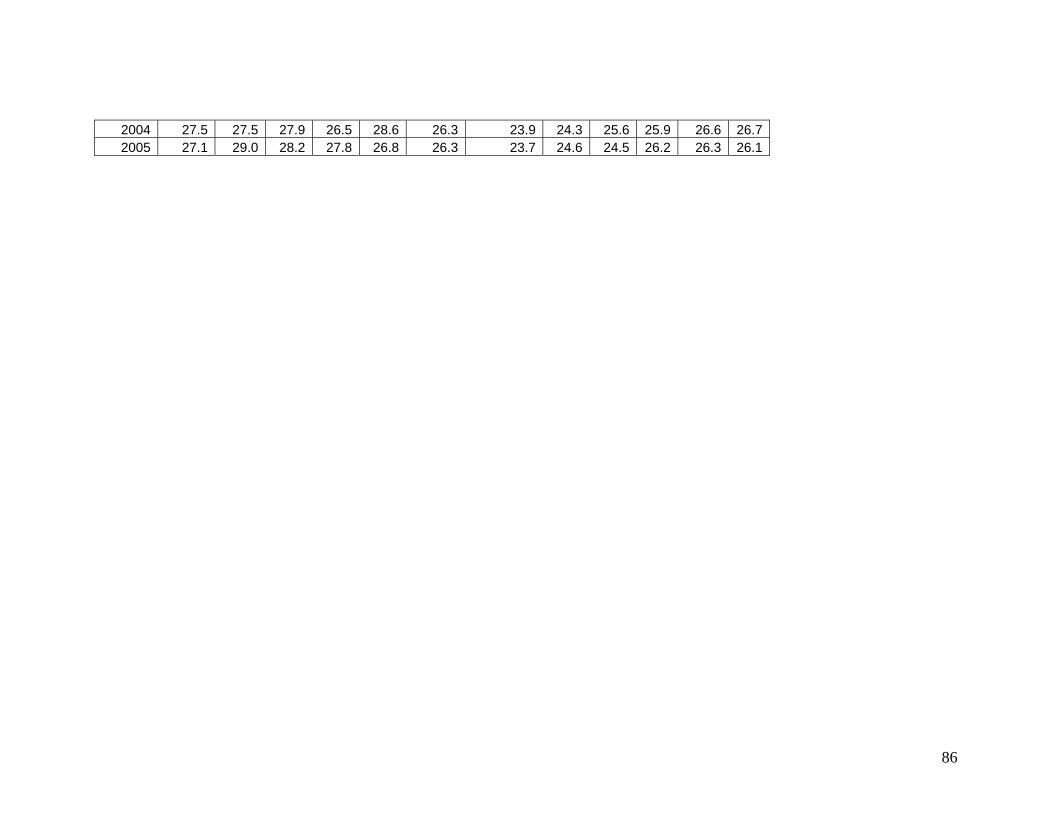
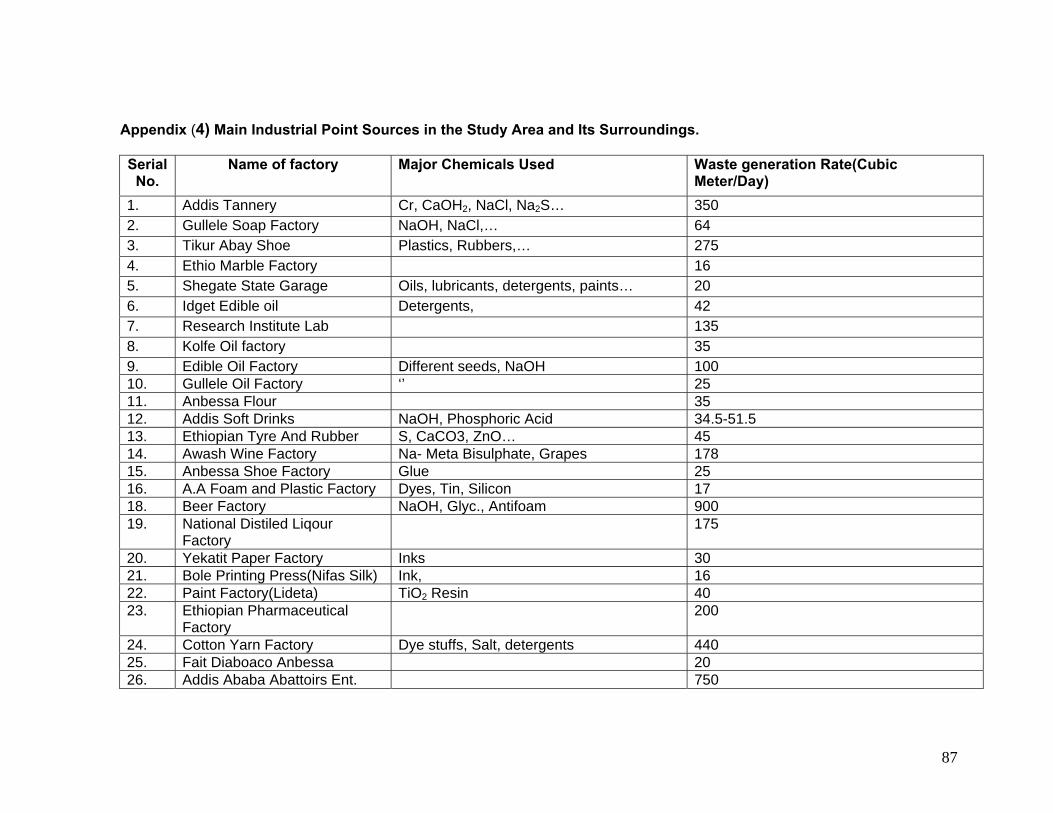
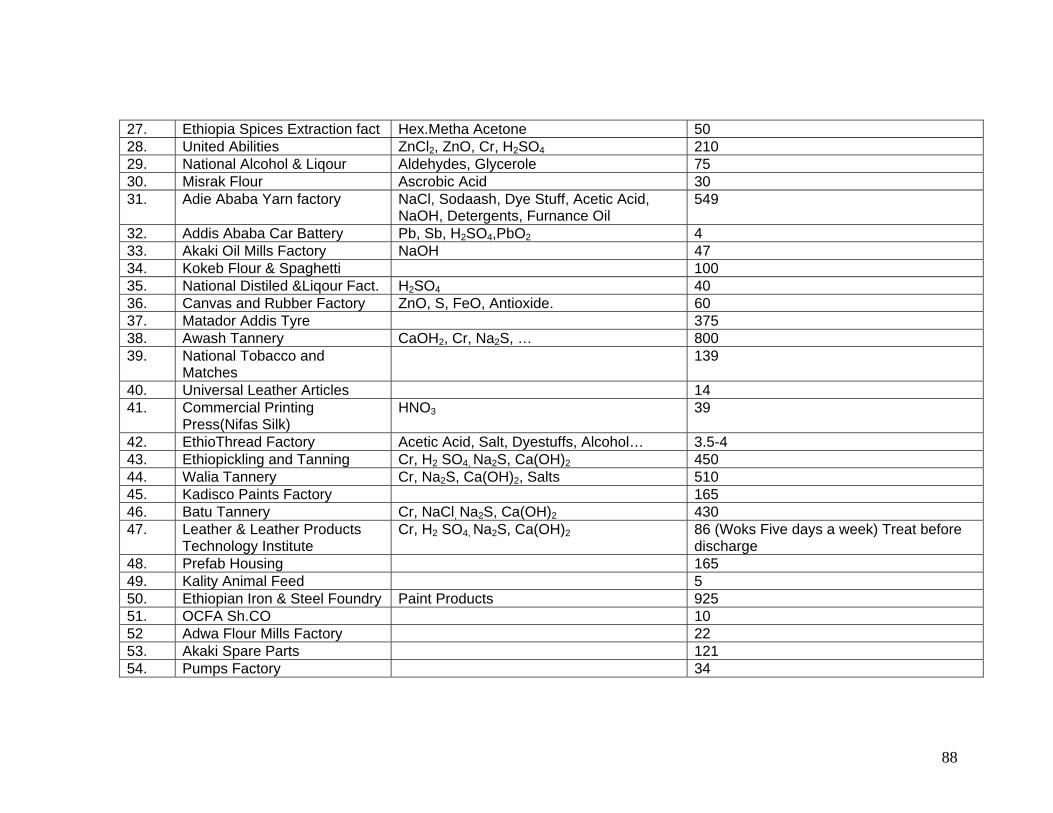
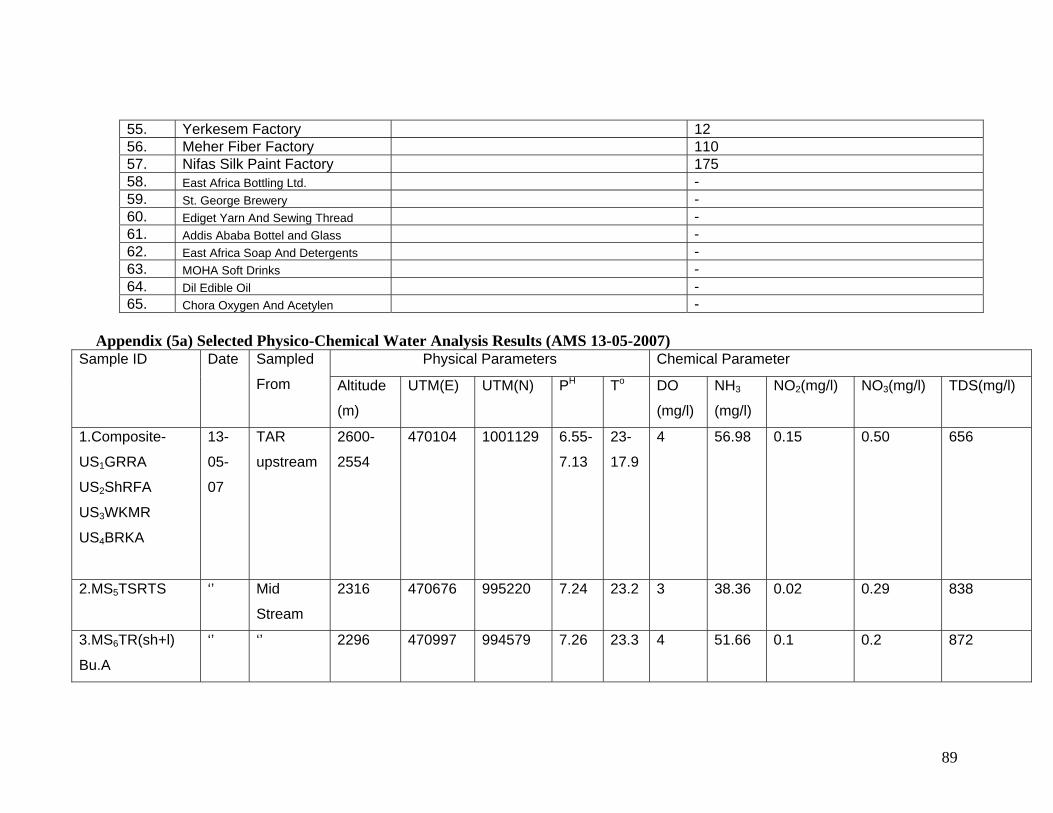
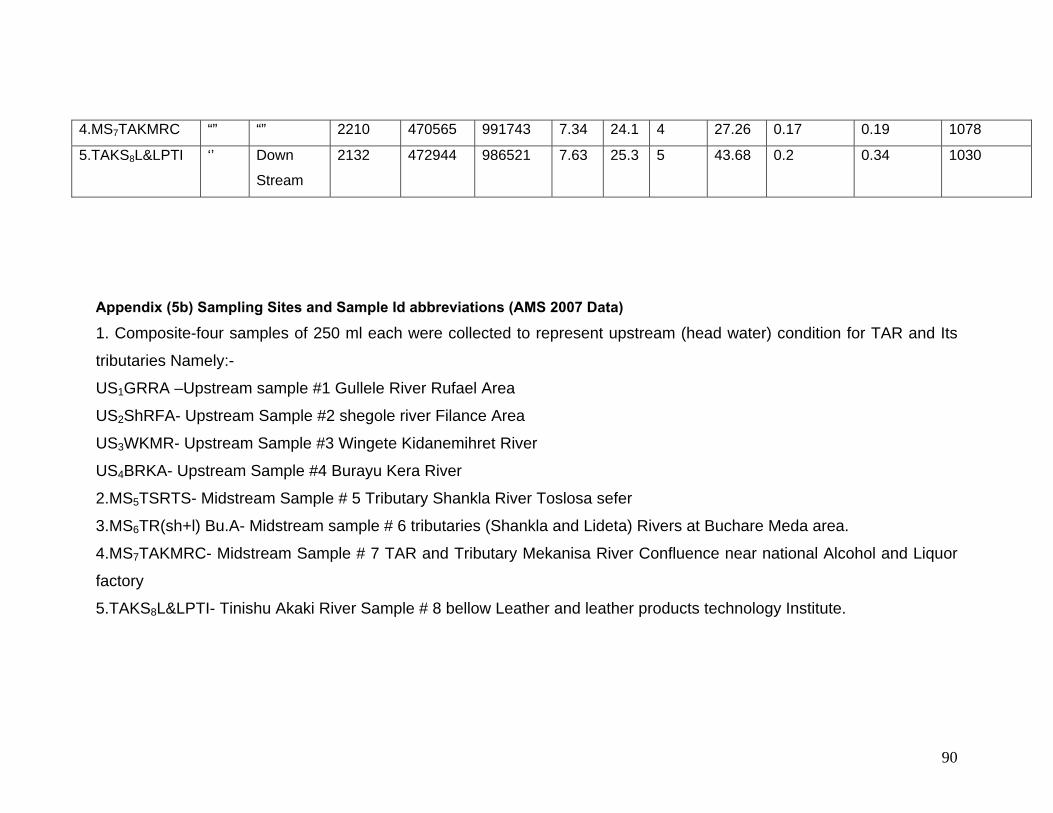
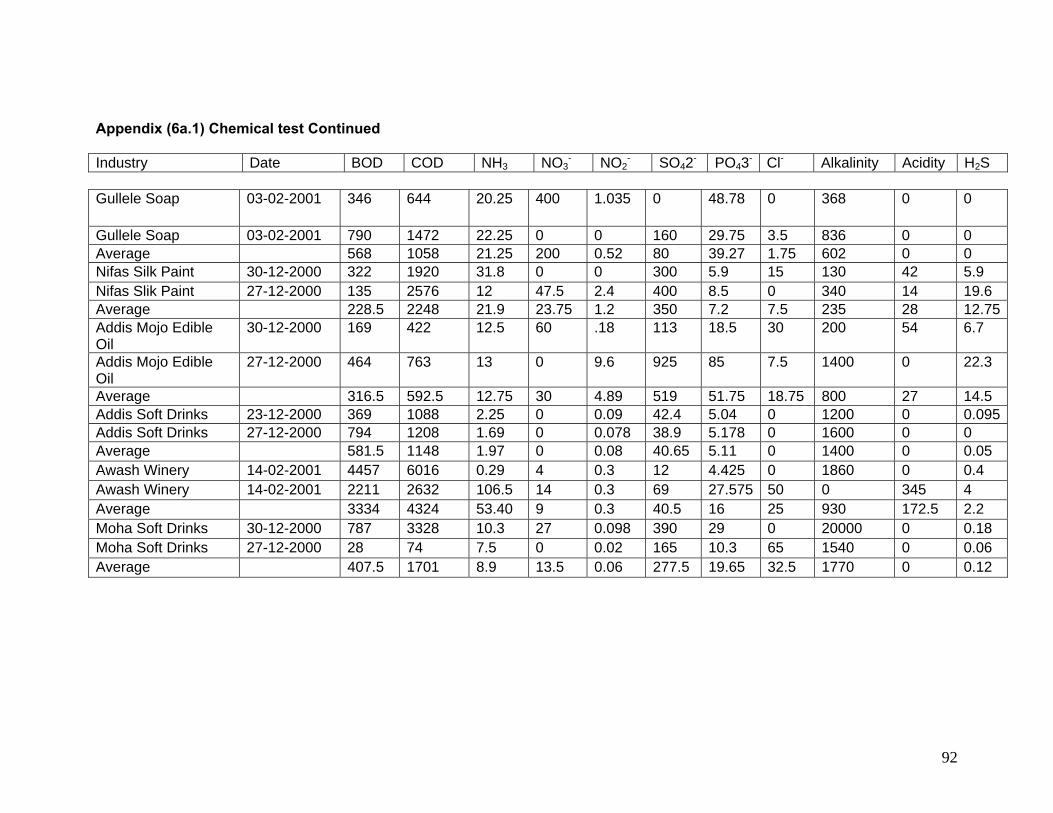
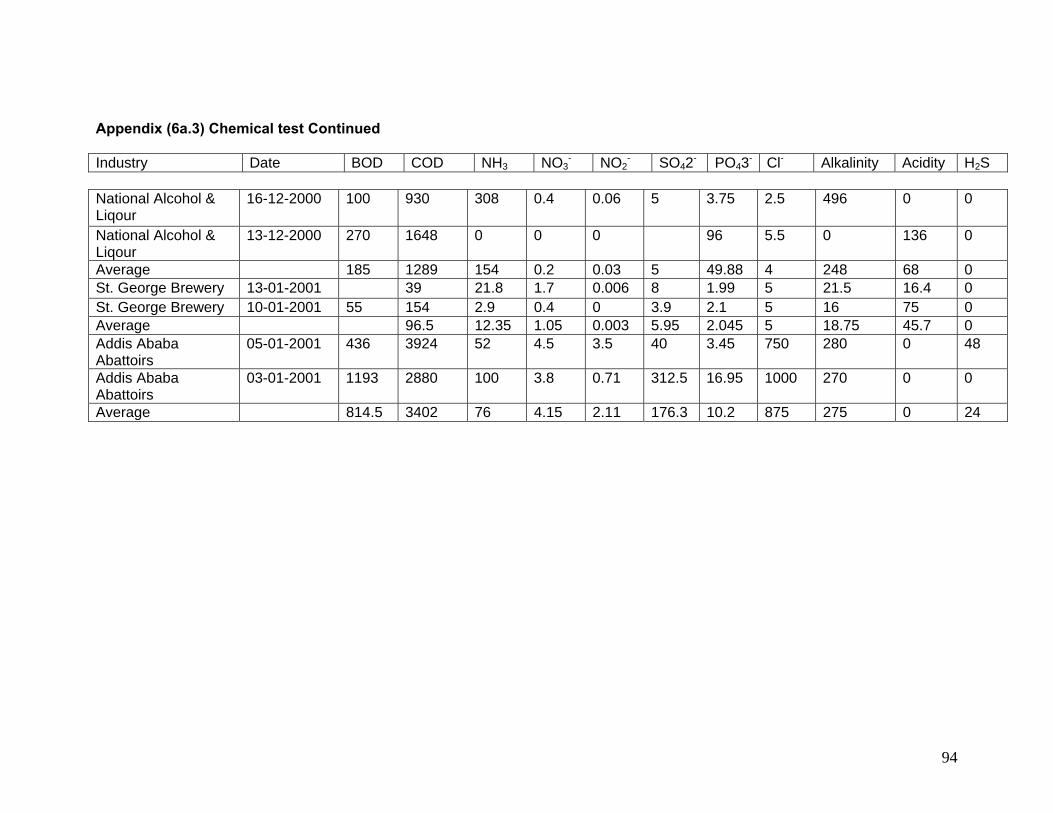
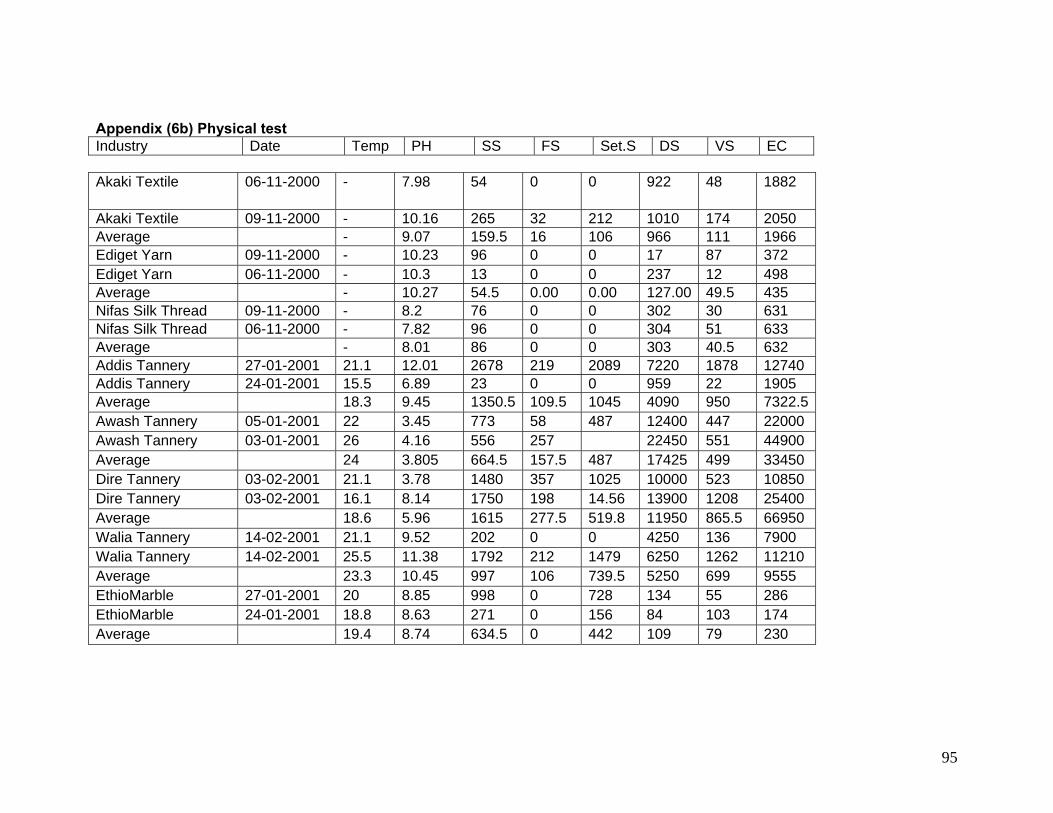
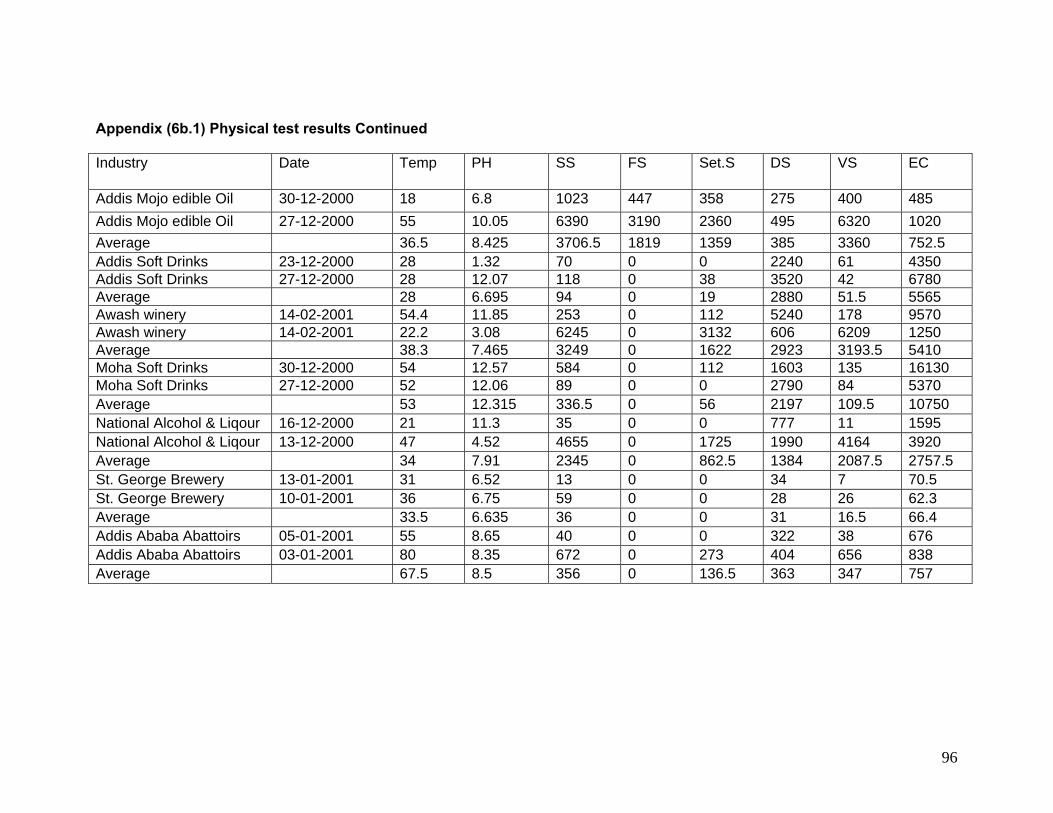
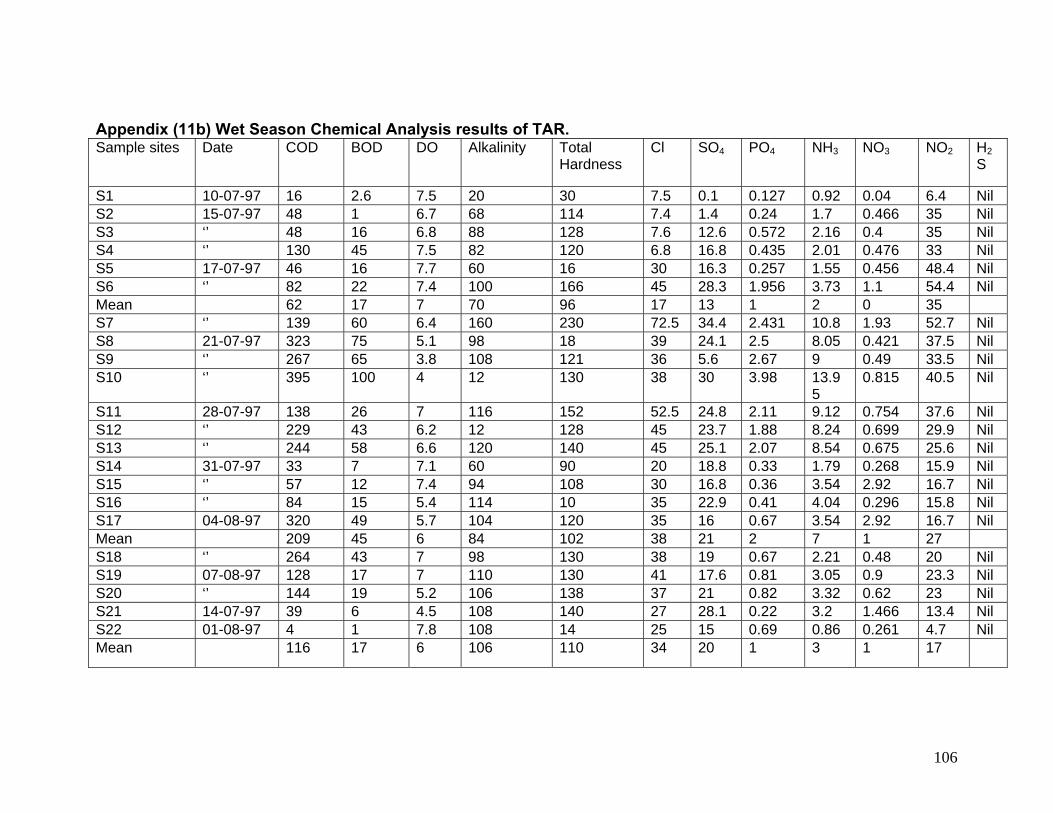
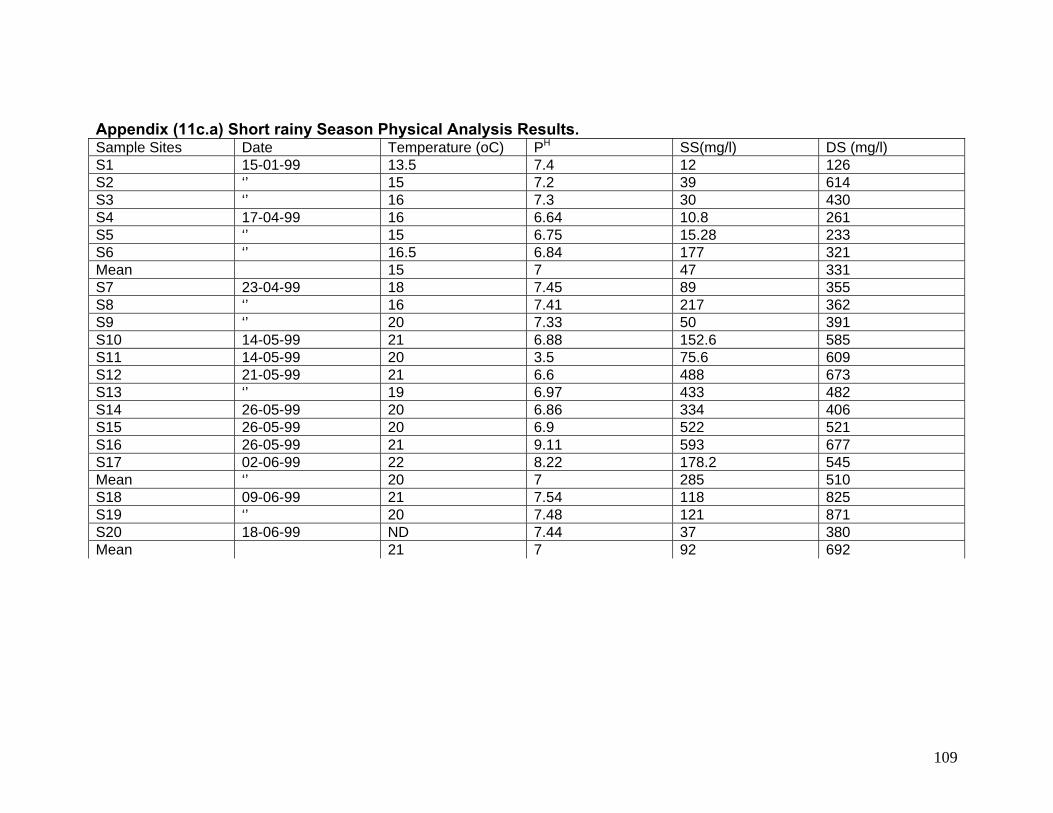
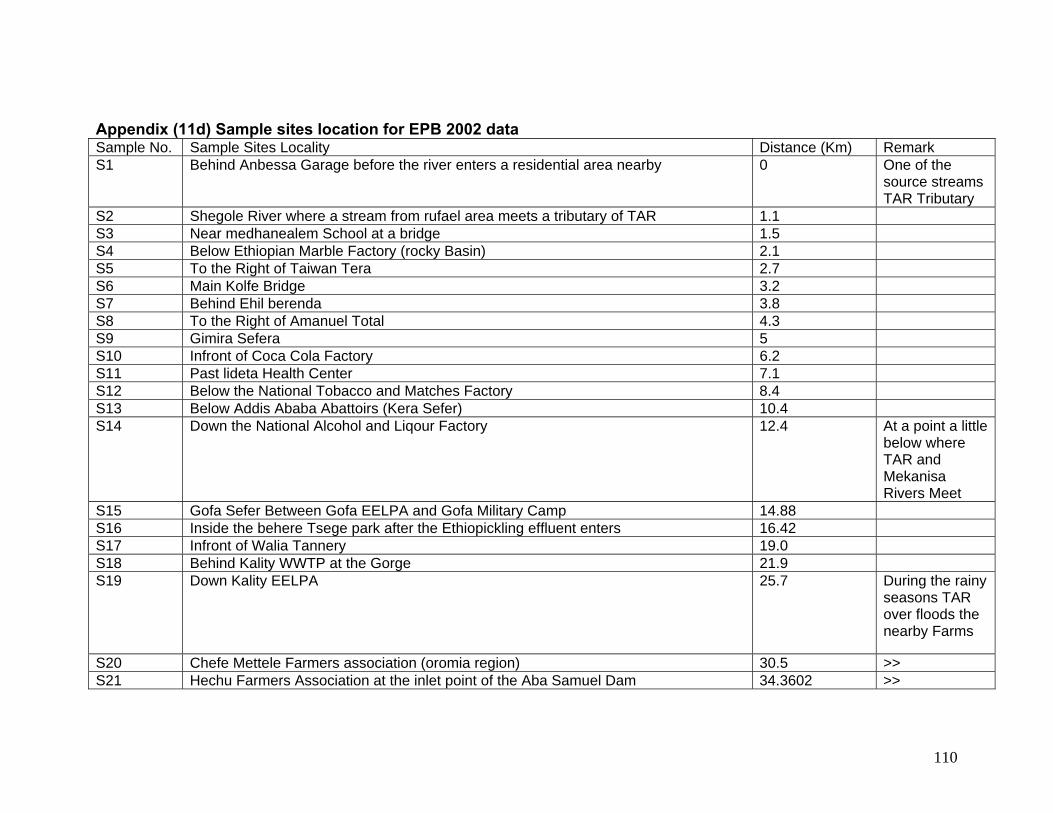
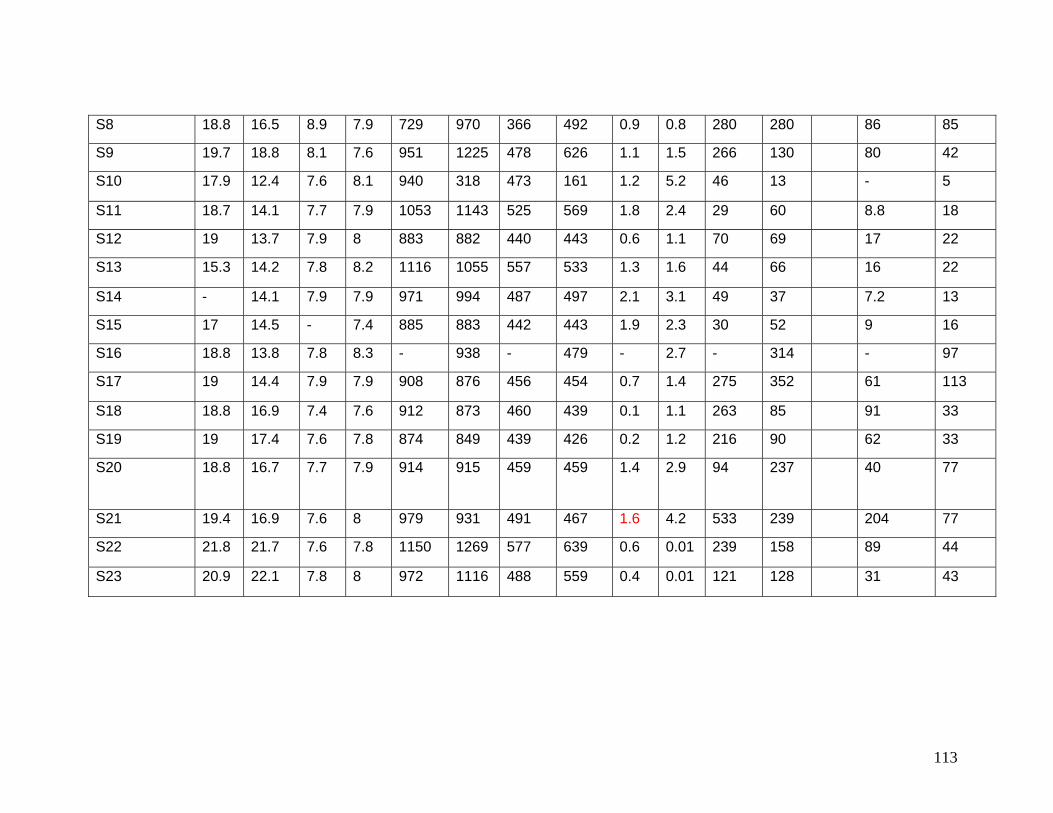
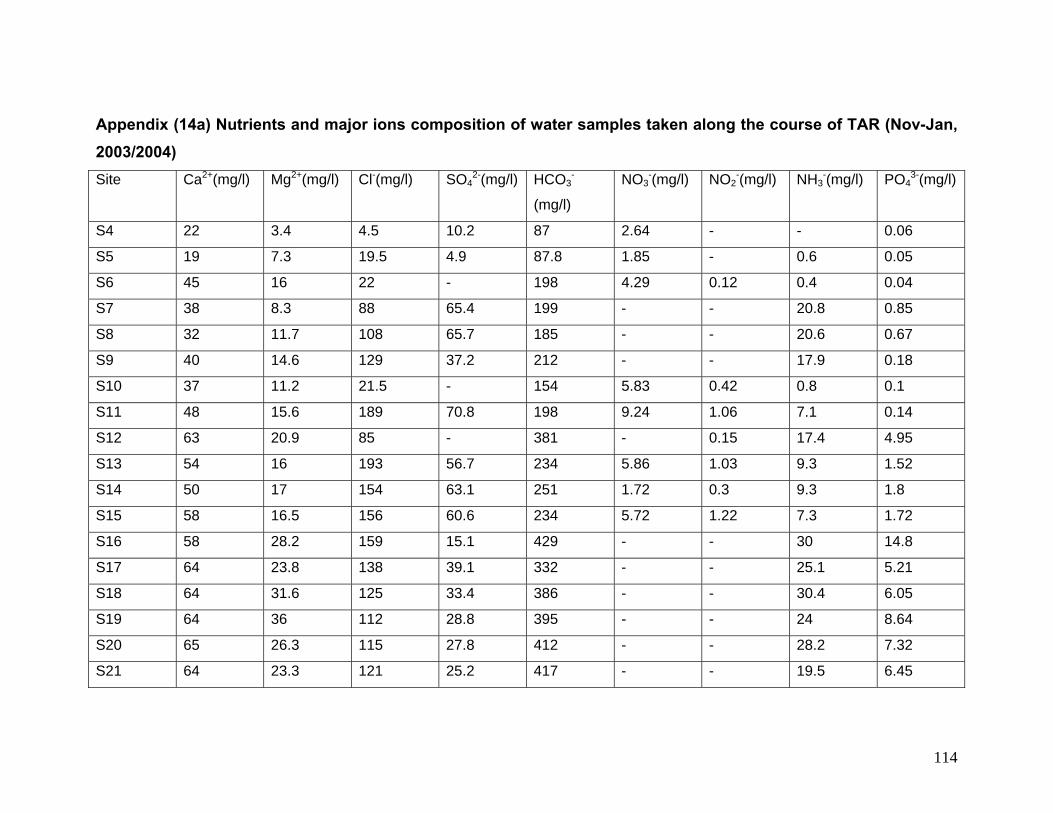
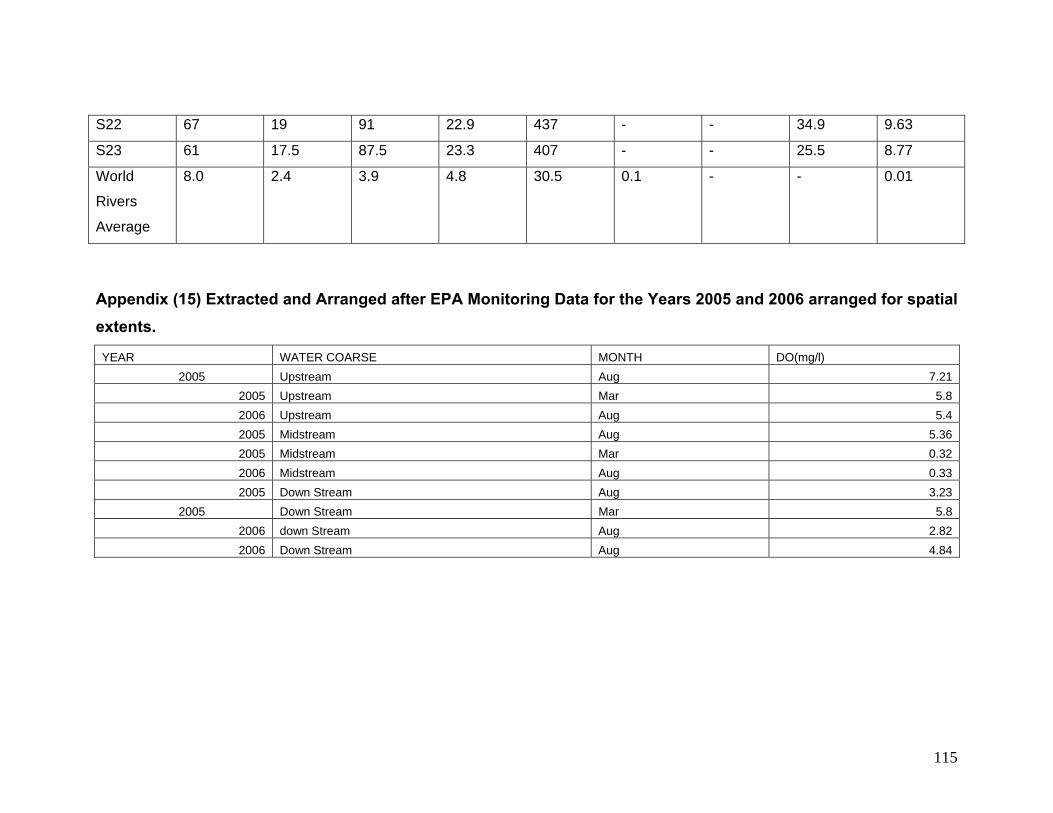
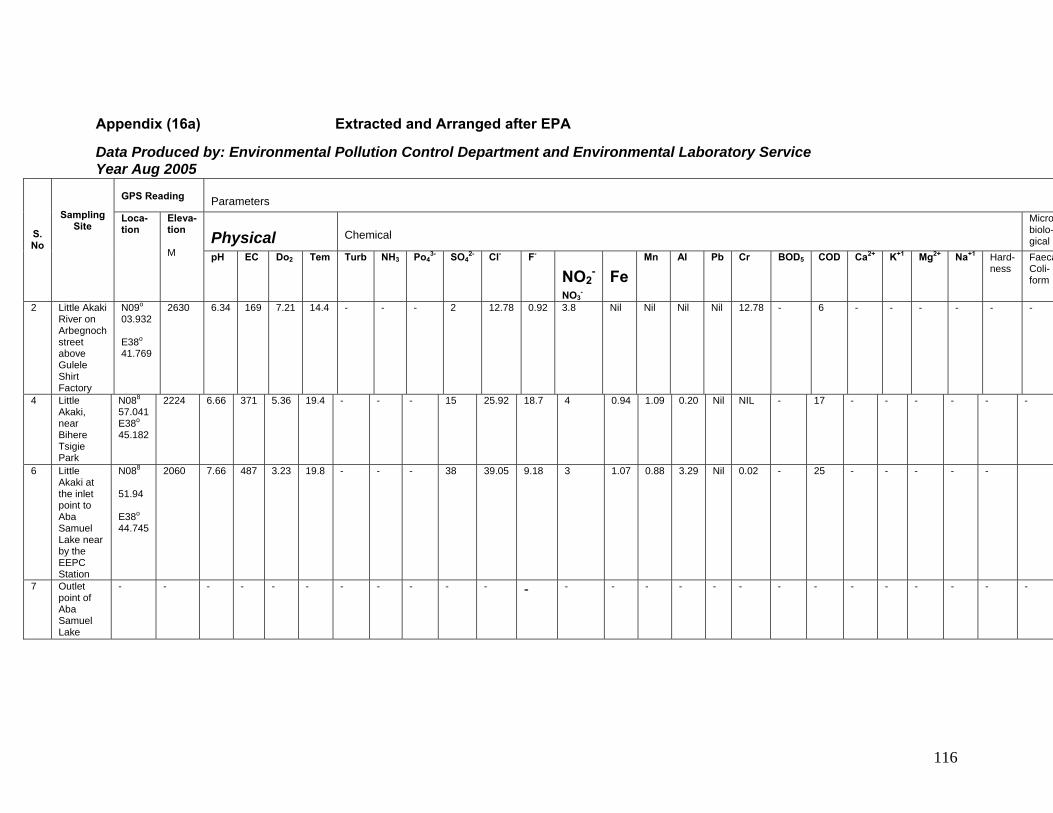
List of Appendices Pages Appendix (1) Monthly Rainfall Data for the Years (1975-2005) .....................83 Appendix (2) Mean Monthly Min Temperature…………………………………..84 Appendix (3) Mean Monthly Max Temperature..............................................85 Appendix (4) Main Industrial Point Sources in the Study Area and Its Surroundings. ...................................................................................................86 Appendix (5a) Selected Physico-Chemical Water Analysis Results 2007 ...88 Appendix (5b) Sampling Sites and Sample Id abbreviations 2007 ...............89 Appendix (6a) Industrial effluents discharged into the Tinishu Akaki River (Random Sampling) chemical test ..................................................................90 Appendix (6a.1) Chemical test Continued ......................................................91 Appendix (6a.2) Chemical test Continued ......................................................92 Appendix (6a.3) Chemical test Continued ......................................................93 Appendix (6b) Physical test .............................................................................94 Appendix (6b.1) Physical test results Continued...........................................95 Appendix (6b.2) Physical Test Result Continued...........................................96 Appendix (6c) Continued on selected Heavy Metals .....................................97 Appendix (7) Some of the Selected Industrial Effluents Physico-Chemical Characteristics ..................................................................................................98 Beverage Industries..........................................................................................98 Appendix (8a) EPB 2002 Industrial effluents Discharged in to the little Akaki River (Systematic Samples) .............................................................................99 Appendix (8b) Continued Chemical parameters in mg/l..............................100 Appendix (9) Pollution Load on Tinishu Akaki River and Its Tributaries ...101 Appendix (10) The in stream Water Quality Standard for selected parameters. .....................................................................................................101 Appendix (11a) Dry Season Chemical Analysis Results .............................102 Appendix (11a.a) Seasonal Water quality Analysis results of Little Akaki River Dry Season Physical Analysis Results ...............................................103 Appendix (11a.b) Dry season bacteriological Analysis Results .................104 Appendix (11b) Wet Season Chemical Analysis results of TAR.................105 Appendix (11b.a) Wet Season Physical Analysis Results...........................106 Appendix (11c) Short rainy Season Chemical Analysis Results ................107 Appendix (11c) Short rainy Season Chemical Analysis Results ................107 Appendix (11c.a) Short rainy Season Physical Analysis Results...............108 Appendix (11d) Sample sites location for EPB 2002 data ...........................109 Appendix (12) May 1999 .................................................................................110 Appendix (13) NOV&DEC, 2000 .....................................................................111 Appendix (14) Physico-Chemical Parameters of Tinishu Akaki River .......111 Appendix (14a) Nutrients and major ions composition of water samples taken along the course of TAR ......................................................................113 Appendix (15) EPA Monitoring Data for the Years 2005 and 2006 arranged for spatial extents. ..........................................................................................114 Appendix (16a) EPA Aug 2005 .......................................................................115
IX
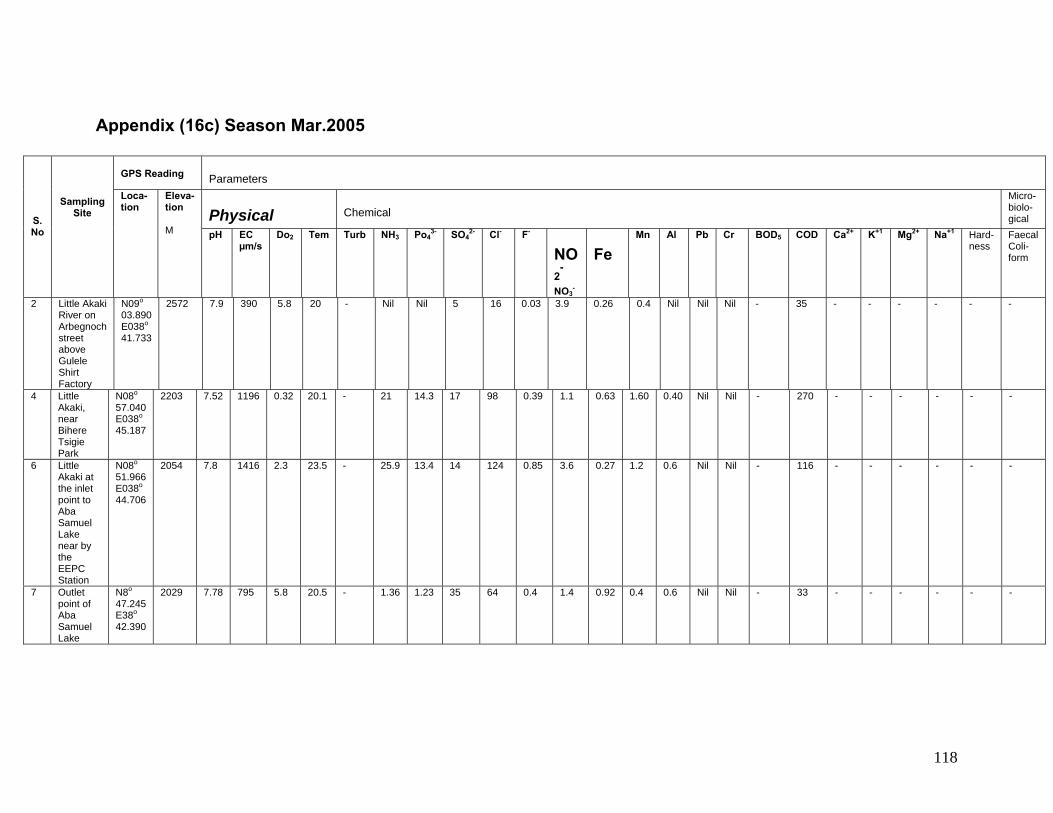
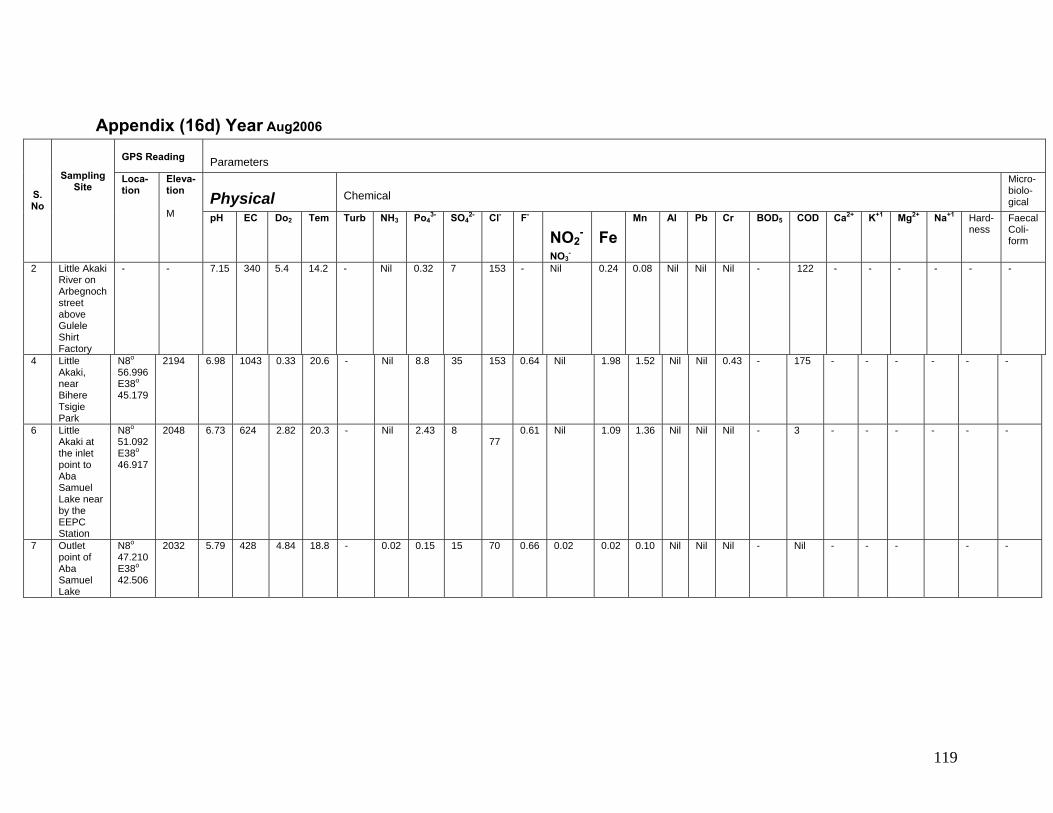
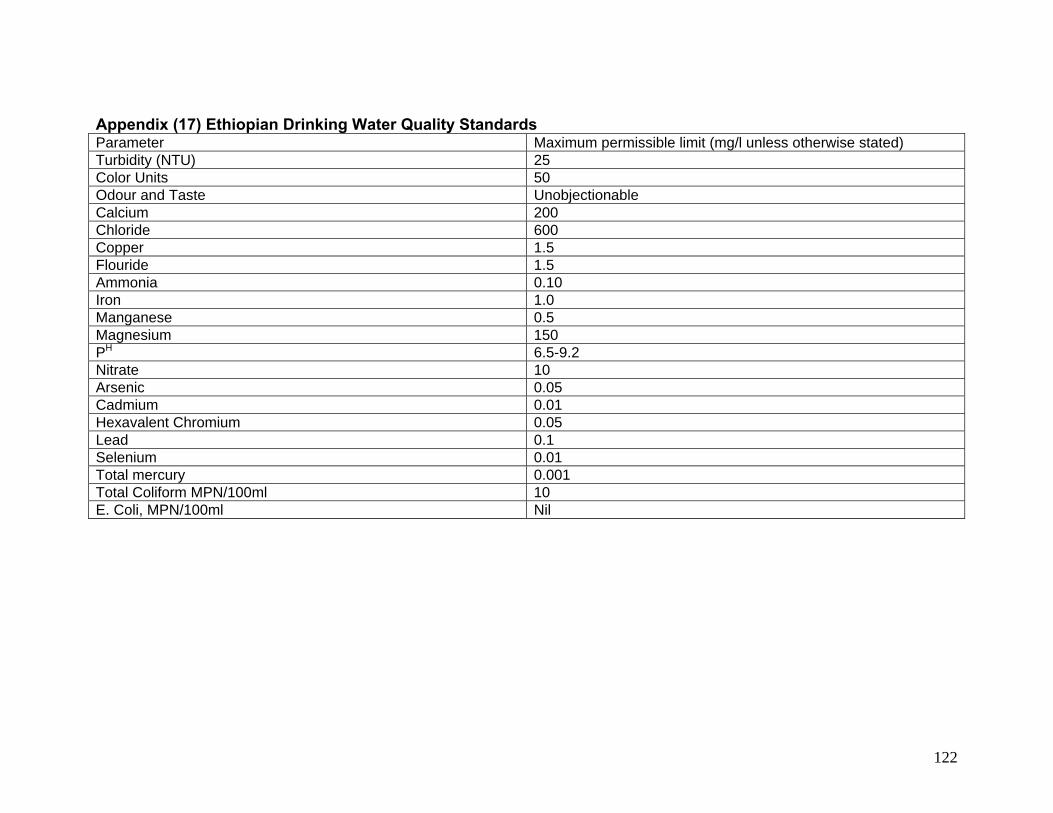
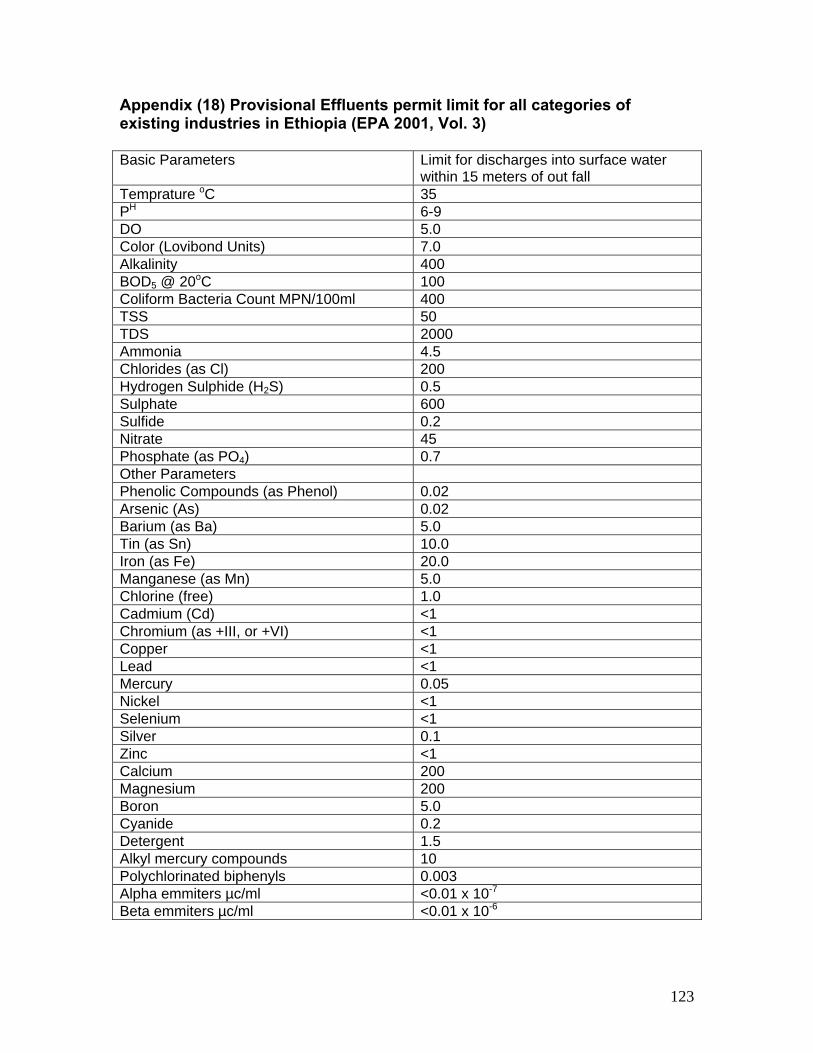
Appendix (16b) EPA Nov 2005 .......................................................................116 Appendix (16c) EPA Mar.2005........................................................................117 Appendix (16d) EPA Aug 2006.......................................................................118 Appendix (16e) EPA Nov 2006 .......................................................................119 Appendix (16f) EPA Mar 2006 .......................................................................120 Appendix (17) Ethiopian Drinking Water Quality Standards .......................121 Appendix (18) Provisional Effluents permit limit for all categories of existing industries in Ethiopia .......................................................................122
X
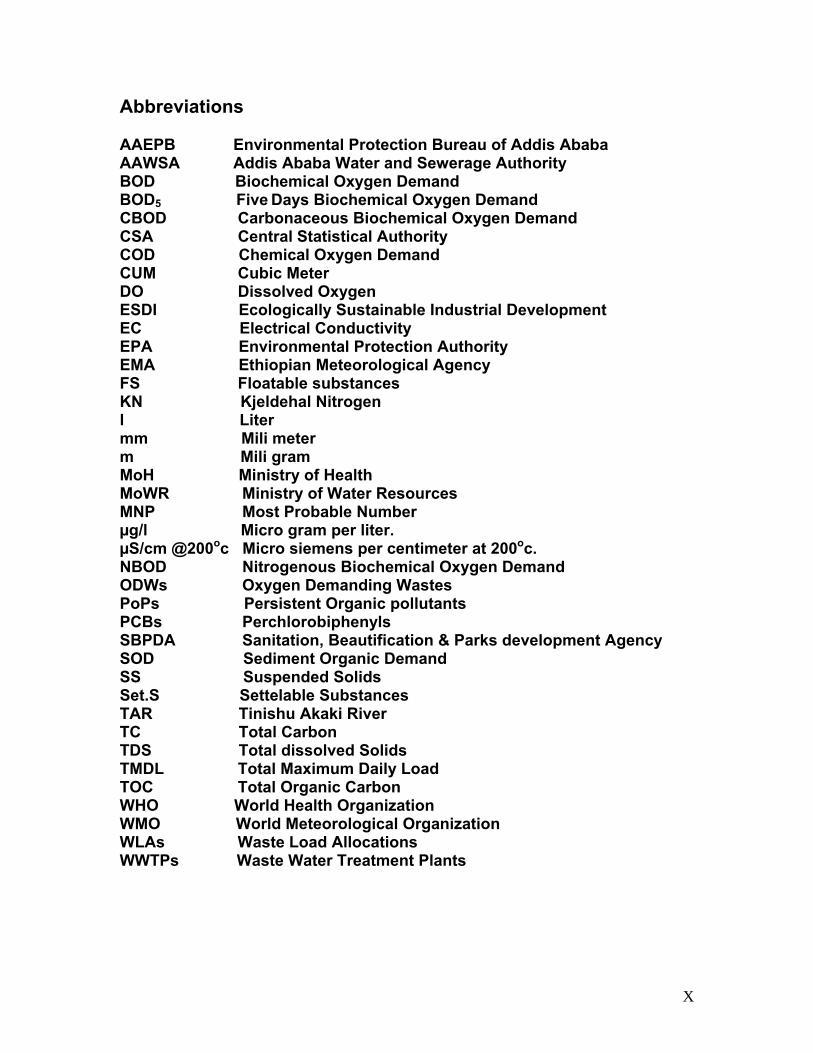
Abbreviations AAEPB Environmental Protection Bureau of Addis Ababa AAWSA Addis Ababa Water and Sewerage Authority BOD Biochemical Oxygen Demand BOD5 Five Days Biochemical Oxygen Demand CBOD Carbonaceous Biochemical Oxygen Demand CSA Central Statistical Authority COD Chemical Oxygen Demand CUM Cubic Meter DO Dissolved Oxygen ESDI Ecologically Sustainable Industrial Development EC Electrical Conductivity EPA Environmental Protection Authority EMA Ethiopian Meteorological Agency FS Floatable substances KN Kjeldehal Nitrogen l Liter mm Mili meter m Mili gram MoH Ministry of Health MoWR Ministry of Water Resources MNP Most Probable Number µg/l Micro gram per liter. µS/cm @200oc Micro siemens per centimeter at 200oc. NBOD Nitrogenous Biochemical Oxygen Demand ODWs Oxygen Demanding Wastes PoPs Persistent Organic pollutants PCBs Perchlorobiphenyls SBPDA Sanitation, Beautification & Parks development Agency SOD Sediment Organic Demand SS Suspended Solids Set.S Settelable Substances TAR Tinishu Akaki River TC Total Carbon TDS Total dissolved Solids TMDL Total Maximum Daily Load TOC Total Organic Carbon WHO World Health Organization WMO World Meteorological Organization WLAs Waste Load Allocations WWTPs Waste Water Treatment Plants
XI
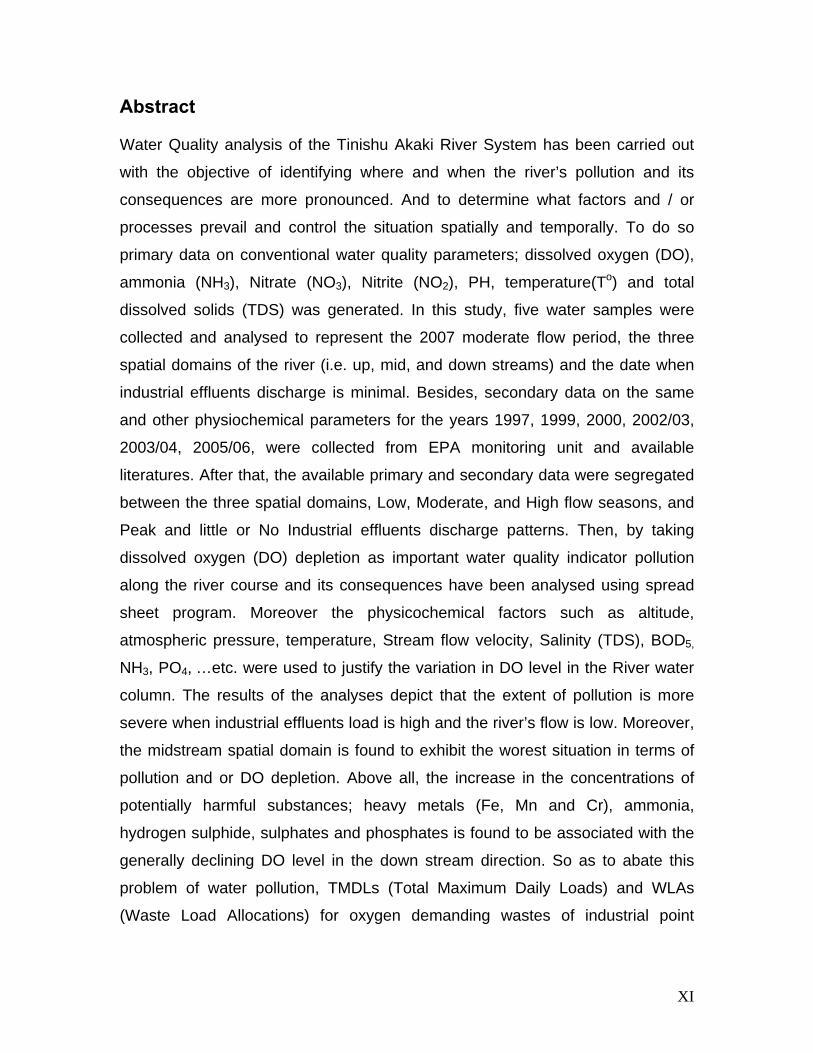
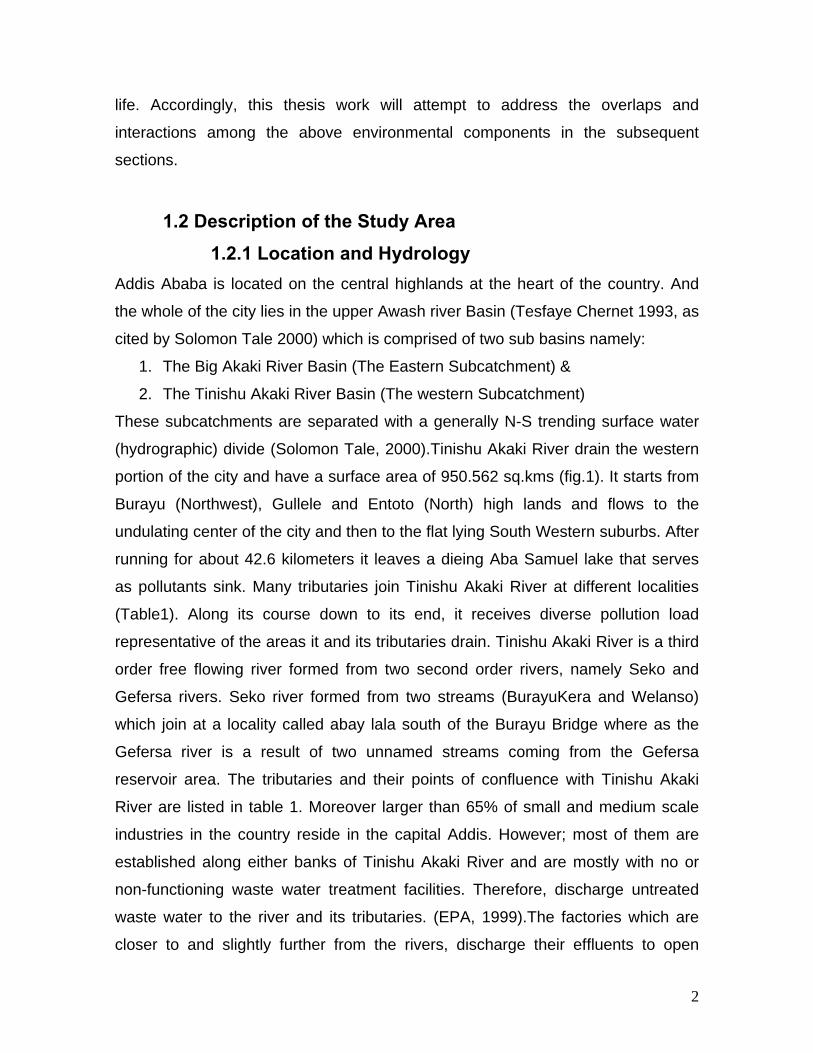
Abstract Water Quality analysis of the Tinishu Akaki River System has been carried out
with the objective of identifying where and when the river’s pollution and its
consequences are more pronounced. And to determine what factors and / or
processes prevail and control the situation spatially and temporally. To do so
primary data on conventional water quality parameters; dissolved oxygen (DO),
ammonia (NH3), Nitrate (NO3), Nitrite (NO2), PH, temperature(To) and total
dissolved solids (TDS) was generated. In this study, five water samples were
collected and analysed to represent the 2007 moderate flow period, the three
spatial domains of the river (i.e. up, mid, and down streams) and the date when
industrial effluents discharge is minimal. Besides, secondary data on the same
and other physiochemical parameters for the years 1997, 1999, 2000, 2002/03,
2003/04, 2005/06, were collected from EPA monitoring unit and available
literatures. After that, the available primary and secondary data were segregated
between the three spatial domains, Low, Moderate, and High flow seasons, and
Peak and little or No Industrial effluents discharge patterns. Then, by taking
dissolved oxygen (DO) depletion as important water quality indicator pollution
along the river course and its consequences have been analysed using spread
sheet program. Moreover the physicochemical factors such as altitude,
The Alaji group volcanic rocks (Alaji Rhyolite and Basalt) in this part of the
escarpment were outpoured from the end of Oligocene until middle Miocene
(Zanettin et al., 1974) as stated in Solomon Tale 2000. This unit is composed of
basalts, which show variation in texture from highly porphyritic to aphanitic. Within
this unit there is an intercalation of gray and glassy welded tuff. This unit outcrops
12
at the crest of Entoto-ridge bordering the northern parts of Addis Ababa
(Haileselassie Girmay and Getaneh Assefa, 1989). It is underlain by tuffs and
ignimbrites; on the other hand its stratigraphic relationship with the Entoto silicics
is difficult to determine as they occur in a fault contact. Mohr (1967); however,
proved that the Entoto trachyte overlies the Alaji basalt. The age of the rock is 22.8
M.Y (Morton et. al., 1979).
1.2.3A.2. Entoto Silicics
These early Miocene age silicic volcanics could represent localized terminal
episodes to massive Oligocene fissure basalt activity in the Addis Ababa region
(Morton et.al. 1979). The thickness of the flow become maximum on the top of
Entoto ridge and thin both towards the plateau and the plain east of Addis Ababa.
According to Zanettin and Justin-Visentin (1974) these lavas make up a thick pile
of flows accumulated along east west fissures (east-west fault running from
Kassam River to Ambo) and uplifted northwards. The unit is unconformably
overlain by Addis Ababa basalt on the foothill of Entoto and underlain by Alaji
basalt. The Entoto silicics composed of rhyolite and trachyte with minor amount of
welded tuff and obsidian (Haileselassie Girmay and Getaneh Assefa 1989). The
rhyolitic lava flows outcrop on the top and the foothills of the Entoto ridge,
predominantly in the western side. The thickness is quite variable as it frequently
forms dome structure. In this rock unit flow banding, folding and jointing are
common. The rhyolites are overlain by feldspar porphyritic trachyte and underlain
by a sequence of tuffs and ignimbrites. Tuffs and ignimbrites are welded and
characterized by columnar jointing. The rhyolite made up of phenocrysts of
plagioclase and altered rebeekite in a groundmass of glass with iron oxide. The
trachytic lava flows outcrop on the top of Entoto ridge and its foothills. It shows a
quite uniform texture, and is constituted by phenocrysts of oligoclase, sandine and
rebeckite within a groundmass of plagioclase, iron oxide and minor quartz and
mafic minerals. The Entoto silicics are dated 21.5my by Morton (1974) and 22 my
by Morton et al. (1979). Thus from the general stratigraphy established by Zaneitin
et al. (1974) both rhyolite and trachyte of the Entoto silicics belong to the “Miocene
13
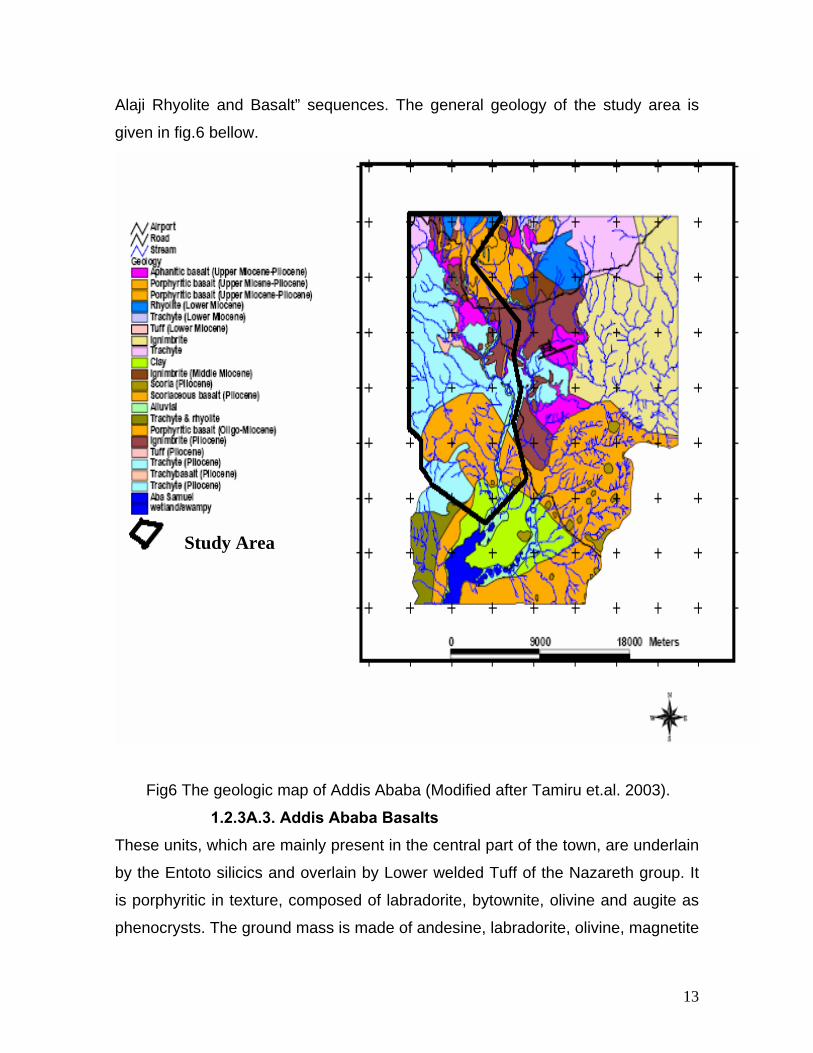
Alaji Rhyolite and Basalt” sequences. The general geology of the study area is
given in fig.6 bellow.
Fig6 The geologic map of Addis Ababa (Modified after Tamiru et.al. 2003).
1.2.3A.3. Addis Ababa Basalts These units, which are mainly present in the central part of the town, are underlain
by the Entoto silicics and overlain by Lower welded Tuff of the Nazareth group. It
is porphyritic in texture, composed of labradorite, bytownite, olivine and augite as
phenocrysts. The ground mass is made of andesine, labradorite, olivine, magnetite
Study Area
14
and pyroxene (Haileselassie Girmay and Getaneh Assefa 1989). Olivine
porphyritic basalts outcrop in the central part of the town that includes Mercato,
Teklehaymanote. The distribution of plagioclase porphyritic basalt is almost the
same as that of the olivine prophyritic basalt, but only little more northwards. It
outcrops in the study area, arround General Winget School. The thickness of the
former varies from 1m or less in the foothills of Entoto, Lideta Airfield and Filwoha
to greater than 130 meters at Ketchane stream (Morton, 1974; Varnier et al.,
1985). In the project area, the Lower Welded Tuff overlies both types of basalt
nearby the Building College, and the Kolfe Police School. The relation ship
between olivine and plagioclase poryphyritic basalts is very difficult to determine in
the study area except that the former overlays the latter at one place elsewhere
(Varnier et al., 1985). Addis Ababa basalt yield ages clustering around 7my and
seams to have no time /composition equivalent (Morton et al., 1974).
1.2.3A.4. Nazareth Group
The units identified in this group denoted as Lower Welded Tuff, Aphanitic basalt
and Upper Welded Tuff. The group is underlain by Addis Ababa basalt and
overlain by Bofa basalts. The rocks outcrop mainly south of Filowha fault and
extend towards Nazareth.
1.2.3A.4.1 Lower Welded Tuff
This rock outcrops as small discontinuous body in Filwoha, western parts of Addis
Ababa and Sululta. It is glassy with abundant fiamme and has columnar joints.
Generally it is overlain by the aphanitic basalt and underlain by the olivine and
plagioclase prophyritic basalts. The age of this rock as dated by Morton et al.
(1979) at Addis Ababa and Sululta is 5.1 and 5.4 million years respectively. This
age overlap with the period of the activity of Wachecha trachyte volcanoes, dated
4.6 million years. Wachecha is located 15 km west of Addis Ababa and probably
the sources of the Lower welded tuff at both localities (Morton et al., 1979).
15
1.2.3A.4.2 Aphanitic Basalt This basalt covers the southern part of the town, especially the areas of Lideta
Airfield. The rock body shows vertically curved columnar jointing together with sub-
horizontal sheet jointing. Lenses of Kaolin are present at the contact of this basalt
with the younger ignimbrite. This is a sure evidence for the hydrothermal
alterations along a NE-SW fracture system, which may affects both the basalt and
the Entoto trachyte. Moreover the basalt is overlain by pumeacoues pyroclastic
falls and the pyroclastic falls. It is underlain by a soil horizon that covers the
plagioclase porphyritic basalt and overlain by soil horizon and tuff layers that lie
below the young ignimbrite. It consists of: Labradorite, augite, rarely olivine and
magnetite. The crystals of plagioclase show marked flow alignments. The age of
the basalt in Addis Ababa ranges from 3.4 to 3.6 million years (Morton, 1974).
Trachy-basalt outcrops around Repi and nearby General Wingate School. It is
underlain by the plagioclase and olivine porphyritic basalt and overlain by the
younger ignimbrite from which it is separated by tuffs and agglomerates. Its
relation with the rocks of the group is not clear, but probably younger than the
aphanitic basalt (Getaneh et al., 1985). Moreover, phenocrysts that occur mainly in
the rock are: sandine, labradorite, magnetite and augite.
1.2.3A.4.3 Upper Welded Tuff
This rock outcrops all over the southern part of the study area including Nefas Silk
and Railway station; nevertheless it is also present in the central and northern
parts of the town. It is gray colored, vertically and horizontally jointed and
composed of sandine, an orthoclase, rebekite, quartz, pumice and unidentified
volcanic fragments (Getaneh Assefa et al., 1989). The welded tuff is underlain by
aphanitic basalts and overlain by young olivine basalts. An age determinations
made on a sample collected near by Haille Gebreselassie road resulted 3.2 million
years, that overlap with the activity of Yerer trachytic volcanoes (Morton et.al.,
1979).
16
1.2.3A.4.4 Young Trachyitic Flow This rock predominates the southwestern parts of the study area, from Dama hotel
towards Furi and Repi along the hills and foothills of Hana Mariama and Tulu Iyou.
It is porphyritic with phenocrysts of plagioclase (albite-oligoclase) sandine, biotite
within a groundmass of microlites of feldspar. Moreover, it is underlain by the tuff
that covers the young ignimbrite and overlain by alternating flows of plagioclase
porphyritic basalt and rhyolite especially in the Repi hill. Its relation with the young
olivine prophyrytic basalt is not clear as they outcrop in different parts of the areas;
however, in a small outcrop nearby Aba Samuel Lake south of the project area,
the trachyte underlies the olivine porphyritic basalt.
1.2.3A.5 Young Olivine Porphyritic (Bofa) Basalt They outcrop southward from Akaki River where they appear in the form of
boulders reaching a thickness of 10 meter. They are restricted and dominant in the
southeast part of the town i.e. Debre Zeit Road. They contain phencorysts of
plagioclase, olivine that is partially and completely altered to iddingisite and augite
within a groundmass composed of plagioclase, magnetite, pyroxene and olivine.
This basalt is underlain by the tuffs, which cover the welded tuff. The age of this
basalt is 2.8 My.
1.2.3B. The Geologic Structures The genetic or post genetic features that appear within or on a geologic material
play an important role in controlling the interaction between the surface and
ground water systems by facilitating exchange of matter. Instances of ground
water contamination with Cr and Cd in the industrial and highly urbanized centers
of the has been associated fractures, joints and related preferential flow paths
(Demlie et.al. 2006). In the project area the occurrence of faults, joints and other
structures within the different Volcanic rocks were reported by different authors.
Long fault line running east west via Kassam river, Addis Ababa and Ambo, cut
across the western rift escarpment and uplifted its northern block (Zanettin et al.,
1978) at about 8 My ago. This fault marks the upper (outer) boundary of the
17
western Ethiopia Rift margin immediately north of Addis Ababa-Ambo road
(Zanettin et al., 1974). The Entoto silicics confined along this fault and form a
ridge. This ridge bounded the city in the northern direction. The fault has a down
throw to the south in the Addis Ababa area (Haileselassie Girmay, 1989). Another
prominent normal fault in the city is the Filowha Fault. This fault has a trend of NE-
SW (Kundo, 1958; Morton, 1974; Haileselassie Girmay, 1989). The fault has a
northwest down thrown side according to Morton (1974). However, Haileselassie
(1985) carried out detail mapping of the Filowha Fault using resistivity method and
found that the fault has down thrown to the south, shallow depth and covered by
very thin soil layer (1-4m).Haileselassie Girmay (1989) found that the fault is not
vertical and its throw can be estimated to be about 40m, which is approximately
the thickness of the welded glassy ignimbrite. This fault has acted as a dam to the
welded glassy ignimbrite, but not to the basalt as it was assumed previously. For
this reason there is quite different geology in the south and north parts of the area.
Thus, the age of the fault may be bounded by 5.0My (the age of the welded glassy
ignimbrite) and 6.4My (the age of plagioclase-poryphyritic basalt). Kundo (1958)
proposed that the hot springs in Filowha are controlled by this fault. The presence
of hot springs, south of the fault gives resistivity contrast on the either side of the
fault.The Filowha fault, having a trend of N55OE (Haileselassie Girmay, 1989) is
thought to be a major NE fault that continues up to Debre Berehan (Mohr, 1964).
Moreover, Al consult (1996) satellite images interpretation map indicates the
continuation of the Filowha fault towards the southwest periphery of the city in the
same direction. Morton (1974) map shows four other north-east trending faults,
which have south-west or north-west down thrown side. The other major structural
features in the study area are joints, which have different spacing, opening and
orientation. The dominant preferred orientation of joints occurring in different rock
units is NNE-SSW (Kebede et al., 1990), which is sub parallel with the general
trend of rifting. They found joint spacing of 15-200 cm (in most basalts), 5-100 cm
(in trachy basalt, trachyte and rhyolite) and 2-100 cm (in ignimbrite).
18
1.3 Water use and supply The increasing demand and all kinds of use of water have a potential to affect the
quantity and quality of the available resource base in an area. Such dual impacts
of growing demand and use of water has been observed in the study area. And
can be associated with rapid population growth and intense socioeconomic
activities. The study area is consisted of six subcities and few peasants
associations in the up and down stream peripheries. Each sub city has an average
population size of 300,000 people (Tamiru et.al, 2003) and they are, Akaki Kality,
Addis Ketema, Kolfe Keraneao, Gullele, Lideta, and Nifas Silk Lafto. The total
population in the above sub cities alone comprises more than 53% of the
population in the capital Addis Ababa. Projections made excluding immigrations
and based on the 1994 census estimated the population size of the city for the
year 2005 to be around three million. However, the city currently has a population
size of over 3 million.
And according to AAWSA, 80% of the water supply for the city is from the three
surface water reservoirs (i.e. Geffersa, Dire, and Legedadi). But, only 80% of the
population relies on good quality surface water for drinking, fire fighting and
sewage disposal (Girma Tadesse, et.al.2005).This implies that the remaining
significant population of the city and the peripheral society is forced to use unsafe
river water for various purposes. Moreover, many industries as well as some
farmers who irrigate or water livestock all depend on large quantities of good
quality surface water (Ijgneh Sime 1998) as cited in Girma et.al 2005.
Consequently add to the quality problems in the surface water bodies and thus
pose scarcity. The requirement for potable water to satisfy all demands plus
unaccountable loses for the year 2010 was estimated to average 1,105,000m3/day
(Table 7). That would increase demands on the existing three dams, springs and
Akaki wells with current supplying capacity of 173,000 m3/day, 10,000 m3/day and
30,000 m3/day respectively.
19
Table 7 Projected potable water demand for Addis Ababa city (Girma Tadesse, et.al.2005). Year Population Projection Potable water
Demand (m 3/day)
2004
2010
2020
3060000
3830000
5570000
380000
565000
1105000
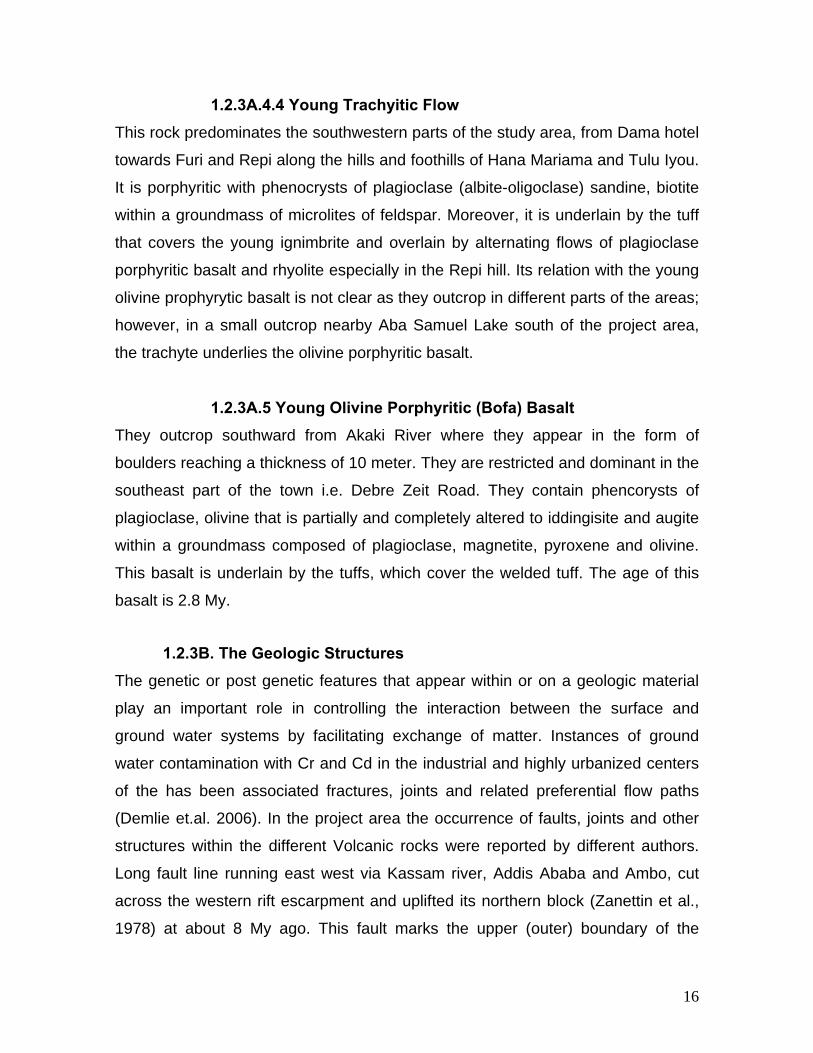
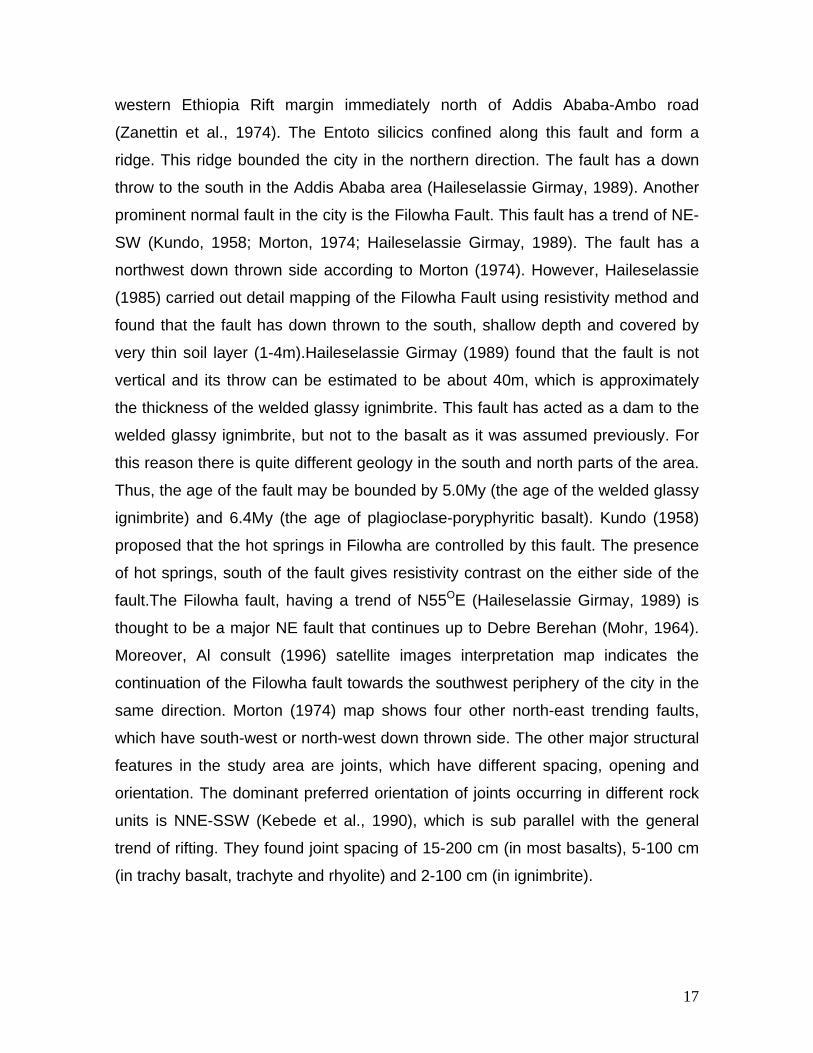
1.4 The Importance of Tinishu Akaki River (TAR)
Despite the fact that Tinishu Akaki River is a recipient of unsorted domestic and
untreated industrial, municipal, commercial, clinical and other types of wastes
(solid and liquid), it is being utilized by a peripheral population for irrigation
purposes (Table 8). Moreover a significant number of people use this river and its
major tributaries for washing vegetables, clothes, livestock watering, bathing and
even for drinking purposes in and around the city Figs (7a-7d).
Fig. 7b People using TAR for bathing.
20
Figure 7a People Using TAR water for dumping domestic solid waste.
Fig. 7c People Discharge toilet and domestic waste water to TAR.
21
Fig. 7d Residents using TAR water for Irrigation.
Table 8 Urban Irrigation with Tinishu Akaki and Its Tributaries (extracted From Tadesse et.al. 2004). Name of scheme
River Districts Irrigated Area (ha)
Shankla Ena Kacha Fabrica
Shankla Coca Cola Fabrica
8.5
Tinshu Akaki Ena Keranio
T. Akaki Keranyo 7.5
Tinshu Akaki Mekanisa Goffa & Furi Saris
T. Akaki
Goffa Sefer 150
Kolfae Ena Lideta
T. Akaki Kolfae 51
Total 217
22
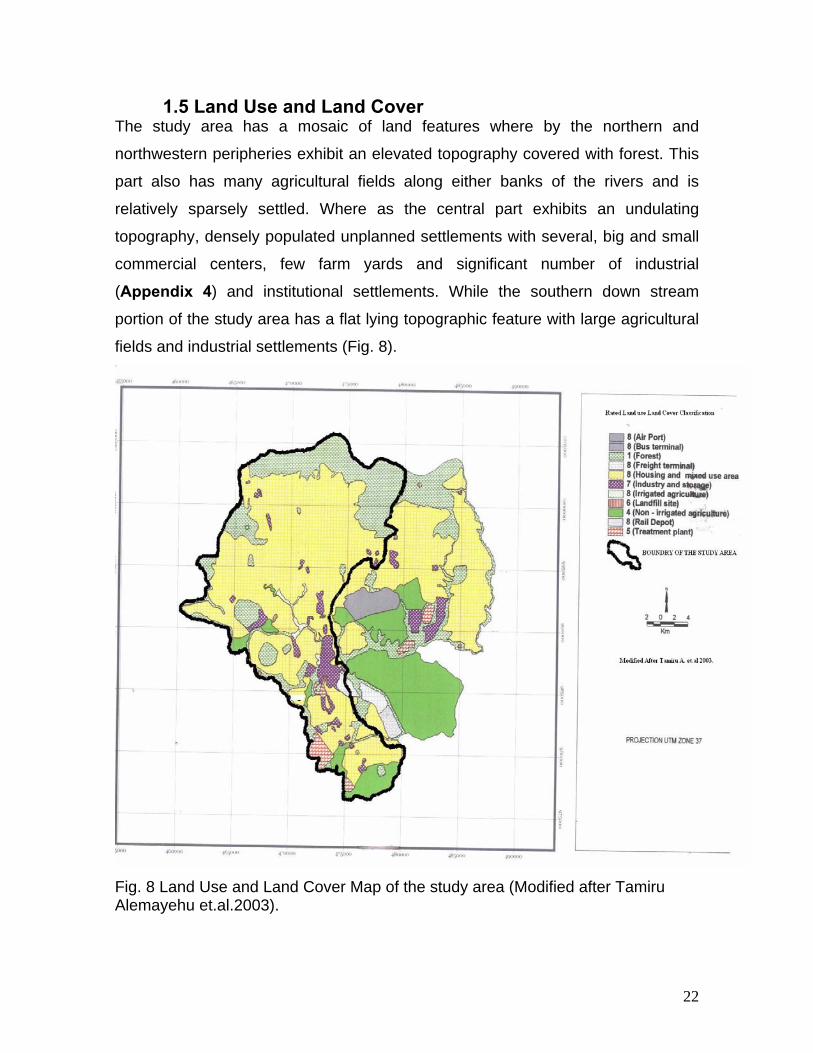
1.5 Land Use and Land Cover The study area has a mosaic of land features where by the northern and
northwestern peripheries exhibit an elevated topography covered with forest. This
part also has many agricultural fields along either banks of the rivers and is
relatively sparsely settled. Where as the central part exhibits an undulating
topography, densely populated unplanned settlements with several, big and small
commercial centers, few farm yards and significant number of industrial
(Appendix 4) and institutional settlements. While the southern down stream
portion of the study area has a flat lying topographic feature with large agricultural
fields and industrial settlements (Fig. 8).
Fig. 8 Land Use and Land Cover Map of the study area (Modified after Tamiru Alemayehu et.al.2003).
23
1.6 Statements and Justifications of the Problem Tinishu Akaki River mainly flows in the premises of Addis Ababa city and in the
surrounding peasants associations of the Oromia regional and national state. The
western, southern and southwestern parts of Addis Ababa are among the highly
populated urban as well as industrial centers in the country (Appendix 4).
Consequently a considerable amount of waste is generated every day from
different sources. Since the city has inadequate and inefficient waste (solid and
liquid) management facilities, all point and non point sources in the study area
discharge their effluents directly or indirectly to the nearby rivers and streams. In
addition to this, wastes dumped on an open ground join the river after a while via
surface runoff. On the other hand industries located in the TAR basin discharge
their effluents with no treatment. Therefore, the poor sewerage system, uses of old
technology, low level of awareness on waste management, weak enforcement
mechanisms on pollution prevention and control and low level of income of the city
dwellers have aggravated the pollution problem of the TAR. In order to solve the
problem, efforts should be directed to wards understanding of How this riverine system functions? And answering questions like; what factors govern the situation, Is there some kind of spatio-temporal trend? And what can be done? This thesis work will attempt to answer these questions. Most previous
studies in the project area had broad objectives and attempted to assess the
potential and quality of water resources in a greater geographic extent and have
been dealing with almost all sources of waters including springs, rivers, ground
and reservoirs for the whole of the city, giving lesser emphasis to a particular
water resource type and commonly end up in shallower discussions of either of a
water resource (river, reservoir, …etc.). Moreover, deeper investigation of the
hydrogeology unlike the hydrology is the common feature of most previous works.
However; in this study an important water quality indicator dissolved oxygen (DO),
and conventional parameters such as TDS, NH3, NO2, NO3, BOD along with
important physical factors for TAR will be environmentally analyzed and the
possible sources and sinks of a particular water quality parameter are utilized to
take into account the spatial and temporal variations in DO patterns and its effects.
24
1.7 Literatures Review Connell and Miller, 1984 have defined DO as the amount of oxygen contained in
water, and as a thing that defines the living conditions for oxygen-requiring
(aerobic) aquatic organisms. Moreover, they stated that the solubility of oxygen in
water is usually limited, ranging from 6 to 14 mg L -1.
However, Susan and Joy 1998 indicated that temperature, salinity of the water and
the partial pressure of the gas in contact with the water to be the common factors
by which the Oxygen’s inherent solubility in water is affected.
Connell and Miller, 1984 also explained that DO concentrations reflect an
equilibrium between oxygen-producing processes (e.g. photosynthesis) and
oxygen-consuming processes (e.g. aerobic respiration, nitrification, chemical
oxidation), and the rates at which DO is added to and removed from the system by
atmospheric exchange (aeration and degassing) and hydrodynamic processes
(e.g. accrual/addition from rivers and tides vs. export to ocean).
But, dissolved oxygen consumption and production are found to be subject to
diurnal and seasonal variation and are influenced by plant and algal biomass, light
intensity and water temperature (because they influence Photosynthesis), as
stated by (Connell and Miller, 1984).
And its level in a water supply is indicative of the concentrations of nutrients and
organic matter in the water (Susan and Joy 1998).
Besides, Clevland J. 1998, Indicated DO as the best indicator of the health of a
water ecosystem.
Additionally (Hem 1989) identified DO as a significant factor in chemical reactions
in water and the survival of aquatic organisms.
25
He also indicated the possibility of its depletion by inorganic oxidation reactions.
Or by biological and chemical processes that consume dissolved, suspended, or
precipitated organic matter (Hem, 1989).
However, (Mills et. Al.1979) had linked the biologically oxidizable materials that
exert an oxygen demand on water resources with many wastes discharged into
the waterways.
Mills et. Al.1979 Also associated DO depletions with occurrences of excessive
CBOD and NBOD loadings coupled with high temperature and low flow conditions.
Nemerow, 1974; Tchobanoglous and Schroeder, 1985 as cited in (Delzer &
McKenzie 2003) defined Oxygen demand as a measure of the amount of
oxidizable substances in a water sample that can lower DO concentrations.
Delzer & McKenzie 2003 then defined biochemical or chemical oxygen demand as
measure of the decay of organic matter in water. They ((Mills et. Al.1979), (US
EPA, 2001) & (Delzer & McKenzie 2003)) also subdivided this biochemical oxygen
demand (BOD) into carbonaceous (CBOD) and nitrogenous (NBOD) components.
Besides (Mills et. Al.1979)25 had approximated the following reaction for CBOD
which represents the amount of oxygen required by bacteria to stabilize organic
The sampling was made in such a way that one composite sample comprised of
four samples each with 250 ml size, three samples each with one litter size and
another one litter sample were collected to represent the upstream (sources) , the
Midstream and the down stream portions of TAR and its tributaries respectively
(Appendix 5b).
These samples also represent the date where there was little or no industrial
effluents discharge which is one of the two extreme discharge scenarios.
Moreover, onsite field observations and recording with the aid of PH-Meter, photo
camera, topographic map and GPS was made, then compiled and analyzed with a
spreadsheet program.
36
4. MAJOR SOURCES OF POLLUTANTS The first step in the water quality analysis of a river system is the identification and
characterization of wastes emanating from various pollution sources. Both natural
and anthropogenic activities can contribute to the pollution of a given water body.
However, in a river system that drains an industrial, highly populated and socio
economically vibrant urban centers like Tinishu Akaki River, the relative effects of
anthropogenic activities in deteriorating the quality of the water exceed by far the
natural causes.
The idea of sustainable development urges every socioeconomic activity of a
nation to have an environmental consideration. Unfortunately, in most developing
countries including Ethiopia, this has not been the concern of the government in its
economic progress endeavor until recently. As a result every sector has been
involved one way or another in deteriorating the environment, particularly the
quality of water bodies. This coupled with little or no environmental management
practice worsen the situation in the capital Addis Ababa, the country’s socio-
political and economic center. Based on field visits, available documents and
analytical results the following entities and or activities are identified as potential
sources of pollutants in the study area and their typical contaminant characteristics
are discussed in the subsequent sections.
Industries
Agricultural Activities
Garages
Health and Pharmaceutical centers
Municipal Dump sites
Fuel stations
Market centers
Mining quarries and
Cemeteries.
37
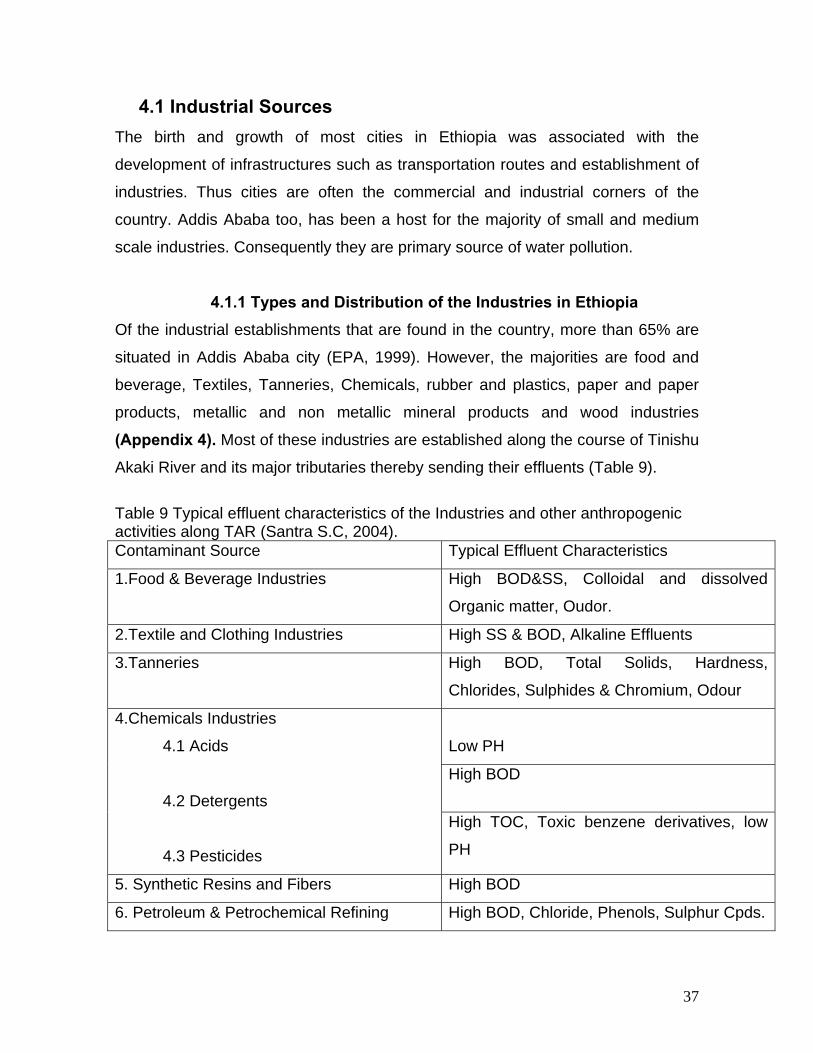
4.1 Industrial Sources The birth and growth of most cities in Ethiopia was associated with the
development of infrastructures such as transportation routes and establishment of
industries. Thus cities are often the commercial and industrial corners of the
country. Addis Ababa too, has been a host for the majority of small and medium
scale industries. Consequently they are primary source of water pollution.
4.1.1 Types and Distribution of the Industries in Ethiopia Of the industrial establishments that are found in the country, more than 65% are
situated in Addis Ababa city (EPA, 1999). However, the majorities are food and
beverage, Textiles, Tanneries, Chemicals, rubber and plastics, paper and paper
products, metallic and non metallic mineral products and wood industries
(Appendix 4). Most of these industries are established along the course of Tinishu
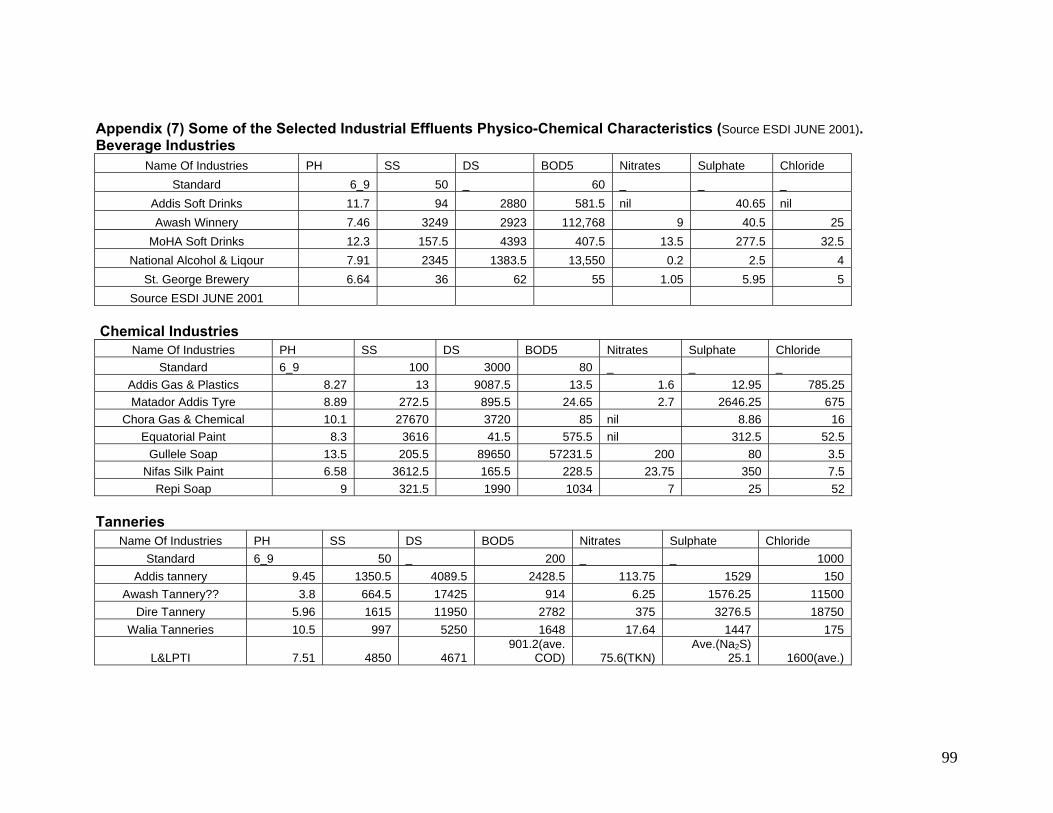
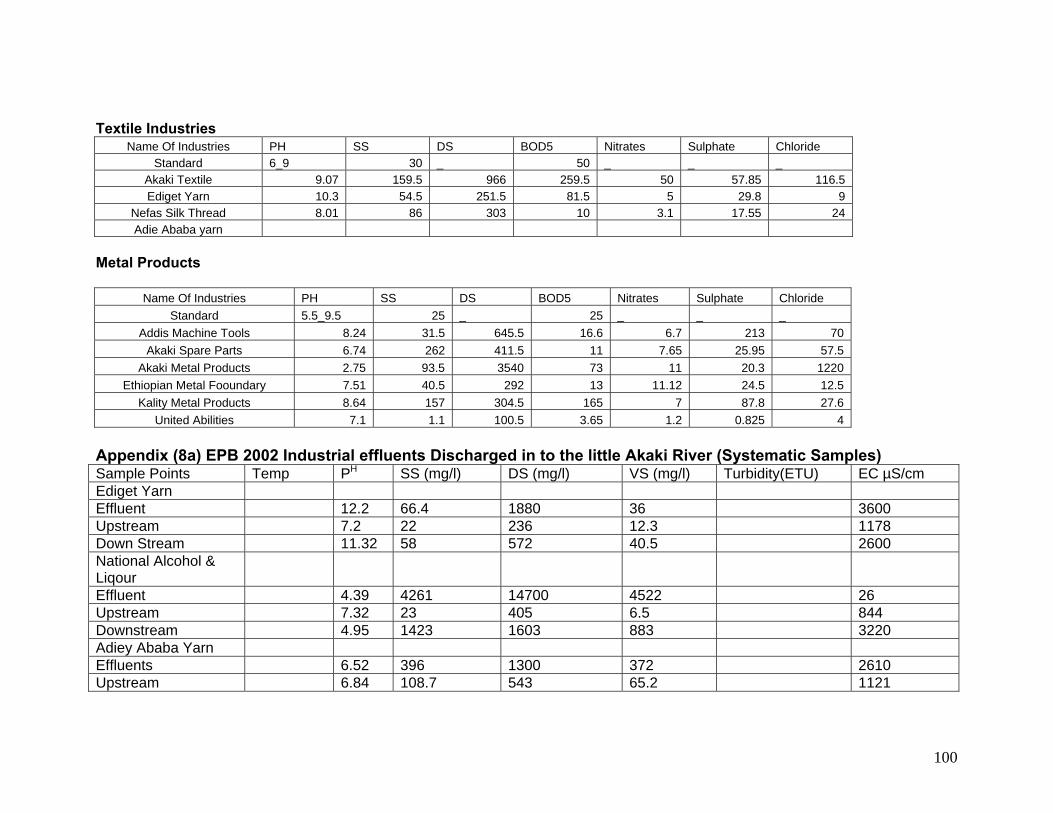
Akaki River and its major tributaries thereby sending their effluents (Table 9).
Table 9 Typical effluent characteristics of the Industries and other anthropogenic activities along TAR (Santra S.C, 2004). Contaminant Source Typical Effluent Characteristics
1.Food & Beverage Industries High BOD&SS, Colloidal and dissolved
Organic matter, Oudor.
2.Textile and Clothing Industries High SS & BOD, Alkaline Effluents
7. Fertilizer Process High BOD, SS, Chloride, Variable PH.
8. Painting & Metal Finishing Low PH, High Content of Toxic Metals
9. Engineering Works High SS, Chlorides, Variable PH
10. Leakage From Storage Tanks &
Pipelines
Aqueous solutions, Hydrocarbons,
Petrochemicals and Sewage.
11. Mining High TDS, SS, Possibly High Chloride.
12. Agriculture
13. Arable Crops Organo-chlorine compounds from pesticides,
Nitrate, Ammonia, Sulphate, Chloride &
Phosphates from fertilizers. Bacterial
contamination from organic fertilizers.
14. Livestock SS, BOD, Nitrogen. High faecal Coli forms
and Streptococci
15. Silage High SS, BOD 1-6X10⁴ mg/l, Carbohydrates
and Phenols.
16. Household Wastes High Sulphate, Chloride, Ammonia, BOD,
TOC, & SS from fresh waste. Bacterial
Contamination. Secondary decomposition
products from TOC (Mainly Volatile fatty
acids- acetic, butyric, propionic acids)
change into high molecular weight organics
(Humic substances and Carbohydrates).
And almost all industrial wastes are untreated and their pollutant loads (organic
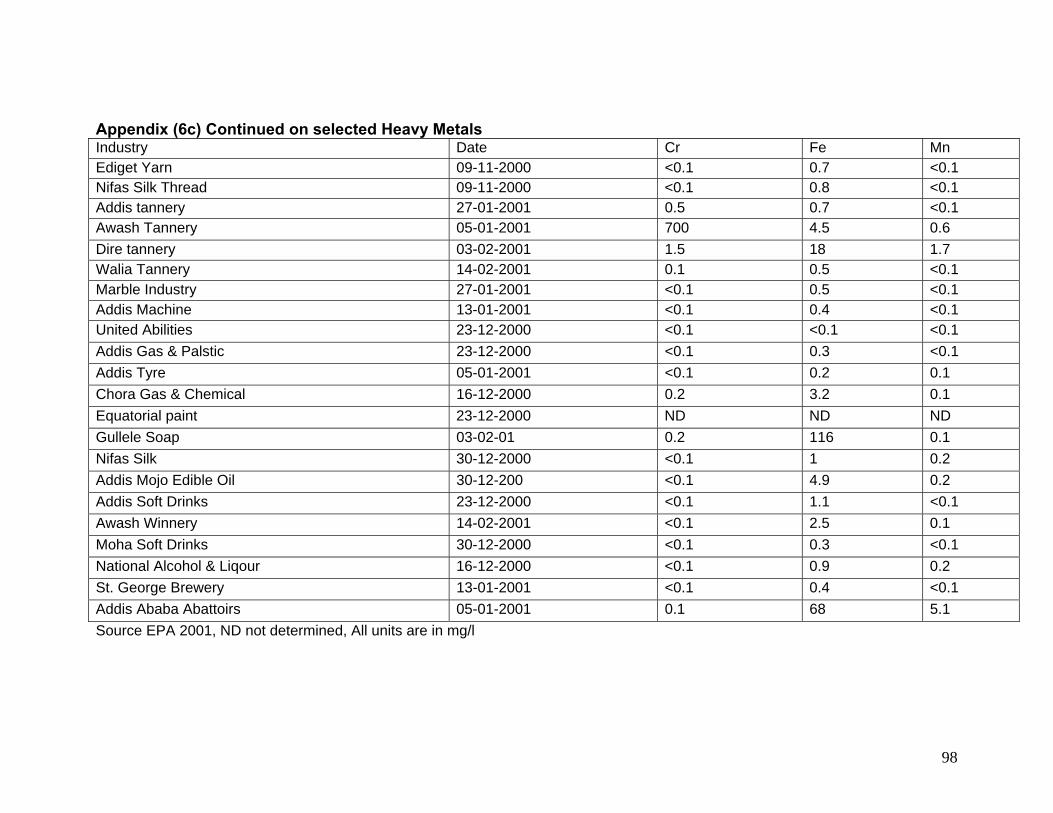
and inorganic) are observed to be high (Appendices 6a-6c and 7). The principal
deleterious effect of these wastes on streams and water courses is their
deoxygenation. And the volume of liquid waste generated from the industries
ranges from 1 to 1000 cubic meter per day which is summed up to be 4,877,371
cubic meter per annum (CSA 1999), see (Table 10).
39
Table 10 Volume of waste water annually discharged from industries in Addis
Ababa (CSA 1999). Type Of Industry Vol. of Waste Water (m3/yr)
Textiles 1,992,597
Food & Beverages 1, 795, 252
Leather & Foot Wear 547, 860
Rubber 205, 746
Iron and Steel 146, 239
Pharmaceuticals 50,089
Wood 47,805
Paper & Printing 45, 967
Tobacco 31,080
Petrochemicals 11, 421
Non Ferrous Metals 2,217
Soaps & Detergents 1,098
Total 4,877,371
4.1.2 Waste Treatment Status of the Industries
Most of the industries in Addis are concentrated in the southern and western parts
(Appendix 4). Among the Industries located in the city 90% of them discharge their
wastes without any treatment into the adjoining water coarse and open spaces
(EPA, 2001 and EPA, 2002). Moreover in a survey conducted in 2000 by Ghirmy
Z., 10 industries out of 25 surveyed dispose their untreated waste water to TAR
and 3 to its tributaries, while the rest dispose their liquid waste into open drainage
in the city. Similarly during field visit of the study area it has been observed that
nearly all industries have no treatment plant and hence they highly contribute to
the Akaki river’s water pollution.
40
4.2 Municipal Sources Ethiopia is one of the developing countries, where urban population growth is very
fast. Especially, in Addis Ababa, the growth is faster (Fig.9) than any other cities. It
is obvious that when the population increases the municipal solid and liquid
wastes generation also increases. In addition the city’s municipal waste (solid and
liquid) collection coverage is limited to minor proportion of the residents and is less
efficient as a result it greatly contributes to the pollution of TAR especially during
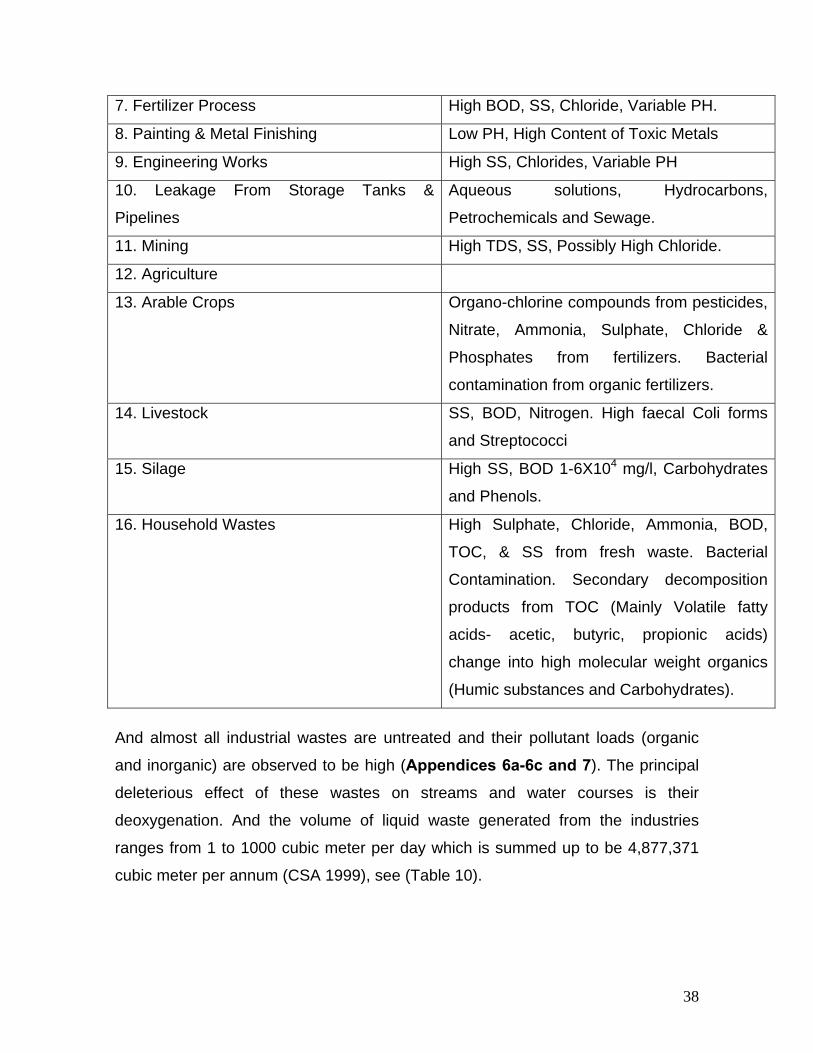
the rainy seasons when the surface runoff gets higher. And (Table 11) illustrates
typical concentrations of organic and nitrogenous wastes in untreated municipal
sources.
Fig. 9 Population growth in Addis Ababa City (immigration not considered) (Tamiru
et.al. 2003).
Table 11 Typical characteristics of untreated municipal wastes (Omann T. 1972,
cited in US EPA 1985) Variable Unit Approximate
Average
Normal Range
Average Daily Flow Gal/cap/day 125 100-200
Solids
Total
Mg/l
800
450-1200
41
Total Volatiles
Total Dissolved
Total Suspended
Volatile Suspended
Settleable
Mg/l
Mg/l
Mg/l
Mg/l
Mg/l
400
500
300
130
150
250-800
300-800
100-400
80-200
-
BOD
CBOD (5-days)
CBOD Ultimate
Nitrogenous*
Mg/l
Mg/l
Mg/l
180
220
220
100-450
120-580
-
Nitrogen
Total
Organic
Ammonia
Nitrite + Nitrate
Mg/l N
Mg/l N
Mg/l N
Mg/l N
50
20
28
2
15-100
5-35
10-60
0-6
Phosphate
Total
Ortho
Poly
Mg/l P
Mg/l P
Mg/l P
20
10
10
10-50
5-25
5-25
Coli forms
Total
Fecal
Million Org./100ml
Million org./100ml
30
4
2-50
0.3-17
*Ultimate, Nitrogenous oxygen demand, exclusive of CBOD.
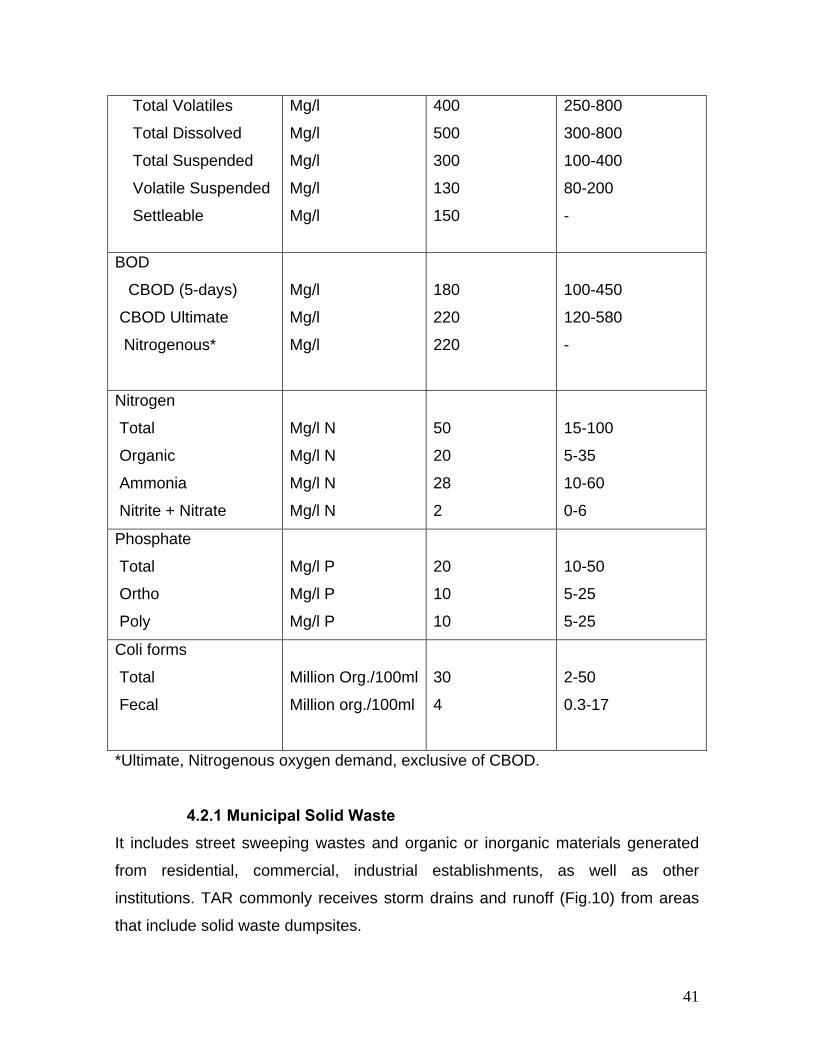
4.2.1 Municipal Solid Waste
It includes street sweeping wastes and organic or inorganic materials generated
from residential, commercial, industrial establishments, as well as other
institutions. TAR commonly receives storm drains and runoff (Fig.10) from areas
that include solid waste dumpsites.
42
Fig.10 Storm Drain Feeding Tributary Shankla at a bridge near Ethiomarble.
This can be attributed to the inadequate and inefficient waste management
facilities. According to SBPDA, 2003 the daily waste generation per capita per day
for a population size of 3, 0335,138. Was 0.252 kg; However, The daily total waste
generation of the city is 2,297 cubic meter i.e. 765 tones currently (EPA 2005).
Consequently, the sectoral and compositional contribution of wastes has shown
tremendous growth and is given in the Table (12) and Table (13) respectively.
43
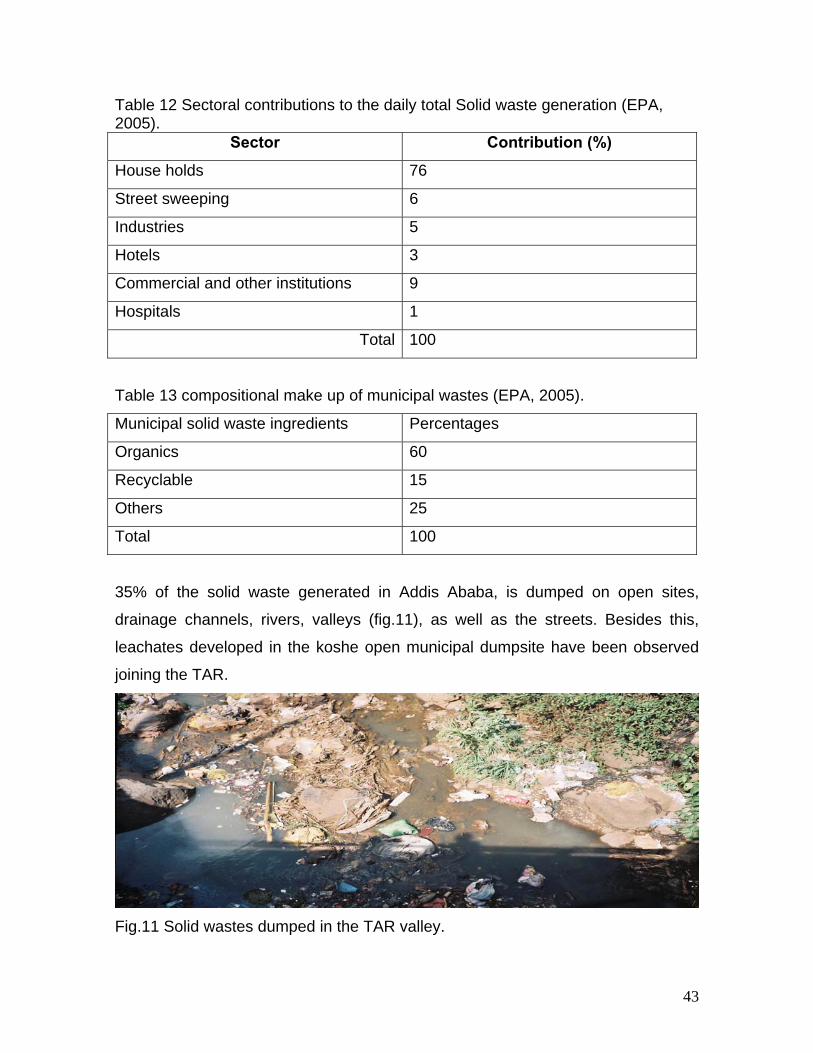
Table 12 Sectoral contributions to the daily total Solid waste generation (EPA, 2005).
Sector Contribution (%)
House holds 76
Street sweeping 6
Industries 5
Hotels 3
Commercial and other institutions 9
Hospitals 1
Total 100
Table 13 compositional make up of municipal wastes (EPA, 2005).
Municipal solid waste ingredients Percentages
Organics 60
Recyclable 15
Others 25
Total 100
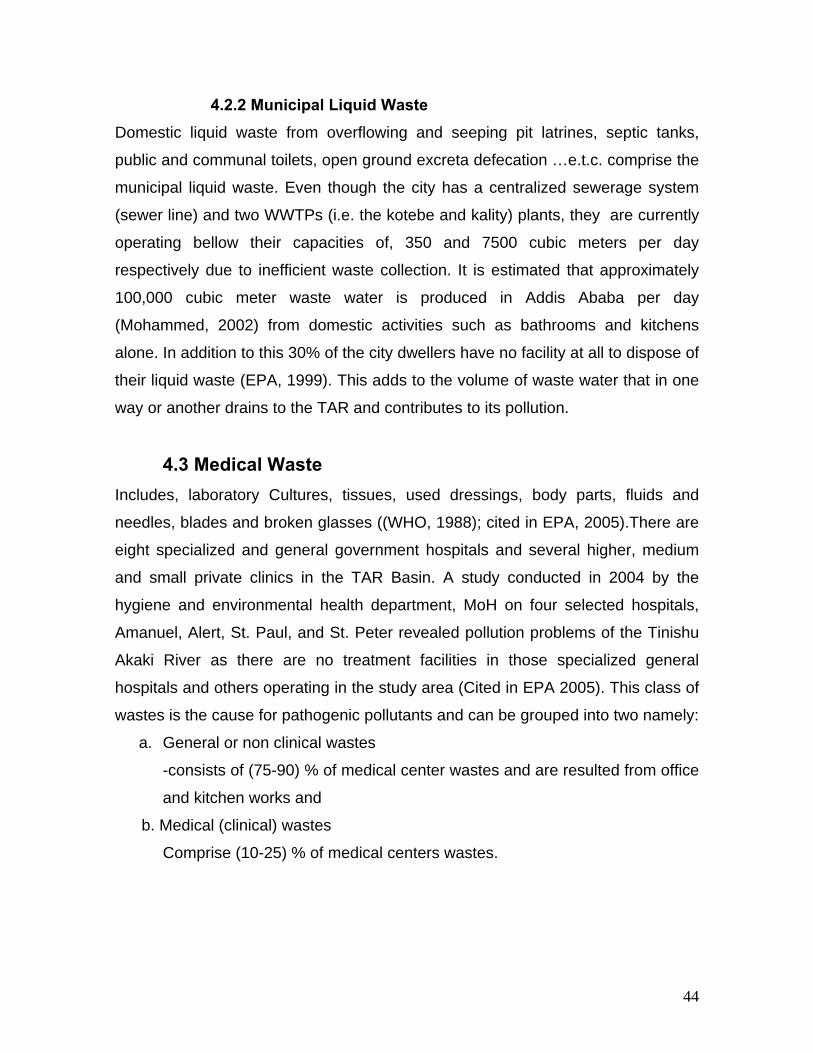
35% of the solid waste generated in Addis Ababa, is dumped on open sites,
drainage channels, rivers, valleys (fig.11), as well as the streets. Besides this,
leachates developed in the koshe open municipal dumpsite have been observed
joining the TAR.
Fig.11 Solid wastes dumped in the TAR valley.
44
4.2.2 Municipal Liquid Waste Domestic liquid waste from overflowing and seeping pit latrines, septic tanks,
public and communal toilets, open ground excreta defecation …e.t.c. comprise the
municipal liquid waste. Even though the city has a centralized sewerage system
(sewer line) and two WWTPs (i.e. the kotebe and kality) plants, they are currently
operating bellow their capacities of, 350 and 7500 cubic meters per day
respectively due to inefficient waste collection. It is estimated that approximately
100,000 cubic meter waste water is produced in Addis Ababa per day
(Mohammed, 2002) from domestic activities such as bathrooms and kitchens
alone. In addition to this 30% of the city dwellers have no facility at all to dispose of
their liquid waste (EPA, 1999). This adds to the volume of waste water that in one
way or another drains to the TAR and contributes to its pollution.
4.3 Medical Waste Includes, laboratory Cultures, tissues, used dressings, body parts, fluids and
needles, blades and broken glasses ((WHO, 1988); cited in EPA, 2005).There are
eight specialized and general government hospitals and several higher, medium
and small private clinics in the TAR Basin. A study conducted in 2004 by the
hygiene and environmental health department, MoH on four selected hospitals,
Amanuel, Alert, St. Paul, and St. Peter revealed pollution problems of the Tinishu
Akaki River as there are no treatment facilities in those specialized general
hospitals and others operating in the study area (Cited in EPA 2005). This class of
wastes is the cause for pathogenic pollutants and can be grouped into two namely:
a. General or non clinical wastes
-consists of (75-90) % of medical center wastes and are resulted from office
and kitchen works and
b. Medical (clinical) wastes
Comprise (10-25) % of medical centers wastes.
45
4.4 Pharmaceutical Waste Chemical extraction, modification, and synthesis of organic, inorganic substances
are the common processes in this sector. In addition to this purification and
packaging are also practiced and together account for pharmaceutical wastes that
join the river system via drainage or leachate.
4.5 Miscellaneous Waste Sources Other activities that are considered in this project work as sources of pollution to
the Akaki River are agricultural practices, slaughter houses and fuel stations or
garages.
4.5.1 Agricultural Sources
Fertilizers, pesticides and sediments derived from agricultural plots or fields are
major polluting agents to TAR. Starting from it’s upstream around Asteko to its
reach at Aba Samuel abstraction of TAR and it’s tributaries for cultivation of
vegetables and crops is a common practice (Table 8). Thus during rainy seasons
agricultural return flow contributes to pollution.
4.5.2 Slaughter Houses
There are at least two slaughter houses in the study area. These are Burayu kera
and Addis Ababa Abattoirs enterprise at the source and midstream areas
respectively. The types of wastes produced by the operations are shown bellow:
Source Waste Stockyard manure
Killing floor blood
Dehairing hair and dirt
Insides removal paunch manure and liquor
Rendering stick liquor or press liquor
Carcass dressing flesh, grease, blood, manure
By-products grease, offal
46
The typical characteristics of the effluent coming out from the slaughter Houses
(Santra S.C 2004) are as follows:
Parameters Characteristic 1. Total solids - 4000 to 5000 mg/1
2. BOD - 4000 mg/1
3. COD - 8000 mg/1
4. PH - 6 to 7
4.5.3 Chemicals PoPs, PCBs, Trace elements such as Cr, As, Cu that are imported and stored by
different organizations near TAR and /or its tributaries pose a serious hazard to
human beings, animals and the aquatic environment in the basin. Besides their
solubility and production is enhanced in the reduced DO levels.
4.5.4 Laundry Chemicals Dry cleaning chemicals are being threats to TAR as there are several laundries in
the basin. One litter out of 10 is being released to open drainage which finally
enters a river (EPA 2005).
4.5.5 Fuel Stations and Garages
Sources of oil wastes in Addis Ababa city are fuel stations, private and
government Garages. Car washing, Laviajo, are among the activities that cause oil
seepage. The battery changing services also contribute to the low pH or acidic
wastes from these centers.
47
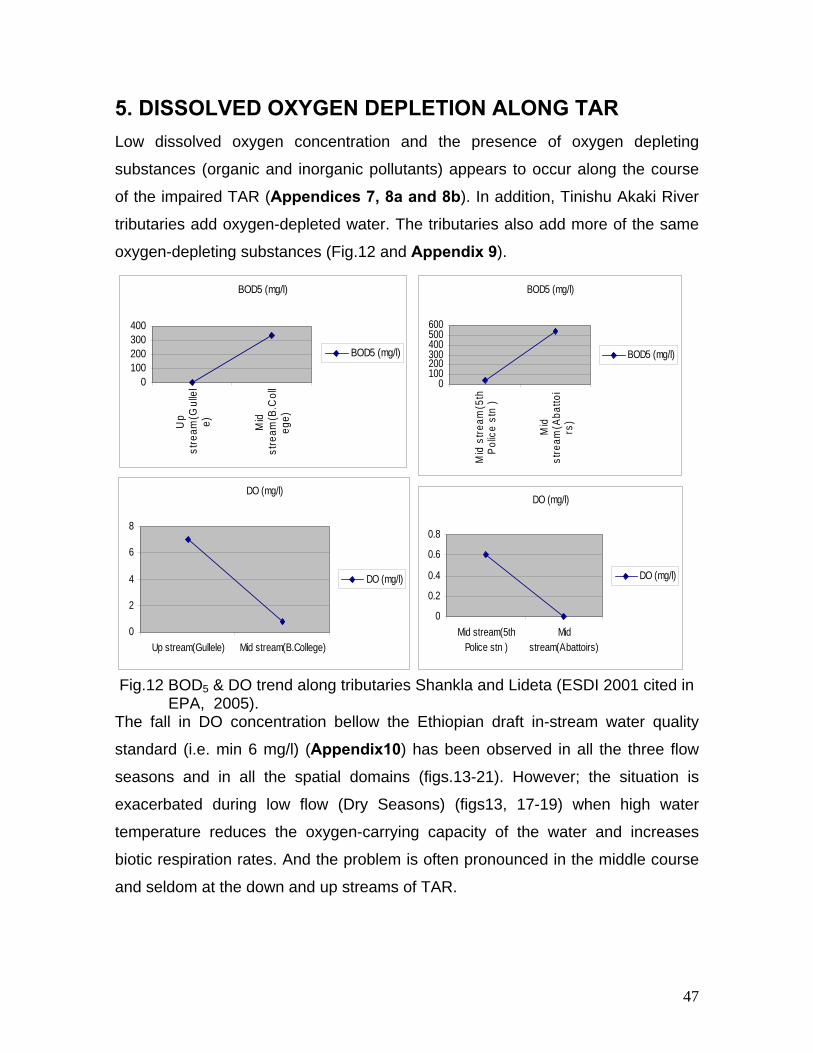
5. DISSOLVED OXYGEN DEPLETION ALONG TAR Low dissolved oxygen concentration and the presence of oxygen depleting
substances (organic and inorganic pollutants) appears to occur along the course
of the impaired TAR (Appendices 7, 8a and 8b). In addition, Tinishu Akaki River
tributaries add oxygen-depleted water. The tributaries also add more of the same
oxygen-depleting substances (Fig.12 and Appendix 9).
Fig.12 BOD5 & DO trend along tributaries Shankla and Lideta (ESDI 2001 cited in EPA, 2005). The fall in DO concentration bellow the Ethiopian draft in-stream water quality
standard (i.e. min 6 mg/l) (Appendix10) has been observed in all the three flow
seasons and in all the spatial domains (figs.13-21). However; the situation is
exacerbated during low flow (Dry Seasons) (figs13, 17-19) when high water
temperature reduces the oxygen-carrying capacity of the water and increases
biotic respiration rates. And the problem is often pronounced in the middle course
and seldom at the down and up streams of TAR.
BOD5 (mg/l)
0100200300400500600
Mid
stre
am(5
thPo
lice
stn
)
Mid
stre
am(A
batto
irs
)
BOD5 (mg/l)
DO (mg/l)
0
0.2
0.4
0.6
0.8
Mid stream(5thPolice stn )
Midstream(Abattoirs)
DO (mg/l)
BOD5 (mg/l)
0100200300400
Up
stre
am(G
ulle
le) Mid
stre
am(B
.Col
leg
e)
BOD5 (mg/l)
DO (mg/l)
0
2
4
6
8
Up stream(Gullele) Mid stream(B.College)
DO (mg/l)
48
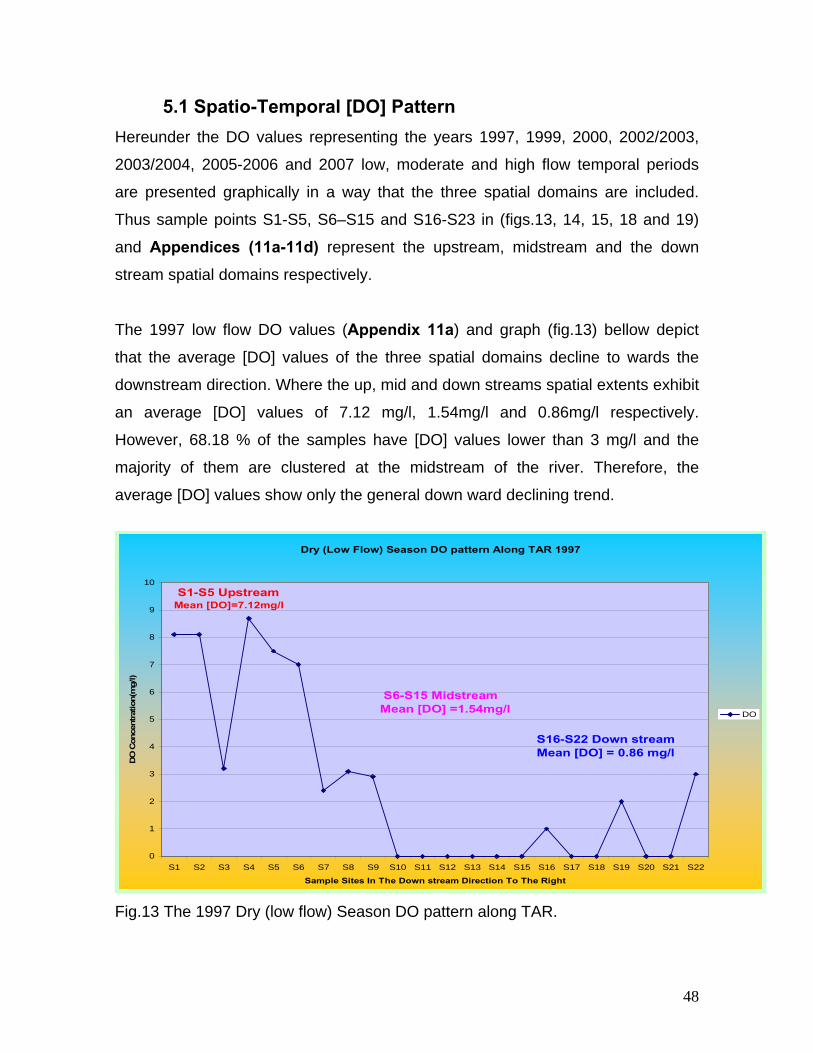
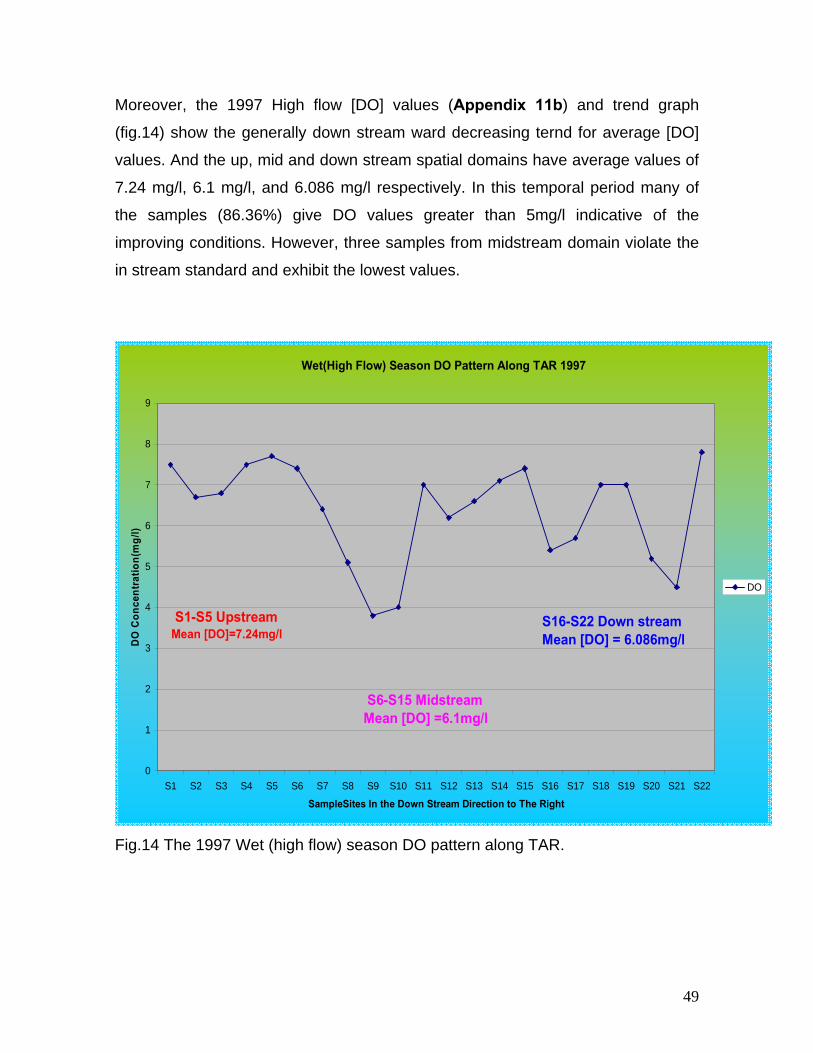
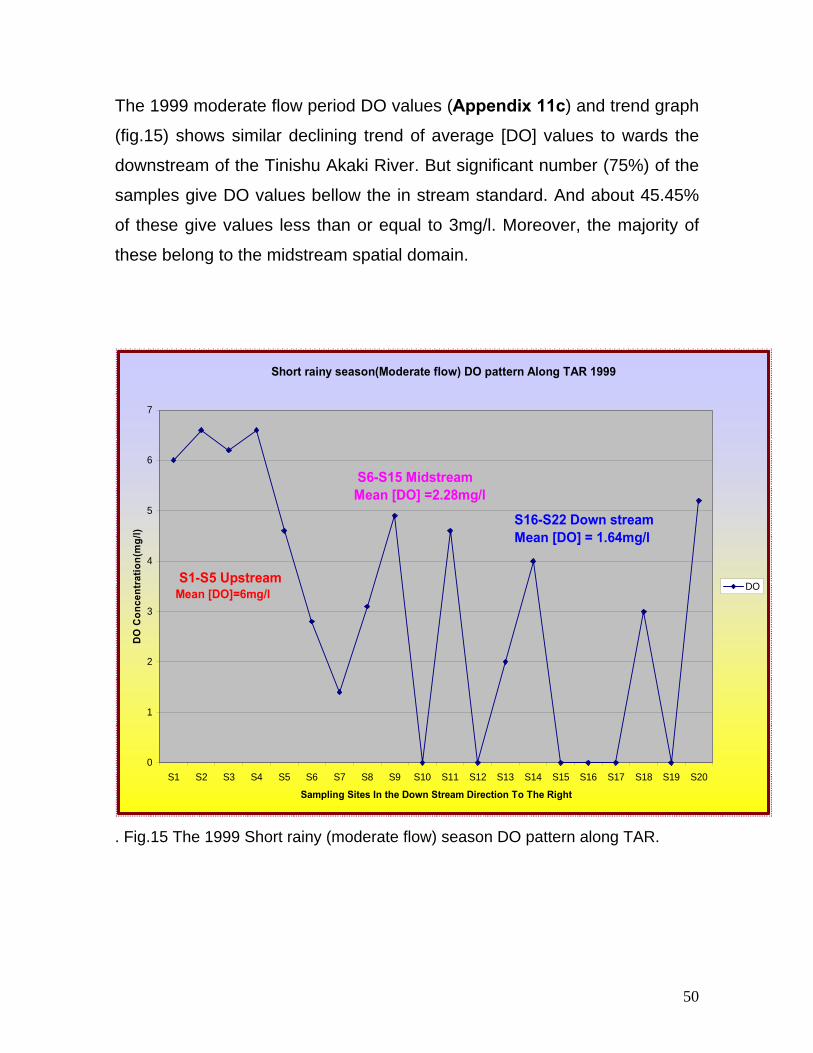
5.1 Spatio-Temporal [DO] Pattern Hereunder the DO values representing the years 1997, 1999, 2000, 2002/2003,
2003/2004, 2005-2006 and 2007 low, moderate and high flow temporal periods
are presented graphically in a way that the three spatial domains are included.
Thus sample points S1-S5, S6–S15 and S16-S23 in (figs.13, 14, 15, 18 and 19)
and Appendices (11a-11d) represent the upstream, midstream and the down
stream spatial domains respectively.
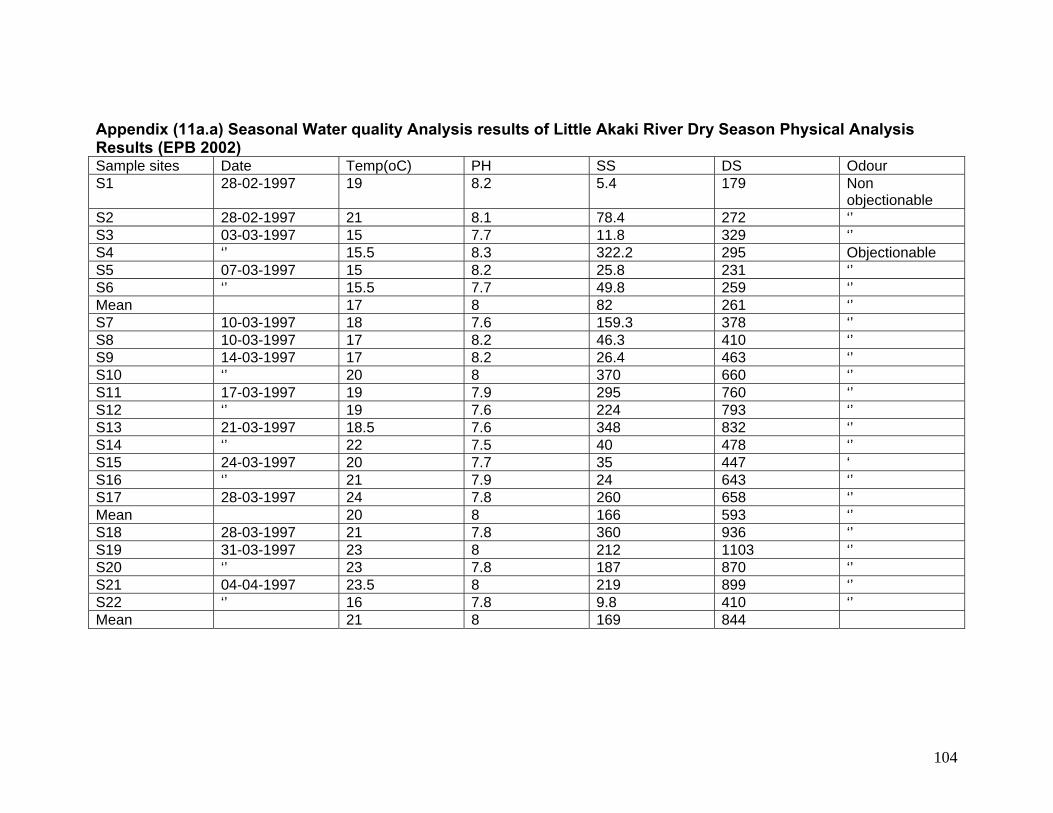
The 1997 low flow DO values (Appendix 11a) and graph (fig.13) bellow depict
that the average [DO] values of the three spatial domains decline to wards the
downstream direction. Where the up, mid and down streams spatial extents exhibit
an average [DO] values of 7.12 mg/l, 1.54mg/l and 0.86mg/l respectively.
However, 68.18 % of the samples have [DO] values lower than 3 mg/l and the
majority of them are clustered at the midstream of the river. Therefore, the
average [DO] values show only the general down ward declining trend.
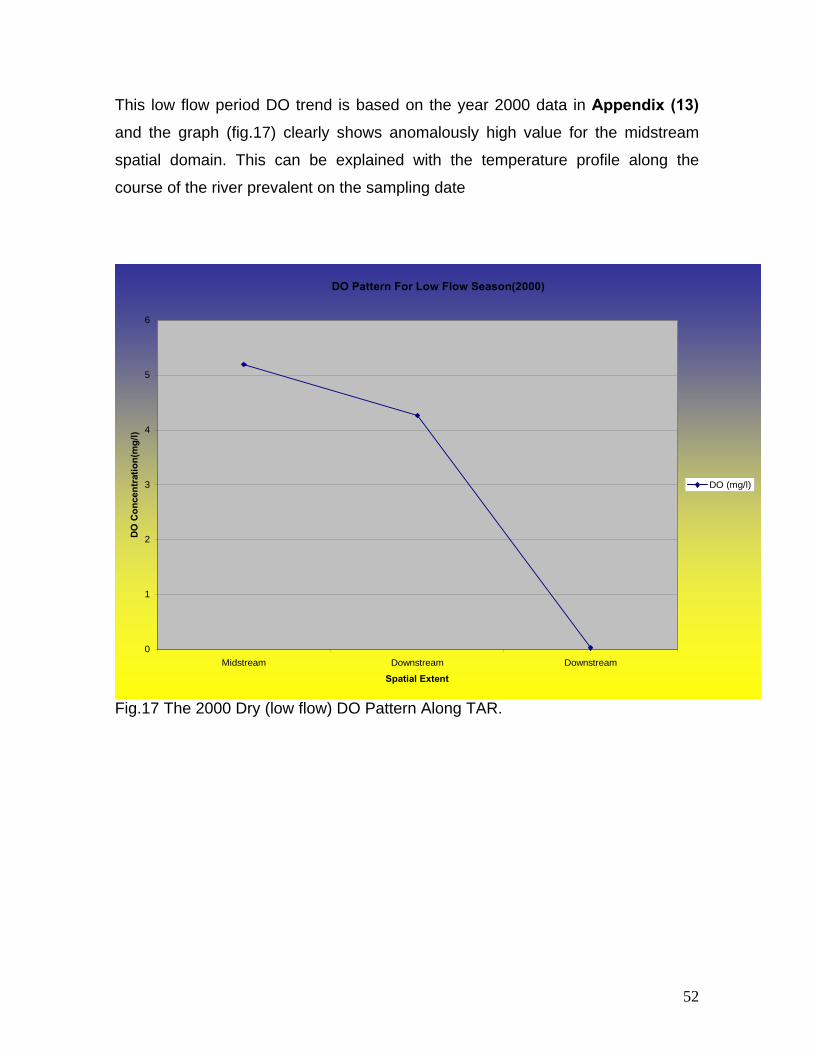
This low flow period DO trend is based on the year 2000 data in Appendix (13) and the graph (fig.17) clearly shows anomalously high value for the midstream
spatial domain. This can be explained with the temperature profile along the
course of the river prevalent on the sampling date
DO Pattern For Low Flow Season(2000)
0
1
2
3
4
5
6
Midstream Downstream Downstream
Spatial Extent
DO
Con
cent
ratio
n(m
g/l)
DO (mg/l)
Fig.17 The 2000 Dry (low flow) DO Pattern Along TAR.
53
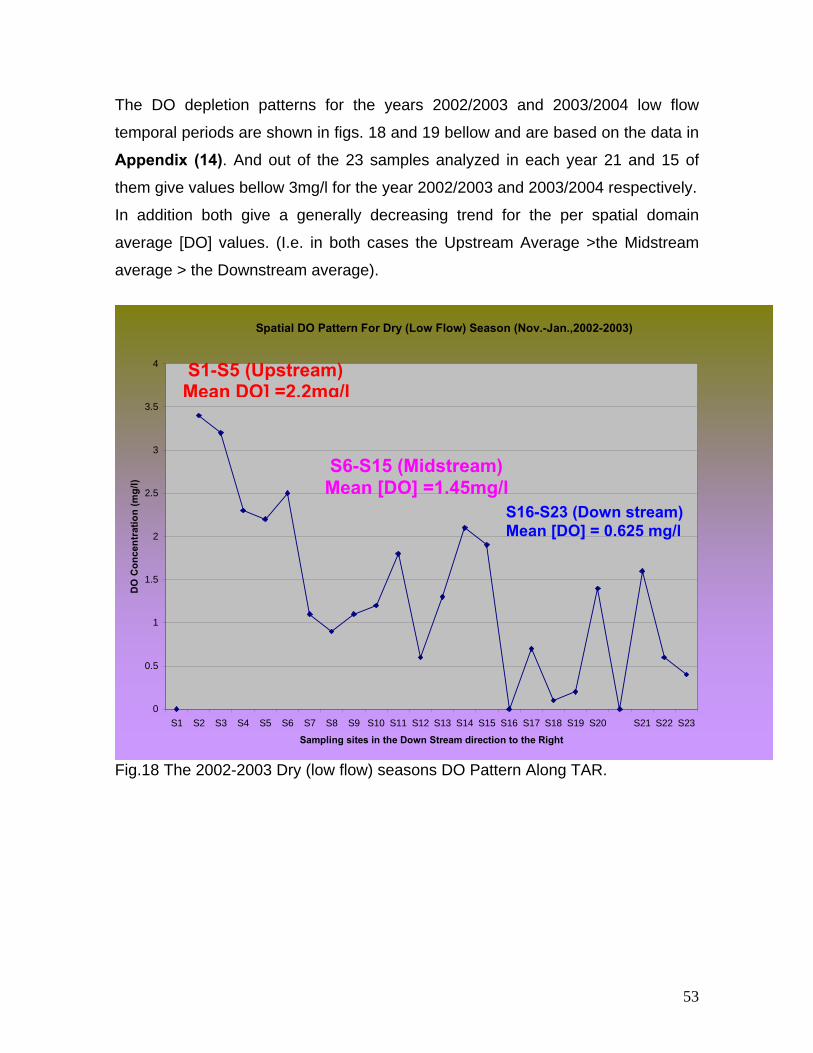
The DO depletion patterns for the years 2002/2003 and 2003/2004 low flow
temporal periods are shown in figs. 18 and 19 bellow and are based on the data in
Appendix (14). And out of the 23 samples analyzed in each year 21 and 15 of
them give values bellow 3mg/l for the year 2002/2003 and 2003/2004 respectively.
In addition both give a generally decreasing trend for the per spatial domain
average [DO] values. (I.e. in both cases the Upstream Average >the Midstream
average > the Downstream average).
Spatial DO Pattern For Dry (Low Flow) Season (Nov.-Jan.,2002-2003)
Sample Sites In the Downstream Direction to The Right
DO
(mg/
l)
DO(mg/l)
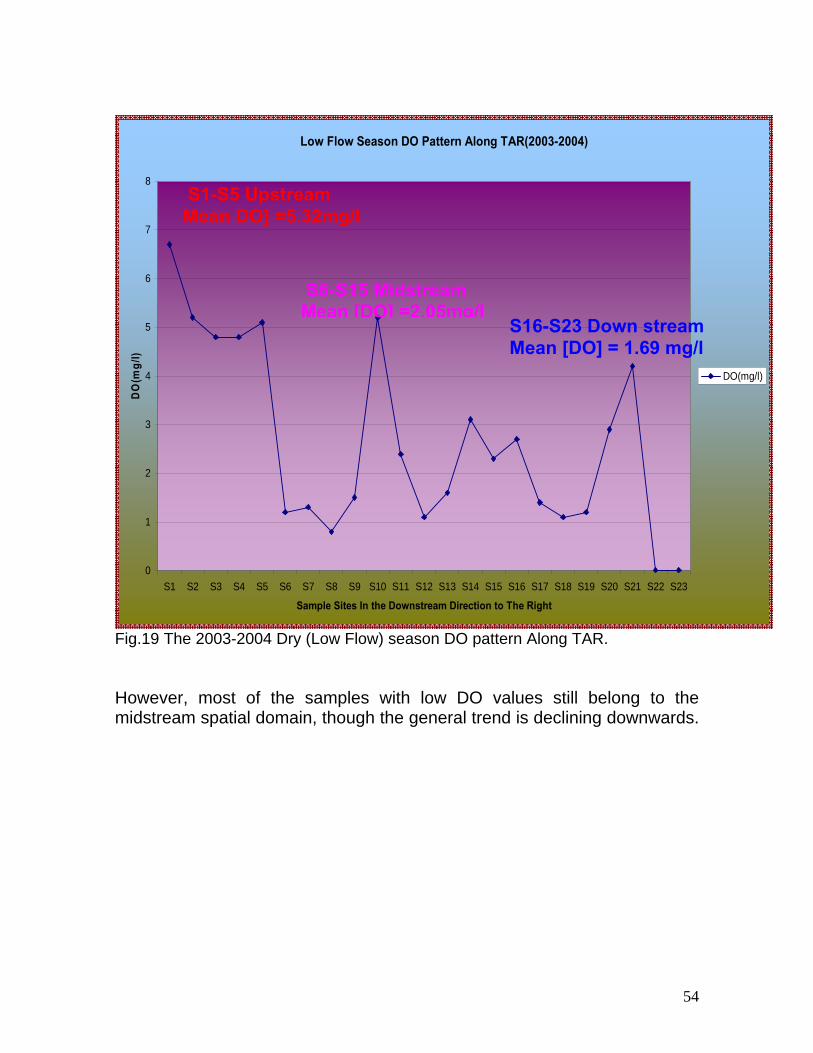
Fig.19 The 2003-2004 Dry (Low Flow) season DO pattern Along TAR. However, most of the samples with low DO values still belong to the midstream spatial domain, though the general trend is declining downwards.
S16-S23 Down stream Mean [DO] = 1.69 mg/l
S6-S15 Midstream Mean [DO] =2.05mg/l
S1-S5 Upstream Mean DO] =5.32mg/l
55
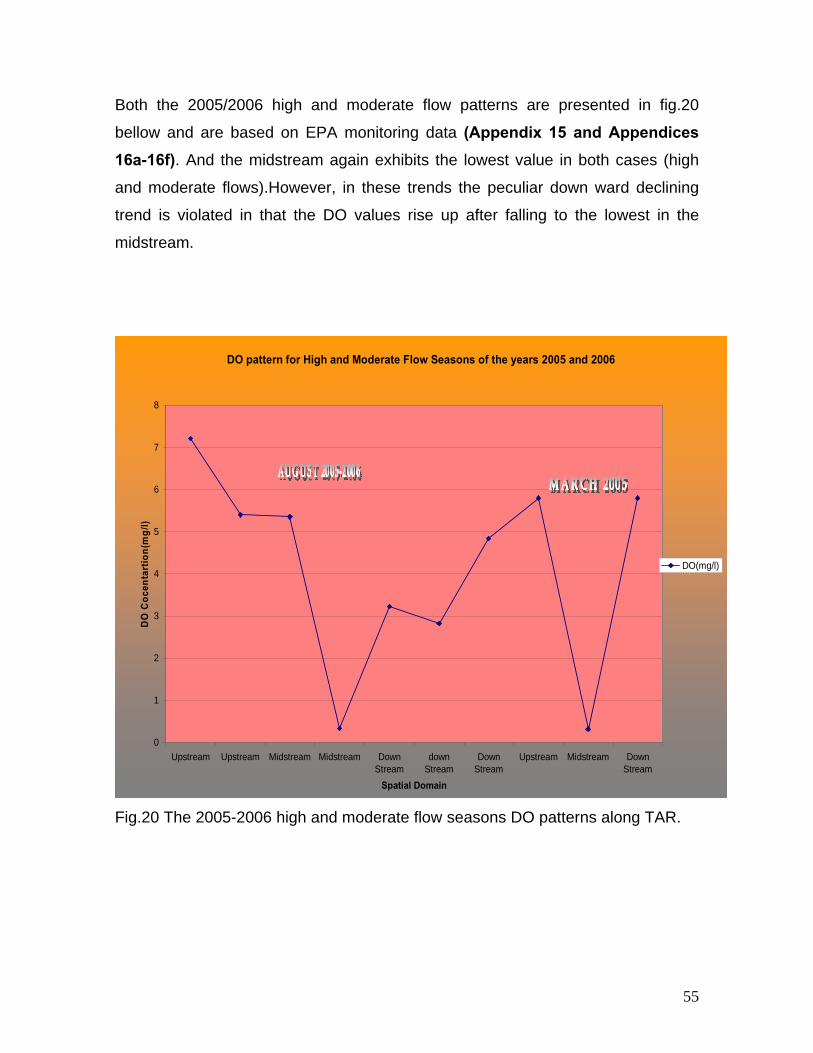
Both the 2005/2006 high and moderate flow patterns are presented in fig.20
bellow and are based on EPA monitoring data (Appendix 15 and Appendices 16a-16f). And the midstream again exhibits the lowest value in both cases (high
and moderate flows).However, in these trends the peculiar down ward declining
trend is violated in that the DO values rise up after falling to the lowest in the
midstream.
DO pattern for High and Moderate Flow Seasons of the years 2005 and 2006
0
1
2
3
4
5
6
7
8
Upstream Upstream Midstream Midstream DownStream
downStream
DownStream
Upstream Midstream DownStream
Spatial Domain
DO
Coc
enta
rtio
n(m
g/l)
DO(mg/l)
Fig.20 The 2005-2006 high and moderate flow seasons DO patterns along TAR.
56
This DO pattern has dual purpose and represents both the 2007 moderate flow
period and the minimum industrial effluents discharge scenario. Thus it is
presented as fig. 21 and 22 which are based on the Appendices (5a and 5b).The
lowest value (i.e. 3mg/l) is registered for the midstream. But the condition seams
improved in the down stream direction. All samples exhibit DO values greater than
or equal to 3 mg/l. But non of them achieve the minimum standard (6mg/l) which
indicates the presence of ODW sources other than industries that keep the DO
level bellow the standard.
Moderate flow DO pattern For the year 2007
0
1
2
3
4
5
6
Upstram Midstream Midstream Midstream Downstream
Spatial Extent
DO
con
cent
ratio
n(m
g/l)
DO(mg/l)
Fig. 21 The 2007 moderate flow DO pattern along TAR.
57
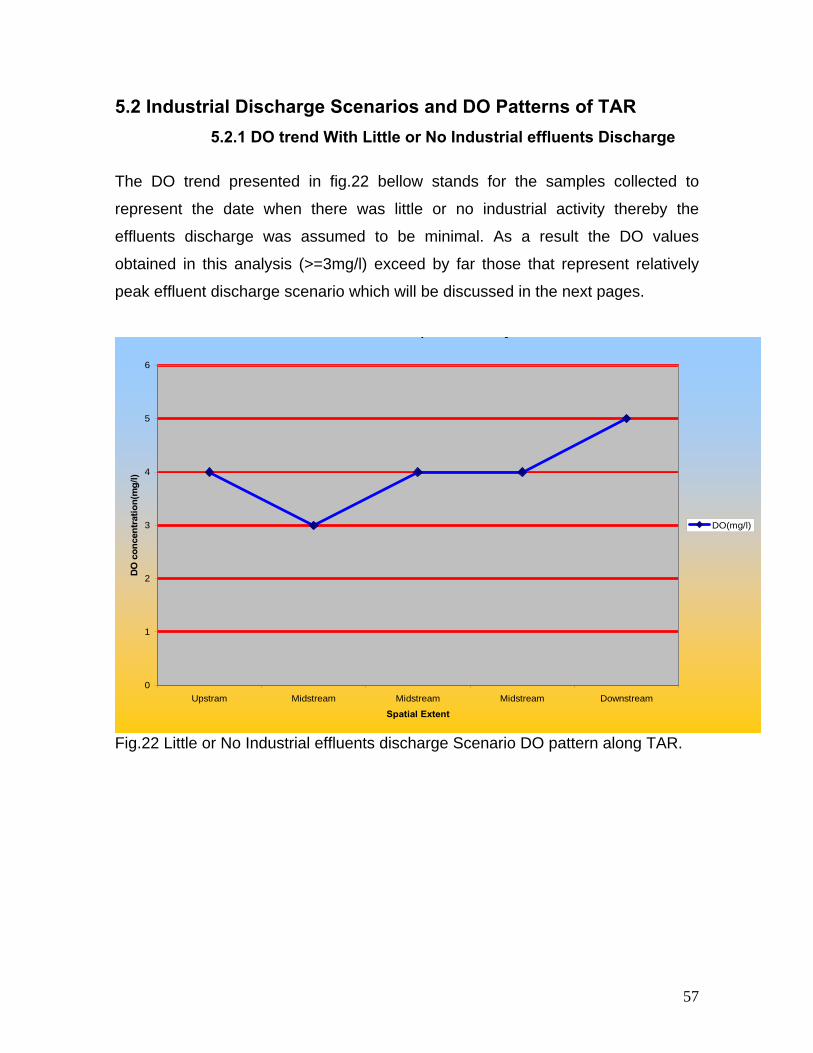
5.2 Industrial Discharge Scenarios and DO Patterns of TAR 5.2.1 DO trend With Little or No Industrial effluents Discharge
The DO trend presented in fig.22 bellow stands for the samples collected to
represent the date when there was little or no industrial activity thereby the
effluents discharge was assumed to be minimal. As a result the DO values
obtained in this analysis (>=3mg/l) exceed by far those that represent relatively
peak effluent discharge scenario which will be discussed in the next pages.
p y
0
1
2
3
4
5
6
Upstram Midstream Midstream Midstream Downstream
Spatial Extent
DO
con
cent
ratio
n(m
g/l)
DO(mg/l)
Fig.22 Little or No Industrial effluents discharge Scenario DO pattern along TAR.
58
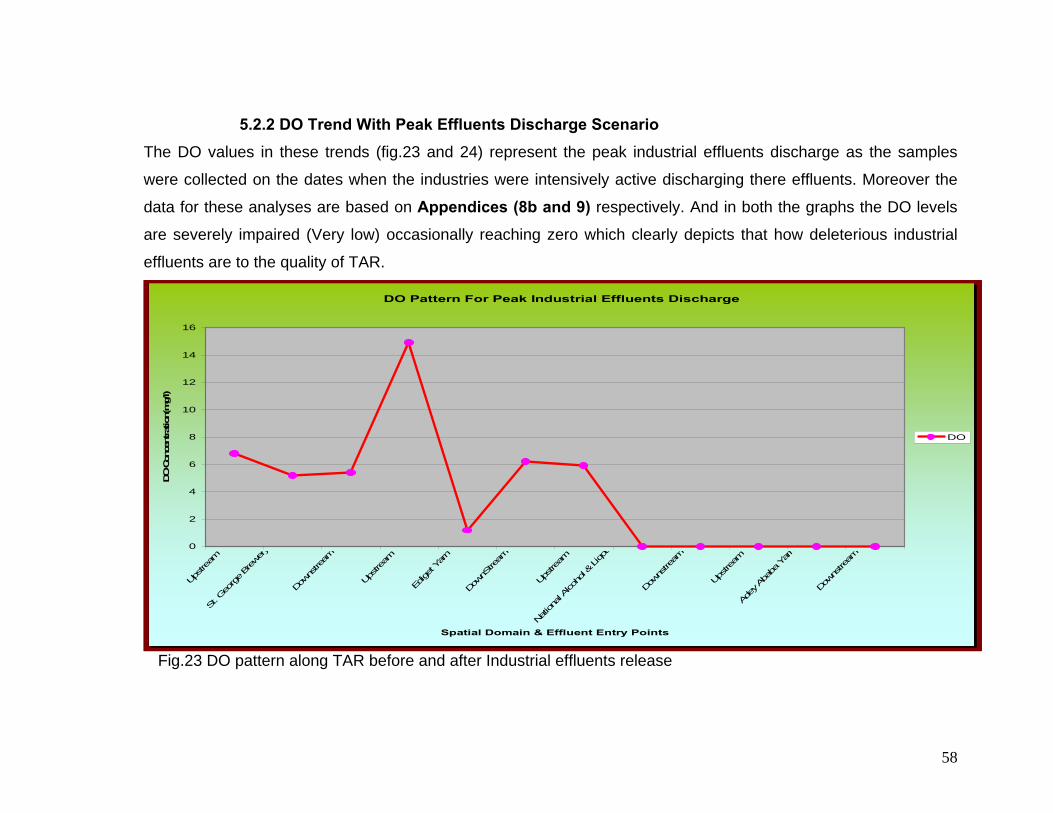
5.2.2 DO Trend With Peak Effluents Discharge Scenario The DO values in these trends (fig.23 and 24) represent the peak industrial effluents discharge as the samples
were collected on the dates when the industries were intensively active discharging there effluents. Moreover the
data for these analyses are based on Appendices (8b and 9) respectively. And in both the graphs the DO levels
are severely impaired (Very low) occasionally reaching zero which clearly depicts that how deleterious industrial
effluents are to the quality of TAR.
DO Pattern For Peak Industrial Effluents Discharge
0
2
4
6
8
10
12
14
16
Upstr
eam
St. G
eorg
e Br
ewer
y
Down
stre
am
Upstr
eam
Edige
t Yar
n
Down
Stre
am
Upstr
eam
Natio
nal A
lcoho
l & L
iqou
Down
stre
am
Upstr
eam
Adey
Aba
ba Y
arn
Down
stre
am
Spatial Domain & Effluent Entry Points
DO C
once
ntra
tion(
mg/
l)
DO
Fig.23 DO pattern along TAR before and after Industrial effluents release
59
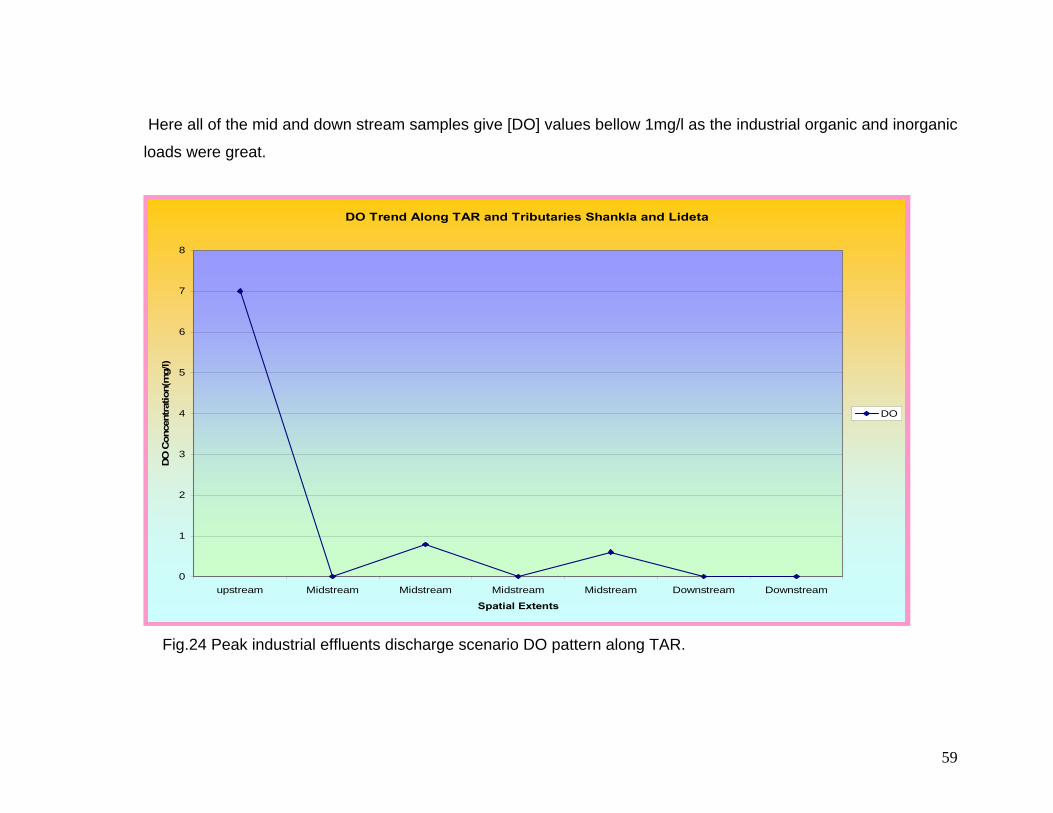
Here all of the mid and down stream samples give [DO] values bellow 1mg/l as the industrial organic and inorganic
loads were great.
DO Trend Along TAR and Tributaries Shankla and Lideta
Fig.24 Peak industrial effluents discharge scenario DO pattern along TAR.
60
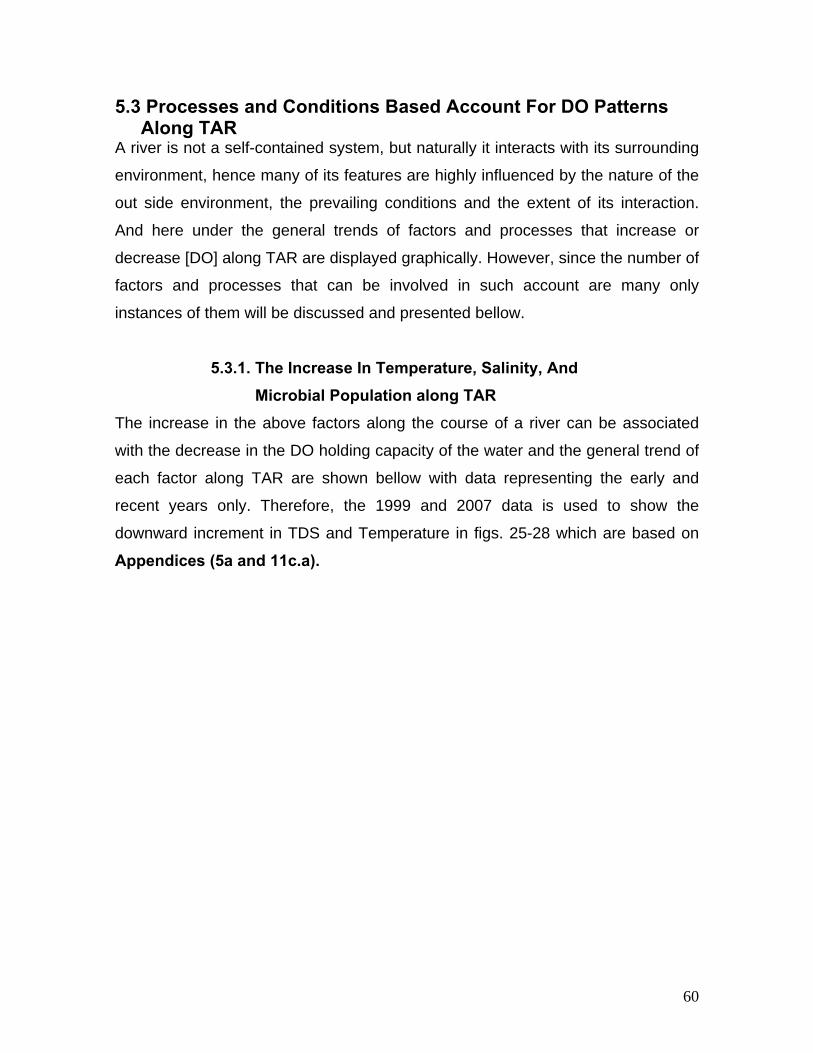
5.3 Processes and Conditions Based Account For DO Patterns Along TAR A river is not a self-contained system, but naturally it interacts with its surrounding
environment, hence many of its features are highly influenced by the nature of the
out side environment, the prevailing conditions and the extent of its interaction.
And here under the general trends of factors and processes that increase or
decrease [DO] along TAR are displayed graphically. However, since the number of
factors and processes that can be involved in such account are many only
instances of them will be discussed and presented bellow.
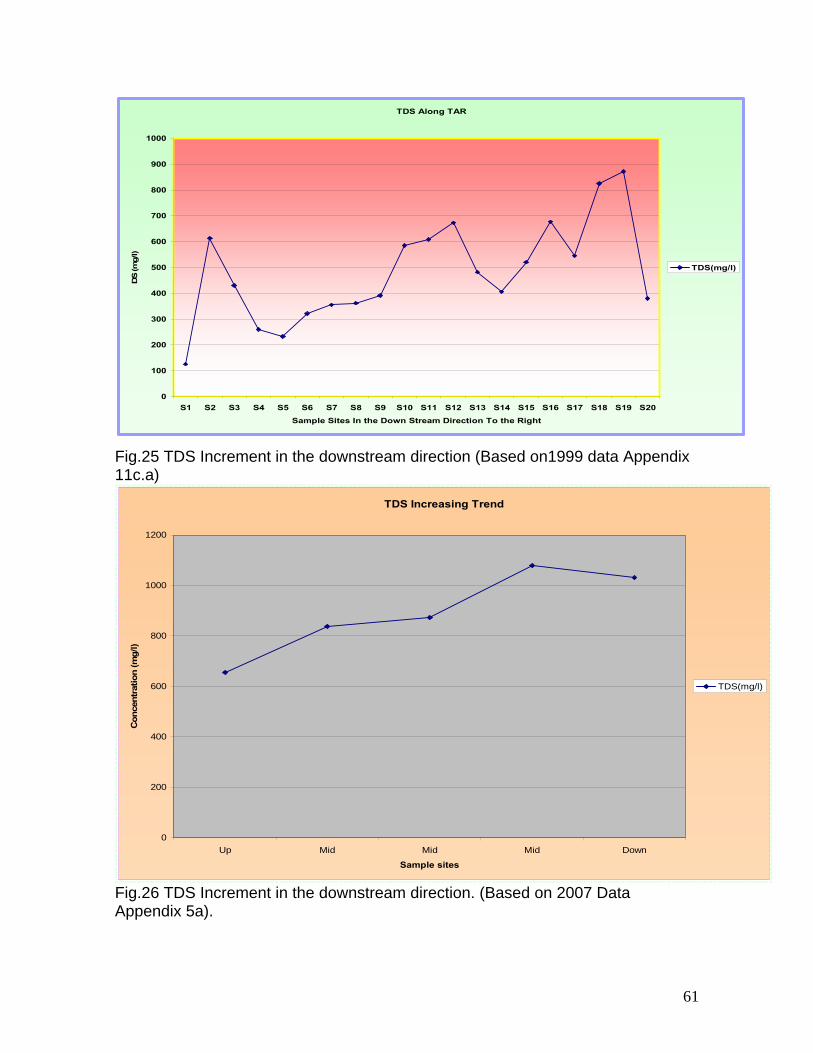
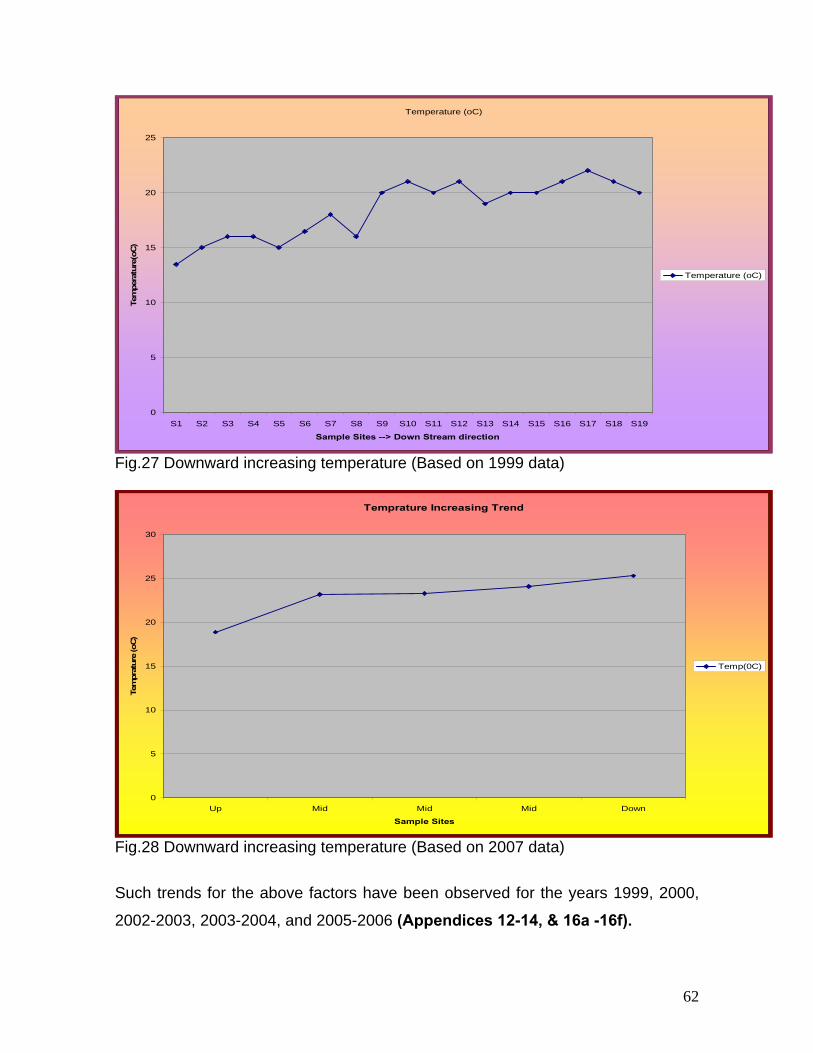
5.3.1. The Increase In Temperature, Salinity, And Microbial Population along TAR
The increase in the above factors along the course of a river can be associated
with the decrease in the DO holding capacity of the water and the general trend of
each factor along TAR are shown bellow with data representing the early and
recent years only. Therefore, the 1999 and 2007 data is used to show the
downward increment in TDS and Temperature in figs. 25-28 which are based on
Sampling Sites In the Down stream Direction to the Right
BO
D5
(mg/
l)
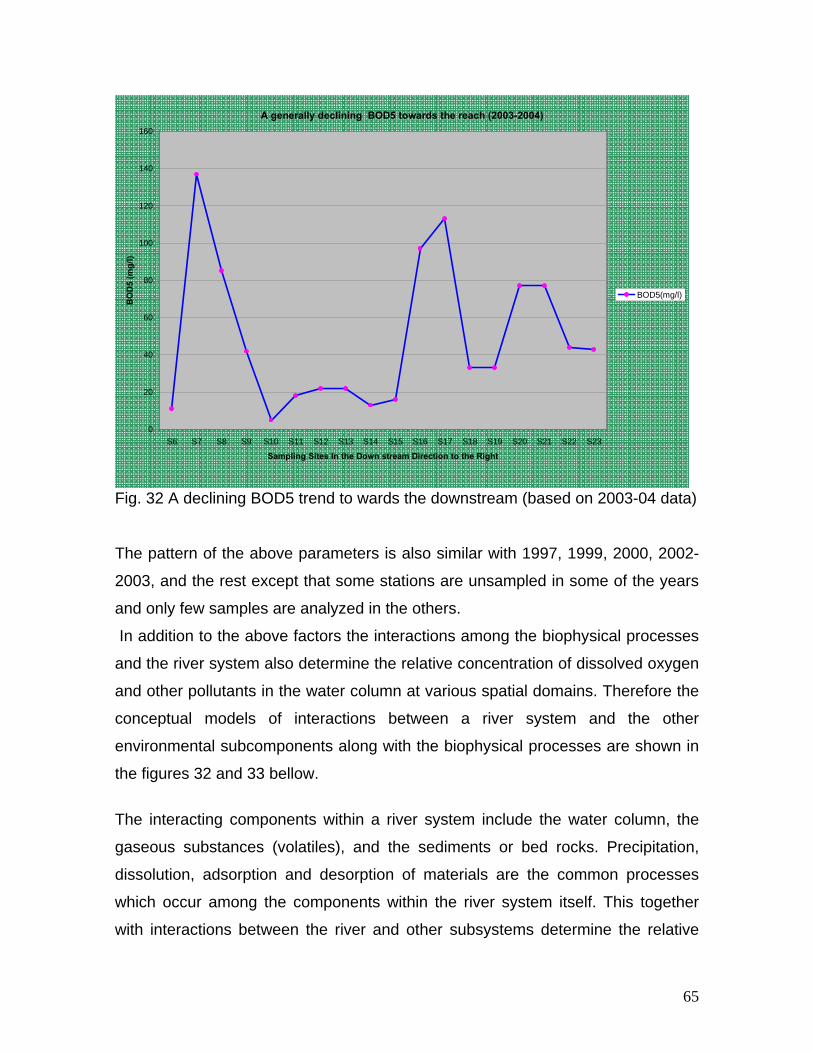
BOD5(mg/l)
Fig. 32 A declining BOD5 trend to wards the downstream (based on 2003-04 data)
The pattern of the above parameters is also similar with 1997, 1999, 2000, 2002-
2003, and the rest except that some stations are unsampled in some of the years
and only few samples are analyzed in the others.
In addition to the above factors the interactions among the biophysical processes
and the river system also determine the relative concentration of dissolved oxygen
and other pollutants in the water column at various spatial domains. Therefore the
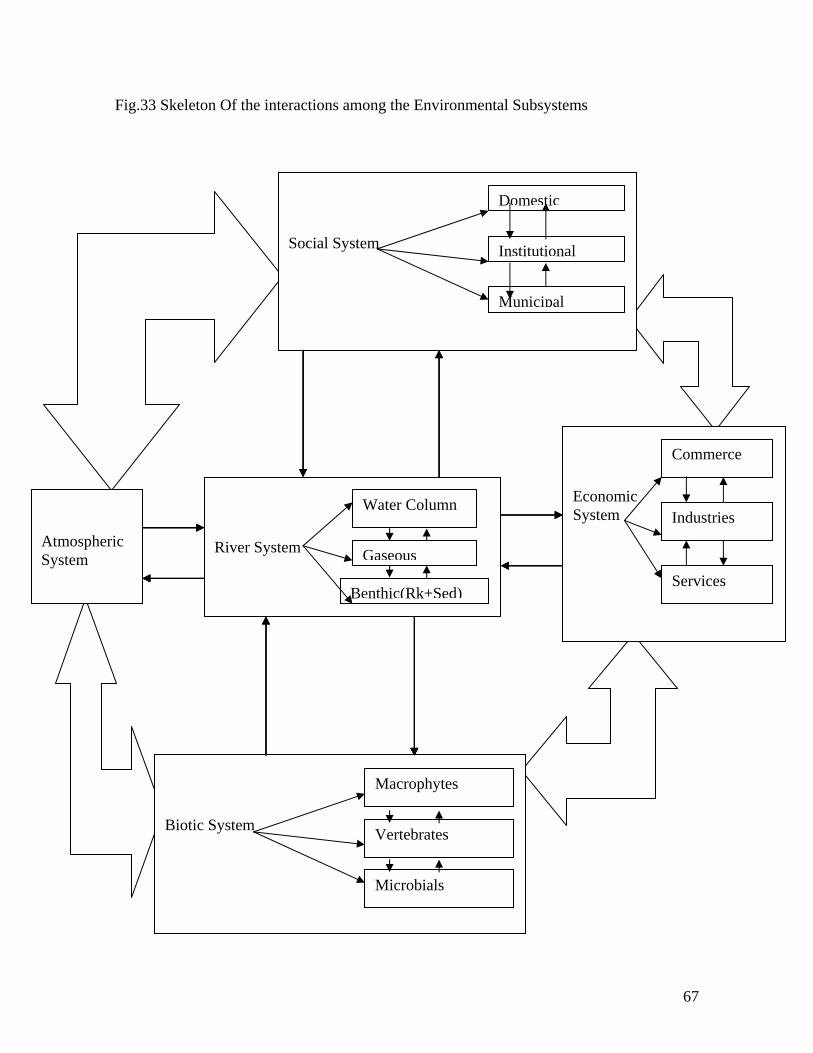
conceptual models of interactions between a river system and the other
environmental subcomponents along with the biophysical processes are shown in
the figures 32 and 33 bellow.
The interacting components within a river system include the water column, the
gaseous substances (volatiles), and the sediments or bed rocks. Precipitation,
dissolution, adsorption and desorption of materials are the common processes
which occur among the components within the river system itself. This together
with interactions between the river and other subsystems determine the relative
66
concentration of matter (e.g. DO, heavy metals, and other pollutants) in the water
column. Instance of such interactions has been observed in TAR sediments trace
elements analyses data of Samuel et.al. 2004 that shows a generally declining
trend for the concentration of trace elements (e.g. Cr, Mn) in the downstream
direction. Incontrast to this however, their concentration in the water column have
an increasing trend down wards as depicted in the data by Samuel et.al.2005 and
EPA, 2005/6.
Moreover the river system also interacts with the atmospheric system though
exchange of gaseous (volatile) substances, precipitation and evaporation, wet and
dry deposition of atmospheric pollutants (e.g. nitrogen and sulphur oxides). This
has also been revealed in the temporal variations of the TAR flow, level, and DO
concentrations.
Besides, it also interacts with the economic system and serves as a recipient of
production wastes that are rich in BOD and COD and in some production and
commercial activities the river water is abstracted and used as input. Such
interactions of the TAR is observed in pollutants load which have typical
characteristics of their sources.
Moreover it receives all sorts of consumption wastes from the social system
(domestics, institutions and municipalities) and gives off recreational, domestic
and other services. However if impaired only diseases causing agents will the
society receive.
In addition the river system also interacts with the life systems that occur within the
river (e.g. microorganisms, fish, algae and weeds) and also gets shelter from
pollutants runoff. And the vegetation cover in the riparian areas also shade the
river from solar radiation. Here the interaction can be considered as symbiotic. The
river serves as habitat and gives of nutrients for the life system. And the microbial
community attempts to purify it from organic contaminants. Moreover, the riparian
vegetation filters the pollutants load from runoffs and gets its mineral and water
demands from the nearby river water. Therefore, the full skeleton of interaction
among the environmental systems is presented bellow (fig.32).
67
Fig.33 Skeleton Of the interactions among the Environmental Subsystems II
Social System
Domestic
Institutional
Municipal
River System
Atmospheric System
Economic System
Biotic System
Water Column
Gaseous
Benthic(Rk+Sed)
Macrophytes
Vertebrates
Microbials
Commerce
Industries
Services
Social System
Domestic
Institutional
Municipal
River System
Atmospheric System
Economic System
Biotic System
Water Column
Gaseous
Benthic(Rk+Sed)
Macrophytes
Vertebrates
Microbials
Commerce
Industries
Services
Social System
Domestic
Institutional
Municipal
River System
Atmospheric System
Economic System
Biotic System
Water Column
Gaseous
Benthic(Rk+Sed)
Macrophytes
Vertebrates
Microbials
Commerce
Industries
Services
68
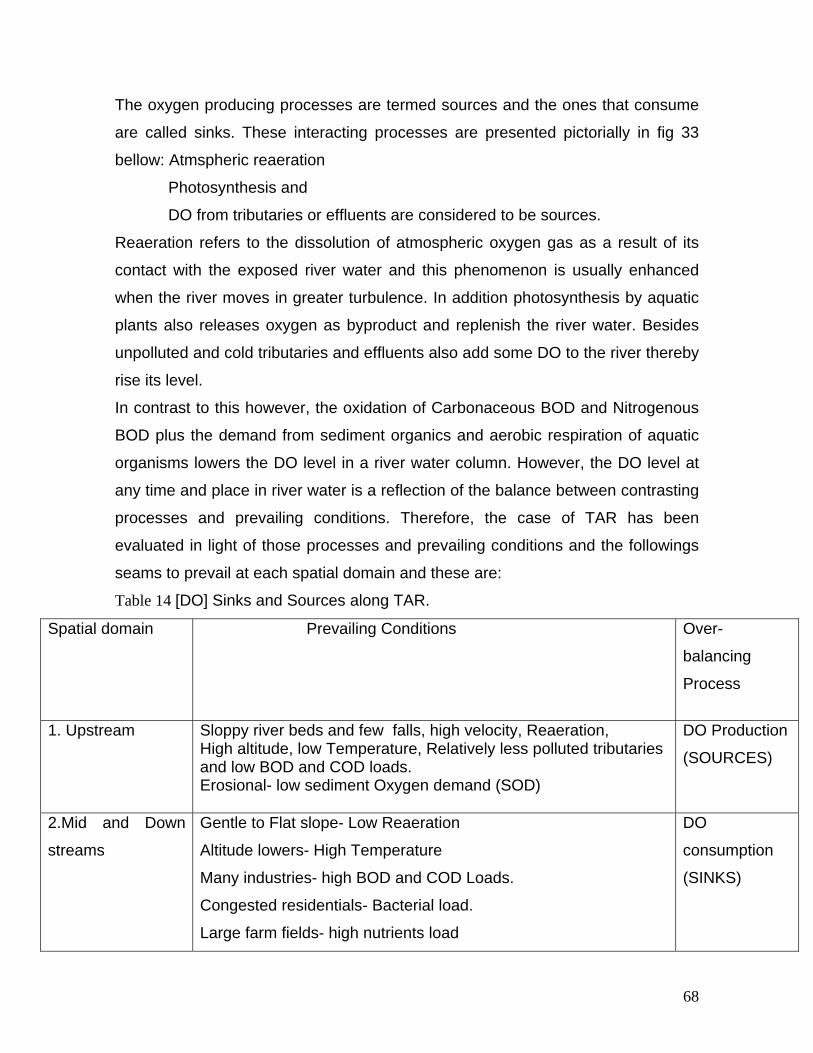
The oxygen producing processes are termed sources and the ones that consume
are called sinks. These interacting processes are presented pictorially in fig 33
bellow: Atmspheric reaeration
Photosynthesis and
DO from tributaries or effluents are considered to be sources.
Reaeration refers to the dissolution of atmospheric oxygen gas as a result of its
contact with the exposed river water and this phenomenon is usually enhanced
when the river moves in greater turbulence. In addition photosynthesis by aquatic
plants also releases oxygen as byproduct and replenish the river water. Besides
unpolluted and cold tributaries and effluents also add some DO to the river thereby
rise its level.
In contrast to this however, the oxidation of Carbonaceous BOD and Nitrogenous
BOD plus the demand from sediment organics and aerobic respiration of aquatic
organisms lowers the DO level in a river water column. However, the DO level at
any time and place in river water is a reflection of the balance between contrasting
processes and prevailing conditions. Therefore, the case of TAR has been
evaluated in light of those processes and prevailing conditions and the followings
seams to prevail at each spatial domain and these are:
Table 14 [DO] Sinks and Sources along TAR.
Spatial domain
Prevailing Conditions Over-
balancing
Process
1. Upstream Sloppy river beds and few falls, high velocity, Reaeration, High altitude, low Temperature, Relatively less polluted tributaries and low BOD and COD loads. Erosional- low sediment Oxygen demand (SOD)
DO Production
(SOURCES)
2.Mid and Down
streams
Gentle to Flat slope- Low Reaeration
Altitude lowers- High Temperature
Many industries- high BOD and COD Loads.
Congested residentials- Bacterial load.
Large farm fields- high nutrients load
DO
consumption
(SINKS)
69
Depositional- High Sediment Oxygen Demand (SOD)
These interactions are also displayed in the conceptual model in fig.33.
Fig.34 Sources and Sinks of DO in the river
[DO] SOURCES
Reaeration from the DO from Tributaries Photosynthetic Atmosphere or effluents Production
Oxidation of SOD Algal Respiration
Oxidation Of CBOD NBOD [DO] SINKS
Water Column [DO] Concentration
70
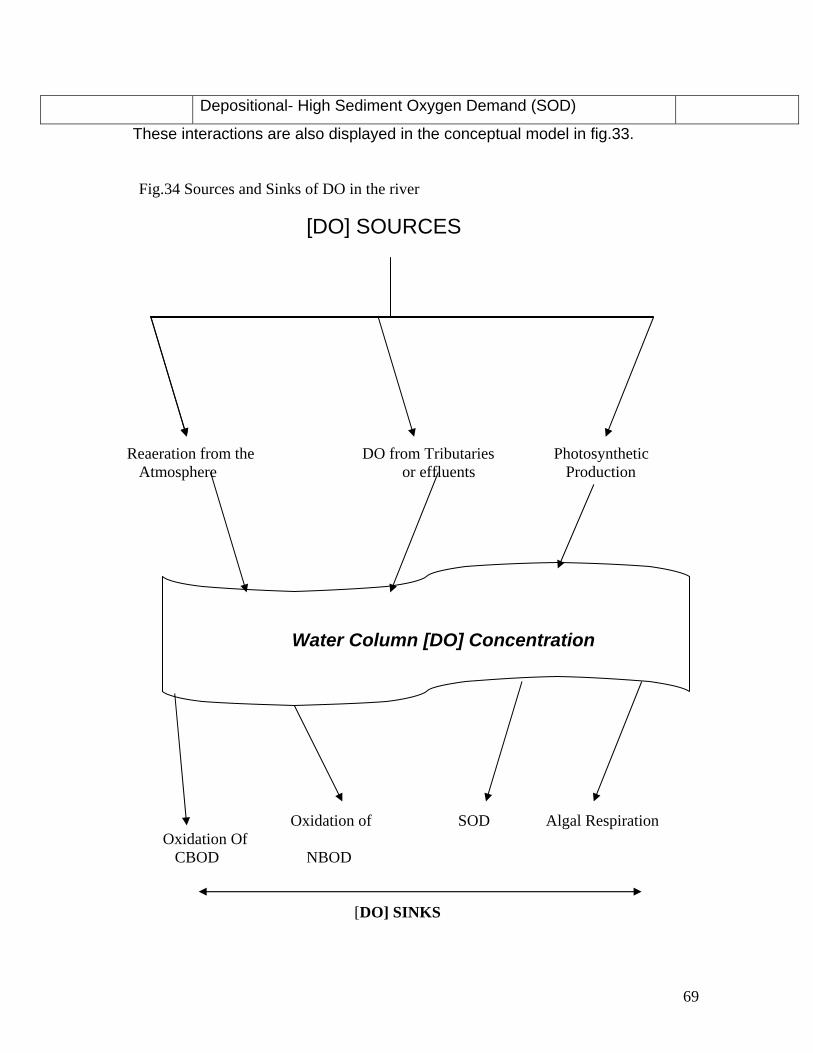
5.3.3 Instances Of Biochemical and Physical Factors In Control of [DO] Patterns Every rise in BOD5, COD and Temperature is observed to be accompanied with a fall in DO level and vice versa.
Fig.35 BOD5 in control of the peak effluents discharge DO pattern along TAR and tributaries Shankla and Lideta.
DO Trend Along TAR and Tributaries Shankla and Lideta
Figure 36 COD In control of the DO pattern along TAR
72
DO Pattern For Low Flow Season(2000)
0
1
2
3
4
5
6
Midstream Downstream Downstream
Spatial Extent
DO Con
centratio
n(mg/l)
DO (mg/l)
Temp(oC) Variation Incontrol of DO Pattern
0
5
10
15
20
25
30
Midstream Downstream Downstream
Spatial Extent
DO Con
centratio
n(mg/l)
Temp(oC)
Fig.37 Temperature in control of DO along TAR.
73
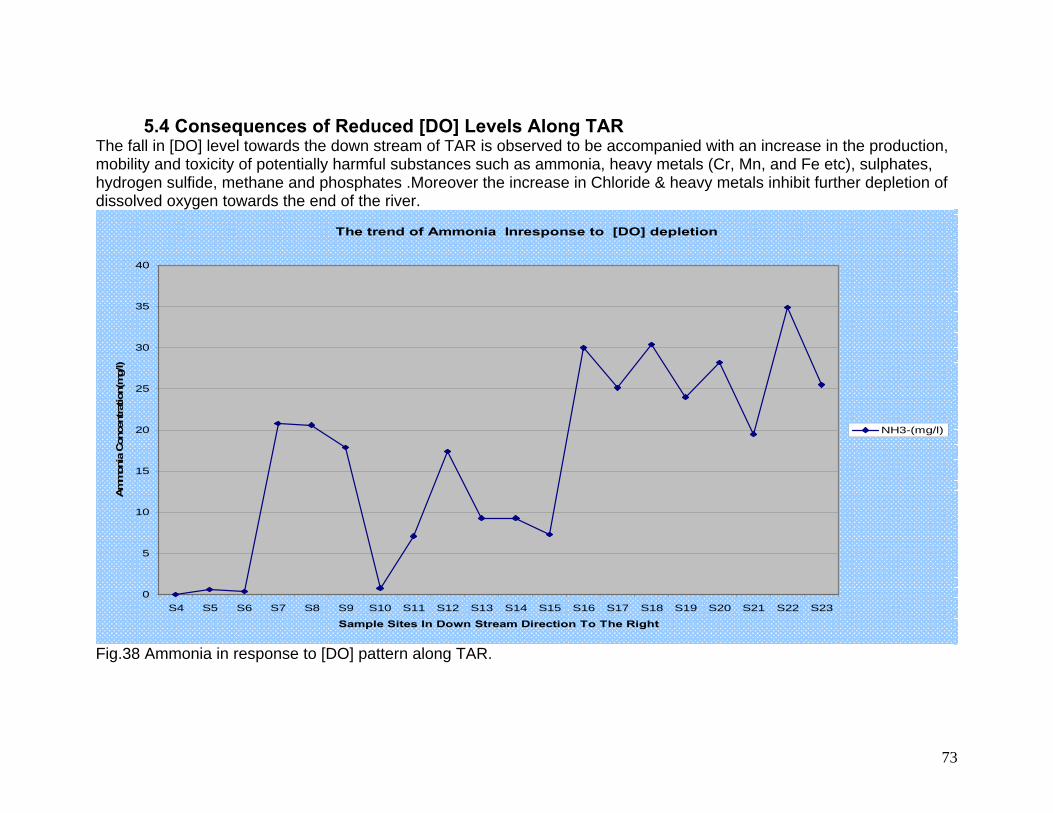
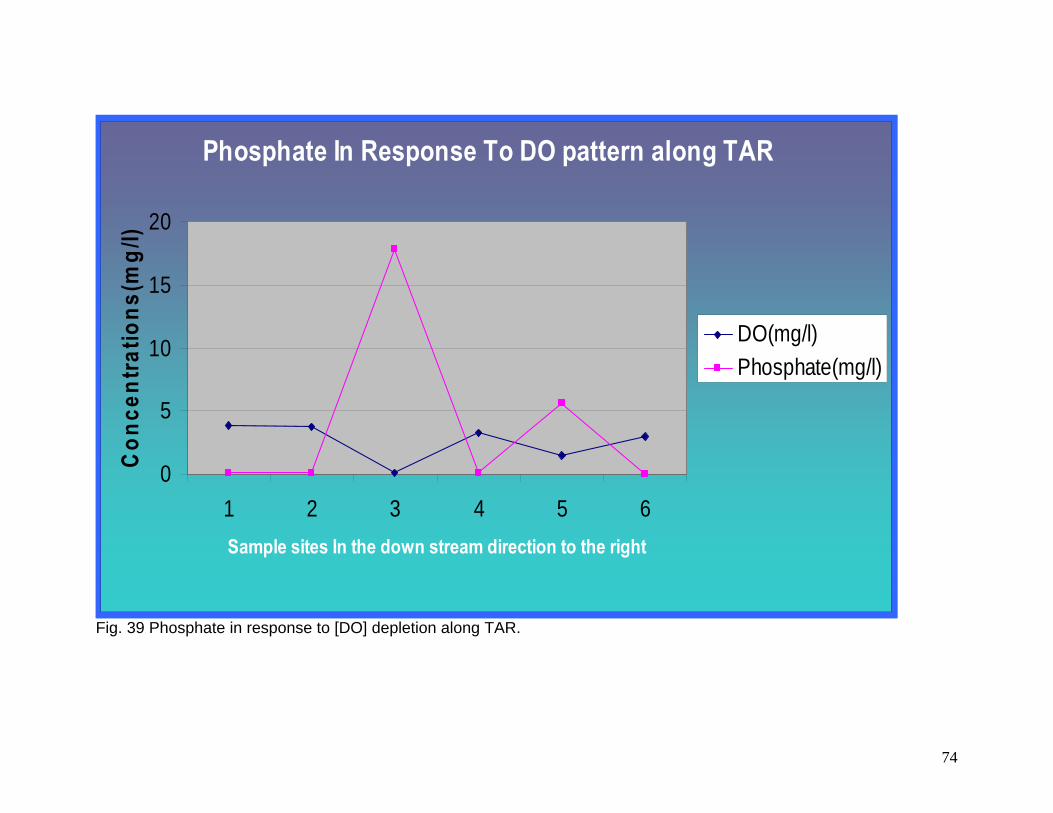
5.4 Consequences of Reduced [DO] Levels Along TAR The fall in [DO] level towards the down stream of TAR is observed to be accompanied with an increase in the production, mobility and toxicity of potentially harmful substances such as ammonia, heavy metals (Cr, Mn, and Fe etc), sulphates, hydrogen sulfide, methane and phosphates .Moreover the increase in Chloride & heavy metals inhibit further depletion of dissolved oxygen towards the end of the river.
Sample Sites In Down Stream Direction To The Right
Am
mon
ia C
once
ntra
tion(
mg/
l)
NH3-(mg/l)
Fig.38 Ammonia in response to [DO] pattern along TAR.
74
Phosphate In Response To DO pattern along TAR
0
5
10
15
20
1 2 3 4 5 6Sample sites In the down stream direction to the right
Con
cent
ratio
ns(m
g/l)
DO(mg/l)Phosphate(mg/l)
Fig. 39 Phosphate in response to [DO] depletion along TAR.
75
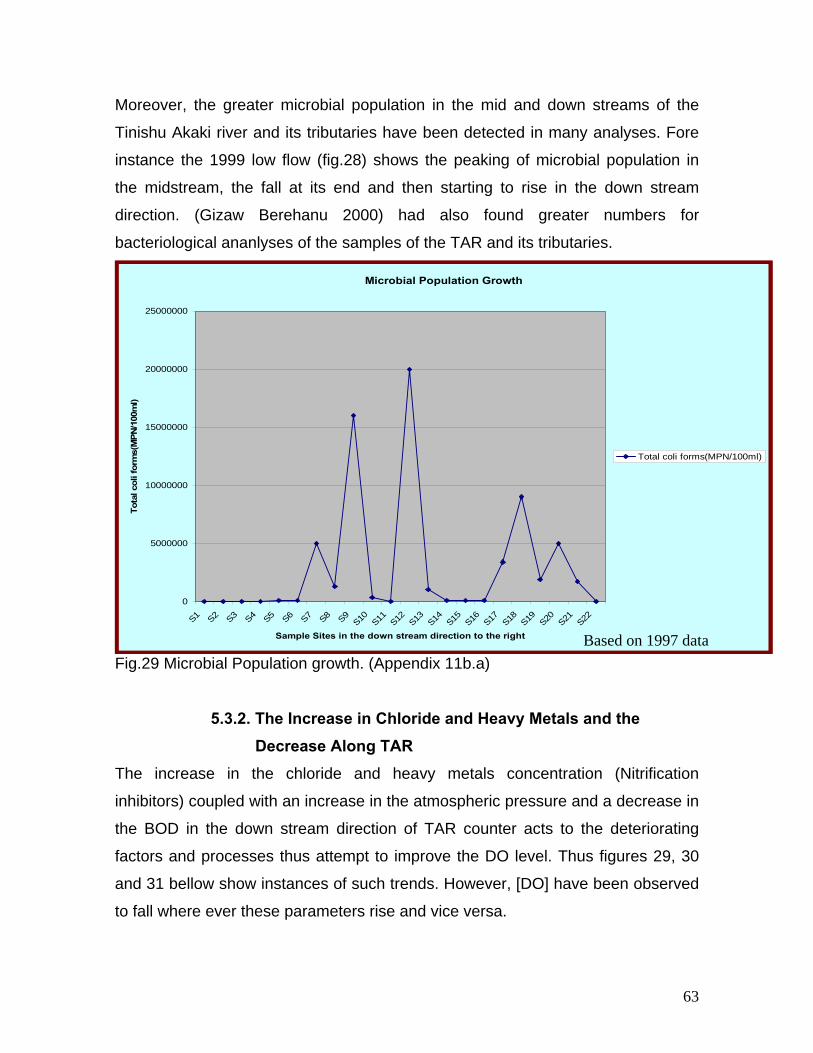
6. DISCUSSION AND INTERPRETATION The graph for the year 1997 low flow period depicts that more than 68% of the
samples representative of the three spatial domains had <= 3mg/l DO values as
a result the greater portion of the river suffers from DO depletion despite the fact
that the midstream case is the worst, where the majority of the 68% impaired
samples are congested. And this can be attributed to the rise in the atmospheric
and water temperatures and then microbial or chemical activities, the fall in the
volume and velocity of the river water and to the closely spaced industrial
establishments that gave the river lesser time to maintain its assimilative capacity
and greatly declined its oxygen holding capacity. Moreover, the average [DO]
value for the up stream domain is greater than the midstream which in turn
exceeds the down stream.
But the trend is almost similar for the years 2002/03, and 2003/04 low flow
periods and the only exception is the year 2000 low flow period which shows an
anomalous DO value in the midstream that is 7mg/l which can be justified with
the prevailing low temperature (i.e. 9.6 0C) in the same location and with possible
thermal pollution (high temperature) in the down stream.
However, the condition got better in the 1999 Moderate flow temporal period and
only slightly greater than 45% of the samples exhibit the critical DO value(i.e. <
3mg/l) and this can be associated with the relative increase in the streams flow
velocity and volume of water in the rivers. But still in this temporal period the mid
and down streams were the hotspots in terms of DO depletion as all of the 45%
spoiled samples were from these spatial extents. And the trend is more or less
similar with the 2005 and 2007 moderate flow seasons.
Moreover, in the 1997 high flow period the situation was much better than any
other temporal period, consequently more than 86% of the samples collected to
represent the whole of the river’s spatial extents, had DO values greater than
5mg/l. But the minimum DO values still correspond to the midstream spatial
domain and again the pattern is almost similar with the year 2005/06 high flow
period; however, the general improvement in DO level pertaining to this temporal
period can be accounted by the high amount and rate of precipitation that causes
76
in an increase in surface runoff and stream velocity which improves the rates of
atmospheric reaeration and mixing at the surface of rapidly moving or turbulent
river water. Besides, the decline in the daily temperature values in this season,
which reduced the chemical and microbial activities also greatly, improves the
DO level in the river water. Therefore, low flow temporal period and the
Midstream are found to be the critical temporal and spatial extents in terms of DO
depletion along Tinishu Akaki River.
Besides, the analysis of the physicochemical data have shown that the DO level
for the samples collected and analyzed to represent the date where there was
little or no industrial activities, every thing else taken as control is much better
than the DO values of the samples associated with the intense industrial
activities. Four out of the five samples analyzed for little discharge scenario
exhibit DO values greater than 3mg/l; however, among the six samples that
represent the peak industrial discharge scenario five of them have DO values
below 1mg/l. Therefore, it has become evident from the above discussion that
unpermitted industrial waste waters are the major contributors of oxygen
demanding wastes in particular and the pollution of TAR in general.
Besides, the temporal and spatial variation in the extent of DO depletion and or
pollution along the TAR was accounted for with the analysis of factors that
control the production (Sources) and consumption (sinks) of dissolved oxygen
(DO) in the river water column. As a result it has become possible to detect
differences in the kind of processes and factors that prevail and control the DO
depletion and or production at various spatial domains along the river. And for
the majority of the temporal periods and till the end of the mid streams spatial
extents, BOD and COD (Biochemical Oxygen Demand and Chemical Oxygen
Demand) are in control of the DO trend along the river.
However, BOD and anaerobic chemical reactions along with increasing
atmospheric pressure play an important role in determining the level of DO in the
downstream spatial domain i.e. clearly shown in the exactly contrasting BOD5,
COD, PO4 Vs DO trends and generally Matching NH3 Vs DO patterns
respectively. Generally the Salinity (TDS), temperature, microbial population and
77
atmospheric pressure, profiles along the river show an increasing trend in the
down stream direction parallel to the decreasing elevation and BOD. But they
have a contrasting effect on the solubility of the air (oxygen) at the surface of the
river water, the former three act negatively while the latter operates positively.
Moreover, the slope of the river bed becomes gentler in the down stream
direction resulting in a decline of the turbulent flow of the river which in turn
negatively affects the DO input that would otherwise be made available via
reaeration and mixing.
In contrast to this, the year 2000 low flow DO sag curve shows an anomalous
pattern and that can be associated to the anomalously low temperature in the
midstream and the possible thermal pollution in the down stream hence the trend
can be better accounted with temperature profile. Above all the reduced [DO]
level is observed to be accompanied with the downward increment in the
concentrations of harmful substances such as NH3, H2S, PO4, SO4 and heavy
metals like, Cr, Mn and Fe. And increasing chloride concentrations have also
been observed in all the years (Appendices 11a, 11b, 11c, 16a- 16f).
78
7. CONCLUSIONS AND RECOMMENDATIONS
7.1 Conclusions The environment has not been featured on the development agenda in the past
since the project evaluation and decision making mechanisms have focused on
short-term technical feasibility and economic benefits. Past development
practices have not anticipated, eliminated or mitigated potential environmental
problems early in the planning process. This has resulted in a situation where the
city experiences a serious degraded natural environment. DO depletion or water pollution along TAR is prevalent in all the three spatial
domains (i.e. the up, mid & down Streams) and temporal periods (i.e. the high
flow, Moderate Flow, and Low Flow periods).
In most cases DO levels are bellow the in stream water quality standard and
occasionally become zero.
But the mid stream and low flow period are the worst in terms of dissolved
oxygen depletion and or pollution.
Moreover the DO depletion is found to be severe with intense industrial activities
and therefore industries are the major sources of pollutants in general and ODW
in particular. The Industrial effluents also violated the Ethiopian provisional
effluents discharge limits (Appendix 18). Industries are followed by the domestic and other nonpoint sources in their role
of polluting the TAR as shown clearly in the effluent discharge scenarios
analyses.
Besides the increase in temperature, Atmospheric pressure, Salinity, River water
Volume, microbial population, (Oxidation-Reduction), the number of industrial
establishments, the size and number of farm lands coupled with the decreasing
elevation, forest cover and stream velocity interact govern the spatio-temporal
DO trends along the course of Tinishu Akaki River.
In addition to this the exceptionally high concentrations of the industrial,
commercial, residential, institutional and service centers in the midstream spatial
domain are attributed to exacerbate the problem at this particular spatial extent
79
by giving lesser time for the river and its tributaries to remaintain their
assimilative capacities
It is also possible to conclude that the dominant causes of DO depletion and
pollution of TAR water are BOD and COD rather than the nutrients.
Moreover, the rise in the concentrations above the in-stream, drinking water
standards of the potentially harmful substances such as ammonia, sulphates,
phosphates, hydrogen sulfides, and heavy metals (Cr, Mn and Fe…etc.) to wards
the downstream is associated to a generally declining [DO] level.
In addition the increase in the toxic substances downstream ward is believed to
pose potential public health problems to the residents.
However the relatively improved DO levels near the reach of the river can be a
result of inhibition of microbial nitrification due to increasing concentration of
chlorides and heavy metals in the same direction.
Lastly it is also possible to conclude that further development has the potential to
exacerbate the damage of fragile riverine systems. Thus proper and cost
effective mitigation measures must be sought.
7.2 Recommendations
Environmental assessment and management have been recognized as effective
tools for facilitating the inclusion of the principles of sustainable development into
development proposals. Thus to ensure that the existing situations get improved
and future developments in Addis are sustainable it is essential to integrate
environmental concerns into development activities.
In line with this and knowing that Biochemical (i.e. CBOD and NBOD) and
Chemical Oxygen demands as, the dominant impairing substances in the TAR
and industries as the largest contributors;
Total Maximum Daily Loads (TMDLs) for Oxygen Demanding Wastes
(ODW) must be designed to implement applicable water quality standards
that enable the maintenance of DO standards. And the design should
include and consider the followings:
80
• A total allowable load as well as individual waste load
allocations for point sources.
• The impacts of background pollutant contributions.
• Critical environmental conditions.
• Seasonal environmental variations.
• A margin of safety (MOS) and
• Public participation.
Besides Industrial effluents discharges must be regulated and monitored
regularly by the concerned environmental bureaus.
And industries must be forced by law to comply with provisional discharge
permit limits whenever they violate.
The waste water collection capacity of the city must be improved and
Proper waste disposal or sewage treatment prior to discharge to surface
waters has to be practiced by the municipal WWTPs and industries so as
to minimize the BOD and bacteriological pollution loads emanating from
domestic and other sources.
Moreover, Vegetation cover alongside streams has to be maintained and
enhanced so as to shade the water and filter pollutants from the runoff or
nonpoint sources.
Anthropogenic activities such as, Agricultural practices, Livestock rearing,
Construction, Chemicals storage and handling and waste disposal in the
project areas should be carried out in such away that impacts to the
riverine system and or the whole environment is minimal.
81
8. REFERENCES
1. Aynalem Ali, 1997, Water Quality and Groundwater / River Interaction in the Sekelo Basin (Lower Akaki River Sub-Basin). M.Sc. Thesis, Addis Ababa University. Addis Ababa, Ethiopia.
2. ANZECC/ARMCANZ, October 2000, Australian and New Zealand Guidelines for Fresh and Marine Water Quality. Australia.
3. Calfed Bay Delta Program, July 2000, Low Dissolved Oxygen Concentration and Oxygen Demanding Wastes, Stockton Water Quality Program Plan USA.
4. Cleveland J. 1998, Water Quality and Dissolved Oxygen, for science junction, NC State University. USA.
5. Carla W. Montgomery, 2000, Environmental Geology, 5th ed. Mc Grawhill Pub.
6. Central Statistical Authority, 1999, Population and Housing Censuses of Addis Ababa, Analytical Report Vol.II, Addis Ababa.
7. Connell, D.W., and Miller, G.J. 1984. Chemistry and Ecotoxicology of Pollution. John Wiley & Sons, N.Y.
8. Demlie Molla, Wohnlich & Stefan, Nov. 2006, Soil and groundwater pollution of an urban catchment by trace metals: case study of the Addis Ababa region, central Ethiopia, Environmental Geology, Volume 51, Number 3, pp. 421-431(11), Springer.
9. Environmental Protection Authority. 1999. National Profile to Assess the National Infrastructure for the Management of Chemicals in Ethiopia. Addis Ababa
10. Environmental Protections Authority, 2001, Large and Small Scale Industries in Ethiopia, Vol 1. Addis Ababa, Ethiopia.
11. Environmental Protection Authority, 2002, Report on the of Status in great and little Akaki river, Addis Ababa, Ethiopia.
12. Environmental Protection Authority, AAEPB & OEPO, 2005, A Survey on pollution status of the Great Akaki, Little Akaki and Kebena Rivers, Addis Ababa, Ethiopia.
13. Girma Tadesse, Don Peden, & Peter McCornick, 2005, Extent and significant use of low quality water in agriculture: The case of Addis Ababa Catchments the upland of the Awash Basin, Addis Ababa, Ethiopia.
14. Gizaw Berhanu Asfaw, Oct.2000, Hydrochemical and Environmental Investigation of the Addis Ababa Region, PhD Thesis, Ludwig-Maxmillan University of Munich, German.
15. Ghirmay Z., 2000, Industrial waste Management and environmental Pollution in Addis Ababa. Workshop on situation of Industrial Pollution, AAEPB, A.A
16. Haile Sellasie Girmaye and Getaneh Assefa, 1989, The Addis Ababa Nazareth Volcanics A Miocene-Pleistocene Volcanic Succession in Ethiopian Rift. SINET, 12(1), Addis Ababa.
17. Hem J.D. 1989, Study and Interpretation of chemical characteristics of natural water, 3rd ed. USGS Water Supply Paper 2254, 264p.
82
18. Kehew Alan E., 2001, Applied Chemical Hydrogeology, Printice Hall, Inc. New Jersey.
19. Mohammed Ali Mohammed, Sept. 2002, Industrial pollution and It’s Impacts on the little Akaki River, MSc thesis, Loughborough University, UK.
20. Mills W.B, V.H. Colber and J. D. Dean, 1979, Hand held Calculator Programs for Analysis of River Quality interactions, Supplemental Volume to: Water Quality Assessment, A screening methods for Nondesignated 208 Areas, USEPA.
21. Samuel Melaku, Tadesse Wondimu, R.Dams and L.Moens, 2004, Simultaneous Determination of Trace Elements in the Tinishu Akaki River Water Sample, Ethiopia, by ICP-MS. Gent University Belgium and Addis Ababa university, Addis Ababa, Ethiopia.
22. Samuel Melaku, Tadesse Wondimu, R.Dams and L.Moens,2005, Multi-element Analysis of Tinishu Akaki River Sediment, Gent University Belgium and Addis Ababa university, Addis Ababa, Ethiopia.
23. Samuel Melaku , Tadesse Wondimu, R.Dams and L.Moens,2007 ,Pollution status of Tinishu Akaki river and its tributaries (Ethiopia) evaluated using physico-chemical parameters, major ions, and nutrients, Bulletin of the chemical society of Ethiopia Vol.21 no.1 (pp. 13 - 22)
24. Santra S.C., Jan 2004, Environmental Science, New Central Books Agency (P) Ltd. India.
25. Solomon Tale, June 2000, The Extent of Surface and Ground Water Pollution in Addis Ababa, MSc Thesis, Addis Ababa University.
26. Susan E.Kegley & Joy Andrews, 1998, The Chemistry of Water, University Science Books, Sausalito, California.
27. SBPDA, 2003, Solid Waste Management status Report of Addis Ababa, Addis Ababa, Ethiopia.
28. Tadesse Bekele, Girma Tadesse, & Don Peden, 2004, Community Based Traditional Irrigation schemes performance: A case of Upper Awash River Basin of the Addis Ababa Subcatchments, Addis Ababa, Ethiopia.
29. Tamiru Alemayehu, 2001, The impact of uncontrolled waste disposal on surface water quality in Addis Ababa. SINET: Ethiopian Journal of Science 24(1):93-104
30. Tamiru Alemayehu, Tenalem Ayenew, Dagnachew Legesse, Yirga Tadesse, Solomon Waltenigus and Nuri Mohammed, 2003, Ground Water Vulnerability Mapping of the Addis Ababa Water supply Aquifers, Scientific Report, Addis Ababa, Ethiopia.
31. US EPA, 2001, TMDLs of CBOD and NBOD for the Little Youghiogheny River, Maryland Department of Environment. Maryland.
32. US EPA 1985, Water Quality Assessment: A Screening Procedure for Toxic and Conventional Pollutants in Surface and Ground Water, part I, JACA Corporation, Athens Georgia.
34. Washington State Department of Ecology, Jan. 2002, Dissolved Oxygen and water quality Standards, Pub. No. 02-10-001, USA.
83
9. APPENDICES Appendix 1 Monthly Rainfall Data for the Years (1975-2005) at Akaki mission Station. NATIONAL METEOROLOGICAL SERVICES AGENCY Element: Monthly Rainfall Lat 08o.52' Altitude 2120mt Region: SHOA Long. 38o.48' Station: AKAKI MISSION Year Jan Feb Mar Apr May Jun Jul Aug Sep Oct Nov Dec
Appendix 2 Monthly Mean Min. Temp.( oc) NATIONAL METEOROLOGICAL SERVICES AGENCY Element Alt. 2120mt Region Shoa Long. 38o.48' Station Akaki Lat. 8o.52' Year Jan Feb Mar Apr May Jun Jul Aug Sep Oct Nov Dec
Appendix (11a.a) Seasonal Water quality Analysis results of Little Akaki River Dry Season Physical Analysis Results (EPB 2002) Sample sites Date Temp(oC) PH SS DS Odour S1 28-02-1997 19 8.2 5.4 179 Non
Appendix (11d) Sample sites location for EPB 2002 data Sample No. Sample Sites Locality Distance (Km) Remark S1 Behind Anbessa Garage before the river enters a residential area nearby 0 One of the
source streams TAR Tributary
S2 Shegole River where a stream from rufael area meets a tributary of TAR 1.1 S3 Near medhanealem School at a bridge 1.5 S4 Below Ethiopian Marble Factory (rocky Basin) 2.1 S5 To the Right of Taiwan Tera 2.7 S6 Main Kolfe Bridge 3.2 S7 Behind Ehil berenda 3.8 S8 To the Right of Amanuel Total 4.3 S9 Gimira Sefera 5 S10 Infront of Coca Cola Factory 6.2 S11 Past lideta Health Center 7.1 S12 Below the National Tobacco and Matches Factory 8.4 S13 Below Addis Ababa Abattoirs (Kera Sefer) 10.4 S14 Down the National Alcohol and Liqour Factory 12.4 At a point a little
below where TAR and Mekanisa Rivers Meet
S15 Gofa Sefer Between Gofa EELPA and Gofa Military Camp 14.88 S16 Inside the behere Tsege park after the Ethiopickling effluent enters 16.42 S17 Infront of Walia Tannery 19.0 S18 Behind Kality WWTP at the Gorge 21.9 S19 Down Kality EELPA 25.7 During the rainy
seasons TAR over floods the nearby Farms
S20 Chefe Mettele Farmers association (oromia region) 30.5 >> S21 Hechu Farmers Association at the inlet point of the Aba Samuel Dam 34.3602 >>
111
S22 Dewera Tino Farmers association at the outlet of Aba Samuel Dam 42.9561 The surface of the entire catchment of the dam is covered with the hyacinth plant
Generally the above Sample sites are grouped in to: * Upstream S1-S5 Mid Stream S6-S15 & Down Stream S16-S22 Appendix (12) May 1999
Appendix (14a) Nutrients and major ions composition of water samples taken along the course of TAR (Nov-Jan, 2003/2004) Site Ca2+(mg/l) Mg2+(mg/l) Cl-(mg/l) SO4
2-(mg/l) HCO3-
(mg/l)
NO3-(mg/l) NO2
-(mg/l) NH3-(mg/l) PO4
3-(mg/l)
S4 22 3.4 4.5 10.2 87 2.64 - - 0.06
S5 19 7.3 19.5 4.9 87.8 1.85 - 0.6 0.05
S6 45 16 22 - 198 4.29 0.12 0.4 0.04
S7 38 8.3 88 65.4 199 - - 20.8 0.85
S8 32 11.7 108 65.7 185 - - 20.6 0.67
S9 40 14.6 129 37.2 212 - - 17.9 0.18
S10 37 11.2 21.5 - 154 5.83 0.42 0.8 0.1
S11 48 15.6 189 70.8 198 9.24 1.06 7.1 0.14
S12 63 20.9 85 - 381 - 0.15 17.4 4.95
S13 54 16 193 56.7 234 5.86 1.03 9.3 1.52
S14 50 17 154 63.1 251 1.72 0.3 9.3 1.8
S15 58 16.5 156 60.6 234 5.72 1.22 7.3 1.72
S16 58 28.2 159 15.1 429 - - 30 14.8
S17 64 23.8 138 39.1 332 - - 25.1 5.21
S18 64 31.6 125 33.4 386 - - 30.4 6.05
S19 64 36 112 28.8 395 - - 24 8.64
S20 65 26.3 115 27.8 412 - - 28.2 7.32
S21 64 23.3 121 25.2 417 - - 19.5 6.45
115
S22 67 19 91 22.9 437 - - 34.9 9.63
S23 61 17.5 87.5 23.3 407 - - 25.5 8.77
World
Rivers
Average
8.0 2.4 3.9 4.8 30.5 0.1 - - 0.01
Appendix (15) Extracted and Arranged after EPA Monitoring Data for the Years 2005 and 2006 arranged for spatial extents.
YEAR WATER COARSE MONTH DO(mg/l) 2005 Upstream Aug 7.21
2005 Upstream Mar 5.8 2006 Upstream Aug 5.4 2005 Midstream Aug 5.36 2005 Midstream Mar 0.32 2006 Midstream Aug 0.33 2005 Down Stream Aug 3.23
2005 Down Stream Mar 5.8 2006 down Stream Aug 2.82 2006 Down Stream Aug 4.84
116
Appendix (16a) Extracted and Arranged after EPA
Data Produced by: Environmental Pollution Control Department and Environmental Laboratory Service Year Aug 2005
GPS Reading Parameters
Physical Chemical Microbiolo-gical
S. No
Sampling Site
Loca- tion
Eleva- tion M pH EC Do2 Tem Turb NH3 Po4
3- SO42- Cl- F-
NO2-
NO3-
Fe Mn Al Pb Cr BOD5 COD Ca2+ K+1 Mg2+ Na+1 Hard-
ness FaecaColi-form
2 Little Akaki River on Arbegnoch street above Gulele Shirt Factory
Appendix (17) Ethiopian Drinking Water Quality Standards Parameter Maximum permissible limit (mg/l unless otherwise stated) Turbidity (NTU) 25 Color Units 50 Odour and Taste Unobjectionable Calcium 200 Chloride 600 Copper 1.5 Flouride 1.5 Ammonia 0.10 Iron 1.0 Manganese 0.5 Magnesium 150 PH 6.5-9.2 Nitrate 10 Arsenic 0.05 Cadmium 0.01 Hexavalent Chromium 0.05 Lead 0.1 Selenium 0.01 Total mercury 0.001 Total Coliform MPN/100ml 10 E. Coli, MPN/100ml Nil
123
Appendix (18) Provisional Effluents permit limit for all categories of existing industries in Ethiopia (EPA 2001, Vol. 3) Basic Parameters Limit for discharges into surface water