University of New Mexico UNM Digital Repository Himalayan Research Papers Archive Nepal Study Center 9-27-2007 Effects of Deforestation on Tree Diversity and Livelihoods of Local Community A Case Study from Nepal Krishna Karkee Follow this and additional works at: hps://digitalrepository.unm.edu/nsc_research is Article is brought to you for free and open access by the Nepal Study Center at UNM Digital Repository. It has been accepted for inclusion in Himalayan Research Papers Archive by an authorized administrator of UNM Digital Repository. For more information, please contact [email protected]. Recommended Citation Karkee, Krishna. "Effects of Deforestation on Tree Diversity and Livelihoods of Local Community A Case Study from Nepal." (2007). hps://digitalrepository.unm.edu/nsc_research/60
Transcript
University of New MexicoUNM Digital Repository
Himalayan Research Papers Archive Nepal Study Center
9-27-2007
Effects of Deforestation on Tree Diversity andLivelihoods of Local Community A Case Studyfrom NepalKrishna Karkee
Follow this and additional works at: https://digitalrepository.unm.edu/nsc_research
This Article is brought to you for free and open access by the Nepal Study Center at UNM Digital Repository. It has been accepted for inclusion inHimalayan Research Papers Archive by an authorized administrator of UNM Digital Repository. For more information, please contact [email protected].
Recommended CitationKarkee, Krishna. "Effects of Deforestation on Tree Diversity and Livelihoods of Local Community A Case Study from Nepal." (2007).https://digitalrepository.unm.edu/nsc_research/60
Effects of Deforestation on Tree Diversity and Livelihoods of Local
Community A Case Study from Nepal
By Krishna Karkee1
Abstract
The objectives of this study were to assess the status and trend of deforestation in the
Shiwalik region of the central Nepal, and to explore the most significant effects of community forestry on tree diversity and livelihood of the local community. Two sites, heavily deforested in the past and one being presently owned by the government, the other managed by the local community for about 15 years, were compared with respect to tree and tree seedlings diversity and livelihood capitals. To analyze the diversity indices Hill’s diversity numbers, Shannon’s index and Importance value percentage were measured, whereas livelihood parameters were compared using the livelihood capitals model. The participatory approach was adopted to collect socio-economic data of the study sites.
Community forestry helped increase the number of tree species as well as individuals. However, the study failed to state that the protection of forest from deforestation for a short period of time changed the diversity indices. Nevertheless, by protection the trend of an increased number of tree species coming as seedlings was obvious. Hence, the hypothesis that deforestation changes the tree diversity was proved.
The study revealed that community forestry increased tree and wild animals, decreased soil erosion and checked the flooding in gullies and flow of debris. In the Government owned forest, soil erosion was rampant and had led to the decrease in agriculture productivity of the study area. The study also supported the fact that the protection of forest from deforestation by local people positively increased the majority of livelihood parameters. Thus, the hypothesis that the protection of forest from deforestation will have positive effects on livelihood of local people was accepted. Key words: community forestry, deforestration, Siwaliks
1 Present address: Centre for Disaster Management Studies, Nepal. GPO Box: 15142, KPC 256, Kathmandu, Nepal. Email: [email protected] or [email protected]
Background Forest is one of the main natural resources of Nepal. In 2001 alone the revenue from forest products was about NRs. 476.3 million (8.6% of the total revenue) (CBS, 2002), which highlights the economic importance of the forest resources in the national economy. Apart from the economic importance at the national level, the forest resources also play an important role in the livelihoods for the majority of the rural population of the country. However, in the last few decades forests have been under tremendous pressure from an increasing human population and their ever growing demands for shelter, land for cultivation as well as their demands for fuel wood, timber and other forest products necessary for the livelihood. In addition, the forest areas have also been used for industrial and other development and construction activities, such as roads, buildings and electricity gridlines. As a consequence, within the period of 15 years (1964 – 1979) about 400,000 hectares or 7% of the total forest area has been cleared (EPC, 1993). Such an alarming scenario of deforestation has posed a growing threat to the natural as well as to the socio-economic environment of the nation as a whole. Immediate measures have now been recognized to save the remaining forest resources from potential decline in order to prevent and minimize the possible future adverse environmental and socio-economic consequences brought upon by the destruction of forest resources. Analyzing the causes of deforestation in historical and present context, the government of Nepal introduced the community forestry concept as a tool to mitigate deforestation and reduce poverty in Nepal (Dev et al, 2003). However, the community forestry has now been restricted only to some parts of the country. This study aims at analyzing the impacts of deforestation on tree diversity and peoples’ livelihoods, and compares community-managed and the government-owned forests in terms of their effectiveness to safeguard the biodiversity and benefiting local people in enhancing their livelihoods. Rationale of the Study The problem of deforestation is severe in the Terai (plain areas of the south bordering to Inida) and the Siwalik (fragile mountains of the south) regions of Nepal as compared to hills and the mountains. "In between 1978 and 1991, about 90,000 hectares of tropical Sal (Shorea robusta) forest in the Terai was cleared with an average rate of deforestation of 1.3 % per annum. As a result, from 6 million hectares of forest cover in 1964 it has now shrunk to 4.2 million hectares" (BISEP-ST, 2003). The Terai has changed from being a densely forested and sparsely populated area to a sparsely forested and densely populated region in the recent past, due to the increasing immigration of settlers from the Hills and the Mountains. The process of migration from the Hills and the Mountains to the plains of the Terai that began in the 1950s, following the eradication of malaria in the Terai, is still continuing. The growing population has placed an immense strain on the existing agricultural land base, and has led to encroachment into forestlands in the search for more cultivable land. The Siwaliks with their fragile soils and steep terrain are geologically and ecologically vulnerable. Their extensive forest cover has remained largely intact as compared to the Terai due to the relative
2
hospitability of the area for human settlement. However, pressure from the increasingly densely populated and deforested Terai and Mid Hills is leading to increasing pressure both for forest product collection and the opening up of new areas for cultivation in the Siwaliks. Development initiatives such as road constructions supplemented by growing encroachment and illegal logging has further increased the risk of deforestation in the Siwaliks as well. The impact of deforestation of the Siwaliks has already begun to have ecological and socio-economic implications for the Terai and inner Terai. Increased rates of soil erosion from the Siwaliks have a potential of leading to a rise in river beds and hence increased frequency of flooding, threatening settlements and cultivable land in the Terai. So far, no information has been recorded about the studies to assess the actual socio-economic and biodiversity loss of deforestation in the country. This study will provide a basis for the policy formulation fulfilling this obvious gap of scientific information. The implications of this study would have broader policy implications for most South Asian and African countries with have similar problems. Conceptual Framework A number of factors have contributed to the deforestation process in Nepal. Of them, shifting cultivation, overgrazing, illegal logging, unscientific cultivation in the hills, construction of physical infrastructures and collection of fuel wood, fodder and small timber for household consumption are the major ones. Once the deforestation occurs, soil organic matter and floral and fauna are lost, run-off is increased, soil is compacted and top soil is eroded. Deforestation reduces the number and varieties of various organisms, and damages ground vegetation. Destruction of vegetation and soil erosion lead to loss in the production potential of the land. It further leads to the loss in biodiversity, occurrence of landslides and floods and increase in land degradation. Based on the above mentioned conceptual framework, a causal loop diagram (CLD) was prepared (Figure 1). This explains the cause and consequence of deforestation in a logical manner. With this conceptual background, this study examined the following hypotheses:
1. Deforestation reduces the number of tree species and tree seedling diversity. 2. Once deforestation is prevented, livelihood capitals will increase.
3
Deforestation
Soil erosion, Lands lide, Flooding
Formation of gullies
Land degradation
Crop Propduc tionPer capita income
+
+
+
+
Socio-economic condition
-
+
Shifting cultivation
-
+
+
R
Timber production
Timber price
Timber demand -
-
-
+++
Biodiversity
Migration
-
+
Illegal logging-
+
R
RB
People's livelihood
Damage physical infrasture+
-
+
-
R
Human causality+
-
R
-
Ecosystem
++
R
Evapotranspiration
Rainfall
Drought
Physical
Natural
Human
Financialand Social
Financial
Forest
+
-B
Figure 1: Casual Loop Diagram for Hypothesized Mechanisms
4
Methodology
Study Site Description Location and physiography Nepal has been divided into five ecological regions which are High Himal, High Mountain, Middle Mountain, Siwaliks and Terai. Makwanpur district lies in Middle Mountain, Siwalik and Inner Terai. The proposed study site is situated in the Shiwalik region in the centre of Nepal. Two sites were chosen which were heavily deforested until 1988 AD. One site was handed over to the local community in the year 1988, and another was still belonged to the ownership of the government. The Siwaliks are comprised of soft, very erodable sediments with steep slope terrain, mostly poor porous soils, and a lack of perennial water course. This elevation ranges from 120 meters to 2000 meters. This renders it unsuitable for cultivation and human inhabitation. As a result the Siwalik range is still covered by moderate to heavy forest cover. The area under forest in the Siwalik accounts for 26% of Nepal’s natural forests (Ministry of Forestry, 1995). The study site, Churiyamai VDC is one VDC among 43 VDCs of Makawanpur district. It is located about 10 km far from district headquarters (Hetauda Municipality). The national highway, linking east to west, passes through this VDC. The area is extended with the geographical coordination of 27021'11" to 27025'11" north latitude and 84058'25" to 85005'23" east longitude. The total area of this VDC is 3507 hectare. Vegetation and soil The dominant tree species of the Siwalik range in the country are: Shorea robusta, Pinus roxburghii, Schima wallichii, Anogeissus latifolia, Semecarpus anacardium, Dillenia pentagyna, Terminalia tomentosa, Syzigium cumini, syzigium jambos, Phyllanthus emblica, among many others. The study site is mostly consisted of loamy and sandy soils.
5
1 0 1 Kilo m e ter s
N Landu se (2004 )
S ou r ce : T o po g r a p hi ca l S u rv ey . HM G /Ne p a l, 1 9 9 5 a n d Fie l d V er if i ca ti on - 2 0 0 4
LE G E N DC u ltiva te d L an dFo re s t L a ndB u sh /Sh ru b La n dG ra ss La n dW a ste /B a rren L a n dO rc ha rd N u rse ryS a n dy A reaLa n d s lid e
LE G E N DLo a m yLo a m y S ke le ta lLo a m y/B o u ld ryD a ta N o t A va ila b le
Soil
S ou r ce : L a n d S ys te m, L a n d R es o u rc e Ma p p in g P o jec t, 1 9 84
Figure 8: Land use and Soil of the study area
6
Study of tree and tree seedling diversity Sampling design, data collection and analysis All trees greater than 10 cm. diameter at breast height (dbh) were labelled. Similarly tree seedling species were also identified in the same sampled plots. Two rectangular plots each of 50m*50m size were established and two 10 meter wide transects were laid out parallel one side. The total area of the transect was kept 1000m2 in each plot. The number of individuals of each species was counted, and the crown cover was calculated using visual observation method. For the measurement of tree seedlings two 5*5 quadrants were laid out along with transects. The numbers of all seedling individuals of each species were counted.
Sample Plot Design 50 meter 5*5 meter 10 meter wide 50 meter Most of the diversity indices data were analyzed using ECOSTAT computer programme. Hill’s diversity number Hill’s diversity numbers, N1 and N2 were used to describe the species diversity in the communities. They were expressed as: N1 = eH’ where H’ is Shannon’s species diversity index. H’ = -Σ (ni/N) ln (ni/N) Where, ni = no. of individuals of ith species in the sample area. N = Total no. of individuals in the area. N2 = 1/λ; λ = Σpi2 where, pi = ni/N proportional abundance. T- test was used to test whether the species diversity indices were significantly different. For this, the following formulas were used (Magurran, 1988, Kafle 1997). t = H’-H’2/√(VarH’1+var H’2) varH’=[Σpi(1npi)2 - Σpi 1n pi2]/ N=(S-1)/2N2
df= (var H’1+var H’2)2/(Var H’1)2/N1+ (var H’2)2/N2 Where, H’1, and H’2 are Shannon’s diversity indices of the NFA and CFA.
7
Var H’ = variance of Shannon’s index Pi = Proportion of individuals = ni/N N = Total number of individuals in the site Evenness Hill’s modified index (E5) was used to calculate the evenness. This is expressed as: E5 = (1/λ-1)/(eH’-1) = (N2-1)/N1-1 Where, E5 = Hill’s modified index λ = Simpson’s index = Σpi2
H’ = Shannon’s index N1 and N2 are Hill’s diversity numbers where N1 indices the number of very abundant species in the sample, and N2 the number of abundant species in the sample. Similarity and difference The following indices were used to compare the similarity differences of the two communities: Soresen’s Index (SI) SI = 2C/A+B Where, C = number of species common to both sites A = total number of species in community A B = total number of species in community B Basal Area / Relative Basal Area Basal Area was calculated using the equation: BA = (Πd2/4)x1/1000 Where, BA = basal area (m2) Π = 3.14156 d = diameter at breast height (cm) Relative basal area (RBA) of each species was calculated dividing the total basal area of that particular species by the total basal area of all species. Community dominance (CD) Dominance was calculated for both communalities using a community dominance index similar in form to one developed by McNaughton (1968) to describe the apportioning of standing crop biomass among the most important species of the community. CD = (N1+N2)/Nx100% Where,
8
CD = Community Dominance N1 and N2 are the number of individuals of the most abundant species. N = total number of individuals Tree density/Relative density Density was measured in terms of numbers of individuals per hectare. The relative density of each species was calculated dividing the total density of that particular species by the total density of all species.
Frequency / Relative frequency The frequency of each tree species occurring in the transects were counted. Since the length of each transect was varied, frequency was counted taking a 100 m length in each transect. Similarly, relative frequency was calculated dividing the frequency of the particular species by the total frequency of all species. Importance Value Index / Importance percentage Importance Value Index (IVI) was calculated by adding three parameters: relative basal area, relative density and relative frequency. Importance percentage (IP) was calculated dividing the Importance Value of each species by the total importance values of all species. Mathematically, IVI =RBA+RD+RF IP= (RBA+RD+RF)/Total IVx100 Study of livelihood Sampling design, data collection and analysis An intensive interaction with forest users of both national and community forests were done. In addition, semi-structured interviews were performed to collect information on the effects of deforestation and adoption of community forestry, taking into account five livelihood capitals viz. natural capital, physical capital, human capital, social capital and financial capital. Executive members of the CFUGs were among the respondents from the community forest, whereas functional groups were from the national forest users. The semi-structured interview was taken with the 30 respondents in each forest site. Since the objective of this study is to quantify the effects of deforestation on the livelihood capitals, I need to document peoples perception on various socio-economic and bio-physical parameters. Focus Group Discussion After the individual interviews, the Focus Group Discussions (FGD) held in the deforested areas of the whole district. The participants of FGD were the persons who were involved in Community Forestry practices and representatives of political parties, civic societies, government official, social workers
9
and other interested peoples in the forest nearby and the concerned VDCs/District. In addition, members of CFUGs district Federation and Forest Product Users Federation were also attended the discussions. There were altogether 25 persons during the focus group discussion. In Nepal women are primarily responsible for most of the household activities and collection of firewood, fodders, and small timber. In this sense, women being immediate beneficiaries of the study, special attention were given to include a considerable percentage of women in each FGD. Informal Interactions In addition to the formal discussion and questionnaire survey, some informal interactions with the residents/ institutions, with marginalized and disadvantaged people were also done in the study site/districts. In addition, secondary information from government and non-government sources were taken.
10
Results
Status and Trend of Deforestation Local People in the study area immigrated from elsewhere. Among the respondents 55% were settled as long as early 1950s, whereas some (13%) had come to this place recently. The majority of the early migrants had come to this place after having damaged their lands and properties by landslides and flooding. The migrants were pouring in after 1963 AD, the year when the malaria was eradicated in the area. The migrants felled as much trees as they could in the open access national forest and started to settle. The principle of Hardin’s tragedy of commons can be applied here (Hardin 1968 as quoted in Carter 2003). This is evidenced by the fact that due to the lack of government control over national forest, local people started to encroach and occupy the government-owned national forests. The respondents were on the opinion that as the central Terai and Inner Terai regions were fertile, accessible and had enough employment opportunities in the nearby cities, the trend of deforestation increased with the increase in the rate of migration (Figure 14). In the district, more than 18 square kilometres forest area was completely lost due to encroachment. However, deforestation was prevalent in almost all forest area. In 1988 the crown cover in the existing Community Forest area was less than 10%, whereas it is more than 60% now. Nevertheless, in the National Forest the percentage crown cover is around 40%. The deforestation was triggered by poor forest management, politics of vested interest and development infrastructures such as road construction, industries and national electricity grid lines. The state could not give enough attention for the protection of national forest, which was the reason why community forestry was adopted in the district.
Figure 14. Decline of Forest Cover in the District over the years
1500.00
1550.00
1600.00
1650.00
1700.00
1750.00
1800.00
1977 1984 1992 1998
Years
Fore
st A
rea
in S
q.km
.
(Source: Department of Forest, HMG/Nepal, 2004)
11
Tree Diversity Species Composition and Tree Diversity The sampling plots in the community forest supported a higher number of tree individuals (Table 3), but the species richness was higher in the national forest. The national forest also contained some ‘unique’ species, found only there, Terminalia tomentosa, Terminalia chebula, Semecarpus anacardium and Anogeissues latifolia were species found only in the national forest. The first three species are relatively less useful as compared to Shorea robusta, Schima wallichii and Syzigium cumini. Terminalia tomentosa, a renowned timber species in the Terai region could have been depleted in the community forest due to over use of this species by rural communities before and right after the handover of the community forest to them. This statement is supported by the fact that more than 2.8% of total individuals of tree seedlings of this species were found in the same community forest (Table 7). A total of 745 individual trees were recorded in community forest and 485 trees in national forest (Table 3). Shorea robusta was the most abundant species followed by Syzigium cumini in both study sites. A total number of 5 tree species in community forest and 7 species in national forest were recorded from the sampled area. Table 3. Composition of tree species (>10 cm. dbh) per ha.
Total 745 (100%) 485 (100%) Percentage figures in parenthesis indicate the relative dominance of the species in the respective forest regime. Basal Area, Tree Density and Community Dominance Basal area (>10 cm DBH) was higher in the national forest than in the community forest (Table 4). But, tree density was higher in the community forest than in the national forest. Similarly, community dominance (CD) was also higher in community forest. The users do not allow all species to grow in community forest, and support only selected useful tree species. Table 4. Basal area, tree density and community dominance
Site Community Statistic Unit CF NF
12
Basal area m2/ha 15.4 17.42 Tree Density (>10 cm. dbh) No/ha 745 485 Community Dominance % 93.3 80.4 Importance Value Index Shorea robusta contributed to more than 63% of the importance percentage in the community forest, as calculated from relative basal area (RBA), relative frequency (RF) and relative density (RD), whereas it was slightly less (56.7%) in the national forest. Importance percentage is a measure of influence of each species on the forest community. Importance value of Syzigium cumini and Schima wallichii were higher in the community forest (Table 5). This suggests that the importance value percentage of more useful species in terms of commercial and private use were higher in the community forest than in the national forest. In the community forest Shorea robusta accounted for 86% by basal area and 85% by density compared to 82 and 69% respectively in the national forest. It shows that more older trees with lesser number of individuals are found in the national forest. Table 5. Importance Value Index of major tree species
Importance Value Community Forest National Forest SN.
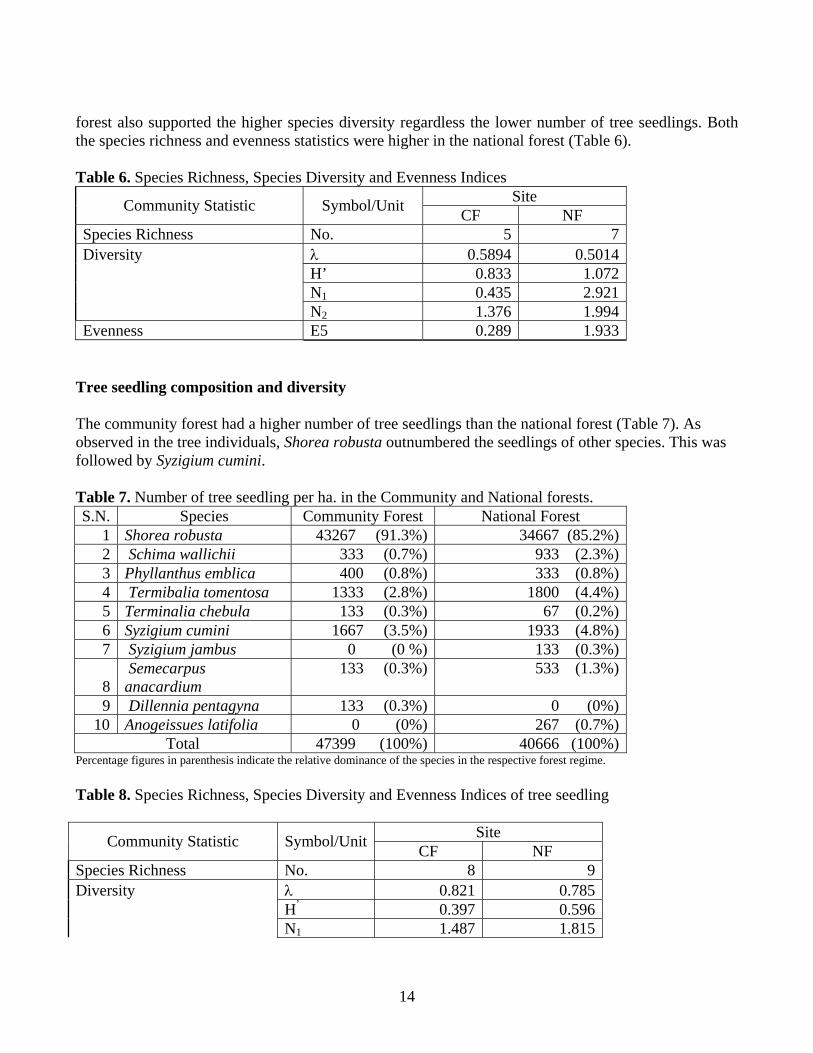
Total 3.08 100 2.98 100 Species Richness and Diversity Table 6 and 8 shows the computed values of different community statistics. In the national forest, irrespective of low species abundance, the diversity index (H’) was significantly higher than in the community forest. Also, individuals were more evenly distributed in the national forest. The national
13
forest also supported the higher species diversity regardless the lower number of tree seedlings. Both the species richness and evenness statistics were higher in the national forest (Table 6). Table 6. Species Richness, Species Diversity and Evenness Indices
Site Community Statistic Symbol/Unit CF NF Species Richness No. 5 7 Diversity λ 0.5894 0.5014 H’ 0.833 1.072 N1 0.435 2.921 N2 1.376 1.994 Evenness E5 0.289 1.933
Tree seedling composition and diversity The community forest had a higher number of tree seedlings than the national forest (Table 7). As observed in the tree individuals, Shorea robusta outnumbered the seedlings of other species. This was followed by Syzigium cumini. Table 7. Number of tree seedling per ha. in the Community and National forests. S.N. Species Community Forest National Forest
Total 47399 (100%) 40666 (100%) Percentage figures in parenthesis indicate the relative dominance of the species in the respective forest regime. Table 8. Species Richness, Species Diversity and Evenness Indices of tree seedling
Site Community Statistic Symbol/Unit CF NF Species Richness No. 8 9 Diversity λ 0.821 0.785 H’ 0.397 0.596 N1 1.487 1.815
14
N2 1.217 1.275 Evenness E5 0.487 0.815 Livelihood Diversity Thirty individuals residing nearby the national forest were asked to respond on the effects of deforestation on the various livelihood indicators. The same numbers of individuals being general members of CFUG were asked various questions related to the effects of management of forest by the local communities on their livelihoods. Almost all respondents (97%) experienced that deforestation contributed to the formation of gullies and occurrence of debris flow. Due to the reduced availability of forest products in the nearby forest, rural people had to buy their daily requirements of fuelwood, fodder and small timber from elsewhere. This increased their household expenditures. However, a majority of the respondents did not experience any decrease of the household income due to deforestation. Natural disasters such as floods, landslides and debris flow were enhanced by deforestation. A majority of the respondents were of the opinion that the reduced availability of the forest products increased their misery (Table 9). Table 9: Effects of deforestation on livelihood (Figures are in percentage)
Increased natural disaster (landslides/flood) 100 0 0 Decreased social cohesion (increased quarrelling/conflict among villagers)
53 33 14
Decreased plants and wild animals 93 0 7 Increased misery of people (due to decreased availability of forest product).
83 7 10
Increased in the atmospheric temperature 70 0 30
The protection and management of forests by local communities had on the other hand increased tree abundances, supported to infrastructure development, increased the number of wild animals, and increased the social cohesion (Table 10). Table 10: Perception of local people on livelihood indicators
Livelihood Assets
Indicators Yes No No Response
Increase in supply of fuel product 50 40 10 Increase in wild animals 80 0 20 Natural Capital Increased tree abundance 100 0 0
15
Increase in Ag. productivity 60 0 40 Physical Capital Increase in physical infrastructures 93 0 7 Human Capital Increase in trained human resource 80 7 13
Increase in social cohesion 60 7 33 Decrease in conflict 53 7 40 Membership in some organization 30 45 25 Social Capital Networking within and among community
80 5 15
Increase in HH income 33 40 27 Decrease in expenditure Financial Capital Increase in CFUGs income 100 0 0
(Figures are in percentage) Before the adoption of community forestry, it was very difficult to collect firewood, fodder and timber, but this is not the case now. Minimum requirements of forest products are fulfilled from the nearby forests through the approval of the CFUG. After implementation of the CF, the numbers of households rearing livestocks are increasing and the productivity of agriculture is increasing. Availability of fodder, fuelwood, bedding materials for domestic animals and small timber has been on the rise. Illegal cutting of trees in the community owned forest has been strictly controlled. This has forced villagers who have some land to practice farm forestry, to plant trees on field bunds along the canal banks and barren lands. Some villagers who do not own any private lands have difficulty to get their daily requirements of fodder, fuelwood and small timber. In one community there were 25 households of Chepang, a very underdeveloped tribe. However, they did not become members of CFUG as they lost their occupation of selling fuelwood after the provision of schedule in the area. The Chepang members have now adopted the stone-grinding (manually) job in the riverside areas. Community forestry has not directly helped to alleviate poverty. With the initiation of CFUGs, some developmental activities such as road construction, support to schools, and relief and rescue of disaster victims have been done. However, CF has not supported to uplift the socio-economic conditions of backward caste and economically deprived people. Not all community people have benefited from the community forest. Only elites and politically and socially active people have received benefits. Biodiversity in the community forestry is better than the national forest, but due to the lack of knowledge of the community people the less known species are removed at tending operations.
16
Discussion
Trend of Deforestation The eradication of malaria in late 1950s led to widespread settlement in the study area mainly by migrants from mid-hills. This together with unsustainable exploitation of the forests has resulted in large-scale deforestation. It is clearly seen from the study that the trend of forest decline in the study area is increasing until 1980s whereas it is increasing but in decreasing trend since then. This might be due to spill over effects of the community forestry. It is also seen that in the national forest the deforestation rate was higher than the forest growth rate, however after implementation of the community forest management the growth rate is on the rise. It is also apparent that for the sustainability of the forest resource the deforestation rate should be lower or equal to the forest growth rate. The decrease in land productivity is due to the high deforestation rate in the study area. A number of counter measures have been carried out from the government however they are not producing results as expected. In practice, the degradation rate and the counter measures are not balanced. Species Composition and Tree Diversity The decreased crown cover in the national forest until 1988 was a direct consequence of deforestation. However, the slightly increased crown cover in the national forest in recent years was the spill over effects of the introduction of community forestry in the district. The prevention of deforestation helped to increase the number of individual trees. Some less useful species such as Semecarpus anacardium, Anogeissus latifolia, Terminalia chebula and Terminalia tomentosa were found only in the national forest, whereas the community forest contained more number of useful species. The less useful species were discarded because users were not aware of the ecological importance of those species. Deforestation decreased the number of tree species in both sites. However, the national forest contained a higher number of tree species than the community forest. The reason was the poor knowledge of local forest users on the tending operations and was partly due to their less interest in protecting ‘unwanted’ species. This statement is supported by the higher number of useful species such as Shorea robusta, Syzigium cumini and Schima wallichii in the community forest. Despite a significantly higher tree population density in the CF, Shorea robusta had the highest relative dominance in both sites. Also, the basal area was higher in the national forest. This was due to older trees found in the national forest compared with the community forest. Shorea robusta had a higher importance value in the community forest than in the national forest. However, the Shannon’s diversity index was higher in the national forest mainly due to higher species richness and evenness. The community forest supported a higher number of tree seedlings than the national forest. CF also contained more species of tree seedlings than of tree species greater than 10 cm DBH. There were five species of trees greater than 10 cm DBH in the community forest, whereas eight species of tree
17
seedlings were found in the same site. This indicated that protection of forest from deforestation not only increases the number of tree individuals, but also contains a higher number of tree seedling species. It also showed that more number of tree individuals and tree seedling species are coming up. Nevertheless, the diversity index of tree seedlings was slightly higher in the national forest than in the community forest. Socio-economic Conditions Participatory interaction with forest users and interviews with local people revealed that deforestation decreased the number of plants and wild animals, increased soil erosion, and contributed to the occurrence of gullies and debris flow. This further lead to lower agriculture productivity, and contributes to an increase in the atmospheric temperature. The findings are supported by Karpagam 1991. However, it is still unclear whether the increase in atmospheric temperatures over the years is due to deforestation or burning of fossil fuels. The study did not reveal that deforestation reduced the household income. Although other responses from the same respondents supported the statement that deforestation would reduce the household income, the direct link in this context could not be established. As a majority of the respondents relied on national forests for their livelihood before the introducing of the CF, they did not perceive that the deforestation directly affected their household income. In addition, the household expenditure increased because of the less availability of the same before the introduction of community forestry. It has also led to increased misery of local people due to the shortage of forest products in the vicinity. Similarly, the study strongly supported the fact that the protection and management of forest by local people positively affected a majority of the livelihood parameters. In addition to the natural capital and physical capitals, the indicator related to human and social capitals also increased after the adoption of community forestry. Local foresters participated in training programmes on capacity building and various skill development schemes. The CF approach also helped resolving small issues and conflicts at local level and there was an increase in the social cohesion. The finding of this study revealed that control of deforestation contributes to the increase of all the aspects of livelihood capitals. Based on the results the hypothesized mechanism proposed for this study prepared before beginning of this study can now be modified as follows (Figure18). Linkages between trend of deforestation, tree and tree seedling diversity and livelihoods The deforestation rate has slowed down in recent years. The reason can be attributed largely to the adoption of community forestry in the study area. The higher number of tree individuals and increased number of seedlings and their species in the community forestry support the fact that diversity indices in the community forestry are on the rise. The study also revealed that protection of forest by the communities enhanced majority of the livelihood parameters. However, the linkage between deforestation and income level of individuals could not directly be delineated.
18
The rampant destruction of forest in the past compelled the Government of Nepal to adopt the community forestry in the country. The new forest management approach contributed to the enhancement of the conservation of both the community-owned and government-controlled forests and improvement of the livelihoods of local communities. The reasons for the decreasing trend of deforestation can be of twofold: first due to the protection of forest by the local community, and second due to the snowballing effects of the community awareness in the community forestry areas. As perceived by the local communities, majority of livelihood capitals are increasing. This suggests that the community forestry has contributed to the conservation of national forest and reduction of poverty. This statement can be interpreted in such a way that the conservation of national forest and the mitigation of poverty further contribute to the mitigation of various natural and man-made hazards like deforestation, landslide, land degradation and the like. In its fullest achievement that is adoption of community forestry and prevention of deforestation, the hypothesized mechanism can be balanced.
19
20
Overgrazing/Forest fire
Illegal logging
Unscientific cultivation in Hills
Construction works (Roads, Dams)
-Loss of flora and fauna
-Loss in soil organic matter
- Landslides
Compaction of soil and increase in run-off and formation of sheet, rill and gully erosion (Soil erosion)
-Destruction of various organisms like bacteria, fungi
Impact - Poor Socio-economic status of people - Imbalance in Natural Eco-system
Underlying causes Poverty, population pressure, Illiteracy, forest fire, government policy (Forest Nationalization Act-1957, Land Reform Act etc)
Recent efforts to counter the problems occurred due to deforestation -Handing over of government forest to community (community forest), - Agro-forestry practices -Farm forestry, leasehold forestry - Use of organic fertilizer, animal manure, compost manure emphasized - EIA emphasized in development construction - Training/Non formal education initiation - Landslide/flooding control programmes launched. - Poverty alleviation programmes
Collection of fuelwood/small timber for subsistence
Shifting cultivation
-Rise in atmospheric temperature
CausesPrimary effects
Def
ores
tatio
n Secondary effect
LD
and
egra
datio
n
Desirable linkages Undesirable linkages
Figure 18: Modified Hypothesized Mechanism of the Effects of Deforestation
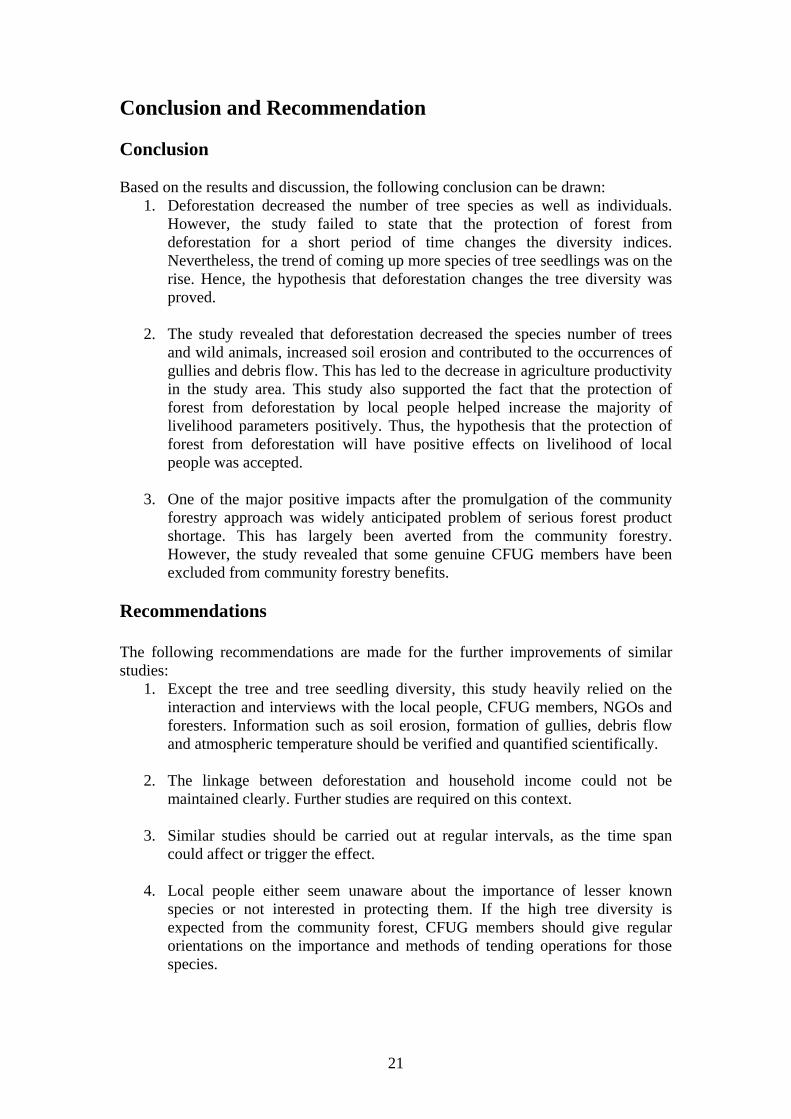
Conclusion and Recommendation Conclusion Based on the results and discussion, the following conclusion can be drawn:
1. Deforestation decreased the number of tree species as well as individuals. However, the study failed to state that the protection of forest from deforestation for a short period of time changes the diversity indices. Nevertheless, the trend of coming up more species of tree seedlings was on the rise. Hence, the hypothesis that deforestation changes the tree diversity was proved.
2. The study revealed that deforestation decreased the species number of trees
and wild animals, increased soil erosion and contributed to the occurrences of gullies and debris flow. This has led to the decrease in agriculture productivity in the study area. This study also supported the fact that the protection of forest from deforestation by local people helped increase the majority of livelihood parameters positively. Thus, the hypothesis that the protection of forest from deforestation will have positive effects on livelihood of local people was accepted.
3. One of the major positive impacts after the promulgation of the community
forestry approach was widely anticipated problem of serious forest product shortage. This has largely been averted from the community forestry. However, the study revealed that some genuine CFUG members have been excluded from community forestry benefits.
Recommendations The following recommendations are made for the further improvements of similar studies:
1. Except the tree and tree seedling diversity, this study heavily relied on the interaction and interviews with the local people, CFUG members, NGOs and foresters. Information such as soil erosion, formation of gullies, debris flow and atmospheric temperature should be verified and quantified scientifically.
2. The linkage between deforestation and household income could not be
maintained clearly. Further studies are required on this context.
3. Similar studies should be carried out at regular intervals, as the time span could affect or trigger the effect.
4. Local people either seem unaware about the importance of lesser known
species or not interested in protecting them. If the high tree diversity is expected from the community forest, CFUG members should give regular orientations on the importance and methods of tending operations for those species.
21
5. Government efforts need to be made to address issues like exclusion and non-equitable distribution of forest produce in community forestry scheme.
References BISEP-ST 2003. A Booklet of Biodiversity Sector Programme for Siwaliks and
Terai, (BISEP-ST), HMG/Nepal CBS, 2001. Population Census of Nepal, Kathmandu:HMG/CBS. CBS, 2002. Statistical Pocket Book Nepal, Kathmandu: HMG/CBS Carter, N., 2003. The Politics of the Environment: Ideas, Activities, Policy, Cambridge University Press. Dev, O. P.; Springate- Baginski, O; N. P. Yadav; and Soussan, J. 2003. Impacts of Community Forestry on Livelihoods in the Middle Hills of Nepal In: Journal of Forest and Livelihood: Vol 3(1), 64-77 pp. EPC. 1993. Nepal Environmental Policy and Action Plan, Kathmandu, HMG Nepal/EPC.
Kafle, S. K., 1997. Effects of Forest Fire Protection on Plant Diversity, Tree Phenilogy and Soil Nutrients in a Deciduous Dipterocarp-Oak Forest of Northern Thailand. An unpublished Master’s thesis submitted to the Chiangmai University, Graduate School, Thailand. Magurran, A. E. 1988. Ecological Diversity and Its Measurements. Croomhelm. McNaughton. 1968. An Index of diversity and the Relation of Certain concepts to diversity. Ecology 8. Ministry of Forest/His Majesty’s Government of Nepal, 1995. The Forest Resources of Nepal. HMG/N, Kathmandu. Simpson, E. H. 1949. Measurement of Diversity Nature 163.