Effects of Diving on Spinal Cord Injury-Associated Decompression Sickness Richard Sové Medical Biophysics University of Western Ontario Supervisors: Dr. Paula Foster, Dean Percy March 22 nd , 2011
Transcript
Effects of Diving on Spinal Cord Injury-Associated Decompression Sickness
Richard Sové Medical Biophysics
University of Western OntarioSupervisors: Dr. Paula Foster, Dean Percy
March 22nd , 2011
Decompression Sickness (DCS)
• Dissolved gases in the blood at high pressure leaving solution during re-pressurization1
– Causes damage to blood vessels and surrounding tissue1
• Approximately 9 million recreational divers in US alone1
– 900 to 1000 treated for severe DCS per year1
1 Newton, Am. Fam. Physician, 2001
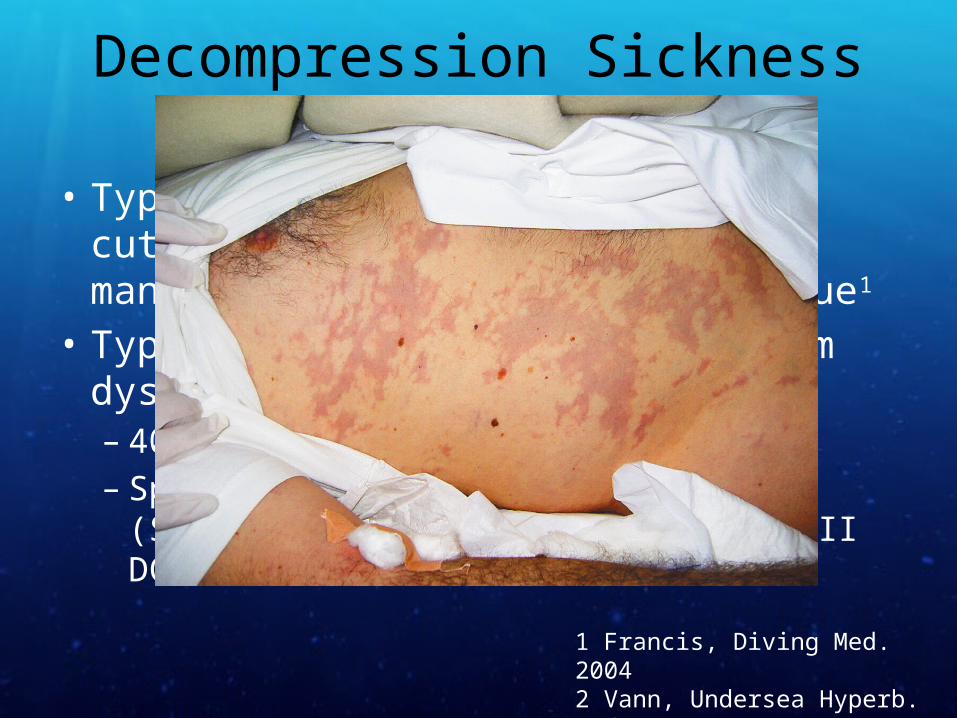
Decompression Sickness (DCS)
• Type I : musculoskeletal pain, cutaneous and lymphatic manifestations, anorexia, fatigue1
• Type II : central nervous system dysfunction1
– 40% of DCS cases2
– Spinal cord injury-associated DCS (SCI-DCS) is most related to type II DCS3
• Dalton’s Law: “The partial pressure of a gas at a constant temperature is proportional to the solubility of the gas”
• At 1 ATA (at sea level): PO2 = 0.21 ATA and PN2 = 0.79 ATA
• At 4 ATA (30 m under water):PO2 = 0.84 ATA and PN2 = 3.16 ATA
ATA – Absolute Total Atmospheres
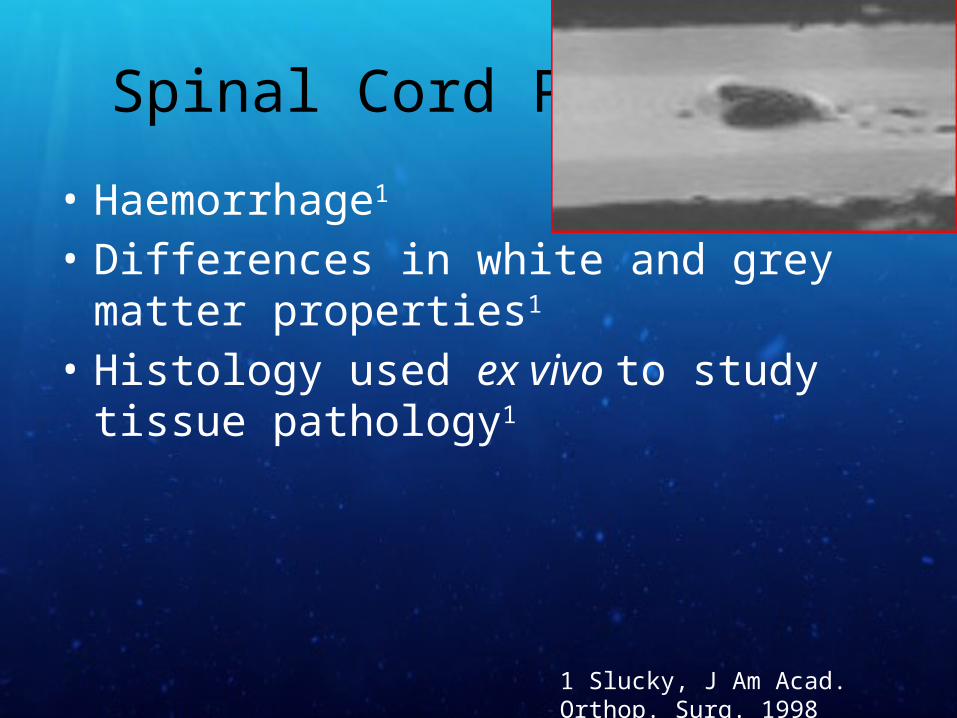
Spinal Cord Pathology
• Haemorrhage1
• Differences in white and grey matter properties1
• Histology used ex vivo to study tissue pathology1
1 Slucky, J Am Acad. Orthop. Surg. 1998
Problem
• Need to be able to assess treatment strategies for SCI-DCS
• Ex vivo histology most commonly used1
- Impractical to sample the entire spinal cord
• Solution: Magnetic Resonance Imaging (MRI)- May be sensitive to haemorrhage1
- May be able to detect differences in white and grey matter properties1
1 Slucky, J Am Acad. Orthop. Surg. 1998
Objective
• Determine whether magnetic resonance imaging (MRI) can be used to identify regions of pathology associated with SCI-DCS
Hypotheses
• There will be a difference in the white matter to grey matter contrast-to-noise ratio (CNR) in the spinal cords of rats with SCI-DCS when compared to rats without the injury
• There will be differences in the number of signal voids in the spinal cords of rats with SCI-DCS when compared to rats without the injury
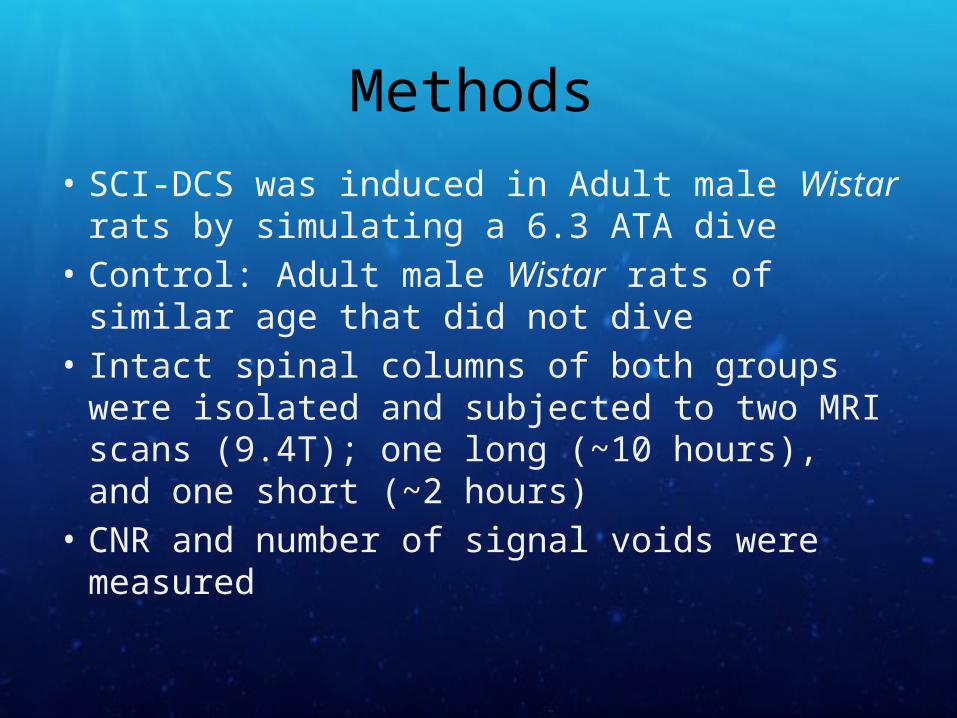
Methods• SCI-DCS was induced in Adult male Wistar rats by
simulating a 6.3 ATA dive• Control: Adult male Wistar rats of similar age that
did not dive• Intact spinal columns of both groups were
isolated and subjected to two MRI scans (9.4T); one long (~10 hours), and one short (~2 hours)
• CNR and number of signal voids were measured
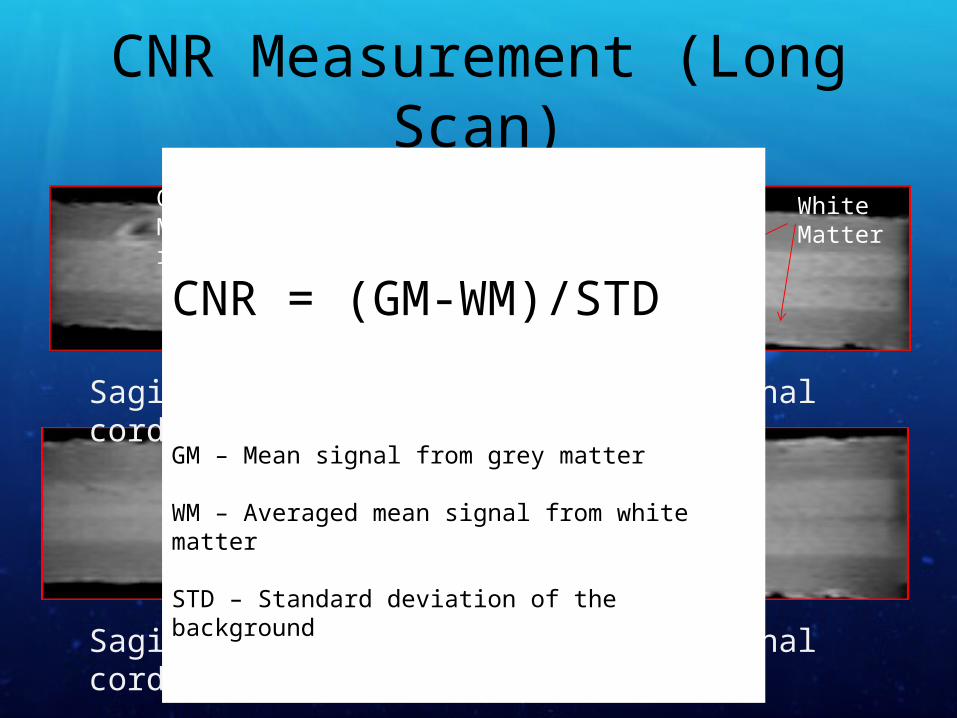
CNR Measurement (Long Scan)
Sagittal slice of control rat’s spinal cord from long scan
Sagittal slice of injured rat’s spinal cord from long scan
Grey Matter
White Matter
CNR = (GM-WM)/STD
GM – Mean signal from grey matter
WM – Averaged mean signal from white matter
STD – Standard deviation of the background
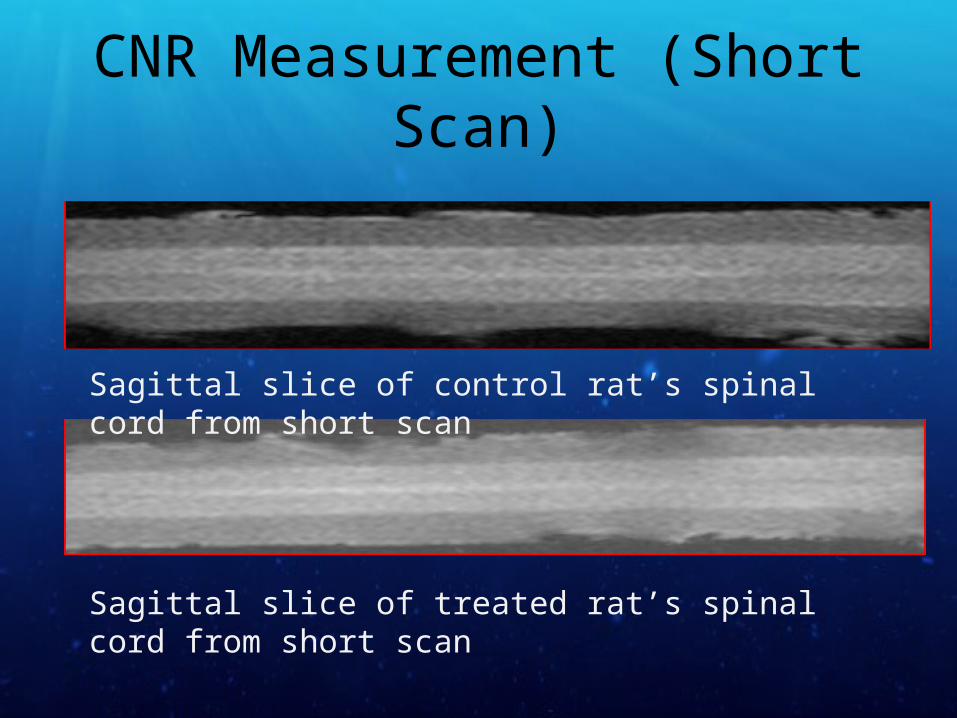
CNR Measurement (Short Scan)
Sagittal slice of control rat’s spinal cord from short scan
Sagittal slice of treated rat’s spinal cord from short scan
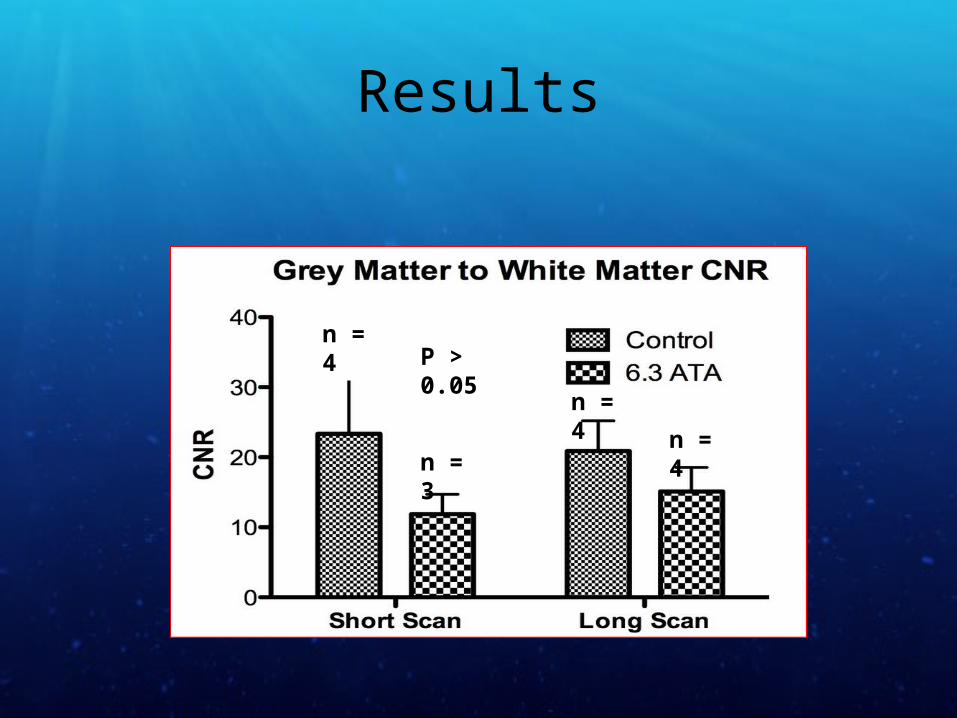
Results
n = 4
n = 3n = 4
n = 4
P > 0.05
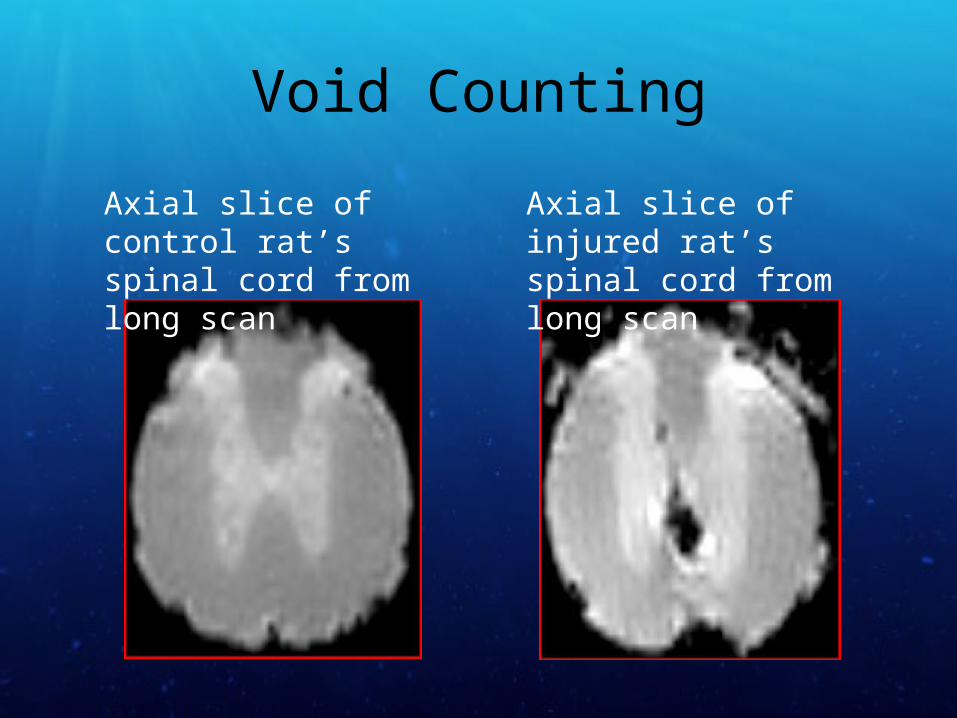
Void Counting
Axial slice of control rat’s spinal cord from long scan
Axial slice of injured rat’s spinal cord from long scan
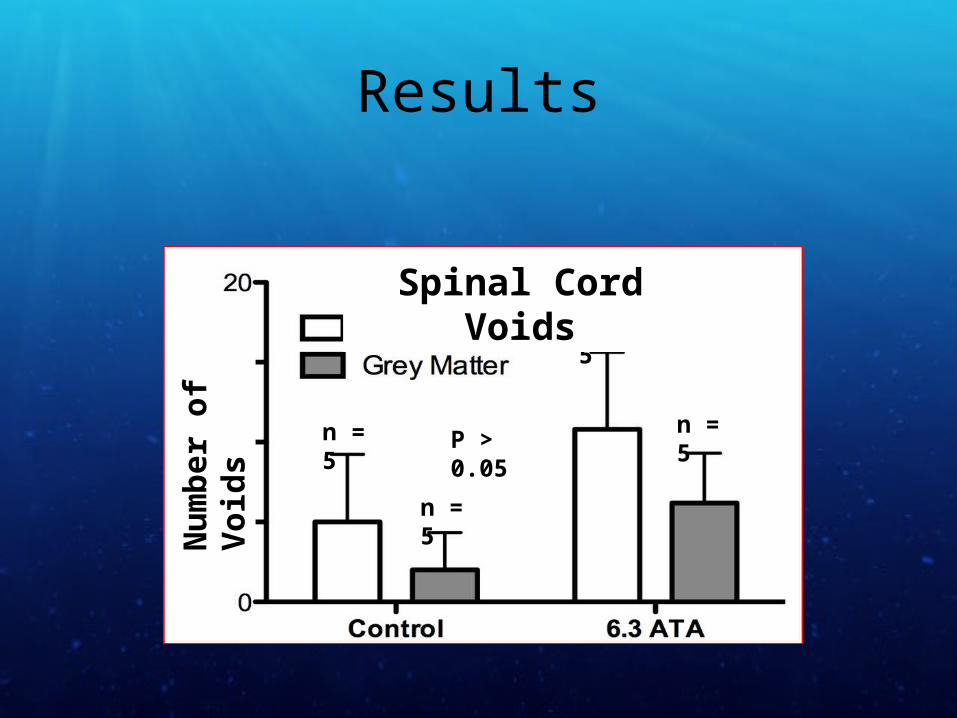
Results
n = 5 n = 5
n = 5
n = 5
P > 0.05
Spinal Cord Voids
Num
ber o
f Voi
ds
Summary
• The lack in significance between short and long scan times indicate that the shorter scan time can be used to image the pathology
• No significant differences in CNR or number of voids, however there was a trend to lower CNR and more voids in the 6.3ATA group– Future experiments may show significance if a