Page 1
EFFECTS OF FEEDING NUCLEOTIDES WITH CORN GERM MEAL OR DRIED CORN
DISTILLERS GRAINS ON RECEIVING AND GROWING CALVES
by
MONIKA L. DETRAY
A.A., Centralia College, 2012
B.S., Washington State University, 2014
A THESIS
submitted in partial fulfillment of the requirements for the degree
MASTER OF SCIENCE
Department of Animal Sciences and Industry
College of Agriculture
KANSAS STATE UNIVERSITY
Manhattan, Kansas
2016
Approved by:
Major Professor
Dale A. Blasi
brought to you by COREView metadata, citation and similar papers at core.ac.uk
provided by K-State Research Exchange
Page 2
Abstract
Effects of nucleotides (NA) (PSB Complex; DSS Global, Chicago, IL) with corn germ
meal (CGM) or dried corn distillers grains (DDG) on growth performance, digestibility, in vitro
ruminal gas production, and mucosal immunity were analyzed in 4 experiments. In Exp. 1, 213
crossbred heifers (BW= 262 ± 67.4 kg) were used in a complete block design with a 3 x 2
factorial arrangement of treatments to determine the net energy values of CGM in comparison to
DDG and the effects of NA at three inclusion levels (0, 2, and 4 g) during an 84-d receiving
period. Pens were randomly assigned to one of six treatments: 1) CGM with no NA (CGM0), 2)
CGM with 2 g/heifer daily NA (CGM2), 3) CGM with 4 g/heifer daily NA (CGM4), 4) DDG
with no NA (DDG0), 5) DDG with 2 g/heifer daily NA (DDG2), and 6) DDG with 4 g/heifer
daily NA (DDG4). There were no significant effects of NA or the type of corn byproduct on
growth performance (P ≥ 0.15). Exp. 2, was conducted to determine the performance and
mucosal immunity effects of NA using 240 crossbred heifers (BW= 268 ± 34.1 kg). Pens were
randomly assigned to three treatments which consisted of diets 4, 5 and 6 from Exp. 1. Calves
were blocked by weight and assigned to a pen for 56-d. There were no significant effects of NA
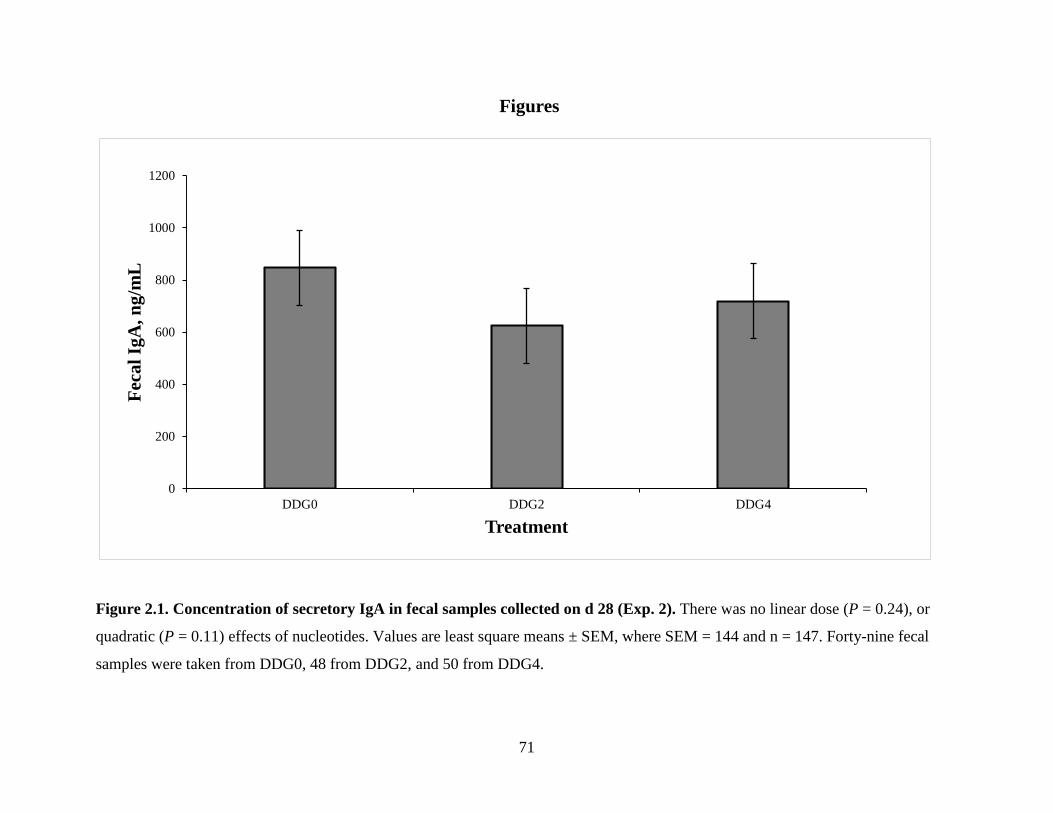
on growth performance results (P ≥ 0.18). On d 28, fecal samples were collected from
approximately 5 calves from each pen and analyzed for secretory IgA concentration. NA
inclusion did not affect fecal IgA concentration (P = 0.15). Exp. 3, utilized 4 ruminally
cannulated Holstein heifers in a 4 x 4 Latin square design. The four treatments included diets 1
and 4 from Exp. 1 along with those two diets supplemented with 3 g/heifer daily NA. Ruminal
pH increased as NA was included (P < 0.05). Ammonia concentrations were greater for DDG
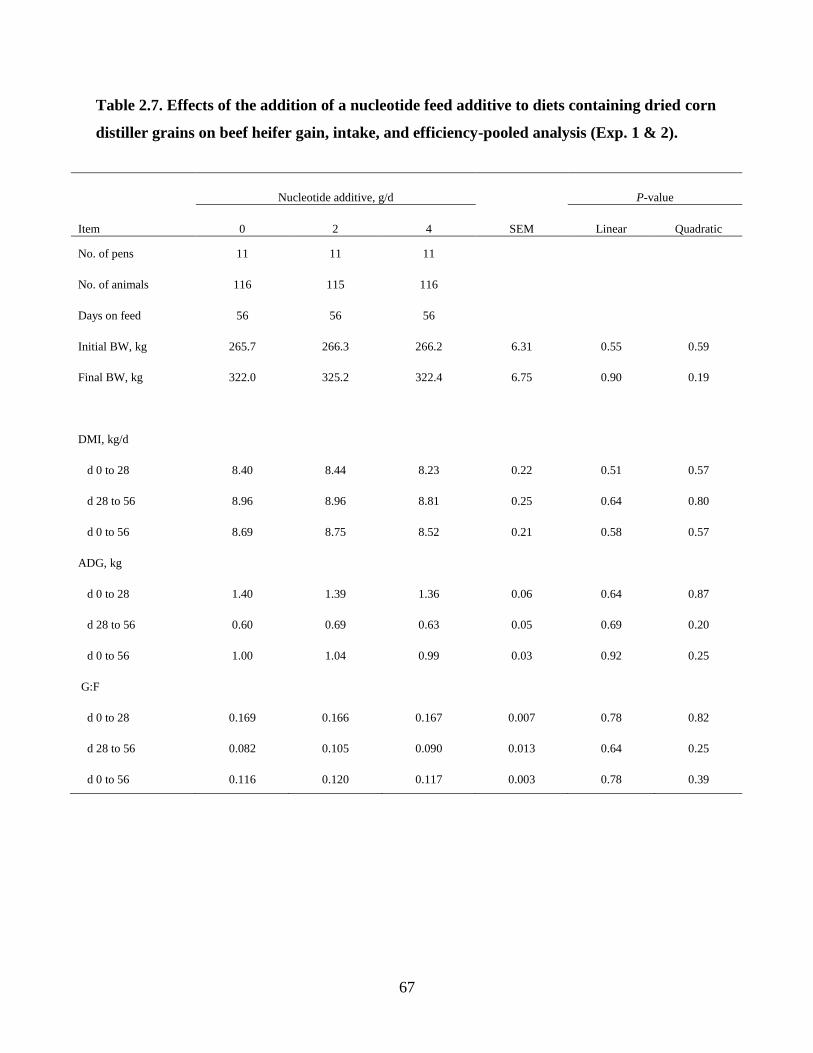
than for CGM (P < 0.01). Ruminal propionate concentration was less in diets that contained NA
(P < 0.05). DDG diets led to greater concentrations of butyrate, isobutyrate, isovalerate, and
Page 3
valerate in ruminal fluid than CGM diets (P < 0.01). Valerate concentrations were decreased by
NA when included in DDG diets, but not when added to CGM diets (interaction, P < 0.01).
Isovalerate concentrations were increased by NA when included in CGM diets, but not when
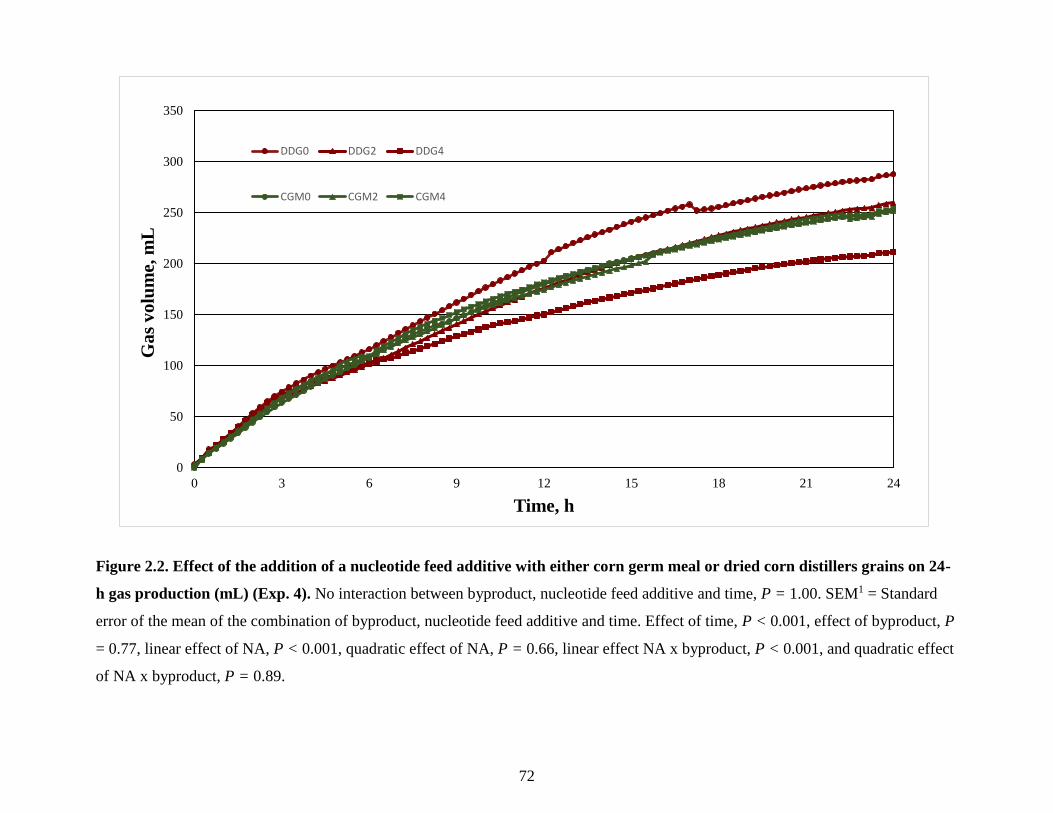
added to DDG diets (interaction, P = 0.01). An in vitro study, Exp. 4, evaluated 24-h gas
production effects of the 6 treatments in Exp. 1. Gas production was decreased linearly by the
inclusion of NA in DDG diets, but it was unaffected by NA in CGM diets (interaction, P <
0.01). CGM can be included in receiving and growing diets at 24.5% on a DM basis in place of
DDG while maintaining growth performance, digestibility, and gas production. There was no
effect of NA on growth performance, digestibility, or mucosal immunity, but there was an effect
on ruminal gas production and ruminal parameters. Further research is needed to determine the
effects of NA on receiving and growing cattle.
Key words: receiving cattle, corn germ meal, nucleotide
Page 4
iv
Table of Contents
List of Figures ................................................................................................................................ vi
List of Tables ................................................................................................................................ vii
Acknowledgements ........................................................................................................................ ix
Chapter 1 - Review of Literature .................................................................................................... 1
Introduction ................................................................................................................................. 1
Status of Receiving and Growing Calves ................................................................................... 1
Role of Energy ......................................................................................................................... 7
Role of Protein ........................................................................................................................ 8
Concentrate Selection ............................................................................................................... 11
Value of Corn Fed to Ruminants .......................................................................................... 12
Ethanol Industry ........................................................................................................................ 13
Dry Milling Byproducts ............................................................................................................ 14
Dried Distillers Grains-Overview ......................................................................................... 15
Feeding Value of Dried Distillers Grains ............................................................................. 16
Wet Milling Byproducts ........................................................................................................... 17
Corn Germ Meal-Overview .................................................................................................. 19
Corn Germ Meal in Diets ..................................................................................................... 20
Nucleotides as a Feed Additive ................................................................................................ 22
Structure of Nucleotides ........................................................................................................ 22
Nucleotide Requirements of Animals .................................................................................... 23
Feeding Nucleotides to Monogastrics .................................................................................. 24
Feeding Nucleotides to Ruminants ....................................................................................... 25
Nucleotide Metabolism in Ruminants ................................................................................... 27
Literature Cited ......................................................................................................................... 29
Chapter 2 - Effects of feeding nucleotides with corn germ meal or dried corn distillers grains on
receiving and growing calves ................................................................................................ 40
Introduction ............................................................................................................................... 40
Materials and Methods .............................................................................................................. 41
Statistical Analyses ............................................................................................................... 50
Page 5
v
Results and Discussion ............................................................................................................. 51
Literature Cited ......................................................................................................................... 59
Tables ........................................................................................................................................ 62
Figures ...................................................................................................................................... 71
Page 6
vi
List of Figures
Figure 2.1. Concentration of secretory IgA in fecal samples collected on d 28 (Exp. 2.) ............ 71
Figure 2.2. Effect of the addition of a nucleotide feed additive with either corn germ meal or
dried corn distillers grains on 24-h gas production (mL) (Exp. 4). ...................................... 72
Page 7
vii
List of Tables
Table 2.1. Composition of diets (% of DM) containing corn germ meal, dried corn distillers
grains and a nucleotide additive fed during Exp. 1, 2, 3, and 4. ........................................... 62
Table 2.2. Analyzed composition of diets (% of DM) fed during Exp. 1, and 2………………...63
Table 2.3. Effects of corn germ meal and dried corn distillers grains and the addition of a
nucleotide additive on beef heifer gain, intake, and efficiency (Exp. 1)…………………...64
Table 2.4. Effects of corn germ meal and dried corn distillers grains and the addition of a
nucleotide additive on beef heifer morbidity (Exp. 1)…………………………………………...65
Table 2.5. Effects of corn germ meal and dried corn distillers grains and the addition of a
nucleotide additive on beef heifer mortality (Exp. 1)………………………………………65
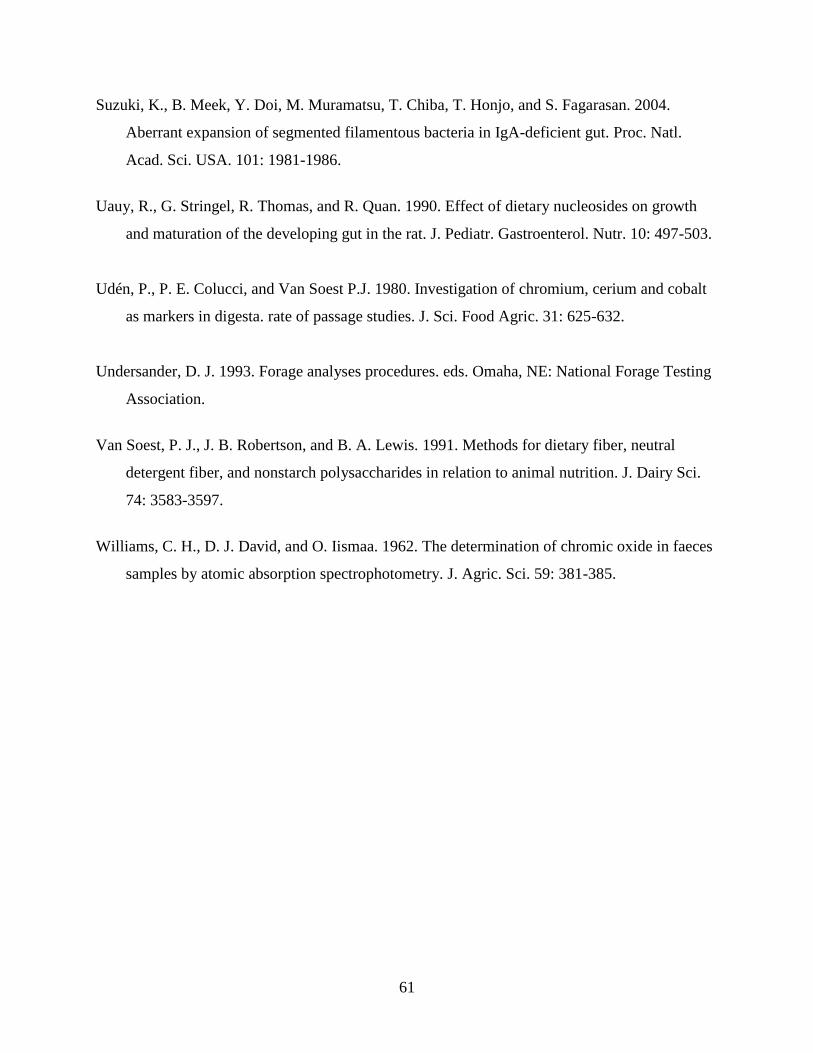
Table 2.6. Effects of the addition of a nucleotide feed additive to diets containing dried corn
distillers grains on beef heifer gain, intake, and efficiency (Exp. 2). ................................... 66
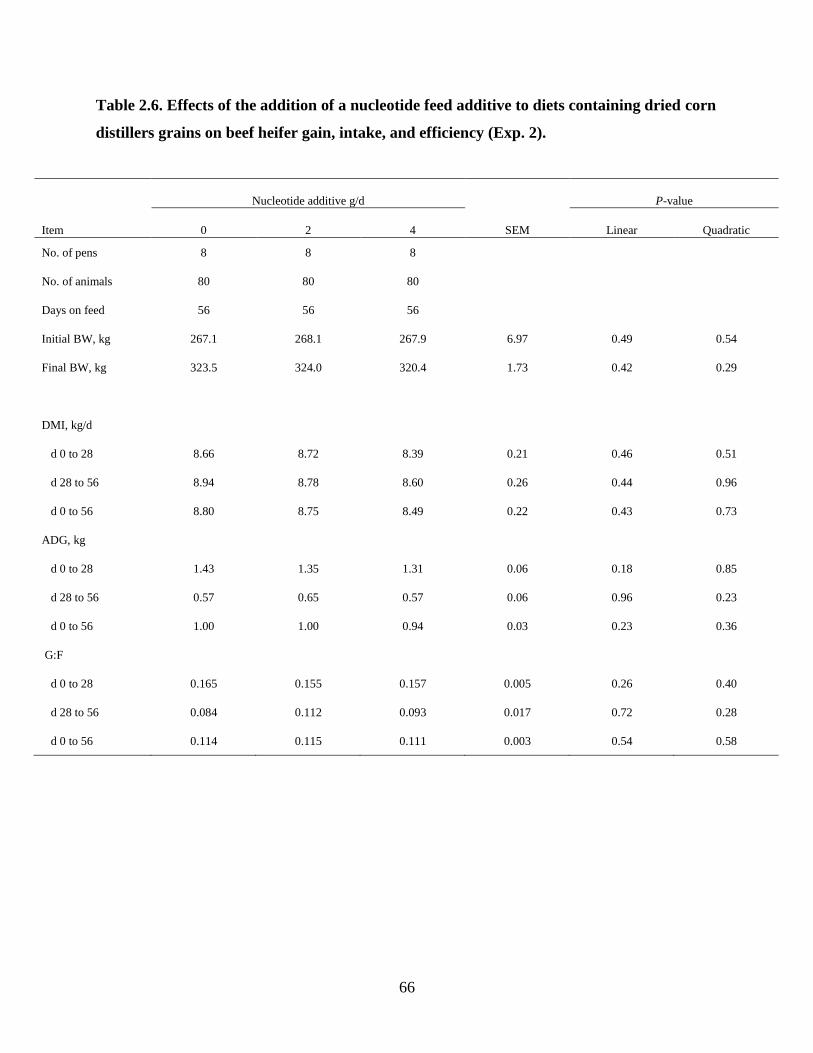
Table 2.7. Effects of the addition of a nucleotide feed additive to diets containing dried corn
distiller grains on beef heifer gain, intake, and efficiency-pooled analysis (Exp. 1 & 2). .... 67
Table 2.8. Effects of corn germ meal and dried corn distillers grains and the addition of a
nucleotide additive on intake and total tract digestibility of DM, starch, and ADF (Exp. 3).
............................................................................................................................................... 68
Table 2.9. Effects of corn germ meal and dried corn distillers grains and the addition of a
nucleotide additive on ruminal fermentation characteristics (Exp. 3). ................................. 69
Page 8
viii
Table 2.10. Effects of corn germ meal and dried corn distillers grains and the addition of a
nucleotide additive on ruminal volatile fatty acid profile (Exp. 3)………………………............70
Page 9
ix
Acknowledgements
Attending Kansas State University as a MS student pursuing a degree in Animal Science-
Ruminant Nutrition has been a dream come true. This experience will be remembered as one that
pushed me out of my comfort zone in which I learned how to question and analyze research to
come to conclusions of my own.
Many people have played integral parts in my MS program; I could not have achieved
this goal of mine without them. I want to thank Dr. Dale Blasi, my advisor and mentor, for
giving me this opportunity to conduct research under your wing. Thank you for all your advice,
positive guidance, and willingness to help me at any time I was in need. You truly have been a
wonderful advisor in which I could treat this role as a job, doing my own work at my own pace
without being micromanaged. You have become Kansas family to me and I know I can turn to
you at any time with any question in the future. To my committee members, Dr. Evan
Titgemeyer, Dr. Aimee Wertz-Lutz, and Dr. Sean Montgomery, thank you for your many hours
of time taken out of your days to guide me with whatever issue that might have been presented.
Dr. Titgemeyer-you are someone I have high respect for, thank you for the countless times you
answered any technical questions such as lab work, data analysis, and much more. Dr. Wertz-
Lutz- thank you for all that you did to make my projects happen. Your coordination and
willingness to help at any time is much appreciated. Dr. Sean Montgomery-you too have been
willing to help at any time of the day. Thank you for your mentorship; you are someone I look up
to and I hope you won’t mind more questions in the future as I begin my career in industry.
A few people who were “behind the scenes” and deserve my thanks are Jim Dunn, Dr.
Chris Vahl, Cheryl Armendariz, and all of the members at the KSU Beef Stocker Unit. Jim-thank
you for presenting me with this opportunity and believing in me. Your coordination “behind the
Page 10
x
scenes” is much appreciated. Dr. Vahl- thank you for your contributions in the statistical design
and analysis of these projects. Cheryl, thank you for always answering any questions I could
come up with in terms of the lab work. I want to thank everyone at the KSU Beef Stocker Unit
especially Bill Hollenbeck and Ross Wahl-I could not have done this without you all. Your
constant coordination for processing, weigh days, and everything else in between is much
appreciated.
I want to thank my family for their constant love and support during this crazy
time in my life. Thank you for your advice, listening ears, and words of encouragement from
back home. Lastly, I want to thank my fiancé, Anthony Schilling. There is not enough words to
describe how thankful I am of you, especially during this time. I could not have tackled this
without you-you have helped me anywhere from rumen sampling to feeding a lot full of calves to
tedious lab work. Your constant love and support has gotten me through this chapter in my life
and I cannot wait to see what our next chapter brings.
Page 11
1
Chapter 1 - Review of Literature
Introduction
Minimizing cattle health issues and attaining desired performance targets during the
receiving and growing phase are constant challenges of the United States cattle feeding industry.
During the receiving and growing phase, calves typically are recently weaned and experience
various physical and psychological stressors which can create health issues and depress feed
intake (Galyean and Hubbert, 1995), generating a challenge for the cattle industry. To reduce
stress and thereby maximize the outcome of newly arrived calves, proper receiving management
is critical. Feed intake typically is low in stressed, newly received calves (Lofgreen, 1983;
Lofgreen, 1988; Hutcheson and Cole, 1986; Galyean and Hubbert, 1995). To encourage feed
intake, formulating a diet that is palatable and meets nutritional requirements, while being
economically feasible is imperative. Byproducts are commonly used as an ingredient in growing
and receiving rations because of their availability, nutrient value, and cost (Leupp, 2008). Feed
additives containing antibiotics, coccidiostats, and ionophores have been developed to minimize
the effects of stress and enhance calf health, thereby increasing growth performance. Ingredient
selection when formulating a diet for receiving and growing calves is a critical first step towards
proper receiving period nutrition management.
Status of Receiving and Growing Calves
Upon weaning, a calf can experience many different outcomes. Most calves go through
some sort of post weaning program which varies widely in growing structure and type (Peel,
2003). The weaning program can be termed as a stocker/backgrounding operation that is located
Page 12
2
at the original birthplace of the calf or at a separate entity for a period of time before entering the
finishing stage of the calf’s life. The program can also be termed as the receiving stage in which
the calf is shipped after weaning to the finishing phase. The overall goal of the receiving and
growing stage of the calf’s life is to maintain health, improve nutrition, and increase body weight
in preparation for the finishing stage where the animal’s performance can be optimized.
Stress, whether it be psychological (restraint, handling, or novelty) or physical stress
(hunger, thirst, fatigue, injury, or temperature extremes) is often subjected to the newly weaned
calf as it is entering a feedlot environment (Grandin, 1997). Loerch and Fluharty (1999)
suggested that the greatest stress imposed by marketing calves is the weaning period. This is a
big change for the calf, as it is denied its dam’s milk and social contact with its dam and other
cattle (Stookey et al., 1997). After weaning, the calf is marketed, transported, and comingled
with other calves to then proceed to the feedlot. Calves are often commingled during this time
with calves of different backgrounds, and even more so, calves with different immunological
statuses. Factors that may contribute to stress during the period of transportation includes feed
and water deprivation, overcrowding, poor air quality, poor sanitation, and unexpected noise
(Loerch and Fluharty, 1999). Once the animal arrives at the feedlot, it is then subjected to
processing, further commingling, a new environment, and potentially, a new feed. Processing
(dehorning, castration, vaccination, etc.) is an obvious physical stress that may overwhelm an
animal, followed by the stress of commingling (Loerch and Fluharty, 1999). During this time, the
animal’s social rank within a pen is tested and established, adding further stress to the animal
(Grandin, 1997). Loerch and Fluharty (1999) defined feedlot environment stress as acclimating
to mud, manure, poor air quality, and exposure to a new social dominance order and new
pathogens. The newly received calf if recently weaned is accustomed to the dam’s milk, not the
Page 13
3
typical mixed diet presented to the animal upon arrival at the feedlot. This can cause stress, as
well as have an impact upon digestibility of a new diet.
The multitude of stressors inflicted upon the animal at weaning, marketing,
transportation, commingling, and the arrival at the feedlot has an impact on the health status of
the animal. Stress negatively affects the immune system at a time when the animal is more likely
to be exposed to infectious agents as a result of commingling (Blecha et al., 1984). The most
common infectious agent available to receiving calves is bovine respiratory disease (BRD), a
viral/bacterial disease that causes morbidity and mortality, and continues to be the most
significant health problem facing the U.S. beef cattle industry (Duff and Galyean, 2007). In a
survey conducted by Loneragan et al. (2001a), from 1994 to 1999 and averaged over time, the
mortality ratio was 12.6 deaths for every 1,000 calves entering the feedlot. Of those deaths,
57.1% were attributed to a respiratory tract infection (Loneragan et al., 2001a).
The causative agents of BRD are a combination of bacterial and viral pathogens. The
bacterial agents include Mannheimia haemolytica, Pasteurella multocida, and Histophilus somni
(Duff and Galyean, 2007) with Mannheimia haemolytica being the most common organism
associated with the disease (Pandher et al., 1998). In combination with these bacterial pathogens
are viral agents. These are identified as infectious bovine rhinotraceitis (IBR), parainfluenza-3
(PI3), bovine viral diarrhea virus (BVDV), and bovine enteric coronavirus (Plummer et al.,
2004). Of the viral pathogens, BVDV is often focused on; BVDV can be transmitted either
horizontally (postnatal transmission) or vertically (fetal infection). A calf can become
persistently infected (PI) via fetal infection, and continues to shed the virus over its lifetime
(McClurkin et al., 1984). PI animals offer a threat of transmission to healthy calves free of the
Page 14
4
infection (Duff and Galyean, 2007), and when paired with stress and commingling, transmission
is a likely outcome.
During the first 27 days of the receiving period, some animals might be removed from
their pens for examination and potential treatment of BRD (Buhman et al., 2000). Correct
diagnosis of these animals is critical during this time that could harm or help the animal’s health
status. Calves suffering from BRD display symptoms that include nasal or ocular discharge,
depression, lethargy, emaciated body condition, labored breathing, or any combination of these.
Usually calves are considered morbid when rectal temperature reaches ≥ 39.7˚C (Duff and
Galyean, 2007). Observation of animals by humans is the primary method of BRD recognition
(Hanzlicek, 2010). Because of the subjective nature of observation, and the observational skill
and experience variability between observers, diagnosis is not always accurate (Duff and
Galyean, 2007). Previous research has confirmed the lack of sensitivity of observational
methods. In one study, 5,976 calves in a Midwestern feedlot revealed a BRD morbidity
incidence of 8.17%, but at harvest 61.9% of the animals had lung lesions, suggesting a previous
BRD challenge (Schneider et al., 2009). This proves that daily animal checks and accurate
diagnosis is vital to ensure a healthy population and reduce chronicity. If an animal is properly
diagnosed and treated, there is a lesser risk of having negative effects on subsequent performance
and health.
Stresses associated with weaning, marketing, and transport of beef cattle have marked
effects on health, but effects on feed intake are also important (Galyean and Hubbert, 1995).
Calves that arrive at the feedlot may be unaccustomed to waterers and feed bunks due to prior
environment surroundings. If calves are unaccustomed to new methods of feed and water
provision, feed intake can be jeopardized. Adequate feed intake is important because it provides
Page 15
5
essential nutrients to the animal that have an impact on health and growth performance.
Typically, feed intake is low in stressed, newly received calves as shown by Hutcheson and Cole
(1986) in a study comparing feed intake of healthy and morbid calves. For healthy calves, during
the first 7 days of the arrival period, feed intake averaged 1.55% of BW daily, and when
averaged for the first 28 days, intake was 2.71% of BW daily. Feed intake was even lower for
morbid calves with an average of 0.9% of BW daily for the first 7 days after arrival and averaged
1.84% of BW daily for the first 28 days. Within the stress of the receiving and arriving process,
several factors are involved in the ability of newly weaned calves to adapt to their new diet
(Fluharty, 2003). Calves that are transported by truck undergo periods of feed and water
deprivation that can alter rumen environment and function (Loerch and Fluharty, 1999), which in
turn can contribute to low feed intake. The rumen status of the newly arrived calf has been an
ongoing subject of research. Baldwin (1967) published that the total number of bacteria in the
rumen is reduced by 10 to 25% of normal after a 48-h period of feed and water deprivation. The
total number of bacteria in the rumen was based on in vitro experiments calculating rumen
fermentative capacity and rumen fermentative activity. Twenty-seven years later, Fluharty et al.
(1994) conducted a more applicable study that contradicted Baldwin (1967). Newly weaned,
fistulated steers were used to determine the effects of energy density and protein source in
receiving diets on in situ dry matter (DM) disappearance, neutral detergent fiber (NDF) and
nitrogen disappearance, concentrations of ruminal bacteria, protozoa, ammonia and pH. Fluharty
et al. (1994) suggested that the viable total and cellulolytic ruminal bacteria concentrations are
not drastically reduced by weaning and 24-h stresses and, furthermore, that the ruminal microbial
population is able to effectively digest available substrate following feed and water deprivation.
Fluharty et al. (1996) subsequently studied the effects of the duration of feed and water
Page 16
6
deprivation on ruminal microbes and ruminal characteristics of newly weaned and feedlot-
adapted calves. Conclusions from this study indicate that ruminal volume, DM, total weight of
ruminal contents, and protozoal numbers decrease as duration of the fasting period increases, and
this decrease is related to a reduction in DM intake (DMI). Prior research shows that poor
performance and low DMI of newly arrived feedlot calves are not a result of reduced ruminal
bacterial numbers and digestive capacity (Loerch and Fluharty, 1999).
Management personnel have the ability to implement several strategies that can
positively affect a newly arrived calf’s feed intake to ensure adequate nutrient uptake. Selecting
preconditioned calves that have been offered creep fed, exposed to a feedbunk, and/or preweaned
(Loerch and Fluharty, 1999) can have a positive impact on an animal’s performance including
increased feed intakes. Another strategy to mitigate low feed intakes is to reduce stress-
associated behavior (Loerch and Fluharty, 1999). How an animal is handled early in life will
have an effect on its physiological response to stressor later in life (Grandin, 1997). Also, how an
animal is handled when loading, unloading, sorting, and processing can be correlated with feed
intake. The goal of increased feed intake is to increase nutrient intake respectively. A
management strategy that can be implemented to increase nutrient intake is to increase the
nutrient density of the diet to offset the low feed intakes of newly arrived cattle (Loerch and
Fluharty, 1999). The series of events a newly received calf undergoes, and thereby the effects,
emphasize the importance of a well-balanced receiving and growing diet which presents a solid
starting place for calves that are transitioning from the weaning to the growing phase.
Page 17
7
Role of Energy
Growing calves have specific energy needs to perform biochemical, physiological, and
nutritional processes that account for their maintenance and growth. As the high stressed calf
first enters the feedlot environment, feed intake is negatively affected for the first few days to
weeks after arrival (Lofgreen, 1988). As feed intake is negatively affected, components of the
diet, including energy, are compromised and later can lead to health issues. One strategy to
increase energy intake that has been previously evaluated to improve calf health is to add
artificial sweeteners or other flavoring agents (Rivera et al., 2004). The most commonly used
approach is to increase the energy concentration in the diet by increasing the level of concentrate
in respect to roughages (Rivera et al., 2005). Unstressed cattle have opposite feeding behaviors
compared with newly arrived stressed cattle (Lofgreen, 1983). Typically, unstressed calves will
consume enough feed to properly maintain their energy requirements, and to fulfill their other
intake requirements, they dilute the diet by ingesting lower energy dietary ingredients. In
contrast, stressed calves consume less low energy ingredients (roughages) and more high energy
ingredients without any regards to energy requirements (Lofgreen, 1983).
Although it seems that stressed calves have a higher feed intake on high-energy diets,
increasing energy levels in the receiving diets usually results in higher morbidity but better
performance (Lofgreen, 1983). Lofgreen et al. (1980) fed flaked-milo at 25, 50, and 75% of the
diet and found that with increasing levels of concentrate there was an increase of morbidity. The
percent of calves treated for BRD was 47, 49, and 57% respectively. The following year,
Lofgreen et al. (1981) compared millet hay alone with millet hay plus 75% concentrate milled
feed and found that animals on hay alone tended to have fewer sick days although they had lower
gains. Fluharty et al. (1996) compared 70, 75, 80 and 85% concentrate diets in their first
Page 18
8
experiment and found that DMI increased as percent concentrate increased. In contrast to
Lofgreen et al. (1980), they did not report negative effects of concentrate level on morbidity of
newly received steer calves. Energy concentrations did not influence performance or overall
morbidity in a study by Berry et al. (2004) where differing dietary energy and starch
concentrations were evaluated for effects on performance and health of newly received feedlot
calves in a 42-d receiving period. These authors noted that cattle fed high energy diets had a
lesser incidence of shedding Pasteurella multiocida and Histophilus somni pathogens in calves
that received one or more antimicrobial treatments. The results between the three studies
mentioned are quite different. Differences between the three can be attributed to source of cattle,
time of year, nature of the diet, management practices, and other unknown factors that could
likely confound the relationship between concentrate level and BRD morbidity (Galyean et al.,
1999). Whether the effects of immunity are associated with energy is still open to question, but
adequate energy intake and body energy stores are important for all bodily functions (Duff and
Galyean, 2007).
Role of Protein
Protein requirements for beef cattle are represented in grams per day and are based on
weight and production targets. The amounts required per day are then presented as a percentage
of DMI. Oftentimes, for newly received calves, DMI is low during the initial weeks, as
previously discussed. To offset the low DMI, higher concentrations of dietary crude protein (CP)
are required (Fluharty and Loerch, 1995). Eck et al. (1988) reported that incoming steers should
receive a 12.5% CP diet, however, even a 12.5% CP receiving diet might not meet the CP
requirements if DMI is low. Cole and Hutcheson (1990) pointed out that it is nearly impossible
Page 19
9
to formulate a diet that will enable cattle to gain weight when they are consuming 1% or less of
their BW daily. They calculated that the required CP percentage would range from 21% at an
intake of 1% of BW daily to approximately 10% at an intake of 3% of BW daily. This presents
the challenge of how much protein to formulate for based on the variation of feed intake.
Galyean et al. (1993) conducted an experiment to determine the effects of different CP
concentrations in the receiving diet on health and performance of newly received calves. Calves
had been in transit for 19.5 h and were assigned to one of three CP concentrations (12, 14, or
16%) for 42 days. Average daily gain and daily DMI increased with increasing levels of CP.
However, more calves were treated for symptoms of BRD on the 16% CP diet and the 12% CP
diet than on the 14% CP diet. To determine if receiving diet CP concentration would affect
subsequent performance, calves were held in respective pens for 42 days (post receiving phase)
following the previous 42 day receiving period and were fed a common 14% CP diet.
Concentrate level of the 14% CP diet was 75% for the first week, after which calves were
stepped up to an 85% concentrate diet. Results of the post-receiving period indicated that calves
fed the 12% CP diet during the 42-day receiving phase, compensated during the post-receiving
phase indicating that the CP concentration fed during the receiving period did not affect the
overall performance. Fluharty and Loerch (1995) conducted three trials to determine the effects
of CP concentrations and source on receiving cattle performance. In the first trial, they used a 2 x
4 factorial experiment, with one factor being CP concentration (12, 14, 16, or 18%) and the other
factor being protein source (soybean meal vs. spray-dried blood meal). Soybean meal and blood
meal differ as protein sources in the sense that 35% of protein from soybean meal is rumen
undegraded protein (RUP) (NRC, 2000), and 82% of protein from spray-dried blood meal is
RUP (Beef, 2015). Veira et al. (1980) concluded that to achieve efficient protein utilization, the
Page 20
10
diet should provide adequate N for optimum microbial growth, and if extra protein is required by
the host, protein should be supplied to bypass ruminal fermentation. For the entire 42-day trial,
calves assigned to blood meal diets resulted in 7.4% greater gains compared to soybean meal
diets. Gain:feed increased with increasing CP concentration over the entire trial. Blood meal
diets improved gain:feed by 11% for the 42 days. Morbidity increased with increasing CP
concentration, but source did not influence morbidity. In the second trial, calves were assigned to
six different CP concentrations (11, 14, 17, 20, 23, or 26%). No differences in DMI were
observed, but maximum gain and feed:gain were observed with the 20% CP diet. Morbidity did
not differ among treatments. In the third trial, the treatments were 1) 12.5% CP diet based on
soybean meal, 2), phase-feeding of 23% CP in wk 1, 17% CP in wk 2, and 12.5% CP in wk 3
and 4. The percentage of morbidity was low across all treatments.
As dietary CP levels increase, morbidity rate tends to increase as observed by Galyean et
al. (1993) and Fluharty and Loerch (1995) in trial 2. Metabolizable protein (MP), is a system that
accounts for rumen degradation of protein and separates requirements into the needs of the
microorganisms and the needs of the animal (NRC, 2000). Nissen et al. (1989) fed diet
containing 5.2, 6.4, 7.4, or 9.5% MP to newly received calves. They reported a linear increase in
ADG and improved feed: gain with increasing MP levels. However, he also found that the
percentage of untreated calves decreased linearly with increasing MP. To better determine
protein requirements of newly received calves, equations and tables based on the NRC (2000),
previous research, and management experiences should be considered to come to a conclusion.
Page 21
11
Concentrate Selection
Growing and receiving cattle are typically fed diets that contain approximately 50 to 75%
concentrate due to specific nutrient requirements and economics. Concentrates are higher in
energy value than roughages, and they are typically cereal grains and their byproducts. The most
common cereal grains that are used in growing and receiving cattle diets are corn, sorghum,
barley, wheat, and oats. Corn and its byproducts are commonly used as the concentrate portion in
feeder cattle rations. The common use of corn and its byproducts as a concentrate source can be
explained by its feed value and high availability.
Before 1920, increased corn production was attributed to increased land area, whereas
after 1935, land area devoted to corn production declined and the increase in corn production
was a result of increased yield per unit of land area (Farnham et al., 2003). Since then, U.S. corn
production has dramatically increased; corn production went from 2.0 billion bushels yearly
during the 1930s to 12.6 billion bushels yearly today, on the same amount of acreage (81.99
million acres) (Karlen et al., 2012). This dramatic increase in corn production can be attributed to
new technologies and advancement in genetics. According to the USDA-ERS, corn is
responsible for 93.8% of the United States feed grain production compared with barley, oats, and
sorghum (ERS, 2015). In 2007, researchers at Texas Tech University surveyed 29 feedlot
nutritionists and found that the primary grain used in beef cattle feedlots was corn (Vasconcelos
and Galyean, 2007). Wheat, sorghum and barley followed the top grain choice of corn as the
second, third, and fourth most used grain (Vasconcelos and Galyean, 2007). Corn is a clear
choice for newly received cattle diets in comparison with the other common cereal grains
because of its consistent composition and flexibility for further processing. Owens et al. (1997)
Page 22
12
investigated performance of cattle fed different grains processed by various methods and found
that the mean G:F for cattle fed dry rolled corn was 5.1% greater than the mean G:F for cattle fed
dry rolled barley, and Zinn (1993) found similar results with steam rolled barley and corn. Zinn
(1993) reported that steam rolled corn improved G:F of cattle 6.2% compared with cattle fed
steam rolled barley. Likewise, Loe et al. (2006) compared dry rolled barley and dry rolled corn
and found that corn fed steers were 23% more efficient than barley fed steers. Steers fed corn
gained faster, consumed less, and had heavier final BW. The consistent performance of cattle
that are fed corn can be attributed to the minimal variation in starch content when compared to
other cereal grains like wheat, sorghum, barley, and oats. With minimal variation in starch
content, diets are more consistent and there is then less risk of ruminal or digestive upset
(Herrera-Saldana et al., 1990).
Value of Corn Fed to Ruminants
Corn is of great value as a feed ingredient because of its high energy, and low fiber
content. The high energy content is a result of the high starch content; corn grain contains 72%
of DM as starch (Huntington, 1997). Behind the rich nutrient profile of corn is the kernel
structure which consists of the hull, endosperm, and the germ. The fibrous hull, about 6% of the
kernel, surrounds the entire structure (Blanchard, 1992). The majority of the hull is the pericarp,
a dense outer layer of dead cells that help to protect the seed. Underneath the hull, is the
endosperm that makes up 82% of the kernel (Blanchard, 1992). The endosperm is comprised
mostly of starch, in fact making up 86.6% of the total starch of the corn kernel. There are two
regions of the endosperm, the soft and the hard. The soft, or floury region contains large and
round starch granules in a thin protein matrix, providing much of starch (Blanchard, 1992) and is
Page 23
13
the most susceptible to later processing and digestion (Kotarski et al., 1992). In the hard, or
horny area the protein matrix is much thicker to hold the starch granules more firmly (Blanchard,
1992). The last component of the corn kernel is the embryo, or germ, constituting 12% of the
kernel (Blanchard, 1992). Oil and protein are the main components of the germ, where energy
and protein provided to ruminants are found.
Light-weight, younger cattle are able to efficiently “process” whole corn kernels through
mastication that damages the pericarp to allow bacterial attachment (Lofgreen, 1988).
Beauchemin et al. (1994) observed that most kernels were broken during consumption of whole-
shelled corn by cows, suggesting that corn processing might not be necessary to optimize
digestion. A study by Siverson et al. (2014) concluded that whole shelled corn can be fed to
receiving and growing cattle as an energy source with responses similar to those of dry rolled
corn. Although whole corn grain is fed to ruminants, many methods of processing have been
employed in an attempt to improve its utilization by livestock (Scott et al., 2003). The underlying
goal is to increase the amount of energy (starch) available to the animal, thereby increasing gain
efficiency (Scott et al., 2003). The most common type of processing method used in large-scale
beef cattle feedlots is steam-flaking, followed by dry-rolling and high-moisture harvesting and
storage (Vasconcelos and Galyean, 2007). Nutrient content and performance results vary across
corn processing methods, but ultimately the cost and effectiveness is the driving force for which
is utilized.
Ethanol Industry
In addition to an ingredient source for the cattle feeding industry, corn also serves the
purpose of being further developed into ethanol for fuel. Corn is the most important and
Page 24
14
economical source of starch in the United States. The starch derived from the kernel can be
readily converted into glucose and fermented into ethanol (Bothast and Schlicher, 2005). Ethanol
production has dramatically increased since the 1970’s world oil crisis, the clean air legislation
in the 1990’s and the passing of the 2005 energy bill (Bothast and Schlicher, 2005). Ethanol
production from corn is an alternative fuel source for the United States. The United States has a
dependence on foreign oil and to decrease this reliance and promote local economies, domestic
substitutes for energy sources are needed (Murthy et al., 2006). In 2014, ethanol plants in 29
states produced a record of 14.3 billion gallons proving that the United States is indeed the
leading ethanol producer with 60% of the global output (RFA, 2015). During the process of
manufacturing ethanol from corn, byproducts are created and can be used as concentrate sources
in receiving and growing rations. As ethanol production reached record levels in 2014, so did the
output of animal feed coproducts with production of approximately 39 million metric tons of
feed (RFA, 2015). Utilizing byproducts as a feedstuff for ruminants is economically practical
because of their availability, nutrient value, and cost (Leupp, 2008).
Dry Milling Byproducts
Ethanol can be manufactured from corn by two processes; dry or wet milling. 67% of
ethanol is produced by dry milling and this can be attributed to the fact that the focus is
maximizing the capital return per gallon of ethanol (Bothast and Schlicher, 2005). This means
that the focus is not on producing other products, but on producing the most amount of ethanol.
This system requires the lowest amount of investment and operational requirements in
comparison with the alternative, wet milling.
Page 25
15
The dry milling process utilizes as much of the corn kernel as possible. There are five
steps to the dry mill ethanol process: grinding, cooking, liquefaction, saccharification, and
fermentation (Bothast and Schlicher, 2005). During the grinding step, corn is screened then
hammer-milled to a medium-coarse to fine-grind meal. The flour-like substance is then
combined with water and alpha-amylase enzymes to form a slurry. The cooking step entails the
resulting mash being cooked, sterilized to kill non-desirable bacteria, and further liquefied. The
mash is cooled and a glucoamylase enzyme is added (saccharification) along with yeast to
convert glucose to ethanol and carbon dioxide (fermentation) (Kalscheur et al., 2008).
After fermenting for 48 to 72 hours, the mash is then distilled to form ethanol and whole
stillage (remaining water and solids). Whole stillage is then centrifuged to separate the coarse
solids from the liquids. The liquid is then evaporated to become condensed distillers solubles or
syrup. The coarse solids are considered the major byproducts of ethanol production by dry
milling. They include wet distillers grains, which can be combined with condensed distillers
solubles to form wet distillers grains with solubles, or dried to form dried distillers grains
(Kalscheur et al., 2008). For every bushel of corn that is manufactured, 2.8 gallons of ethanol,
8.16 kg of carbon dioxide, and 8.16 kg of distiller grains are produced. In other terms, each
bushel or kernel that is processed, one-third becomes ethanol, carbon dioxide or distillers grains
(Kalscheur et al., 2008).
Dried Distillers Grains-Overview
Dried distillers grains are the most predominant byproduct produced by the dry milling
process; 60% of the distillers produced are dried, 27% is wet distillers, and 13% modified
distillers (RFA, 2015). Dried distillers grains are developed by combining wet distiller grains
Page 26
16
with condensed distiller solubles and drying the mixture. Drying the mixture is preferable for
ethanol plants because wet distiller grains have a shelf life of only one to two weeks which can
make transportation, handling, and storage challenging (Bothast and Schlicher, 2005). It is
certainly energy-intensive to dry wet distiller grains into dried distiller grains, but the production
of a uniform, stable, and high-quality feed product is essential to the profitability of the plant,
resulting in a domination of dried distiller grains (Bothast and Schlicher, 2005).
Feeding Value of Dried Distillers Grains
During the dry milling procedure, after fermentation, the starch is removed from the
mixture and the other nutrients, mainly protein, fat, fiber and P found within corn grain become
more concentrated (Stock et al., 2000). For example, crude protein increases from 10% in the
original corn grain to 30% in dried distiller grains plus solubles, fat from 4 to 12%, NDF from 12
to 36%, and P from 0.3 to 0.9% all on a DM basis (Klopfenstein et al., 2008). During the 1990s,
for reasons previously stated, the production of ethanol increased and the feeding value of dried
distillers grains shifted. Previously, dried distillers grains was used as a protein source, but after
the dramatic increase of ethanol production, there was a major paradigm shift; distillers grains
being used as an energy source rather than a protein source (Klopfenstein et al., 2008). Dried
distillers grains are an excellent source of protein with 65% of the ~30% CP as RUP (Erickson et
al., 2012).
An issue that can arise when feeding distillers grains is the increase in concentrations of
minerals, specifically P and S. Traditionally, distillers grains contain between 0.65 and 0.95% P,
which when balanced for proper Ca:P ratio is not a concern (Klopfenstein et al., 2008). Whilst
processing corn into ethanol, sulfuric acid is used for pH control and cleaning, resulting in S
Page 27
17
levels of 0.6 to 1.0% or greater (Klopfenstein et al., 2008). Elevated levels of dietary S are
problematic, posing a health concern (Loneragan et al., 2001b). High levels may lead to
polioencephalomalacia, reduced DMI and ADG, and reduced Cu stores (Klopfenstein et al.,
2008).
Acidosis is a metabolic disease that occurs when the pH of the rumen falls below 5.5 as a
result of ingesting increasing amounts of rapidly fermentable carbohydrates. Distillers grains can
decrease acidosis related challenges by diluting dietary starch, i.e., fermentable carbohydrates
(Erickson et al., 2012). Distillers grains are relatively low in starch, high in fiber, protein and fat
due to ethanol production. During the dry milling procedure, the starch in corn grain is converted
to glucose which is later converted to ethanol. As a result of the low starch content, feeding
distillers grains can dilute dietary starch and influence rumen metabolism (Erickson et al., 2012).
Feeding wet corn gluten feed helps prevent the risk of acidosis with high-grain diets, as observed
by greater rumen pH in steers (Krehbiel et al., 1995). Wet corn gluten feed has amounts of fiber
similar to that of distillers grains, indicating that prevention of acidosis is linked with feeding of
distillers grains (Klopfenstein et al., 2008).
New technologies that alter the dry milling process make it challenging for nutritionists
to formulate diets. These new technologies alter the nutrient content of distillers grains, and can
vary from plant to plant.
Wet Milling Byproducts
Unlike, the dry milling process, the wet milling focuses on investing in a technology that
will separate and produce valuable byproducts, making it much more capital and energy
intensive (Bothast and Schlicher, 2005). As a result, only 33% of ethanol is produced by means
Page 28
18
of wet milling (Bothast and Schlicher, 2005). However, the dry milling procedure accounts for
only 10% of total corn oil production (Watson, 1988). Both methods fulfill different purposes
and produce different byproducts for cattle use.
The overall goal of wet milling is to separate the kernel into distinct products, thereby
obtaining highly purified individual components of corn (Herold, 1999). As outlined by
(Blanchard, 1992) the wet milling procedure begins with the whole cleaned corn grain being
steeped by soaking for 40 hours in warm water with added sulfur dioxide. This softens the kernel
for further grinding, loosens the protein matrix, and removes soluble material which is then
evaporated. After the 40-hour steeping process, the corn is then passed through degerminating
mills. The purpose of the mill is to tear the kernels apart to free the germ fraction of the grain.
The germ is separated due to it being lower in density, because it contains 85% of the corn’s oil
(Blasi et al., 2001). It can be separated in hydrocyclones because of its density measurements,
after which it is washed free of starch and gluten, dewatered, and dried.
The remaining material, which consists of starch, gluten, fiber, and kernel fragments is
put through fine-grinding mills which releases the remaining starch and gluten. Because the fiber
fraction is not easily ground, it is separated, washed on a series of screens, and later dewatered
and dried. The starch-gluten slurry screened free of fiber is centrifuged to separate the gluten.
The gluten is then thickened in another set of centrifuges, dewatered, and dried. The remaining
starch slurry is purified with fresh water in hydrocyclones and can be further processed for
ethanol or high fructose corn syrup production (Blanchard, 1992).
The wet milling industry produces an array of high value byproducts. There are several
byproducts that are utilized in ruminant diets. Corn bran, corn gluten feed, corn gluten meal, corn
germ meal, and condensed fermented corn extractives or corn steep liquor are all byproducts that
Page 29
19
are regularly used in the feed industry (Loy and Wright, 2003). There are no absolute byproduct
yields in corn wet milling. The yields depend on the range of byproducts being made, the
equipment available, and the composition of the corn (Blanchard, 1992). In general terms, for
every bushel of corn, the wet milling process will yield 0.78 kg corn oil, 1.55 kg condensed
fermented corn extractives, 0.83 kg corn germ meal, 2.67 kg corn gluten feed, 1.16 kg gluten
meal, and 14.63 kg starch (Blasi et al., 2001).
Corn Germ Meal-Overview
Germ is separated from the kernel virtually completely to manufacture corn oil because it
contains on a DM basis, 45 to 50% oil, 13% protein, and 12% starch (Blanchard, 1992). The oil
extraction process is a sector in its own. Not every wet corn mill has the equipment to process
corn germ into oil and meal (Johnson and May, 2003). The process for oil recovery and germ
meal production is outlined by Johnson and May (2003). Germ is first softened by heat and
steam before pressure is applied to rupture the oil cells. Oil can be extracted via a conventional
expeller or solvent extraction. An expeller essentially applies pressure and squeezes the germ,
decreasing the oil content from 45 to 6%. In solvent extraction, germ is pressed to an oil content
of 13 to 20% (Bredeson, 1983), flaked with roller mills, and solvent extracted with hexane to
lower the oil content to approximately 1.5%. Solvent extracted germ meal, the remaining
residue, is desolventized with heat by means of direct and indirect steam. The oil rich solvent,
called miscella, is heated, steamed and vacuumed to be further refined.
Corn germ meal can be used as a component of livestock feeding systems. The amino
acid profile is better than corn as a whole (Blanchard, 1992), and it can be used as a carrier of
nutrient supplements, such as vitamins, minerals, and medicants in animal feeds (Johnson and
Page 30
20
May, 2003). Solvent extracted corn germ meal can be combined with corn steep liquor and corn
bran to produce corn gluten feed (Johnson and May, 2003).
Corn Germ Meal in Diets
As stated previously, corn germ meal has a much better nutritional balance than whole
corn grain, making it a desirable feed ingredient. Corn germ meal has medium protein and
energy content and typically is used as a component in swine and poultry rations (Blanchard,
1992). On a DM basis, corn germ meal contains 25% protein, and 1.5% oil (Blanchard, 1992).
Very little literature exists on solvent extracted germ meal as an ingredient for ruminants, and
less for receiving and growing cattle.
Kelzer et al. (2009) investigated the effects of feeding three corn milling coproducts on
intake, milk production, ruminal fermentation, and digestibility of lactating Holstein cows. The
three coproducts that were examined were dried distiller grains, dehydrated corn germ meal, and
high protein dried distillers grains. Cows that were fed the dehydrated corn germ meal in the first
experiment tended to consume more feed and tended to produce more milk. The authors
suggested that it is possible that the higher fat content of this diet resulted in a greater supply of
energy and thus allowed animals to produce more milk. In the second experiment, the
digestibilities of the diet were not different. Kelzer et al. (2009) concluded that dairy diets can be
successfully formulated to include 15% of diet DM as corn-milling coproducts while maintaining
yields of milk and milk components. Although full fat corn germ meal and lactating dairy
animals are quite different from corn germ meal and receiving and growing cattle, this
information still is useful.
Page 31
21
Similarly, Miller et al. (2010) evaluated full fat germ as a replacement for whole
cottonseed and tallow in total mixed rations for lactating dairy cows. DMI, milk yield, energy
corrected milk, lactose percentage, protein and lactose yield and somatic cell count did not differ
among diets. Milk fat percentage and fat yield were lower with the full fat germ diets. The
authors concluded that additional studies need to be conducted to determine the amount of full-
fat corn germ to feed to lactating dairy cows. Sulpizio et al. (2010) compared tallow and dried
full fat corn germ as supplemental energy sources to finishing beef heifers. ADG was 1.36 kg for
the tallow fed heifers; this compares with the heifers that were fed corn germ with an ADG of
1.34 kg. This posed no significant differences, but DMI was greater for the heifers fed the corn
germ than for the heifers fed tallow. Thus, heifers fed the corn germ as a supplemental energy
source were 3.4% less efficient. The authors concluded that when priced appropriately corn germ
is a suitable substitute as a supplemental energy source in finishing diets.
The previous literature summarized involves full fat germ meal as an energy source in
ruminant diets. Solvent extracted germ meal has little oil content, making it hard to compare to
the previous literature on full fat germ meal. Herold (1999) conducted a few studies more
relevant to solvent extracted germ meal in order to assess the energy value. When evaluating the
effect of solvent extracted germ meal with and without steep liquor on performance of finishing
steers and lambs, Herold (1999) found that the energy value of corn germ meal was similar to or
greater than dry rolled corn in finishing cattle. In lambs, solvent extracted corn germ meal
diminished dietary energy density and digestibility in lambs when compared to dry rolled corn.
Herold (1999) also conducted a receiving trial and two finishing trials to evaluate corn germ as
an ingredient in wet corn gluten feed by combining steep liquor with corn germ or dry corn bran.
In the receiving trial, DMI and ADG did not differ among treatments, but feed efficiency tended
Page 32
22
to be greater for the corn germ diet. He concluded that corn bran promotes greater DMI, whereas
corn germ and corn steep liquor possess higher energy content than bran. Overall, more research
on the energy value of solvent extracted corn germ meal is needed regarding the effects of corn
germ meal on the growth performance of receiving and growing cattle.
Nucleotides as a Feed Additive
Newly arrived calves that are recently weaned undergo changes in the gastrointestinal
tract which, in turn, can lead to health problems. Calves, when recently weaned, are more
susceptible to diseases such as BRD. Viral pathogens can destroy villus structure and decrease
absorptive surface area of the small intestine (Bridger et al., 1978; Saif et al., 1986; Holland et
al., 1992). Feed additives have been developed to assist in the transition for calves in ways
typical ingredients cannot. Nucleotides may serve as an immune boosting feed additive that can
minimize the effects of stress and enhance calf health by accelerating the immune response,
thereby increasing health and growth performance.
Structure of Nucleotides
Nucleotides are subunits of nucleic acids such as DNA or RNA that are composed of a
phosphate group, a five-carbon sugar, and a nitrogenous base. Nucleotides participate in many
biochemical pathways and are constantly synthesized and degraded in all tissues, especially in
tissues with a rapid turnover rate such as cells in the immune system, intestinal mucosa, skin, and
progenitors of leukocytes or erythrocytes (Uauy, 1989). Besides their role in biochemical
pathways, studies have suggested that dietary nucleotides may promote the development of the
gastrointestinal structure (Uauy et al., 1990), control intestinal microorganisms (Gil et al., 1986),
Page 33
23
and influence immune function (Lee et al., 2007). There are three potential sources of
nucleotides: de novo synthesis, salvage pathways, and the diet (Cosgrove, 1998; Boza, 1998).
The de novo synthesis of nucleotides is a metabolically costly process that requires considerable
amounts of energy in the form of ATP (Carver and Allan Walker, 1995). The salvage pathway
requires less energy than the de novo synthesis because it recycles 90% or more of the purine
bases under fed conditions, suggesting that the pathway is dependent on the availability of free
purine and pyrimidine bases (Uauy, 1989). Some tissues have limitations for de novo synthesis
and therefore require nucleotides via the salvage pathway (Savaiano and Clifford, 1981; LeLeiko
et al., 1983; Gil and Uauy, 1995). An example is the intestinal mucosa, the haematopoietic cells
of bone marrow, leukocytes, erythrocytes and lymphocytes which are all incapable of de novo
synthesis (Sanderson and He, 1994) and are reliant on a supply of nucleotides via the diet
(Cosgrove, 1998).
Nucleotide Requirements of Animals
Nucleotides are naturally present in all feedstuffs (Clifford and Story, 1976) but are much
lower in concentration than mammalian milk (Mateo et al., 2004). The nucleotide concentration
in milk of mammals is species specific and the concentration of most nucleotides changes during
the lactation period (Gil and Sanchez-Medina, 1982). Feedstuffs are not typically analyzed for
nucleotide concentration and content, but the little data that there is suggests that in comparison
with colostrum and milk, there are low concentrations of individual nucleotides in feedstuffs
such as barley, soy protein concentrate, and soybean meal (Mateo and Stein, 2004). Soy protein
concentrate is prepared from defatted soybean meal by extraction of the soluble carbohydrates
and typically contain 70% CP (Berk, 1992). Low concentrations of nucleotides in feedstuffs may
Page 34
24
prove a potential problem for young animals that are recently weaned and stressed. The diet the
young animals are leaving behind is rich in nucleotides and the weaning diet contains a low
concentration of nucleotides that is insufficient to cope with potential stressors that compromise
health. Supplemental nucleotides are required in growing young animals because they are more
susceptible to disease, infection, or inflammation of the intestinal tissue (Uauy et al., 1990). It is
even more important to supplement with nucleotides due to the fact that de novo nucleotide
synthesis is absent (Savaiano and Clifford, 1981) or limited (LeLeiko et al., 1983) in the
intestine.
Feeding Nucleotides to Monogastrics
In rats and pigs, supplementation of nucleotides has improved intestinal morphology, and
reduced diarrhea (Kulkarni et al., 1986; Uauy et al., 1990). Uauy et al. (1990) evaluated the
relative need for exogenous nucleosides in the small intestine at a time of rapid growth in the
developing rat. They found that the amount of mucosal protein and mucosal DNA of the gut was
significantly affected by exogenous nucleosides; the nucleoside-fed group had 50% more protein
and 77% more DNA than those fed the nucleoside-free diet. Villi in the proximal segment of the
intestine were longer in the nucleoside-fed animals which could reflect greater amount of protein
and DNA. Larger villi allow more surface area, which can increase the small intestinal
absorption of nutrients. They found evidence showing accelerated maturation of the intestine in
response to dietary nucleosides with increases in both sucrase and maltase activity in the middle
and distal segments of the intestine. They concluded that nucleosides may be considered semi-
essential nutrients for optimal gut growth and development in the weanling rat.
Page 35
25
In piglets, Sauer et al. (2012) determined the effects of a mixture of free nucleotides
supplemented post weaning from d 20 to 39 or 40 on growth performance, immunological status,
small intestinal morphology, and bacterial numbers in digesta of jejunum and cecum in feces.
Average daily feed intake increased with the inclusion of nucleotides, whereas ADG, G:F, and
final BW did not differ between treatments. Erythrocyte volume fraction did not differ between
treatments. The nucleotide fed piglets had a greater plasma concentration of IgA than the control
piglets, although IgG and IgM concentrations did not differ between groups. No differences in
small intestine length, duodenal, jejunal and ileal villi height and crypt depth were observed
between the treatments. Also, bacterial numbers of Enterococcus spp., Clostridium, and total
bacteria were not different between the control and the nucleotide fed diet. Sauer et al. (2012)
concluded that supplementing the diet of weaning piglets with pure nucleotides resulted in an
increase in plasma IgA concentrations without altering gut morphology, bacterial numbers, and
growth performance.
Feeding Nucleotides to Ruminants
Overall, there is contrasting literature published on supplementing nucleotides to pigs and
rats. There is very little research on supplementing nucleotides to ruminants, and specifically no
research on the addition of nucleotides in receiving and growing diets of beef cattle. In two
experiments, Mashiko et al. (2009) investigated the effects of feeding a milk replacer
supplemented with uridine 5’-monophosphate (UMP) at 2 g/d on the immune status of newborn
calves. In Exp. 1, newborn Holstein bull calves were fed milk replacer with or without the UMP
supplementation from d 4 to 10 after birth. They found that IgA concentration of the ileal
mucosa was greater in the UMP group than in the control group but there was no difference in
Page 36
26
jejunal mucosa. Also, there tended to be an increase in interferon-γ concentration by peripheral
blood mononuclear cells on d 24 in the calves supplemented with UMP. In Exp. 2, treatments
were the same as Exp. 1, but calves were fed from d 4 to 56 after birth. The proliferation of
peripheral blood mononuclear cells was greater in the UMP treatment than in the control on d 14,
28, and 42. There also was an increase in interferon-γ concentration by peripheral blood
mononuclear cells on d 28 and 42 in the UMP treated group compared to the control. From these
results they concluded that dietary UMP can affect the immune response of newborn calves
because it could stimulate a humoral or mucosal immunity.
Kehoe et al. (2008) evaluated supplementation of milk replacer with nucleotides on
intestinal absorptive function and animal health in pre-weaned dairy calves. Three treatments
consisting of 23 calves each were fed milk replacer supplemented with no nucleotides, purified
nucleotides, or nucleotides from an extract of Saccharomyces cerevisiae. Average daily gain,
health scores, fecal DM, and fecal bacteria were monitored. Blood samples were analyzed for
packed cell volume, glucose, blood urea nitrogen, and creatinine. Calves were monitored for
fecal scores and fecal fluidity, and intestinal function was evaluated by measuring absorption of
orally administered xylose. Four calves per treatment were harvested to evaluate intestinal
morphology, enzyme activities, and nucleoside transporter mRNA expression. Calves that were
fed the milk replacer with nucleotides from an extract of Saccharomyces cerevisiae had
increased nucleoside transporters mRNA, numerically longer villi, and lower alkaline
phosphatase than the other two treatments. Calves that were fed the milk replacer with purified
nucleotides had the highest detrimental and lowest beneficial bacteria overall, indicating an
unfavorable intestinal environment. Growth measurements, fecal DM, fecal bacteria population,
and plasma concentrations of glucose, blood urea nitrogen, creatinine, and IgG were not different
Page 37
27
among the three treatments. They concluded that calves supplemented with nucleotides from an
extract of yeast tended to increase calf intestinal function, provide a more beneficial intestinal
environment, and improve intestinal morphology.
Nucleotide Metabolism in Ruminants
Supplementing nucleotides to ruminants is a fairly new concept, but the metabolism of
nucleotides in ruminants is an ongoing process as ruminants derive nucleotides naturally from
feedstuffs, mucosal secretions, and lysed microbial cells in the form of nucleic acids (McAllan,
1982). Variable amounts of nucleic acids are present in the most commonly used ruminant
feedstuffs ranging from 1 to 50 g/kg dietary DM (McAllan, 1982). In forages, nucleic acids
comprise 5.2 to 9.5% of the total nitrogen.
Nucleic acids (DNA or RNA) fed as plant material or as pure compounds are rapidly
hydrolyzed in the rumen. Nucleic acids are degraded into oligonucleotides (polynucleotides that
contain a small number of nucleotides) or nucleotides by nucleases, as described by (McAllan
and Smith, 1973b). Oligonucleotides are then degraded into nucleotides by nuclease enzymes.
From there, phosphate groups are cleaved by nucleoside phosphorylases to result in nucleosides
(nitrogen base + sugar). Nucleosides are broken down by glycohydrolase enzymes that cleave the
sugar off of the nitrogen base. The nitrogen base is then left for further absorption and excretion
in the urine, nucleic acid synthesis, or converted into ammonia for further amino acid synthesis
(McAllan and Smith, 1973b). When free RNA or DNA were fed to ruminating lambs, little to
none survived to the abomasum (Razzaque and Topps, 1972) and when these compounds were
introduced into the rumens of young steers they were rapidly degraded with the transient
appearance of small amounts of oligonucleotides, nucleosides and bases (McAllan and Smith,
Page 38
28
1973a). These derivatives disappeared from the rumen much more rapidly than could be
accounted for by transfer to the lower digestive tract.
Little net changes occur in the amounts of nucleic acids between the rumen and
duodenum (Ellis and Bleichner, 1969; Smith and McAllan, 1971). About 15 to 35 g/kg dietary
DM entering the duodenum are nucleic acids of which approximately 60 to 70% is RNA (Smith
and McAllan, 1971; McMeniman, 1975). About 85% of nucleic acids entering the duodenum in
young calves receiving hay and concentrate diets are of microbial origin. As far as
supplementing nucleotides, more research is needed on the effects on metabolism since these
nucleotides are not of feedstuff origin. Moreover, research is needed on the effects of nucleotides
on the immune function and growth performance of cattle, especially newly arrived receiving
and growing beef calves.
Page 39
29
Literature Cited
Baldwin, R. L. 1967. Effect of starvation and refeeding upon rumen function. 7th California
Feeders Day Rep., pp 7-12. Univ. of California, Davis.
Beauchemin, K., T. McAllister, Y. Dong, B. Farr, and K. Cheng. 1994. Effects of mastication on
digestion of whole cereal grains by cattle. J. Anim. Sci. 72: 236-246.
Beef. 2015. 2015 Feed Composition Table. Beef Magazine Vol 51. No. 7. p. 18-28.
Berk, Z. 1992. Technology of production of edible flours and protein products from soybeans.
FAO Agricultural Services Bulletin No. 97. Food and Agriculture Organization of the
United Nations. Rome, Italy.
Berry, B. A., C. R. Krehbiel, A. W. Confer, D. R. Gill, R. A. Smith, and M. Montelongo. 2004.
Effects of dietary energy and starch concentrations for newly received feedlot calves: I.
growth performance and health. J. Anim. Sci. 82: 837-844.
Blanchard, P. H. 1992. Industrial Chemistry Library, Vol. 4. Technology of corn wet milling and
associated processes. Elsevier. Amsterdam, The Netherlands.
Blasi, D. A., M. J. Brouk, J. S. Drouillard, and S. P. Montgomery. 2001. Corn gluten feed:
Composition and feeding value for beef and dairy cattle. Kansas Coop. Ext. Svc. MF-2538.
Blecha, F., S. L. Boyles, and J. G. Riley. 1984. Shipping suppresses lymphocyte blastogenic
responses in Angus and Brahman X Angus feeder calves. J. Anim. Sci. 59: 576-583.
Bothast, R. J., and M. A. Schlicher. 2005. Biotechnological processes for conversion of corn into
ethanol. Appl. Microbiol. Biotechnol. 67: 19-25.
Page 40
30
Boza, J. 1998. Nukleotide in der säuglingsernährung. Monatsschr. Kinderheilkd. 146: S39-S48.
Bredeson, D. 1983. Mechanical oil extraction. J. Am. Oil Chem. Soc. 60: 211-213.
Bridger, J. C., G. N. Woode, and A. Meyling. 1978. Isolation of coronaviruses from neonatal calf
diarrhoea in Great Britain and Denmark. Vet. Microbiol. 3: 101-113.
Buhman, M. J., L. J. Perino, M. L. Galyean, T. E. Wittum, T. H. Montgomery, and R. S.
Swingle. 2000. Association between changes in eating and drinking behaviors and
respiratory tract disease in newly arrived calves at a feedlot. Am. J. Vet. Res. 61: 1163-
1168.
Carver, J. D., and W. Allan Walker. 1995. The role of nucleotides in human nutrition. J. Nutr.
Biochem. 6: 58-72.
Clifford, A. J., and D. I. Story. 1976. Levels of purines in foods and their metabolic effects in
rats. J. Nutr. 106: 435-442.
Cole, N. A., and D. P. Hutcheson. 1990. Influence of dietary protein concentrations on
performance and nitrogen repletion in stressed calves. J. Anim. Sci. 68: 3488-3497.
Cosgrove, M. 1998. Nucleotides. Nutr. 14: 748-751.
Duff, G. C., and M. L. Galyean. 2007. BOARD-INVITED REVIEW: Recent advances in
management of highly stressed, newly received feedlot cattle. J. Anim. Sci. 85: 823-840.
Eck, T. P., S. J. Bartle, R. L. Preston, R. T. Brandt, and C. R. Richardson. 1988. Protein source
and level for incoming feedlot cattle. J. Anim. Sci. 66: 1871-1876.
Ellis, W. C., and K. L. Bleichner. 1969. Synthesis and digestion of nucleic acids in the
gastrointestinal tract of sheep. Fed. Proc. 28: 623.
Page 41
31
Erickson, G. E., T. J. Klopfenstein, and A. K. Watson. 2012. Utilization of feed coproducts from
wet or dry milling for beef cattle. In: H.P.S. Makkar, editor, Biofuel coproducts as livestock
feed-Opportunities and challenges. Food and Agriculture Organization of the United
Nations, Rome, Italy. p. 77-100.
ERS, U. 2015. Corn background. http://www.ers.usda.gov/topics/crops/corn/background.aspx
(Accessed 18 January 2016.)
Farnham, D. E., G. O. Benson, and R. B. Pearce. 2003. Corn Perspective and Culture. In: P. J.
White, and L. A. Johnson, editors, Corn: Chemistry and Technology 2nd ed. American
Association of Cereal Chemists, Inc., St. Paul, Minnesota. p. 1-33.
Fluharty, F. L., and S. C. Loerch. 1995. Effects of protein concentration and protein source on
performance of newly arrived feedlot steers. J. Anim. Sci. 73: 1585-1594.
Fluharty, F. L., S. C. Loerch, and B. A. Dehority. 1996. Effects of feed and water deprivation on
ruminal characteristics and microbial population of newly weaned and feedlot-adapted
calves. J. Anim. Sci. 74: 465-474.
Fluharty, F. L., S. C. Loerch, and B. A. Dehority. 1994. Ruminal characteristics, microbial
populations, and digestive capabilities of newly weaned, stressed calves. J. Anim. Sci. 72:
2969-2979.
Fluharty, F. 2003. Complex factors have role in feedlot receiving diets. Feedstuffs. 75: 13-16.
Galyean, M. L., S. A. Gunter, K. J. Malcolm-Callis, and D. R. Garcia. 1993. Effects of crude
protein concentration in the receiving diet on performance and health of newly received beef
calves. Clayton Livestock Res. Ctr. Prog. Rep. No. 88. N. M. Agric. Exp. Sta. Las Cruces.
Page 42
32
Galyean, M. L., and M. E. Hubbert. 1995. Effects of season, health, and management on feed
intake by beef cattle. Pages 226 – 234 in Symposium: Intake by Feedlot Cattle. F.N. Owens,
ed. Oklahoma Agric. Exp. Stn., P-942.
Galyean, M. L., L. J. Perino, and G. C. Duff. 1999. Interaction of cattle health/immunity and
nutrition. J. Anim. Sci. 77: 1120-1134.
Gil, A., E. Corral, and A. Martinez. 1986. Effects of the addition of nucleotides to an adapted
milk formula on the microbial pattern of faeces in at term newborn infants. J. Clin. Nutr.
Gastroenterol. 1: 127-132.
Gil, A., and F. Sanchez-Medina. 1982. Acid- soluble nucleotides of human milk at different
stages of lactation. J. Dairy Res. 49: 301-307.
Gil, A., and R. Uauy. 1995. Nucleotides and related compounds in human and bovine milks. In:
R. Jensen, editor, Handbook of Milk Composition. Academic Press, San Diego, CA. p. 436-
464.
Grandin, T. 1997. Assessment of stress during handling and transport. J. Anim. Sci. 75: 249-257.
Hanzlicek, G. A. 2010. Epidemiology, diagnosis, and prevention of bovine respiratory disease
complex. PhD Diss. Kansas State Univ., Manhattan.
Herold, D. 1999. Solvent-extracted germ meal for ruminants. PhD Diss. University of Nebraska,
Lincoln.
Herrera-Saldana, R., J. T. Huber, and M. H. Poore. 1990. Dry matter, crude protein, and starch
degradability of five cereal grains. J. Dairy Sci. 73: 2386-2393.
Page 43
33
Holland, R. E., S. M. Boyle, T. H. Herdt, S. D. Grimes, and R. D. Walker. 1992. Malabsorption
of vitamin A in preruminating calves infected with cryptosporidium parvum. Am. J. Vet.
Res. 53: 1947-1952.
Huntington, G. B. 1997. Starch utilization by ruminants: From basics to the bunk. J. Anim. Sci.
75: 852-867.
Hutcheson, D. P., and N. A. Cole. 1986. Management of transit-stress syndrome in cattle:
Nutritional and environmental effects. J. Anim. Sci. 62: 555-560.
Johnson, L. A., and J. B. May. 2003. Wet Milling: The Basis for Corn Biorefineries. In: P. J.
White, and L. A. Johnson, editors, Corn: Chemistry and Technology. 2nd ed. American
Association of Cereal Chemists, Inc., St. Paul, Minnesota. p. 449-494.
Kalscheur, K., A. Garcia, Rosentrater, K., and C. Wright. 2008. Ethanol coproducts for ruminant
livestock diets. Fact Sheet 947. South Dakota State University, Coop. Ext. Svc.
Karlen, D. L., D. Archer, A. J. Liska, and S. Meyer. 2012. Energy issues affecting corn/soybean
systems: Challenges for sustainable production. CAST Issue Paper No. 48. Council for
Agricultural Science and Technology, Ames, IA, USA.
Kehoe, S. I., A. J. Heinrichs, C. R. Baumrucker, and D. L. Greger. 2008. Effects of nucleotide
supplementation in milk replacer on small intestinal absorptive capacity in dairy calves. J.
Dairy Sci. 91: 2759-2770.
Kelzer, J. M., P. J. Kononoff, A. M. Gehman, L. O. Tedeschi, K. Karges, and M. L. Gibson.
2009. Effects of feeding three types of corn-milling coproducts on milk production and
ruminal fermentation of lactating Holstein cattle. J. Dairy Sci. 92: 5120-5132.
Klopfenstein, T. J., G. E. Erickson, and V. R. Bremer. 2008. BOARD-INVITED REVIEW: Use
of distillers byproducts in the beef cattle feeding industry. J. Anim. Sci. 86: 1223-1231.
Page 44
34
Kotarski, S., R. Waniska, and K. Thurn. 1992. Starch hydrolysis by the ruminal microflora. J.
Nutr. 122: 178-90.
Krehbiel, C. R., R. A. Stock, D. W. Herold, D. H. Shain, G. A. Ham, and J. E. Carulla. 1995.
Feeding wet corn gluten feed to reduce subacute acidosis in cattle. J. Anim. Sci. 73: 2931-
2939.
Kulkarni, A. D., W. C. Fanslow, F. B. Rudolph, and Van Buren C.T. 1986. Effect of dietary
nucleotides on response to bacterial infections. J. Parenteral and Enteral Nutr. 10: 169-171.
Lee, D. N., S. R. Liu, Y. T. Chen, R. C. Wang, S. Y. Lin, and C. F. Weng. 2007. Effects of diets
supplemented with organic acids and nucleotides on growth, immune responses and
digestive tract development in weaned pigs. J. Anim. Physiol. Anim. Nutr. 91: 508-518.
LeLeiko, N. S., A. D. Bronstein, B. S. Baliga, and H. N. Munro. 1983. De novo purine
nucleotide synthesis in the rat small and large intestine: Effect of dietary protein and
purines. J. Pediatr. Gastroenterol. Nutr. 2: 313-319.
Leupp, J. L. 2008. Use of corn distillers dried grains in beef cattle diets. PhD Diss. North Dakota
State Univ., Fargo.
Loe, E. R., M. L. Bauer, and G. P. Lardy. 2006. Grain source and processing in diets containing
varying concentrations of wet corn gluten feed for finishing cattle. J. Anim. Sci. 84: 986-
996.
Loerch, S. C., and F. L. Fluharty. 1999. Physiological changes and digestive capabilities of
newly received feedlot cattle. J. Anim. Sci. 77: 1113-1119.
Lofgreen, G. P. 1988. Nutrition and management of stressed beef calves. An update. The
Veterinary Clinics of North America. Food Animal Practice. 4: 509-522.
Page 45
35
Lofgreen, G. P. 1983. Nutrition and management of stressed beef calves. The Veterinary Clinics
of North America. Large Animal Practice. 5: 87-101.
Lofgreen, G. P., A. E. El Tayeb, and H. E. Kiesling. 1981. Millet and alfalfa hays alone and in
combination with high-energy diet for receiving stressed calves. J. Anim. Sci. 52: 959-968.
Lofgreen, G. P., L. H. Stinocher, and H. E. Kiesling. 1980. Effects of dietary energy, free choice
alfalfa hay and mass medication on calves subjected to marketing and shipping stresses. J.
Anim. Sci. 50: 590-596.
Loneragan, G. H., D. A. Dargatz, P. S. Morley, and M. A. Smith. 2001a. Trends in mortality
ratios among cattle in US feedlots. J. Am. Vet. Med. Assoc. 219: 1122-1127.
Loneragan, G. H., J. J. Wagner, D. H. Gould, F. B. Garry, and M. A. Thoren. 2001b. Effects of
water sulfate concentration on performance, water intake, and carcass characteristics of
feedlot steers. J. Anim. Sci. 79: 2941-2948.
Loy, D. D., and K. N. Wright. 2003. Nutritional Properties and Feeding Value of Corn and its
Byproducts. In: P. J. White, and L. A. Johnson, editors, Corn: Chemistry and Technology.
2nd ed. American Association of Cereal Chemists, Inc., St. Paul, Minnesota. p. 571-604.
Mashiko, T., S. Nagafuchi, M. Kanbe, Y. Obara, Y. Hagawa, T. Takahashi, and K. Katoh. 2009.
Effects of dietary uridine 5′-monophosphate on immune responses in newborn calves. J.
Anim. Sci. 87: 1042-1047.
Mateo, C. D., and H. H. Stein. 2004. Nucleotides and young animal health: Can we enhance
intestinal tract development and immune function? In: T.P. Lyons and J.K. Jacques, editors,
Nutritional Biotechnology in the Feed and Food Industries. Proc. of Alltech’s 20th Annual
Symp., Lexington, KY. p. 159-168.
Page 46
36
Mateo, C., D. Peters, and H. Stein. 2004. Nucleotides in sow colostrum and milk at different
stages of lactation. J. Anim. Sci. 82: 1339-1342.
McAllan, A. B., and R. H. Smith. 1973a. Degradation of nucleic acid derivatives by rumen
bacteria in vitro. Br. J. Nutr. 29: 467.
McAllan, A. B., and R. H. Smith. 1973b. Degradation of nucleic acids in the rumen. Br. J. Nutr.
29: 331.
McAllan, A. B. 1982. The fate of nucleic acids in ruminants. Proc. Nutr. Soc. 41: 309-316.
McClurkin, A. W., E. T. Littledike, R. C. Cutlip, G. H. Frank, M. F. Coria, and S. R. Bolin.
1984. Production of cattle immunotolerant to bovine viral diarrhea virus. Canadian Journal
of Comparative Medicine: Revue Canadienne De Médecine Comparée. 48: 156-161.
McMeniman, N. P. 1975. Aspects of nitrogen digestion in the ruminant. PhD Diss. University of
Newcastle, Newcastle upon Tyne.
Miller, W. F., E. C. Titgemeyer, M. V. Scheffel, R. T. Ethington, J. E. Shirley, and M. J. Brouk.
2010. Comparative value of full-fat corn germ, whole cottonseed and tallow as energy
sources for lactating dairy cows. Dairy Day, Kansas State Univ. Coop. Ext. Svc. 898. p. 60-
65.
Murthy, G., V. Singh, D. Johnston, K. Rausch, and M. Tumbleson. 2006. Evaluation and
strategies to improve fermentation characteristics of modified dry-grind corn processes.
Cereal Chem. 83: 455-459.
Nissen, S., G. Kuhlman, M. VanKoevering, & G. Link. 1989. Effect of protein intake on immune
function and growth of stressed calves. J. Dairy. Sci. 72(Suppl.1): 24-25. (Abstr.)
Page 47
37
NRC. 2000. Nutrient requirements of beef cattle. 7th ed. Washington, DC, National Academy
Press.
Owens, F. N., D. S. Secrist, W. J. Hill, and D. R. Gill. 1997. The effect of grain source and grain
processing on performance of feedlot cattle: A review. J. Anim. Sci. 75: 868-879.
Pandher, K., A. W. Confer, and G. L. Murphy. 1998. Genetic and immunologic analyses of PlpE,
a lipoprotein important in complement-mediated killing of pasteurella haemolytica serotype
1. Infect. Immun. 66: 5613-5619.
Peel, D. S. 2003. Beef cattle growing and backgrounding programs. Veterinary Clinics of North
America: Food Animal Practice. 19: 365-385.
Plummer, P. J., B. W. Rohrbach, R. A. Daugherty, R. A. Daugherty, K. V. Thomas, R. P.
Wilkes, F. E. Duggan, and M. A. Kennedy. 2004. Effect of intranasal vaccination against
bovine enteric coronavirus on the occurrence of respiratory tract disease in a commercial
backgrounding feedlot. J. Am. Vet. Med. Assoc. 225: 726-731.
Razzaque, M. A., and J. H. Topps. 1972. Utilisation of dietary nucleic acids by sheep. Proc.
Nutr. Soc. 31: 105A
RFA. 2015. 2015 Ethanol Industry Outlook. http://www.ethanolrfa.org/ (Accessed 5 February
2016.)
Rivera, J. D., J. T. Richeson, M. L. Galyean, M. Rounds, & P. Schlegel. 2004. Effects of an
artificial sweetener (sucram C-150) on performance and health of newly received beef
cattle. J. Anim. Sci. 82 (Suppl.1): 350. (Abstr.)
Rivera, J. D., M. L. Galyean, and W. T. Nichols. 2005. Review: Dietary roughage concentration
and health of newly received cattle. Prof. Anim. Sci. 21: 345-351.
Page 48
38
Saif, L. J., D. R. Redman, P. D. Moorhead, and K. W. Theil. 1986. Experimentally induced
coronavirus infections in calves: Viral replication in the respiratory and intestinal tracts.
Am. J. Vet. Res. 47: 1426-1432.
Sanderson, I. R., and Y. He. 1994. Nucleotide uptake and metabolism by intestinal epithelial
cells. In: Symposium: Nucleotides and nutrition. J. Nutr. 124: 131S-137S.
Sauer, N., M. Eklund, E. Bauer, M. G. Gänzle, C. J. Field, R. T. Zijlstra, and R. Mosenthin.
2012. The effects of pure nucleotides on performance, humoral immunity, gut structure and
numbers of intestinal bacteria of newly weaned pigs. J. Anim. Sci. 90: 3126-3134.
Savaiano, D. A., and A. J. Clifford. 1981. Adenine, the precursor of nucleic acids in intestinal
cells unable to synthesize purines de novo. J. Nutr. 111: 1816-1822.
Schneider, M., R. Tait, W. Busby, and J. Reecy. 2009. An evaluation of bovine respiratory
disease complex in feedlot cattle: Impact on performance and carcass traits using treatment
records and lung lesion scores. J. Anim. Sci. 87: 1821-1827.
Scott, T., C. Milton, G. Erickson, T. Klopfenstein, and R. Stock. 2003. Corn processing method
in finishing diets containing wet corn gluten feed. J. Anim. Sci. 81: 3182-3190.
Siverson, A. V., E. C. Titgemeyer, S. P. Montgomery, B. E. Oleen, G. W. Preedy, and D. A.
Blasi. 2014. Effects of corn processing and dietary wet corn gluten feed inclusion on
performance and digestion of newly received growing cattle. J. Anim. Sci. 92: 1604-1612.
Smith, R. H., and A. B. McAllan. 1971. Nucleic acid metabolism in the ruminant. Br. J. Nutr.
25(1): 181-190.
Stock, R. A., J. M. Lewis, T. J. Klopfenstein, and C. T. Milton. 2000. Review of new
information on the use of wet and dry milling feed byproducts in feedlot diets. J. Anim. Sci.
78 (E-suppl.).
Page 49
39
Stookey, J. M., K. S. Schwartzkopf-Genswein, C. S. Waltz, & J. M. Watts. 1997. Effects of
remote and contact weaning on behaviour and weight gain of beef calves. J. Anim. Sci.
75(Suppl. 1): 157. (Abstr.)
Sulpizio, M. J., T. J. Kessen, E. R. Loe, S. P. Montgomery, J. N. Pike, J. J. Sindt, R. T.
Ethington, and J. S. Drouillard. 2010. Comparison of dried full-fat corn germ and tallow in
finishing feedlot diets for heifers. Cattlemen’s Day, Kansas State Univ. Res. Ext. Rep. Prog.
908. p. 185-187.
Uauy, R. 1989. Dietary Nucleotides and Requirements in Early Life. In: F. Lebenthal, editor,
Textbook of Gastroenterology and Nutrition in Infancy. 2nd ed. Raven Press, Ltd., New
York.
Uauy, R., G. Stringel, R. Thomas, and R. Quan. 1990. Effect of dietary nucleosides on growth
and maturation of the developing gut in the rat. J. Pediatr. Gastroenterol. Nutr. 10: 497-503.
Vasconcelos, J. T., and M. L. Galyean. 2007. Nutritional recommendations of feedlot consulting
nutritionists: the 2007 Texas Tech University survey. J. Anim. Sci. 85: 2772-2781.
Veira, D. M., G. K. Macleod, J. H. Burton, and J. B. Stone. 1980. Nutrition of the weaned
Holstein calf. II. Effect of dietary protein level on nitrogen balance, digestibility, and feed
intake. J. Anim. Sci. 50:945-951.
Watson, S. A. 1988. Corn Marketing, Processing, and Utilization. In: G. F. Sprague, and J. W.
Dudley, editors, Corn and Corn Improvement. 3rd ed. American Society of Agronomy, Inc.,
Crop Science Society of America, Inc., Soil Science Society of America, Inc., Madison,
Wisconsin. p. 881-940.
Zinn, R. A. 1993. Influence of processing on the comparative feeding value of barley for feedlot
cattle. J. Anim. Sci. 71: 3-10.
Page 50
40
Chapter 2 - Effects of feeding nucleotides with corn germ meal or
dried corn distillers grains on receiving and growing calves
Introduction
To improve profitability for newly arrived stressed cattle, it is essential to minimize feed
costs and health issues while optimizing growth performance. During the receiving and growing
phase, calves typically are recently weaned and experience various physical and psychological
stressors which can create health issues and depress feed intake (Galyean and Hubbert, 1995).
Selecting ingredients low in cost while providing adequate nutrients is especially important
during this phase. Byproducts are commonly used in growing and receiving diets because of
availability, nutrient value, and cost (Leupp, 2008). Corn germ meal (CGM) is a byproduct
manufactured by the corn wet milling industry, has medium protein and energy content, and is
often used in swine and poultry diets (Blanchard, 1992). Very little information exists on the
feeding value of CGM (solvent extracted) for beef cattle.
Feeding nucleotides (NA), a natural, immune boosting feed additive, may improve the
gastrointestinal health of an animal. NA are subunits of nucleic acids such as DNA or RNA that
are composed of a phosphate group, a five-carbon sugar, and a nitrogenous base. NA are
naturally found in all feedstuffs (Clifford and Story, 1976), but most feedstuffs contain a lower
concentration than milk (Mateo et al., 2004). Supplemental nucleotides are required in growing
young animals because they are susceptible to disease, infection, or inflammation of the
intestinal tissue (Uauy et al., 1990). Overall, there is contrasting literature published on
supplementing nucleotides to pigs and rats (Uauy et al., 1990; Sauer et al., 2012). There is very
little research on supplementing nucleotides to ruminants (Kehoe et al., 2008; Mashiko et al.,
Page 51
41
2009), and specifically there is no research on the addition of nucleotides to receiving and
growing diets for beef cattle.
The objectives of these experiments were to determine: 1) the effects of CGM in
comparison to dried corn distillers grains (DDG) on growth performance, digestibility, and in
vitro gas production, and 2) the effects of NA on growth performance, digestibility, gas
production, and mucosal immunity, of receiving and growing cattle.
Materials and Methods
Animal care practices were approved by the Kansas State University Institutional Animal
Care and Use Committee protocols 3299.8 and 3574.
Experiment 1. Receiving and Growing Cattle Performance Study I
Two hundred thirteen crossbred heifers (BW= 262 ± 67.4 kg) were shipped from three
separate sources (Searcy, AR; Snook, TX; and Melbourne, AR) to the Kansas State University
Beef Stocker Unit over a 5-d period from June 15 to June 19, 2015. The heifers were used in a
complete block design with a 3 x 2 factorial arrangement of treatments to determine the energy
value of corn germ meal (CGM) in comparison to dried corn distillers grains (DDG) and the
effect of adding a nucleotide (NA) (PSB Complex; DSS Global, Chicago, IL) at three inclusion
levels (0, 2 and 4 g/d). Calves were blocked by source (n = 3), stratified by arrival weight within
each block, and assembled into pens containing 11 or 12 heifers. Pens were randomly assigned
one of the six treatments, which allowed three pens per treatment with a total of 18 pens filled
for the experiment. Each of the 18 pens was of equal size (9.1 x 15.2 m) and soil surfaced with a
concrete fenceline bunk (9.1 m) that was attached to a 3.6-m concrete apron.
Page 52
42
The six treatment diets were: 1) CGM with no NA (CGM0), 2) CGM with 2 g/heifer
daily NA (CGM2), 3) CGM with 4 g/heifer daily NA (CGM4), 4) DDG with no NA (DDG0), 5)
DDG with 2 g/heifer daily NA (DDG2), and 6) DDG with 4 g/heifer daily NA (DDG4) (Table
2.1). Diets within CGM or DDG were formulated to include the same amount of each ingredient
with the exception of the NA. There were three different NA supplements mixed and pelleted,
and they were formulated to provide 0, 2 or 4 g NA/heifer daily when DMI was 8.2 kg/d. At this
inclusion level, the NA treatments provide 0, 0.242, and 0.489 g NA/kg dietary DM. Diets were
formulated to be isocaloric and isonitrogenous. As a result, CGM and DDG diets included
different amounts of specific ingredients where CGM diets had larger inclusions of prairie hay,
and DDG diets had larger inclusions of cracked corn and alfalfa hay.
At the time of arrival, calves were weighed individually, and ear tagged with an
individual identification number. Calves were held in six pens overnight with free choice access
to prairie hay and water. The day after arrival (d 0), heifers were weighed, tagged with a pen
number, and vaccinated for respiratory and clostridial diseases. For protection against clostridial
bacteria, Vision 7 Somnus with Spur (7-way clostridial modified-live vaccine; Merck Animal
Health, Madison, NJ) was used, and Pyramid 5 (Boehringer Ingelheim, St. Joseph, MO) a
modified-live vaccine for protection against infectious bovine rhinotracheitis (IBR), bovine viral
diarrhea (BVD), parainfluenza 3 (PI3), and bovine respiratory syncytial virus (BRSV) was
administered. Calves were dewormed with 5 mL 1% ivermectin wt/vol and 10% wt/vol clorsulon
(Ivomec Plus; Merial Animal Health, Duluth, GA) and given a subcutaneous injection of 1.5 mL
of Excede (200 mg ceftiofur equivalents (CE) per mL; Zoetis, Florham Park, NJ) for protection
against bovine respiratory pathogens Mannheimia haemolytica, Pasteurella multocida, and
Histophilus somni. On d 14, cattle were revaccinated with Bovi-Shield Gold 5 (Zoetis, Florham
Page 53
43
Park, NJ), a modified-live virus vaccine with strains of IBR, BVD, PI3, and BRSV. To combat
bovine respiratory disease (BRD), 4.5 mg/kg BW daily of Aureomycin (22.7 g chlortetracycline
hydrochloride/kg; Zoetis, Florham Park, NJ) was added to all diets for five consecutive days, two
times during the trial; d 31 to 35 and d 51 to 55. Heifers were individually weighed on d 0
(initiation of study), 28, 56, 84 and 85 (completion of trial).
Calves were fed once daily using a Roto-Mix (Model 414-14B, Dodge City, Kansas)
wagon at approximately 0730 h. The amount of feed delivered and the amount that disappeared
from each pen was recorded daily. The disappearance of diets from each bunk was measured
daily by weighing the feed delivered to each bunk and subtracting the refusals left the next
morning. Refusals were measured at approximately 0600 h to calculate dry matter intake (DMI)
and to determine the amount to be fed that day. Feed samples of each diet were collected weekly
from each bunk and stored frozen (-20˚C) for later analysis. Feed samples were dried in a 55˚C
oven, air equilibrated, and ground through a 1-mm screen using a Wiley mill. Ground feed
samples were composited by period and shipped to a commercial lab (SDK Laboratories,
Hutchinson, KS) for analysis of DM (105˚C), N (AOAC, 1997), NDF and ADF (Van Soest et al.,
1991), Ca (Bower and Rains, 1988), P (AOAC, 1997), starch (Richards et al., 1995), ash
(Undersander, 1993), and fat content (Sukhija and Palmquist, 1988) (Table 2.2).
Health of heifers was evaluated daily and any heifers that appeared to have signs of
sickness or bloat were removed from their pen. Once restrained in a chute, rectal temperature
was measured. Treatment was based on rectal temperature and number of previous treatments.
Treatments for calves with temperature of < 40.6˚C were: first treatment, 19.8 mg/kg BW
Biomycin (200 mg/mL oxytetracycline; Boehringer Ingelheim, St. Joseph, MO), second
treatment, 40 mg/kg BW and 2.2 mg/kg BW Resflor Gold (30 mg/mL florfenicol and 16.5
Page 54
44
mg/mL flunixin; Merck Animal Health, Madison, NJ), third treatment, 2.5 mg/kg BW Draxxin
(100 mg/mL tulathromycin; Zoetis, Florham Park, NJ), and fourth treatment, 1.1 to 2.2 mg/kg
BW Excenel (50 mg/mL ceftiofur hydrochloride; Zoetis, Florham Park, NJ). Treatment for
calves with temperature > 40.6˚C were: first treatment, 40 mg/kg BW and 2.2 mg/kg BW Resflor
Gold (30 mg/mL florfenicol and 16.5 mg/mL flunixin; Merck Animal Health, Madison, NJ),
second treatment, 2.5 mg/kg BW Draxxin (100 mg/mL tulathromycin; Zoetis, Florham Park,
NJ), third treatment, 1.1 to 2.2 mg/kg BW Excenel (50 mg/mL ceftiofur hydrochloride; Zoetis,
Florham Park, NJ), and fourth treatment, 19.8 mg/kg BW Noromycin 300 LA (300 mg/mL
oxytetracycline; Norbrook Inc., Lenexa, KS). Following treatment heifers were returned to their
pen.
Experiment 2. Receiving and Growing Cattle Performance Study II
Three hundred Brahman x Hereford crossbred heifers (BW= 268 ± 34.1 kg) were shipped
from one source in Council Grove, KS to the Kansas State University Beef Stocker Unit on
January 6, 2016. Calves had been purchased via online live auctions from Huntsville, TX and
shipped to a backgrounding lot in Council Grove, KS on December 8, 2015. On December 19,
2015 heifers were vaccinated with Express 5 (Boehringer Ingelheim, St. Joseph, MO), a
modified live virus vaccine with strains of IBR, BVD, PI3, and BRSV. For protection against
clostridial bacteria, Vision 7 Somnus with Spur (7-way clostridial modified-live vaccine; Merck
Animal Health, Madison, NJ) was used, and for protection against respiratory pathogens,
Mannheimia haemolytica, Pasteurella multocida, and Histophilus somni, Super Poly-Bac (Texas
Vet Lab Inc., San Angelo, TX) was administered. Calves were dewormed with 0.5 mg/kg BW
Cydectin (5 mg/mL moxidectin; Boehringer Ingelheim, St. Joseph, MO), given Fusogard
Page 55
45
(Elanco, Indianapolis, IN) a foot rot vaccine for protection against Fusobacterium necrophorum,
and implanted with SolidBac (Zoetis, Florham Park, NJ) for aid against pink eye.
Upon arrival at the Kansas State University Beef Stocker Unit, heifers were immediately
weighed, and each was tagged with an individual identification number. Calves were held in 24
pens and fed a common diet until January 13, 2016. In this experiment, heifers were used in a
complete block design to evaluate the effects of NA (PSB Complex; DSS Global, Chicago, IL)
in three inclusion levels (0, 2, and 4 g/heifer daily) on growth performance and mucosal
immunity. Calves were allotted to 10 blocks of 30 heifers, stratified to pens by arrival weight
within each block, and assembled into pens containing 10 heifers. Pens were randomly assigned
to one of three treatments, which allowed 10 pens per treatment with a total of 30 pens used for
the experiment. During the duration of the study, it was observed that 6 of the 30 pens were not
performing to their potential due to the fact that they were in newly constructed pens. It was then
decided, for the growth performance objective, to only include 24 of the 30 pens in the statistical
analysis. Therefore, only 24 pens (n = 8) of 10 heifers per pen, and 8 pens per treatment were
used in the growth statistical analysis of growth performance in this study. The three treatment
diets were DDG0, DDG2, and DDG4 from Exp. 1, and the diets and NA inclusions were
formulated to be identical to Exp. 1 (Table 2.1). On January 13, 2016 (d 0) calves were weighed,
tagged with a pen number, and revaccinated with Pyramid 5 (Boehringer Ingelheim, St. Joseph,
MO), a modified live virus vaccine with strains of IBR, BVD, PI3, and BRSV. Heifers were
weighed on d 0 (initiation of study), 28, 56, and 57 (completion of trial).
Calves were fed once daily using a Roto-Mix feed wagon (Model 414-14B, Dodge City,
KS) at approximately 0730 h. The amount of feed delivered and the amount that disappeared
from each pen was recorded daily. The disappearance of diets from each bunk was measured
Page 56
46
daily by weighing the feed delivered to each bunk and subtracting the refusals left the next
morning. Refusals were measured at approximately 0700 h to calculate DMI and to determine
the amount to be fed that day. Feed samples of each diet were collected weekly from each bunk
and stored frozen (-20˚C) for later analysis. Feed samples were dried in a 55˚C oven, air
equilibrated, and ground through a 1-mm screen using a Wiley mill. Ground feed samples were
composited by period and shipped to a commercial lab (SDK Laboratories, Hutchinson, KS) for
analysis of DM, CP, NDF, ADF, Ca, P, starch, ash, and fat content as described in Exp. 1 (Table
2.2). Fecal samples were collected from the rectum on d 28 as they came through the chute/scale
to be weighed and were frozen at -20˚C for further analysis of IgA concentration. Samples were
thawed and analyzed for total IgA by ELISA (sIgA ELISA analysis, Bethyl Laboratories,
Montgomery, TX).
Health of heifers was monitored daily and any heifers that appeared to have signs of
sickness or bloat were treated and treatment protocols followed that of Exp. 1 and once
appropriate treatment was determined calves were treated and returned to their pen.
Experiment 3. Digestibility Study
Four ruminally cannulated Holstein heifers were used in a 4 x 4 Latin square design in an
experiment to evaluate diet digestibility and ruminal parameters. Treatment periods consisted of
four consecutive 15-d periods; each period included 10 d of treatment adaptation, 4 d of fecal
collection, and 1 d for sampling of rumen fluid. The four treatments were: 1) CGM0, 2) CGM0
with 3 g/heifer daily NA top-dressed to the diet, 3) DDG0, and 4) DDG with 3 g/heifer daily NA
top-dressed to the diet. The CGM and DDG diets were the same as Exp. 1. Heifers were housed
in individual stalls (3.7 x 3.7 m) with 2 cm thick rubber mats surfaced with 0.75 m3 pine
Page 57
47
shavings inside a temperature-controlled barn (10 to 21˚C). Heifers were allowed free movement
in individual stalls and only restrained during sample collection. Before feeding, heifers were
moved to a larger pen and allowed approximately 1 h of exercise while feed pans and stalls were
cleaned, and feed was distributed.
Heifers were fed once daily at 0800 h. Heifers were provided feed in amounts allowing
for ad libitum intake and amounts of feed provided were designed to allow for at least 10% feed
refusals. Feed samples were collected on d 10 through 14 and composited for each heifer for
each period. Feed refusals were collected at approximately 0700 h on d 11 through 15 and
composited for each heifer for each period. Ingredient samples of each diet were collected on d
10 through 14 and were composited for each period. Feed samples, refusals, and ingredients
were dried at 55˚C, air equilibrated and ground through a 1-mm screen using a Wiley mill. Feed
samples, refusals, and ingredients were shipped to a commercial lab (SDK Laboratories,
Hutchinson, KS) for analysis of DM, CP, NDF, ADF, Ca, P, starch, ash, and fat content as
described for Exp. 1. Chromic oxide (10 g/d) was top dressed and mixed by hand into each diet
for each heifer on d 4 through 14. On d 11 through 14, fecal samples were collected from the
rectum 3 times daily (every 8 h) with fecal sampling beginning 2 h later than the previous day so
that samples represented each 2-h interval after feeding. Fecal samples were stored and frozen (-
20˚C) for later analysis. Fecal samples were thawed, dried at 55˚C, air equilibrated, and ground
through a 1-mm screen using a Wiley mill. Fecal samples were composited within each period
for each heifer and shipped to a commercial lab (SDK Laboratories, Hutchinson, KS) for
analysis of DM, CP, NDF, ADF, Ca, P, starch, ash, and fat content as described for Exp. 1. The
Cr concentrations in feed refusals and fecal samples were analyzed by atomic absorption
spectrophotometry (Williams et al., 1962).
Page 58
48
On d 15 of each period, rumen fluid samples were collected at 0, 2, 4, 6, 8, 12, 18, and 24
h after feeding. Subsequent to the 0 h sampling, Co-EDTA (0.4 g Co) dissolved in 200 mL of
water, was mixed into the rumen (Udén et al., 1980). Rumen samples were immediately analyzed
for pH with a portable pH meter (Orion, Beverly, MA) then strained through 8 layers of
cheesecloth. Once strained, rumen fluid was pipetted into 2-mL micro-centrifuge tubes
containing 0.25 mL of m-phosphoric acid and were frozen at -20˚C for later analysis of ammonia
(Broderick and Kang, 1980), lactate (Barker and Summerson, 1941), and VFA. In addition, 20
mL of fluid was collected and frozen at -20˚C for Co analysis to determine ruminal liquid
dilution rate. Liquid passage rates were calculated from ruminal cobalt concentrations at 2 to 18
h after dosing of Co-EDTA. Passage rate was calculated using the nonlinear procedure of SAS
(SAS Inst., Inc., Cary, NC) by regressing the natural logarithm of Co concentration against time
for each heifer within each period.
Experiment 4. In Vitro Study: Gas Production
To determine the effect of a NA (PSB Complex; DSS Global, Chicago, IL) with either
CGM or DDG on gas production, a randomized complete block design with a 3 x 2 factorial
arrangement of treatments was used. The experiment had four replicates and the six treatments 1)
CGM with no NA (CGM0), 2) CGM with 2 g/heifer daily NA (CGM2), 3) CGM with 4 g/heifer
daily NA (CGM4), 4) DDG with no NA (DDG0), 5) DDG with 2 g/heifer daily NA (DDG2),
and 6) DDG with 4 g/heifer daily NA (DDG4). Ruminal digesta was obtained from two of the
four ruminally cannulated Holstein heifers from Exp. 3 where one was fed CGM0 and one was
fed DDG0. Ruminal contents were acquired at approximately 0730 h, prior to feeding and
strained through four layers of cheese cloth into pre-warmed insulated thermoses. From there,
Page 59
49
the thermoses were transported to the Kansas State University Pre-Harvest Food Safety
Laboratory.
In the laboratory, ruminal fluid was decanted into separatory funnels, gassed with
nitrogen for several minutes, and incubated at 39˚C for approximately 1 h to allow fluid to
stratify. The bottom sediment layer was discarded and the bacteria rich layer was kept for use as
inoculum. Batch cultures were prepared in 250 mL screw-top bottles and filled with 100 mL
buffer solution, 50 mL ruminal fluid, and 2.0 g of substrate. The buffer solution was prepared as
described by McDougall (1948) for synthetic saliva. The substrate was one of the six treatments
and was prepared by taking a representative sample of DDG0 and CGM0 diets from Exp. 1 and
2. The feed sample was then dried at 55˚C, air equilibrated and ground through a 1-mm screen
using a Wiley mill. From there, NA was added in each of the two diets at three different doses (0,
2 or 4 g). For each treatment, NA was added at 0 g per 2 g of substrate, 0.000488 g per 2 g of
substrate, and 0.000978 g per 2 g of substrate. The rumen inoculum used for each treatment
correlated with the substrate being fermented. For example, the heifer fed DDG0 provided the
inoculum for treatments DDG0, DDG2, and DDG4. In each replication, there was one bottle
used as a blank that contained only buffer and rumen inoculum. Initial pH was measured using a
benchtop pH meter (Thermo Orion model 230 A; Thermo Fisher Scientific Inc., Waltham, MA)
after combining of contents. After measuring pH, culture bottles were gassed with nitrogen,
capped with AnkomRF1 modules (AnkomRF Gas Production System; Ankom Technology,
Macedon, NY), and placed into a shaking incubator (New Brunswick Scientific Co., Inc., New
Brunswick, NJ) for 24 h. The incubator maintained a 39˚C temperature with gentle agitation. Gas
pressure was recorded at 15 min intervals. After 24 h, bottles were removed from the shaking
incubator and final pH was measured.
Page 60
50
This experiment was repeated to increase power. All procedures followed the above
description, except the rumen inoculum was derived from the remaining two ruminally
cannulated Holstein heifers.
Statistical Analyses
Exp. 1 data were analyzed in SAS (SAS Inst., Inc., Cary, NC) using the MIXED
procedure with byproduct, NA, byproduct x NA as fixed effects and block as a random effect.
Initial body weight was used as a fixed covariate. Contrast statements were used to assess the
overall effect as well as the linear and quadratic effects. Generalized quadratic solutions were
used to determine dietary NEm and NEg values based on DM intake and cattle growth
performance using the NRC (1996) equations for each pen of cattle during the 84-d feeding
period.
Data for Exp. 2 were analyzed in SAS using the MIXED procedure with NA as a fixed
effect and block as a random effect. Initial body weight was used as a fixed covariate. Contrast
statements were used to assess the overall effect as well as linear and quadratic effects of
treatment.
The pooled analysis of Exp. 1 and 2 were analyzed in SAS using the MIXED procedure
with NA as a fixed effect. Initial body weight was used as a fixed covariate. A blocking variable
was created that combined experiment and block together. Contrast statements were used to
assess the overall effect of treatment as well as the linear and quadratic effects of treatment. Only
data from d 0 to 56 were used for Exp. 1 to coincide with data from Exp. 2.
For Exp. 3, data were analyzed as a Latin square with a factorial arrangement of
treatments using the MIXED procedure in SAS. Fixed effects included byproduct (CGM or
Page 61
51
DDG), NA, NA x byproduct, and period. Heifer was a random effect. Treatment means were
calculated using the LSMEANS option. Ruminal fermentation parameters were analyzed as
repeated measures with the model containing byproduct, NA, NA x byproduct, sampling time,
time x NA, time x byproduct, time x byproduct x NA, and period. Heifer was included as a
random term. The repeated term was time, and heifer x period served as the subject; the
covariance structure was spatial power.
Exp. 4 gas production data were analyzed using the MIXED procedure of SAS. Fixed
effects included byproduct, NA, byproduct x NA, time, byproduct x time, NA x time, and
byproduct x NA x time. Block was used as a random effect. Contrast statements were used to
assess the overall effect as well as the linear and quadratic effects of treatment.
Results and Discussion
Experiment 1
Low morbidity was observed in this study with a total of twelve heifers treated for illness
(Table 2.4). Five calves were treated for pinkeye, one for foot rot, one for bloat, and the
remaining five for bovine respiratory disease. Only two out of the five heifers that were treated
for bovine respiratory disease were treated more than once. Three heifers were removed from
this study due to death; two animals died of bacterial infections, and one of chronic bovine
respiratory disease (Table 2.5). All data from the three animals were removed from this study.
There were no significant effects of the type of byproduct, either CGM or DDG, on dry
matter intake from d 0 to 28 (P = 0.76), d 28 to 56 (P = 0.96), d 56 to 84 (P = 0.19), and for the
complete feeding period, d 0 to 84 (P = 0.55) (Table 2.3). No difference in DMI was observed
Page 62
52
when lactating Holstein cows were fed corn-milling coproducts, comparing dried corn distillers
grains plus solubles, dehydrated corn germ meal, and high protein dried distiller grains (Kelzer et
al., 2009). Although full fat germ meal was used in the Kelzer et al. (2009) study, this
information is still useful. For the entire 84 d feeding period, the calves averaged an intake of
9.16 kg dry matter per day across all treatments. Average daily gain was also not significantly
different between CGM and DDG treatments. On d 0 to 28, d 28 to 56, d 56 to 84, d 0 to 84,
heifers respectively averaged 1.42 kg ADG (P = 0.57), 1.22 kg ADG (P = 0.65), 0.64 kg ADG
(P = 0.83), 1.11 kg ADG (P = 0.88). Similar to DMI and ADG, feed efficiency was not
significant due to the two different byproducts; calves that were fed CGM were just as efficient
as the calves fed DDG (P ≥ 0.34). Kelzer et al. (2009) found that milk production response to an
inclusion of corn germ meal, dried distillers grains plus solubles, and high protein dried distillers
grains was not different. Growth performance is different from milk production, as is the fat
level in this study’s corn germ meal, but, it is still useful information that can be translated to our
experiment.
One of the objectives of this experiment was to determine the NEm and NEg of CGM in
comparison to DDG because of the lack of literature found on quantifying the energy value of
CGM. Our hypothesis was that CGM would be similar to DDG in energy content, and with the
performance results of this study and the calculated NEm and NEg, it proved correct. There was
no significant effect of CGM or DDG on NEm (P = 0.25) or NEg (P = 0.31). This proves that
when corn germ meal is included in a diet at 24.5% on DM basis offers the same NEm and NEg
values as a diet with 22.0% dried corn distillers grains on DM basis when both diets are
formulated to be isocaloric and isonitrogenous.
Page 63
53
No linear effect (P ≥ 0.58) or quadratic effect (P ≥ 0.28) of a nucleotide additive fed at
rates of 0, 2, or 4 g/ heifer daily were observed on dry matter intake. Likewise, there was no
linear effect (P ≥ 0.15) or quadratic effect (P ≥ 0.70) of NA on ADG. Feed efficiency also was
not different across NA treatments (P ≥ 0.15). These findings are similar to that of Kehoe et al.
(2008), where they supplemented nucleotides in milk replacer to preweaned dairy calves. All
growth measurements were similar for calves that were not supplemented with nucleotides,
supplemented with purified nucleotides, and supplemented with nucleotides from an extract of
Saccharomyces cerevisiae (Kehoe et al., 2008). Over the entire 6-wk period and post-weaning,
feed intake was not different between treatments (Kehoe et al., 2008).
Experiment 2
No morbidity and mortality was observed in this study for the entire 56-d feeding period.
Intake of dry matter was not different across treatments (Table 2.6). Average DMI for d 0 to 28,
d 28 to 56, and d 0 to 56 was 8.59 kg/d (P ≥ 0.46), 8.77 kg/d (P ≥ 0.44), and 8.68 kg/d (P ≥ 0.43)
respectively. Average daily gain of these heifers was also not different across three different
treatments. Over the entire feeding period, from d 0 to 56, calves gained on average 0.98 kg per
day (P ≥ 0.23). The nonsignificant effects of NA on DMI and ADG translates to the
nonsignificant effects on feed efficiency in this experiment (P ≥ 0.26). The results of this
experiment are in agreement with Exp. 1 in that there were no significant differences of feeding a
nucleotide additive to receiving calves on performance.
On d 28 of this experiment, approximately 5 random fecal samples were taken from each
pen to determine if feeding NA would alter total IgA concentration. Fecal IgA concentration was
not different among treatments with the treatment DDG0 having a IgA concentration of 847
Page 64
54
ng/mL, DDG2 with 625 ng/mL, and DDG4 with 718 ng/mL (P ≥ 0.15) (Figure 2.1). Although
there was no difference in IgA concentration in fecal samples across the three treatments, there
did tend to be a quadratic dose effect (P = 0.11) with DDG2 having the lowest fecal IgA
concentration. NA did not provide a linear dose effect across treatments (P = 0.24). Dietary
nucleotides have been reported to have many biological activities in the digestive system,
including the growth and development of the small intestine as well as the intestinal repair after
chronic diarrhea (Bueno et al., 1994). Overall, very little literature is available on the effects of
feeding nucleotides on mucosal immunity. Immunoglobulin A plays important roles in mucosal
immunity by preventing pathogenic microbes from adhering to the mucosal epithelium and by
neutralizing toxins and viruses (Mashiko et al., 2009). Secreted IgA are therefore critical for
maintaining a stable gut microbiota (Suzuki et al., 2004). Our experiment, though much
different, differed in results with that of Mashiko et al. (2009). They investigated the effects of
feeding a milk replacer supplemented with uridine 5’ –monophosphate (UMP) at 2 g per day on
the immune status of newborn calves. They found that IgA concentration of the ileal mucosa was
greater in the UMP group than in the control group, but no difference in jejunal mucosa.
Nagafuchi et al. (2000) observed that fecal IgA levels significantly increased in mice that were
fed a nucleotide-supplemented diet than those fed a nucleotide free diet. More research is
warranted on the effects of feeding NA to animals, and even more specifically, receiving and
growing cattle.
Experiment 1 & 2 pooled analysis
Pooled effects of the addition of a nucleotide feed additive on gain, intake, and
efficiency of Exp. 1 and 2 are listed in Table 2.7. No effects of the addition of NA were
Page 65
55
observed on DMI throughout this analysis. Heifers in both Exp. 1 and 2 averaged a DM intake of
8.65 kg/d for the 56 d feeding period (P = 0.72). Therefore, there were no linear (P = 0.58) or
quadratic effects (P = 0.57) of NA on DM intake. ADG was also not affected by the NA (P ≥
0.40), and thus there were no linear (P ≥ 0.64) or quadratic effects (P ≥ 0.20) of treatment.
Experiment 3
Diet composition, intake, and nutrient digestibility of the diets fed in Exp. 3 are listed in
Table 2.8. DM intake was not affected by the type of corn byproduct included in the diet, CGM
and DDG (P ≥ 0.46), or NA (P ≥ 0.40) and averaged across treatments was 10.04 ± 0.46 kg. The
DM intake results from the digestibility experiment agrees with the fact that there were no DM
intake differences in Exp. 1 and 2. Likewise, starch, non-starch, and ADF intake were not
affected by CGM and DDG (P ≥ 0.14) or NA (P ≥ 0.40). DM digestibility was not different
across treatments, averaging 69.5 ± 1.50% from CGM and DDG (P = 0.60) or NA (P = 0.84).
Similarly, digestibility of starch, non-starch, and ADF were not affected by CGM and DDG (P ≥
0.18) or NA (P ≥ 0.12). Within the diet, starch (P = 0.04) and ADF (P ≤ 0.01) composition was
higher for CGM compared to DDG diets. As discussed, there was no differences in starch and
ADF digestibility between CGM and DDG treatments, even though starch and ADF content
differed significantly. These results support that the byproduct CGM can replace DDG with no
differences in intake, or digestibility and agrees with research by Kelzer et al. (2009). Kelzer et
al. (2009) observed that there were no digestibility differences when comparing full fat corn
germ meal, dried distiller grains plus solubles, and high protein dried distiller grains.
The effects of CGM and DDG, and the addition of NA on ruminal fermentation
characteristics are presented in Table 2.9. Ruminal pH was not affected by the two different
Page 66
56
byproducts, CGM and DDG (P ≥ 0.34). The NA when present at 3 g/heifer daily increased
ruminal pH significantly (P = 0.03), thereby making the ruminal pH less acidic, compared to the
diets without NA. A less acidic ruminal environment aids in fiber digestion and can increase the
productivity of cellulolytic bacteria. Although NA had a significant impact on rumen pH, there
was no byproduct x NA interaction (P = 0.93).
Lactate concentration in ruminal fluid was not affected by either CGM or DDG (P ≥
0.85) or by NA (P ≥ 0.76). Interestingly, ammonia concentration was lowest when animals were
fed the CGM diet compared to animals fed the DDG diet (P < 0.01) which reflects the ruminal
degradability of the diets. The NA had no effect (P = 0.85) on ammonia concentrations in the
ruminal fluid, and no byproduct x NA interaction was found (P = 0.37).
The DDG diets had more total VFA concentration compared to the CGM diets (P =
0.04). This is reflected not only by the differing byproducts, but also by the different diets. Both
diets, CGM and DDG, were formulated to be isocaloric and isonitrogenous, and as a result there
were different amounts of prairie hay, alfalfa hay, cracked corn, and corn gluten meal between
the two. The higher amount of total VFA concentration in DDG diets translates to the amount of
acetate where the DDG diets tended to have higher concentration of acetate than the CGM diets
(P = 0.08). Although there were no significant effects of NA on total VFA (P = 0.19) or acetate
concentration (P = 0.60), there was a significant decrease in propionate concentration (P =
0.03). Butyrate, another VFA measured in this experiment, had higher concentrations in DDG
diets compared to CGM diets (P < 0.01). There was no NA effect (P = 0.15), but there tended to
be a byproduct x NA interaction (P = 0.06) within the DDG diets. As NA was present in DDG
diets, there was a numerical decrease in butyrate concentration. There was a significant
byproduct effect on isobutyrate concentration where DDG diets had higher concentrations (P <
Page 67
57
0.01) of isobutyrate in ruminal fluid than CGM diets. There was no effect of NA on isobutyrate
concentration (P = 0.13). Valerate and isovalerate was higher in DDG diets compared to CGM
diets (P < 0.01). For isovalerate specifically, there was no NA effect but there was a byproduct x
NA interaction (P ≤ 0.01) detected within the CGM diets. Within the CGM diets, as NA was
present, it increased isovalerate concentrations (P < 0.01). NA had a significant effect on
valerate concentration which was decreased when present (P = 0.02), especially when fed within
the DDG diets (P < 0.01) demonstrating a byproduct x NA interaction. Fluid passage rate was
not affected (P ≥ 0.44) by the two different byproducts, CGM or DDG, and whether or not a NA
was present.
Experiment 4
The effect of the addition of NA with either corn germ meal or dried corn distillers on 24-
h gas production is represented in Figure 2.2. Gas production, expressed in mL, was affected by
time during the 24-h incubation (P < 0.001), NA (P < 0.001), and NA x byproduct (P < 0.001)
during the 24-h incubation. There was no effect of byproduct (CGM and DDG) on gas
production (P = 0.77). As increasing amounts of NA was added to the DDG diets there was a
linear decrease in the total ruminal gas volume (P < 0.001). However, there was no interaction
between CGM and DDG, NA and time (P = 1.00).
Conclusions
There were no significant effects of CGM and DDG on growth performance,
digestibility, or gas production in Exp. 1, 3, and 4. Results of these experiments indicate that
CGM diets can be fed to receiving and growing cattle in place of DDG diets while maintaining
Page 68
58
DMI, ADG, feed efficiency, digestibility and ruminal gas production. When CGM is included in
a diet at 24.5% on DM basis, it offers the same NEm and NEg values as a diet with 22.0% DDG
on DM basis when both diets are formulated to be isocaloric and isonitrogenous. This can be
useful information because very little is known regarding the feed value of CGM in receiving
and growing diets. This might be useful at times when CGM has greater availability and lower
cost than DDG.
There was no significant effect of NA on growth performance, digestibility, or mucosal
immunity in Exp. 1, 2, 3, and 4. However, there was an effect on ruminal gas production and
ruminal parameters. More research is warranted on the addition of NA in receiving and growing
cattle. Further research could entail testing a larger dose than what was used in this study, a
rumen protected nucleotide, and specific nucleotide subunit such as uridine 5’-monophosphate
on receiving and growing cattle.
Page 69
59
Literature Cited
AOAC. 1997. Official Methods of Analysis. 14th ed. Assoc. Off. Anal. Chem. Arlington, VA.
Barker, S. B., and W. H. Summerson. 1941. The colorimetric determination of lactic acid in
biological material. J. Biol. Chem. 138: 535-554.
Blanchard, P. H. 1992. Industrial Chemistry Library, Vol. 4. Technology of corn wet milling and
associated processes. Elsevier. Amsterdam, The Netherlands.
Bowers, G. N., and T. C. Rains. 1988. Measurement of total calcium in biological fluids: Flame
atomic absorption spectrometry. Meth. Enzymol. 158: 302.
Broderick, G. A., and J. H. Kang. 1980. Automated simultaneous determination of ammonia and
total amino acids in ruminal fluid and in vitro media. J. Dairy Sci. 63: 64-75.
Bueno, J., M. Torres, A. Almendros, R. Carmona, Nuñez M.C., A. Rios, and A. Gil. 1994. Effect
of dietary nucleotides on small intestinal repair after diarrhoea. histological and
ultrastructural changes. Gut. 35: 926-933.
Clifford, A. J., and D. I. Story. 1976. Levels of purines in foods and their metabolic effects in
rats. J. Nutr. 106: 435-442.
Galyean, M. L., and M. E. Hubbert. 1995. Effects of season, health, and management on feed
intake by beef cattle. Pages 226 – 234 in Symposium: Intake by Feedlot Cattle. F.N. Owens,
ed. Oklahoma Agric. Exp. Stn., P-942.
Kehoe, S. I., A. J. Heinrichs, C. R. Baumrucker, and D. L. Greger. 2008. Effects of nucleotide
supplementation in milk replacer on small intestinal absorptive capacity in dairy calves. J.
Dairy Sci. 91: 2759-2770.
Page 70
60
Kelzer, J. M., P. J. Kononoff, A. M. Gehman, L. O. Tedeschi, K. Karges, and M. L. Gibson.
2009. Effects of feeding three types of corn-milling coproducts on milk production and
ruminal fermentation of lactating Holstein cattle. J. Dairy Sci. 92: 5120-5132.
Leupp, J. L. 2008. Use of corn distillers dried grains in beef cattle diets. PhD Diss. North Dakota
State Univ., Fargo.
Mashiko, T., S. Nagafuchi, M. Kanbe, Y. Obara, Y. Hagawa, T. Takahashi, and K. Katoh. 2009.
Effects of dietary uridine 5′-monophosphate on immune responses in newborn calves. J.
Anim. Sci. 87: 1042-1047.
Mateo, C., D. Peters, and H. Stein. 2004. Nucleotides in sow colostrum and milk at different
stages of lactation. J. Anim. Sci. 82: 1339-1342.
McDougall, E. I. 1948. Studies on ruminant saliva. 1. the composition and output of sheep's
saliva. Biochem. J. 43: 99-109.
Nagafuchi, S., M. Totsuka, S. Hachimura, M. Goto, T. Takahashi, T. Yajima, T. Kuwata, and S.
Kaminogawa. 2000. Dietary nucleotides increase the proportion of a TCRγδ + subset of
intraepithelial lymphocytes (IEL) and IL- 7 production by intestinal epithelial cells (IEC);
implications for modification of cellular and molecular cross- talk between IEL and IEC by
dietary nucleotides. Biosci. Biotechnol. Biochem. 64: 1459-1465.
Richards, C. J., J. F. Pedersen, R. A. Britton, R. A. Stock, and C. R. Krehbiel. 1995. In vitro
starch disappearance procedure modifications. Anim. Feed Sci. Technol. 55: 35-45.
Sauer, N., M. Eklund, E. Bauer, M. G. Gänzle, C. J. Field, R. T. Zijlstra, and R. Mosenthin.
2012. The effects of pure nucleotides on performance, humoral immunity, gut structure and
numbers of intestinal bacteria of newly weaned pigs. J. Anim. Sci. 90: 3126-3134.
Sukhija, P. S. and D. L. Palmquist. 1988. Rapid method for determination of total fatty acid
content and composition in feedstuffs and feces. J. Agric. and Food Chem 36: 1202-1206.
Page 71
61
Suzuki, K., B. Meek, Y. Doi, M. Muramatsu, T. Chiba, T. Honjo, and S. Fagarasan. 2004.
Aberrant expansion of segmented filamentous bacteria in IgA-deficient gut. Proc. Natl.
Acad. Sci. USA. 101: 1981-1986.
Uauy, R., G. Stringel, R. Thomas, and R. Quan. 1990. Effect of dietary nucleosides on growth
and maturation of the developing gut in the rat. J. Pediatr. Gastroenterol. Nutr. 10: 497-503.
Udén, P., P. E. Colucci, and Van Soest P.J. 1980. Investigation of chromium, cerium and cobalt
as markers in digesta. rate of passage studies. J. Sci. Food Agric. 31: 625-632.
Undersander, D. J. 1993. Forage analyses procedures. eds. Omaha, NE: National Forage Testing
Association.
Van Soest, P. J., J. B. Robertson, and B. A. Lewis. 1991. Methods for dietary fiber, neutral
detergent fiber, and nonstarch polysaccharides in relation to animal nutrition. J. Dairy Sci.
74: 3583-3597.
Williams, C. H., D. J. David, and O. Iismaa. 1962. The determination of chromic oxide in faeces
samples by atomic absorption spectrophotometry. J. Agric. Sci. 59: 381-385.
Page 72
62
Tables
Table 2.1. Composition of diets (% of DM) containing corn germ meal, dried corn distillers
grains and a nucleotide additive fed during Exp. 1, 2, 3, and 4.
Corn germ meal Dried distillers grains
Nucleotide additive, g/d
Item 0 2 4 0 2 4
Ingredient
Cracked corn 25.5 25.5 25.5 29.0 29.0 29.0
Corn germ meal 24.5 24.5 24.5 - - -
Dried distillers grains - - - 22.0 22.0 22.0
Prairie hay 18.0 18.0 18.0 10.7 10.7 10.7
Alfalfa hay 13.0 13.0 13.0 22.8 22.8 22.8
Corn steep liquor 7.0 7.0 7.0 7.0 7.0 7.0
Corn gluten meal 4.0 4.0 4.0 0.5 0.5 0.5
Limestone 1.5 1.5 1.5 1.5 1.5 1.5
Mineral supplement1 1.0 1.0 1.0 1.0 1.0 1.0
Nucleotide additive2 5.5 5.5 5.5 5.5 5.5 5.5 1 Mineral supplement was formulated to contain (DM basis) 18.7% Ca, 4.14% P, 0.24% Mg, 0.43% K, 26.88%
NaCl, 10.62% Na, 16.38% Cl, 1.43% S, 399.41 ppm Fl, 35.66 ppm Co, 177.79 ppm I, 775.26 ppm Fe, 6516.67 ppm
Mn, and 4018.94 ppm Zn. 2 Nucleotide additive was formulated to provide 0, 2 or 4 g/heifer daily when DMI was 8.2 kg/d. At this inclusion
level, the NA provides 0, 0.242, or 0.489 g/kg dietary DM.
Page 73
63
Table 2.2. Analyzed composition of diets (% of DM) fed during Exp. 1, and 2.
Corn germ meal Dried distillers grains
Nucleotide additive, g/d
Item 0 2 4 0 2 4
Composition, analyzed (Exp. 1)1
DM, % 77.4 77.5 77.6 76.4 77.0 76.5
CP, % of DM 18.3 18.9 18.1 18.9 18.7 19.4
Starch, % of DM 19.5 18.7 19.0 18.0 17.3 16.1
Ether extract, % of DM 2.6 2.7 2.6 4.1 4.1 4.4
ADF, % of DM 18.4 17.8 18.1 16.5 16.6 17.2
Ca, % of DM 0.96 0.94 1.00 1.12 1.08 0.99
P, % of DM 0.51 0.53 0.50 0.55 0.54 0.57
NEm, Mcal/kg 1.79 1.79 1.77 1.81 1.80 1.81
NEg, Mcal/kg 1.07 1.07 1.07 1.09 1.09 1.08
Composition, analyzed (Exp. 2)1
DM, % 75.0 74.7 74.9
CP, % of DM 20.2 19.5 20.0
Starch, % of DM 16.0 16.3 16.8
Ether extract, % of DM 3.9 3.9 3.8
ADF, % of DM 20.2 21.3 21.3
Ca, % of DM 1.22 1.27 1.23
P, % of DM 0.58 0.56 0.56
NEm, Mcal/kg 1.75 1.73 1.72
NEg, Mcal/kg 1.02 1.00 1.01 1 Feed samples were analyzed by a commercial laboratory (SDK Laboratories, Hutchinson, KS).
Page 74
64
Table 2.3. Effects of corn germ meal and dried corn distillers grains and the addition of a
nucleotide additive on beef heifer gain, intake, and efficiency (Exp. 1).
1 BP indicates byproduct effect. 4 BPxNA-L indicates byproduct x nucleotide additive linear effect.
2 NA-L indicates nucleotide additive linear effect. 5 BPxNA-Q indicates byproduct x nucleotide additive quadratic.
3 NA-Q indicates nucleotide additive quadratic effect. 6 NEm and NEg calculated based on equations from the 1996 NRC.
Corn germ meal Dried distillers grains
Nucleotide additive, g/d P-value
Item 0 2 4 0 2 4 SEM BP1 NA-L2 NA-Q3 BPxNA-L4 BPxNA-Q5
No. of pens 3 3 3 3 3 3
No. of animals 35 35 36 36 35 36
Days on feed 84 84 84 84 84 84
Calculated NEm, Mcal/kg6 1.59 1.63 1.62 1.63 1.70 1.64 0.07 0.25 0.62 0.27 0.89 0.66
Calculated NEg, Mcal/kg6 0.98 1.02 1.01 1.01 1.08 1.03 0.06 0.31 0.63 0.30 0.87 0.61
Initial BW, kg 262.3 261.6 261.1 261.8 261.4 261.5 15.9 0.78 0.20 0.72 0.41 0.91
Final BW, kg 355.8 352.7 355.7 349.2 358.8 357.3 6.80 0.88 0.33 0.72 0.32 0.23
DMI, kg/d
d 0 to 28 7.78 7.43 7.83 7.67 7.72 7.80 0.92 0.76 0.66 0.28 0.83 0.31
d 28 to 56 9.51 8.96 9.29 9.00 9.44 9.36 0.71 0.96 0.84 0.77 0.42 0.26
d 56 to 84 11.0 10.7 10.9 10.0 10.2 10.7 0.97 0.19 0.58 0.65 0.44 0.94
d 0 to 84 9.40 8.99 9.30 8.88 9.10 9.26 0.83 0.55 0.65 0.56 0.45 0.48
ADG, kg
d 0 to 28 1.36 1.38 1.46 1.33 1.49 1.50 0.16 0.57 0.15 0.80 0.71 0.48
d 28 to 56 1.30 1.20 1.23 1.13 1.25 1.23 0.10 0.65 0.90 0.97 0.38 0.43
d 56 to 84 0.63 0.64 0.64 0.62 0.69 0.64 0.09 0.83 0.85 0.72 0.99 0.75
d 0 to 84 1.11 1.08 1.13 1.04 1.16 1.14 0.08 0.88 0.28 0.70 0.39 0.25
G:F
d 0 to 28 0.171 0.187 0.189 0.177 0.196 0.194 0.015 0.47 0.15 0.41 0.99 0.87
d 28 to 56 0.137 0.134 0.132 0.126 0.134 0.132 0.010 0.64 0.96 0.78 0.56 0.72
d 56 to 84 0.055 0.059 0.059 0.063 0.070 0.060 0.010 0.59 0.96 0.55 0.72 0.66
d 0 to 84 0.118 0.121 0.121 0.119 0.130 0.124 0.007 0.34 0.41 0.28 0.93 0.45
Page 75
65
Table 2.4. Effects of corn germ meal and dried corn distillers grains and the addition of a
nucleotide additive on beef heifer morbidity (Exp. 1).
Disease Treatment
BRD DDG0
BRD DDG0
BRD DDG0
BRD CGM2
BRD DDG4
Pinkeye CGM0
Pinkeye CGM2
Pinkeye CGM4
Pinkeye DDG2
Pinkeye DDG4
Footrot DDG4
Bloat CGM2
Table 2.5. Effects of corn germ meal and dried corn distillers grains and the addition of a
nucleotide additive on beef heifer mortality (Exp. 1).
Death Type Treatment
Bacterial infection DDG2
Bacterial infection DDG4
Chronic BRD CGM0
Page 76
66
Table 2.6. Effects of the addition of a nucleotide feed additive to diets containing dried corn
distillers grains on beef heifer gain, intake, and efficiency (Exp. 2).
Nucleotide additive g/d P-value
Item 0 2 4 SEM Linear Quadratic
No. of pens 8 8 8
No. of animals 80 80 80
Days on feed 56 56 56
Initial BW, kg 267.1 268.1 267.9 6.97 0.49 0.54
Final BW, kg 323.5 324.0 320.4 1.73 0.42 0.29
DMI, kg/d
d 0 to 28 8.66 8.72 8.39 0.21 0.46 0.51
d 28 to 56 8.94 8.78 8.60 0.26 0.44 0.96
d 0 to 56 8.80 8.75 8.49 0.22 0.43 0.73
ADG, kg
d 0 to 28 1.43 1.35 1.31 0.06 0.18 0.85
d 28 to 56 0.57 0.65 0.57 0.06 0.96 0.23
d 0 to 56 1.00 1.00 0.94 0.03 0.23 0.36
G:F
d 0 to 28 0.165 0.155 0.157 0.005 0.26 0.40
d 28 to 56 0.084 0.112 0.093 0.017 0.72 0.28
d 0 to 56 0.114 0.115 0.111 0.003 0.54 0.58
Page 77
67
Table 2.7. Effects of the addition of a nucleotide feed additive to diets containing dried corn
distiller grains on beef heifer gain, intake, and efficiency-pooled analysis (Exp. 1 & 2).
Nucleotide additive, g/d P-value
Item 0 2 4 SEM Linear Quadratic
No. of pens 11 11 11
No. of animals 116 115 116
Days on feed 56 56 56
Initial BW, kg 265.7 266.3 266.2 6.31 0.55 0.59
Final BW, kg 322.0 325.2 322.4 6.75 0.90 0.19
DMI, kg/d
d 0 to 28 8.40 8.44 8.23 0.22 0.51 0.57
d 28 to 56 8.96 8.96 8.81 0.25 0.64 0.80
d 0 to 56 8.69 8.75 8.52 0.21 0.58 0.57
ADG, kg
d 0 to 28 1.40 1.39 1.36 0.06 0.64 0.87
d 28 to 56 0.60 0.69 0.63 0.05 0.69 0.20
d 0 to 56 1.00 1.04 0.99 0.03 0.92 0.25
G:F
d 0 to 28 0.169 0.166 0.167 0.007 0.78 0.82
d 28 to 56 0.082 0.105 0.090 0.013 0.64 0.25
d 0 to 56 0.116 0.120 0.117 0.003 0.78 0.39
Page 78
68
Table 2.8. Effects of corn germ meal and dried corn distillers grains and the addition of a
nucleotide additive on intake and digestibility of DM, starch, and ADF (Exp. 3).
Corn germ meal Dried distillers grains
Nucleotide additive, g/d P-value
Item 0 3 0 3 SEM Byproduct NA1 Byproduct x NA
No. of observations 4 4 4 4
Diet composition, % DM
Starch 23.8 23.8 22.5 22.5 0.005 0.04 1.0 1.0
ADF 16.0 16.0 15.4 15.4 0.002 0.01 1.0 1.0
Intake, kg/d
DM 9.92 9.98 10.35 9.90 0.46 0.46 0.40 0.28
Starch 2.39 2.40 2.34 2.24 0.13 0.27 0.61 0.57
Non-starch 7.53 7.59 8.02 7.66 0.34 0.14 0.40 0.26
ADF 1.58 1.60 1.60 1.53 0.06 0.42 0.50 0.19
Digestibility, %
DM 68.7 69.4 70.5 69.2 1.50 0.60 0.84 0.53
Starch 85.6 88.2 88.4 88.2 1.84 0.35 0.39 0.34
Non-starch 63.4 63.4 65.3 63.7 1.73 0.55 0.66 0.67
ADF 62.6 61.6 67.6 62.1 2.28 0.18 0.12 0.26
1 NA indicates nucleotide additive.
Page 79
69
Table 2.9. Effects of corn germ meal and dried corn distillers grains and the addition of a
nucleotide additive on ruminal fermentation characteristics (Exp. 3).
Corn germ meal Dried distillers grains
Nucleotide additive, g/d P-value
Item 0 3 0 3 SEM1 Byproduct NA4 Byproduct x NA
No. of observations 4 4 4 4
Ruminal
pH2 5.61 5.73 5.67 5.78 0.07 0.34 0.03 0.93
Lactate2, mM 0.08 0.07 0.07 0.08 0.01 0.85 0.76 0.43
Ammonia2, mM 2.6 2.8 4.5 4.2 0.46 < 0.01 0.85 0.37
Total VFA2, mM 104.5 102.8 113.6 106.9 3.62 0.04 0.19 0.43
Acetate2, mM 63.4 64.1 68.3 65.7 2.81 0.08 0.60 0.39
Propionate2, mM 27.2 24.1 26.5 24.6 1.39 0.92 0.03 0.61
Butyrate2, mM 10.7a 10.9a 14.1b 12.4c 1.03 < 0.01 0.15 0.06
Isobutyrate2, mM 0.69 0.76 0.96 0.98 0.06 < 0.01 0.13 0.34
Isovalerate2, mM 1.00e 1.36d 1.51d 1.38d 0.13 < 0.01 0.23 0.01
Valerate2, mM 1.47f 1.58f 2.28g 1.86h 0.07 < 0.01 0.02 < 0.01
Fluid passage rate, %/h3 14.6 15.2 13.4 14.9 0.01 0.59 0.44 0.74
1 Largest value among treatments is reported.
2 Average of values collected at 0, 2, 4, 6, 8, 12, 18, and 24 h after feeding.
3 Calculated values from samples collected at 2, 4, 6, 8, 12, and 18 h after feeding.
4 NA indicates nucleotide additive.
a,b,c means within a row not bearing a common letter differ (P ≤ 0.05).
d,e means within a row not bearing a common letter differ (P ≤ 0.01).
f,g,h means within a row not bearing a common letter differ (P < 0.01).
Page 80
70
Table 2.10. Effects of corn germ meal and dried corn distillers grains and the addition of a
nucleotide additive on ruminal volatile fatty acid profile (Exp. 3).
1 Largest value among treatments is reported.
2 Average of values collected at 0, 2, 4, 6, 8, 12, 18, and 24 h after feeding expressed as a percent of total VFA.
3 NA indicates nucleotide additive.
a, b, c, d means within a row not bearing a common letter differ (P ≤ 0.04).
a, b means within a row not bearing a common letter differ (P ≤ 0.02).
c,d means within a row not bearing a common letter differ (P ≤ 0.05).
Corn germ meal Dried distillers grains
Nucleotide additive, g/d P-value
Item 0 3 0 3 SEM1 Byproduct NA3 Byproduct x NA
No. of observations 4 4 4 4
Ruminal VFA, % of total
Acetate2 60.9 62.5 60.3 61.6 0.83 0.07 < 0.01 0.70
Propionate2 25.9 23.3 23.2 23.0 1.45 ≤ 0.01 0.03 0.07
Butyrate2 10.2c 10.5d 12.3c,d 11.4c,d 0.72 < 0.01 0.40 0.05
Isobutyrate2 0.67 0.75 0.85 0.92 0.05 < 0.01 0.04 0.90
Isovalerate2 0.97b 1.35a 1.34a 1.31a 0.12 0.12 0.09 0.05
Valerate2 1.41a 1.52b 1.98c 1.73d 0.06 < 0.01 0.05 < 0.01
Page 81
71
0
200
400
600
800
1000
1200
DDG0 DDG2 DDG4
Fec
al
IgA
, n
g/m
L
Treatment
Figures
Figure 2.1. Concentration of secretory IgA in fecal samples collected on d 28 (Exp. 2). There was no linear dose (P = 0.24), or
quadratic (P = 0.11) effects of nucleotides. Values are least square means ± SEM, where SEM = 144 and n = 147. Forty-nine fecal
samples were taken from DDG0, 48 from DDG2, and 50 from DDG4.
Page 82
72
0
50
100
150
200
250
300
350
0 3 6 9 12 15 18 21 24
Ga
s v
olu
me,
mL
Time, h
DDG0 DDG2 DDG4
CGM0 CGM2 CGM4
Figure 2.2. Effect of the addition of a nucleotide feed additive with either corn germ meal or dried corn distillers grains on 24-
h gas production (mL) (Exp. 4). No interaction between byproduct, nucleotide feed additive and time, P = 1.00. SEM1 = Standard
error of the mean of the combination of byproduct, nucleotide feed additive and time. Effect of time, P < 0.001, effect of byproduct, P
= 0.77, linear effect of NA, P < 0.001, quadratic effect of NA, P = 0.66, linear effect NA x byproduct, P < 0.001, and quadratic effect
of NA x byproduct, P = 0.89.