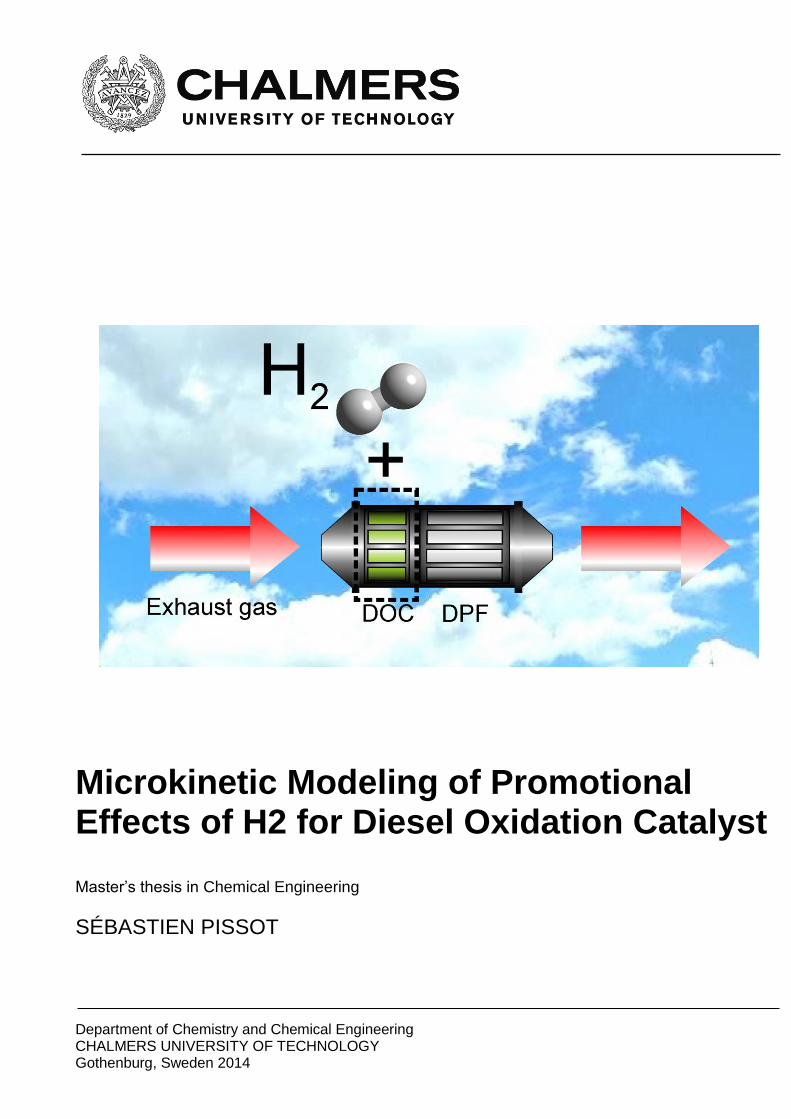
Department of Chemistry and Chemical Engineering CHALMERS UNIVERSITY OF TECHNOLOGY Gothenburg, Sweden 2014 Microkinetic Modeling of Promotional Effects of H2 for Diesel Oxidation Catalyst Master’s thesis in Chemical Engineering SÉBASTIEN PISSOT
Transcript
Department of Chemistry and Chemical Engineering CHALMERS UNIVERSITY OF TECHNOLOGY Gothenburg, Sweden 2014
Microkinetic Modeling of Promotional Effects of H2 for Diesel Oxidation Catalyst Master’s thesis in Chemical Engineering
SÉBASTIEN PISSOT
Table of Contents Abstract ........................................................................................................................................................ 2
3. Model building ...................................................................................................................................... 5
3.1 Reactor Model .................................................................................................................................... 5
4.1 Temperature ..................................................................................................................................... 12
3.3 Mass balance equations As mentioned previously, mass transport between gas and solid phase was not included in this model,
instead a simple mass balance for each tank coupling gas phase and catalyst surface was used. The mass
balance for specie i in tank k is:
With Fi,k-1 the inlet flow of species i in tank k, Fi,k the outlet molar flow of species i out of tank k, rj,k the
rate of reaction j (in s-1) in tank k, νi,j the stoichiometric coefficient of species i in reaction j, Csite the site
(𝐹𝑖,𝑘 − 𝐹𝑖,𝑘−1) = (∑ 𝑟𝑗,𝑘 ∗ 𝜈𝑖,𝑗
𝑁𝑅
𝑗=1
) ∗𝐶𝑠𝑖𝑡𝑒 ∗ 𝑚𝑐𝑎𝑡,𝑘
𝑁𝐴 Equation 4
10
density of catalyst in sites/mg, calculated for 1 wt.% Pt with 2% dispersion, mcat,k the mass of catalyst in
tank k and NA the Avogadro number.
The adsorbed species transient balance is:
And the site conservation equation:
With θi,k surface coverage of adsorbed specie i in tank k, θv,k surface coverage of vacant sites in tank k.
3.4 Heat balance equations A simple heat balance was implemented in the program to account for heat of reactions, heat loss to
the environment (simulated as heat radiation). The heat balance for tank k is written as follow:
With Ftot,k the total molar flowrate in tank k (reacting gas phase and inerts), ΔHr,j the reaction enthalpy of
reaction j, Utot a radiation heat transfer coefficient set equal to 18.5*10-12 W/K4 and T∞ the environment
temperature set to 150 ˚C.
Instead of including the heat of reaction of every reaction steps, only the heat of reaction for the two
most important global reactions was included. Therefore, the enthalpy of reaction for the reaction: NO +
O => NO2* was set to -58.19 kJ/mol (58.19 kJ/mol for reverse reaction) for both Langmuir-Hinshelwood
and Eley-Rideal mechanisms (reaction 15 and 16 respectively). The heat of reaction for H2O formation
(reactions 29 and 31) reactions was set to -243.8 kJ/mol (243.8 kJ/mol for reverse reactions 30 and 32).
These heats of reaction correspond to a reference temperature equal to 250˚C. These heats of reaction
correspond to the global reaction heats (from gas phase reactants to gas phase products) at a reference
temperature equal to 250˚C. The enthalpy of reaction of every other reaction step was set to 0. This
information is summed up in Table 5.
Table 5: Heat of reactions
Reaction Reaction enthalpy (KJ/mol)
NO* + O* => NO2* + * -58.19
NO2* + * => NO* + O* 58.19
NO + O* => NO2* -58.19
NO2* => NO + O* 58.19
OH*+H* ==> H2O*+* -243.8
𝑑𝜃𝑖,𝑘
𝑑𝑡= ∑ 𝑟𝑗,𝑘 ∗ 𝜈𝑖,𝑗
𝑁𝑅
𝑗=1
Equation 5
𝜃𝑣,𝑘 = 1 − ∑ 𝜃𝑖,𝑘
𝑁𝑎𝑑𝑠
𝑖=1
Equation 6
𝐹𝑡𝑜𝑡,𝑘𝐶𝑝,𝑔𝑎𝑠(𝑇𝑔,𝑘−1 − 𝑇𝑔,𝑘) + (∑ 𝑟𝑗,𝑘(−𝛥𝐻𝑟,𝑗))
𝑁𝑅
𝑗=1
𝐶𝑠𝑖𝑡𝑒𝑚𝑐𝑎𝑡,𝑘
𝑁𝐴
− 𝑈𝑡𝑜𝑡
𝑚𝑐𝑎𝑡,𝑘
𝑚𝑐𝑎𝑡,𝑡𝑜𝑡(𝑇4
𝑔,𝑘 − 𝑇4∞)
= 𝐶𝑝,𝑚𝑜𝑛𝑜𝑙𝑖𝑡ℎ (𝑚𝑚𝑜𝑛𝑜𝑙𝑖𝑡ℎ
𝑚𝑐𝑎𝑡,𝑘
𝑚𝑐𝑎𝑡,𝑡𝑜𝑡+ 𝑚𝑐𝑎𝑡,𝑘)
𝑑𝑇𝑔,𝑘
𝑑𝑡
Equation 7
11
H2O*+*==>OH*+H* 243.8
OH* + OH* ==> H2O* + O* -243.8
H2O*+O*==>OH*+OH* 243.8
Heat losses by conduction to the environment as well as axial conduction through the monolith length
are not included in this heat balance, which is kept as simple as possible.
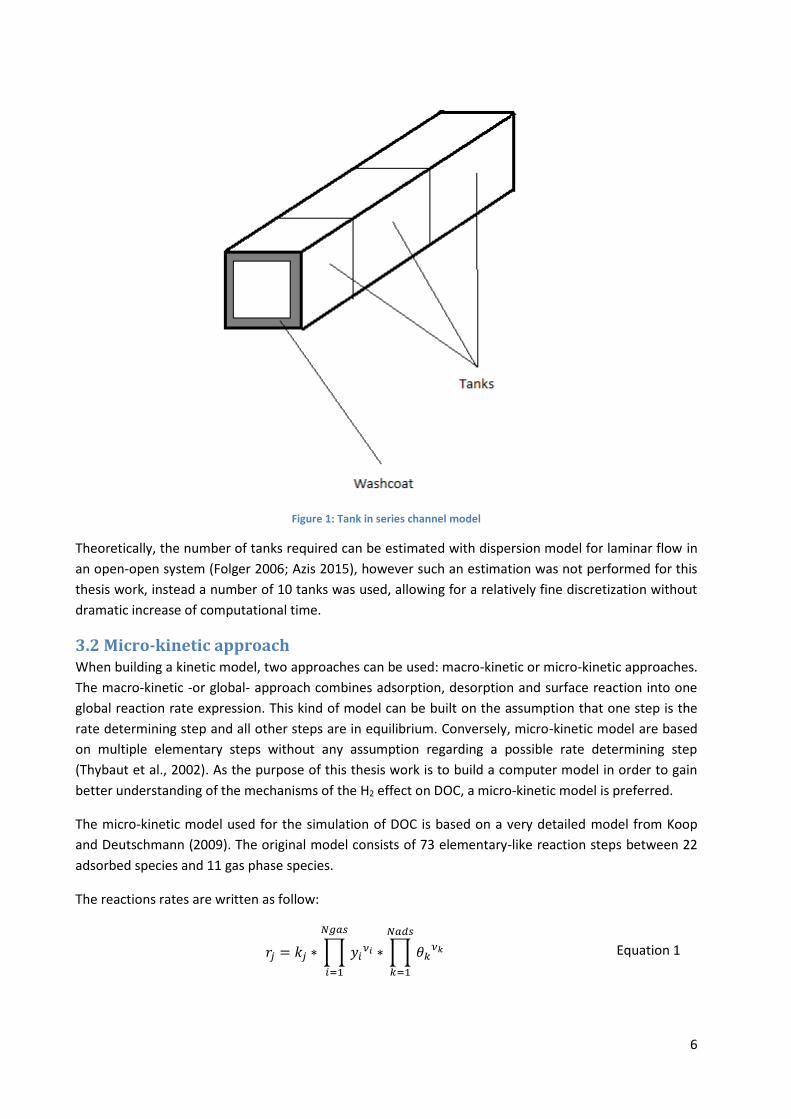
3.5 Model limitations As stated previously, the channel model was kept simple and a lot of factors were neglected. In reality,
all reactions do not occur on the washcoat surface, but through the washcoat, meaning that diffusion of
species through the washcoat layers should be included if the aim is to develop a more realistic model.
Often, the washcoat is discretized in both the axial and radial direction. Mass transport resistance from
gas phase to the washcoat and from the washcoat to gas phase has also been neglected. For the heat
balance model to be more realistic, the heat of reaction for every reaction should be included, as well as
convection from the gas phase, heat conduction through the monolith length and heat losses by
convection with the environment.
Concerning the microkinetic model, though it is quite extensive, it might not be extensive enough or not
represent reality accurately enough. For instance, Rankovic et al. (2011) use more steps for the coupling
reactions between CO and H2 and more coupling between gas phase and platinum surface whereas
Koop and Deutschmann (2009) include more reactions that couple H2 and NO oxidation. However,
increasing the number of reactions and adsorbed species leads to an increase in computational time.
3.6 MatLab program Two MatLab® programs were built and used in this thesis. The first one is a steady-state program which
simulates for one experimental point only and was mainly used for testing the kinetic model. The second
program is a transient simulation program which uses mainly the same body as the first program, but
can simulate experiments such as temperature-programmed reaction experiments.
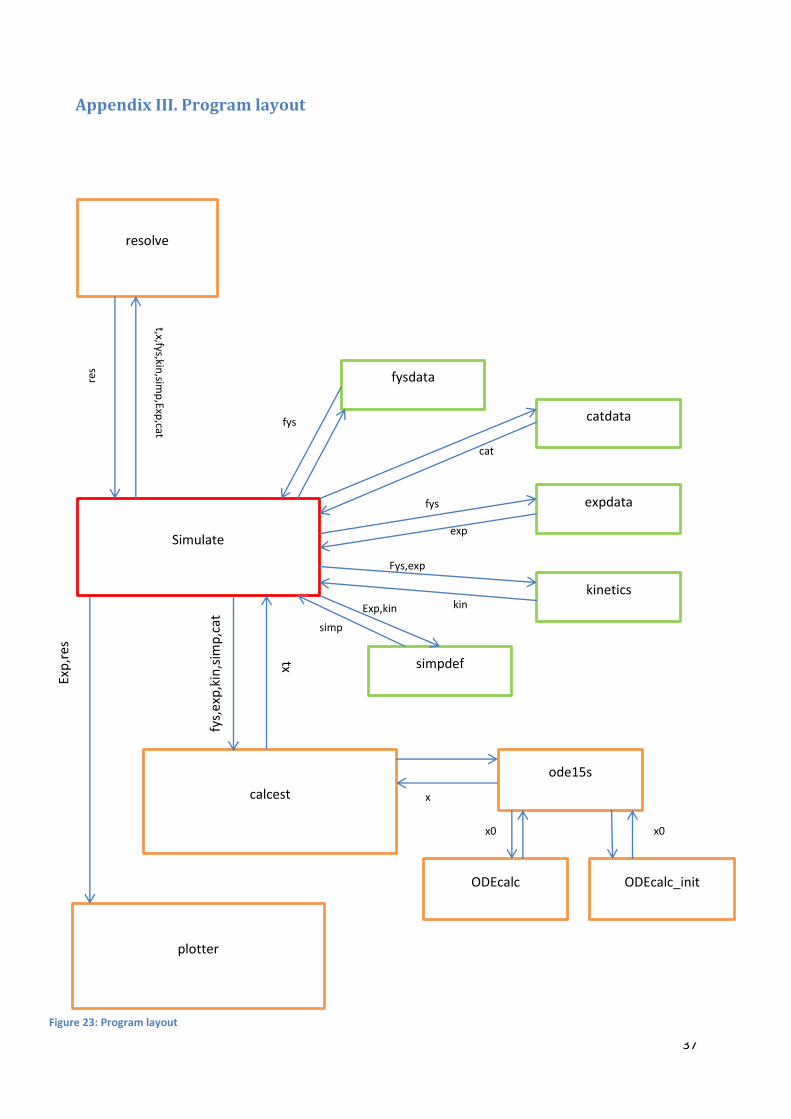
The layout of the transient program is described in Figure 23 in appendix III.
The main file is simulate.m, which calls the functions that set up the simulation (fysdata, expdata,
kinetics, simpdef and catdata) then solve the differential equations through function calcest and finally
plots the relevant results calling the function plotter. Table 7 (appendix II) describes what every function
in the program does and their outputs. The functions are described in the order they are called in the
program.
In the case of the steady-state program, the only structural difference in the program is that there is no
need to call ODEcalc_init. When heat balance is implemented into the transient program, the layout
remains the same, only a differential equation is added in ODEcalc_init and ODEcalc files. The steady-
state program solves the system of differential and algebraic equations from given start conditions until
Equation 5 is lower than a set threshold value (1e-5 in this case). When this threshold is reached, the
rate of change of the surface coverages is considered low enough for steady states to have been
reached. The transient program, however, works in two steps. First, in ODEcalc_init, similar to the
steady-state program it solves for steady-state conditions at the time zero experiment conditions. Then,
it solves the system of differential and algebraic equations for the remaining time steps.
12
When using a detailed model with reversible reaction steps, some of the reaction steps can be very
close to the equilibrium, which can make simulation stiff and computationally demanding. Therefore,
the average value of a reversible reaction rate pair is limited to be no more than a set order of
magnitude (1e3 in this work) higher than the net difference in that reaction pair. This allowed the
program to run faster and avoid stiffness.
3.7 Parameter fitting The goal of this thesis work was primarily to test existing micro-kinetic models and try to simulate and
explain experimental results from the existing models rather than developing our own models.
Consequently, no parameter fitting was performed, the only ‘’parameter tuning’’ consisted in adjusting
the pre-exponential factor and activation energy of the reverse NO oxidation reaction (reaction 17 & 18)
so that the simulation of NO2 formation was thermodynamically consistent. Also, the platinum
dispersion in the model was adjusted in order for NO2 yield to better fit the experiment in the kinetic
regime.
4. Results
4.1 Temperature
To be consistent with Azis et al. (2015) results, both experimental and simulated results were plotted
against the catalyst outlet temperature, measured as explained in the experimental section.
Figure 2: Comparison of inlet gas temperature and catalyst outlet temperature for NO/O2 gas mixture experiment. (a) No H2 in feed. (b) 1000ppm H2 in feed. Plotted versus gas inlet temperature exceptionally.
It can be seen from Figure 2 that with or without H2, the temperature of the catalyst is not equal to the
temperature of the inlet. Besides, when H2 is fed, the temperature of the monolith is first higher than
the temperature of the inlet gas, and then becomes lower at around 230˚C, with H2 being fully
converted around 200˚C. The difference between the catalyst temperature and the gas inlet
temperature is mainly due to two factors: first, there are temperature gradients along the length of the
catalyst resulting from heat losses, and second is the temporal lagging behind of catalyst temperature,
due to thermal inertia. The adiabatic temperature rise for the experiment with NO oxidation only was
a) b)
13
estimated to be 1.0˚C for 80% conversion. For NO oxidation with H2 (1000ppm) oxidation, with 80%
conversion for NO and 100% conversion for H2, the adiabatic temperature rise was estimated to be
12˚C. Consequently, assuming the temporal effect is negligible due to the slow ramping rate 5˚C/min, if
the reactor was adiabatic the catalyst temperature should be slightly higher than the gas inlet
temperature. This is not the case, proof that there are some heat losses and that the reactor is not
adiabatic.
Figure 3: Comparison of NO2 yield from experiment and equilibrium for NO/O2 gas mixture experiment with 750ppm H2 in feed.
Figure 3 shows that between 120 and 300˚C, NO2 formation is controlled by kinetics, but from
approximately 350˚C, thermodynamic equilibrium is causing decrease in NO2 yield. There is a 20˚C to
60˚C difference between the thermodynamic curve and the experimental curve in the thermodynamic
control regime as can be seen in Figure 3. The experimental curve being above the equilibrium curve
means that the actual catalyst temperature is lower than the one measured, mainly due to heat losses.
Obviously, any kinetic model that is thermodynamically constrained can predict only a maximum NO2
yield, limited by thermodynamic at a given temperature. Therefore, this difference must be accounted
for in order for the model to fit the experiment with more accuracy, which is done by adding the
differential equation shown in Equation 7. By doing so, the simulated NO2 yield can be made to follow
much closer the experimental equilibrium as can be seen in Figure 4.
14
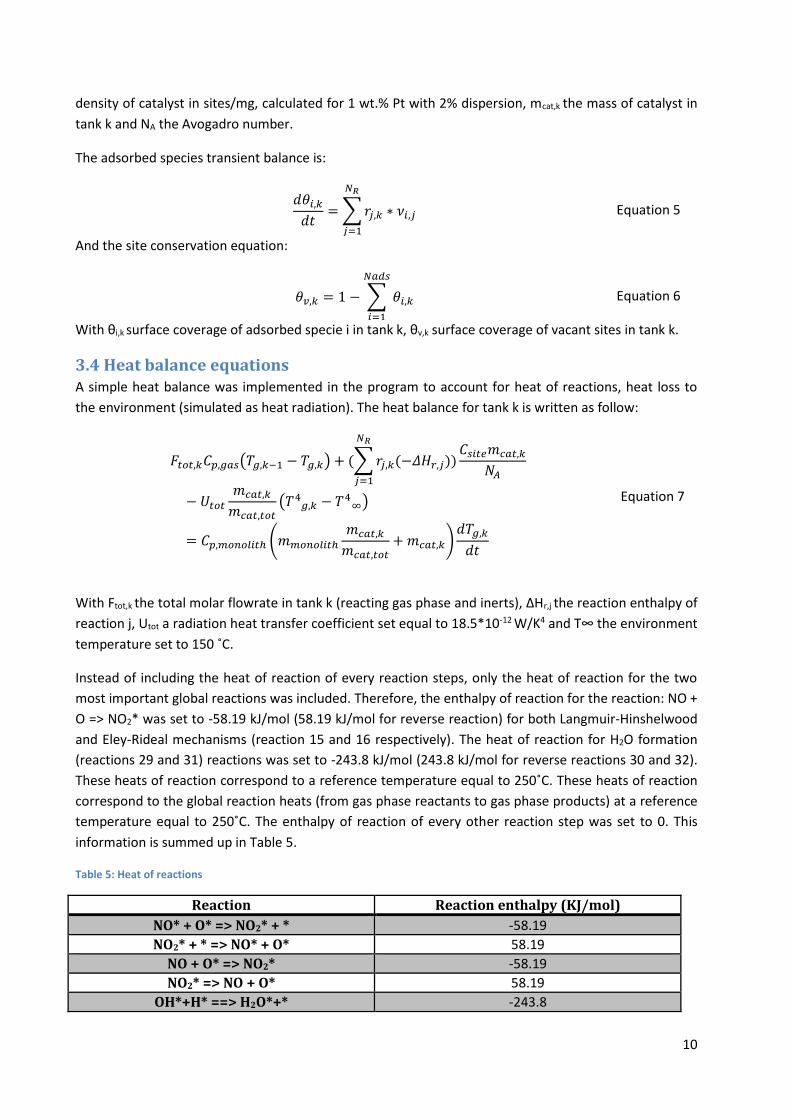
Figure 4: Comparison of NO2 yield from simulation and experiment for NO/O2 gas mixture experiment ,with heat balance, 750ppm H2 in feed.
As can be seen from Figure 4, the simulation is close to the experiment at temperature higher than
350˚C when equilibrium limited. Without the heat balance, the simulated curve in Figure 4 would be
closer to the equilibrium curve from Figure 3.
4.2 Platinum oxide dispersion
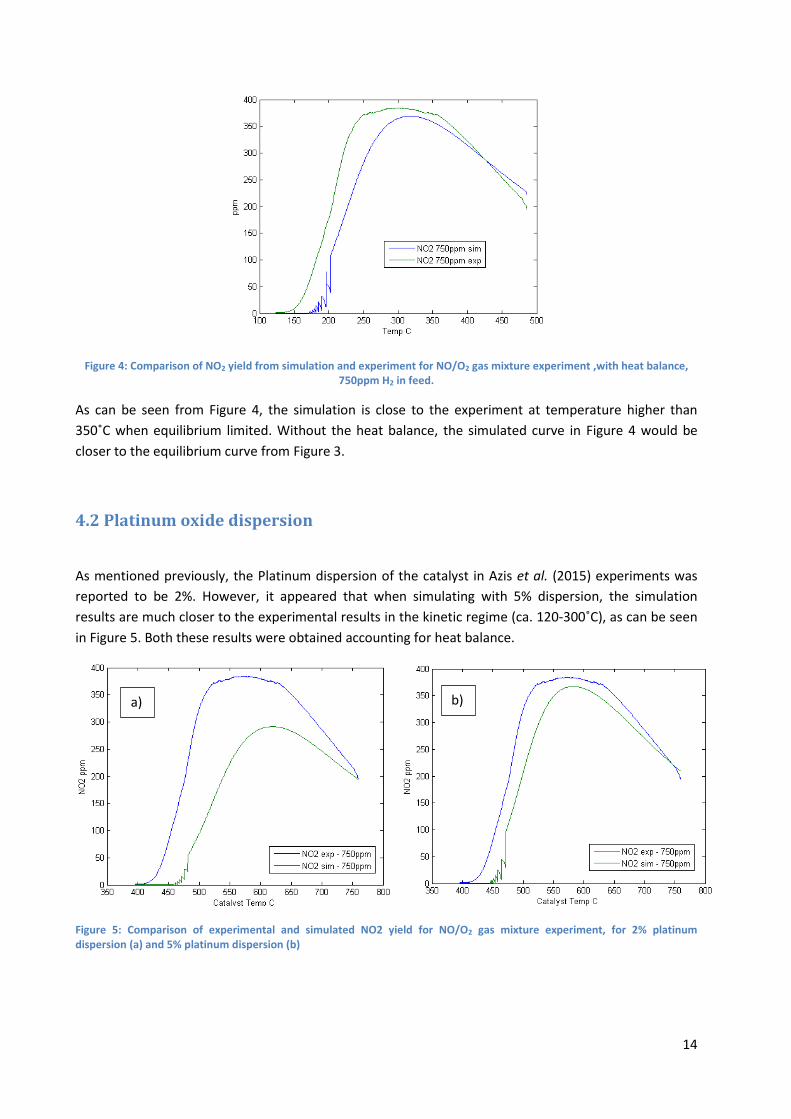
As mentioned previously, the Platinum dispersion of the catalyst in Azis et al. (2015) experiments was
reported to be 2%. However, it appeared that when simulating with 5% dispersion, the simulation
results are much closer to the experimental results in the kinetic regime (ca. 120-300˚C), as can be seen
in Figure 5. Both these results were obtained accounting for heat balance.
Figure 5: Comparison of experimental and simulated NO2 yield for NO/O2 gas mixture experiment, for 2% platinum dispersion (a) and 5% platinum dispersion (b)
a) b)
15
This 5% dispersion value was fixed totally arbitrarily, no optimization was performed on this value and
most likely there is another value which would give better results. However, this thesis work was more
focused on the micro-kinetic model rather than on the simulation parameter, hence the 5% value was
considered sufficient.
Consequently, the results that are going to be presented subsequently will be simulated with 5%
platinum dispersion on accounting for heat balance.
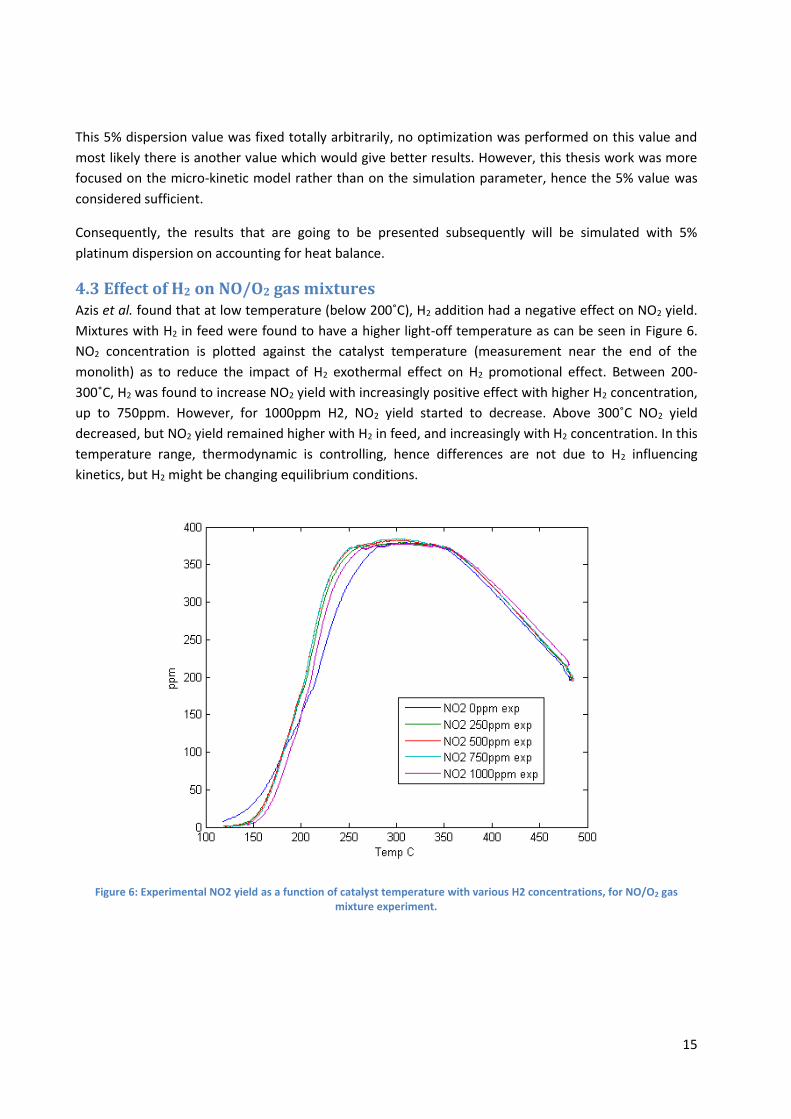
4.3 Effect of H2 on NO/O2 gas mixtures Azis et al. found that at low temperature (below 200˚C), H2 addition had a negative effect on NO2 yield.
Mixtures with H2 in feed were found to have a higher light-off temperature as can be seen in Figure 6.
NO2 concentration is plotted against the catalyst temperature (measurement near the end of the
monolith) as to reduce the impact of H2 exothermal effect on H2 promotional effect. Between 200-
300˚C, H2 was found to increase NO2 yield with increasingly positive effect with higher H2 concentration,
up to 750ppm. However, for 1000ppm H2, NO2 yield started to decrease. Above 300˚C NO2 yield
decreased, but NO2 yield remained higher with H2 in feed, and increasingly with H2 concentration. In this
temperature range, thermodynamic is controlling, hence differences are not due to H2 influencing
kinetics, but H2 might be changing equilibrium conditions.
Figure 6: Experimental NO2 yield as a function of catalyst temperature with various H2 concentrations, for NO/O2 gas mixture experiment.
16
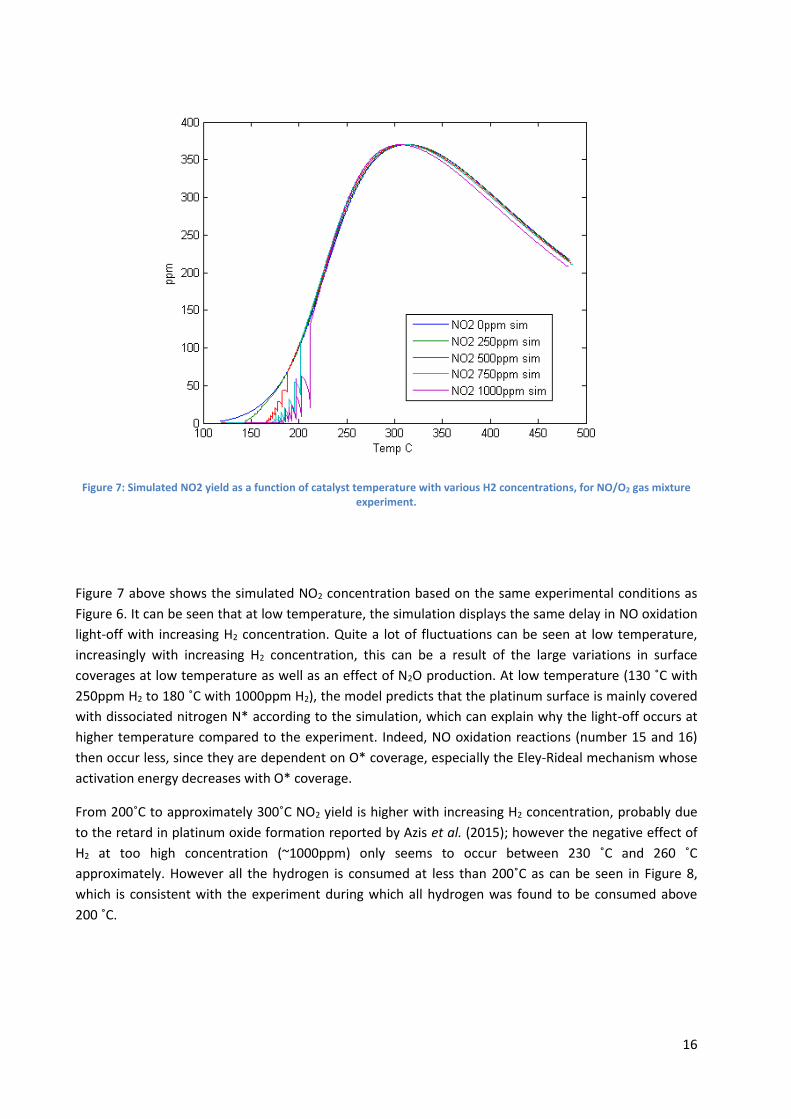
Figure 7: Simulated NO2 yield as a function of catalyst temperature with various H2 concentrations, for NO/O2 gas mixture experiment.
Figure 7 above shows the simulated NO2 concentration based on the same experimental conditions as
Figure 6. It can be seen that at low temperature, the simulation displays the same delay in NO oxidation
light-off with increasing H2 concentration. Quite a lot of fluctuations can be seen at low temperature,
increasingly with increasing H2 concentration, this can be a result of the large variations in surface
coverages at low temperature as well as an effect of N2O production. At low temperature (130 ˚C with
250ppm H2 to 180 ˚C with 1000ppm H2), the model predicts that the platinum surface is mainly covered
with dissociated nitrogen N* according to the simulation, which can explain why the light-off occurs at
higher temperature compared to the experiment. Indeed, NO oxidation reactions (number 15 and 16)
then occur less, since they are dependent on O* coverage, especially the Eley-Rideal mechanism whose
activation energy decreases with O* coverage.
From 200˚C to approximately 300˚C NO2 yield is higher with increasing H2 concentration, probably due
to the retard in platinum oxide formation reported by Azis et al. (2015); however the negative effect of
H2 at too high concentration (~1000ppm) only seems to occur between 230 ˚C and 260 ˚C
approximately. However all the hydrogen is consumed at less than 200˚C as can be seen in Figure 8,
which is consistent with the experiment during which all hydrogen was found to be consumed above
200 ˚C.
17
Figure 8: Simulated H2 outlet concentration with various H2 inlet concentrations, for NO/O2 gas mixture experiment.
Above 300 ˚C, NO2 yield decreases with the temperature, however it decreases more with increasing H2
concentrations, as opposed to the experimental results. From 230˚C to 300˚C, NO2 yield is almost the
same for each H2 concentration fed.
18
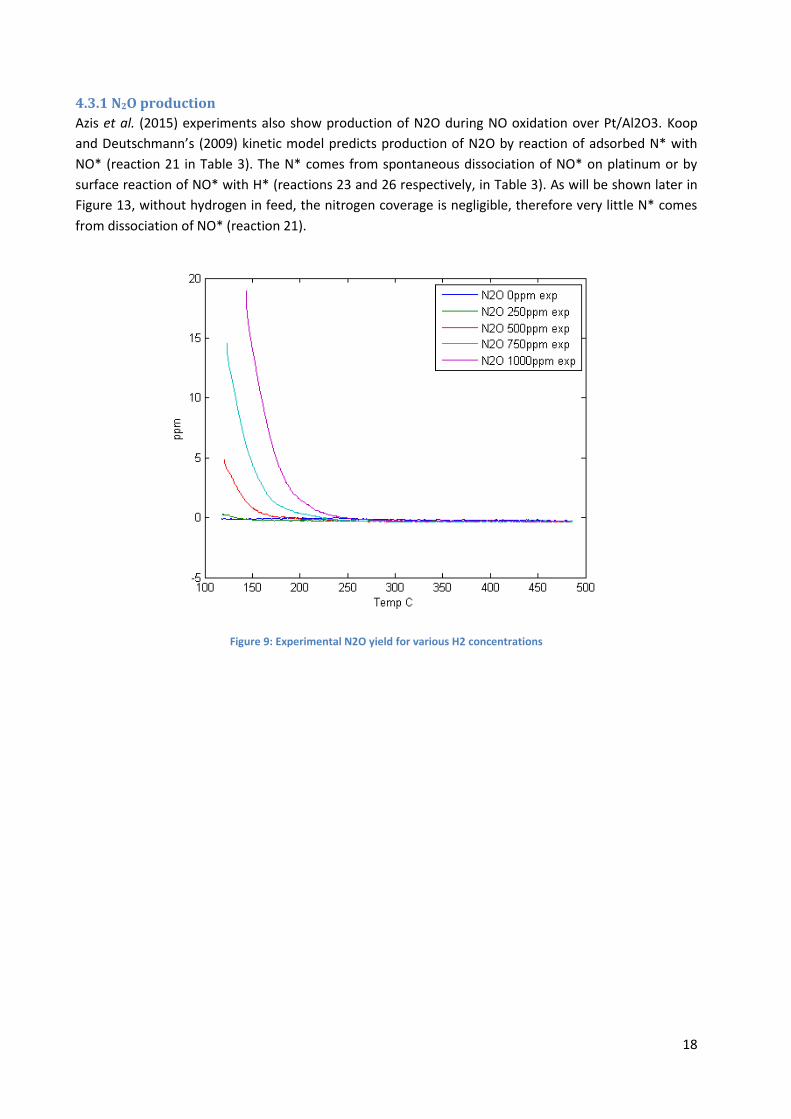
4.3.1 N2O production
Azis et al. (2015) experiments also show production of N2O during NO oxidation over Pt/Al2O3. Koop
and Deutschmann’s (2009) kinetic model predicts production of N2O by reaction of adsorbed N* with
NO* (reaction 21 in Table 3). The N* comes from spontaneous dissociation of NO* on platinum or by
surface reaction of NO* with H* (reactions 23 and 26 respectively, in Table 3). As will be shown later in
Figure 13, without hydrogen in feed, the nitrogen coverage is negligible, therefore very little N* comes
from dissociation of NO* (reaction 21).
Figure 9: Experimental N2O yield for various H2 concentrations
19
Figure 10: Simulated N2O yield for various H2 concentrations
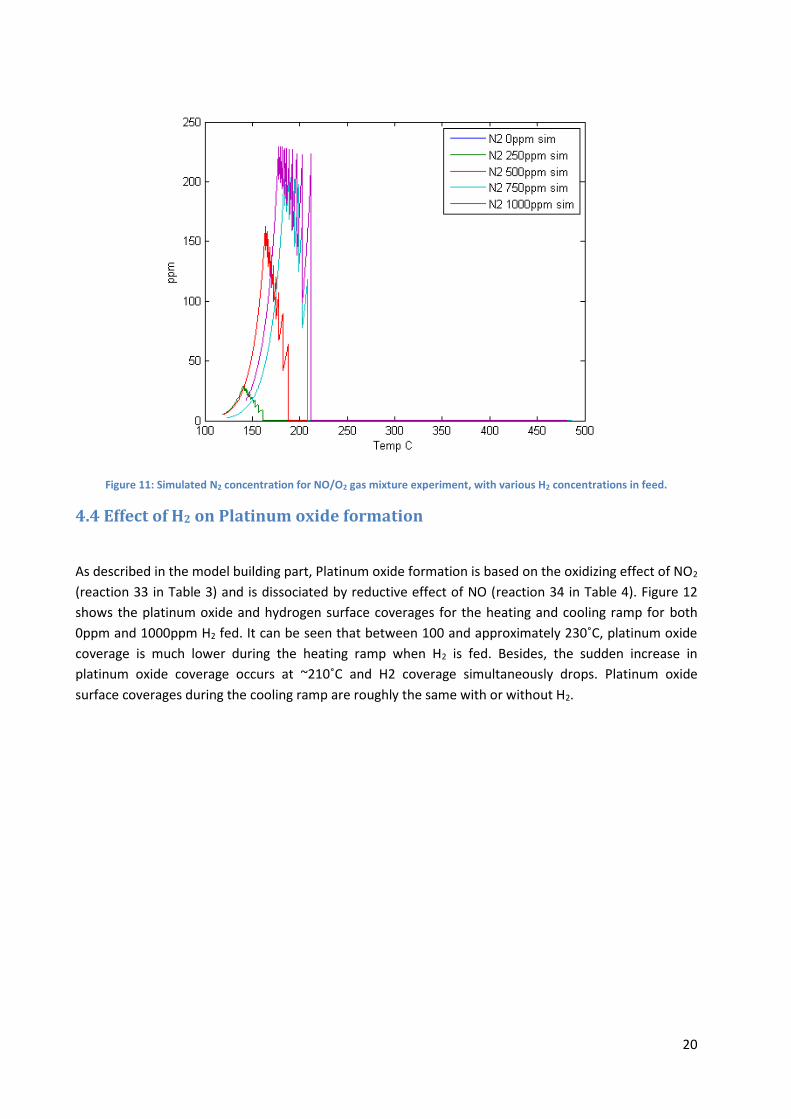
N2O formation was observed during experiments only when H2 was fed in. The corresponding simulated
results in Figure 10 show that without H2, there is no formation of N2O, however experiments show that
N2O yield increase with H2 concentration and the opposite effect is predicted by the simulation. The
reason might be that N2O is formed by reaction between NO* and N* (reaction 21 in Table 3), but N2 is
formed from reaction of adsorbed nitrogen (reaction 14). As can be seen from comparing Figure 10 and
Figure 11, with increasing H2 concentrations, the model predicts a shift in selectivity from N2O to N2.
20
Figure 11: Simulated N2 concentration for NO/O2 gas mixture experiment, with various H2 concentrations in feed.
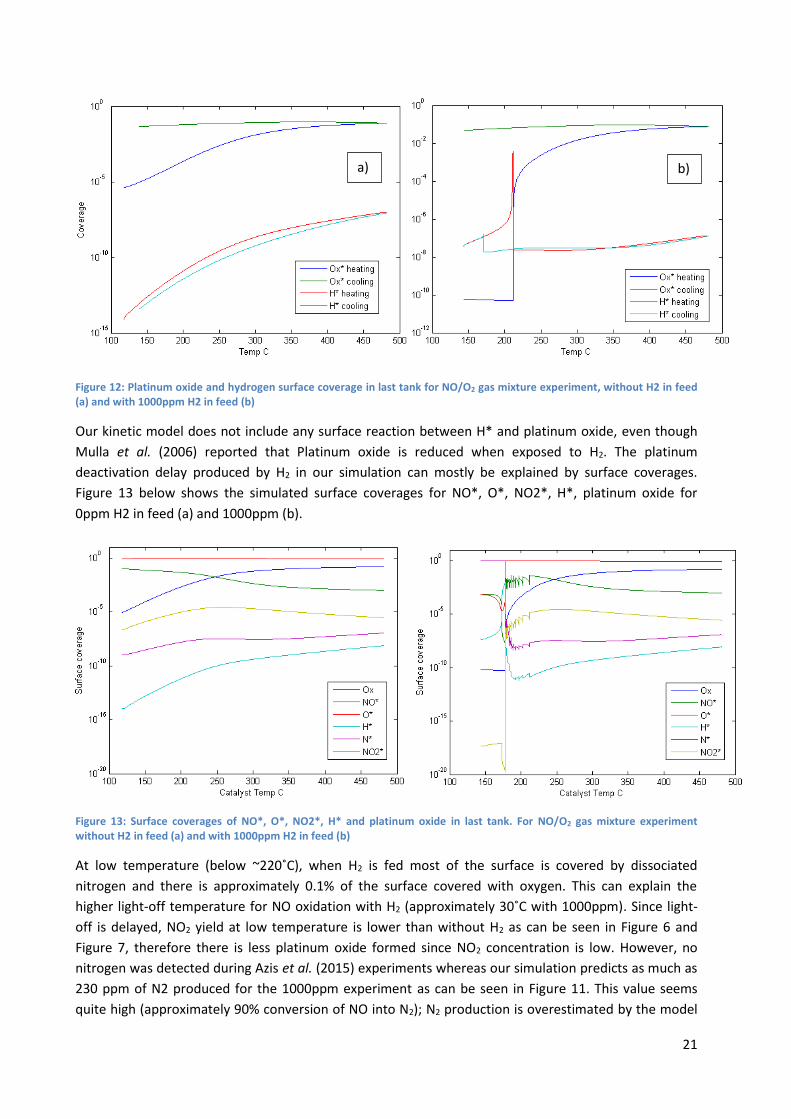
4.4 Effect of H2 on Platinum oxide formation
As described in the model building part, Platinum oxide formation is based on the oxidizing effect of NO2
(reaction 33 in Table 3) and is dissociated by reductive effect of NO (reaction 34 in Table 4). Figure 12
shows the platinum oxide and hydrogen surface coverages for the heating and cooling ramp for both
0ppm and 1000ppm H2 fed. It can be seen that between 100 and approximately 230˚C, platinum oxide
coverage is much lower during the heating ramp when H2 is fed. Besides, the sudden increase in
platinum oxide coverage occurs at ~210˚C and H2 coverage simultaneously drops. Platinum oxide
surface coverages during the cooling ramp are roughly the same with or without H2.
21
Figure 12: Platinum oxide and hydrogen surface coverage in last tank for NO/O2 gas mixture experiment, without H2 in feed (a) and with 1000ppm H2 in feed (b)
Our kinetic model does not include any surface reaction between H* and platinum oxide, even though
Mulla et al. (2006) reported that Platinum oxide is reduced when exposed to H2. The platinum
deactivation delay produced by H2 in our simulation can mostly be explained by surface coverages.
Figure 13 below shows the simulated surface coverages for NO*, O*, NO2*, H*, platinum oxide for
0ppm H2 in feed (a) and 1000ppm (b).
Figure 13: Surface coverages of NO*, O*, NO2*, H* and platinum oxide in last tank. For NO/O2 gas mixture experiment without H2 in feed (a) and with 1000ppm H2 in feed (b)
At low temperature (below ~220˚C), when H2 is fed most of the surface is covered by dissociated
nitrogen and there is approximately 0.1% of the surface covered with oxygen. This can explain the
higher light-off temperature for NO oxidation with H2 (approximately 30˚C with 1000ppm). Since light-
off is delayed, NO2 yield at low temperature is lower than without H2 as can be seen in Figure 6 and
Figure 7, therefore there is less platinum oxide formed since NO2 concentration is low. However, no
nitrogen was detected during Azis et al. (2015) experiments whereas our simulation predicts as much as
230 ppm of N2 produced for the 1000ppm experiment as can be seen in Figure 11. This value seems
quite high (approximately 90% conversion of NO into N2); N2 production is overestimated by the model
a) b)
22
which could partly explain why the light-off temperature from simulation is higher than from
experiments when H2 is fed.
Adsorbed nitrogen is principally produced by reaction 23 and 26 (Table 3), the activation energy of
reaction 26 is quite low whereas it is high for reaction 23, and therefore at low temperature reaction 26
will be very fast when H2 is fed. With high nitrogen coverages, N2O can be formed by reaction 21.
Above is mentioned the fact that the model in this thesis work does not include hydrogen reactions with
platinum oxide, however that would make sense in our model only in temperature ranges where H2 is
not completely converted. At low temperature, our model already predicts that H2 delays platinum
oxide formation, and at higher temperature, H2 is converted early on inside the reactor. This means
reaction with platinum oxide would mostly occur at the entrance of the reactor, hence implementing a
reaction between H2 and platinum oxide might not be necessary.
4.4.1 Transient NO2 yield at constant T
Figure 14 show the experimental results and simulated NO2 formation with 0ppm and 750ppm H2, for
the transient experiments as described in the experimental section 2.3. The temporal build-up of
platinum oxide is investigated here. Results are scaled within a range of 0 to 1 by dividing by the
maximum NO2 concentration signal over the time range.
Figure 14: Transient NO2 yield as a function of time, heating up from 120-230˚C with a rate 5˚C/min, then holding 1h at 230˚C, for both simulation and experiment
From the experiments it can be seen that the rate of decay in NO2 yield increases with H2, which is
observed for the simulation results too. There is approximately a decrease of 21% in NO2 yield according
23
to the simulation and -26% according to the experiment. With 750ppm, the decay is -25% for the
simulation and -30% for the experiments. The decay increase due to H2 after one hour seems to be
roughly the same for both, with a 4% increase in the decay. The fact that the simulated curves are above
the experimental ones during the holding up might be due to the fact that platinum oxide build up at
230˚C is underestimated and/or the negative effect of H2 on platinum oxide formation overestimated.
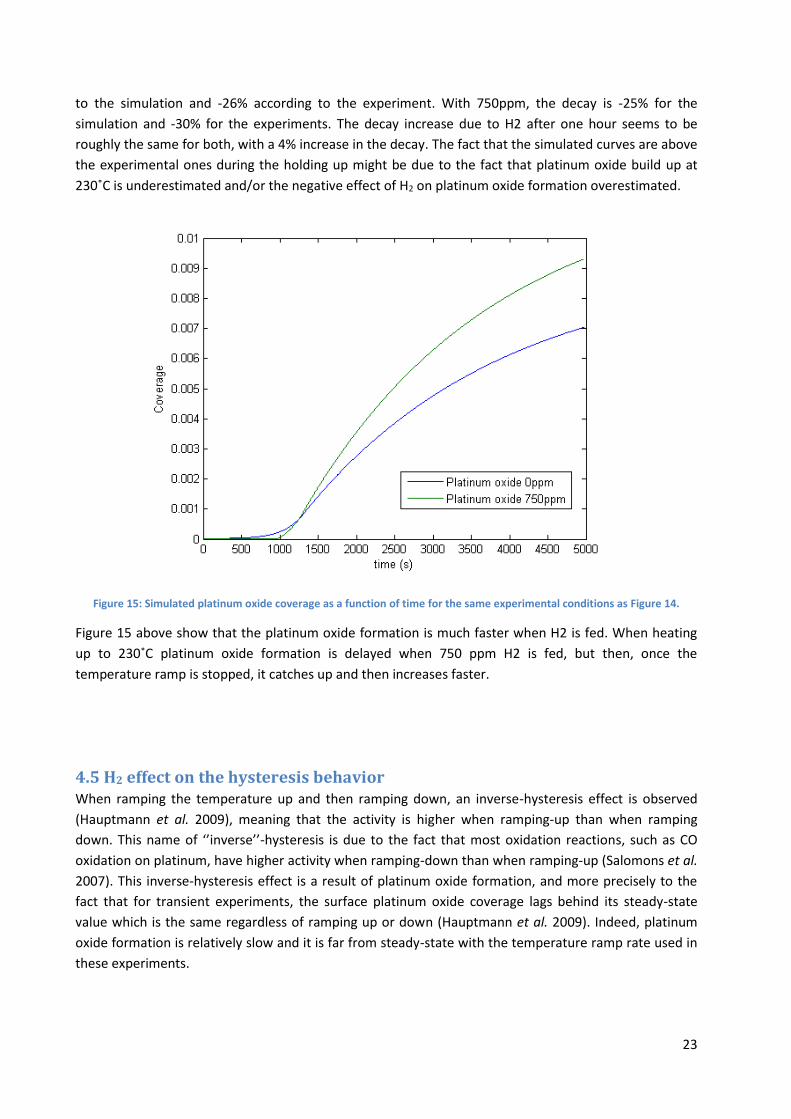
Figure 15: Simulated platinum oxide coverage as a function of time for the same experimental conditions as Figure 14.
Figure 15 above show that the platinum oxide formation is much faster when H2 is fed. When heating
up to 230˚C platinum oxide formation is delayed when 750 ppm H2 is fed, but then, once the
temperature ramp is stopped, it catches up and then increases faster.
4.5 H2 effect on the hysteresis behavior When ramping the temperature up and then ramping down, an inverse-hysteresis effect is observed
(Hauptmann et al. 2009), meaning that the activity is higher when ramping-up than when ramping
down. This name of ‘’inverse’’-hysteresis is due to the fact that most oxidation reactions, such as CO
oxidation on platinum, have higher activity when ramping-down than when ramping-up (Salomons et al.
2007). This inverse-hysteresis effect is a result of platinum oxide formation, and more precisely to the
fact that for transient experiments, the surface platinum oxide coverage lags behind its steady-state
value which is the same regardless of ramping up or down (Hauptmann et al. 2009). Indeed, platinum
oxide formation is relatively slow and it is far from steady-state with the temperature ramp rate used in
these experiments.
24
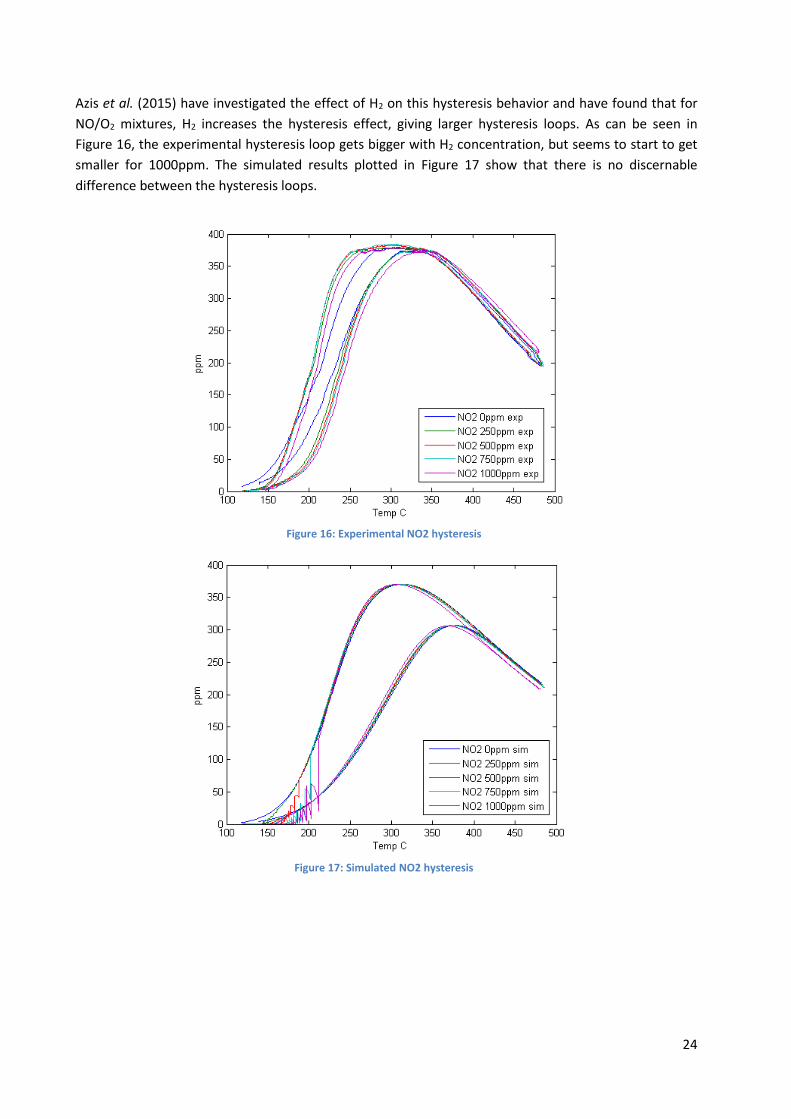
Azis et al. (2015) have investigated the effect of H2 on this hysteresis behavior and have found that for
NO/O2 mixtures, H2 increases the hysteresis effect, giving larger hysteresis loops. As can be seen in
Figure 16, the experimental hysteresis loop gets bigger with H2 concentration, but seems to start to get
smaller for 1000ppm. The simulated results plotted in Figure 17 show that there is no discernable
difference between the hysteresis loops.
Figure 16: Experimental NO2 hysteresis
Figure 17: Simulated NO2 hysteresis
25
As stated previously, the experimental curves show that the hysteresis effect increases with H2
concentration, which can be explained by the fact that at low temperature (200-300˚C), H2 hinders
platinum oxide formation, which combined with surface interaction with NO yield higher NO2. However,
at higher temperature, NO2 produced oxidize the platinum and since NO2 yield is higher with H2
concentration, there is more platinum oxide formed and thus a larger hysteresis.
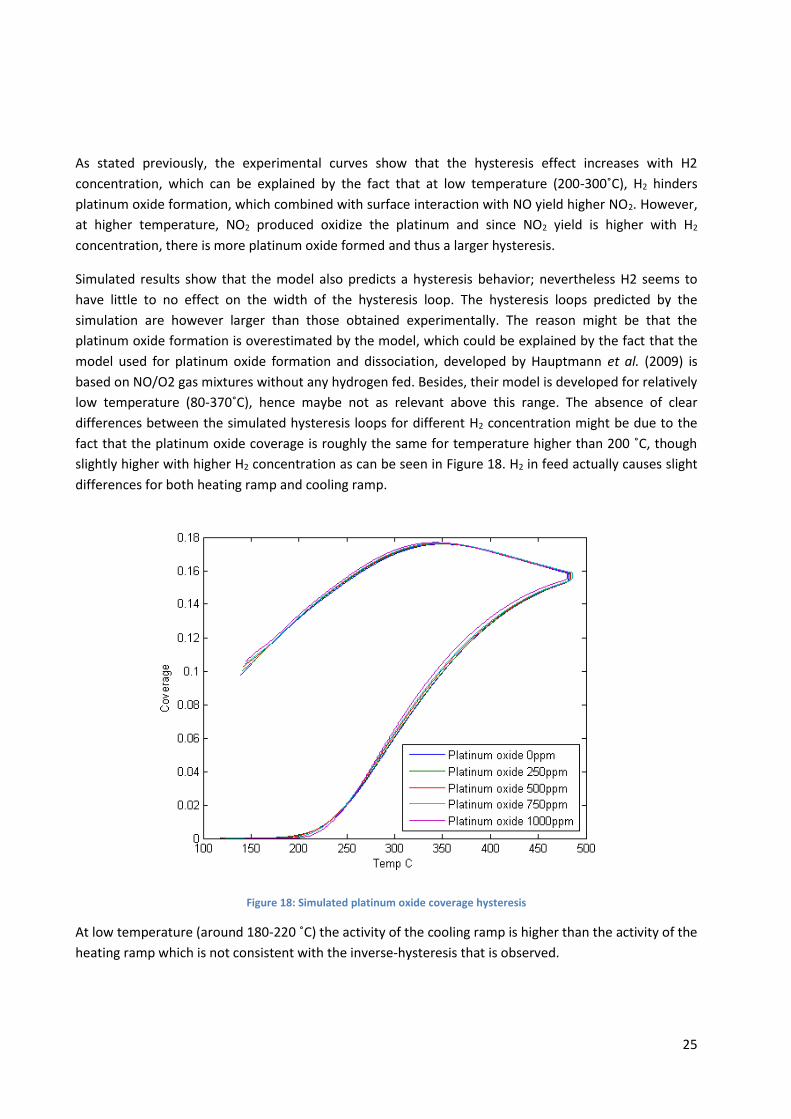
Simulated results show that the model also predicts a hysteresis behavior; nevertheless H2 seems to
have little to no effect on the width of the hysteresis loop. The hysteresis loops predicted by the
simulation are however larger than those obtained experimentally. The reason might be that the
platinum oxide formation is overestimated by the model, which could be explained by the fact that the
model used for platinum oxide formation and dissociation, developed by Hauptmann et al. (2009) is
based on NO/O2 gas mixtures without any hydrogen fed. Besides, their model is developed for relatively
low temperature (80-370˚C), hence maybe not as relevant above this range. The absence of clear
differences between the simulated hysteresis loops for different H2 concentration might be due to the
fact that the platinum oxide coverage is roughly the same for temperature higher than 200 ˚C, though
slightly higher with higher H2 concentration as can be seen in Figure 18. H2 in feed actually causes slight
differences for both heating ramp and cooling ramp.
At low temperature (around 180-220 ˚C) the activity of the cooling ramp is higher than the activity of the
heating ramp which is not consistent with the inverse-hysteresis that is observed.
26
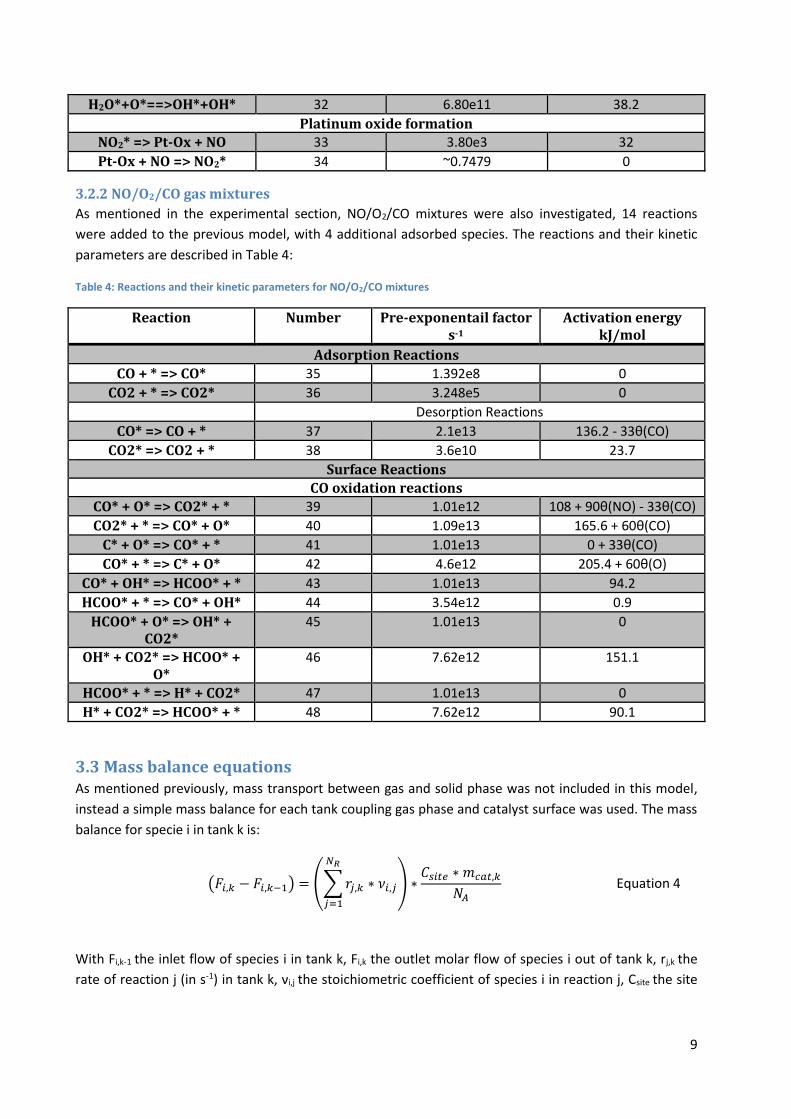
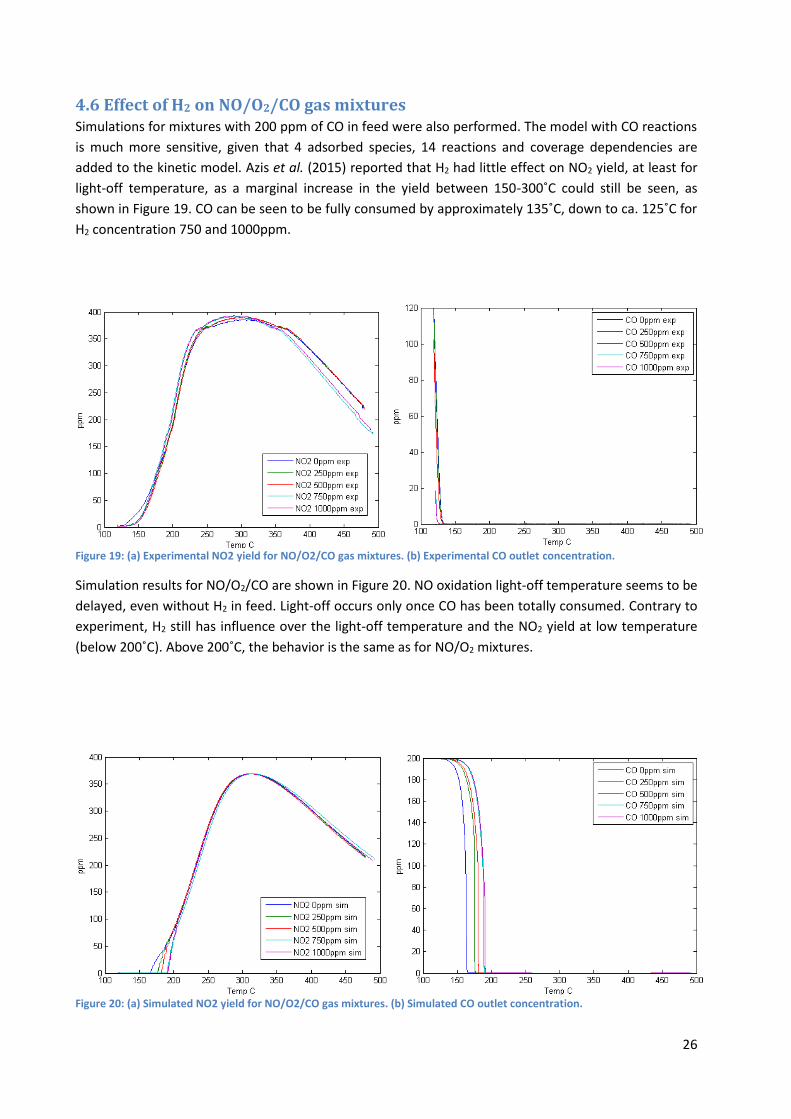
4.6 Effect of H2 on NO/O2/CO gas mixtures Simulations for mixtures with 200 ppm of CO in feed were also performed. The model with CO reactions
is much more sensitive, given that 4 adsorbed species, 14 reactions and coverage dependencies are
added to the kinetic model. Azis et al. (2015) reported that H2 had little effect on NO2 yield, at least for
light-off temperature, as a marginal increase in the yield between 150-300˚C could still be seen, as
shown in Figure 19. CO can be seen to be fully consumed by approximately 135˚C, down to ca. 125˚C for
H2 concentration 750 and 1000ppm.
Figure 19: (a) Experimental NO2 yield for NO/O2/CO gas mixtures. (b) Experimental CO outlet concentration.
Simulation results for NO/O2/CO are shown in Figure 20. NO oxidation light-off temperature seems to be
delayed, even without H2 in feed. Light-off occurs only once CO has been totally consumed. Contrary to
experiment, H2 still has influence over the light-off temperature and the NO2 yield at low temperature
(below 200˚C). Above 200˚C, the behavior is the same as for NO/O2 mixtures.
Figure 20: (a) Simulated NO2 yield for NO/O2/CO gas mixtures. (b) Simulated CO outlet concentration.
27
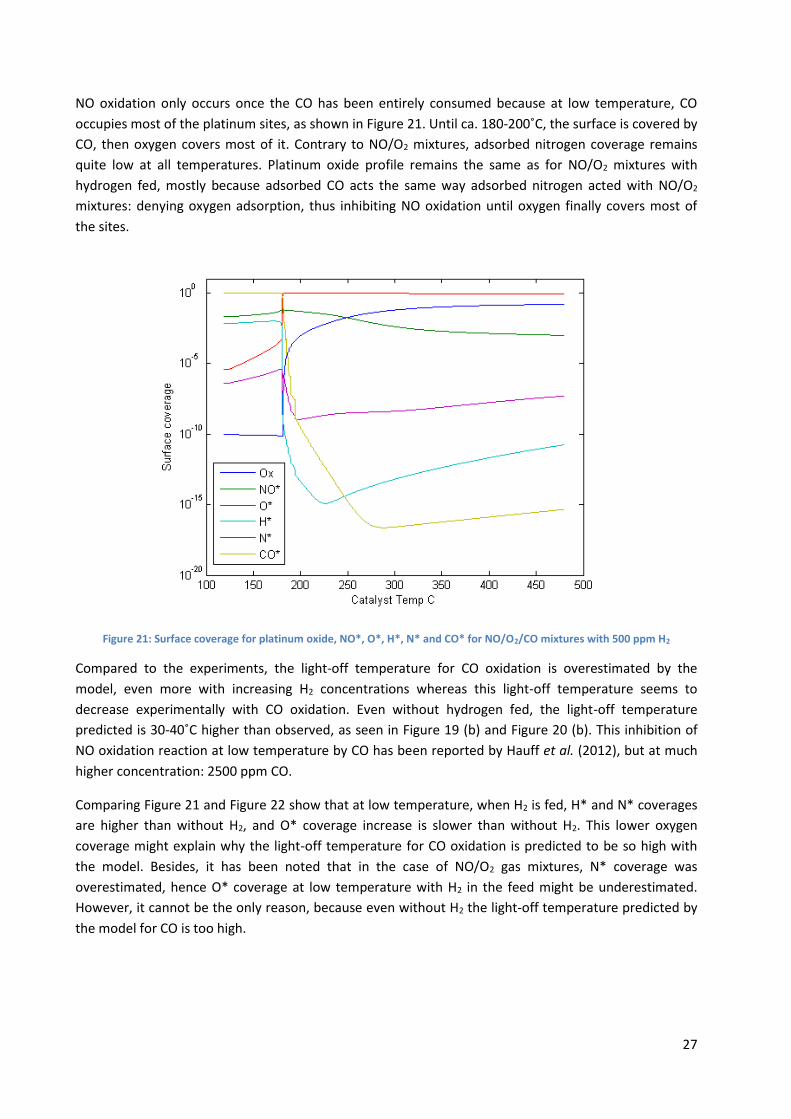
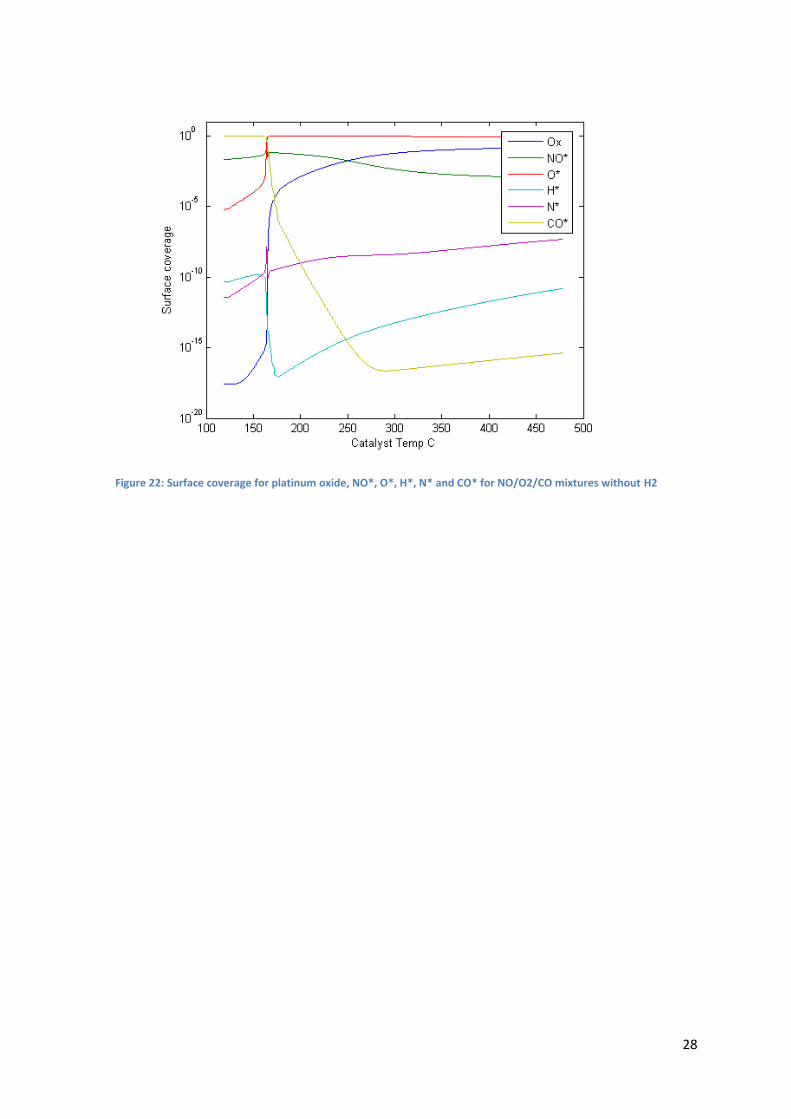
NO oxidation only occurs once the CO has been entirely consumed because at low temperature, CO
occupies most of the platinum sites, as shown in Figure 21. Until ca. 180-200˚C, the surface is covered by
CO, then oxygen covers most of it. Contrary to NO/O2 mixtures, adsorbed nitrogen coverage remains
quite low at all temperatures. Platinum oxide profile remains the same as for NO/O2 mixtures with
hydrogen fed, mostly because adsorbed CO acts the same way adsorbed nitrogen acted with NO/O2
mixtures: denying oxygen adsorption, thus inhibiting NO oxidation until oxygen finally covers most of
the sites.
Figure 21: Surface coverage for platinum oxide, NO*, O*, H*, N* and CO* for NO/O2/CO mixtures with 500 ppm H2
Compared to the experiments, the light-off temperature for CO oxidation is overestimated by the
model, even more with increasing H2 concentrations whereas this light-off temperature seems to
decrease experimentally with CO oxidation. Even without hydrogen fed, the light-off temperature
predicted is 30-40˚C higher than observed, as seen in Figure 19 (b) and Figure 20 (b). This inhibition of
NO oxidation reaction at low temperature by CO has been reported by Hauff et al. (2012), but at much
higher concentration: 2500 ppm CO.
Comparing Figure 21 and Figure 22 show that at low temperature, when H2 is fed, H* and N* coverages
are higher than without H2, and O* coverage increase is slower than without H2. This lower oxygen
coverage might explain why the light-off temperature for CO oxidation is predicted to be so high with
the model. Besides, it has been noted that in the case of NO/O2 gas mixtures, N* coverage was
overestimated, hence O* coverage at low temperature with H2 in the feed might be underestimated.
However, it cannot be the only reason, because even without H2 the light-off temperature predicted by
the model for CO is too high.
28
Figure 22: Surface coverage for platinum oxide, NO*, O*, H*, N* and CO* for NO/O2/CO mixtures without H2
29
5. Conclusion
The purpose of this thesis work was to develop a program to test an existing micro-kinetic model for
Diesel oxidation catalyst reactions, and try to see how well it fit the experiments performed by Azis et al.
(2015), in order to investigate further the effects of H2 on DOC. The model was taken from Koop and
Deutschmann (2009) and Hauptmann et al. (2009) for platinum oxidation. The model was based on a
simple tanks-in-series simulation of a single channel of the monolith, with only axial discretization of the
monolith.
From Azis et al. work (2015), this study focused mainly on the NO/O2 mixtures, and then tried to
simulate NO/O2/CO mixtures, because trying to simulate directly NO/O2/CO/C3H6 gas mixtures would
have been too complicated and difficult to troubleshoot. For NO/O2 mixtures, the micro-kinetic model
was found to simulate relatively correctly the low temperature light-off delay with increasing hydrogen.
Between 200-300˚C, H2 has no more effect on NO2 yield, and above 260˚C the decrease in NO2 yield
seen experimentally for H2 concentration of 1000ppm was not reproduced by the model. In the
thermodynamic regime (above 300˚C) NO2 simulated yield is lower with increasing H2 concentrations as
opposed to the experiments. This could be a result of an overestimated platinum oxide formation, which
also could explain the too large hysteresis loops obtained. These hysteresis loops remain roughly
constant, failing to simulate the increase in the width of the loop with increasing H2 concentration. N2O
formation was also predicted by the model, though the amount produced is much higher than
experimentally measured, which can be explained by the almost total nitrogen coverage resulting from
H2 at low temperature. This nitrogen coverage due to H2 concentration delays platinum oxide formation,
which in turn explains the higher light-off temperature for NO2 yield. However, this delay being too high
might indicate that the effect of H2 on platinum oxide is overestimated in our model.
The promotional effect of H2 on NO/O2/CO mixtures was also investigated, though not as thoroughly as
for NO/O2 gas mixtures. It was found that the model predict much higher light-off temperature for both
CO and NO oxidation than observed experimentally. Besides, it fails to simulate the promotional effect
of H2 on CO oxidation, actually predicting the opposite: a negative effect of H2 on CO light-off
temperature. Platinum oxide formation during the TPR was found to be unchanged by the addition of
200 ppm of CO.
30
6. Recommendations for future work
It is important to mention again the fact that a model from literature (Koop and Deutschmann 2009,
Hauptmann et al. 2009) was tested, but no parameter fitting was performed, which would have to be
done to fit the experiment better. Indeed, taking a model developed to fit other experimental
conditions conducted by different people with different equipment is bound to show at some point
deviations from the set of experiment used in this thesis work. Besides, the model was kept as simple as
possible; therefore its ability to represent reality is questionable. Future work on this model should
include propene reactions to see how well they simulate NO/O2/CO/C3H6 gas mixtures. Adding platinum
oxide reactions with H2 and O2 might also be interesting, though the model already seems to
overestimate both platinum oxide formation and the retarding effect of hydrogen. Finally, a more
realistic model can be achieved by including mass transport, radial catalyst discretization and a more
complex heat balance.
31
Acknowledgements
My gratitude goes to Derek Creaser, my supervisor, for his valuable help throughout every step of this
thesis work. His advises in the choice of the model, the coding and the analysis of the results was of
great importance and I am thankful for his constant support and availability. I would also like to thank
Muhammad Mufti Azis for letting me use his experimental data and helping implement it in the
program, and for allowing me to use his picture as the front page of this thesis work. Special thanks to
all my colleagues in the Master student’s room for all the good time spent there, these relaxing
moments allowed me to be more focused on my thesis. Finally, I want to give a general thank to all the
people I have met during my stay in Sweden, who turned this Erasmus year into the best experience of
my life.
32
References
Auvray, X. (2013). Fundamental studies of catalytic systems for diesel emission control, Chalmers University of Technology. AZIS, M. M. (2015). "Experimental and kinetic studies of H2 effect on lean exhaust aftertreatment processes: HC-SCR and DOC." Després, J., § (2004). "Catalytic oxidation of nitrogen monoxide over Pt/SiO2." Applied Catalysis B: Environmental 50(2): 73-82. Fogler, H. S. (2006). Elements of Chemical Reaction Engineering, Prentice Hall PTR. Fuglestvedt, J., et al. (2008). "Climate forcing from the transport sectors." Proceedings of the National Academy of Sciences 105(2): 454-458. Granger, P. and V. I. Parvulescu (2011). "Catalytic NO x abatement systems for mobile sources: from three-way to lean burn after-treatment technologies." Chemical reviews 111(5): 3155-3207. Hauff, K., et al. (2012). "Platinum oxide formation and reduction during NO oxidation on a diesel oxidation catalyst–Experimental results." Applied Catalysis B: Environmental 123: 107-116. Hauptmann, W., et al. (2007). "Global kinetic models for the oxidation of NO on platinum under lean conditions." Topics in Catalysis 42-43(1-4): 157-160. Hauptmann, W., et al. (2009). "Inverse hysteresis during the NO oxidation on Pt under lean conditions." Applied Catalysis B: Environmental 93(1–2): 22-29. Herreros, J. M., et al. (2014). "Enhancing the low temperature oxidation performance over a Pt and a Pt–Pd diesel oxidation catalyst." Applied Catalysis B: Environmental 147(0): 835-841. Koop, J. and O. Deutschmann (2009). "Detailed surface reaction mechanism for Pt-catalyzed abatement of automotive exhaust gases." Applied Catalysis B: Environmental 91(1–2): 47-58. Kumar, A., et al. (2011). "Microkinetic modeling of the NO-H2 system on Pt/Al2O3 catalyst using temporal analysis of products." Journal of Catalysis 279(1): 12-26. Li, X., et al. (2003). "A Study on the Properties and Mechanisms for NO x Storage Over Pt/BaAl2O4-Al2O3 Catalyst." Topics in Catalysis 22(1-2): 111-115. Mahzoul, H., et al. (1999). "Experimental and mechanistic study of NOx adsorption over NOx trap catalysts." Applied Catalysis B: Environmental 20(1): 47-55. Mulla, S. S., et al. (2005). "NO2 inhibits the catalytic reaction of NO and O2 over Pt." Catalysis Letters 100(3-4): 267-270. Mulla, S. S., et al. (2006). "Reaction of NO and O2 to NO2 on Pt: Kinetics and catalyst deactivation." Journal of Catalysis 241(2): 389-399. Olsson, L., et al. (2001). "A Kinetic Study of NO Oxidation and NOx Storage on Pt/Al2O3 and Pt/BaO/Al2O3." The Journal of Physical Chemistry B 105(29): 6895-6906.
33
Olsson, L. and E. Fridell (2002). "The Influence of Pt Oxide Formation and Pt Dispersion on the Reactions NO2⇔NO+1/2 O2 over Pt/Al2O3 and Pt/BaO/Al2O3." Journal of Catalysis 210(2): 340-353. Olsson, L., et al. (2005). "Global kinetic model for lean NO x traps." Industrial & engineering chemistry research 44(9): 3021-3032.
Rankovic, N., et al. (2011). "Kinetic Modeling Study of the Oxidation of Carbon Monoxide–Hydrogen
Mixtures over Pt/Al2O3 and Rh/Al2O3 Catalysts." The Journal of Physical Chemistry C 115(41): 20225-
20236.
Salomons, S., et al. (2007). "On the use of mechanistic CO oxidation models with a platinum monolith catalyst." Applied Catalysis B: Environmental 70(1–4): 305-313. Thybaut, J. W. and G. B. Marin (2002). Kinetics of Catalyzed Reactions—Heterogeneous. Encyclopedia of Catalysis, John Wiley & Sons, Inc. Wang, H.-F., et al. (2009). "NO Oxidation on Platinum Group Metals Oxides: First Principles Calculations Combined with Microkinetic Analysis." The Journal of Physical Chemistry C 113(43): 18746-18752.
34
Appendices
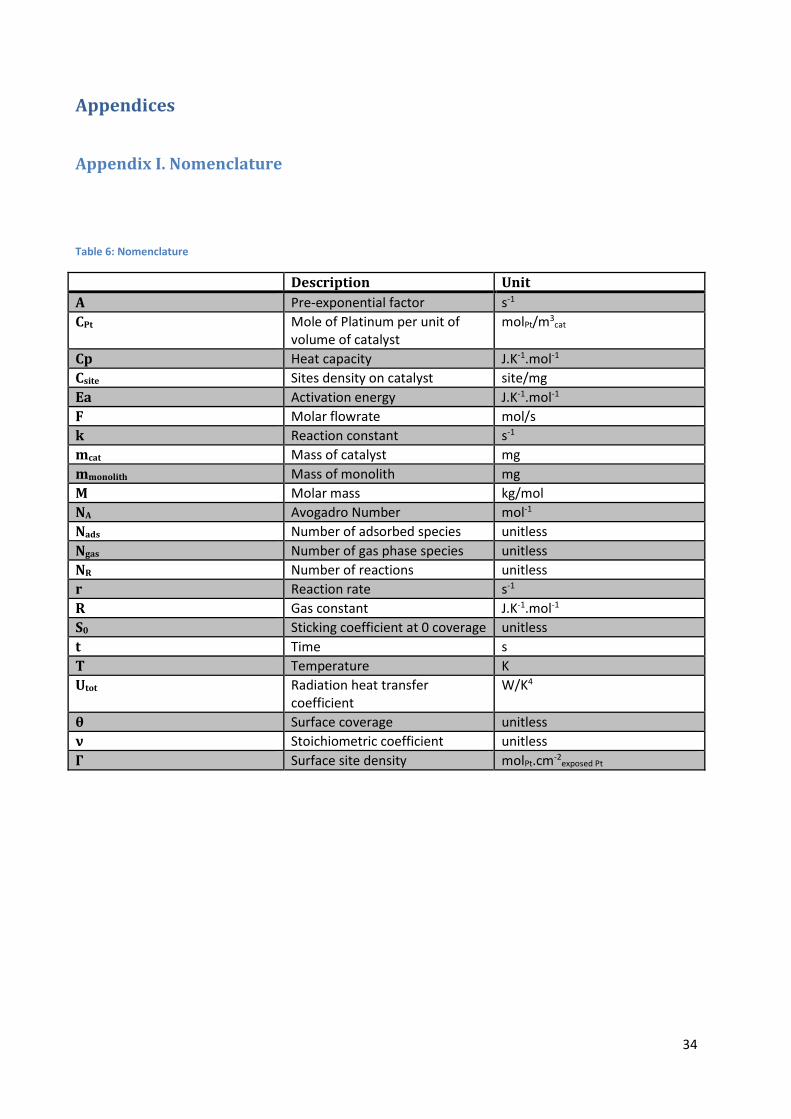
Appendix I. Nomenclature
Table 6: Nomenclature
Description Unit
A Pre-exponential factor s-1
CPt Mole of Platinum per unit of volume of catalyst
molPt/m3cat
Cp Heat capacity J.K-1.mol-1
Csite Sites density on catalyst site/mg
Ea Activation energy J.K-1.mol-1
F Molar flowrate mol/s
k Reaction constant s-1
mcat Mass of catalyst mg
mmonolith Mass of monolith mg
M Molar mass kg/mol
NA Avogadro Number mol-1
Nads Number of adsorbed species unitless
Ngas Number of gas phase species unitless
NR Number of reactions unitless
r Reaction rate s-1
R Gas constant J.K-1.mol-1
S0 Sticking coefficient at 0 coverage unitless
t Time s
T Temperature K
Utot Radiation heat transfer coefficient
W/K4
θ Surface coverage unitless
ν Stoichiometric coefficient unitless
Γ Surface site density molPt.cm-2exposed Pt
35
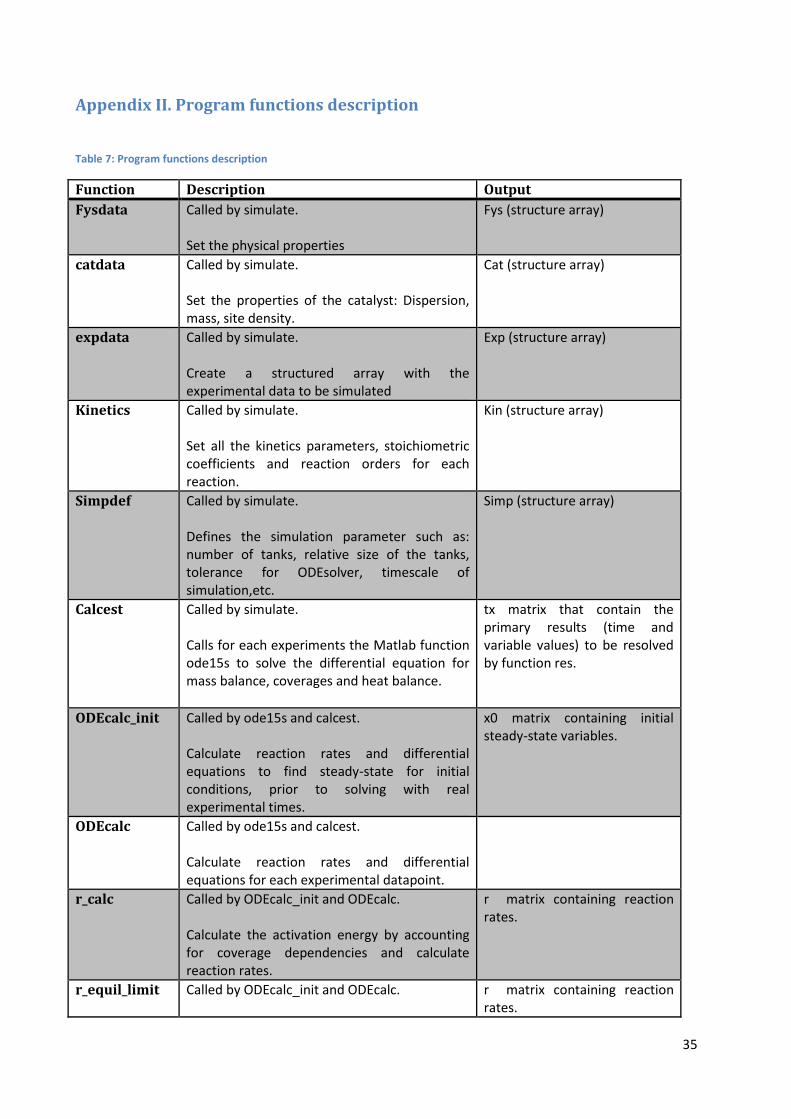
Appendix II. Program functions description
Table 7: Program functions description
Function Description Output
Fysdata Called by simulate. Set the physical properties
Fys (structure array)
catdata Called by simulate. Set the properties of the catalyst: Dispersion, mass, site density.
Cat (structure array)
expdata Called by simulate. Create a structured array with the experimental data to be simulated
Exp (structure array)
Kinetics Called by simulate. Set all the kinetics parameters, stoichiometric coefficients and reaction orders for each reaction.
Kin (structure array)
Simpdef Called by simulate. Defines the simulation parameter such as: number of tanks, relative size of the tanks, tolerance for ODEsolver, timescale of simulation,etc.
Simp (structure array)
Calcest Called by simulate. Calls for each experiments the Matlab function ode15s to solve the differential equation for mass balance, coverages and heat balance.
tx matrix that contain the primary results (time and variable values) to be resolved by function res.
ODEcalc_init Called by ode15s and calcest. Calculate reaction rates and differential equations to find steady-state for initial conditions, prior to solving with real experimental times.
ODEcalc Called by ode15s and calcest. Calculate reaction rates and differential equations for each experimental datapoint.
r_calc Called by ODEcalc_init and ODEcalc. Calculate the activation energy by accounting for coverage dependencies and calculate reaction rates.
r matrix containing reaction rates.
r_equil_limit Called by ODEcalc_init and ODEcalc.
r matrix containing reaction rates.
36
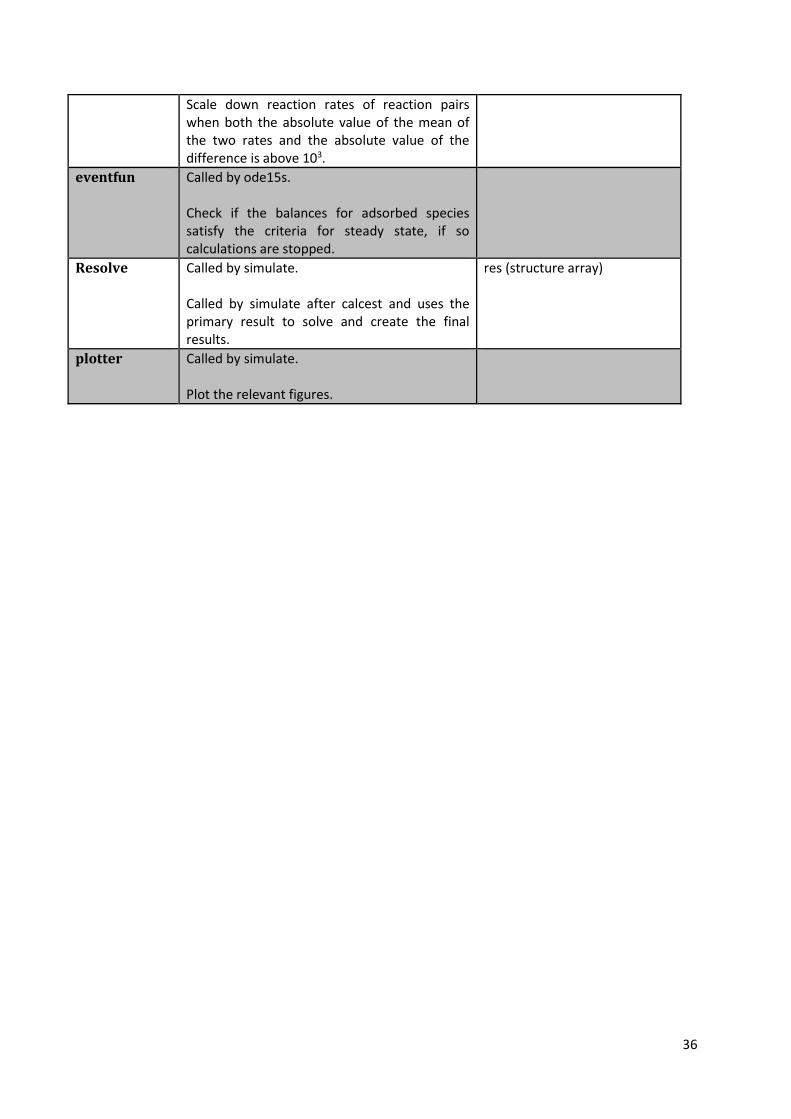
Scale down reaction rates of reaction pairs when both the absolute value of the mean of the two rates and the absolute value of the difference is above 103.
eventfun Called by ode15s. Check if the balances for adsorbed species satisfy the criteria for steady state, if so calculations are stopped.
Resolve Called by simulate. Called by simulate after calcest and uses the primary result to solve and create the final results.
res (structure array)
plotter Called by simulate. Plot the relevant figures.