Effects of mixing depth, turbulent diffusion and nutrient enrichment on enclosed marine plankton communities Thomas J. Kunz Dissertation der Fakultät für Biologie der Ludwig-Maximilians-Universität München Oktober 2005
Transcript
Effects of mixing depth, turbulent diffusion and nutrient enrichment on enclosed marine
plankton communities
Thomas J. Kunz Dissertation der Fakultät für Biologie der Ludwig-Maximilians-Universität München Oktober 2005
Erstgutachter: Prof. Dr. Sebastian Diehl
Zweitgutachter: PD Dr. Herwig Stibor
Tag der mündlichen Prüfung: 21.11.2005
Table of contents 1
Table of contents
Table of contents ........................................................................................................................................1 Abstract ......................................................................................................................................................3 General introduction...................................................................................................................................5 Summaries of the articles .........................................................................................................................11 Article 1 Effects of mixing depth and nitrogen enrichment on marine zooplankton, phytoplankton, light and mineral nutrients ................................................................................................................................12 Article 2 Response of auto-, mixo- and heterotrophic marine plankton to nitrogen enrichment and a mixing-depth gradient ..............................................................................................................................13 Article 3 Effects of water column depth and turbulent diffusion on an enclosed North Atlantic plankton community................................................................................................................................................15
Synopsis ...................................................................................................................................................17 References ................................................................................................................................................18 Articles .....................................................................................................................................................20 Article 1 Effects of mixing depth and nitrogen enrichment on marine zooplankton, phytoplankton, light and mineral nutrients ................................................................................................................................21 Introduction ..............................................................................................................................................21 Material and Methods...............................................................................................................................23
Study Site..............................................................................................................................23 Experimental set-up ..............................................................................................................23 Sampling and laboratory analyses ........................................................................................24 Calculation of seston production and loss rates....................................................................24 Microplankton.......................................................................................................................24 Mesozooplankton..................................................................................................................25 Data analysis .........................................................................................................................25
Results ......................................................................................................................................................26 Light and nutrients ................................................................................................................26 Seston and phytoplankton.....................................................................................................26 Zooplankton..........................................................................................................................26
Discussion ................................................................................................................................................32 Limiting resources ................................................................................................................32 Patterns in algal biomass.......................................................................................................32 Patterns in zooplankton biomass...........................................................................................34
Article 2 Responses of auto-, mixo- and heterotrophic marine plankton to nitrogen enrichment and a mixing-depth gradient ..............................................................................................................................40 Introduction ..............................................................................................................................................40 Material and Methods...............................................................................................................................42
Experimental design and study site ......................................................................................42 Sampling and laboratory analyses ........................................................................................43 Data analysis .........................................................................................................................45
Results and Discussion.............................................................................................................................45 Plankton nutritional mode vs. mixing depth and nutrient enrichment ..................................45
Article 3 Effects of water column depth and turbulent diffusion on an enclosed North Atlantic plankton community................................................................................................................................................60
Introduction…………………………………………………………………………...………………..60 Material and Methods………………………………………………………………………………….62
Experimental design………………………………………………………………………62 Measurement of mixing intensity…………………………………………………………63 Sampling and laboratory analyses………………………………………………………...63 Data analysis……………………………………………………………………………...64
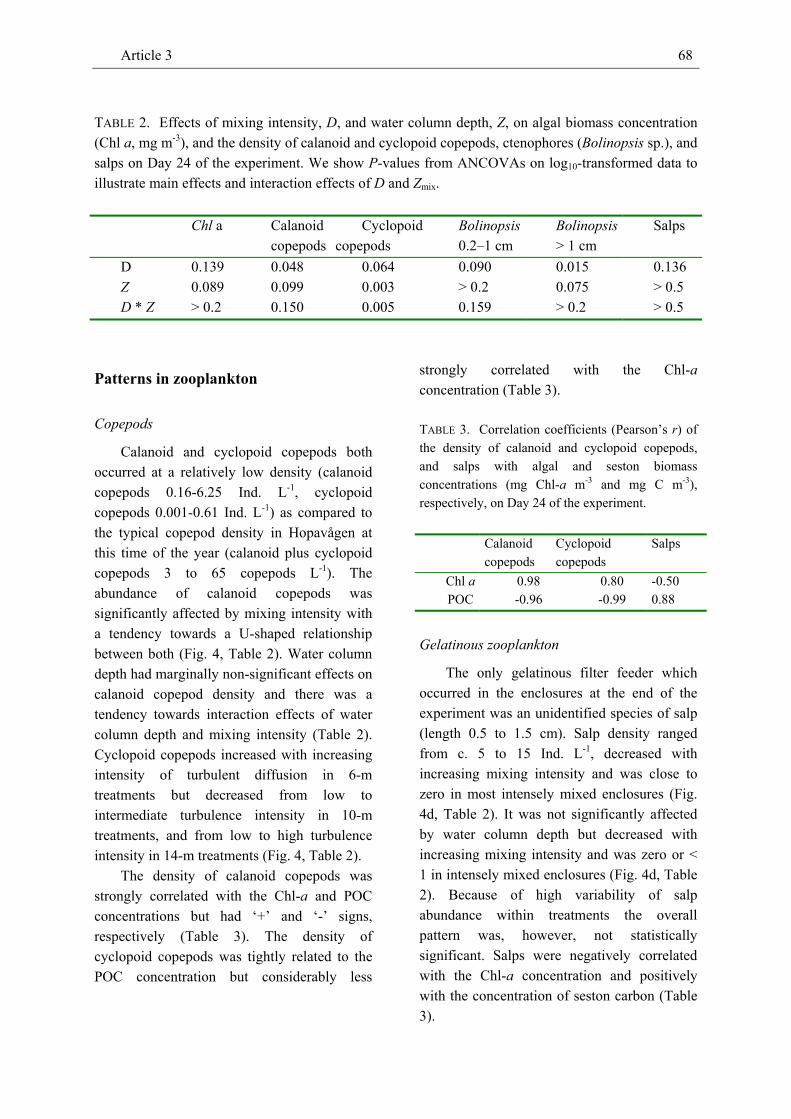
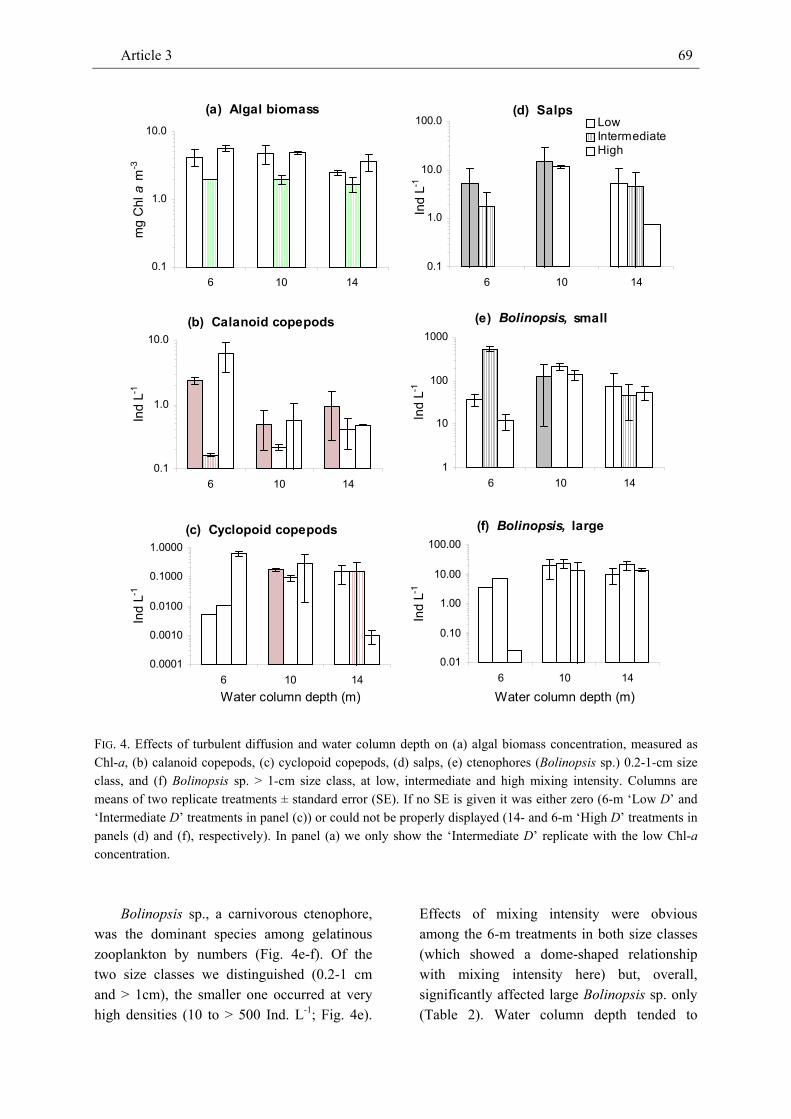
Results…………………………………………………………………………………………….……65 Light and mineral nitrogen………………………………………………………………..65 Algal biomass patterns…………………………………………………………………....65 Patterns in zooplankton…………………………………………………………………...68
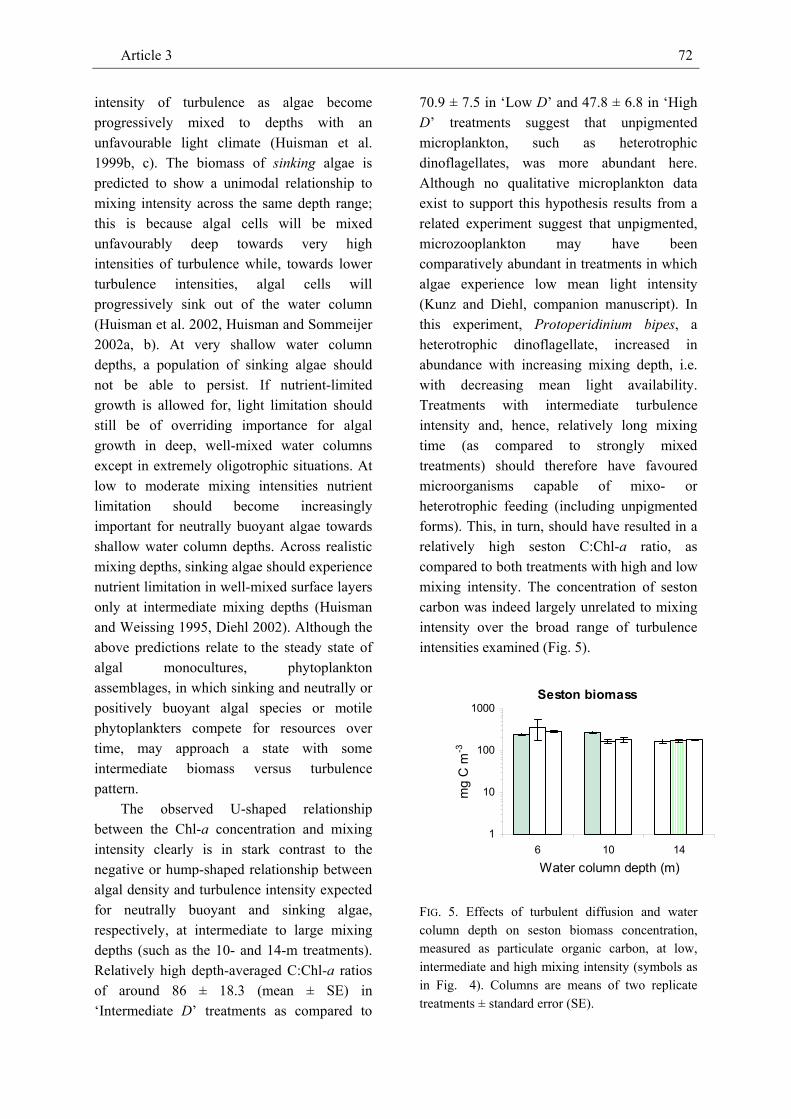
Discussion………………………………………………………………………………………...........70 Vertical distribution of phytoplankton and limiting resources………………………...…70 Effects on algal and herbivore density, and phytoplankton-zooplankton interactions…...71 Effects on herbivores, predators and predator-prey interactions in the plankton……...…73
Depth of the surface layer of oceans and lakes, and the intensity of turbulent diffusion therein is increasingly recognized to play a fundamental role for phytoplankton production. Both parameters vary considerably with latitude, proximity to the coast, and seasonally within regions. Increasing mixing depth negatively affects the mean light available to planktonic algae, and the sedimentation loss rates of sinking phytoplankton, resulting in an overall decrease of phytoplankton growth with increasing mixing depth. Nutrient enrichment positively affects phytoplankton growth and nutrient availability. According to a recently developed framework of reaction-advection-diffusion models the effects which depth and intensity of vertical mixing within the water column have on phytoplankton biomass will depend on the sinking characteristics of algal species. However, except for nutrient enrichment, effects of these parameters on marine plankton communities have received little or no experimental investigation. In lakes, expectations concerning effects of the vertical extent of the mixed surface layer on phytoplankton biomass and resource availability have largely been corroborated both experimentally and in field surveys. Because of the predicted profound effects of mixing depth and intensity on phytoplankton production impacts on higher trophic levels should also be expected.
I explored effects of mixing depth and intensity, and of nutrient enrichment on the concentration and vertical distribution of phytoplankton and zooplankton biomass, community composition, and the availability of limiting resources by means of enclosure experiments in a sheltered fjord situated at the central Norwegian coast. In one experiment I investigated effects of mixing depth and nutrient enrichment on zooplankton, phytoplankton, and the abiotic resources of the latter. I enclosed the 100-µm filtered coastal North Atlantic plankton community into large, cylindrical plastic bags ranging in depth from 1.5 to 12 m. Enclosures were mixed to the bottom; each mixing depth was examined at two total nitrogen concentrations (ambient and high). Increasing mixing depth negatively affected light availability but positively affected nutrient availability in the water column. Nitrogen enrichment did not have major negative effects on the light climate in the experimental treatments and a considerable amount of the added nutrients remained dissolved. The concentrations of Chl a, seston carbon, the biomass concentrations of mesozooplankton (copepods, appendicularians) and total zooplankton, but not of phyto- and protozooplankton were significantly negatively affected by mixing depth. The decay in mean light intensity with increasing mixing depth seemed to favour different nutritional strategies in dinoflagellates. This mechanism may account for the discrepancy of the relationships between the Chl-a and seston-carbon concentrations and mixing depth on the one hand, and phytoplankton biomass concentration and mixing depth on the other hand. Nitrogen enrichment positively affected the concentrations of Chl a, seston carbon, overall biomasses of phyto-, micro- and mesozooplankton, and the majority of algal groups and mesozooplankters. In a second experiment I investigated effects of the intensity of turbulent diffusion and water column depth on the biomass and density of phyto- and zooplankton, respectively, and on the vertical distribution of the Chl-a and dissolved mineral nitrogen concentrations. I enclosed the coastal North Atlantic plankton community into cylindrical plastic bags and varied turbulence across a broad range of intensities (low, intermediate and high; vertical eddy diffusivity ~ 3 to 120 cm² sec-1) and at three water column depths (6, 10 and 14 m). The results support predictions of the reaction-advection-diffusion model framework of light-limited phytoplankton population growth in that low intensity of turbulence results in steep vertical gradients of the phytoplankton concentration with the latter peaking close to the water surface; in line with expectations, intermediate and high intensities of turbulence resulted in largely homogeneous vertical profiles of the Chl-a concentration. The vertical distribution of the concentration of the limiting
Abstract 4
nutrient, dissolved mineral nitrogen, did not show any significant vertical trend under turbulent mixing but was inverse to the Chl-a concentration of algal biomass in situations with low turbulent diffusion. Intermediate levels of turbulence resulted in smaller algal blooms (in terms of chlorophyll concentration) than both high and very low intensities of mixing, likely because the low mean light intensity associated with long mixing time at intermediate turbulence intensity favoured microzooplankton. Mesozooplankton density displayed different responses to mixing intensity: the density of crustacean grazers (calanoid copepods) appeared to be governed by food availability and predation but not by direct effects of turbulent diffusion intensity. Gelatinous grazers (salps) tended to decrease, and gelatinous predators of copepods (ctenophores) tended to be unimodally related to mixing intensity across water column depth. These findings indicate that turbulence may considerably affect the density of filter-feeding, gelatinous zooplankton and of ambush-feeding, predatory zooplankton and support the paradigm of a dome-shaped relationship between secondary production and turbulence intensity in the water column.
The experiments show that the vertical extent and the intensity of turbulent mixing in the surface layer of oceans plays a key role for phytoplankton and zooplankton biomass and community composition, the resources limiting phytoplankton, the favoured nutritional mode of microplankton and that effects propagate up the food chain. The results confirm that the biophysical mechanisms assumed to govern phytoplankton dynamics do operate in principal but indicate that the diversity of nutritional modes in a natural plankton community may produce patterns of algal biomass which depart considerably from the expectations of a recently developed model framework.
General Introduction 5
General Introduction
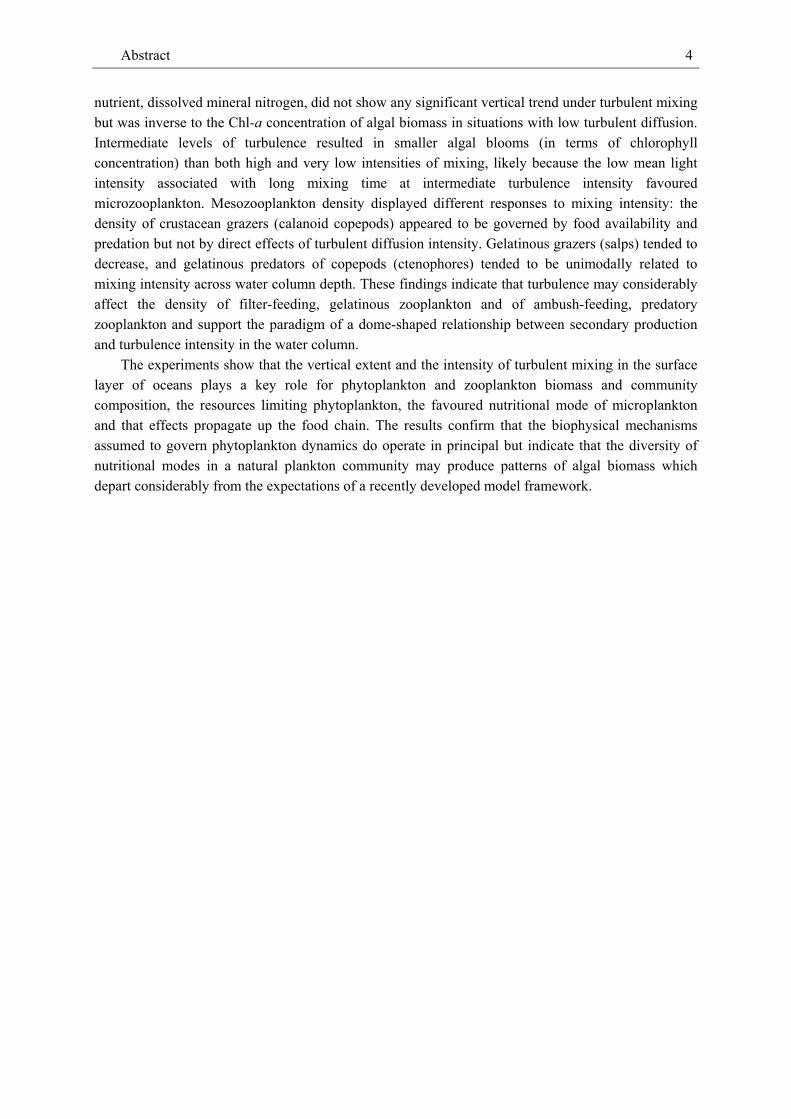
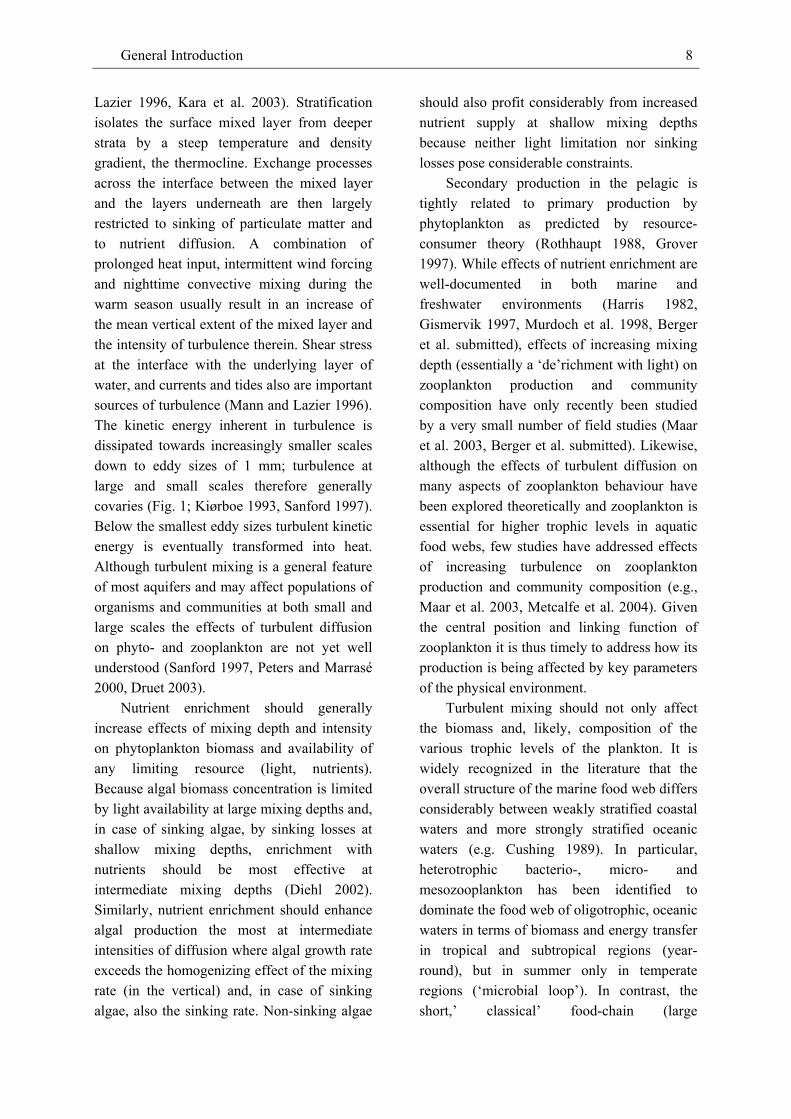
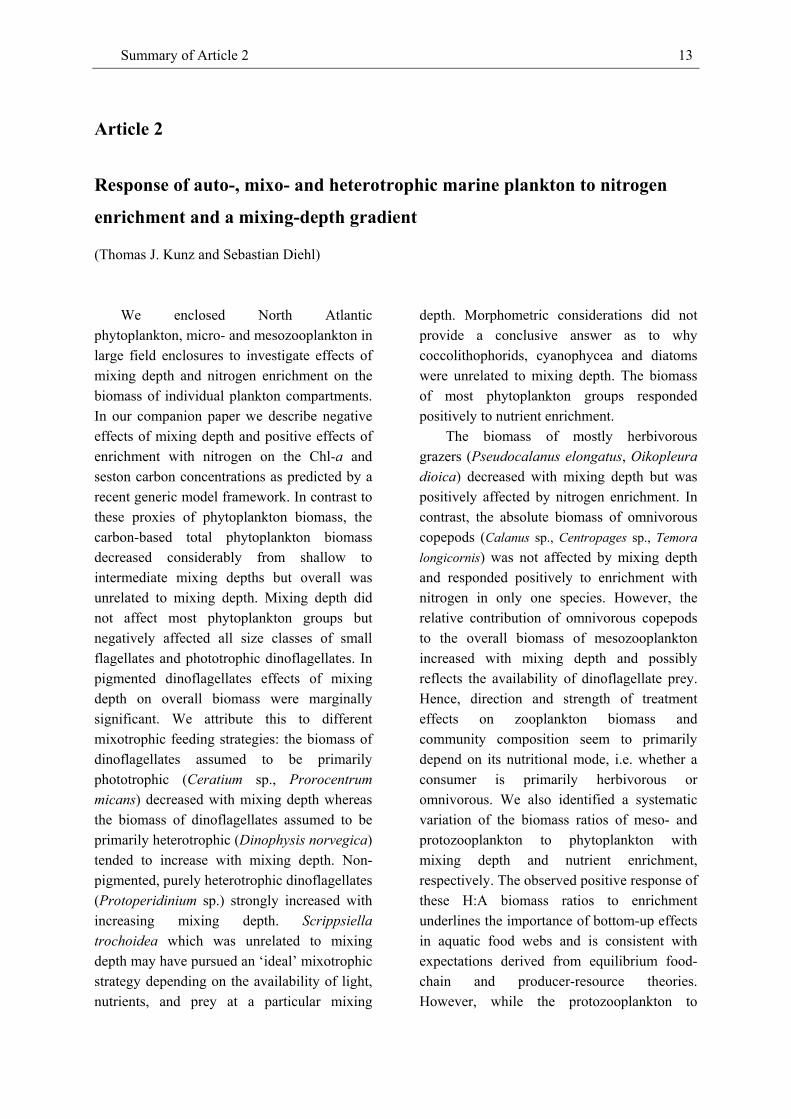
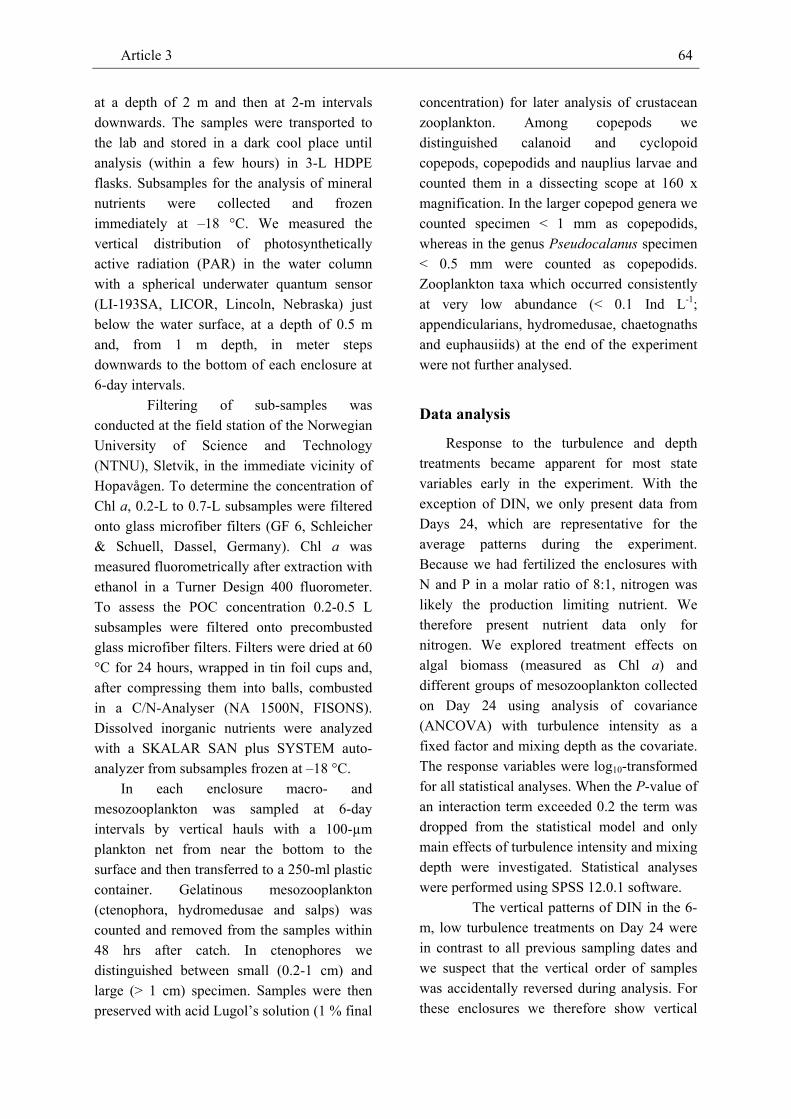
Aquatic primary production by phytoplankton largely occurs in the well-lit surface layer of oceans and lakes and is fundamentally important to most heterotrophic organisms in the pelagic food web, from heterotrophic bacteria to ciliates, zooplankton, and fish. Phytoplankton cells depend on light and mineral nutrients for growth, reproduction and survival. Light is, however, absorbed by water molecules and dissolved organic or suspended inorganic substances (background attenuation) and therefore exhibits a pronounced vertical gradient in the water column (Fig. 1; Kirk 1994). Plankton algae which are largely moved passively should thus experience an average light intensity in a well-mixed surface layer, while in an unstratified, relatively quiescent water column the light availability to phytoplankton cells depends on
their vertical position (Fig. 1; Huisman and Weissing 1995, Huisman et al. 1999, Diehl 2002, Huisman et al. 2002). Both local and mixing-depth averaged algal production should therefore decrease with increasing water column depth and mixing depth, respectively. Within a mixed layer, phytoplankton should also experience an average nutrient concentration because dissolved nutrients will largely be homogeneously distributed. In contrast, in a quiescent surface layer the availability to phytoplankton of both light and nutrients should be strongly affected by the vertical position of a cell in the water column (Klausmeier and Litchman 2001). Gravity negatively affects entrainment of algal cells resulting in sinking losses; however, cell density and morphology may counteract sinking (Reynolds 1984, Harris 1986).
I0
Iout
Sinking losses
Sinking losses
Zmix
Sinking losses
General Introduction 6
Fig. 1 (overleaf) Physical processes in the pelagic. Light enters the water at the surface with incident light intensity I0 and decays exponentially over depth. The mean light intensity experienced by phtyoplankton therefore decreases with increasing depth (Zmix) of a turbulently mixed surface layer while losses of sinking algae decrease (left panel). In a relatively quiescent water column light availability and entrainment of plankton algae will depend more on algal characteristics (right panel). Theoretical models suggest that entrainment of algal cells is governed by hydrophysical properties of their environment, in particular the vertical extent and the intensity of turbulent diffusion in the water column (Fig. 1, 2; Riley et al. 1949, Okubo 1980, Diehl 2002). A number of field experiments have confirmed the expected positive effects of increasing mixing depth on the entrainment of lake phytoplankton (Reynolds 1986, Visser 1996, Diehl et al. 2002). Likewise lab and field
experiments and lake surveys (Huisman 1999, Diehl et al. 2002, Soto 2002, Kunz and Diehl 2003) and investigations in the marine pelagic (e.g., Mitchell and Holm-Hansen 1991, Sakshaug et al. 1991, Helbing et al. 1995) have found a negative correlation between proxies of phytoplankton biomass concentration and mixing depth. Nevertheless, no experiments addressing effects of mixing depth seem to have been conducted in the marine environment to date.
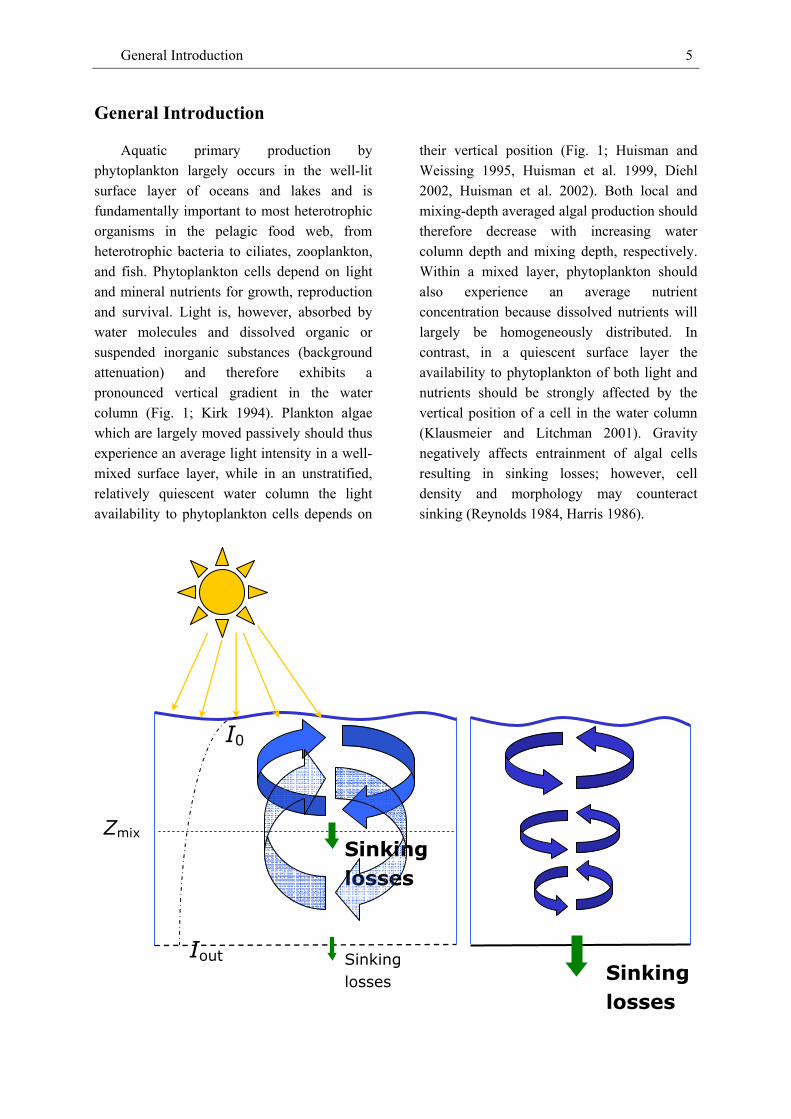
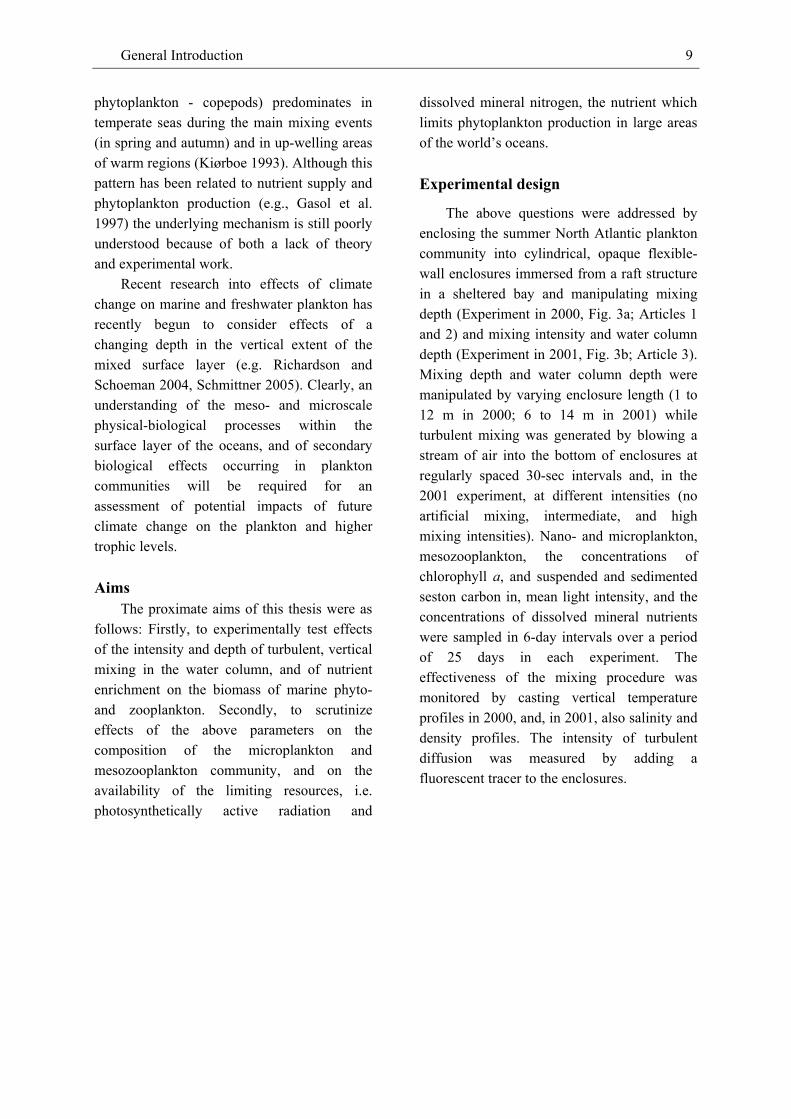
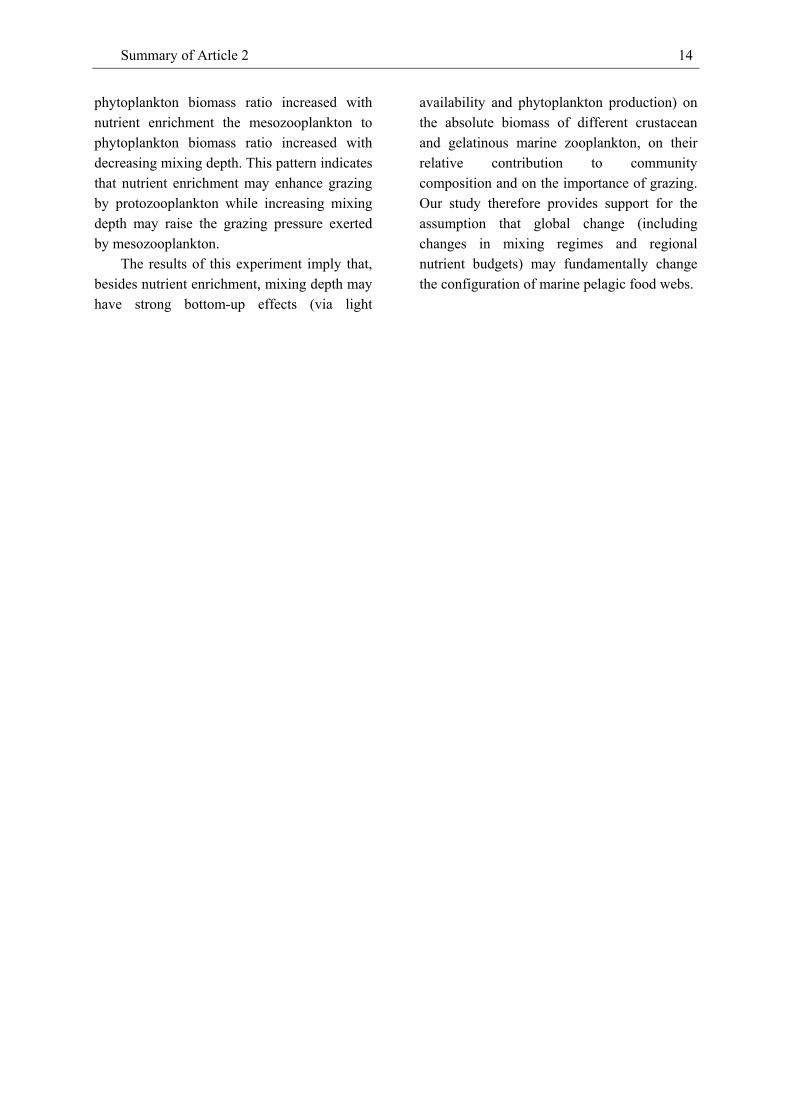
Fig. 2 Effects of mixing depth and nutrient enrichment on the biomass of phytoplankton. The graph depicts the equilibrium biomass concentration of phytoplankton in a mixed surface layer without contact to the sediment and recycling of nutrients from sedimented algae. Higher total nutrient content results in a higher biomass of plankton algae (after Diehl 2002).
Effects of the intensity of turbulent diffusion on phytoplankton have received even less experimental treatment, apart from a small
number of mesocosm experiments which all held water column depth constant (Oviatt 1981, Petersen et al. 1998, Metcalfe et al.
Algal biomass concentration
Mixing depth
High nutrients
Low nutrients
General Introduction 7
2004). Huisman et al. (1999b, c) and Huisman and Sommeijer (2002a, b) recently extended early advection-diffusion models by Riley et al. (1949) and Okubo (1980) which neglected light-dependent photosynthesis and background attenuation of the water, respectively. The model framework which focuses on light-limited algal growth (thus ignoring nutrient limitation), allows to derive combinations of water column depth and turbulence intensity under which an algal species may bloom, depending on its growth and sinking characteristics (neutrally buoyant or sinking). The theory breaks with the paradigm that an algal bloom, i.e., a population of phytoplankton, may only develop when the depth of the mixed surface layer becomes more shallow than the ‘critical depth’ as defined by Sverdrup (1953) in an attempt to understand the onset of the annual spring phytoplankton bloom in the North Atlantic. The reaction-advection-diffusion model framework suggests that an algal species may generally bloom at a mixing intensity and water column depth where its growth rate exceeds both sinking and mixing losses. As a result, non-sinking algae should bloom in all except very deep and highly turbulent waters; sinking algae should, in addition, be excluded from quiescent and very shallow waters (Huisman et al. 1999b, c, Huisman and Sommeijer 2002b). The concept that the intensity of turbulence may be important in the establishment of algal blooms is supported by field data which strongly suggest even incomplete mixing may allow the establishment of phytoplankton blooms (Townsend et al. 1992, Eilertsen 1993). In view of the small number of experimental studies that have investigated effects of turbulence intensity on algal biomass (see above) simultaneous manipulation of mixing intensity and water column depth appeared to be a promising tool to shed light on the relevance of turbulence for the formation of algal blooms in field situations.
Turbulent flow also advects more nutrients towards phytoplankton. It has been suggested that this should reduce the thickness of the boundary layer surrounding cells and which becomes nutrient-depleted when the uptake rate for the nutrient exceeds its diffusion rate. However, as Kiørboe (1993) showed, turbulent diffusion is relevant only for phytoplankton larger than approximately 100 µm equivalent spherical diameter, and at nutrient concentrations below saturation levels. The intensity of turbulence should, therefore, not affect the nutrient uptake rate of most species of phytoplankton. However, like algal photosynthesis, nutrient uptake is a function of light intensity and so less nutrients should be consumed by algae with increasing mixing depth or depth within the water column (Huisman and Weissing 1994, L’Helguen et al. 1994). As shown theoretically, and in field experiments and surveys more nutrients will therefore remain in dissolved mineral form with increasing depth of the mixed surface layer (Sakshaug et al. 1991, Huisman and Weissing 1995, Diehl 2002, Diehl et al. 2002). Below the mixed layer and in a water column with low intensity of turbulent diffusion, the concentration of nutrients will usually increase towards depth because of resupply from the aphotic zone, the sediment or both (Longhurst and Harrison 1989, Klausmeier and Litchman 2001). Experimental evidence for the relationship between the concentration of the dissolved mineral nutrient and mixing depth or water column depth is, however, still lacking in the marine pelagic.
Increasing input of solar energy in spring and a concomitant reduction of wind mixing typically result in thermal stratification of the upper part of temperate oceans and deeper freshwater lakes. For example, in large parts of the North Atlantic, a region which is characterised by relatively deep mixing down to a depth of around 300 m by the end of winter, vertical mixing becomes restricted to the upper 10 to 50 m in summer (Mann and
General Introduction 8
Lazier 1996, Kara et al. 2003). Stratification isolates the surface mixed layer from deeper strata by a steep temperature and density gradient, the thermocline. Exchange processes across the interface between the mixed layer and the layers underneath are then largely restricted to sinking of particulate matter and to nutrient diffusion. A combination of prolonged heat input, intermittent wind forcing and nighttime convective mixing during the warm season usually result in an increase of the mean vertical extent of the mixed layer and the intensity of turbulence therein. Shear stress at the interface with the underlying layer of water, and currents and tides also are important sources of turbulence (Mann and Lazier 1996). The kinetic energy inherent in turbulence is dissipated towards increasingly smaller scales down to eddy sizes of 1 mm; turbulence at large and small scales therefore generally covaries (Fig. 1; Kiørboe 1993, Sanford 1997). Below the smallest eddy sizes turbulent kinetic energy is eventually transformed into heat. Although turbulent mixing is a general feature of most aquifers and may affect populations of organisms and communities at both small and large scales the effects of turbulent diffusion on phyto- and zooplankton are not yet well understood (Sanford 1997, Peters and Marrasé 2000, Druet 2003).
Nutrient enrichment should generally increase effects of mixing depth and intensity on phytoplankton biomass and availability of any limiting resource (light, nutrients). Because algal biomass concentration is limited by light availability at large mixing depths and, in case of sinking algae, by sinking losses at shallow mixing depths, enrichment with nutrients should be most effective at intermediate mixing depths (Diehl 2002). Similarly, nutrient enrichment should enhance algal production the most at intermediate intensities of diffusion where algal growth rate exceeds the homogenizing effect of the mixing rate (in the vertical) and, in case of sinking algae, also the sinking rate. Non-sinking algae
should also profit considerably from increased nutrient supply at shallow mixing depths because neither light limitation nor sinking losses pose considerable constraints.
Secondary production in the pelagic is tightly related to primary production by phytoplankton as predicted by resource-consumer theory (Rothhaupt 1988, Grover 1997). While effects of nutrient enrichment are well-documented in both marine and freshwater environments (Harris 1982, Gismervik 1997, Murdoch et al. 1998, Berger et al. submitted), effects of increasing mixing depth (essentially a ‘de’richment with light) on zooplankton production and community composition have only recently been studied by a very small number of field studies (Maar et al. 2003, Berger et al. submitted). Likewise, although the effects of turbulent diffusion on many aspects of zooplankton behaviour have been explored theoretically and zooplankton is essential for higher trophic levels in aquatic food webs, few studies have addressed effects of increasing turbulence on zooplankton production and community composition (e.g., Maar et al. 2003, Metcalfe et al. 2004). Given the central position and linking function of zooplankton it is thus timely to address how its production is being affected by key parameters of the physical environment.
Turbulent mixing should not only affect the biomass and, likely, composition of the various trophic levels of the plankton. It is widely recognized in the literature that the overall structure of the marine food web differs considerably between weakly stratified coastal waters and more strongly stratified oceanic waters (e.g. Cushing 1989). In particular, heterotrophic bacterio-, micro- and mesozooplankton has been identified to dominate the food web of oligotrophic, oceanic waters in terms of biomass and energy transfer in tropical and subtropical regions (year-round), but in summer only in temperate regions (‘microbial loop’). In contrast, the short,’ classical’ food-chain (large
General Introduction 9
phytoplankton - copepods) predominates in temperate seas during the main mixing events (in spring and autumn) and in up-welling areas of warm regions (Kiørboe 1993). Although this pattern has been related to nutrient supply and phytoplankton production (e.g., Gasol et al. 1997) the underlying mechanism is still poorly understood because of both a lack of theory and experimental work.
Recent research into effects of climate change on marine and freshwater plankton has recently begun to consider effects of a changing depth in the vertical extent of the mixed surface layer (e.g. Richardson and Schoeman 2004, Schmittner 2005). Clearly, an understanding of the meso- and microscale physical-biological processes within the surface layer of the oceans, and of secondary biological effects occurring in plankton communities will be required for an assessment of potential impacts of future climate change on the plankton and higher trophic levels. Aims
The proximate aims of this thesis were as follows: Firstly, to experimentally test effects of the intensity and depth of turbulent, vertical mixing in the water column, and of nutrient enrichment on the biomass of marine phyto- and zooplankton. Secondly, to scrutinize effects of the above parameters on the composition of the microplankton and mesozooplankton community, and on the availability of the limiting resources, i.e. photosynthetically active radiation and
dissolved mineral nitrogen, the nutrient which limits phytoplankton production in large areas of the world’s oceans.
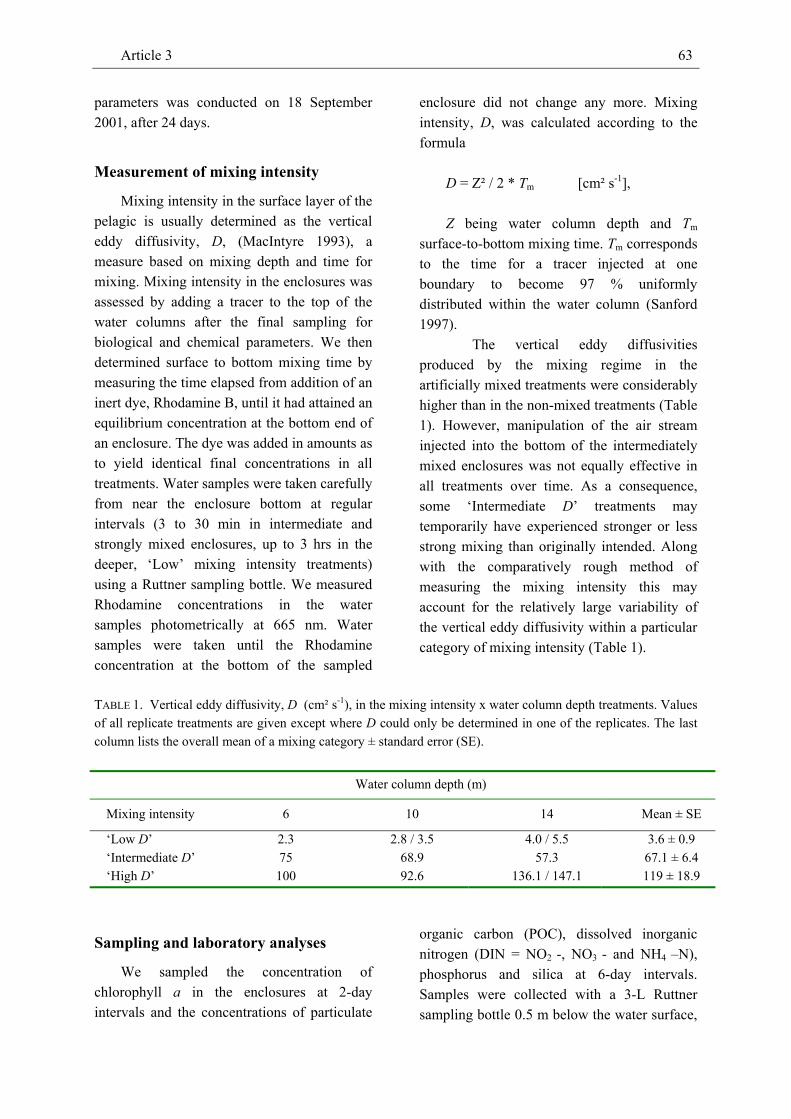
Experimental design
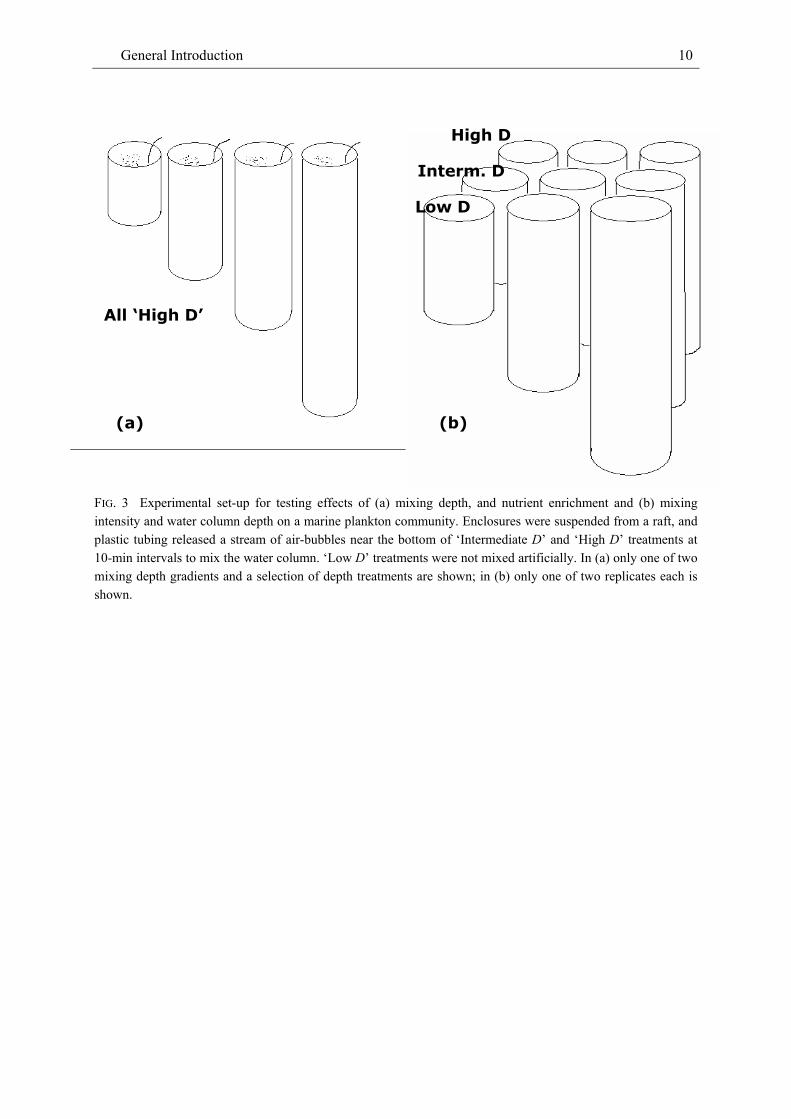
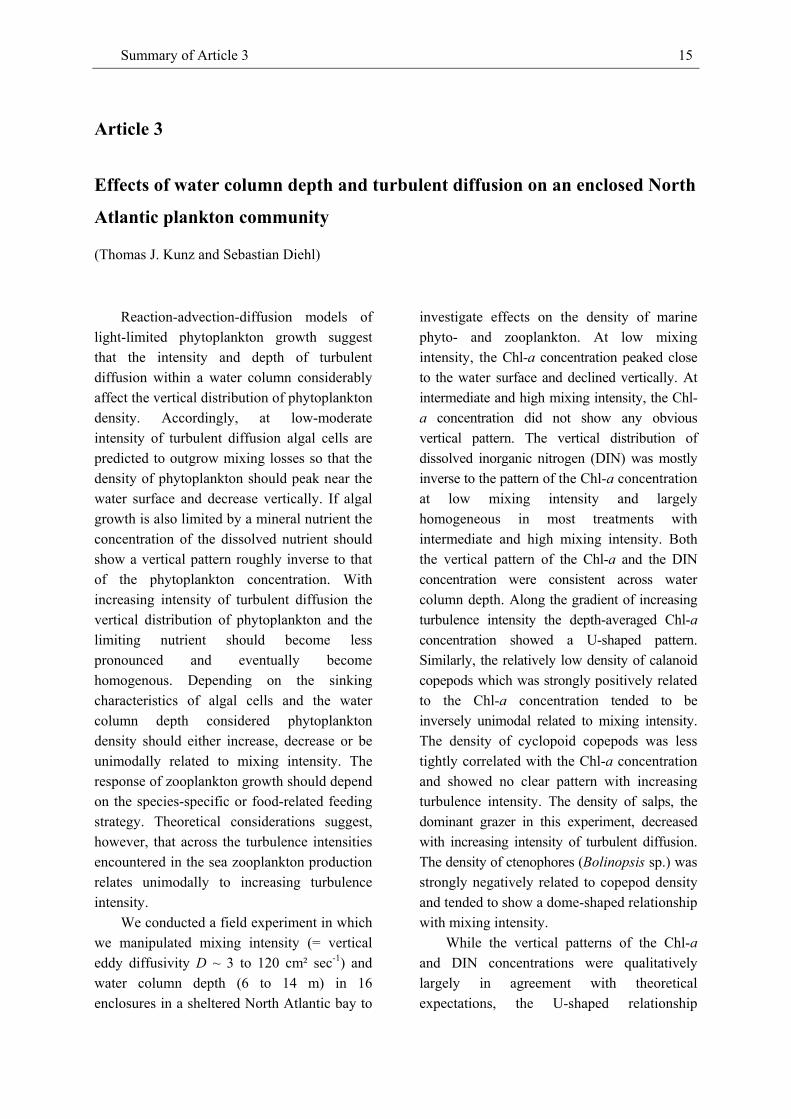
The above questions were addressed by enclosing the summer North Atlantic plankton community into cylindrical, opaque flexible-wall enclosures immersed from a raft structure in a sheltered bay and manipulating mixing depth (Experiment in 2000, Fig. 3a; Articles 1 and 2) and mixing intensity and water column depth (Experiment in 2001, Fig. 3b; Article 3). Mixing depth and water column depth were manipulated by varying enclosure length (1 to 12 m in 2000; 6 to 14 m in 2001) while turbulent mixing was generated by blowing a stream of air into the bottom of enclosures at regularly spaced 30-sec intervals and, in the 2001 experiment, at different intensities (no artificial mixing, intermediate, and high mixing intensities). Nano- and microplankton, mesozooplankton, the concentrations of chlorophyll a, and suspended and sedimented seston carbon in, mean light intensity, and the concentrations of dissolved mineral nutrients were sampled in 6-day intervals over a period of 25 days in each experiment. The effectiveness of the mixing procedure was monitored by casting vertical temperature profiles in 2000, and, in 2001, also salinity and density profiles. The intensity of turbulent diffusion was measured by adding a fluorescent tracer to the enclosures.
General Introduction 10
FIG. 3 Experimental set-up for testing effects of (a) mixing depth, and nutrient enrichment and (b) mixing intensity and water column depth on a marine plankton community. Enclosures were suspended from a raft, and plastic tubing released a stream of air-bubbles near the bottom of ‘Intermediate D’ and ‘High D’ treatments at 10-min intervals to mix the water column. ‘Low D’ treatments were not mixed artificially. In (a) only one of two mixing depth gradients and a selection of depth treatments are shown; in (b) only one of two replicates each is shown.
Low D
Interm. D
High D
(b) (a)
All ‘High D’
Summary of Article 1 11
Summaries of the articles
Summary of Article 1 12
Article 1
Effects of mixing depth and nitrogen enrichment on marine zooplankton,
phytoplankton, light and mineral nutrients
(Thomas J. Kunz and Sebastian Diehl)
Mixing depth has long been attributed a central role in determining the onset of the phytoplankton spring bloom in the pelagic of major ocean regios. Recently developped producer-resource theory suggests that the phytoplankton concentration within the mixed surface layer of lakes and oceans strongly depends on both mixing depth and nutrient enrichment. Increasing mixing depth negatively affects mean light intensity and so specific production of planktonic primary producers is predicted to decrease with mixing depth. Increasing mixing depth also negatively affects algal sinking loss rate within the mixed layer and enrichment with the limiting nutrient positively affects phytoplankton production. As a consequence, the concentration of phytoplankton is predicted to decline over most of the range of mixing depths usually encountered in the pelagic but to increase with nutrient enrichment. For a realistic range of mixing depths the model framework predicts that the concentration of the dissolved limiting nutrient will increase with increasing depth of the mixed layer and nutrient enrichment. Resource-consumer theory suggests that the production of primary consumers is positively affected by primary production and so zooplankton biomass can be expected to show a similar response to increasing mixing depth and nutrient enrichment as phytoplankton biomass. Although field surveys have indicated negative relationships between mixing depth and phytoplankton density, effects of mixing depth on the biomass of phyto- and zooplankton have not previously been explored
experimentally in the marine environment. Likewise, although the effects of nitrogen enrichment on the production of marine phyto- and zooplankton have received some experimental treatment light and nutrient enrichment have not been manipulated simultaneously. We therefore investigated effects of mixing depth and enrichment with nitrogen on a plankton assemblage and resource availability in large field enclosures in the coastal North Atlantic. Mixing depth negatively affected light availability but positively affected nutrient availability in the mixed water columns. The concentrations of Chl a, seston carbon, meso- and total zooplankton, but not of phyto- and protozooplankton biomass were significantly negatively affected by mixing depth. Nitrogen enrichment positively affected the concentrations of Chl a, seston carbon, phyto-, micro- and mesozooplankton biomass and did not have major negative effects on the light climate. The results indicate that the vertical extent of the mixed surface layer in the oceans plays a key role for the biomass of phytoplankton, its limiting resources, and zooplankton and suggests that these effects propagate up the food chain.
Summary of Article 2 13
Article 2
Response of auto-, mixo- and heterotrophic marine plankton to nitrogen
enrichment and a mixing-depth gradient
(Thomas J. Kunz and Sebastian Diehl)
We enclosed North Atlantic
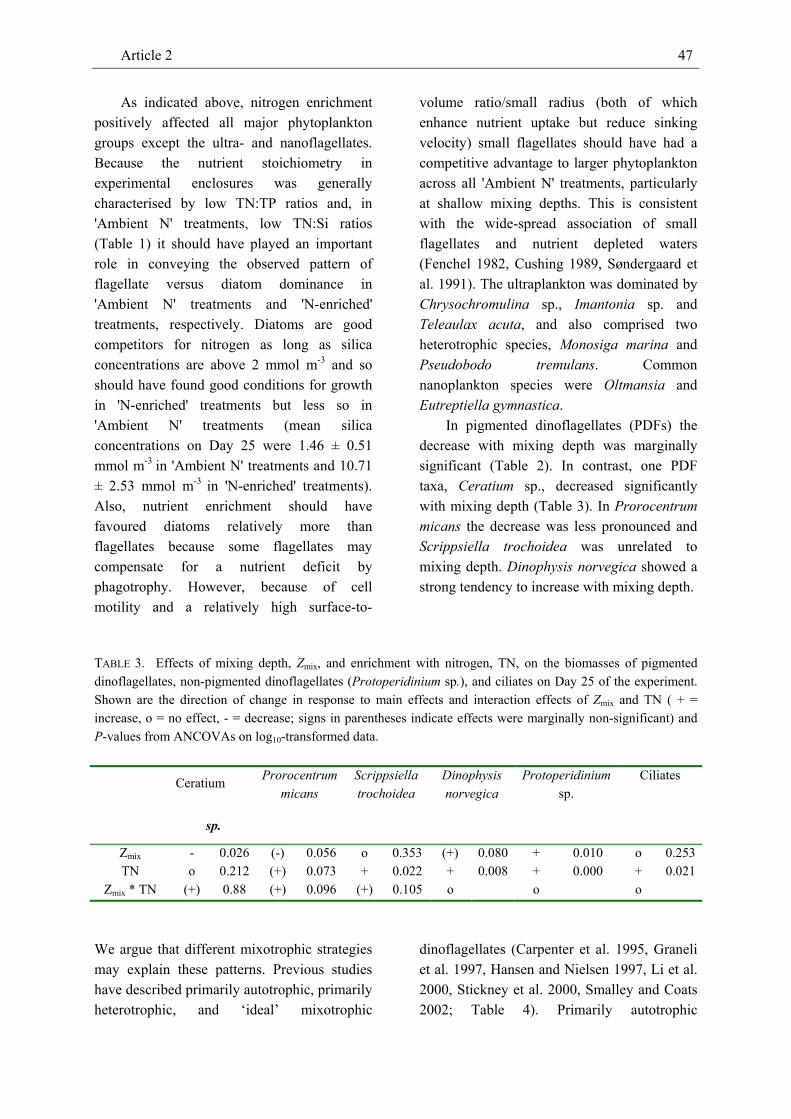
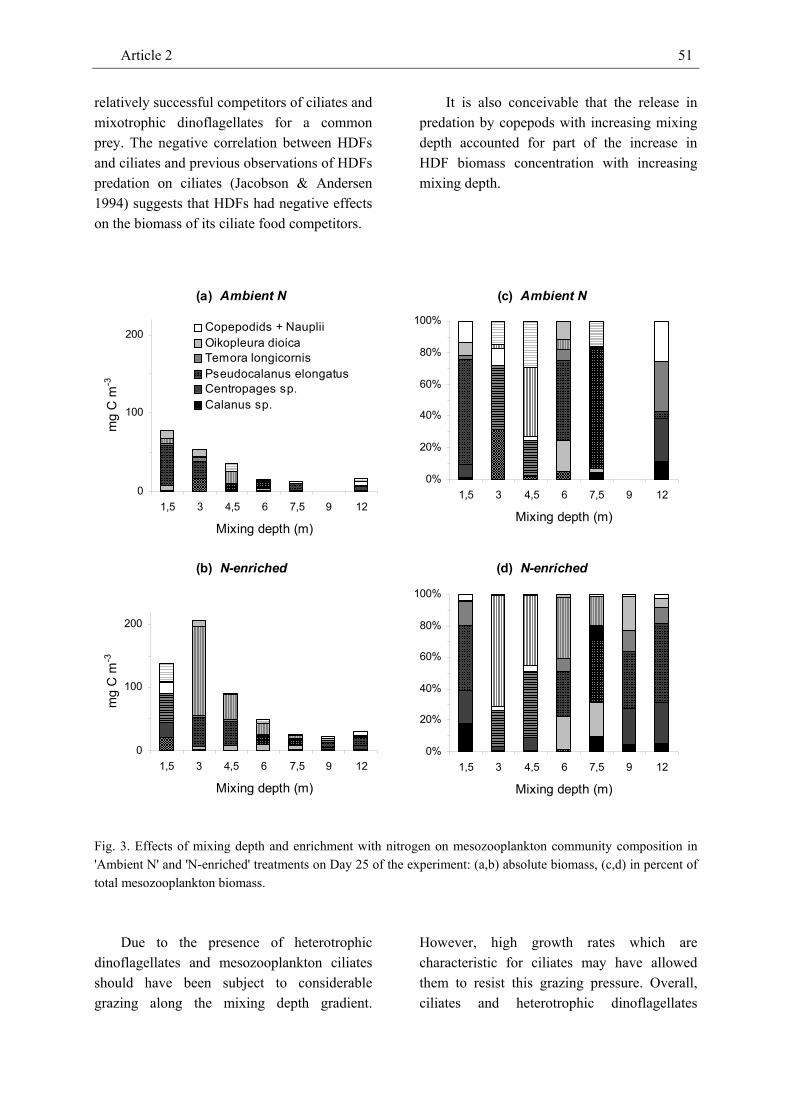
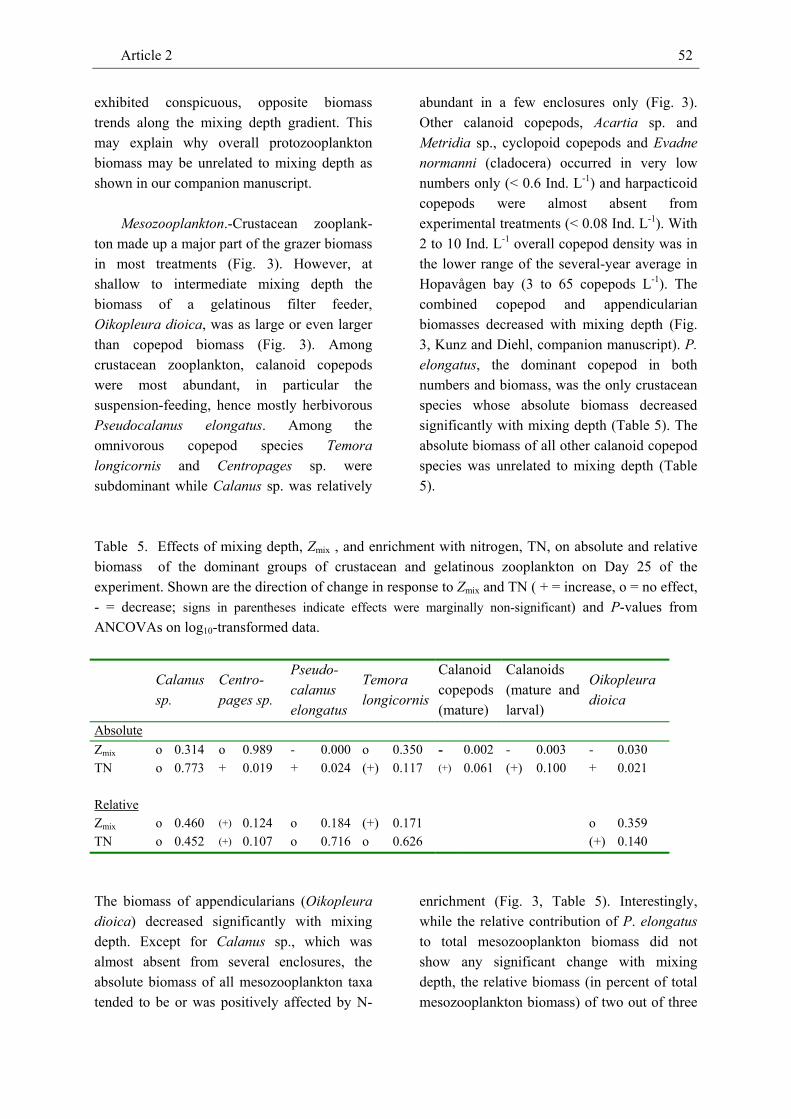
phytoplankton, micro- and mesozooplankton in large field enclosures to investigate effects of mixing depth and nitrogen enrichment on the biomass of individual plankton compartments. In our companion paper we describe negative effects of mixing depth and positive effects of enrichment with nitrogen on the Chl-a and seston carbon concentrations as predicted by a recent generic model framework. In contrast to these proxies of phytoplankton biomass, the carbon-based total phytoplankton biomass decreased considerably from shallow to intermediate mixing depths but overall was unrelated to mixing depth. Mixing depth did not affect most phytoplankton groups but negatively affected all size classes of small flagellates and phototrophic dinoflagellates. In pigmented dinoflagellates effects of mixing depth on overall biomass were marginally significant. We attribute this to different mixotrophic feeding strategies: the biomass of dinoflagellates assumed to be primarily phototrophic (Ceratium sp., Prorocentrum micans) decreased with mixing depth whereas the biomass of dinoflagellates assumed to be primarily heterotrophic (Dinophysis norvegica) tended to increase with mixing depth. Non-pigmented, purely heterotrophic dinoflagellates (Protoperidinium sp.) strongly increased with increasing mixing depth. Scrippsiella trochoidea which was unrelated to mixing depth may have pursued an ‘ideal’ mixotrophic strategy depending on the availability of light, nutrients, and prey at a particular mixing
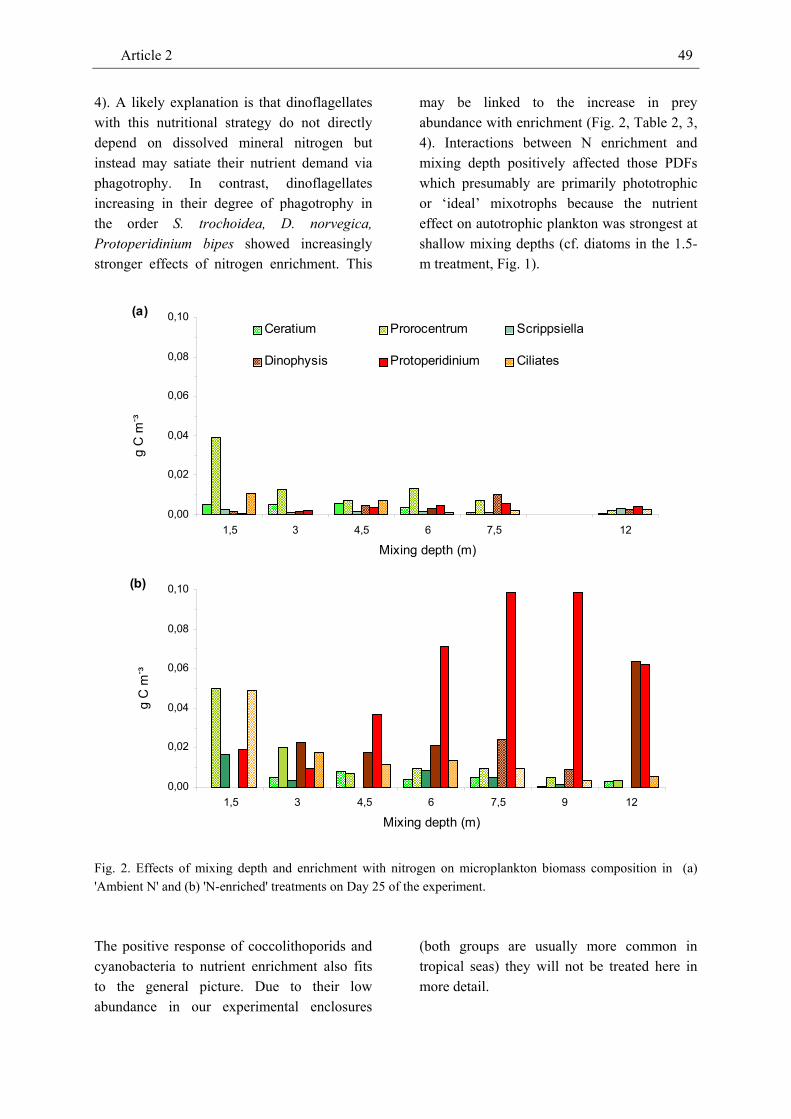
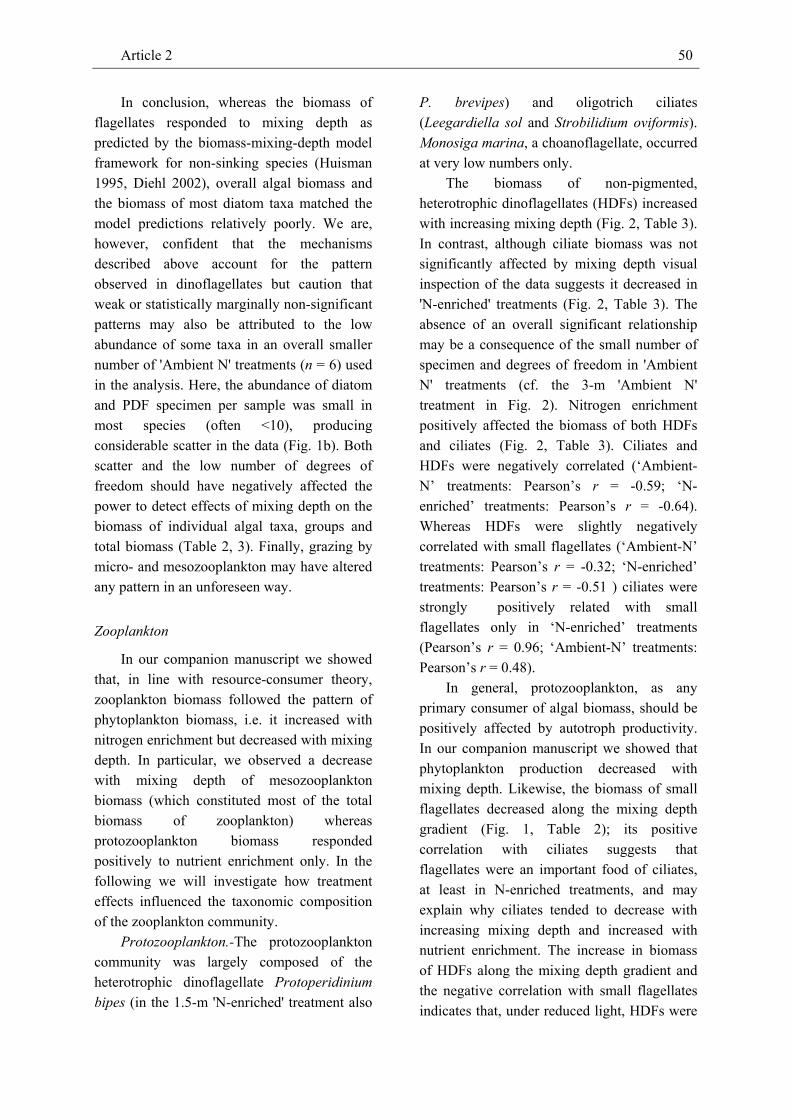
depth. Morphometric considerations did not provide a conclusive answer as to why coccolithophorids, cyanophycea and diatoms were unrelated to mixing depth. The biomass of most phytoplankton groups responded positively to nutrient enrichment.
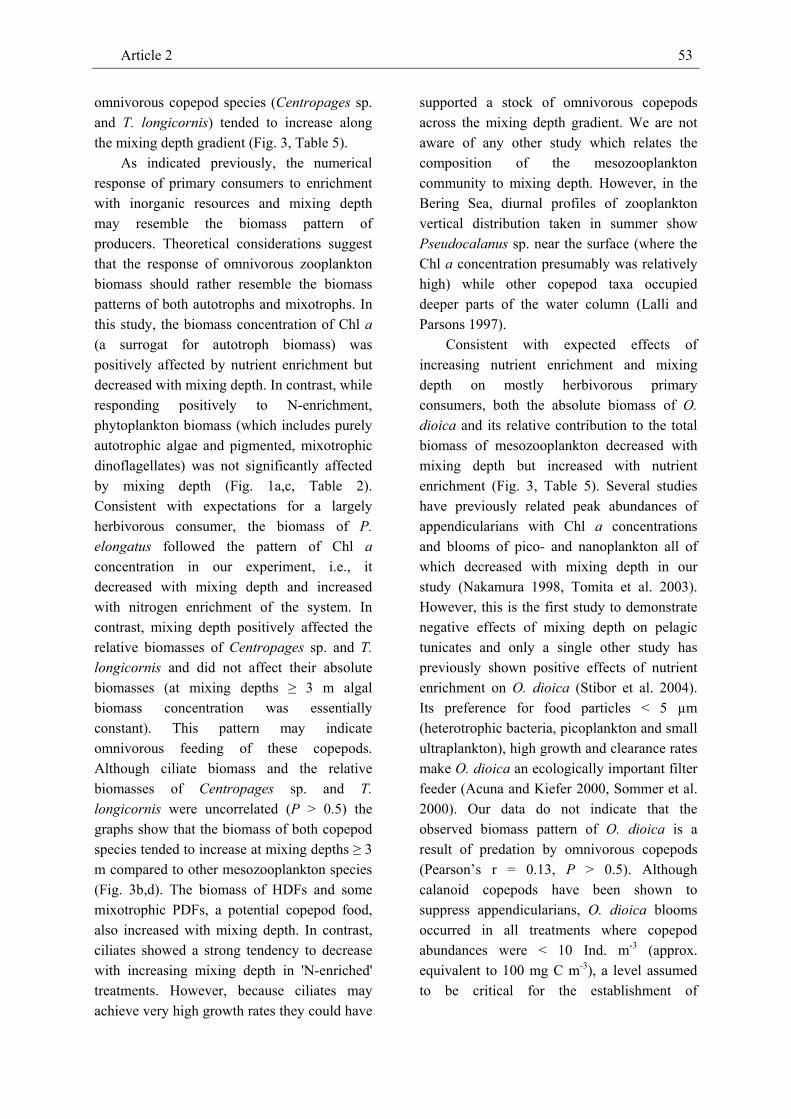
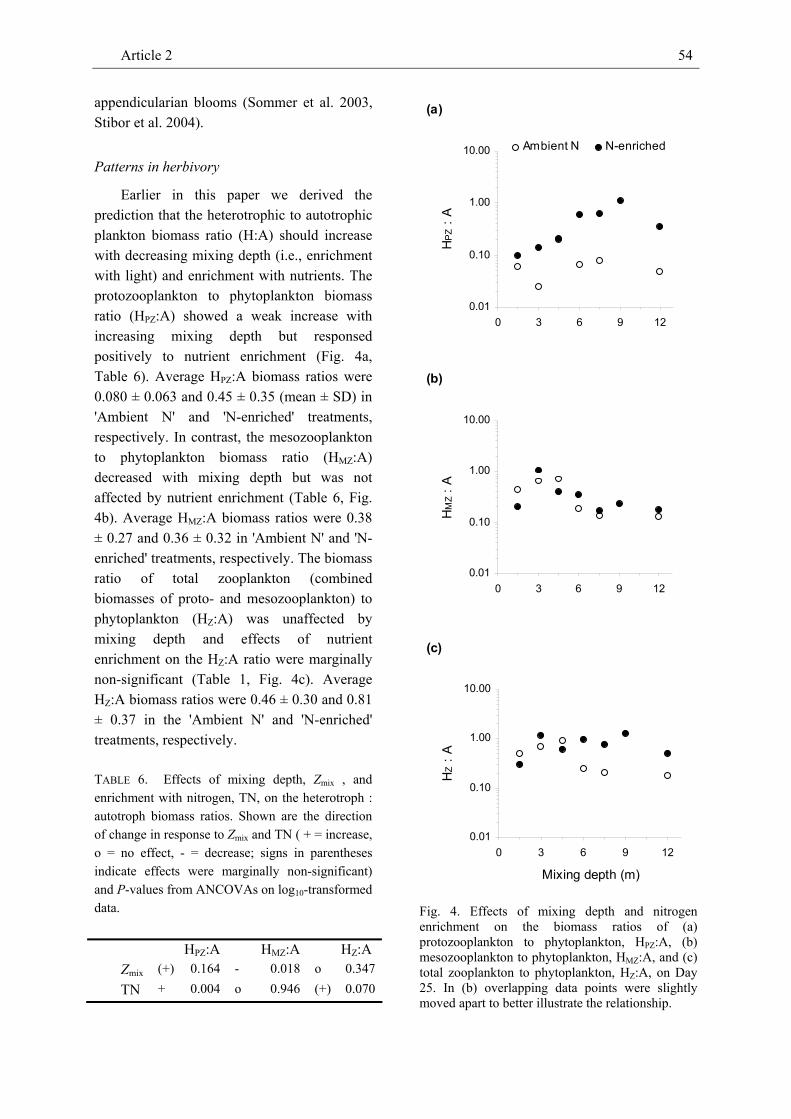
The biomass of mostly herbivorous grazers (Pseudocalanus elongatus, Oikopleura dioica) decreased with mixing depth but was positively affected by nitrogen enrichment. In contrast, the absolute biomass of omnivorous copepods (Calanus sp., Centropages sp., Temora longicornis) was not affected by mixing depth and responded positively to enrichment with nitrogen in only one species. However, the relative contribution of omnivorous copepods to the overall biomass of mesozooplankton increased with mixing depth and possibly reflects the availability of dinoflagellate prey. Hence, direction and strength of treatment effects on zooplankton biomass and community composition seem to primarily depend on its nutritional mode, i.e. whether a consumer is primarily herbivorous or omnivorous. We also identified a systematic variation of the biomass ratios of meso- and protozooplankton to phytoplankton with mixing depth and nutrient enrichment, respectively. The observed positive response of these H:A biomass ratios to enrichment underlines the importance of bottom-up effects in aquatic food webs and is consistent with expectations derived from equilibrium food-chain and producer-resource theories. However, while the protozooplankton to
Summary of Article 2 14
phytoplankton biomass ratio increased with nutrient enrichment the mesozooplankton to phytoplankton biomass ratio increased with decreasing mixing depth. This pattern indicates that nutrient enrichment may enhance grazing by protozooplankton while increasing mixing depth may raise the grazing pressure exerted by mesozooplankton.
The results of this experiment imply that, besides nutrient enrichment, mixing depth may have strong bottom-up effects (via light
availability and phytoplankton production) on the absolute biomass of different crustacean and gelatinous marine zooplankton, on their relative contribution to community composition and on the importance of grazing. Our study therefore provides support for the assumption that global change (including changes in mixing regimes and regional nutrient budgets) may fundamentally change the configuration of marine pelagic food webs.
Summary of Article 3 15
Article 3
Effects of water column depth and turbulent diffusion on an enclosed North
Atlantic plankton community
(Thomas J. Kunz and Sebastian Diehl)
Reaction-advection-diffusion models of
light-limited phytoplankton growth suggest that the intensity and depth of turbulent diffusion within a water column considerably affect the vertical distribution of phytoplankton density. Accordingly, at low-moderate intensity of turbulent diffusion algal cells are predicted to outgrow mixing losses so that the density of phytoplankton should peak near the water surface and decrease vertically. If algal growth is also limited by a mineral nutrient the concentration of the dissolved nutrient should show a vertical pattern roughly inverse to that of the phytoplankton concentration. With increasing intensity of turbulent diffusion the vertical distribution of phytoplankton and the limiting nutrient should become less pronounced and eventually become homogenous. Depending on the sinking characteristics of algal cells and the water column depth considered phytoplankton density should either increase, decrease or be unimodally related to mixing intensity. The response of zooplankton growth should depend on the species-specific or food-related feeding strategy. Theoretical considerations suggest, however, that across the turbulence intensities encountered in the sea zooplankton production relates unimodally to increasing turbulence intensity.
We conducted a field experiment in which we manipulated mixing intensity (= vertical eddy diffusivity D ~ 3 to 120 cm² sec-1) and water column depth (6 to 14 m) in 16 enclosures in a sheltered North Atlantic bay to
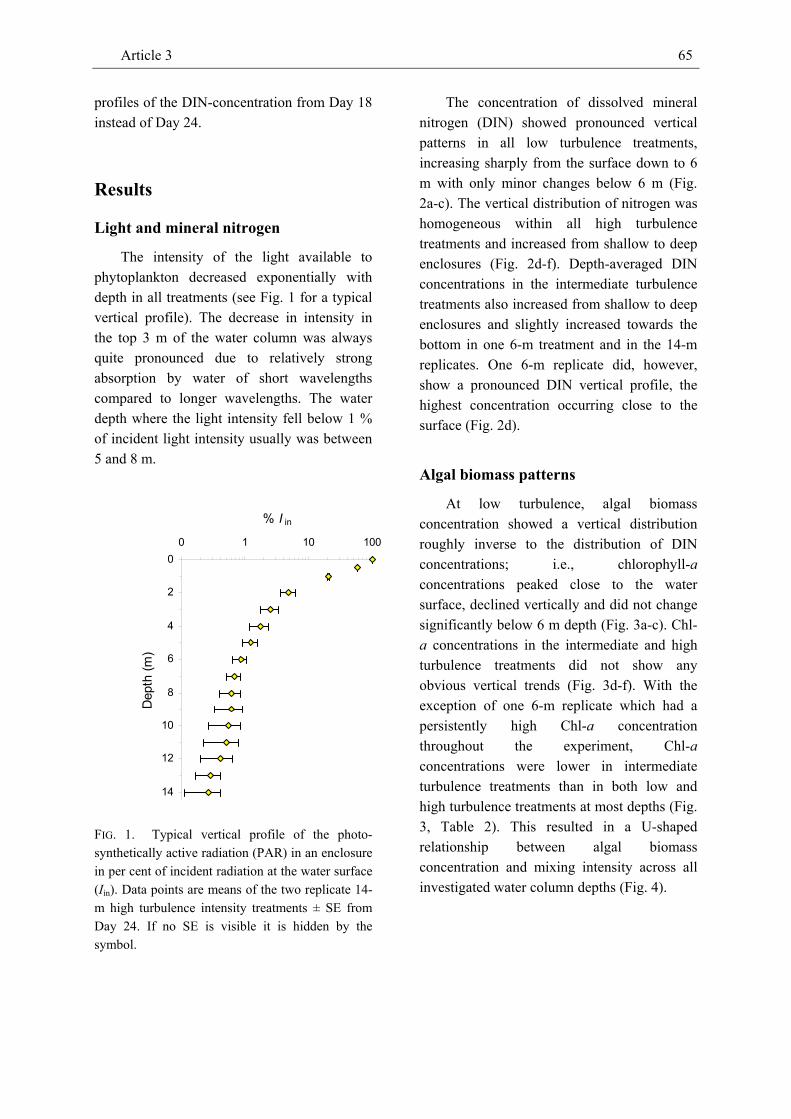
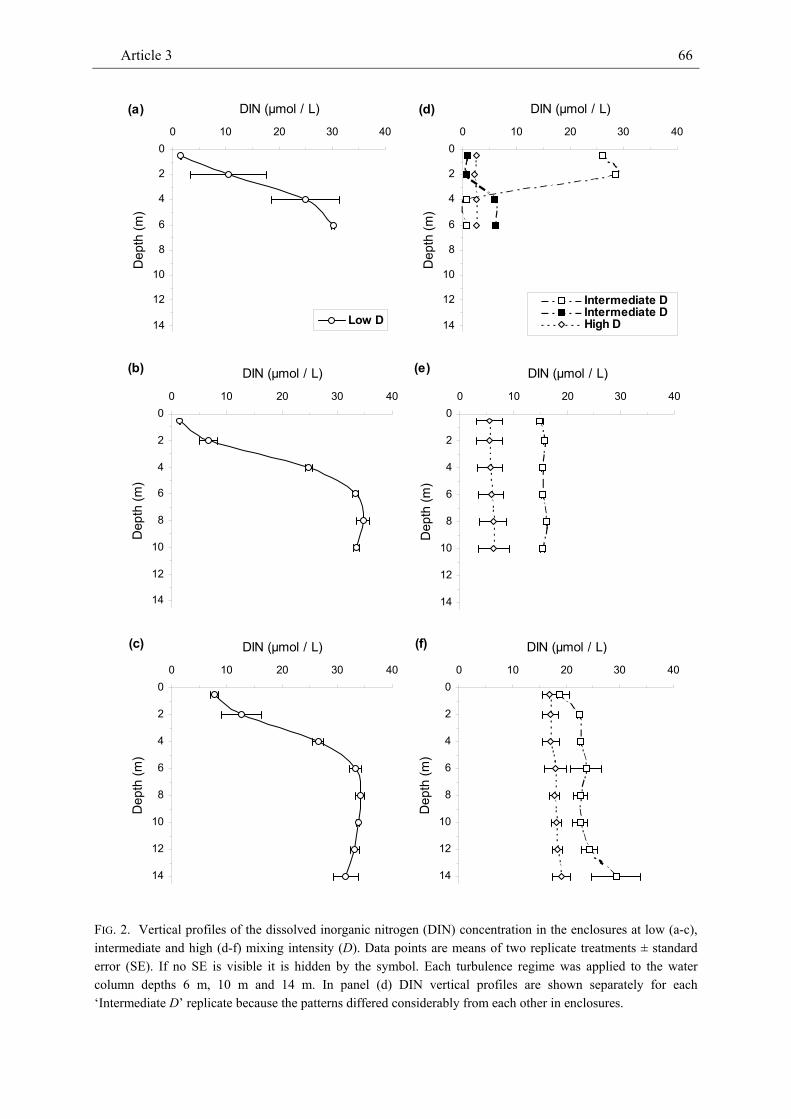
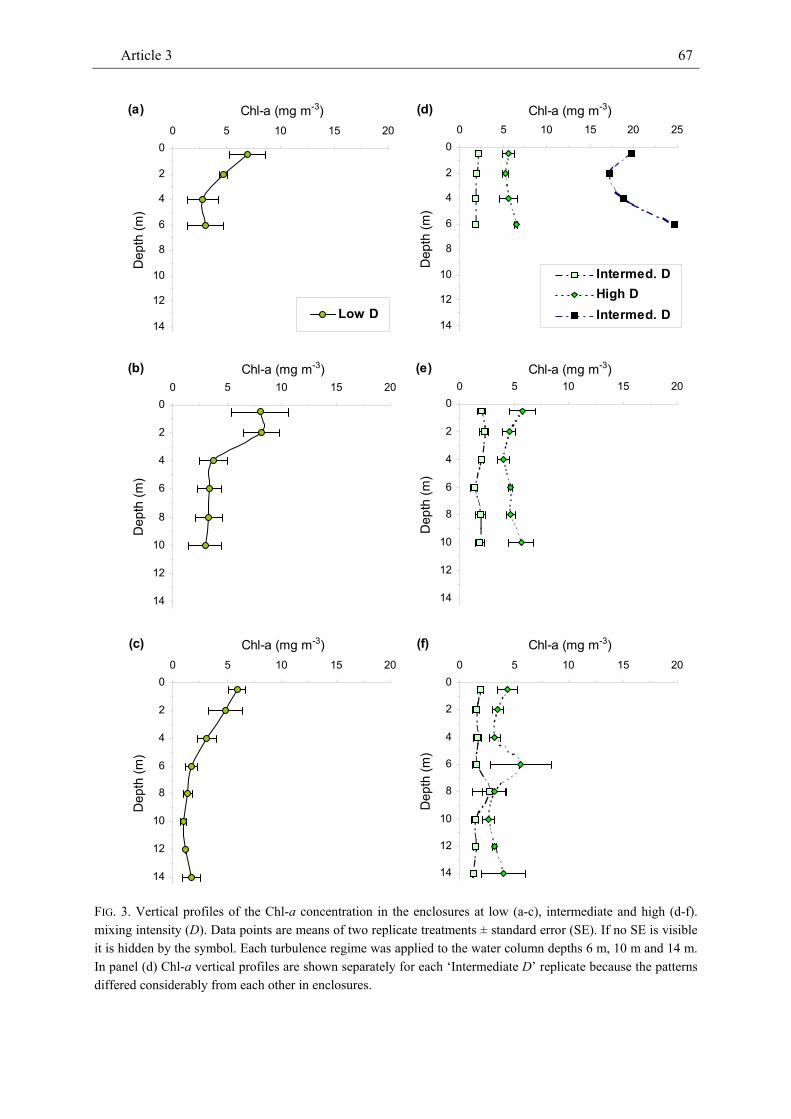
investigate effects on the density of marine phyto- and zooplankton. At low mixing intensity, the Chl-a concentration peaked close to the water surface and declined vertically. At intermediate and high mixing intensity, the Chl-a concentration did not show any obvious vertical pattern. The vertical distribution of dissolved inorganic nitrogen (DIN) was mostly inverse to the pattern of the Chl-a concentration at low mixing intensity and largely homogeneous in most treatments with intermediate and high mixing intensity. Both the vertical pattern of the Chl-a and the DIN concentration were consistent across water column depth. Along the gradient of increasing turbulence intensity the depth-averaged Chl-a concentration showed a U-shaped pattern. Similarly, the relatively low density of calanoid copepods which was strongly positively related to the Chl-a concentration tended to be inversely unimodal related to mixing intensity. The density of cyclopoid copepods was less tightly correlated with the Chl-a concentration and showed no clear pattern with increasing turbulence intensity. The density of salps, the dominant grazer in this experiment, decreased with increasing intensity of turbulent diffusion. The density of ctenophores (Bolinopsis sp.) was strongly negatively related to copepod density and tended to show a dome-shaped relationship with mixing intensity.
While the vertical patterns of the Chl-a and DIN concentrations were qualitatively largely in agreement with theoretical expectations, the U-shaped relationship
Summary of Article 3 16
between the Chl-a concentration and mixing intensity contradicted theoretical expectations for the pattern of phytoplankton density. Comparatively long mixing time at intermediate mixing intensity may have favoured microzooplankton (e.g. heterotrophic dinoflagellates) as indicated by relatively high C:Chl-a levels. Both the strongly positive relationship between the density of calanoid copepods and the Chl-a concentration and the strongly negative relationship between the
densities of copepods and Bolinopsis suggest that the U-shaped relationship between calanoid copepod density and mixing intensity resulted from concomitant bottom-up and top-down control. Direct effects of turbulence on zooplankton were more likely observed in salps and ctenophores and support the paradigm of a dome-shaped relationship between secondary production and turbulence intensity.
Synopsis 17
Synopsis
The approach of this thesis allowed to examine how key hydrophysical parameters, the intensity
and depth of vertical mixing in the water column, and interactions between them affect the biomass and community composition of phyto- and zooplankton and the availability of resources limiting pelagic primary production. The experimental plankton communities were considerably more complex than the systems of dynamical state variables described by recently developed models of light- and nutrient-dependent phytoplankton growth and a reaction-advection-diffusion model framework for phytoplankton. Despite the simplifying assumptions of the theory the results of these experiments confirm the operation of the underlying biophysical mechanisms and have substantial effects not only on phytoplankton but also on the next higher trophic levels (micro- and mesozooplankton). The experiments also allowed to investigate interactions between pelagic primary producers, grazers, and their predators in the surface layer of the marine pelagic under the influence of mixing depth and intensity, and nutrient enrichment. The results provide new insights into the functioning of marine pelagic ecosystems with respect to the importance of mixotrophy and grazing at different levels of resource supply (heterotroph to autotroph ratio). Along with related research recently carried out in lakes this thesis therefore contributes to an ecology of unifiying concepts. This thesis also demonstrates that considerable theoretical and experimental effort is still required to better understand how the intensity of turbulent diffusion affects the feeding and growth rate of zooplankton and higher trophic levels. The results suggest that mixing depth and intensity of turbulent diffusion be considered alongside with nutrient availability in any model, experimental and field study that aims to better understand structure and function of pelagic ecosystems. The latter will be essential for the sustainable use of aquatic ecosystems in a globally changing environment.
References 18
References
Berger SA, Diehl S, Kunz TJ, Albrecht D, Oucible AM, Ritzer S (submitted) Light supply, plankton biomass and seston stoichiometry in a gradient of lake mixing depths.
Boyd PW (2002) Environmental factors controlling phytoplankton processes in the Southern Ocean. J.Phycol. 38:844-861
Cloern JE (2001) Our evolving conceptual model of the coastal eutrophication problem. Mar.Ecol.Progr.Ser. 210:223-253
Cushing DH (1989) A difference in structure between ecosystems in strongly stratified waters and in those that are only weekly stratified. J.Plank.Res. 11(1):1-13
Diehl S. (2002) Phytoplankton, light, and nutrients in a gradient of mixing depths: theory. Ecology 83:386-391
Dower JF, Miller TJ, Leggett WC (1997) The role of microscale turbulence in the feeding ecology of larval fish. Adv.Mar.Biol. 31:170-220
Druet C (2003) The fine structure of marine hydrophysical fields and its influence on the
behaviour of plankton: an overview of some experimental and theoretical investigations. Oceanologia 45(4):517-555
Eilertsen HC (1993) Spring blooms and stratification. Nature 363:24
Gismervik I, Olsen Y, Vadstein O (2002) Micro- and mesozooplankton response to enhanced nutrient input - a mesocosm study. Hydrobiologia 484:75-87
Trophic interactions and production processes in enclosed water columns. In: Grice GD, Reeve MR (eds) Marine mesocosms: biological and chemical research in experimental ecosystems. Springer-Verlag, p 353-387
Huisman J, Weissing FJ (1994) Light-limited growth and competition for light in well-mixed aquatic environments: an elementary model. Ecology 80:202-210
Huisman J, Weissing FJ (1995) Competition for nutrients and light in a mixed water column: a theoretical analysis. Am.Nat. 146:536-564
Huisman J., Oostveen P v, Weissing FJ (1999b) Species dynamics and phytoplankton blooms: incomplete mixing and competition for light. Am.Nat. 154(1):46-68
Huisman J, Arrayás M, Ebert U, Sommeijer B (2002) How do sinking phytoplankton species manage to persist? Am.Nat.159(3):245-254
Kiørboe T (1993) Turbulence, phytoplankton cell size, and the structure of pelagic food webs. Adv.Mar.Biol. 29:1-72
Klausmeier CA, Litchman E (2001) Algal games: the vertical distribution of phytoplankton in stratified water columns. Limnol.Oceanogr. 46:1998-2007
Kirk JTO (1994) Light and photosynthesis in aquatic ecosystems. Cambridge University Press.
References 19
Lalli CM, Parsons TR (1997) Biological Oceanography - An introduction. The Open University. Butterworth Heinemann. Oxford.
Longhurst AR, Harrison WG (1989) The biological pump: profiles of plankton production and
consumption in the upper ocean. Prog.Oceanog. 22:47-123.
Maar M, Nielsen TG, Stips A, Visser AW (2003) Microscale distribution of zooplankton in relation to turbulent diffusion. Limnol.Oceanogr. 48:1312-1325
Maar M, Nielsen TG, Gooding S, Tönnesen K, Tiselius P, Zervoudaki S, Sell A, Richardson K (2004)
Trophodynamic function of copepods, appendicularians and protozooplankton in the late summer zooplankton community in the Skagerrak. Mar.Biol. 144: 917-933
MacIntyre S (1998) Turbulent mixing and resource supply to phytoplankton. In: Physical
processes in lakes and oceans. Coastal and Estuarine Studies. Imberger J (ed.). American Geophysical Union, Washington , D.C.
Mitchell BG, Holm-Hansen O (1991) Observations and modeling of the Antarctic phytoplankton crop in relation to mixing depth. Deep-Sea Res.Pt.A-Oceanogr.Res.Papers 38:981-1007
Murdoch WW, Nisbet RM, McCauley E, deRoos AM, Gurney WSC (1998) Plankton abundance and dynamics across nutrient levels: tests of hypotheses. Ecology 79:1339-1356
Okubo A (1980) Diffusion and ecological problems: mathematical models. Springer
Richardson, A.J. and D.S. Schoeman. (2004). Climate impact on plankton ecosystems in the Northeast Atlantic. Science 305: 1609-1612.
Schmittner A (2005) Decline of the marine ecosystem caused by a reduction of the Atlantic overturning circulation. Nature 434:628-633
Riley GA, Stommel H, Bumpus DF (1949) Quantitative ecology of the plankton of the western North Atlantic. Bulletin of the Bingham Oceanographic Collection, Yale University. 12:1-169.
Sakshaug E, Slagstad D, Holm-Hansen O (1991) Factors controlling the development of phytoplankton blooms in the antarctic ocean - a mathematical model. Mar.Chem. 35:259-271
Schmittner A (2005) Decline of the marine ecosystem caused by a reduction of the Atlantic overturning circulation. Nature 434:628-633
Sverdrup HU (1953) On conditions for the vernal blooming of phytoplankton. J.Cons.Perm.Int.Explor.Mer 18:287-295
Townsend DW, Keller MD, Sieracki ME, Ackleson SG (1992) Spring phytoplnkton blooms in the absence of vertical water column stratification. Nature 360:59-62
Visser AW, Stips A (2002) Turbulence and zooplankton production: insights from PROVESS. J. Sea Res. 47:317-329
Article 1
EFFECTS OF MIXING DEPTH AND NITROGEN ENRICHMENT ON
MARINE ZOOPLANKTON, PHYTOPLANKTON, LIGHT AND
MINERAL NUTRIENTS
THOMAS J. KUNZ AND SEBASTIAN DIEHL
Article 1 21
Effects of mixing depth and nitrogen enrichment on marine zooplankton,
phytoplankton, light and mineral nutrients
Thomas J. Kunz and Sebastian Diehl
Introduction
The plankton community of the surface mixed layer of lakes and oceans is central to many processes occurring in the pelagic and beyond. Specific phytoplankton production is a function of both nutrient and light availability (Tilman and Kilham 1976, Kirk 1994, Huisman and Weissing 1995) and, in a turbulently mixed layer, subject to the vertical gradient of light intensity in the water column. Vertical mixing causes phytoplankton to experience an average light intensity which decreases with increasing mixing depth, resulting in a decline of the volumetric, depth-averaged primary production (Reynolds 1984, Kirk 1994, Huisman 1999, Diehl et al. 2002). The key role which mixing depth plays in the onset of the annual phytoplankton spring bloom has been recognised early (Gran and Braarud 1935, Sverdrup 1953). While mixing depth is comparatively low and temporally constant in tropical and subtropical regions it may vary regionally and temporally over more than an order of magnitude in mid- and high latitude lakes and oceans (Sterner 1990, Mann & Lazier 1996, Kara et al. 2003, Kunz and Diehl 2003). Mixing depth is therefore usually a key parameter in regional models of pelagic primary production of mid- and high latitudes (e.g., Mitchell and Holm-Hansen 1991, Sakshaug and Slagstad 1991).
In more recent years, the relationships between mixing-depth mediated light supply and phytoplankton biomass have been explored with strategic, mechanistic ecosystem models (Huisman and Weissing 1995, Diehl 2002, Berger et al. submitted, Diehl et al.
submitted). This modelling approach focuses on the dynamic interplay between phytoplankton and its abiotic resources and assumes a small set of resources (light intensity and a single nutrient) to co-limit the specific production of phytoplankton in a homogeneously mixed, open water column such as the mixed surface layer of lakes and oceans. For an algal assemblage of neutrally buoyant or sinking species the models predict the concentration of phytoplankton biomass to decrease with increasing mixing depth over the range of mixed-layer depths usually observed in pelagic systems. Laboratory experiments with freshwater algae (Huisman 1999) and field surveys in freshwater lakes (Soto 2002, Kunz and Diehl 2003, Berger et al. submitted) and in the marine pelagic (Mitchell and Holm-Hansen 1991, Sakshaug et al. 1991, Helbing et al. 1995) have indeed demonstrated that the concentrations of phytoplankton biomass (chlorophyll a and/or seston carbon) correlate negatively with mixing depth.
The above models all make identical qualitative predictions concerning the responses of light and mineral nutrients to increasing mixing depth: both mean light intensity averaged across the mixed layer and light intensity at the bottom of the mixed layer decrease and the concentration of the limiting nutrient increases along a gradient of realistic mixing depths (Huisman and Weissing 1995, Diehl 2002, Berger et al. submitted). Because algae will incorporate less nutrients with increasing light limitation, with increasing depth of the mixed layer, more nutrients should remain in dissolved mineral form (Sakshaug et al. 1991, Huisman and Weissing 1995, Diehl 2002). In the freshwater environment, such a
Article 1 22
pattern has recently been documented in a field survey of a large set of lakes spanning a moderate range of mixing depths (Kunz and Diehl 2003, Berger et al. submitted). In contrast, field evidence of a positive relationship between the dissolved mineral nutrient concentration and depth of the mixed surface layer has, to our knowledge, not been described from the marine environment.
Algal biomass, mineral nutrient concentration, and light climate also depend on external nutrient supply (enrichment). An abundance of studies have related phytoplankton biomass and production to the availability of one or a small set of limiting nutrients (for a review see Cloern 2001) and nitrogen has been identified as the nutrient that primarily limits phytoplankton production in large regions of the world’s oceans (Boyd 2002). The models by Huisman and Weissing (1995), Diehl (2002), and Berger et al. (submitted) all predict nutrient enrichment to positively affect phytoplankton biomass and the concentration of dissolved mineral nutrients, but to negatively affect the light climate in the mixed water column. Because light and nutrients are interactive-essential resources the magnitude of nutrient enrichment effects on phytoplankton biomass is expected to depend on mixing depth; i.e. effects of nutrient enrichment on algal biomass are potentially high at low mixing depths (where light limitation is strong) (Diehl 2002, Berger et al. submitted). Increases in algal biomass in response to enrichment with inorganic nutrients have previously been observed in enclosure experiments across a geographic gradient of coastal waters (Duarte et al. 2000, Olsen et al. 2003). In those experiments, mixing depth was, however, held constant. Experimental data on the role of mixing depth in modifying effects of nutrient enrichment on marine plankton communities are thus lacking.
Resource-consumer theory (Rothhaupt 1988, Grover 1997) predicts that the biomass of consumers should be positively related to
the productivity of their prey and, hence, zooplankton biomass to follow the pattern of phytoplankton production. Effects of upper mixed layer depth and of nutrient enrichment on primary production would then be expected to propagate to higher trophic levels. A decrease of phytoplankton production along a gradient of increasing mixing depth should thus provide an increasingly smaller carbon and energy source for herbivorous proto- and mesozooplankton which may result in a concomitant decrease of the zooplankton biomasses. While there is experimental and comparative evidence that zooplankton biomass is positively related to nutrient enrichment in both lakes and oceans (Harris 1982, Hanson and Peters 1984, Murdoch et al. 1988, Gismervik 1997, Berger et al. submitted) the only study relating zooplankton biomass to mixing depth we are aware of is by Berger et al. (submitted). In that study, conducted in thermally stratified freshwater lakes, a strong negative relationship was found between zooplankton biomass and the depth of the mixed surface layer. To our knowledge, the relationship of zooplankton biomass to mixing depth has not previously been investigated In the marine pelagic.
In this paper we experimentally investigate the influence of mixing depth and enrichment with nitrogen on a North Atlantic plankton assemblage in large field enclosures. Specifically, we manipulated mixing depth on a moderate absolute scale (1.5 to 12 m) but spanning a considerable range of optical depths [the product of mixing depth and the coefficient of background attenuation of light] and supply with nitrogen (total nitrogen concentrations 3 and 41 mmol m-3) and investigated the following response variables: availability of abiotic resources (light and dissolved mineral nitrogen), and the biomasses of phyto-, proto- and mesozooplankton.
Article 1 23
Material and Methods
Study site
The experiment was carried out at Hopavågen, a small (37 ha), basin-shaped and maximally 31 m deep, landlocked bay of the coastal North Atlantic (central Norway, 63°34’13” N 9°42’10” E) in August and September 2000. The water has an average salinity of 31 ‰ and hosts a North Atlantic plankton community. Between 10 and 20 % of Hopavågen’s total water volume (5.5 Mio m-3) are exchanged during a tidal cycle. Mixed-layer depth in September usually exceeds 14 m and the bottom part of the water body is largely excluded from water exchange with the ocean (van Marion 1996).
Experimental set-up
We manipulated mixing depth and nutrient content in experimental enclosures suspended from a raft structure which consisted of large, octagonal plastic rings, each accommodating up to four cylindrical enclosures of 0.95 m diameter. Overall, there were 14 enclosures. The raft was anchored at a water depth of c. 18 m. Individual enclosures consisted of opaque (inside black, outside white) plastic foil to provide for high background turbidity and extended 0.25 m above the water surface. The enclosures were open to the atmosphere and had a conical, heat-sealed ending at the bottom. Enclosures were filled with water from a depth of 3-4 m via pumping. Filling of the enclosures lasted from 26 to 28 August. Originally we wanted to investigate a nutrient-phytoplankton-only system and therefore filtered the inflowing water through a gauze (mesh size 100 µm) to exclude mesozooplankton grazers. However, appendicularians and copepod eggs, nauplii, and possibly some early-stage copepodids passed the net and developed into a mesozooplankton community during the
course of the experiment. By Day 25 mesozooplankton densities had attained values typical for regional summer stocks, which allowed us to investigate effects of mixing depth also on metazoan secondary producers.
We generated two gradients of mixing depths (enclosure depths 1.5, 3, 4.5, 6, 7.5, 9 and 12 m). Homogeneous mixing was generated by intermittently blowing air into the bottom end of the enclosures for 30-second periods, and at 10 min intervals, using electrically driven compressors and PVC tubing (inner diameter 6 mm). The resulting air bubbles generated strong turbulence (vertical eddy diffusivity ≈ 120 cm-2 s-1 , as determined in a second experiment).
Temperature differences between just below the water surface and the greatest mixed depth of individual enclosures did never exceed 0.2 °C suggesting that the generated turbulence mixed the water columns homogeneously. Temperature differences among enclosures never exceeded 0.6 °C.
One set of enclosures was kept at ambient concentrations of total nitrogen (3 mmol N m-3, ‘Ambient N’ enclosures) whereas the second set was enriched to approximately 14 times that level (41.4 mmol N m-3, ‘N-enriched’ enclosures) with ammonium-nitrate on Day 0 of the experiment (31 August 2000). Each depth x nutrient combination was present once. The two sets of enclosures were enriched with sodium-phosphate and sodium-silicate such that nitrogen would be the limiting nutrient (TN:TP:Si = 2.5 : 1 : 0.9 in 'Ambient N' treatments, TN:TP:Si = 6.9 : 1 : 2.3 in 'N-enriched' treatments). Ratios differed because ambient N and Si levels could not be measured before fertilization so that fertilization was based on nutrient contents typical for the region at this time of the year. By the end of the experiment (25 September 2000), TN:TP:Si ratios averaged across the two mixing-depth gradients were 1.7 : 1 : 1.1 in 'Ambient N' treatments and 4.9 : 1 : 2.5 in 'N-enriched' treatments.).
Article 1 24
Sampling and laboratory analyses
We sampled the enclosures for chlorophyll a concentration at 2-day intervals and for particulate organic carbon (POC), the concentrations of dissolved inorganic nitrogen (DIN = NO2 -, NO3 - and NH4 –N), phosphorus and silica, and of total nutrients (TN and TP) at 6-day intervals. Samples were collected below the water surface with 3-L HDPE flasks and 200 ml glass vials, respectively. Seston sedimenting out of the mixed water columns was collected with sedimentation traps (opening diameter = 29 mm, volume = 100 ml) which were suspended centrally at the bottom of each enclosure. The traps were sampled and replaced at 6-day intervals.
The vertical distribution of photosynthetically active radiation (PAR) was measured at 6-day with a spherical underwater quantum sensor (LI-193SA, LICOR, Lincoln, Nebraska) in 1-m intervals and beginning just below the water surface. Light intensity at the bottom of the water column (Iout) was then calculated as a percentage of the subsurface (incident) light intensity. Mean light intensity in the water column (Imix) was determined as Imix = 100 * (1-e -K zmix) (K zmix) -1 , with zmix being enclosure depth and K the light attenuation coefficient obtained as the slope of a linear regression of ln-transformed PAR against depth.
Filtering of sub-samples and analysis of total phosphorus was conducted at the field station of the Norwegian University of Science and Technology (NTNU), Sletvik, in the immediate vicinity of Hopavågen. Total phosphorus was analysed according to the molybdenum-blue method from samples stored at 4 °C one day after collection. To assess Chl a concentrations 0.2-0.7 L subsamples were filtered onto glass microfiber filters (GF/C, Whatman). Chl a was measured fluorometrically after extraction with methanol. To assess POC concentrations 0.2-0.5 L subsamples were filtered onto
precombusted GF/C filters. The POC content of sedimentation traps was assessed in the same way. Filters were dried at 60 °C for 24 hours, wrapped in tin foil cups, compressed to balls and then combusted in a CN-Analyser (NA 1500N, FISONS). Dissolved inorganic nutrients were analysed with a SKALAR SAN plus SYSTEM auto-analyser from subsamples frozen at –18°C.
Calculation of seston production and loss rates
To investigate the relationships of specific seston production and sedimentation loss rates to the depth of the mixed water column we calculated these rates in week 1 of the experiment when grazing by mesozooplankton should still have been negligible and sinking likely was the major loss process of phytoplankton. Specific gross production rate pg was approximated as pg = pn + ls with pn being specific net production and ls specific sedimentation loss rate. Following Diehl et al. (2002), specific daily net production rate was estimated as pn = 1 / t * ln (Wt/W0) with W0 and Wt being the depth-integrated standing stocks of seston organic carbon at the beginning and end of week 1, respectively. Specific daily sedimentation rate was then calculated according to Visser (1996) as ls = pn (F / {Wt - W0}) with F being the amount of POC sedimented per unit area in the sediment trap during week 1.
Microplankton
For the assessment of phyto- and protozooplankton biomasses 100-ml samples were collected from individual enclosures on Day 25 of the experiment and preserved with acid Lugol’s solution (1 % final concentration). Depending on chlorophyll a levels, sub-samples of 25, 50 or 100 ml were transferred to sedimentation chambers and analysed via phase contrast microscopy in an
Article 1 25
inverted microscope according to Utermöhl (1958). For species exceeding 50 µm in greatest linear dimension or clearly distinguished taxa the whole sedimentation chamber was scanned at 63 x magnification. For species from 30 to 50 µm two to six transects across the sedimentation chamber were scanned at 200 x magnification and for species smaller than 30 µm one transect was scanned at 400 x magnification. To limit counting error to ± 20 %, at least 100 specimen were counted per taxon, sufficient abundance provided. Volume estimates were calculated based on linear dimensions of ≥ 30 specimen in the more abundant taxa, measured with Analysis Pro software (Soft Imaging Systems, Münster, Germany) and a black/white CCD camera (Sanyo, Japan) and using formulae from Hillebrand et al. (1999) and Sun and Liu (2003). Since no effects of treatment on mean size of individual taxa were observed, taxon-specific biovolume was averaged across treatments. In chain-forming, colonial species, a mean cell number per colony was calculated from 20 to 30 colonies and multiplied by the averaged cell volume. In rare species biovolume was calculated on the basis of a small number of measured individuals. Biovolume was converted to carbon mass using the formulae given in Menden-Deuer and Lessard (2000) for diatoms and ‘other phytoplankton’.
Mesozooplankton
Mesozooplankton was sampled by hauling a zooplankton net (mesh width 100 µm) vertically through the mixed water columns, transfer of the catch to 100 ml plastic flasks and immediate preservation with acid Lugol’s solution to 1 % final concentration. Zooplankters were determined to genus or species level and enumerated on a dissecting microscope at 160 x magnification. Copepodids and nauplius larvae were counted separately. If appendicularians had
disintegrated into trunk and tail only trunks were counted. Copepod length was measured from the anterior tip of the cephalosome to the tip of the urosome (telson). Carbon weight was then calculated according to the formulae compiled in Tokle (1999). In appendicularians (Oikopleura), trunk length was measured to the nearest 10 µm, converted into ash-free dry weight according to Pfaffenhöfer (1976) and then multiplied by a factor of 0.45 to yield carbon-based biomass (Uye and Ichino 1994). Mesozooplankton taxa not exceeding 20 individuals m-3 were excluded from analysis.
Data analysis
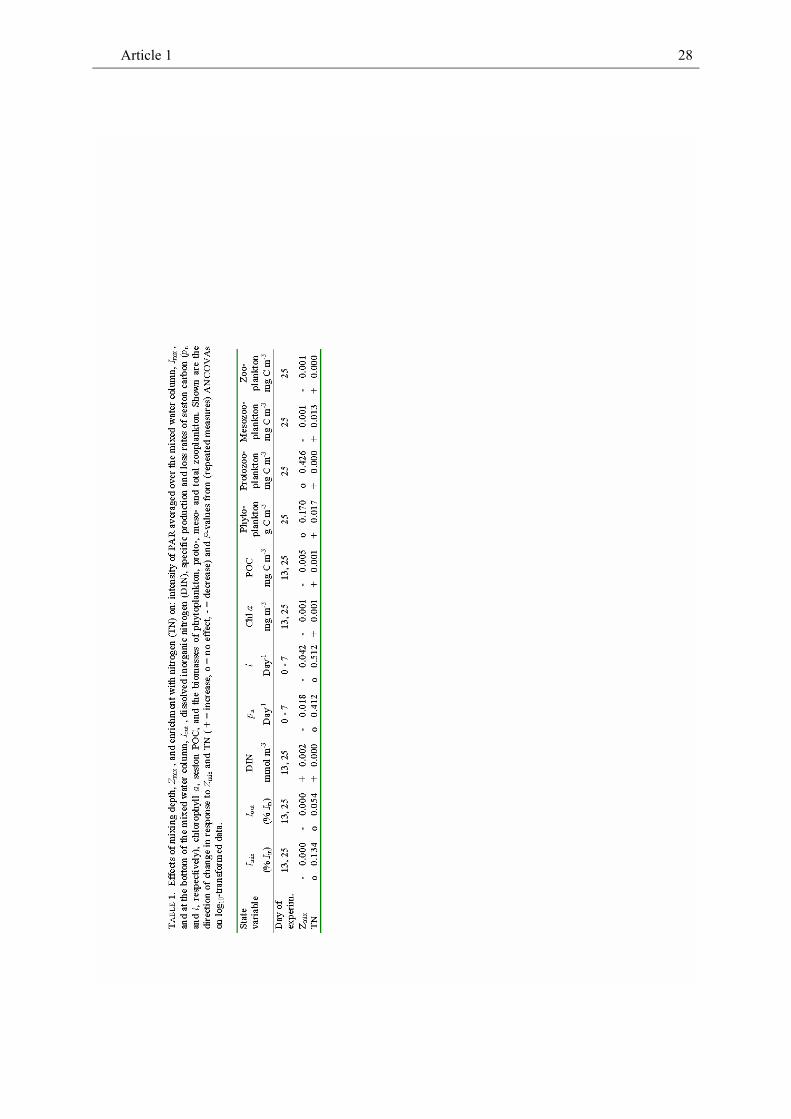
The qualitative responses of most state variables to the nutrient and mixing depth treatments started to become apparent early in the experiment. Where available, we analysed data from Days 13 and 25 which are representative for the average patterns during the experiment. Of the dissolved inorganic nutrient concentrations, we only show nitrogen. For all statistical analyses response variables were log10-transformed. Treatment and interaction effects were explored using repeated-measures analysis of covariance (ANCOVA) on seston, light and nutrient data from Days 13 and 25 of the experiment with nutrient content (‘Ambient N’ or ‘N-enriched’) as a fixed factor and mixing depth as the covariate. Biomass data of phyto-, protozoo-, and mesozooplankton from Day 25 were investigated by analysis of covariance. When P of interaction effects exceeded 0.2 the interaction term was dropped from the statistical model and the main effects of mixing depth and nutrient enrichment were investigated only.
The removal of mesozooplankton prior to the start of the experiment was effective in all enclosures except for the 9-m 'Ambient N' treatment. Here, initial densities of copepodids and calanoid copepods were five times higher than in the other treatments (1.6 Ind L-1 vs. 0.3
Article 1 26
Ind L-1). We suspect that these initial differences were responsible for the persistently higher mesozooplankton densitites in the 9-m 'Ambient N' treatment compared to most other enclosures and therefore excluded this treatment from all analyses. Statistical analyses were performed using SPSS 12.0.1 software.
Results
Light and nutrients
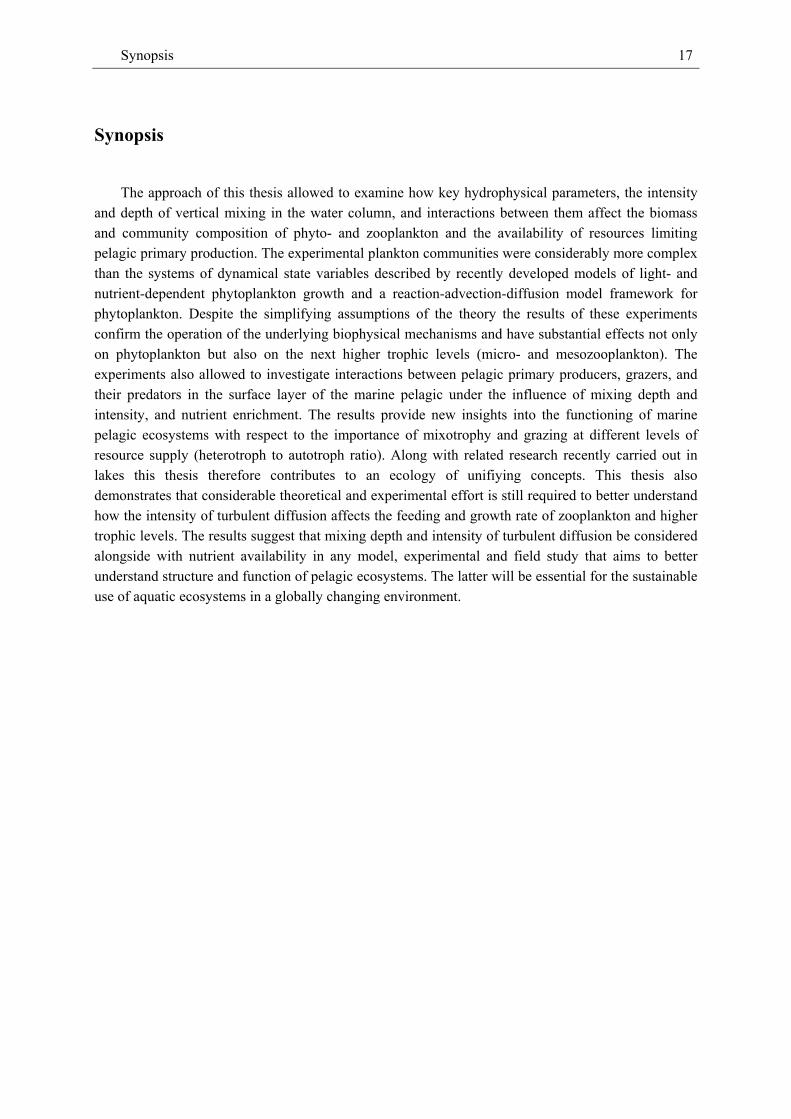
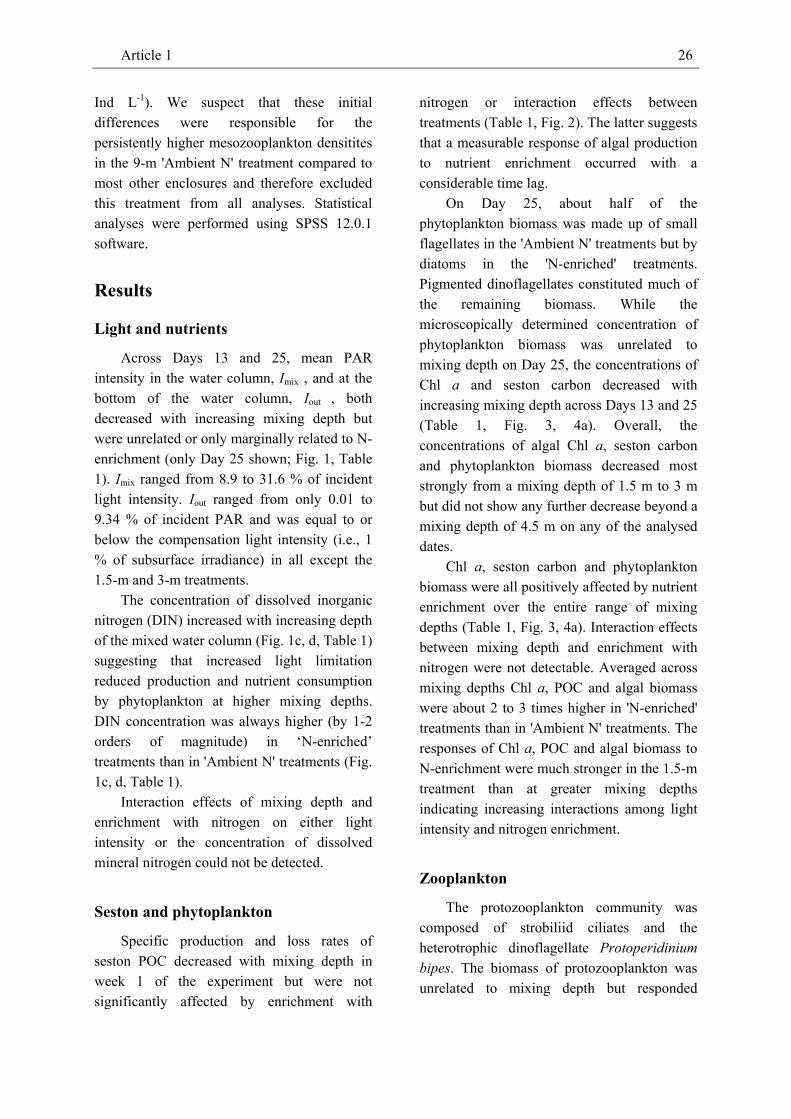
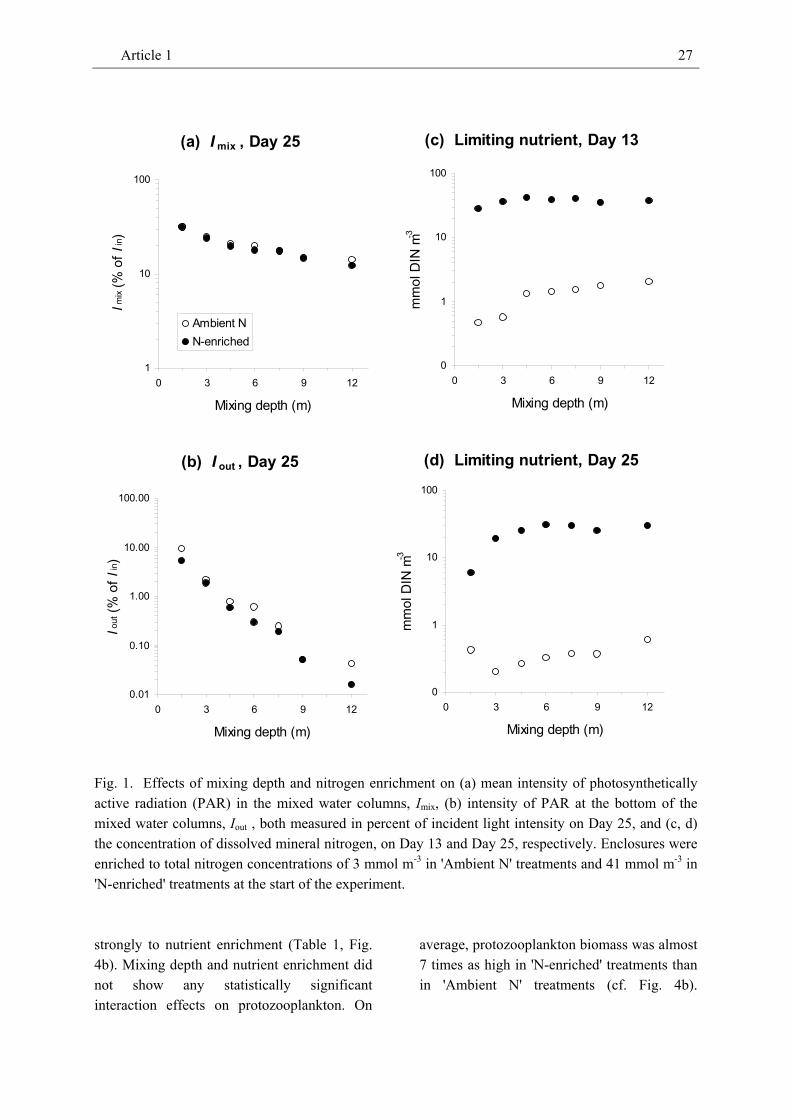
Across Days 13 and 25, mean PAR intensity in the water column, Imix , and at the bottom of the water column, Iout , both decreased with increasing mixing depth but were unrelated or only marginally related to N-enrichment (only Day 25 shown; Fig. 1, Table 1). Imix ranged from 8.9 to 31.6 % of incident light intensity. Iout ranged from only 0.01 to 9.34 % of incident PAR and was equal to or below the compensation light intensity (i.e., 1 % of subsurface irradiance) in all except the 1.5-m and 3-m treatments.
The concentration of dissolved inorganic nitrogen (DIN) increased with increasing depth of the mixed water column (Fig. 1c, d, Table 1) suggesting that increased light limitation reduced production and nutrient consumption by phytoplankton at higher mixing depths. DIN concentration was always higher (by 1-2 orders of magnitude) in ‘N-enriched’ treatments than in 'Ambient N' treatments (Fig. 1c, d, Table 1).
Interaction effects of mixing depth and enrichment with nitrogen on either light intensity or the concentration of dissolved mineral nitrogen could not be detected.
Seston and phytoplankton
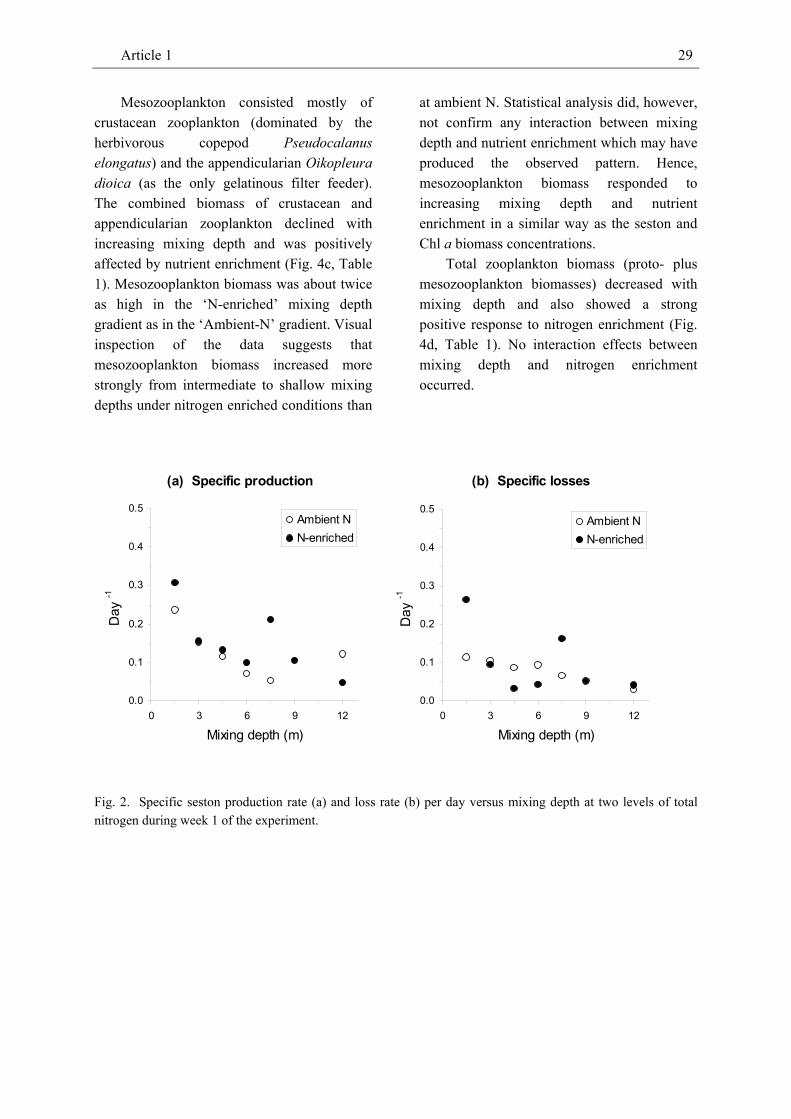
Specific production and loss rates of seston POC decreased with mixing depth in week 1 of the experiment but were not significantly affected by enrichment with
nitrogen or interaction effects between treatments (Table 1, Fig. 2). The latter suggests that a measurable response of algal production to nutrient enrichment occurred with a considerable time lag.
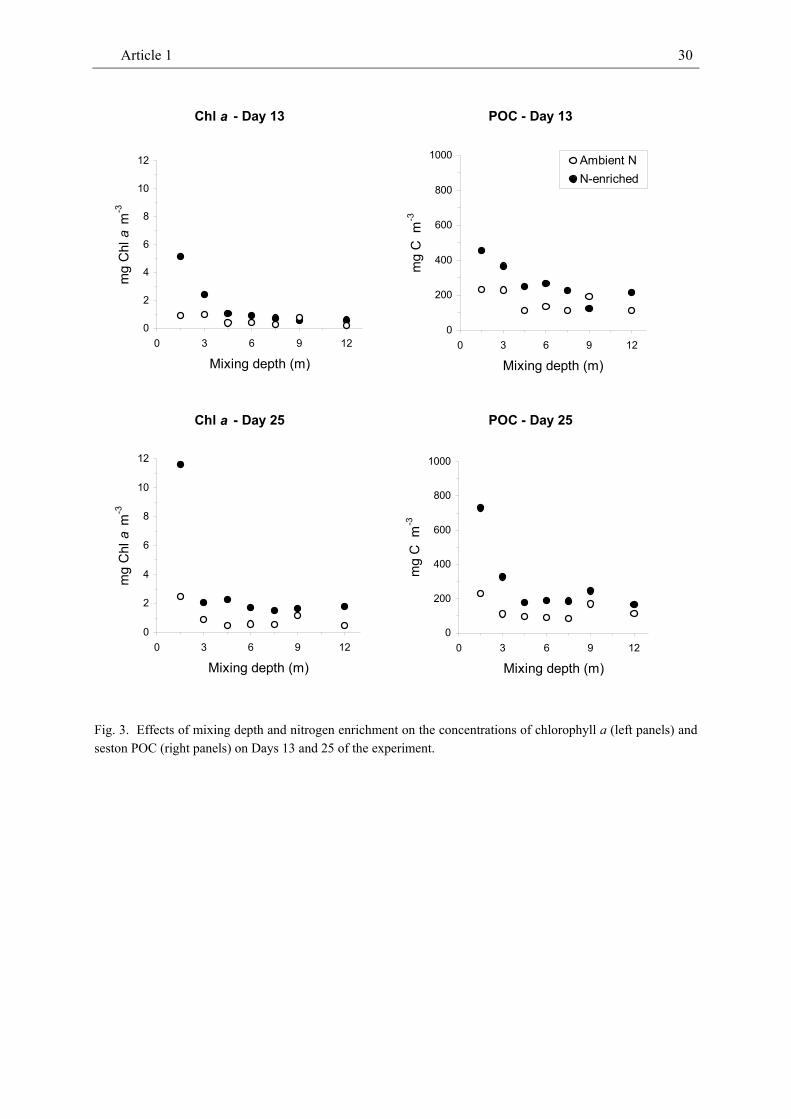
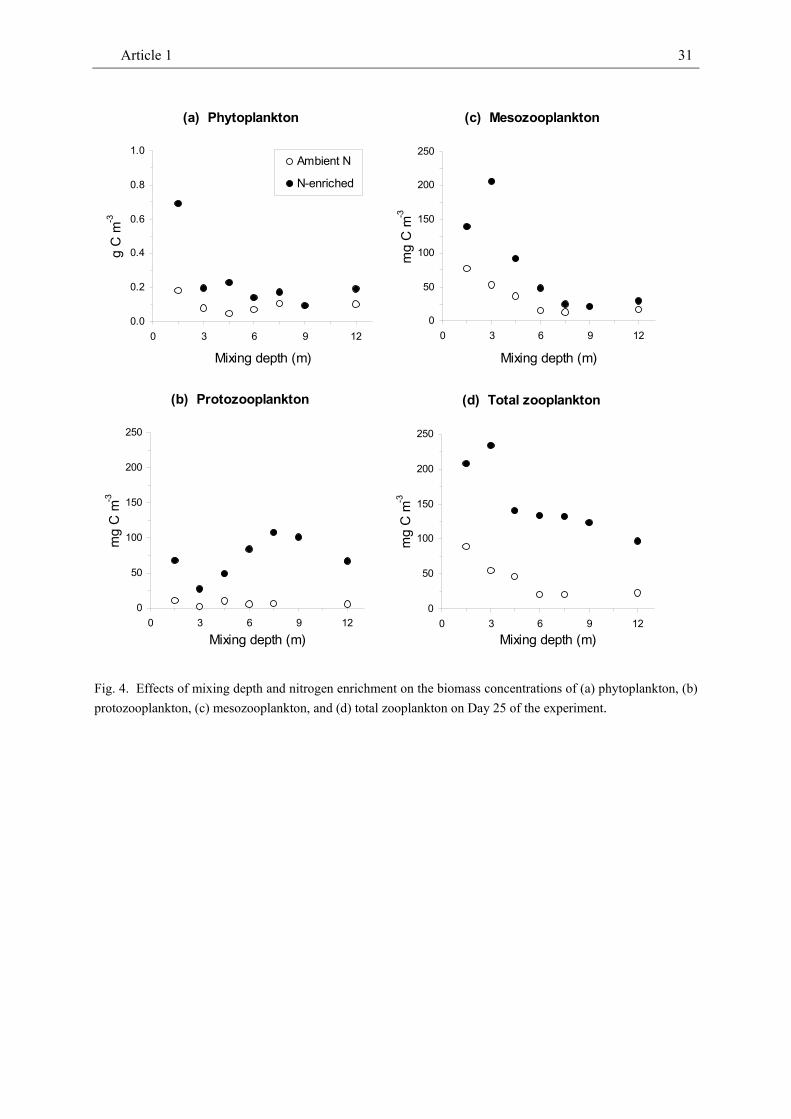
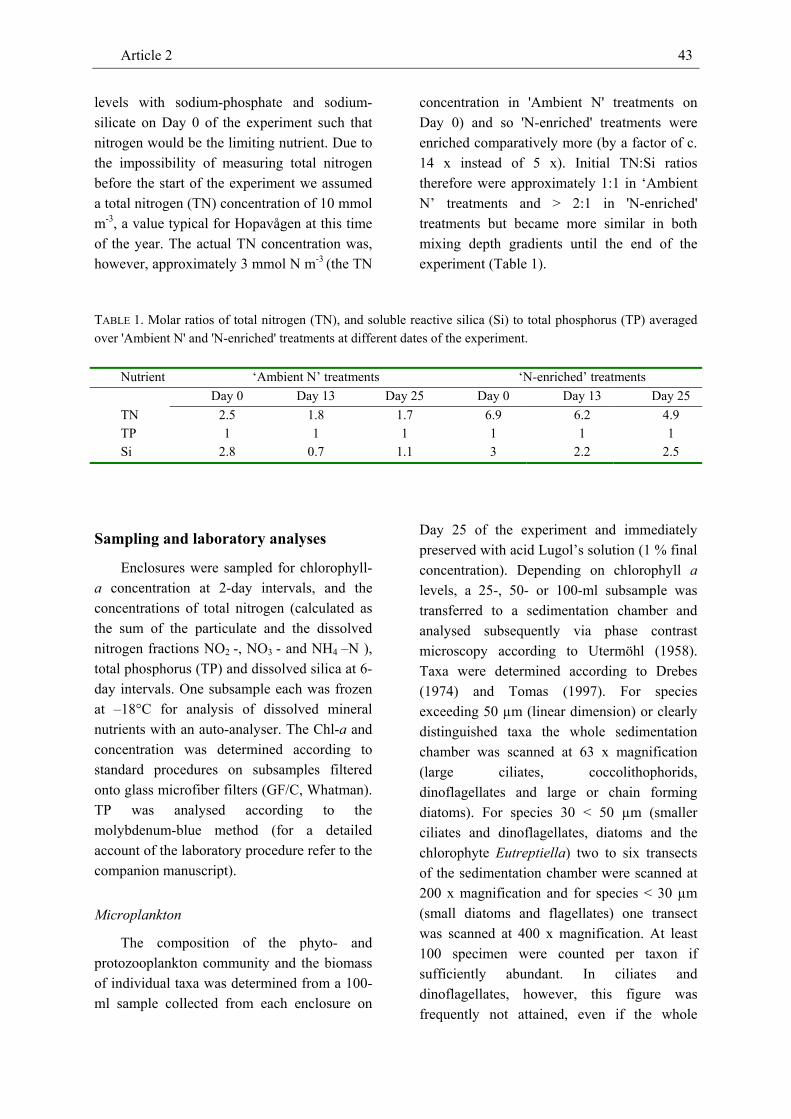
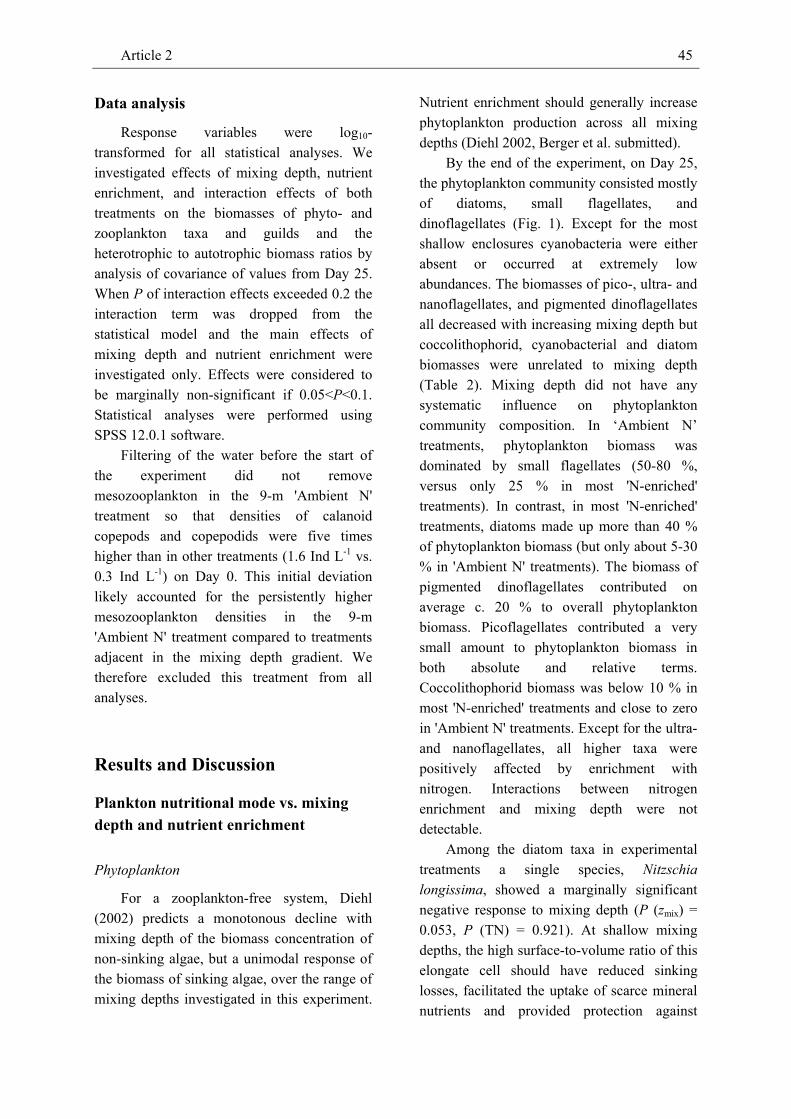
On Day 25, about half of the phytoplankton biomass was made up of small flagellates in the 'Ambient N' treatments but by diatoms in the 'N-enriched' treatments. Pigmented dinoflagellates constituted much of the remaining biomass. While the microscopically determined concentration of phytoplankton biomass was unrelated to mixing depth on Day 25, the concentrations of Chl a and seston carbon decreased with increasing mixing depth across Days 13 and 25 (Table 1, Fig. 3, 4a). Overall, the concentrations of algal Chl a, seston carbon and phytoplankton biomass decreased most strongly from a mixing depth of 1.5 m to 3 m but did not show any further decrease beyond a mixing depth of 4.5 m on any of the analysed dates.
Chl a, seston carbon and phytoplankton biomass were all positively affected by nutrient enrichment over the entire range of mixing depths (Table 1, Fig. 3, 4a). Interaction effects between mixing depth and enrichment with nitrogen were not detectable. Averaged across mixing depths Chl a, POC and algal biomass were about 2 to 3 times higher in 'N-enriched' treatments than in 'Ambient N' treatments. The responses of Chl a, POC and algal biomass to N-enrichment were much stronger in the 1.5-m treatment than at greater mixing depths indicating increasing interactions among light intensity and nitrogen enrichment.
Zooplankton
The protozooplankton community was composed of strobiliid ciliates and the heterotrophic dinoflagellate Protoperidinium bipes. The biomass of protozooplankton was unrelated to mixing depth but responded
Article 1 27
(a) I mix , Day 25
1
10
100
0 3 6 9 12
Mixing depth (m)
Im
ix (%
of I
in)
Ambient NN-enriched
(c) Limiting nutrient, Day 13
0
1
10
100
0 3 6 9 12
Mixing depth (m)m
mol
DIN
m-3
(b) I out , Day 25
0.01
0.10
1.00
10.00
100.00
0 3 6 9 12
Mixing depth (m)
Iout (%
of I
in)
(d) Limiting nutrient, Day 25
0
1
10
100
0 3 6 9 12
Mixing depth (m)
mm
ol D
IN m
-3
Fig. 1. Effects of mixing depth and nitrogen enrichment on (a) mean intensity of photosynthetically active radiation (PAR) in the mixed water columns, Imix, (b) intensity of PAR at the bottom of the mixed water columns, Iout , both measured in percent of incident light intensity on Day 25, and (c, d) the concentration of dissolved mineral nitrogen, on Day 13 and Day 25, respectively. Enclosures were enriched to total nitrogen concentrations of 3 mmol m-3 in 'Ambient N' treatments and 41 mmol m-3 in 'N-enriched' treatments at the start of the experiment.
strongly to nutrient enrichment (Table 1, Fig. 4b). Mixing depth and nutrient enrichment did not show any statistically significant interaction effects on protozooplankton. On
average, protozooplankton biomass was almost 7 times as high in 'N-enriched' treatments than in 'Ambient N' treatments (cf. Fig. 4b).
Article 1 28
Article 1 29
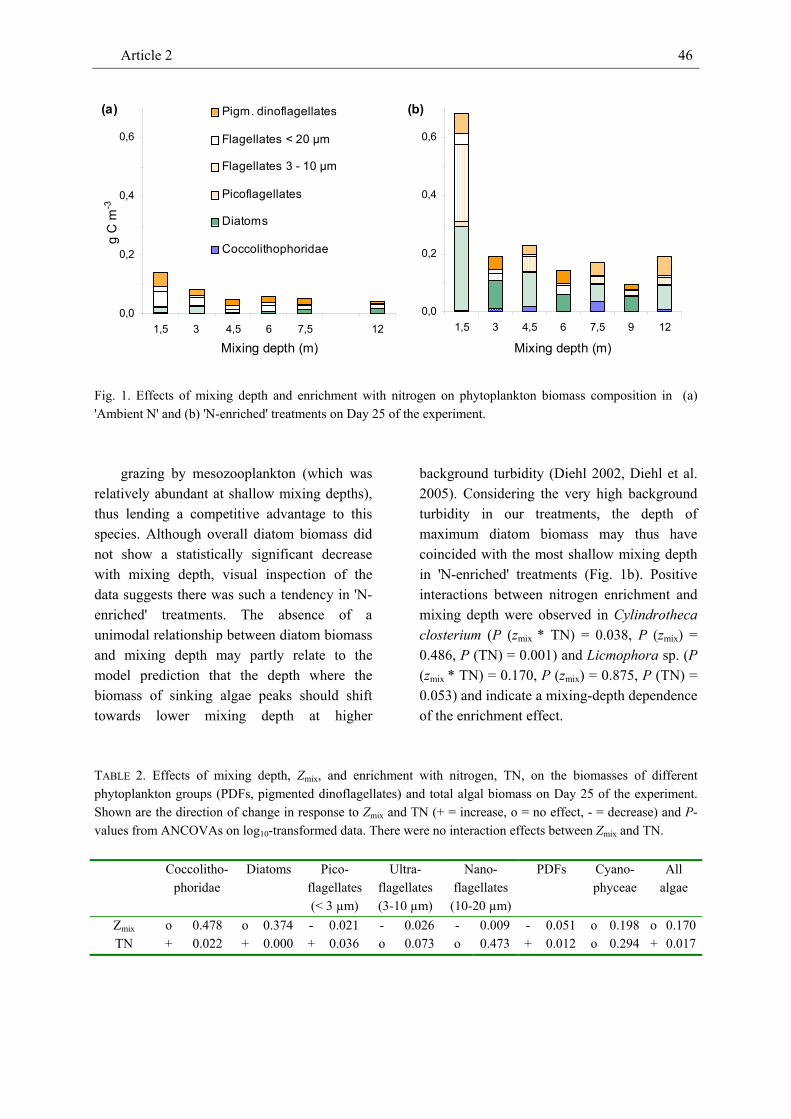
Mesozooplankton consisted mostly of crustacean zooplankton (dominated by the herbivorous copepod Pseudocalanus elongatus) and the appendicularian Oikopleura dioica (as the only gelatinous filter feeder). The combined biomass of crustacean and appendicularian zooplankton declined with increasing mixing depth and was positively affected by nutrient enrichment (Fig. 4c, Table 1). Mesozooplankton biomass was about twice as high in the ‘N-enriched’ mixing depth gradient as in the ‘Ambient-N’ gradient. Visual inspection of the data suggests that mesozooplankton biomass increased more strongly from intermediate to shallow mixing depths under nitrogen enriched conditions than
at ambient N. Statistical analysis did, however, not confirm any interaction between mixing depth and nutrient enrichment which may have produced the observed pattern. Hence, mesozooplankton biomass responded to increasing mixing depth and nutrient enrichment in a similar way as the seston and Chl a biomass concentrations.
Total zooplankton biomass (proto- plus mesozooplankton biomasses) decreased with mixing depth and also showed a strong positive response to nitrogen enrichment (Fig. 4d, Table 1). No interaction effects between mixing depth and nitrogen enrichment occurred.
(a) Specific production
0.0
0.1
0.2
0.3
0.4
0.5
0 3 6 9 12
Mixing depth (m)
Day
-1
Ambient NN-enriched
(b) Specific losses
0.0
0.1
0.2
0.3
0.4
0.5
0 3 6 9 12
Mixing depth (m)
Day
-1
Ambient NN-enriched
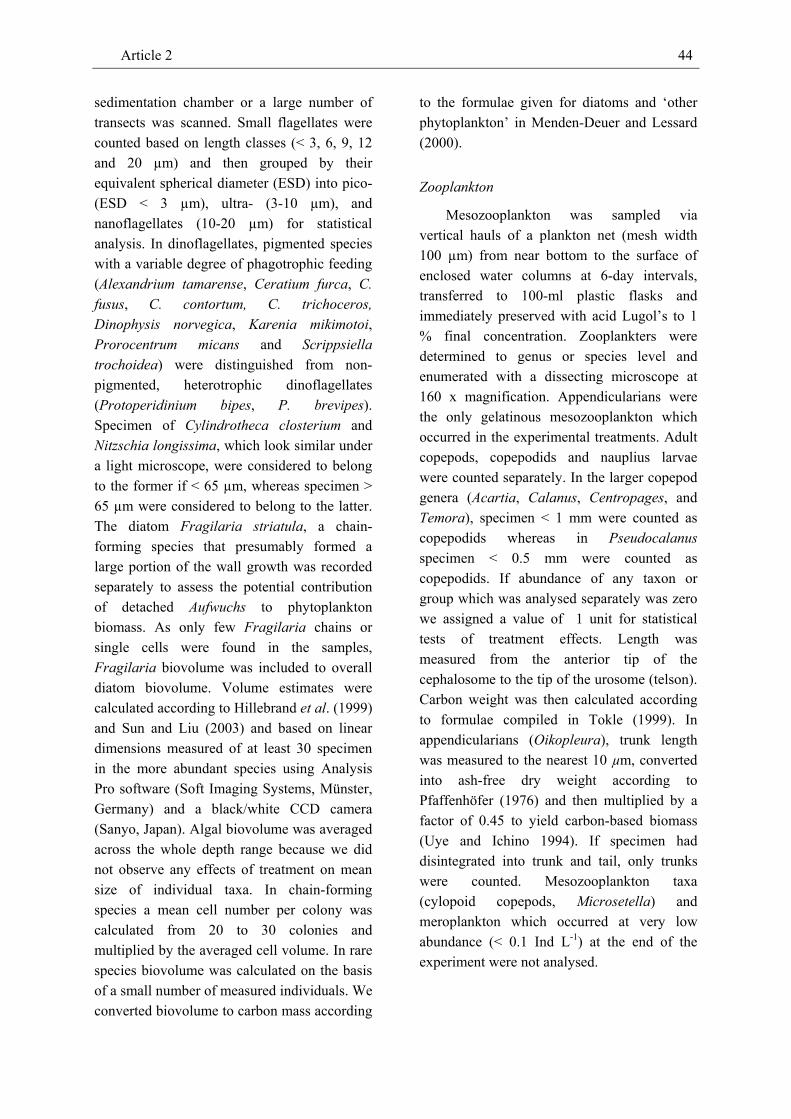
Fig. 2. Specific seston production rate (a) and loss rate (b) per day versus mixing depth at two levels of total nitrogen during week 1 of the experiment.
Article 1 30
Chl a - Day 13
0
2
4
6
8
10
12
0 3 6 9 12
Mixing depth (m)
mg
Chl
a m
-3POC - Day 13
0
200
400
600
800
1000
0 3 6 9 12
Mixing depth (m)
mg
C m
-3
Ambient NN-enriched
Chl a - Day 25
0
2
4
6
8
10
12
0 3 6 9 12
Mixing depth (m)
mg
Chl
a m
-3
POC - Day 25
0
200
400
600
800
1000
0 3 6 9 12
Mixing depth (m)
mg
C m
-3
Fig. 3. Effects of mixing depth and nitrogen enrichment on the concentrations of chlorophyll a (left panels) and seston POC (right panels) on Days 13 and 25 of the experiment.
Article 1 31
(a) Phytoplankton
0.0
0.2
0.4
0.6
0.8
1.0
0 3 6 9 12
Mixing depth (m)
g C
m-3
Ambient N
N-enriched
(c) Mesozooplankton
0
50
100
150
200
250
0 3 6 9 12
Mixing depth (m)
mg
C m
-3(b) Protozooplankton
0
50
100
150
200
250
0 3 6 9 12
Mixing depth (m)
mg
C m
-3
(d) Total zooplankton
0
50
100
150
200
250
0 3 6 9 12Mixing depth (m)
mg
C m
-3
Fig. 4. Effects of mixing depth and nitrogen enrichment on the biomass concentrations of (a) phytoplankton, (b) protozooplankton, (c) mesozooplankton, and (d) total zooplankton on Day 25 of the experiment.
Article 1 32
Discussion
In the following we investigate how the patterns of state variables observed in this experiment compare to theoretical expectations and to evidence from other field experiments and surveys in the marine and freshwater environments.
Limiting resources
The theoretical expectation of Imix and Iout to decrease with increasing mixing depth has previously been corroborated in freshwater lakes in both enclosure experiments (Diehl et al. 2002, Diehl et al. submitted) and field surveys (Kunz and Diehl 2003, Berger et al submitted). The finding of a monotonous decrease of both Imix and Iout with increasing mixing depth in this marine enclosure experiment accounts for the observed decrease of seston production rate and the associated decrease of algal biomass along the mixing depth gradient (assuming the same processes to operate in week 1 and after).
Strong negative effects of nutrient enrichment on the respective light intensities could not be demonstrated in this enclosure experiment, even though values of Imix and Iout tended to be lower in 'N-enriched' treatments as compared with 'Ambient N' treatments on Day 25 (Fig. 1a,b). Because N-enrichment increased seston biomass, the lack of a strong N-enrichment effect on light climate indicates that background attenuation (as mimicked by the black plastic material) was the main light absorbant with phytoplankton absorbing comparatively little light. In field surveys of 65 dimictic, central European lakes ranging in phosphorus content from 7-122 µg l-1 deteriorating mixed layer light climate could be related to the total concentration of phosphorus, the nutrient assumed to limit phytoplankton biomass in these studies (Kunz and Diehl 2003, Berger et al. submitted). In the
marine environment, a negative feedback of algal biomass on light availability has, for example, been reported from Antarctic waters (Tilzer et al. 1994).
Low concentrations of the limiting macronutrient are usually associated with seasonal or permanent water column stratification whereas high concentrations occur in upwelling regions or during periods of whole water-column mixing (when nutrients are supplied from underlying layers of water or the sediment). The pattern observed of increasing concentrations of dissolved nitrogen with mixing depth at both levels of enrichment in our experiment indicates increasing light limitation of algal production along the mixing depth gradient. Our study thus corroborates central predictions derived from Huisman and Weissing (1995), Diehl (2002), and Berger et al. (submitted) despite that all these models neglect grazing processes. Grazing on phytoplankton is known to considerably affect the distribution of mineral nutrients among different organic and inorganic pools in the water column.
Patterns in algal biomass
Algal biomass vs. mixing depth
Manipulation of mixing depth in field enclosures in a freshwater lake has previously shown that a phytoplankton community will experience the predicted shift in limitation by sedimentation, nutrients and light along a mixing depth gradient (Diehl 2002, Diehl et al. 2002, Diehl et al. submitted). Hence, across a realistic range of mixing depths the concentration of algal biomass will usually decrease. In the marine pelagic, a negative correlation between mixed layer depth and proxies of phytoplankton density has been identified in a number of field surveys, often from polar waters (Mitchell and Holm-Hansen 1991, Eldridge and Sieracki 1993, Helbing et al. 1995). For example, van Oijen et al. (2004),
Article 1 33
related low algal carbon assimilation and Chl a concentrations in the Atlantic sector of the Southern Ocean to the mixing-depth mediated, limited light availability during austral autumn (when iron is usually not limiting). Likewise, Sakshaug (personal communication) identified a negative relation between Chl a concentration and depth of the upper mixed layer in the Greenland Sea. Visual inspection of vertical temperature, salinity and Chl a profiles from the North Atlantic presented by Backhaus et al. (2003) also suggests a negative relationship between phytoplankton concentration and depth of the mixed layer. Shallowing of the thermocline from 125 m to c. 25 m and an associated decrease in mixed layer depth in the equatorial Pacific might also explain the unusually large-scale surface bloom of phytoplankton observed during the transition from El Niño to La Niña in 1998 (cf. Ryan et al. 2002).
An experimental manipulation of the depth of turbulent mixing in the marine environment has to date not been conducted to our knowledge. Our findings of the specific production and loss rates of seston POC and the biomass concentrations of Chl a and POC to decrease with increasing mixing depth in the marine pelagic strongly suggest that the central underlying mechanisms are similar in freshwater and marine phytoplankton communities. How then can the lack of a significantly negative linear relationship between algal biomass and mixing depth be explained? As shown in our companion manuscript, the biomass of some species of pigmented dinoflagellates was unrelated to or tended to increase with mixing depth and may therefore also account for the increase with mixing depth of the seston POC : Chl-a ratio (P(Zmix) = 0.001, P(TN) = 0.003). The decrease with mixing depth in the biomass of small flagellates (a dominant group of phytoplankton in the experimental enclosures) was thus compensated by an increase of the biomass of dinoflagellates.
This study confirms the prediction by Diehl (2002) and Berger et al. (submitted) that along a mixing depth gradient phytoplankton production and biomass concentration should generally experience a shift in the relative importance of factors limiting phytoplankton growth. While zooplankton grazing was an important loss factor at all mixing depths (see below), the importance of sedimentation losses and the availability of mineral nutrients (DIN concentration) as limiting factors was overriding in the most shallow mixing-depth treatments (Fig. 1, 2b, 3, 4). Increasing mixing depth (i.e., decreasing light availability) and high background turbidity (caused, mostly, by the black enclosure material) strongly limited phytoplankton biomass at mixing depths of 3 m and deeper.
Algal biomass vs. nutrient enrichment
A positive response of phytoplankton biomass to nutrient enrichment across a gradient of mixing depths as predicted by Diehl (2002) has previously been shown in freshwater lakes (Kunz and Diehl 2003, Berger et al. submitted). Our manipulative study now also confirms the validity of this prediction in the marine pelagic. In line with model predictions, the increase of phytoplankton biomass in response to nutrient enrichment was strongest among the shallow-most treatments where light was not or least limiting. The response of phytoplankton biomass was considerably smaller at intermediate and large mixing depths where light became increasingly limiting to algal growth (Fig. 2a). Over the course of the experiment, Chl a concentrations decreased from an initial 1.8 mg m-3 to c. 1 mg m-3 in 'Ambient N' treatments and increased to c. 3 mg m-3 in 'N-enriched' treatments (but was very high at a mixing depth of 1.5 m). These concentrations are typical for oligotrophic, oceanic and eutrophic, coastal waters, respectively, of the North Atlantic in summer. Averaged across all mixing depths, N-
Article 1 34
enrichment by a factor of 14 (‘N-enriched’ vs. ‘Ambient N’ treatments) resulted in a doubling of the seston, Chl a and phytoplankton concentrations (Fig. 3, 4). While light availability at intermediate to large mixing depth obviously was the overriding limiting factor to phytoplankton, grazing by proto- and mesozooplankton should have dampened the growth response of phytoplankton biomass to light and nutrient enrichment.
Patterns in zooplankton biomass
Enrichment with light (such as by a decrease in mixing depth) and nutrients should, in general, positively affect consumers of algal biomass. Relationships between total zooplankton biomass, mixing depth, and total phosphorus which confirm the operation of such mechanisms were recently detected in a set of 40 central European lakes (Berger et al. submitted). In the following we describe treatment effects on the biomass of proto- and mesozooplankton grazer guilds.
Protozooplankton
In our experiment mixing depth did not affect the biomass of protozooplankton (ciliates plus heterotrophic dinoflagellates) (Fig. 4b, Table 1). In our companion manuscript we show that the tendency of ciliate biomass to decrease towards greater mixing depths was compensated by increasing biomass of heterotrophic dinoflagellates. As a result, the biomass of protozooplankton was unrelated to mixing depth. In contrast, protozooplankton responded strongly to nutrient enrichment, suggesting bottom-up effects of nutrients via phytoplankton production. This is indicated by a positive correlation between protozooplankton biomass and the Chl a concentration (Pearson’s r = 0.62 , P = 0.023) and a marginally significant correlation with phytoplankton biomass (Pearson’s r = 0.55, P = 0.051). Positive
effects of enrichment on protozooplankton are in line with classical food-chain theory and have also been reported from other marine mesocosm studies, although not in a gradient of derichment with light (Kivi et al. 1993, Escarvage and Prins 2002, Gismervik et al. 2002, Vadstein et al. 2004). Visual inspection of the protozooplankton-mixing depth relationship suggests a negative relationship between protozoo- and mesozooplankton biomasses in 'N-enriched' treatments. Statistical analysis indeed confirmed the existence of a strong negative correlation between these guilds (Pearson’s r = -0.838, P = 0.019). Such top-down effects of meso- on protozooplankton have previously been demonstrated with respect to omnivorous copepods on ciliates (see, e.g., Vadstein et al. 2004).
Mesozooplankton
In the marine pelagic, the biomass of copepods (which frequently form a major component of mesozooplankton) generally seems to be unrelated to water column structure (Kiørboe 1991). The negative effects of mixing depth on the biomass of mesozooplankton (which was largely composed of different species of copepods) detected in this experimental study represent the first such evidence from the marine pelagic. The disparity observed between experimental and correlational studies may result from the different temporal scale operating on the systems under investigation: whereas ecosystem-level variables may seem to approach equilibrium in short-term experiments, natural systems are subject to processes like invasion and extinction which retard equilibration of the system (Leibold et al. 1997). Also, sampling often occurs at standard depths or integrated over the whole water column (instead of the mixed layer) or copepods are not recorded due to their diel vertical migration to sub-surface layers of the
Article 1 35
water column performed in some regions. As a consequence, other proxies of copepod numerical response such as the egg production rate have usually been used to investigate relationships with phytoplankton in the field (see, for example, Kiørboe et al. 1990, Kiørboe and Nielsen 1994).
Though positive effects of nutrient enrichment on the biomass of marine mesozooplankton have been observed in marine micro- and mesocosm experiments (Harris et al. 1982, Gismervik et al. 1997, Ptacnik et al. 2004) the qualitatively novel finding of this study is their observation across a gradient of mixing depths and including appendicularian zooplankton. Positive correlations between mesozooplankton biomass and the concentrations of Chl a (Pearson’s r = 0.72, P < 0.005), POC (Pearson’s r = 0.73, P < 0.005) and phytoplankton biomass (Pearson’s r = 0.62, P < 0.024) all indicate that effects of mixing depth and nutrient enrichment propagated up the food chain via phytoplankton. Because the biomass of mesozooplankton was relatively large compared to protozooplankton biomass, overall zooplankton biomass also strongly decreased with mixing depth.
Conclusions
The detected decrease with increasing mixing depth of the Chl-a and seston POC concentrations agrees well with field evidence from a variety of marine biogeochemical provinces (for example, the North Atlantic, equatorial Pacific, and Southern Ocean). The results of this experiment further indicate that the mechanisms assumed to affect the growth of phytoplankton in a mixing depth gradient principally operate in the pelagic of oceans. The differences observed between the relationships of concentrations of
phytoplankton biomass and proxies thereof suggest that nutritional strategies other than pure autotrophy may be important in the surface layer of oceans. Despite the simplifying assumptions of the model framework with respect to algal community composition (mono-specific), resource supply (a single limiting nutrient), and loss processes (absence of grazing), the results of the experiment and model predictions agree qualitatively well when Chl-a is used as a proxy of phytoplankton. Our findings also show that besides nutrient enrichment, mixing depth may have considerable bottom-up effects on the biomass of marine zooplankton and suggest these effects propagate up the food chain.
Acknowledgements
We thank Robert Ptacnik for comments on this manuscript and Herwig Stibor for seminal discussions. K. Andresen, Øystein Leknes, S.O. Linde, Yngvar Olsen and N. Tokle (Trondheim Marine Systems Research Infrastructure), Sabine Dreßmann, Margit Feissel, Anna Gelzleichter, Peter Herrmann, Jan Ingenhaag, Nike Sommerwerk, and Herwig Stibor (Ludwig-Maximilians-University München), and T. Hansen and U. Sommer (Institute for Marine Research IFM-GEOMAR, Kiel) provided technical support. This research work was funded by a LMU Stipend for Junior Scientists and the Improving Human Potential / Access to Research Infrastructure Program of the European Commission (1999-CT00060).
Article 1 36
References
Backhaus JO, Hegseth EN, Wehde H, Irigoien X, Hatten K, Logemann K (2003) Convection and primary production in winter. Mar.Ecol.Progr.Ser. 251:1-14
Berger SA, Kunz TJ, Albrecht D, Oucible AM, Ritzer S, Diehl S (2005) Light supply, plankton biomass and seston stoichiometry in a gradient of lake mixing depths. (submitted)
Boyd PW (2002) Environmental factors controlling phytoplankton processes in the Southern Ocean. J.Phycol. 38:844-861
Cloern JE (2001) Our evolving conceptual model of the coastal eutrophication problem. Mar.Ecol.Progr.Ser. 210:223-253
Diehl S. (2002) Phytoplankton, light, and nutrients in a gradient of mixing depths: theory. Ecology 83:386-391
Diehl S, Berger SA, Ptacnik R, Wild A (2002) Phytoplankton, light, and nutrients in a gradient of mixing depths: field experiments. Ecology 83:399-411
Diehl S, Berger SA, Wöhrl R (2005) Flexible algal nutrient stoichiometry mediates environmntal influences on phytoplankton and its abiotic resources. Ecology (in press)
Duarte CM, Agustí S, Agawin NSR (2005) Response of a Mediterranean phytoplankton community to increased nutrient inputs: a mesocosm experiment. Mar.Ecol.Progr.Ser. 195:61-70
Eldridge PM, Sieracki ME (1993) Biological and hydrodynamic regulation of the microbial food-web in a periodically mixed estuary. Limnol.Oceanogr. 38:1666-1679
Gismervik I, Olsen Y, Vadstein O (2002) Micro- and mesozooplankton response to enhanced nutrient input - a mesocosm study. Hydrobiologia 484:75-87
Gran HH, Braarud T (1935) A quantitative study of the phytoplankton in the Bay of Fundy and the Gulf of Maine (including observations on hydrography, chemistry and turbidity). Biol.Bd.Canada 1:279-433
Grover, J (1997) Resource competition. Chapman & Hall, London
Hanson PC, Bade DL, Carpenter SR, Kratz TK (2003) Lake metabolism: relationships with dissolved organic carbon and phosphorus. Limnol.Oceanogr. 48:1112-1119
Harris, R.P., Reeve MR, Grice GD, Evans GD, Gibson VR, Beers JR, Sullivan BK (1982) Trophic interactions and production processes in enclosed water columns. In: Grice GD, Reeve MR (eds) Marine mesocosms: biological and chemical research in experimental ecosystems. Springer-Verlag, p 353-387
Helbling EW, Villafane VE, Holm-Hansen O (1995) Variability of phytoplankton distribution and primary production around Elephant Island, Antarctica, during 1990-1993. Polar Biol. 15:233-246
Hillebrand H, Durselen CD, Kirschtel D, Pollingher U, Zohary T (1999) Biovolume calculation for pelagic and benthic microalgae. J.Phycol. 35:403-424
Huisman J (1999) Population dynamics of light-limited phytoplankton: microcosm experiments. Ecology 80:202-210
Huisman J, Weissing FJ (1995) Competition for nutrients and light in a mixed water column: a theoretical analysis. Am.Nat. 146:536-564
Kara AB, Rochford PA, Hurlburt HE (2003) Mixed layer depth variability over the global ocean. J.Geophys.Res. 108:3079
Kiørboe T (1993) Turbulence, phytoplankton cell size, and the structure of pelagic food webs.
Article 1 37
Adv.Mar.Biol. 29:1-72
Kiørboe T, Nielsen TG (1994) Regulation of zooplankton biomass and production in a temperate, coastal ecosystem. 1. copepods. Limnol.Oceanogr. 39:493-507
Kirk JTO (1994) Light and Photosynthesis in aquatic ecosystems. Cambridge University Press.
Kivi K, Kaitala S, Kuosa H, Kuparinen J, Leskinen E, Lignell R, Marcussen B, Tamminen T (1993) Nutrient limitation and grazing control of the Baltic plankton community during annual succession. Limnol.Oceanogr. 38:893-905
Kunz TJ, Diehl S (2003) Phytoplankton, light and nutrients along a gradient of mixing depth: a field test of producer-resource theory. Freshw.Biol. 48:1050-1063
Leibold MA (1997) Do nutrient-competition models predict nutrient availabilities in limnetic ecosystems? Oecologia 110:132-142
Mann KH, Lazier JRN (1996) Dynamics of Marine Ecosystems: biological-physical interactions in the oceans. Blackwell, Oxford
Marion P van (1996) Ecological Studies in Hopavågen, a landlocked bay at Agdenes, Sør-Trøndelag, Norway. Gunneria 71:7-23
Menden-Deuer, S., Lessard E (2000) Carbon to volume relationships for dinoflagellates, diatoms, and other protist plankton. Limnol.Oceanogr. 45:569-579
Mitchell BG, Holm-Hansen O (1991) Observations and modeling of the Antarctic phytoplankton crop in relation to mixing depth. Deep-Sea Res.Pt.A-Oceanogr.Res.Papers 38:981-1007
Murdoch WW, Nisbet RM, McCauley E, deRoos AM, Gurney WSC (1998) Plankton abundance and dynamics across nutrient levels: tests of hypotheses. Ecology 79:1339-1356
Oijen T van, van Leeuwe MA, Granum E, Weissing FJ, Bellerby RGJ, Gieskes WWC, de Baar HJW (2004) Light rather than iron controls photosynthate production and allocation in Southern Ocean phytoplankton populations during austral autumn. J.Plankton Res. 26:885-900
Olsen Y, Reinertsen H, Vadstein O, Andersen T, Gismervik I, Duarte C, Agustí S, Stibor H, Sommer U, Lignell R, Tamminen T, Lancelot C, Rousseau V, Hoell E, Sanderud KA (2001) Comparative analysis of food webs based on flow networks: effects of nutrient supply on structure and function of coastal plankton communities. Cont.Shelf Res. 21:2043-2053
Pfaffenhöfer GA On the biology of Appendicularia of the southern North Sea. Persoone, G. and Jaspers, E 437-455 (1976) Wetteren, Belgium, Universal Press. 10th European Symposium on Marine Biology.
Ptacnik R, Sommer U, Hansen T, Martens V (2004) Effects of microzooplankton and mixotrophy in an experimental planktonic food web. Limnol.Oceanogr. 49:1435-1445
Reynolds CS (1984) The ecology of freshwater phytoplankton. Cambridge University Press
Rothhaupt KO (1988) Mechanistic resource competition theory applied to laboratory experiments with zooplankton. Nature 333:660-662
Ryan JP, Polito PS, Strutton PG, Chavez FP (2002) Unusual large-scale phytoplankton blooms in the equatorial Pacific. Progr.Oceanogr. 55:263-285
Sakshaug E, Slagstad D, Holm-Hansen O (1991) Factors controlling the development of phytoplankton blooms in the antarctic ocean - a mathematical model. Mar.Chem. 35:259-271
Soto D (2002) Oligotrophic patterns in southern Chilean lakes: the relevance of nutrients and mixing depth. Rev.Chil.Hist.Nat. 75:377-393
Article 1 38
Sterner RW (1990) Lake morphometry and light in the surface-layer. Can.J.Fish.Aquat.Sci. 47:687- 692
Sverdrup HU (1953) On conditions for the vernal blooming of phytoplankton. J.Cons.Perm.Int.Explor.Mer 18:287-295
Tilman D, Kilham SS (1976) Phosphate and silicate growth and uptake kinetics of the diatoms Asterionella formosa and Cyclotella meneghiniana in batch and semicontinuous culture. J.Phycol. 12:375-383
Tilzer MM, Gieskes WW, Heusel R, Fenton N (1994) The impact of phytoplankton on spectral water transparency in the Southern Ocean: implications for primary productivity. Polar Biol. 14:127-136
Tokle N. (1999) Forekomst av dyreplankton i Trondhjemsfjorden med fokus pa stoffomsetningen. Masters thesis, NTNU Trondheim, Norway
Uye S, Ichino S (1994) Seasonal variations in abundance, size composition, biomass and production rate of Oikopleura dioica (Fol) (Tunicata: Appendicularia) in a temperate eutrophic inlet. J.Exp.Mar.Biol.Ecol. 189:1-11
Vadstein O, Stibor H, Lippert B, Loseth K, Roederer W, Sundt-Hansen L, Olsen Y (2004) Moderate increase in the biomass of omnivorous copepods may ease grazing control of planktonic algae. Mar.Ecol.Progr.Ser. 270:199-207
Visser PM, Massaut L, Huisman J, Mur LR (1996) Sedimentation losses of Scenedesmus in relation to mixing depth. Arch.Hydrobiol. 136:289-308
Article 2
RESPONSE OF AUTO-, MIXO- AND HETEROTROPHIC MARINE
PLANKTON TO NITROGEN ENRICHMENT AND A MIXING-DEPTH
GRADIENT
THOMAS J. KUNZ AND SEBASTIAN DIEHL
Article 2 40
Responses of auto-, mixo- and heterotrophic marine plankton to nitrogen
enrichment and a mixing-depth gradient
Thomas J. Kunz and Sebastian Diehl
Introduction
Depth of the mixed surface layer is increasingly being recognized as a major factor controlling the biomass of phytoplankton (Sakshaug 1991, Huisman and Weissing 1995, Boyd 2002, Diehl 2002, Kunz and Diehl 2003, Diehl et. al. 2005, Berger et al. submitted, Kunz and Diehl comp. manus). In recent years, insight grew that several important resource acquisition and loss processes of algal species not only affect cell and population growth and, hence, species competition and community composition but are themselves influenced by mixing-depth (Huisman and Weissing 1994, Huisman et al. 1999a, Diehl et al. 2002, Ptacnik et al. 2003). Mixing depth directly affects the average light availability in the water column, hence, the potential light absorption of algal cells (Huisman and Weissing 1994, 1995, Diehl et al. 2002, Berger et al. submitted). In contrast, the availability of nutrients to phytoplankton is indirectly affected by mixing depth via nutrient retention in the mixed layer (Huisman and Weissing 1995, Diehl 2002, Diehl et al. 2002, Diehl et al. 2002, Berger et al. submitted). Sinking loss rate, which is a function of sinking velocity and mixing depth decreases with increasing mixing-depth (Visser 1996, Diehl 2002, Diehl et al. 2002). Whether a phytoplankton species thrives and persists in a monoculture and if it will be competitively superior to other species when grown together depends on its critical values of nutrient concentration and light intensity, and its maximally sustainable sinking velocity (Tilman 1982, Huisman and Weissing 1994, Huisman et al. 1999a, b, Huisman and Sommeijer 2002b). In one way or another, all these traits should be related to cell size and
shape. Overall, the following expectations can be derived: total autotrophic biomass should be positively affected by nutrients but be negatively affected by mixing depth. Motile phytoplankters and/or phytoplankton cells with a high surface to volume ratio such as small, elongate or process-bearing (little to non-sinking) cells should be favoured by shallow mixing and low nutrient concentrations, whereas large, compact (faster sinking) phytoplankton should profit from opposite conditions (Reynolds 1984, Harris 1986).
The occurrence of phytoplankton species which can utilise particulate matter (‘mixotrophs’) may complicate the overall picture. Mixotrophic species should profit from phagotrophic feeding in a variety of ways and, hence, may have competitive advantages to purely autotrophic or heterotrophic plankters under certain environmental conditions. Firstly, because phagotrophic feeding usually requires some cell motility, mixotrophs (as there are, e.g. among dinoflagellates) should generally suffer less sinking losses than most purely autotrophic phytoplankton (such as coccolithophorids or diatoms). Secondly, mixotrophs may exploit various organic and inorganic resources in an opportunistic way, depending on their availability. At larger mixing depths (where light availability is low) phagotrophic feeding might allow mixotrophs to complement their carbon metabolism while at the same time reducing the abundance of competitors, either directly (by preying on them) or indirectly (by reducing the abundance of their prey) (Jacobson & Andersen 1994, Thingstad et al. 1996, Stickney et al. 2000). At shallow mixing depths (where nutrient availability is comparatively low), phagotrophic feeding should allow mixotrophs to supplement cellular nutrient concentrations
Article 2 41
(at the expense of autotrophic competitors) while the utilization of light energy allows to increase the food digestion rate (Stickney et al. 2000, Li and Stoecker 2000, Strom 2002). Mixotrophs have indeed been shown theoretically and experimentally to compete successfully with purely heterotrophs and autotrophs when light was available as an additional energy source (Rothhaupt 1996, Tittel 2003). In contrast, enhancement of phagotrophic feeding in mixotrophic organisms under conditions of low light and out-competing of heterotrophs is only known from extreme (polar) environments. This may relate to additional metabolic costs for the maintenance of both light harvesting and feeding organelles and enzymes. On the other hand, phagotrophy in dinoflagellates has been shown to be a prerequirement for meeting metabolic demands and for attaining competitive growth rates (Broekhuizen 1999, Fulton et al. 2004). In situations where autotrophs or heterotrophs are nutrient or carbon-limited, respectively, only mixotrophic plankters should therefore be successful competitors (Rothhaupt 1996). In that case the biomass of mixotrophic plankton should be independent from mixing depth. In those mixotrophs, however, where phagotrophic feeding is a light-dependent process the biomass may decrease more strongly with mixing depth than in purely autotrophic plankton.
Enrichment with nutrients may positively affect the absolute biomass of mixotrophs but likely have a negative effect on their relative biomass because autotrophs should profit relatively more from nutrient enrichment. The relative success of mixotrophs should also be affected by interactions among nutrient enrichment and mixing depth, because the nutrient effect on autotrophic plankton should be strongest at shallow mixing depths whereas no or only a small effect of nutrients on autotrophs is to be expected at higher mixing depths where light limits autotrophic growth.
According to food-chain theory, consumers should generally follow the productivity of their resource (Grover 1997, Leibold et al. 1997). In a well-mixed, pelagic ecosystem the biomass of heterotrophic plankton should therefore increase with light and nutrient availability to phytoplankton although the biomass of the latter may remain unchanged. The biomass of individual herbivorous zooplankton species and overall zooplankton biomass may thus show a similar response to increasing mixing depth and nutrient enrichment as phytoplankton production. In the pelagic of lakes and coastal waters, positive effects of nutrient enrichment and negative effects of mixing depth on both phyto-and zooplankton have recently been observed (Berger et al. submitted, Kunz and Diehl companion manuscript). If mixotrophs contribute significantly to the diet of heterotrophic plankton this pattern may be modified in terms of biomass and community composition. Despite a long tradition in biological oceanography to investigate zooplankton patterns in space and time, studies of zooplankton community composition have, however, frequently focussed on relationships with algal biomass, water temperature or regional hydrological phenomena (e.g., Kiørboe et al. 1990, Kang et al. 2004, Maar et al. 2004). We are not aware of any marine study which specifically addresses effects of mixing depth on the composition of the grazer community.
In the traditional planktonic food chain the biomass of any trophic levels is usually assumed to equal on average about 10 % of the biomass of the next lower trophic level due to trophic transfer and respiration losses (‘biomass pyramid’). Equilibrium theory of food-chain dynamics predicts that the biomass of top consumers and even-numbered trophic levels below will be higher under resource enrichment whereas the biomass of odd-numbered trophic levels (incl. producers) should not change (Oksanen et al.1981,
Article 2 42
DeAngelis et al. 1996, Leibold et al. 1997). In a planktonic producer-resource system phytoplankton biomass is predicted to be highest at relatively shallow mixing depths and to decrease towards larger mixing depths because light and nutrients are interactive-essential resources and because the light intensity decays vertically (Huisman and Weissing 1995, Diehl 2002, Berger et al. submitted, Diehl et al. in press). The biomass ratio of aquatic primary consumers (e.g. ciliates, herbivorous mesozooplankton) to phytoplankton should therefore decrease with mixing depth and increase with nutrient enrichment (assuming that production is transferred to the next higher trophic level at a constant loss rate). Although considerable departures of the heterotrophic to autotrophic plankton (H:A) biomass ratio from 0.1 have been demonstrated in lakes and across the seascape (Vinogradov and Shushkina 1978, Holligan et al. 1984, Gasol et al. 1997) to our knowledge, relationships between the H:A plankton biomass ratio and mixing depth have neither been investigated in field surveys nor been tested experimentally. Similarly, effects of nutrient enrichment on the H:A biomass ratio of marine plankton are know but from a very small number of studies (Roberts et al. 2003, Ptacnik et al. 2004).
The aim of this paper is the identification of any systematic variation with mixing depth and nitrogen enrichment of algal and zooplankton taxonomic composition, microplankton nutritional mode, and the ratio of autotrophic to heterotrophic plankton biomass by fertilizing and subjecting a North Atlantic plankton community to an artificial mixing regime.
Material and Methods
Experimental design and study site
We manipulated depth of turbulent mixing of the water column and nutrient enrichment in an enclosure experiment. The experiment was carried out at Hopavågen, a small (37 ha), basin-shaped and maximally 31 m deep, landlocked bay of the coastal North Atlantic (central Norway, 63°34’13” N 9°42’10” E) in August and September 2000. The water has an average salinity of 31 ‰ and hosts a North Atlantic plankton community. For a more detailed description see van Marion (1996). Specifically, we crossed 7 mixing depth treatments (1.5 to 12 m) with 2 levels of enrichment with nitrogen (3 mmol N m-3, ‘Ambient N’ enclosures; 41.4 mmol N m-3, ‘N-enriched’ enclosures). Enclosures were 0.95 m wide, consisted of opaque (inside black, outside white) plastic foil and were filled with water from a depth of 3-4 m via pumping. A detailed account of the experimental set-up is given in Kunz and Diehl (companion manuscript). The experiment lasted from 31 August to 25 September.
Because the original intention of the experiment was to test a dynamical nutrient-phytoplankton model the inflowing water was filtered through a 100-µm gauze. This did, however, not exclude appendicularian(s) and copepod eggs, nauplii, and early-stage copepodids which developed into a mesozooplankton community during the course of the experiment. At the end of the experiment (Day 25), the density of mesozooplankton grazers was within the regional range and allowed investigation of treatment effects on individual taxa.
The water within the enclosures was homogeneously mixed by blowing air into the bottom six times per hour for 30-second periods. Temperature differences between enclosures never exceeded 0.6 °C. Enclosures were enriched to total phosphorus and silica
Article 2 43
levels with sodium-phosphate and sodium-silicate on Day 0 of the experiment such that nitrogen would be the limiting nutrient. Due to the impossibility of measuring total nitrogen before the start of the experiment we assumed a total nitrogen (TN) concentration of 10 mmol m-3, a value typical for Hopavågen at this time of the year. The actual TN concentration was, however, approximately 3 mmol N m-3 (the TN
concentration in 'Ambient N' treatments on Day 0) and so 'N-enriched' treatments were enriched comparatively more (by a factor of c. 14 x instead of 5 x). Initial TN:Si ratios therefore were approximately 1:1 in ‘Ambient N’ treatments and > 2:1 in 'N-enriched' treatments but became more similar in both mixing depth gradients until the end of the experiment (Table 1).
TABLE 1. Molar ratios of total nitrogen (TN), and soluble reactive silica (Si) to total phosphorus (TP) averaged over 'Ambient N' and 'N-enriched' treatments at different dates of the experiment.
Nutrient ‘Ambient N’ treatments ‘N-enriched’ treatments Day 0 Day 13 Day 25 Day 0 Day 13 Day 25 TN 2.5 1.8 1.7 6.9 6.2 4.9 TP 1 1 1 1 1 1 Si 2.8 0.7 1.1 3 2.2 2.5
Sampling and laboratory analyses
Enclosures were sampled for chlorophyll-a concentration at 2-day intervals, and the concentrations of total nitrogen (calculated as the sum of the particulate and the dissolved nitrogen fractions NO2 -, NO3 - and NH4 –N ), total phosphorus (TP) and dissolved silica at 6-day intervals. One subsample each was frozen at –18°C for analysis of dissolved mineral nutrients with an auto-analyser. The Chl-a and concentration was determined according to standard procedures on subsamples filtered onto glass microfiber filters (GF/C, Whatman). TP was analysed according to the molybdenum-blue method (for a detailed account of the laboratory procedure refer to the companion manuscript).
Microplankton
The composition of the phyto- and protozooplankton community and the biomass of individual taxa was determined from a 100-ml sample collected from each enclosure on
Day 25 of the experiment and immediately preserved with acid Lugol’s solution (1 % final concentration). Depending on chlorophyll a levels, a 25-, 50- or 100-ml subsample was transferred to a sedimentation chamber and analysed subsequently via phase contrast microscopy according to Utermöhl (1958). Taxa were determined according to Drebes (1974) and Tomas (1997). For species exceeding 50 µm (linear dimension) or clearly distinguished taxa the whole sedimentation chamber was scanned at 63 x magnification (large ciliates, coccolithophorids, dinoflagellates and large or chain forming diatoms). For species 30 < 50 µm (smaller ciliates and dinoflagellates, diatoms and the chlorophyte Eutreptiella) two to six transects of the sedimentation chamber were scanned at 200 x magnification and for species < 30 µm (small diatoms and flagellates) one transect was scanned at 400 x magnification. At least 100 specimen were counted per taxon if sufficiently abundant. In ciliates and dinoflagellates, however, this figure was frequently not attained, even if the whole
Article 2 44
sedimentation chamber or a large number of transects was scanned. Small flagellates were counted based on length classes (< 3, 6, 9, 12 and 20 µm) and then grouped by their equivalent spherical diameter (ESD) into pico- (ESD < 3 µm), ultra- (3-10 µm), and nanoflagellates (10-20 µm) for statistical analysis. In dinoflagellates, pigmented species with a variable degree of phagotrophic feeding (Alexandrium tamarense, Ceratium furca, C. fusus, C. contortum, C. trichoceros, Dinophysis norvegica, Karenia mikimotoi, Prorocentrum micans and Scrippsiella trochoidea) were distinguished from non-pigmented, heterotrophic dinoflagellates (Protoperidinium bipes, P. brevipes). Specimen of Cylindrotheca closterium and Nitzschia longissima, which look similar under a light microscope, were considered to belong to the former if < 65 µm, whereas specimen > 65 µm were considered to belong to the latter. The diatom Fragilaria striatula, a chain-forming species that presumably formed a large portion of the wall growth was recorded separately to assess the potential contribution of detached Aufwuchs to phytoplankton biomass. As only few Fragilaria chains or single cells were found in the samples, Fragilaria biovolume was included to overall diatom biovolume. Volume estimates were calculated according to Hillebrand et al. (1999) and Sun and Liu (2003) and based on linear dimensions measured of at least 30 specimen in the more abundant species using Analysis Pro software (Soft Imaging Systems, Münster, Germany) and a black/white CCD camera (Sanyo, Japan). Algal biovolume was averaged across the whole depth range because we did not observe any effects of treatment on mean size of individual taxa. In chain-forming species a mean cell number per colony was calculated from 20 to 30 colonies and multiplied by the averaged cell volume. In rare species biovolume was calculated on the basis of a small number of measured individuals. We converted biovolume to carbon mass according
to the formulae given for diatoms and ‘other phytoplankton’ in Menden-Deuer and Lessard (2000).
Zooplankton
Mesozooplankton was sampled via vertical hauls of a plankton net (mesh width 100 µm) from near bottom to the surface of enclosed water columns at 6-day intervals, transferred to 100-ml plastic flasks and immediately preserved with acid Lugol’s to 1 % final concentration. Zooplankters were determined to genus or species level and enumerated with a dissecting microscope at 160 x magnification. Appendicularians were the only gelatinous mesozooplankton which occurred in the experimental treatments. Adult copepods, copepodids and nauplius larvae were counted separately. In the larger copepod genera (Acartia, Calanus, Centropages, and Temora), specimen < 1 mm were counted as copepodids whereas in Pseudocalanus specimen < 0.5 mm were counted as copepodids. If abundance of any taxon or group which was analysed separately was zero we assigned a value of 1 unit for statistical tests of treatment effects. Length was measured from the anterior tip of the cephalosome to the tip of the urosome (telson). Carbon weight was then calculated according to formulae compiled in Tokle (1999). In appendicularians (Oikopleura), trunk length was measured to the nearest 10 µm, converted into ash-free dry weight according to Pfaffenhöfer (1976) and then multiplied by a factor of 0.45 to yield carbon-based biomass (Uye and Ichino 1994). If specimen had disintegrated into trunk and tail, only trunks were counted. Mesozooplankton taxa (cylopoid copepods, Microsetella) and meroplankton which occurred at very low abundance (< 0.1 Ind L-1) at the end of the experiment were not analysed.
Article 2 45
Data analysis
Response variables were log10-transformed for all statistical analyses. We investigated effects of mixing depth, nutrient enrichment, and interaction effects of both treatments on the biomasses of phyto- and zooplankton taxa and guilds and the heterotrophic to autotrophic biomass ratios by analysis of covariance of values from Day 25. When P of interaction effects exceeded 0.2 the interaction term was dropped from the statistical model and the main effects of mixing depth and nutrient enrichment were investigated only. Effects were considered to be marginally non-significant if 0.05<P<0.1. Statistical analyses were performed using SPSS 12.0.1 software.
Filtering of the water before the start of the experiment did not remove mesozooplankton in the 9-m 'Ambient N' treatment so that densities of calanoid copepods and copepodids were five times higher than in other treatments (1.6 Ind L-1 vs. 0.3 Ind L-1) on Day 0. This initial deviation likely accounted for the persistently higher mesozooplankton densities in the 9-m 'Ambient N' treatment compared to treatments adjacent in the mixing depth gradient. We therefore excluded this treatment from all analyses.
Results and Discussion
Plankton nutritional mode vs. mixing depth and nutrient enrichment
Phytoplankton
For a zooplankton-free system, Diehl (2002) predicts a monotonous decline with mixing depth of the biomass concentration of non-sinking algae, but a unimodal response of the biomass of sinking algae, over the range of mixing depths investigated in this experiment.
Nutrient enrichment should generally increase phytoplankton production across all mixing depths (Diehl 2002, Berger et al. submitted).
By the end of the experiment, on Day 25, the phytoplankton community consisted mostly of diatoms, small flagellates, and dinoflagellates (Fig. 1). Except for the most shallow enclosures cyanobacteria were either absent or occurred at extremely low abundances. The biomasses of pico-, ultra- and nanoflagellates, and pigmented dinoflagellates all decreased with increasing mixing depth but coccolithophorid, cyanobacterial and diatom biomasses were unrelated to mixing depth (Table 2). Mixing depth did not have any systematic influence on phytoplankton community composition. In ‘Ambient N’ treatments, phytoplankton biomass was dominated by small flagellates (50-80 %, versus only 25 % in most 'N-enriched' treatments). In contrast, in most 'N-enriched' treatments, diatoms made up more than 40 % of phytoplankton biomass (but only about 5-30 % in 'Ambient N' treatments). The biomass of pigmented dinoflagellates contributed on average c. 20 % to overall phytoplankton biomass. Picoflagellates contributed a very small amount to phytoplankton biomass in both absolute and relative terms. Coccolithophorid biomass was below 10 % in most 'N-enriched' treatments and close to zero in 'Ambient N' treatments. Except for the ultra- and nanoflagellates, all higher taxa were positively affected by enrichment with nitrogen. Interactions between nitrogen enrichment and mixing depth were not detectable.
Among the diatom taxa in experimental treatments a single species, Nitzschia longissima, showed a marginally significant negative response to mixing depth (P (zmix) = 0.053, P (TN) = 0.921). At shallow mixing depths, the high surface-to-volume ratio of this elongate cell should have reduced sinking losses, facilitated the uptake of scarce mineral nutrients and provided protection against
Article 2 46
(a)
0,0
0,2
0,4
0,6
1,5 3 4,5 6 7,5 12
Mixing depth (m)
g C
m-3
Pigm. dinoflagellates
Flagellates < 20 µm
Flagellates 3 - 10 µm
Picoflagellates
Diatoms
Coccolithophoridae
(b)
0,0
0,2
0,4
0,6
1,5 3 4,5 6 7,5 9 12
Mixing depth (m)
Fig. 1. Effects of mixing depth and enrichment with nitrogen on phytoplankton biomass composition in (a) 'Ambient N' and (b) 'N-enriched' treatments on Day 25 of the experiment.
grazing by mesozooplankton (which was relatively abundant at shallow mixing depths), thus lending a competitive advantage to this species. Although overall diatom biomass did not show a statistically significant decrease with mixing depth, visual inspection of the data suggests there was such a tendency in 'N-enriched' treatments. The absence of a unimodal relationship between diatom biomass and mixing depth may partly relate to the model prediction that the depth where the biomass of sinking algae peaks should shift towards lower mixing depth at higher
background turbidity (Diehl 2002, Diehl et al. 2005). Considering the very high background turbidity in our treatments, the depth of maximum diatom biomass may thus have coincided with the most shallow mixing depth in 'N-enriched' treatments (Fig. 1b). Positive interactions between nitrogen enrichment and mixing depth were observed in Cylindrotheca closterium (P (zmix * TN) = 0.038, P (zmix) = 0.486, P (TN) = 0.001) and Licmophora sp. (P (zmix * TN) = 0.170, P (zmix) = 0.875, P (TN) = 0.053) and indicate a mixing-depth dependence of the enrichment effect.
TABLE 2. Effects of mixing depth, Zmix, and enrichment with nitrogen, TN, on the biomasses of different phytoplankton groups (PDFs, pigmented dinoflagellates) and total algal biomass on Day 25 of the experiment. Shown are the direction of change in response to Zmix and TN (+ = increase, o = no effect, - = decrease) and P-values from ANCOVAs on log10-transformed data. There were no interaction effects between Zmix and TN.
Coccolitho-phoridae
Diatoms Pico-flagellates(< 3 µm)
Ultra-flagellates (3-10 µm)
Nano-flagellates (10-20 µm)
PDFs Cyano-phyceae
All algae
Zmix o 0.478 o 0.374 - 0.021 - 0.026 - 0.009 - 0.051 o 0.198 o 0.170TN + 0.022 + 0.000 + 0.036 o 0.073 o 0.473 + 0.012 o 0.294 + 0.017
Article 2 47
As indicated above, nitrogen enrichment positively affected all major phytoplankton groups except the ultra- and nanoflagellates. Because the nutrient stoichiometry in experimental enclosures was generally characterised by low TN:TP ratios and, in 'Ambient N' treatments, low TN:Si ratios (Table 1) it should have played an important role in conveying the observed pattern of flagellate versus diatom dominance in 'Ambient N' treatments and 'N-enriched' treatments, respectively. Diatoms are good competitors for nitrogen as long as silica concentrations are above 2 mmol m-3 and so should have found good conditions for growth in 'N-enriched' treatments but less so in 'Ambient N' treatments (mean silica concentrations on Day 25 were 1.46 ± 0.51 mmol m-3 in 'Ambient N' treatments and 10.71 ± 2.53 mmol m-3 in 'N-enriched' treatments). Also, nutrient enrichment should have favoured diatoms relatively more than flagellates because some flagellates may compensate for a nutrient deficit by phagotrophy. However, because of cell motility and a relatively high surface-to-
volume ratio/small radius (both of which enhance nutrient uptake but reduce sinking velocity) small flagellates should have had a competitive advantage to larger phytoplankton across all 'Ambient N' treatments, particularly at shallow mixing depths. This is consistent with the wide-spread association of small flagellates and nutrient depleted waters (Fenchel 1982, Cushing 1989, Søndergaard et al. 1991). The ultraplankton was dominated by Chrysochromulina sp., Imantonia sp. and Teleaulax acuta, and also comprised two heterotrophic species, Monosiga marina and Pseudobodo tremulans. Common nanoplankton species were Oltmansia and Eutreptiella gymnastica.
In pigmented dinoflagellates (PDFs) the decrease with mixing depth was marginally significant (Table 2). In contrast, one PDF taxa, Ceratium sp., decreased significantly with mixing depth (Table 3). In Prorocentrum micans the decrease was less pronounced and Scrippsiella trochoidea was unrelated to mixing depth. Dinophysis norvegica showed a strong tendency to increase with mixing depth.
TABLE 3. Effects of mixing depth, Zmix, and enrichment with nitrogen, TN, on the biomasses of pigmented dinoflagellates, non-pigmented dinoflagellates (Protoperidinium sp.), and ciliates on Day 25 of the experiment. Shown are the direction of change in response to main effects and interaction effects of Zmix and TN ( + = increase, o = no effect, - = decrease; signs in parentheses indicate effects were marginally non-significant) and P-values from ANCOVAs on log10-transformed data. Ceratium
sp.
Prorocentrum micans
Scrippsiella trochoidea
Dinophysis norvegica
Protoperidinium sp.
Ciliates
Zmix - 0.026 (-) 0.056 o 0.353 (+) 0.080 + 0.010 o 0.253 TN o 0.212 (+) 0.073 + 0.022 + 0.008 + 0.000 + 0.021
Zmix * TN (+) 0.88 (+) 0.096 (+) 0.105 o o o
We argue that different mixotrophic strategies may explain these patterns. Previous studies have described primarily autotrophic, primarily heterotrophic, and ‘ideal’ mixotrophic
dinoflagellates (Carpenter et al. 1995, Graneli et al. 1997, Hansen and Nielsen 1997, Li et al. 2000, Stickney et al. 2000, Smalley and Coats 2002; Table 4). Primarily autotrophic
Article 2 48
dinoflagellates should have profited from increased availability of light and prey (i.e., algal primary producers) at shallow mixing depths, and so their biomass tended to decrease towards larger mixing depths (C. fusus and P. micans, Alexandrium tamarense, Karenia mikimotoi; Fig. 2, Table 3). A negative correlation with water depth (which may relate to the vertical light gradient) and a positive relationship between feeding rate and nitrogen concentration has previously been described in C. furca (Smalley and Coats 2002). The biomass of ‘ideal’ mixotrophic phytoplankton, i.e., algae which can grow equally well on phototrophy, phagotrophy, or both, should not be strongly affected by mixing depth. In our study we found one PDF species, Scrippsiella trochoidea, which did not show any biomass trend across mixing depth treatments (Fig. 2, Table 3). We are not aware of any study which addresses the degree of mixotrophy in S. trochoidea, and so we believe that our data warrant experimental investigation of the
hypothesized ‘ideal’ mixotrophy in this dinoflagellate species. Finally, the biomass of primarily heterotrophic dinoflagellates, as in any primary consumer, should follow the productivity of their autotrophic prey (i.e., decrease with mixing depth) while simultaneously suppressing competitors for the common resource and profiting from their consumption. The net effect of both processes, i.e. increase or decrease of the biomass of this type of dinoflagellates with mixing depth, should depend on the competitive abilities of both the primarily heterotrophic dinoflagellate and its purely heterotrophic rival or predator. The tendency of Dinophysis norvegica biomass, to increase with mixing depth suggests this dinoflagellate to be a mostly heterotrophic mixotroph and shows that it coexisted with purely heterotrophic dinoflagellates, Protoperidinium sp, and ciliates across the mixing depth gradient (Fig. 2, Table 3).
TABLE 4. Dinoflagellates observed in experimental treatments and their known or suspected nutritional mode according to this study and other authors. Species Nutritional mode Reference Alexandrium tamarense mixotrophic (prim. phototr.?) this study Ceratium furca mixotrophic (prim. phototr.) Bockstahler & Coats (1993), Nielsen & Hansen
(1999), Smalley & Coats (2002) Ceratium fusus mixotrophic (prim. phototr.?) Nielsen & Hansen (1999), this study Dinophysis norvegica mixotrophic (prim. heterotr.?) Jacobson & Andersen (1994), Carpenter et al.
(1995), Graneli et al. 1997, Nielsen & Hansen (1999), this study
Karenia mikimotoi mixotrophic (prim. phototr.?) this study Prorocentrum micans mixotrophic (prim. phototr.?) Jacobson & Andersen (1996), this study Protoperidinium bipes, P. brevipes
heterotrophic Nielsen & Hansen (1999), this study
Scrippsiella trochoidea mixotrophic (‘ideal’?) Jacobson & Andersen (1996), Ismael (2003), this study
Observed effects of nutrient enrichment on
pigmented dinoflagellates resembled theoretical considerations quite well. N
enrichment did not significantly affect Ceratium sp. and Prorocentrum micans, PDFs assumed to be primarily phototrophic (Table 3,
Article 2 49
4). A likely explanation is that dinoflagellates with this nutritional strategy do not directly depend on dissolved mineral nitrogen but instead may satiate their nutrient demand via phagotrophy. In contrast, dinoflagellates increasing in their degree of phagotrophy in the order S. trochoidea, D. norvegica, Protoperidinium bipes showed increasingly stronger effects of nitrogen enrichment. This
may be linked to the increase in prey abundance with enrichment (Fig. 2, Table 2, 3, 4). Interactions between N enrichment and mixing depth positively affected those PDFs which presumably are primarily phototrophic or ‘ideal’ mixotrophs because the nutrient effect on autotrophic plankton was strongest at shallow mixing depths (cf. diatoms in the 1.5-m treatment, Fig. 1).
(a)
0,00
0,02
0,04
0,06
0,08
0,10
1,5 3 4,5 6 7,5 12
Mixing depth (m)
g C
m- ³
Ceratium Prorocentrum Scrippsiella
Dinophysis Protoperidinium Ciliates
(b)
0,00
0,02
0,04
0,06
0,08
0,10
1,5 3 4,5 6 7,5 9 12
Mixing depth (m)
g C
m- ³
Fig. 2. Effects of mixing depth and enrichment with nitrogen on microplankton biomass composition in (a) 'Ambient N' and (b) 'N-enriched' treatments on Day 25 of the experiment.
The positive response of coccolithoporids and cyanobacteria to nutrient enrichment also fits to the general picture. Due to their low abundance in our experimental enclosures
(both groups are usually more common in tropical seas) they will not be treated here in more detail.
Article 2 50
In conclusion, whereas the biomass of flagellates responded to mixing depth as predicted by the biomass-mixing-depth model framework for non-sinking species (Huisman 1995, Diehl 2002), overall algal biomass and the biomass of most diatom taxa matched the model predictions relatively poorly. We are, however, confident that the mechanisms described above account for the pattern observed in dinoflagellates but caution that weak or statistically marginally non-significant patterns may also be attributed to the low abundance of some taxa in an overall smaller number of 'Ambient N' treatments (n = 6) used in the analysis. Here, the abundance of diatom and PDF specimen per sample was small in most species (often <10), producing considerable scatter in the data (Fig. 1b). Both scatter and the low number of degrees of freedom should have negatively affected the power to detect effects of mixing depth on the biomass of individual algal taxa, groups and total biomass (Table 2, 3). Finally, grazing by micro- and mesozooplankton may have altered any pattern in an unforeseen way.
Zooplankton
In our companion manuscript we showed that, in line with resource-consumer theory, zooplankton biomass followed the pattern of phytoplankton biomass, i.e. it increased with nitrogen enrichment but decreased with mixing depth. In particular, we observed a decrease with mixing depth of mesozooplankton biomass (which constituted most of the total biomass of zooplankton) whereas protozooplankton biomass responded positively to nutrient enrichment only. In the following we will investigate how treatment effects influenced the taxonomic composition of the zooplankton community.
Protozooplankton.-The protozooplankton community was largely composed of the heterotrophic dinoflagellate Protoperidinium bipes (in the 1.5-m 'N-enriched' treatment also
P. brevipes) and oligotrich ciliates (Leegardiella sol and Strobilidium oviformis). Monosiga marina, a choanoflagellate, occurred at very low numbers only.
The biomass of non-pigmented, heterotrophic dinoflagellates (HDFs) increased with increasing mixing depth (Fig. 2, Table 3). In contrast, although ciliate biomass was not significantly affected by mixing depth visual inspection of the data suggests it decreased in 'N-enriched' treatments (Fig. 2, Table 3). The absence of an overall significant relationship may be a consequence of the small number of specimen and degrees of freedom in 'Ambient N' treatments (cf. the 3-m 'Ambient N' treatment in Fig. 2). Nitrogen enrichment positively affected the biomass of both HDFs and ciliates (Fig. 2, Table 3). Ciliates and HDFs were negatively correlated (‘Ambient-N’ treatments: Pearson’s r = -0.59; ‘N-enriched’ treatments: Pearson’s r = -0.64). Whereas HDFs were slightly negatively correlated with small flagellates (‘Ambient-N’ treatments: Pearson’s r = -0.32; ‘N-enriched’ treatments: Pearson’s r = -0.51 ) ciliates were strongly positively related with small flagellates only in ‘N-enriched’ treatments (Pearson’s r = 0.96; ‘Ambient-N’ treatments: Pearson’s r = 0.48).
In general, protozooplankton, as any primary consumer of algal biomass, should be positively affected by autotroph productivity. In our companion manuscript we showed that phytoplankton production decreased with mixing depth. Likewise, the biomass of small flagellates decreased along the mixing depth gradient (Fig. 1, Table 2); its positive correlation with ciliates suggests that flagellates were an important food of ciliates, at least in N-enriched treatments, and may explain why ciliates tended to decrease with increasing mixing depth and increased with nutrient enrichment. The increase in biomass of HDFs along the mixing depth gradient and the negative correlation with small flagellates indicates that, under reduced light, HDFs were
Article 2 51
relatively successful competitors of ciliates and mixotrophic dinoflagellates for a common prey. The negative correlation between HDFs and ciliates and previous observations of HDFs predation on ciliates (Jacobson & Andersen 1994) suggests that HDFs had negative effects on the biomass of its ciliate food competitors.
It is also conceivable that the release in predation by copepods with increasing mixing depth accounted for part of the increase in HDF biomass concentration with increasing mixing depth.
Fig. 3. Effects of mixing depth and enrichment with nitrogen on mesozooplankton community composition in 'Ambient N' and 'N-enriched' treatments on Day 25 of the experiment: (a,b) absolute biomass, (c,d) in percent of total mesozooplankton biomass.
Due to the presence of heterotrophic
dinoflagellates and mesozooplankton ciliates should have been subject to considerable grazing along the mixing depth gradient.
However, high growth rates which are characteristic for ciliates may have allowed them to resist this grazing pressure. Overall, ciliates and heterotrophic dinoflagellates
Article 2 52
exhibited conspicuous, opposite biomass trends along the mixing depth gradient. This may explain why overall protozooplankton biomass may be unrelated to mixing depth as shown in our companion manuscript.
Mesozooplankton.-Crustacean zooplank-
ton made up a major part of the grazer biomass in most treatments (Fig. 3). However, at shallow to intermediate mixing depth the biomass of a gelatinous filter feeder, Oikopleura dioica, was as large or even larger than copepod biomass (Fig. 3). Among crustacean zooplankton, calanoid copepods were most abundant, in particular the suspension-feeding, hence mostly herbivorous Pseudocalanus elongatus. Among the omnivorous copepod species Temora longicornis and Centropages sp. were subdominant while Calanus sp. was relatively
abundant in a few enclosures only (Fig. 3). Other calanoid copepods, Acartia sp. and Metridia sp., cyclopoid copepods and Evadne normanni (cladocera) occurred in very low numbers only (< 0.6 Ind. L-1) and harpacticoid copepods were almost absent from experimental treatments (< 0.08 Ind. L-1). With 2 to 10 Ind. L-1 overall copepod density was in the lower range of the several-year average in Hopavågen bay (3 to 65 copepods L-1). The combined copepod and appendicularian biomasses decreased with mixing depth (Fig. 3, Kunz and Diehl, companion manuscript). P. elongatus, the dominant copepod in both numbers and biomass, was the only crustacean species whose absolute biomass decreased significantly with mixing depth (Table 5). The absolute biomass of all other calanoid copepod species was unrelated to mixing depth (Table 5).
Table 5. Effects of mixing depth, Zmix , and enrichment with nitrogen, TN, on absolute and relative biomass of the dominant groups of crustacean and gelatinous zooplankton on Day 25 of the experiment. Shown are the direction of change in response to Zmix and TN ( + = increase, o = no effect, - = decrease; signs in parentheses indicate effects were marginally non-significant) and P-values from ANCOVAs on log10-transformed data.
Calanus sp.
Centro-pages sp.
Pseudo-calanus elongatus
Temora longicornis
Calanoid copepods (mature)
Calanoids (mature and larval)
Oikopleura dioica
Absolute Zmix o 0.314 o 0.989 - 0.000 o 0.350 - 0.002 - 0.003 - 0.030 TN o 0.773 + 0.019 + 0.024 (+) 0.117 (+) 0.061 (+) 0.100 + 0.021 Relative Zmix o 0.460 (+) 0.124 o 0.184 (+) 0.171 o 0.359 TN o 0.452 (+) 0.107 o 0.716 o 0.626 (+) 0.140
The biomass of appendicularians (Oikopleura dioica) decreased significantly with mixing depth. Except for Calanus sp., which was almost absent from several enclosures, the absolute biomass of all mesozooplankton taxa tended to be or was positively affected by N-
enrichment (Fig. 3, Table 5). Interestingly, while the relative contribution of P. elongatus to total mesozooplankton biomass did not show any significant change with mixing depth, the relative biomass (in percent of total mesozooplankton biomass) of two out of three
Article 2 53
omnivorous copepod species (Centropages sp. and T. longicornis) tended to increase along the mixing depth gradient (Fig. 3, Table 5).
As indicated previously, the numerical response of primary consumers to enrichment with inorganic resources and mixing depth may resemble the biomass pattern of producers. Theoretical considerations suggest that the response of omnivorous zooplankton biomass should rather resemble the biomass patterns of both autotrophs and mixotrophs. In this study, the biomass concentration of Chl a (a surrogat for autotroph biomass) was positively affected by nutrient enrichment but decreased with mixing depth. In contrast, while responding positively to N-enrichment, phytoplankton biomass (which includes purely autotrophic algae and pigmented, mixotrophic dinoflagellates) was not significantly affected by mixing depth (Fig. 1a,c, Table 2). Consistent with expectations for a largely herbivorous consumer, the biomass of P. elongatus followed the pattern of Chl a concentration in our experiment, i.e., it decreased with mixing depth and increased with nitrogen enrichment of the system. In contrast, mixing depth positively affected the relative biomasses of Centropages sp. and T. longicornis and did not affect their absolute biomasses (at mixing depths ≥ 3 m algal biomass concentration was essentially constant). This pattern may indicate omnivorous feeding of these copepods. Although ciliate biomass and the relative biomasses of Centropages sp. and T. longicornis were uncorrelated (P > 0.5) the graphs show that the biomass of both copepod species tended to increase at mixing depths ≥ 3 m compared to other mesozooplankton species (Fig. 3b,d). The biomass of HDFs and some mixotrophic PDFs, a potential copepod food, also increased with mixing depth. In contrast, ciliates showed a strong tendency to decrease with increasing mixing depth in 'N-enriched' treatments. However, because ciliates may achieve very high growth rates they could have
supported a stock of omnivorous copepods across the mixing depth gradient. We are not aware of any other study which relates the composition of the mesozooplankton community to mixing depth. However, in the Bering Sea, diurnal profiles of zooplankton vertical distribution taken in summer show Pseudocalanus sp. near the surface (where the Chl a concentration presumably was relatively high) while other copepod taxa occupied deeper parts of the water column (Lalli and Parsons 1997).
Consistent with expected effects of increasing nutrient enrichment and mixing depth on mostly herbivorous primary consumers, both the absolute biomass of O. dioica and its relative contribution to the total biomass of mesozooplankton decreased with mixing depth but increased with nutrient enrichment (Fig. 3, Table 5). Several studies have previously related peak abundances of appendicularians with Chl a concentrations and blooms of pico- and nanoplankton all of which decreased with mixing depth in our study (Nakamura 1998, Tomita et al. 2003). However, this is the first study to demonstrate negative effects of mixing depth on pelagic tunicates and only a single other study has previously shown positive effects of nutrient enrichment on O. dioica (Stibor et al. 2004). Its preference for food particles < 5 µm (heterotrophic bacteria, picoplankton and small ultraplankton), high growth and clearance rates make O. dioica an ecologically important filter feeder (Acuna and Kiefer 2000, Sommer et al. 2000). Our data do not indicate that the observed biomass pattern of O. dioica is a result of predation by omnivorous copepods (Pearson’s r = 0.13, P > 0.5). Although calanoid copepods have been shown to suppress appendicularians, O. dioica blooms occurred in all treatments where copepod abundances were < 10 Ind. m-3 (approx. equivalent to 100 mg C m-3), a level assumed to be critical for the establishment of
Article 2 54
appendicularian blooms (Sommer et al. 2003, Stibor et al. 2004).
Patterns in herbivory
Earlier in this paper we derived the prediction that the heterotrophic to autotrophic plankton biomass ratio (H:A) should increase with decreasing mixing depth (i.e., enrichment with light) and enrichment with nutrients. The protozooplankton to phytoplankton biomass ratio (HPZ:A) showed a weak increase with increasing mixing depth but responsed positively to nutrient enrichment (Fig. 4a, Table 6). Average HPZ:A biomass ratios were 0.080 ± 0.063 and 0.45 ± 0.35 (mean ± SD) in 'Ambient N' and 'N-enriched' treatments, respectively. In contrast, the mesozooplankton to phytoplankton biomass ratio (HMZ:A) decreased with mixing depth but was not affected by nutrient enrichment (Table 6, Fig. 4b). Average HMZ:A biomass ratios were 0.38 ± 0.27 and 0.36 ± 0.32 in 'Ambient N' and 'N-enriched' treatments, respectively. The biomass ratio of total zooplankton (combined biomasses of proto- and mesozooplankton) to phytoplankton (HZ:A) was unaffected by mixing depth and effects of nutrient enrichment on the HZ:A ratio were marginally non-significant (Table 1, Fig. 4c). Average HZ:A biomass ratios were 0.46 ± 0.30 and 0.81 ± 0.37 in the 'Ambient N' and 'N-enriched' treatments, respectively.
TABLE 6. Effects of mixing depth, Zmix , and enrichment with nitrogen, TN, on the heterotroph : autotroph biomass ratios. Shown are the direction of change in response to Zmix and TN ( + = increase, o = no effect, - = decrease; signs in parentheses indicate effects were marginally non-significant) and P-values from ANCOVAs on log10-transformed data.
HPZ:A HMZ:A HZ:A
Zmix (+) 0.164 - 0.018 o 0.347 TN + 0.004 o 0.946 (+) 0.070
(a)
0.01
0.10
1.00
10.00
0 3 6 9 12
HP
Z : A
Ambient N N-enriched
(b)
0.01
0.10
1.00
10.00
0 3 6 9 12
HM
Z : A
(c)
0.01
0.10
1.00
10.00
0 3 6 9 12
Mixing depth (m)
HZ
: A
Fig. 4. Effects of mixing depth and nitrogen enrichment on the biomass ratios of (a) protozooplankton to phytoplankton, HPZ:A, (b) mesozooplankton to phytoplankton, HMZ:A, and (c) total zooplankton to phytoplankton, HZ:A, on Day 25. In (b) overlapping data points were slightly moved apart to better illustrate the relationship.
Article 2 55
Variability in the H:A biomass ratio has previously been associated with water column structure (Cushing 1989, Kiørboe et al. 1990a). Gasol et al. (1997) demonstrated that the H:A biomass ratio may range from less than 0.1 to about 10 with large H:A ratios (i.e., inverse biomass pyramids) dominating in relatively unproductive, stratified oceanic waters and lower H:A ratios being typical for more productive coastal waters. However, existing studies did not address direct effects of mixed layer depth and we are aware only of a single other study which found positive effects of nitrogen enrichment on the HPZ:A ratio. This mesocosm study was conducted in the same coastal North Atlantic region with a similar range of TN:TSi ratios (1:1 to 4:1) but constant mixing depth (Roberts et al. 2003). Our study presents evidence that resource enrichment may be an important cause for the variability in H:A biomass ratios of marine plankton. The observed positive response of the H:A ratios to enrichment underpins the importance of bottom-up effects in aquatic food webs and is therefore consistent with expectations derived from equilibrium food-chain and producer-resource theories. However, while the HPZ:A ratio mostly increased with nutrient enrichment the HMZ:A ratio increased with decreasing mixing depth (i.e., with light enrichment sensu Diehl 2002). This pattern indicates that nutrient enrichment may enhance grazing by protozooplankton while increasing water column stratification may raise the grazing pressure exerted by mesozooplankton (Fig. 4). We do, however, caution to generalize from these observations as opposite trends in the biomasses of ciliates and heterotrophic dinoflagellates along the mixing depth gradient may have neutralized each other. This may have resulted in the HPZ:A ratio to be seemingly unaffected by mixing depth and may also explain why the overall HZ:A biomass ratios was not affected by mixing depth (Table 5, Fig. 4a,c).
Conclusions
Consideration of microplankton nutritional mode contributed to understand the disparities observed between predictions derived from a mechanistic model framework for phytoplankton growth in a gradient of mixing depth and the outcome of this marine enclosure experiment. While overall algal biomass and most phytoplankton groups responded positively to nutrient enrichment, only flagellate species were negatively affected by mixing depth. Effects of mixing depth on overall biomass of pigmented dinoflagellates were not very pronounced because of different nutritional strategies: while primarily phototrophic dinoflagellates could build up comparatively high biomass at shallow mixing depth, the biomass of primarily heterotrophic flagellates tended to increase towards larger mixing depths. The single species of dinoflagellate which was unrelated to mixing depth may have pursued an ‘ideal’ mixotrophic strategy by opportunistic feeding depending on the availability of light, nutrients and prey. Although non-flagellate taxa were characterised by a variety of shape which may have affected their distribution along the mixing depth gradient this did not provide a conclusive answer as to why most of these phytoplankters were unrelated to mixing depth. The results of this experiment imply that both mixing depth and nutrient enrichment may have strong bottom-up effects on the biomass concentration of different microplankton, crustacean and gelatinous marine zooplankton and on their relative contribution to community composition. Direction and strength of these effects generally seem to primarily depend on the nutritional mode of the organism, i.e. whether a consumer is primarily herbivorous or omnivorous. The identified systematic variation of the biomass ratios of meso- and protozooplankton to phytoplankton with mixing depth and nutrient enrichment, respectively, lends additional support to the
Article 2 56
prediction that the global change in mixing and nutrient regimes may fundamentally change the configuration of pelagic food webs.
Acknowledgements
We thank Ingrid Gismervik, Helmut Hillebrand, Robert Ptacnik and Ulrich Sommer
for help with species identification, and Stella Berger, Robert Ptacnik, Herwig Stibor, and Timo Tamminen for seminal discussions. This research work was funded by a Ludwig-Maximilians-University München Stipend for Junior Scientists and the European Commission - Improving the Human Potential / Access to Research Infrastructure Programme (1999-CT00060).
Article 2 57
References
Berger SA, Diehl S, Kunz TJ, Albrecht D, Oucible AM, Ritzer S (2005) Light supply, plankton biomass and seston stoichiometry in a gradient of lake mixing depths. (submitted)
Boyd PW (2002) Environmental factors controlling phytoplankton processes in the Southern Ocean. J.Phycol. 38:844-861
Broekhuizen N (1999) Simulating motile algae using a mixed Eulerian-Lagrangian approach: does motility promote dinoflagellate persistence or co-existence with diatoms? J.Plankton Res. 21:1191-1216
Cushing DH (1989) A difference in structure between ecosystems in strongly stratified waters and in those that are only weekly stratified. J.Plank.Res. 11(1):1-13
Diehl S (2002) Phytoplankton, light, and nutrients in a gradient of mixing depths: theory. Ecology 83:386-391
Diehl S, Berger SA, Ptacnik R, Wild A (2002) Phytoplankton, light, and nutrients in a gradient of mixing depths: field experiments. Ecology 83:399-411
Diehl S, Berger SA, Wöhrl R (2005) Flexible algal nutrient stoichiometry mediates environmental influences on phytoplankton and its abiotic resources. Ecology (in press)
Fenchel T (1987) Ecology of protozoa. The biology of free-living phagotrophic protists. Science Tech Publishers, Springer-Verlag, Berlin.
Gasol JM, del Giorgio PA, Duarte C M (1997) Biomass distribution in marine planktonic communities. Limnol.Oceanogr. 42(6):1353-1363
Grover, J (1997) Resource competition. Chapman & Hall, London
Hansen P J and Nielsen TG (1997) Mixotrophic feeding of Fragilidium subglobosum (Dinophyceae) on three species of Ceratium: effects of prey concentration, prey species and light intensity. Mar.Ecol.Prog.Ser. 147:187-196
Hillebrand H, Durselen CD, Kirschtel D, Pollingher U, Zohary T (1999) Biovolume calculation for pelagic and benthic microalgae. J.Phycol. 35:403-424
Huisman J, Sommeijer B (2002b) Maximal sustainable sinking velocity of phytoplankton. Mar.Ecol.Prog.Ser. 244:39-48
Huisman J, Jonker RR, Zonneveld C, Weissing FJ (1999a) Competition for light between phytoplankton species: experimental tests of mechanistic theory. Ecology 80:211-222
Huisman J., van Oostveen P, Weissing FJ (1999b) Species dynamics and phytoplankton blooms: incomplete mixing and competition for light. Am.Nat. 154(1):46-68
Huisman J, Weissing FJ (1995) Competition for nutrients and light in a mixed water column: a theoretical analysis. Am.Nat. 146:536-564
Kunz TJ, Diehl S (2003) Phytoplankton, light and nutrients along a gradient of mixing depth: a field test of producer-resource theory. Freshw.Biol. 48:1050-1063
Kunz TJ, Diehl S Effects of mixing depth and nitrogen enrichment on marine zooplankton, phytoplankton, light and mineral nutrients.(submitted)
Leibold MA (1997) Do nutrient-competition models predict nutrient availabilities in limnetic ecosystems? Oecologia 110:132-142
Li AS, Stoecker DK, Coats DW (2000) Mixotrophy in Gyrodinium galatheanum (Dinophyceae): grazing responses to light intensity and inorganic nutrients. J.Phycol. 36:33-45
Article 2 58
Maar M, Nielsen TG, Gooding S, Tönnesen K, Tiselius P, Zervoudaki S, Sell A, Richardson K (2004) Trophodynamic function of copepods, appendicularians and protozooplankton in the late summer zooplankton community in the Skagerrak. Mar.Biol. 144: 917-933
Menden-Deuer S, Lessard E (2000). Carbon to volume relationships for dinoflagellates, diatoms, and other protist plankton. Limnol.Oceanogr. 45(3):569-579
Nakamura Y (1998) Blooms of tunicates Oikopleura spp. and Dolioletta gegenbauri in the Seto Inland Sea, Japan, during summer. Hydrobiologia 385:183-192
Ptacnik R, Diehl S, Berger SA (2003) Performance of sinking and non-sinking phytoplankton taxa in a gradient of mixing depths. Limnol.Oceanogr. 48:1903-1912
Reynolds CS (1984) The ecology of freshwater phytoplankton. Cambridge University Press
Roberts EC, Davidson K, Gilpin LC (2003) Response of temperate microplankton communities to N:Si ratio perturbation. J.Plankton Res. 25(12):1485-1495
Rothhaupt KO (1996) Laboratory experiments with a mixotrophic chrysophyte and obligately phagotrophic and phototrophic competitors. Ecology 77:716-724
Sakshaug E, Slagstad D, Holm-Hansen O (1991) Factors controlling the development of phytoplankton blooms in the antarctic ocean - a mathematical model. Mar.Chem. 35:259-271
Sommer F, Stibor H, Sommer U, Velimirov B (2000) Grazing by mesozooplankton from Kiel Bight, Baltic Sea, on different sized algae and natural seston size fractions. Mar.Ecol.Prog.Ser. 199:43-53
Søndergaard M, Jensen LM, Ærtebjerg G (1991) Picoalgae in Danish coastal waters during summer stratification. Mar.Ecol.Prog.Ser. 79:139-149
Tittel J, Bissinger V, Zippel B, Gaedke U, Bell E, Lorke A, Kamjunke N. (2003) Mixotrophs combine resource use to outcompete specialists: implications for aquatic food webs. Proc.Nat.Acad.Sci. 100(22):12776-12781
Utermöhl H (1958) Zur Vervollkommnung der quantitativen Phytoplanktonmethodik. Int.Ver.Theor.Ang. Limnol.Mitteilungen 9:1-38
Visser PM, Massaut L, Huisman J, Mur LR (1996) Sedimentation losses of Scenedesmus in relation to mixing depth. Arch.Hydrobiol. 136:289-308
Article 3
EFFECTS OF WATER COLUMN DEPTH AND TURBULENT
DIFFUSION ON AN ENCLOSED NORTH ATLANTIC PLANKTON
COMMUNITY
THOMAS J. KUNZ AND SEBASTIAN DIEHL
Article 3 60
Effects of water column depth and turbulent diffusion on an enclosed North
Atlantic plankton community
Thomas J. Kunz and Sebastian Diehl
Introduction
Phytoplankton growth and associated algal blooms may occur near the water surface, throughout a well-mixed surface layer, or near the thermocline (Brooks and Torke 1977, Cullen 1982, Longhurst and Harrison 1989, Banse 1994). A variety of mechanisms have been invoked to explain these patterns of algal vertical distribution. Due to relatively small size and limited motility of individual cells, growth and vertical distribution of phytoplankton populations are strongly influenced by the direction of resource supply and by turbulent diffusion processes in the surrounding water. While nutrients may be supplied with water advected from adjacent, more nutrient-rich water masses, by atmospheric dust, and from deeper strata or the sediment, light essentially forms a vertical gradient of decreasing intensity and changing quality. Algal photosynthesis and growth in this light gradient is governed by the interplay between cell morphology, sinking and swimming, and turbulent water motion and depth of vertical mixing (Harris 1986, Reynolds 1994). Buoyancy regulation, phototaxis, and increasing intensity and depth of vertical mixing all positively affect entrainment of algal cells in the light-rich surface layer and will therefore increase light availability to algal cells. In recent years, a mechanistic model framework for phytoplankton growth has been developed which accounts for both the vertical extent and the intensity of mixing processes in the water column (Huisman et al. 1999b, c, Huisman et al. 2002, Huisman and Sommeijer 2002a, b). Accordingly, neutrally buoyant algae should
be able to thrive in all except very deep and turbulent waters because algal growth rate will always exceed the vertical mixing rate (Huisman et al. 1999b, c). As a consequence, the biomass concentration of non-sinking algae should be unrelated to turbulence intensity in stratified water bodies with shallow to intermediate mixing depth and should decrease with increasing tubulence intensity in deeper water columns. By contrast, for sinking algae to grow and persist, the intensity and vertical extent of turbulent diffusion within a water column must lie within certain critical bounds: If both depth and intensity of vertical mixing exceed some species-specific upper threshold the mean light intensity experienced by phytoplankton will be too low for growth and loss processes (sinking, mixing) to be balanced; likewise, both the intensity of turbulence and mixing depth must not fall short of some species-specific lower threshold or otherwise algal sinking rate will exceed growth and mixing rates (Huisman et al. 2002, Huisman and Sommeijer 2002a, b). Blooms of sinking algae are therefore not expected to develop in stratified waters with a very shallow thermocline, in stratified waters with low turbulent diffusion or in deep, strongly mixed waters. This is because in deep waters, the biomass concentration of a sinking algal species should increase sharply with increasing mixing intensity beyond a threshold value which allows entrainment of that species depending on its specific sinking characteristics. While the biomass concentration of sinking algae should peak at intermediate mixing intensities it should decrease with increasing turbulence intensity at intermediate water column depths. At shallow water column depths, the biomass
Article 3 61
concentration should not decrease even under conditions of strong turbulent mixing.
Increasing turbulence may also lead to enhanced nutrient transport into the upper part of the water column from below which should positively affect phytoplankton growth. However, as increasing turbulence usually increases the vertical extent of the mixed part of the water column and nutrients are supplied on a per volume basis, increasing water column depth also means that added nutrients will be partitioned among a larger volume of water (Diehl 2002, Visser and Stips 2002). The net effect of a concomitant increase in turbulence intensity and mixing depth on nutrient supply may therefore be zero.
Intensity and depth of vertical mixing in the water column are therefore considered to be important factors mediating light and nutrient supply, and sinking losses of algal cells. In the sea, mixing intensity and depth of the surface layer vary across orders of magnitude, depending on wind intensity, convection, tides, shear stress at the bottom of the surface layer and other hydrological phenomena (Mann and Lazier 1996, Sanford 1997). In lakes, mixing intensity and depth usually vary over a smaller range but nevertheless are important factors in determining the dynamics of algal biomass (MacIntyre 1993, Kunz and Diehl 2003, Berger et al. submitted).
While mixing depth and turbulence intensity directly affect both the supply of algae with light and algal sedimentation losses, they should indirectly affect the concentration of dissolved mineral nutrients. The influence of mixing depth on nutrient concentration has recently been explored theoretically, experimentally, and empirically in well-mixed systems (Huisman and Weissing 1995, Diehl 2002, Diehl et al. 2002, Kunz and Diehl 2003, Berger et al. submitted, Diehl et al. in press). In contrast, the vertical distribution of nutrients in poorly mixed water columns has received considerably less attention (but see e.g. Oviatt
1981, Klausmeier and Litchman 2001). At low values of turbulent diffusion, local consumption of mineral nutrients should generally correspond to the vertical pattern of algal production and may therefore produce a pattern which is inverse to the vertical distribution of phytoplankton biomass. Increasing turbulence should result in vertical profiles with increasingly less pronounced maxima of phytoplankton biomass concentration (Huisman et al. 2002). Hence, any minima of nutrient concentration near the light-rich water surface should be less pronounced. Sufficiently strong mixing within the water column should prevent the establishment of vertical patterns of mineral nutrients altogether.
Zooplankton should be affected by turbulent diffusion and the depth of vertical mixing in both direct and indirect ways. Because grazer production generally follows the productivity of their autotrophic resource any turbulence and mixing-depth mediated limitation of phytoplankton production by light, nutrients or sinking should indirectly affect zooplankton production (Rothhaupt 1988, Grover 1997). Moreover, the intensity of turbulence should also influence zooplankton production directly in various ways. This is because turbulent diffusion interferes with the food-detection ability of particle feeders, the efficiency of feeding currents of filter-feeders and affects the encounter rate of zooplankton with mates, predators, and food, the food-capture rate and the energy expenditure of heterotrophic organisms (Rothschild and Osborn 1988, Jenkinson 1995, Kiørboe and Saiz 1995, Osborn 1996, Dower et al. 1997, Irigoien et al. 2000). However, theoretical as well as empirical evidence as to how increasing turbulence intensity affects zooplankton growth rate is ambiguous, probably because of differences in the range of turbulence intensities considered and because of the variety of zooplankton feeding strategies and behavioral responses to increasing
Article 3 62
turbulence (Peters and Marrasé 2000). Theoretical considerations suggest that generally a dome-shaped relationship between turbulence intensity and the growth rate of planktonic consumers is to be expected. Such a relationship has been proposed by several authors for both zooplankton production and fish recruitment (Cury and Roy 1989, MacKenzie and Kiørboe 2000, Visser and Stips 2002).
In recent years effects of depth and intensity of turbulent mixing in a water column on phytoplankton populations have been extensively explored theoretically and a number of laboratory and field experiments, and field surveys have investigated phytoplankton communities in well-mixed systems (Huisman and Weissing 1994, 1995, Huisman 1999, Huisman et al. 1999a, Diehl 2002, Diehl et al. 2002, Kunz and Diehl 2003, Ptacnik et al. 2003, Berger et al. submitted, Diehl et al. in press, Kunz and Diehl, companion manuscript). Likewise, effects of turbulence intensity on zooplankton encounter, ingestion and growth rates have received considerable theoretical treatment (e.g., Rothschild and Osborn 1988, Davis 1991, Kiørboe and Saiz 1995). However, only few experiments have investigated effects of water column turbulence on phyto- and zooplankton production or biomass (Oviatt 1981, Estrada et al. 1987, Jones and Gowen 1990, Shimeata et al. 1995, Petersen et al. 1998). Because of the difficulties involved with measuring the intensity of turbulent diffusion in the field surveys addressing the issue are scarce (Maar et al. 2003, Huisman et al. 2004).
As water column depth in all previously published studies which manipulated mixing intesity was held constant we conducted a field enclosure experiment to investigate effects of intensity and depth of turbulent mixing on a nitrogen-limited North Atlantic plankton community. Our aim was to examine vertical patterns of the concentrations of dissolved mineral nitrogen and phytoplankton biomass in
the water column and to identify potential effects of mixing depth and intensity on the biomass of phyto- and zooplankton.
Material and Methods
Experimental design
We subjected a North Atlantic plankton community to a 3 x 3 factorial manipulation of water column depth (6, 10, and 14 m) and turbulent diffusion (low, intermediate, and high). Water from the surface layer of Hopavågen, a small, landlocked bay of the coastal North Atlantic (central Norway, 63°34’13” N 9°42’10” E; maximum depth 31 m, average salinity 31 ‰) was enclosed in 18 cyclindrical, marine field enclosures, each treatment being replicated twice. Up to four enclosures were attached to octagonal plastic rings connected to form a float. Enclosures consisted of white, opaque plastic material, were 0.95 m wide, heat-sealed at the bottom, extended 0.25 m above the water surface and were open to the atmosphere. At the beginning of the experiment, we enriched the water in each enclosure with ammonium-nitrate, sodium-phosphate and sodium-silicate to yield total concentrations of 50 mmol N m-3, 6 mmol P m-3, and 25 mmol Si m-3. All enclosures were subject to the massaging effect of surface waves and tidal currents within the bay. Enclosures with ‘Low’ intensity of turbulent diffusion were not mixed artificially. All other enclosures were mixed intermittently by blowing air into the bottom end of the enclosures for 30-second periods, and at 10-min intervals, using electrically driven compressors and 6-mm PVC tubing. The air stream was adjusted to produce ‘intermediate’ or ‘high’ intensities of turbulent diffusion in the water columns, depending on treatment. The experiment started on 25 August 2001. The final sampling of biomass and nutrient
Article 3 63
parameters was conducted on 18 September 2001, after 24 days.
Measurement of mixing intensity
Mixing intensity in the surface layer of the pelagic is usually determined as the vertical eddy diffusivity, D, (MacIntyre 1993), a measure based on mixing depth and time for mixing. Mixing intensity in the enclosures was assessed by adding a tracer to the top of the water columns after the final sampling for biological and chemical parameters. We then determined surface to bottom mixing time by measuring the time elapsed from addition of an inert dye, Rhodamine B, until it had attained an equilibrium concentration at the bottom end of an enclosure. The dye was added in amounts as to yield identical final concentrations in all treatments. Water samples were taken carefully from near the enclosure bottom at regular intervals (3 to 30 min in intermediate and strongly mixed enclosures, up to 3 hrs in the deeper, ‘Low’ mixing intensity treatments) using a Ruttner sampling bottle. We measured Rhodamine concentrations in the water samples photometrically at 665 nm. Water samples were taken until the Rhodamine concentration at the bottom of the sampled
enclosure did not change any more. Mixing intensity, D, was calculated according to the formula
D = Z² / 2 * Tm [cm² s-1], Z being water column depth and Tm
surface-to-bottom mixing time. Tm corresponds to the time for a tracer injected at one boundary to become 97 % uniformly distributed within the water column (Sanford 1997).
The vertical eddy diffusivities produced by the mixing regime in the artificially mixed treatments were considerably higher than in the non-mixed treatments (Table 1). However, manipulation of the air stream injected into the bottom of the intermediately mixed enclosures was not equally effective in all treatments over time. As a consequence, some ‘Intermediate D’ treatments may temporarily have experienced stronger or less strong mixing than originally intended. Along with the comparatively rough method of measuring the mixing intensity this may account for the relatively large variability of the vertical eddy diffusivity within a particular category of mixing intensity (Table 1).
TABLE 1. Vertical eddy diffusivity, D (cm² s-1), in the mixing intensity x water column depth treatments. Values of all replicate treatments are given except where D could only be determined in one of the replicates. The last column lists the overall mean of a mixing category ± standard error (SE).
We sampled the concentration of chlorophyll a in the enclosures at 2-day intervals and the concentrations of particulate
organic carbon (POC), dissolved inorganic nitrogen (DIN = NO2 -, NO3 - and NH4 –N), phosphorus and silica at 6-day intervals. Samples were collected with a 3-L Ruttner sampling bottle 0.5 m below the water surface,
Article 3 64
at a depth of 2 m and then at 2-m intervals downwards. The samples were transported to the lab and stored in a dark cool place until analysis (within a few hours) in 3-L HDPE flasks. Subsamples for the analysis of mineral nutrients were collected and frozen immediately at –18 °C. We measured the vertical distribution of photosynthetically active radiation (PAR) in the water column with a spherical underwater quantum sensor (LI-193SA, LICOR, Lincoln, Nebraska) just below the water surface, at a depth of 0.5 m and, from 1 m depth, in meter steps downwards to the bottom of each enclosure at 6-day intervals.
Filtering of sub-samples was conducted at the field station of the Norwegian University of Science and Technology (NTNU), Sletvik, in the immediate vicinity of Hopavågen. To determine the concentration of Chl a, 0.2-L to 0.7-L subsamples were filtered onto glass microfiber filters (GF 6, Schleicher & Schuell, Dassel, Germany). Chl a was measured fluorometrically after extraction with ethanol in a Turner Design 400 fluorometer. To assess the POC concentration 0.2-0.5 L subsamples were filtered onto precombusted glass microfiber filters. Filters were dried at 60 °C for 24 hours, wrapped in tin foil cups and, after compressing them into balls, combusted in a C/N-Analyser (NA 1500N, FISONS). Dissolved inorganic nutrients were analyzed with a SKALAR SAN plus SYSTEM auto-analyzer from subsamples frozen at –18 °C.
In each enclosure macro- and mesozooplankton was sampled at 6-day intervals by vertical hauls with a 100-µm plankton net from near the bottom to the surface and then transferred to a 250-ml plastic container. Gelatinous mesozooplankton (ctenophora, hydromedusae and salps) was counted and removed from the samples within 48 hrs after catch. In ctenophores we distinguished between small (0.2-1 cm) and large (> 1 cm) specimen. Samples were then preserved with acid Lugol’s solution (1 % final
concentration) for later analysis of crustacean zooplankton. Among copepods we distinguished calanoid and cyclopoid copepods, copepodids and nauplius larvae and counted them in a dissecting scope at 160 x magnification. In the larger copepod genera we counted specimen < 1 mm as copepodids, whereas in the genus Pseudocalanus specimen < 0.5 mm were counted as copepodids. Zooplankton taxa which occurred consistently at very low abundance (< 0.1 Ind L-1; appendicularians, hydromedusae, chaetognaths and euphausiids) at the end of the experiment were not further analysed.
Data analysis
Response to the turbulence and depth treatments became apparent for most state variables early in the experiment. With the exception of DIN, we only present data from Days 24, which are representative for the average patterns during the experiment. Because we had fertilized the enclosures with N and P in a molar ratio of 8:1, nitrogen was likely the production limiting nutrient. We therefore present nutrient data only for nitrogen. We explored treatment effects on algal biomass (measured as Chl a) and different groups of mesozooplankton collected on Day 24 using analysis of covariance (ANCOVA) with turbulence intensity as a fixed factor and mixing depth as the covariate. The response variables were log10-transformed for all statistical analyses. When the P-value of an interaction term exceeded 0.2 the term was dropped from the statistical model and only main effects of turbulence intensity and mixing depth were investigated. Statistical analyses were performed using SPSS 12.0.1 software.
The vertical patterns of DIN in the 6-m, low turbulence treatments on Day 24 were in contrast to all previous sampling dates and we suspect that the vertical order of samples was accidentally reversed during analysis. For these enclosures we therefore show vertical
Article 3 65
profiles of the DIN-concentration from Day 18 instead of Day 24.
Results
Light and mineral nitrogen
The intensity of the light available to phytoplankton decreased exponentially with depth in all treatments (see Fig. 1 for a typical vertical profile). The decrease in intensity in the top 3 m of the water column was always quite pronounced due to relatively strong absorption by water of short wavelengths compared to longer wavelengths. The water depth where the light intensity fell below 1 % of incident light intensity usually was between 5 and 8 m.
0
2
4
6
8
10
12
14
0 1 10 100
% I in
Dep
th (m
)
FIG. 1. Typical vertical profile of the photo-synthetically active radiation (PAR) in an enclosure in per cent of incident radiation at the water surface (Iin). Data points are means of the two replicate 14-m high turbulence intensity treatments ± SE from Day 24. If no SE is visible it is hidden by the symbol.
The concentration of dissolved mineral nitrogen (DIN) showed pronounced vertical patterns in all low turbulence treatments, increasing sharply from the surface down to 6 m with only minor changes below 6 m (Fig. 2a-c). The vertical distribution of nitrogen was homogeneous within all high turbulence treatments and increased from shallow to deep enclosures (Fig. 2d-f). Depth-averaged DIN concentrations in the intermediate turbulence treatments also increased from shallow to deep enclosures and slightly increased towards the bottom in one 6-m treatment and in the 14-m replicates. One 6-m replicate did, however, show a pronounced DIN vertical profile, the highest concentration occurring close to the surface (Fig. 2d).
Algal biomass patterns
At low turbulence, algal biomass concentration showed a vertical distribution roughly inverse to the distribution of DIN concentrations; i.e., chlorophyll-a concentrations peaked close to the water surface, declined vertically and did not change significantly below 6 m depth (Fig. 3a-c). Chl-a concentrations in the intermediate and high turbulence treatments did not show any obvious vertical trends (Fig. 3d-f). With the exception of one 6-m replicate which had a persistently high Chl-a concentration throughout the experiment, Chl-a concentrations were lower in intermediate turbulence treatments than in both low and high turbulence treatments at most depths (Fig. 3, Table 2). This resulted in a U-shaped relationship between algal biomass concentration and mixing intensity across all investigated water column depths (Fig. 4).
Article 3 66
(a)
0
2
4
6
8
10
12
14
0 10 20 30 40
DIN (µmol / L)
Dep
th (m
)
Low D
(d)
0
2
4
6
8
10
12
14
0 10 20 30 40
DIN (µmol / L)
Dep
th (m
)
Intermediate DIntermediate DHigh D
(b)
0
2
4
6
8
10
12
14
0 10 20 30 40
DIN (µmol / L)
Dep
th (m
)
(e)
0
2
4
6
8
10
12
14
0 10 20 30 40
DIN (µmol / L)
Dep
th (m
)
(c)
0
2
4
6
8
10
12
14
0 10 20 30 40
DIN (µmol / L)
Dep
th (m
)
(f)
0
2
4
6
8
10
12
14
0 10 20 30 40
DIN (µmol / L)
Dep
th (m
)
FIG. 2. Vertical profiles of the dissolved inorganic nitrogen (DIN) concentration in the enclosures at low (a-c), intermediate and high (d-f) mixing intensity (D). Data points are means of two replicate treatments ± standard error (SE). If no SE is visible it is hidden by the symbol. Each turbulence regime was applied to the water column depths 6 m, 10 m and 14 m. In panel (d) DIN vertical profiles are shown separately for each ‘Intermediate D’ replicate because the patterns differed considerably from each other in enclosures.
Article 3 67
(a)
0
2
4
6
8
10
12
14
0 5 10 15 20
Chl-a (mg m-3)
Dep
th (m
)
Low D
(d)
0
2
4
6
8
10
12
14
0 5 10 15 20 25Chl-a (mg m-3)
Dep
th (m
)
Intermed. DHigh DIntermed. D
(b)
0
2
4
6
8
10
12
14
0 5 10 15 20Chl-a (mg m-3)
Dep
th (m
)
(e)
0
2
4
6
8
10
12
14
0 5 10 15 20Chl-a (mg m-3)
Dep
th (m
)
(c)
0
2
4
6
8
10
12
14
0 5 10 15 20
Chl-a (mg m-3)
Dep
th (m
)
(f)
0
2
4
6
8
10
12
14
0 5 10 15 20
Chl-a (mg m-3)
Dep
th (m
)
FIG. 3. Vertical profiles of the Chl-a concentration in the enclosures at low (a-c), intermediate and high (d-f). mixing intensity (D). Data points are means of two replicate treatments ± standard error (SE). If no SE is visible it is hidden by the symbol. Each turbulence regime was applied to the water column depths 6 m, 10 m and 14 m. In panel (d) Chl-a vertical profiles are shown separately for each ‘Intermediate D’ replicate because the patterns differed considerably from each other in enclosures.
Article 3 68
TABLE 2. Effects of mixing intensity, D, and water column depth, Z, on algal biomass concentration (Chl a, mg m-3), and the density of calanoid and cyclopoid copepods, ctenophores (Bolinopsis sp.), and salps on Day 24 of the experiment. We show P-values from ANCOVAs on log10-transformed data to illustrate main effects and interaction effects of D and Zmix.
Chl a Calanoid
copepods Cyclopoid
copepods Bolinopsis0.2–1 cm
Bolinopsis > 1 cm
Salps
D 0.139 0.048 0.064 0.090 0.015 0.136 Z 0.089 0.099 0.003 > 0.2 0.075 > 0.5 D * Z > 0.2 0.150 0.005 0.159 > 0.2 > 0.5
Patterns in zooplankton
Copepods
Calanoid and cyclopoid copepods both occurred at a relatively low density (calanoid copepods 0.16-6.25 Ind. L-1, cyclopoid copepods 0.001-0.61 Ind. L-1) as compared to the typical copepod density in Hopavågen at this time of the year (calanoid plus cyclopoid copepods 3 to 65 copepods L-1). The abundance of calanoid copepods was significantly affected by mixing intensity with a tendency towards a U-shaped relationship between both (Fig. 4, Table 2). Water column depth had marginally non-significant effects on calanoid copepod density and there was a tendency towards interaction effects of water column depth and mixing intensity (Table 2). Cyclopoid copepods increased with increasing intensity of turbulent diffusion in 6-m treatments but decreased from low to intermediate turbulence intensity in 10-m treatments, and from low to high turbulence intensity in 14-m treatments (Fig. 4, Table 2).
The density of calanoid copepods was strongly correlated with the Chl-a and POC concentrations but had ‘+’ and ‘-’ signs, respectively (Table 3). The density of cyclopoid copepods was tightly related to the POC concentration but considerably less
strongly correlated with the Chl-a concentration (Table 3).
TABLE 3. Correlation coefficients (Pearson’s r) of the density of calanoid and cyclopoid copepods, and salps with algal and seston biomass concentrations (mg Chl-a m-3 and mg C m-3), respectively, on Day 24 of the experiment.
Calanoid
copepods Cyclopoid copepods
Salps
Chl a 0.98 0.80 -0.50 POC -0.96 -0.99 0.88
Gelatinous zooplankton
The only gelatinous filter feeder which occurred in the enclosures at the end of the experiment was an unidentified species of salp (length 0.5 to 1.5 cm). Salp density ranged from c. 5 to 15 Ind. L-1, decreased with increasing mixing intensity and was close to zero in most intensely mixed enclosures (Fig. 4d, Table 2). It was not significantly affected by water column depth but decreased with increasing mixing intensity and was zero or < 1 in intensely mixed enclosures (Fig. 4d, Table 2). Because of high variability of salp abundance within treatments the overall pattern was, however, not statistically significant. Salps were negatively correlated with the Chl-a concentration and positively with the concentration of seston carbon (Table 3).
Article 3 69
(a) Algal biomass
0.1
1.0
10.0
6 10 14
mg
Chl
a m
-3
(d) Salps
0.1
1.0
10.0
100.0
6 10 14
Ind
L-1
Low IntermediateHigh
(b) Calanoid copepods
0.1
1.0
10.0
6 10 14
Ind
L-1
(e) Bolinopsis, small
1
10
100
1000
6 10 14
Ind
L-1
(c) Cyclopoid copepods
0.0001
0.0010
0.0100
0.1000
1.0000
6 10 14Water column depth (m)
Ind
L-1
(f) Bolinopsis, large
0.01
0.10
1.00
10.00
100.00
6 10 14
Water column depth (m)
Ind
L-1
FIG. 4. Effects of turbulent diffusion and water column depth on (a) algal biomass concentration, measured as Chl-a, (b) calanoid copepods, (c) cyclopoid copepods, (d) salps, (e) ctenophores (Bolinopsis sp.) 0.2-1-cm size class, and (f) Bolinopsis sp. > 1-cm size class, at low, intermediate and high mixing intensity. Columns are means of two replicate treatments ± standard error (SE). If no SE is given it was either zero (6-m ‘Low D’ and ‘Intermediate D’ treatments in panel (c)) or could not be properly displayed (14- and 6-m ‘High D’ treatments in panels (d) and (f), respectively). In panel (a) we only show the ‘Intermediate D’ replicate with the low Chl-a concentration.
Bolinopsis sp., a carnivorous ctenophore,
was the dominant species among gelatinous zooplankton by numbers (Fig. 4e-f). Of the two size classes we distinguished (0.2-1 cm and > 1cm), the smaller one occurred at very high densities (10 to > 500 Ind. L-1; Fig. 4e).
Effects of mixing intensity were obvious among the 6-m treatments in both size classes (which showed a dome-shaped relationship with mixing intensity here) but, overall, significantly affected large Bolinopsis sp. only (Table 2). Water column depth tended to
Article 3 70
positively affect the density of large Bolinopsis sp. (Table 2).
The density of Bolinopsis sp. was strongly negatively correlated with the density of calanoid copepods (small Bolinopsis, Pearson’s r = -0.87; large Bolinopsis, Pearson’s r = -0.95; Fig. 4e) and less strong with the density of cyclopoid copepods (small Bolinopsis, Pearson’s r = -0.62; large Bolinopsis, Pearson’s r = -0.76; Fig. 4f).
Discussion
Vertical distribution of phytoplankton and limiting resources
In waters with relatively low rates of vertical mixing theory predicts that because of decreasing light intensity the density of neutrally buoyant, sinking, and actively moving phytoplankton assumes a non-uniform vertical distribution and that the depth of maximum abundance should primarily depend on whether the system is predominantly limited by light or by nutrients (Huisman et al. 1999b, c, Klausmeier and Litchman 2001, Huisman et al. 2002, Huisman and Sommeijer 2002a). Accordingly, if phytoplankton production is primarily limited by light the peak in phytoplankton density is expected near the water surface; if phytoplankton production is primarily limited by nutrients the peak in phytoplankton density is expected closer to the underlying layer of water or the sediment provided they are the primary source of nutrients. If, however, both nutrients and light are about equally limiting the maximum abundance of phytoplankton should occur at some intermediate depth. Consumption of nutrients by phytoplankton should generally follow the pattern of primary production. In a thoroughly mixed water column both algal cells and dissolved nutrients should largely be homogeneously distributed. With decreasing intensity of turbulence the concentration of any
limiting nutrient(s) may become increasingly heterogeneous and show an inverse vertical distribution to phytoplankton. In a water body dominated by light limitation this should result in an increase in the concentration of mineral nutrients towards greater depth (where less nutrients will be consumed) even in the absence of nutrient supply from below. Although vertical profiles of Chl-a and dissolved mineral nutrients are frequently recorded in the oceans (e.g., Eilertsen 1993, Knockright et al. 1994) the small number of experiments which investigated such patterns have, to our knowledge, never investigated a gradient of turbulence intensity and always included a sediment layer. Whereas water column depths on the scale of 1 m seem to be too shallow to produce vertical microscale patterns of Chl-a and mineral nutrient concentrations, at least under a light and nutrient regime typical for coastal waters (Petersen et al. 1998), Oviatt (1981) identified high near-surface and low near-bottom Chl-a concentrations during a phytoplankton bloom in the stagnant water column of 5 m deep mesocosms. Conversely, concentrations of dissolved mineral nutrients were lowest near the water surface and highest above the sediment. This experiment did, however, not allow to distinguish between nutrients released from the sediment and nutrients not consumed by phytoplankton production.
In the ‘Low D’ treatments, the vertical pattern of the Chl-a concentration resembled the stationary depth distribution of light-limited phytoplankton predicted for algal monocultures at low intensity of water column turbulence (Huisman et al. 1999b, c, Klausmeier and Litchman 2001, Huisman et al. 2002, Huisman and Sommeijer 2002a): the Chl-a concentration showed a pronounced peak close to the water surface and declined to much lower concentrations at depths of 6 m and below (Fig. 3). The dominance of Eutreptiella gymnastica (a motile green alga) in live samples from near the water surface
Article 3 71
suggests that the near-surface peak in Chl-a concentration may have been brought about not only by the local phytoplankton growth rate exceeding vertical mixing and loss rates but also by active migration of algae towards the light. Corresponding to theoretical expectations, the concentration of dissolved mineral nitrogen (DIN) in ’Low D’ treatments was relatively low near the water surface and strongly increased towards depth in all water columns (Fig. 2a-c). Beyond a depth of 6 m the light intensity available to phytoplankton usually was below the light compensation point, i.e. the light intensity at which net production equals zero and which is generally assumed to be 1 % of the incident light intensity. The fact that the observed vertical patterns of the Chl-a and dissolved nutrient concentration established early during the experiment when remineralisation of nutrients from sedimented seston likely was very small indicates non-consumption of nutrients as the primary cause of high nutrient availability at greater depths. Both the peak in phytoplankton density and the increase in dissolved nutrients to depth strongly suggest that phytoplankton production was primarily limited by light in the’Low D’ treatments In ‘Intermediate D‘ and ‘High D’ treatments the vertical distribution of the Chl-a concentration did not exhibit any conspicuous pattern and thus corresponded to the largely homogeneous vertical distribution of phytoplankton expected at higher intensities of turbulent mixing (Fig. 2d-f, 3d-f). The observed vertical distribution of the dissolved inorganic nitrogen concentration showed some variation with water column depth in the ‘Intermediate D’ treatments which may relate to slight differences in turbulence intensity across depth. A distinct vertical pattern of the concentration of DIN was conspicuous in one of the 6-m ‘Intermediate D’ replicates (Fig. 2d). Although measurement of turbulence intensity was not successful in this enclosure visual inspection suggested it was relatively low throughout the experiment as technical
reasons prevented adjustment of the mixing intensity to the level of the replicate treatment.
In situations where the intensity of mixing is not sufficient to homogenize phytoplankton within a water column, local differences in zooplankton grazing generally should either reduce or enhance any pattern in phytoplankton vertical distribution. As a consequence, the chance of detecting relatively subtle patterns in phytoplankton vertical distribution as were expected in treatments with intermediate mixing intensity should be affected. Because zooplankton was collected by vertically integrating net tows we do not know whether it was distributed homogeneously within water columns and, hence, we can not entirely rule out the possibility that zooplankton grazing affected or even accounted for the vertical pattern of the Chl-a concentration observed in ‘Low D’ treatments. The persistence of the U-shaped pattern of the Chl-a concentration versus turbulence intensity irrespective of the abundance of the major grazer indicates, however, that phytoplankton net advection, migration, and growth account for the observed vertical pattern. Clearly, a grazer-free system will be required to rigorously test if opposite vertical concentration gradients of phytoplankton and nutrients may be maintained at the low intensities of turbulent diffusion typical for the surface layer of the stratified oceans when wind-mixing is weak.
Effects on algal and herbivore density, and phytoplankton-zooplankton interactions
In very shallow, unstratified waters only non-sinking algae should be able to bloom within the water column, according to reaction-advection-diffusion models (Huisman et al. 1999b, c). At intermediate to large water column depths the biomass of neutrally buoyant algae should decrease with increasing
Article 3 72
intensity of turbulence as algae become progressively mixed to depths with an unfavourable light climate (Huisman et al. 1999b, c). The biomass of sinking algae is predicted to show a unimodal relationship to mixing intensity across the same depth range; this is because algal cells will be mixed unfavourably deep towards very high intensities of turbulence while, towards lower turbulence intensities, algal cells will progressively sink out of the water column (Huisman et al. 2002, Huisman and Sommeijer 2002a, b). At very shallow water column depths, a population of sinking algae should not be able to persist. If nutrient-limited growth is allowed for, light limitation should still be of overriding importance for algal growth in deep, well-mixed water columns except in extremely oligotrophic situations. At low to moderate mixing intensities nutrient limitation should become increasingly important for neutrally buoyant algae towards shallow water column depths. Across realistic mixing depths, sinking algae should experience nutrient limitation in well-mixed surface layers only at intermediate mixing depths (Huisman and Weissing 1995, Diehl 2002). Although the above predictions relate to the steady state of algal monocultures, phytoplankton assemblages, in which sinking and neutrally or positively buoyant algal species or motile phytoplankters compete for resources over time, may approach a state with some intermediate biomass versus turbulence pattern.
The observed U-shaped relationship between the Chl-a concentration and mixing intensity clearly is in stark contrast to the negative or hump-shaped relationship between algal density and turbulence intensity expected for neutrally buoyant and sinking algae, respectively, at intermediate to large mixing depths (such as the 10- and 14-m treatments). Relatively high depth-averaged C:Chl-a ratios of around 86 ± 18.3 (mean ± SE) in ‘Intermediate D’ treatments as compared to
70.9 ± 7.5 in ‘Low D’ and 47.8 ± 6.8 in ‘High D’ treatments suggest that unpigmented microplankton, such as heterotrophic dinoflagellates, was more abundant here. Although no qualitative microplankton data exist to support this hypothesis results from a related experiment suggest that unpigmented, microzooplankton may have been comparatively abundant in treatments in which algae experience low mean light intensity (Kunz and Diehl, companion manuscript). In this experiment, Protoperidinium bipes, a heterotrophic dinoflagellate, increased in abundance with increasing mixing depth, i.e. with decreasing mean light availability. Treatments with intermediate turbulence intensity and, hence, relatively long mixing time (as compared to strongly mixed treatments) should therefore have favoured microorganisms capable of mixo- or heterotrophic feeding (including unpigmented forms). This, in turn, should have resulted in a relatively high seston C:Chl-a ratio, as compared to both treatments with high and low mixing intensity. The concentration of seston carbon was indeed largely unrelated to mixing intensity over the broad range of turbulence intensities examined (Fig. 5).
Seston biomass
1
10
100
1000
6 10 14
Water column depth (m)
mg
C m
-3
FIG. 5. Effects of turbulent diffusion and water column depth on seston biomass concentration, measured as particulate organic carbon, at low, intermediate and high mixing intensity (symbols as in Fig. 4). Columns are means of two replicate treatments ± standard error (SE).
Article 3 73
Intermediate turbulence intensity but not stagnant water or higher intensity of turbulence also favoured mixo- or heterotrophic dinoflagellates (Protoperidinium sp., Scrippsiella trochoidea) in a marine microcosm experiment (Estrada et al. 1987). Mixing intensity-dependent grazing effects of microzooplankton on phytoplankton therefore need to be considered when analysing relationships between the Chl-a concentration and the intensity of turbulent diffusion.
In ‘Low D’ treatments, mixing time was very long and, hence, mixing rate so low that microplankton may have adapted to light levels locally in the water column and in various ways, on an individual or community basis. These processes may have resulted in the C:Chl-a ratio to average out over the water column. Photoadaptation of phytoplankton is unlikely to have accounted for the observed differences in C:Chl-a ratios between the different turbulence regimes because the longer mixing time in ‘Intermediate D’ treatments versus ‘High D’ treatments and, hence, longer exposure to an unfavourable light climate should have resulted in precisely the opposite pattern, i.e. a lower C:Chl-a ratio in ‘Intermediate D’ treatments.
The patterns observed in copepod and salp density indicate that grazing may have differed considerably between crustacean and gelatinous zooplankton and between treatments. With the exception of the 6-m ‘High D’ treatments, the relatively low overall density of calanoid copepods suggests they only had a minor grazing impact on phytoplankton while the strong positive correlation of both calanoid and cyclopoid copepods with the Chl-a concentration indicates bottom-up control of crustacean zooplankton in this experiment (Pearson’s r = 0.98). In contrast, high salp density in ‘Low D’ and ‘Intermediate D’ treatments and the negative correlation between salp density and the Chl-a concentration suggest that grazing by salps had some negative effect on
phytoplankton biomass. Because of high variability of salp abundance within treatments and variability of C:Chl-a ratios across turbulence treatments the correlation was, however, not very strong (Pearson’s r = -0.5). High clearance rates and removal of substantial amounts of phytoplankton from surface waters have previously shown that salps are important grazers in coastal and oceanic waters (Zeldis et al. 1995, Lalli and Parsons 1997). Overall, however, the tendency of calanoid copepod density to first decrease and then increase with mixing intensity, and of salp density to decrease with increasing turbulence should have acted in favour of, rather than against, the expected pattern of phytoplankton versus turbulence (Fig. 4a, b, d).
Effects on herbivores, predators and predator-prey interactions in the plankton
The response of zooplankton density to turbulent diffusion should be a combination of both direct and indirect (food- and predation-related) effects. Turbulent fluid motion will generally affect the velocity components of travelling suspended particles. This suggests that the feeding mode of zooplankton should generally matter in terms of turbulence effects. Mathematical investigation of the problem showed that zooplankton encounter rate with food increases with increasing turbulent velocity in ambush and cruise-type predators and in grazers which generate a feeding current (Rothschild and Osborn 1988, Kiørboe and Saiz 1995, Osborn 1996). As turbulence intensity continues to grow, the prey capture rate should, however, be negatively affected, resulting in a dome-shaped relationship between zooplankton predation and turbulence intensity (Jenkinson 1995). Observations of decreasing feeding rates in a number of copepod species under relatively turbulent conditions have led to the proposition that this translates into a dome-shaped relationship
Article 3 74
between turbulence and zooplankton production (Visser et al. 2001, Visser and Stips 2002). Effects of turbulence intensity on encounter rates with conspecifics/ mating behaviour should, generally, be governed by similar principles as predator-prey encounter rates, whether the zooplankter is a broadcast spawner or not; this issue will, however, not be considered further here. In the case that turbulence intensity does not affect phytoplankton stoichiometry and, therefore, food quality then algal density and grazer growth should be proportional. Effects of turbulence intensity on interactions between predators and grazers should differ from interactions between grazers and algae in that, as a prey, the grazer is also motile; however, effects of turbulence intensity on growth of grazers and predators should still be in the same direction, according to the aforementioned theory.
The tendency to a U-shaped relationship between the density of calanoid copepods and turbulence intensity, the strong positive correlation between calanoida density and the Chl-a concentration (itself inversely unimodal related to mixing intensity), and the strong negative correlation with the major predator of copepods in the experiment, Bolinopsis, all indicate that indirect effects of turbulence intensity on copepod abundance were very important (Fig. 4). Despite that the abundance of secondary factors may have blurred the turbulence signal, it does not seem that the mixing intensity generated in ‘High D’ treatments had strong negative effects on copepod growth. This finding fits to the conclusion of Kiørboe and Saiz (1995) that negative effects on the feeding current of copepods were not likely at the intensities of turbulence typically found in oceans (see Petersen et al. 1998 for an overview of qualitative effects of turbulence on zooplankton). A U-shaped relationship between zooplankton growth and turbulence intensity has previously been attributed to the
dispersal of prey patches at ‘intermediate levels of turbulence’ and increasing predator-prey encounter rate towards higher turbulence intensity (Davis et al. 1991, Druet 2003). However, the turbulence intensities generated in our experiment (2.3-147 cm² s-1) fall into a somewhat higher range of turbulence intensities anticipated to yield a dome-shaped relationship between the intensity of turbulent diffusion and zooplankton capture and growth rates (Jenkinson 1995, Visser and Stips 2002). Hence, the U-shaped pattern between calanoid copepod density and mixing intensity observed in our experiment more likely resulted from combined effects of phytoplankton availability and predation by Bolinopsis along the turbulence gradient. The pattern observed in salp density is more difficult to explain as the decrease in abundance with increasing intensity of turbulence was not statistically significant (Fig. 4d, Table 2). The mere absence of salps from ‘High D’ treatments was, however, a consistent pattern that may have resulted from detrimental effects of high mixing intensity on individual specimen and/ or their feeding current. Individual and population growth may thus have been consistently suppressed. As this study may be the first to investigate effects of tubulence intensity on salp density and because the susceptibility of the feeding current of salps to turbulent diffusion seems to lack experimental treatment it is, however, impossible to draw any conclusion here. The high variability of salp density within treatments may relate to considerable differences in abundance already at the beginning of the experiment owing to the reduced likeliness to capture a representative number of larger-sized organisms (the approximate size of mature salps was ~ 1 cm) in relatively small volumes of water (such as used for filling the enclosures). The decrease in abundance of salps from ‘Low D’ to ‘High D’ treatments should have relaxed food competition with calanoid copepods and so may have contributed to the pattern observed
Article 3 75
in calanoid density. In cyclopoid copepods which primarily feed on ciliates only indirect effects of the concentration of phytoplankton biomass on their density were to be expected. The density of cyclopoid copepods was indeed less tightly correlated with the Chl-a concentration (as compared to calanoid copepods). It was, however, very strongly related to the concentration of seston carbon as expected for mesozooplankton predators feeding on microzooplankton. Cyclopoid copepod density did not show any clear pattern with increasing intensity of turbulence. The very low abundance of cyclopoid copepods in the 6-m ‘Low D’ and ‘Intermediate D’ treatments, and in the 14-m ‘High D’ treatments should, however, have made detection of any trend difficult (Fig. 4).
Bolinopsis sp., as an ambush predator, will be strongly reliant on prey movement and, therefore, likely be considerably affected by turbulent fluid motion (Kiørboe and Saiz 1995). Increases in intensity of turbulent diffusion from should therefore have positively affected the prey encounter rate of Bolinopsis in the lower turbulence range. Higher intensities of turbulence may, however, have reduced the prey-detection ability of Bolinopsis and the rate of successful encounters with prey, or had negative effects on fecundity and survival of Bolinopsis. The observed tendency of Bolinopsis abundance to be unimodally related to turbulence intensity in our experiment therefore not only supports the paradigm of a dome-shaped relationship between zooplankton growth and turbulence intensity but may also provide the first field evidence of such a relationship in mesozooplankton .
Conclusions
The results of our experiment suggest that the detection of relationships between phytoplankton density and mixing intensity
and depth is sensitive to the surrogate parameter used because long mixing times may select for heterotrophic microplankton, as indicated by elevated C:Chl-a concentrations at intermediate mixing intensity. Hence, a detailed qualitative and quantitative analysis of the microplankton composition, including the assessment of the nutritional mode of small flagellates and dinoflagellates, and knowledge of species-specific sinking or buoyancy characteristics will be required to assess effects of mixing intensity on the biomass of phytoplankton assemblages. Clearly, this is not easily accomplished. Alternatively, pigment analysis of water samples might provide a more time- and cost-efficient solution but was, unfortunately, not available when the experiment was conducted. As for zooplankton, this study potentially provides rare evidence for direct effects of turbulence intensity on the actual density of a species despite confounding indirect effects of food availability and predation. The direction of response of zooplankton growth to increasing turbulence intensity in a plankton community should therefore depend on the pattern of phytoplankton density, the presence of any predators, and on the feeding mode and susceptibility of a species of zooplankton to detrimental effects of turbulent fluid motion on reproduction and survival.
Acknowledgments
We thank Christof Jäger, Mathew Leibold, Herwig Stibor and Timo Tamminen for seminal discussions. Petra Cinková (Charles University, Prague), Øystein Leknes, Sven Ove Linde, Barbara Neyts, Yngvar Olsen and Nils Tokle (Trondheim Marine Systems Research Infrastructure), Gerhard Angermann, Margit Feissel, Claudia Happe, Peter Herrmann, and Herwig Stibor (Ludwig-Maximilians-University München), and Thomas Hansen and Ulrich Sommer (Institute for Marine Research
Article 3 76
IFM-GEOMAR, Kiel) provided technical support. This research work was funded by a Ludwig-Maximilians-University München Stipend for Junior Scientists and the European Commission - Improving the Human Potential / Access to Research Infrastructure Program (1999-CT00060).
Article 3 77
References
Berger SA, Diehl S, Kunz TJ, Albrecht D, Oucible AM, Ritzer S Light supply, plankton biomass and seston stoichiometry in a gradient of lake mixing depths. (submitted)
Cury P, Roy C (1989). Optimal environmental window and pelagic fish recruitment success in upwelling areas. Can.J.Fish.Aquat.Sci.46:670-680
Davis CS, Flierl GR, Wiebe PH, Franks PJS (1991) Micropatchiness, turbulence and recruitment in plankton. J.Mar.Sci. 49(1):109-151
Diehl S (2002) Phytoplankton, light, and nutrients in a gradient of mixing depths: theory. Ecology 83:386-391
Diehl S, Berger SA, Ptacnik R, Wild A (2002) Phytoplankton, light, and nutrients in a gradient of mixing depths: field experiments. Ecology 83:399-411
Diehl S, Berger SA, Wöhrl R (2005) Flexible algal nutrient stoichiometry mediates environmntal influences on phytoplankton and its abiotic resources. Ecology (in press)
Druet C (2003) The fine structure of marine hydrophysical fields and its influence on the behaviour of plankton: an overview of some experimental and theoretical investigations. Oceanologia 45(4):517-555
Grover J (1997) Resource competition. Chapman & Hall, London
Harris GP (1986) Phytoplankton ecology. Chapman & Hall, London
Huisman J, Weissing FJ (1994) Light-limited growth and competition for light in well-mixed aquatic environments: an elementary model. Ecology 75:507-520
Huisman J, Weissing FJ (1995) Competition for nutrients and light in a mixed water column: a theoretical analysis. Am.Nat. 146:536-564
Huisman J (1999) Population dynamics of light-limited phytoplankton: microcosm experiments. Ecology 80:202-210
Huisman J, Jonker RR, Zonneveld C, Weissing FJ (1999a) Competition for light between phytoplankton species: experimental tests of mechanistic theory. Ecology 80:211-222
Huisman J, van Oostveen P, Weissing FJ (1999b) Species dynamics and phytoplankton blooms: incomplete mixing and competition for light. Am.Nat. 154(1):46-68
Huisman J, van Oostveen P, Weissing FJ (1999c) Critical depth and critical turbulence: two different mechanisms for the development of phytoplankton blooms. Limnol.Oceanogr. 44(7):1781-1788
Huisman J, Arrayás M, Ebert U, Sommeijer B (2002) How do sinking phytoplankton species manage to persist? Am.Nat.159(3):245-254
Huisman J, Sommeijer B (2002) Maximal sustainable sinking velocity of phytoplankton. Mar.Ecol.Prog.Ser. 244:39-48
Huisman J, Sharples J, Strom JM, Visser PM, Kardinal WEA, Verspagen JMH, Sommeijer B (2004) Changes in turbulent mixing shift competition for light between phytoplankton species. Ecology 85(11):2960-2970
Irigoien X, Harris, RP, Head, RN (2000) Does turbulence play a role in feeding and reproduction of Calanus finmarchicus. J. Plankton Res. 22:399-407
Jenkinson, IR (1995) A review of two recent predation rate models: the dome-shaped relationship between feeding rate and shear rate appears universal. J.Mar.Sci. 52:605-610
Article 3 78
Klausmeier CA, Litchman E (2001) Algal games: the vertical distribution of phytoplankton in stratified water columns. Limnol.Oceanogr. 46:1998-2007
Kiørboe T, Saiz E (1995) Planktivorous feeding in calm and turbulent environments, with emphasis on copepods. Mar.Ecol.Prog.Ser. 122:135-145
Kunz TJ, Diehl S (2003) Phytoplankton, light and nutrients along a gradient of mixing depth: a field test of producer-resource theory. Freshw.Biol. 48:1050-1063
Kunz TJ, Diehl S Effects of mixing depth and nitrogen enrichment on marine zooplankton, phytoplankton, light and mineral nutrients.(submitted)
Maar M, Nielsen TG, Stips A, Visser AW (2003) Microscale distribution of zooplankton in relation to turbulent diffusion. Limnol.Oceanogr. 48:1312-1325
MacIntyre S (1993) Vertical mixing in a shallow, eutrophic lake: possible consequences for the light climate of phytoplankton. Limnol.Oceanogr. 38:798-817
Mann KH, Lazier JRN (1996) Dynamics of Marine Ecosystems: Biological-physical Interactions in the Oceans. Blackwell, Oxford
Osborn TR (1996) The role of turbulent diffusion for copepods with feeding current. J.Plankton Res. 18:185-195
Reynolds CS (1994) The long, the short and the stalled: on the attributes of phytoplankton selected by physical mixing in lakes and rivers. Hydrobiol. 289:9-21
Ptacnik R, Diehl S, Berger SA (2003) Performance of sinking and non-sinking phytoplankton taxa in a gradient of mixing depths. Limnol.Oceanogr. 48:1903-1912
Rothhaupt KO (1988) Mechanistic resource competition theory applied to laboratory experiments with zooplankton. Nature 333:660-662
Rothschild BJ, Osborn TR (1988) Small-scale turbulence and plankton contact rates. J. Plankton Res. 10:465-474
Visser AW, Stips A (2002) Turbulence and zooplankton production: insights from PROVESS. J. Sea Res. 47:317-329
Acknowledgements 79
Acknowledgements
A number of people have contributed to this thesis and deserve special thanks:
Prof. Sebastian Diehl agreed on the topic, and provided computer and lab workplaces. Thank you for your encouraging and skillfull advice and guidance through all those years as a PhD student!
PD Dr. Herwig Stibor provided seminal ideas, support during field work and mental distraction from this thesis by putting myself in charge for the vegetation in his office during times of leave.
I thank Stella Berger, Lissy Pfeiffer and Gabi Sigl for enlivening office hours and Margit Feissel and Angelika Wild for their restless effort regarding administrative issues and the provision of lab materials and equipment. I also thank Achim Weigert for not resisting to analyse water samples well beyond the use-by-date. Gerhard Angermann’s and Stella Berger’s tireless technical support during the final phase of this thesis will be unforgotten.
Cordial thanks to Robert Ptacnik for valuable comments on Chapters one and two and to Petra Cinková (the live Aurelia aurita which hit my back will be unforgotten…), Sabine Dressmann, Anna Gelzleichter, Martin Groth, Claudia Happe, Peter Herrmann, Jan Ingenhaag and Nike Sommerwerk for their skillful and arduous help with lab and field work. Thanks also to those anonymous people who spread the ‘roaring stag’ story from North Atlantic to Red Sea shores. I highly acknowledge the nutrient and C/N analyses of water samples conducted by Thomas Hansen and the lab workplace provided by Prof. Ulrich Sommer (Institute for Marine Research-Geomar, Karl-Albrechts University, Kiel). Prof. Cathérine Legrand (Kalmar University, Sweden) borrowed the fluorometer used in the 2001 experiment and helped with phytoplankton identification.
Warm thanks to Øystein Leknes, Svenn Ove Linde, Alexandra Neyts, Prof. Yngvar Olsen, Prof. Egil Sakshaug, and Nils Tokle from the Trondheim Marine Systems Research Infrastructure / Norwegian University for Science and Technolgy, Norway, for collaboration, hosting and welcoming our research group!
Last not least, I wish to thank my friends for tolerating my absence from way to many outings during the final phase of this thesis.
Curriculum Vitae
Date and place of birth 31 March 1972, Munich Citizenship German
University education
July 2000 – Oct 2005 PhD thesis, Ludwig-Maximilians-University (LMU), Munich, Germany Effects of mixing depth, turbulent diffusion and nutrient enrichment on enclosed marine plankton communities (Advisor: Prof. S. Diehl) In collaboration with the Norwegian University of Science and Technology, Trondheim, and a team of biology students from LMU.
Nov 1994 – Sept 1999
Diplom in Biology (approx. equival. MSc Biol. Sciences), LMU Thesis on effects of mixing depth and nutrient content in the epilim-nion of lakes on light, biomass & physiological state of phytoplankton. Major: Ecology. Minors: Landscape planning and conservation biology, Systematic botany, Zoology
March 1996 – Jan 1997 Study Abroad Program at The Flinders University of S.A., Adelaide: Coursework in marine biology and biodiversity, functional ecology of marine organisms, community ecology, conservation biology, plant ecophysiology, systematic biology, and Australian studies.
NOV 1992 – OCT 1994 Undergraduate studies in biological sciences, chemistry, mathematics and physics, LMU 1994, 1995 Basic courses in geology, palaeontology, and toxicology, LMU
Professional experience Jan 2003 - Jun 2004 (half-time)
Research and teaching associate, LMU Conducted an enclosure experiment on effects of mixing depth on zooplankton-phytoplankton interactions in lakes.
June 1997 – May 2004 (part-time)
Freelance biologist with the Working Group Habitat Network, Chiemgau, southern Germany (Project supervisor: Prof. O. Siebeck) Provided statistical analyses of biological field data, design and realization of exhibitions, and guided eco-tours of the area.
Nov 1999 – Dec 1999 Project employee, Fraunhofer Management GmbH, Munich Feb 1997 – March 1997 Freelancer at zeiX image digital publishing GmbH, Munich:
Translated technical terms for a German-English thesaurus. Aug 1995 – Sept 1995 Scientific assistant at the chair Landscape Planning and Conservation Biology, Technical
University of Munich (TUM), in a project investigating treetop biodiversity
Research grants Effects of mixing depth and turbulent diffusion on marine phyto-plankton, light and nutrients
2000 – 2002 2000, 2001
University stipend for the promotion of junior scientists, LMU European Commission-Access to Research Infrastructure Program (Assoc. investigator: Prof. S. Diehl)
Publications Kunz TJ, Diehl S. Effects of mixing depth and nitrogen enrichment on marine zoo- and phytoplankton, light mineral and nutrients (in prep.). Kunz TJ, Diehl S. Responses of auto-, mixo- and heterotrophic marine plankton to N enrichment and a mixing-depth gradient (in prep.). Kunz TJ, Diehl S. Effects of water column depth and turbulent diffusion on an enclosed North Atlantic plankton community (in prep.).
Berger SA, Diehl S, Kunz TJ, Oucible A, Ritzer S, Albrecht D. Light supply, plankton biomass and seston stoichiometry in a gradient of lake mixing depths (submitted). Kunz TJ, Diehl S (2003). Phytoplankton, light, and nutrients in a gradient of mixing depth: a field test of producer-resource theory. Freshwater Biology 48, 1050-1063.
CONFERENCE PRESENTATIONS
16–20 Feb 2004 ASLO/TOS Ocean Research Conference 2004, Honolulu, Hawai’i: Water column turbulence and its effects on marine plankton (Oral)
23–27 March 2003 5 th International Conf. on Environmental Future, Zurich, Switzerland (attendance only) 10–14 June 2002 ASLO Summer Meeting, Victoria, B.C.:
Mixing intensity and water column depth: How do they affect marine phytoplankton biomass and its abiotic resources? (Oral)
25–28 April 2002 Trondheim Marine Systems Research Infrastr.-User Meeting, Norway: Effects of mixing intensity and water column depth on marine phytoplankton biomass, light, and nutrients (Oral)
5–9 June 2000 ASLO Aquatic Sciences Meeting, Copenhagen, Denmark: Influence of mixing depth on phytoplankton, light, and nutrients: A comparative lake study (Poster)
Professional training
26–30 April 2004 Aquatic Ecology and Climate Change, PhD course, Copenhagen Global Change Initiative, Brørfelde, Denmark
27-31 Oct 1997 Ecological Check and Assessment of Skiing Areas, GIS course, Chair Landscape Planning and Conservation Biology, TUM
30 Sept-4 Oct 1996 Fisheries and Aquaculture Science, South Australian Research and Development Institute, Adelaide, S.A.
Teaching experience
May 1997 – May 2004 Teaching assistant at the Dept. Biology II, LMU: Assisted basic courses in biodiversity, plankton ecology, zoology, and statistics, the Experim. plankton ecology & Limnological field courses
March 1997 – Dec 1997 Educational supervisor, Museum Man and Nature, Munich: Introduced pupils (age 5 to 15) to the regional flora, fauna, and general ecological principles via presentations and guidance through interactive displays.
Community service
Aug 1991 - Oct 1992 (Full-time)
Mobile Social Care Service with the Bavarian Red Cross, Munich Provided care for old and / or handicapped people in their home.
Volunteer work Coordinator of the ‘Recent Literature in Evolutionary Ecology’ seminary, Dept. Biology
II, LMU Equipment Officer, Flinders University Underwater Club Member of the Arbeitskreis Oekologie, a student group aiming at improving teaching in ecology at the Faculty of Biology, LMU
Languages English (fluent), French (good), German (1st language),