Do Not Cite Without Permission EFFECTS OF FOOT STIMULATION ON THE HUMAN ELECTROENCEPHALOGRAM Thatcher, R. W 1 ., DeBrincat, M. 2 , North, D. M. 1 , and Dhaliwal, J. 2 EEG and NeuroImaging Laboratory, Applied Neuroscience Research Institute. St. Petersburg, Fl 1 and Voxx Life, Inc., Toronto, Canada 2 Send Reprint Requests To: Robert W. Thatcher, Ph.D. Applied Neuroscience Res. Inst. 8200 Bryan Diary Rd., Suite 300 Largo, Florida 33777 (727) 244-0240, [email protected]
Transcript
Do Not Cite Without Permission
EFFECTS OF FOOT
STIMULATION ON THE HUMAN
ELECTROENCEPHALOGRAM
Thatcher, R. W1., DeBrincat, M.2, North, D. M.1, and Dhaliwal, J.2
EEG and NeuroImaging Laboratory, Applied Neuroscience Research Institute. St. Petersburg, Fl1
and Voxx Life, Inc., Toronto, Canada2
Send Reprint Requests To: Robert W. Thatcher, Ph.D. Applied Neuroscience Res. Inst. 8200 Bryan Diary Rd., Suite 300 Largo, Florida 33777 (727) 244-0240, [email protected]
2
ABSTRACT
Objectives: The purpose of this study was to explore the effects on the human electroencephalogram (EEG) by replacing standard cloth socks and placing socks with a patterned somatosensory form sewed into the bottom of the socks. Methods: The electroencephalogram (EEG) was recorded from 19 scalp locations from 60 subjects ranging in age from 14 years to 83 years (Females = 26, males = 34). An approximate five minute baseline EEG was recorded with subjects wearing standard store purchased socks on their feet. The subject’s standard socks were removed and the Voxx pattern socks were placed on the subject’s feet and a second EEG recording was obtained. Both eyes-closed and eyes-open conditions were recorded. A FFT auto and cross-spectral power analysis of the surface EEG was conducted from 1 Hz to 50 Hz. The variables were absolute power EEG in 1 Hz increments and coherence and phase differences in 10 frequency bands (delta, theta, alpha1, alpha2, beta1, beta2, beta3 and hi-beta). Paired t-tests between the standard socks and Voxx pattern socks conditions were computed for each subject for all EEG measures as well as group paired t-tests. Results: The results showed statistically significant t-test differences (P < .01) in 59 out of 60 subjects in absolute power and 60 out of 60 subjects showed statistically significant differences in coherence and phase difference. The largest differences were in the alpha1 and beta2 frequency bands and especially in central scalp locations. Paired t-tests of LORETA current source densities between socks on and socks off demonstrated statistically significant differences in 60 out of 60 subjects. The largest effects of Voxx socks on were on the medial bank of the somatosensory cortex as well as in the left frontal lobes in the theta and alpha frequency. Conclusions: A strong effect size of the Voxx pattern socks on the EEG was present primarily in the theta and alpha frequency bands. Anatomical validation was evident because of the strong effects on the homuncular projection of the feet to the medial somatosensory cortex. The mechanism of action of the Voxx pattern socks on the brain and the EEG is still under investigation.
3
Introduction
The peripheral nervous system (PNS) connects the central nervous system to environmental stimuli to gather sensory input and create motor output. The PNS coordinates action and responses by sending signals from one part of the body to another (From the various receptors such as mechano-receptors and dermatomes to the brainstem). The PNS includes all other sensory neurons, clusters of neurons called ganglia, and connector neurons that attach to the brainstem and other neurons (Hubbard, 1974). The brainstem connects the forebrain with the spinal cord. It consists of the midbrain, medulla oblongata, and the pons. The primary input into the brainstem are through the Area Postrema (AP) and Nucleus Tractus Solitarius (NTS). Motor and sensory neurons relay signals between the brain and spinal cord. Ascending neural pathways cross allowing the left hemisphere of the cerebrum to control the right side of the body and vice versa. The brainstem coordinates motor control signals sent from the brain to the body. It also controls several important functions of the body including pain management, alertness, arousal, breathing, blood pressure, digestion, heart rate, swallowing, walking, posture, stability and sensory and motor information integration.
Different PNS receptors have an integrative relationship between themselves and correlate to specific nervous stimulation and signals that can be sent through General Somatic Afferent (GSA) Pathways, Special Somatic Afferent (SSA) Pathways, General Visceral Afferent (GVA) Pathways, and Special Visceral Afferent (SVA) Pathways to the brainstem (Robertson and Biaggioni, 1995). These signals can be very specific and can help the brainstem reach homeostasis (equilibrium) and enhance the functions of the brainstem and the reticular nuclei, the monoaminergic and cholinergic nuclei as well as the parabrachial nucleus and periaqueductal gray.
It was recently discovered that when a somatosensory pattern of stimulation is applied to the metatarsal region of the foot then improved balance and movement coordination often occurred (Dahliwal, 2018). As a consequence the somatosensory pattern of stimulation was woven or molded into socks and worn on one’s feet to better facilitate the effects of the somatosensory stimulation of the metatarsal region of the bottom of the feet on the peripheral and central nervous system.
The purpose of this study was to explore the effects on the human electroencephalogram (EEG) when subjects place specially designed socks that provide tactile pattern pressure on the metatarsal region of the human foot.
4
Methods Subjects A total population of 60 subjects ranging in age from 14 to 83 years (Females = 36, Males = 24). EEG Recording The Wearable Sensing DSI-24 dry amplifier system was used to amplify and digitize the EEG recorded from 19 scalp electrodes according to the International 10/20 electrode locations. Approximately 2 to 5 minutes of EEG was recorded in the eyes closed condition and the eyes open condition with no socks on the subject’s feet. A second 2 to 5 minute recording in the eyes closed and eye open condition was recorded after placing the Voxx socks on each subject’s feet. Power Spectral Analyses
Each EEG record was visually examined and manual deselection of segments containing artifact of any type were deleted from the record. Split-half reliability and test re-test reliability measures of the artifact free data were computed using the Neuroguide software program (NeuroGuide, v2.9.9). Split-half reliability tests were conducted on the edited artifact free EEG segments and records with > 90% reliability were entered into the spectral analyses. A Fast Fourier transform (FFT) auto-spectral and cross-spectral analysis was computed on 2 second epochs thus yielding a 0.5 Hz frequency resolution over the frequency range from 0 to 50 Hz for each epoch. A 75% sliding window method was used to compute the FFT in which successive two-second epochs (i.e., 256 points) were overlapped by 500 millisecond steps (64 points) in order to minimize the effects of the FFT windowing procedure. Surface EEG Coherence The cross-spectrum was used to compute EEG coherence and phase differences in ten frequency bands: Delta (1 to 4.0 Hz), theta (4 - 8 Hz), alpha (8 - 12 Hz), beta broad (12 - 25 Hz), beta 1 (12 - 15 Hz), beta 2 (15 - 18 Hz), beta 3 (18 - 25 Hz) and hi-beta (25 - 30 Hz). Coherence is a measure of the consistency of the analytical phase differences over some interval of time and is equivalent to a squared correlation coefficient and is dependent on the number of degrees of freedom used to estimate the consistency of the phase differences. When the phase difference in successive epochs is constant then coherence = 1 and when phase differences are random then coherence = 0. Coherence is mathematically defined as:
, where is the cross-power spectral density and
and are the respective autopower spectral densities. The computational procedure
G2 xy f( ) =Gxy f( )( )2
Gxx f( )Gyy f( )( )Gxy f( ) Gxx f( )
Gyy f( )
5
to obtain coherence involved first computing the power spectra for x and y and then computing the cross-spectra. Since complex analyses are involved this produced the average cospectrum (‘r’ for real) and quadspectrum (‘q’ for imaginary). Then coherence was computed as:
LORETA Current Density
LORETA is a distributed EEG inverse solution where the currents at 3-
dimensional gray matter voxels J are a linear combination of the signal S recorded at a
scalp electrode:
Where T is a minimum norm 3-dimensional matrix of 2,394 gray matter voxels
with x, y and z coordinates in a generalized inverse that weights the solution to sources
that are synchronous in local volumes or regions using the 3-dimensional Laplacian
Operator (Pasqual-Marqui et al., 1994; Pasqual-Marqui, 1999). The T matrix is
mathematically defined as:
Where B is the discrete Laplacian Operator and W is a weighting matrix (inv indicates
inverse) and pinv(X) is the Moore-Penrouse pseudoinverse of X (Menke, 1984).
The Talairach Atlas coordinates of the Montreal Neurological Institute’s MRI
average of 305 brains (Lancaster et al, 2000; Pascual-Marqui, 1999) and the linkage to
standard anatomical 7mm x 7mm x 7 mm voxels each with a distinct Talairach Atlas
Coordinate. Groups of voxels are also defined by the clear anatomical landmarks
established by von Brodmann in 1909 and referred to as Brodmann areas. The resultant
[ ]åå +
=G
Nyyxx
Nxyxy
xy GG
qrf
2
2 )(
STJ •=
}')'({')}'({ KBWWBpinvKBWWBinvT =
6
current source vector at each voxel was computed as the square root of the sum of the
squares for the x, y and z source moments for each 0.5Hz frequency band. In order to
reduce the number of variables, adjacent frequency 0.5 Hz bins were averaged to produce
nine different frequency bands: delta (1-4 Hz); theta (4-7 Hz); alpha1 (8-10 Hz); alpha2
Absolute Power Surface EEG Table I are the percent difference between socks on vs socks off from the 19 scalp electrode locations for the ten frequency bands in the eyes closed condition. The differences ranged from 0.04 % difference at O1 in the alpha frequency band to 54.68 % in the delta frequency band in F7.
7
Table I - Percent difference in absolute power in the surface EEG in all frequency bands between socks on versus socks off in the eyes closed condition.
8
Table II shows the results of the paired t-tests in absolute EEG power between socks off vs socks on in the eyes closed condition. Statistically significant differences were primarily in the delta and theta frequency bands and especially in the left hemisphere in comparison to the right hemisphere.
9
Table II - Paired t-tests in absolute power in the surface EEG in all frequency bands between socks on versus socks off between socks on and socks off in the eyes closed condition.
Table III shows the percent difference between socks on vs socks off from the 19
scalp electrode locations for the ten frequency bands in the eyes closed condition. The differences ranged from 0.06 % difference at Cz in the beta frequency band to 62.26 % in the delta frequency band in P4.
10
Table III – Percent difference in absolute power in the surface EEG in all frequency bands between socks on versus socks off in the eyes open condition.
Table IV shows the results of the paired t-tests in absolute EEG power between
socks off vs socks on in the eyes open condition. Statistically significant differences (P < .05) were present bilaterally with increased power in the lower frequency bands. Statistically significant reduction in absolute power were present in the higher frequency bands in the right hemisphere.
11
Table IV- Paired t-tests in absolute power in the surface EEG in all frequency bands between socks on versus socks off in the eyes open condition.
Surface EEG Coherence Figure 1 shows then results of paired t-tests in the surface EEG coherence measures between socks off vs socks on in the eyes closed condition. Significant differences (P < .05) were present in widespread electrode pairs and in all frequency bands in both the left and right hemispheres. The socks on condition generally resulted in reduced coherence with the exception of the interhemispheric temporal lobes (T3-T4) in the delta frequency band.
12
Fig. 1- Paired t-tests in surface EEG coherence between socks off vs socks on in the eyes closed condition.
Figure 2 shows then results of paired t-tests in the surface EEG coherence measures between socks off vs socks on in the eyes closed condition. Significant differences (P < .05) were present in widespread electrode pairs and in all frequency bands in both the left and right hemispheres. The socks on condition consistently resulted in reduced coherence.
Fig. 2- Paired t-tests in surface EEG coherence between socks off vs socks on in the eyes open condition.
13
LORETA Current Density Table V shows the results of paired t-tests in LORETA current density in the eyes closed condition between socks off and socks on. The effects appeared to be widespread with statistically significant differences (P < .05) in 48 out of 86 Brodmann areas. There were more statistically significant differences in the left hemisphere Brodmann areas (36 out of 43) than the number of Brodmann areas with statistical significance in the right hemisphere (12 out of 43). The theta frequency band had more statistically significant differences than other frequency bands.
Table V – paired t-tests in LORETA current density between socks off vs socks on in the eyes closed condition.
Table VI shows the results of paired t-tests in LORETA current density in the
eyes open condition between socks off and socks on. The effects appeared to be widespread with statistically significant differences (P < .05) in 35 out of 86 Brodmann areas. There were more statistically significant differences in the left hemisphere
14
Brodmann areas (22 out of 43) than the number of Brodmann areas with statistical significance in the right hemisphere (13 out of 43). The theta frequency band had more statistically significant differences than other frequency bands.
Table VI – paired t-tests in LORETA current density between socks off vs socks on in the eyes open condition.
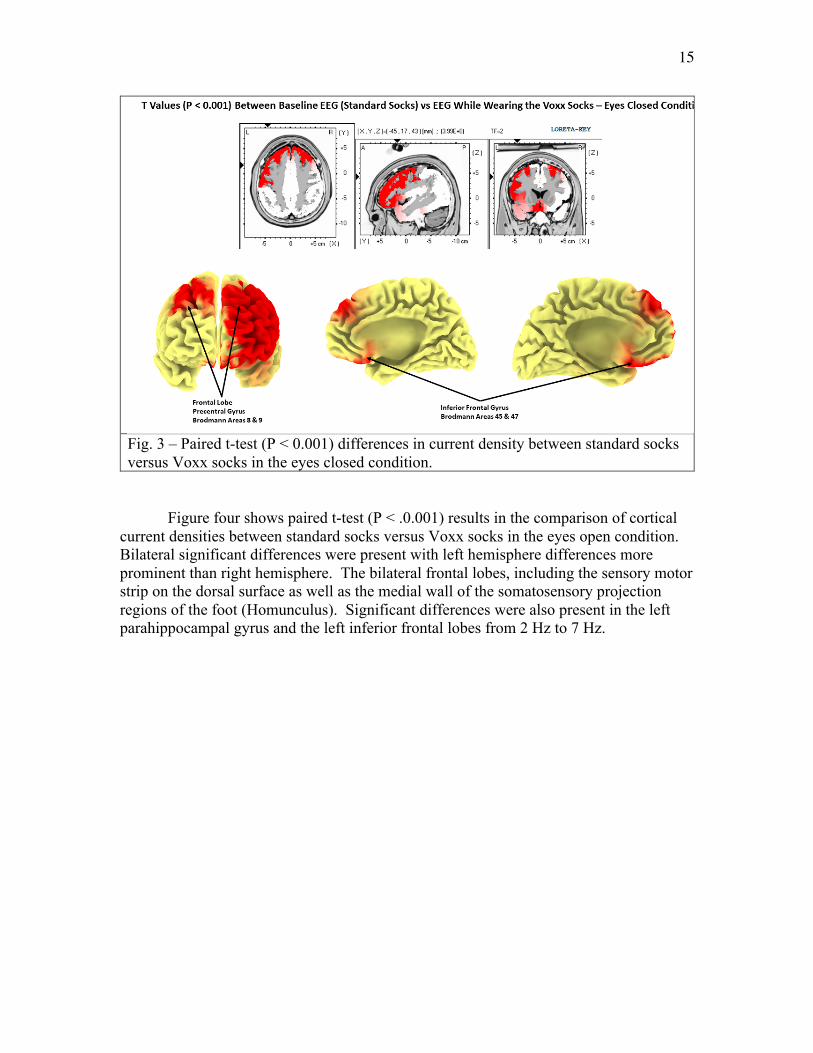
Figure three shows paired t-test (P < .0.001) results in the comparison of cortical current densities between standard socks versus Voxx socks in the eyes closed condition. Bilateral significant differences were present with left hemisphere differences more prominent than right hemisphere. The bilateral frontal lobes, including the sensory motor strip on the dorsal surface as well as the medial wall of the somatosensory projection regions of the foot (Homunculus) from 2 Hz to 7 Hz.
15
Fig. 3 – Paired t-test (P < 0.001) differences in current density between standard socks versus Voxx socks in the eyes closed condition.
Figure four shows paired t-test (P < .0.001) results in the comparison of cortical current densities between standard socks versus Voxx socks in the eyes open condition. Bilateral significant differences were present with left hemisphere differences more prominent than right hemisphere. The bilateral frontal lobes, including the sensory motor strip on the dorsal surface as well as the medial wall of the somatosensory projection regions of the foot (Homunculus). Significant differences were also present in the left parahippocampal gyrus and the left inferior frontal lobes from 2 Hz to 7 Hz.
16
Fig. 4– Paired t-test (P < 0.001) differences in current density between standard socks versus Voxx socks in the eyes closed condition.
Discussion
The results of this study showed that the EEG auto and cross-spectrum is effected when the Voxx socks are placed on a person’s feet as compared to a random sample of regularly worn socks. Fifty nine out of 60 subjects exhibited statistically significant changes in surface auto and cross-spectrum. Sixty out of sixty of the subjects exhibited statistically significant changes in the EEG source current density.
There was generally an increase in EEG absolute power in the delta and theta frequency bands, especially in the left hemisphere and a decrease in power in the higher frequency bands, especially in the right hemisphere with Voxx socks on vs Voxx socks off.
EEG coherence primarily decreased with Voxx socks on vs regular socks in all frequency bands and in both hemispheres. Decreased coherence indicates increased differentiation and increased complexity in brain networks.
Validation of the effects of the somatosensory foot stimulation on the central nervous system was further provided by the finding that LORETA current density consistently increased in the foot projection areas on the medial surface of the somatosensory cortex. Bilateral frontal lobe Brodmann areas exhibited the largest t-test differences (99.9%) in the lower frequency bands (e.g., delta and theta) and especially in left hemisphere Brodmann areas. The effects of Voxx socks on the electrical energies of the brain were evident especially in left frontal and left temporal, left anterior cingulate and left parahippocampal gyrus.
The exact mechanisms of action of the Voxx sock foot pattern on the somatosensory system are currently unknown. At least three hypotheses are: 1- The
17
process of changing socks effects the EEG spectrum, 2- Dishabituation occurs because of the novelty of a sequence of edges that stimulate the foot and, 3- Both hypotheses 1 and 2 contributed to the EEG changes. Future studies are planned to control for the order of sock changes to partition the variance attributable to these two hypotheses.
References Dahliwal, J. (2018). VoxxLife, Inc., Toronto, Canada. Hubbard, J.J. (1974) (Ed.). The Peripheral Nervous System. Plenum Press, New York. Robertson, D. and Biaggioni, I. (eds). (1995). Disorders of the autonomic system. Australia: Harwood Academic, 1995.