American Journal of Electrical Power and Energy Systems 2017; 6(6): 94-112 http://www.sciencepublishinggroup.com/j/epes doi: 10.11648/j.epes.20170606.13 ISSN: 2326-912X (Print); ISSN: 2326-9200 (Online) Effects of Toshka Pumping Station Operations on Power Quality and Stability of Electrical Grid Khaled Mohamed Kotb Fetyan Mechanical and Electrical Research Institute, National Water Research Centre, Ministry of Water Resources and Irrigation, Cairo, Egypt Email address: [email protected]To cite this article: Khaled Mohamed Kotb Fetyan. Effects of Toshka Pumping Station Operations on Power Quality and Stability of Electrical Grid. American Journal of Electrical Power and Energy Systems. Vol. 6, No. 6, 2017, pp. 94-112. doi: 10.11648/j.epes.20170606.13 Received: August 13, 2017; Accepted: August 29, 2017; Published: November 21, 2017 Abstract: Toshka is a large water pumping stations in Egypt. This station contains 21 units (18+3 Extentions) each 12MW. At a full capacity the full power consumptions can reach 200MW. The electrical feeding system for the stations contains; transformer, substations and Overhead transmission line (its long 300km), so the operations of the stations causes some problem for the electrical grid due to large value of power consumptions. In this paper, some problems were studied during the operations of the station. Effect of starting time on the station running and current consuming were studied. Also the effect of water level variations on the suctions side in Nasser Lake, speed changing, and power quality of the grid on the power consumptions. It was focused on the voltage and current variations, and the flicker occurred during the station operation. Finally the effects of number of harmonic filters used depending on the power rating of the unit, and effective short circuit ratio (ESCR) values on the stability of the electrical grid during the full load operations. The analyses of the results are obtained from actual measurement on the stations using modern power quality analyzers during different cases of operation are explained. This study is more useful for studying the problem occurred on the electrical grid during running of Toshka Stations, as it’s a large station in Egypt and has special design, at different cases and conditions of operation. Keywords: Pumping Stations, Power Quality, Electrical Grid Stability, Harmonic Contents 1. Introduction A Toshka pump station is installed to lift water for 500,000 Fadden’s of desert into farmland, and establishing three million persons as permanent residents in that area [1, 2]. Toshka pump station contains 21 units (18 +3 extensions) each one rated power about 12MW. Figure 1 and Table 1 show the specifications and external view of the motor pump unit contents. The pump type is a submersible pump of rating flow rate 16.7 m 3 /s and the maximum Head is about 57m depends on the water level on Nasser Lake (source of water for the stations). The unit uses a synchronous motor of rated is 12 MW to drive the pump unit on variable speed operations. The motor uses Load Commutated Inverter (LCI) to control the motor speed which uses to control the pump flow rate according to the water level in Nasser Lake. Figure 1. Pump unit contents and specifications of Toshka pumping stations.
Transcript
American Journal of Electrical Power and Energy Systems 2017; 6(6): 94-112 http://www.sciencepublishinggroup.com/j/epes doi: 10.11648/j.epes.20170606.13 ISSN: 2326-912X (Print); ISSN: 2326-9200 (Online)
Effects of Toshka Pumping Station Operations on Power Quality and Stability of Electrical Grid
Khaled Mohamed Kotb Fetyan
Mechanical and Electrical Research Institute, National Water Research Centre, Ministry of Water Resources and Irrigation, Cairo, Egypt
To cite this article: Khaled Mohamed Kotb Fetyan. Effects of Toshka Pumping Station Operations on Power Quality and Stability of Electrical Grid. American
Journal of Electrical Power and Energy Systems. Vol. 6, No. 6, 2017, pp. 94-112. doi: 10.11648/j.epes.20170606.13
Received: August 13, 2017; Accepted: August 29, 2017; Published: November 21, 2017
Abstract: Toshka is a large water pumping stations in Egypt. This station contains 21 units (18+3 Extentions) each 12MW. At a full capacity the full power consumptions can reach 200MW. The electrical feeding system for the stations contains; transformer, substations and Overhead transmission line (its long 300km), so the operations of the stations causes some problem for the electrical grid due to large value of power consumptions. In this paper, some problems were studied during the operations of the station. Effect of starting time on the station running and current consuming were studied. Also the effect of water level variations on the suctions side in Nasser Lake, speed changing, and power quality of the grid on the power consumptions. It was focused on the voltage and current variations, and the flicker occurred during the station operation. Finally the effects of number of harmonic filters used depending on the power rating of the unit, and effective short circuit ratio (ESCR) values on the stability of the electrical grid during the full load operations. The analyses of the results are obtained from actual measurement on the stations using modern power quality analyzers during different cases of operation are explained. This study is more useful for studying the problem occurred on the electrical grid during running of Toshka Stations, as it’s a large station in Egypt and has special design, at different cases and conditions of operation.
Keywords: Pumping Stations, Power Quality, Electrical Grid Stability, Harmonic Contents
1. Introduction
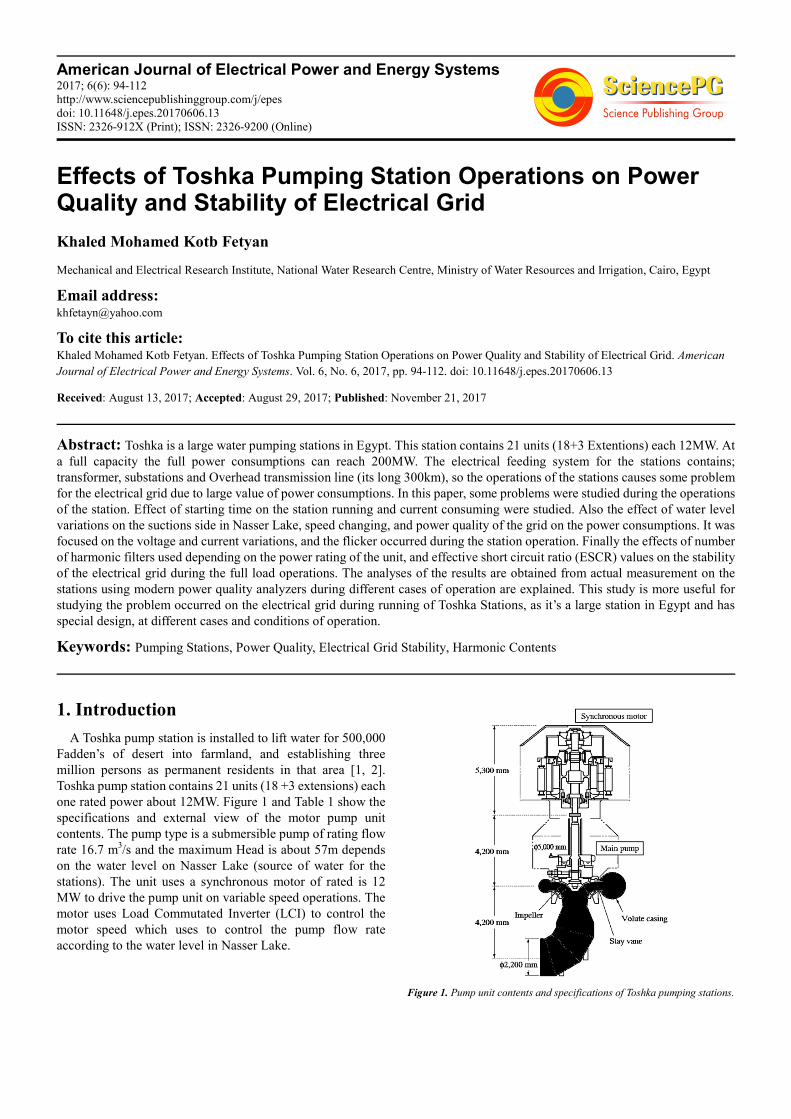
A Toshka pump station is installed to lift water for 500,000 Fadden’s of desert into farmland, and establishing three million persons as permanent residents in that area [1, 2]. Toshka pump station contains 21 units (18 +3 extensions) each one rated power about 12MW. Figure 1 and Table 1 show the specifications and external view of the motor pump unit contents. The pump type is a submersible pump of rating flow rate 16.7 m3/s and the maximum Head is about 57m depends on the water level on Nasser Lake (source of water for the stations). The unit uses a synchronous motor of rated is 12 MW to drive the pump unit on variable speed operations. The motor uses Load Commutated Inverter (LCI) to control the motor speed which uses to control the pump flow rate according to the water level in Nasser Lake.
Figure 1. Pump unit contents and specifications of Toshka pumping stations.
American Journal of Electrical Power and Energy Systems 2017; 6(6): 94-112 95
Table 1. Motor and pump specifications.
Discharge 16.7 m3/s Total head 57.1 m Speed 210 – 300 min-1 Drive motor 12,000-kW Number of units 21 (18+3 Extenions) Rated power 12,000 kW Rated voltage 2,950 V Rated current 1,369 A ´ 2 power factor 0.88 (leading) Frequency 35 – 50 Hz Number of poles 20
1.1. Motor Drive System of Toshka Pumping Stations
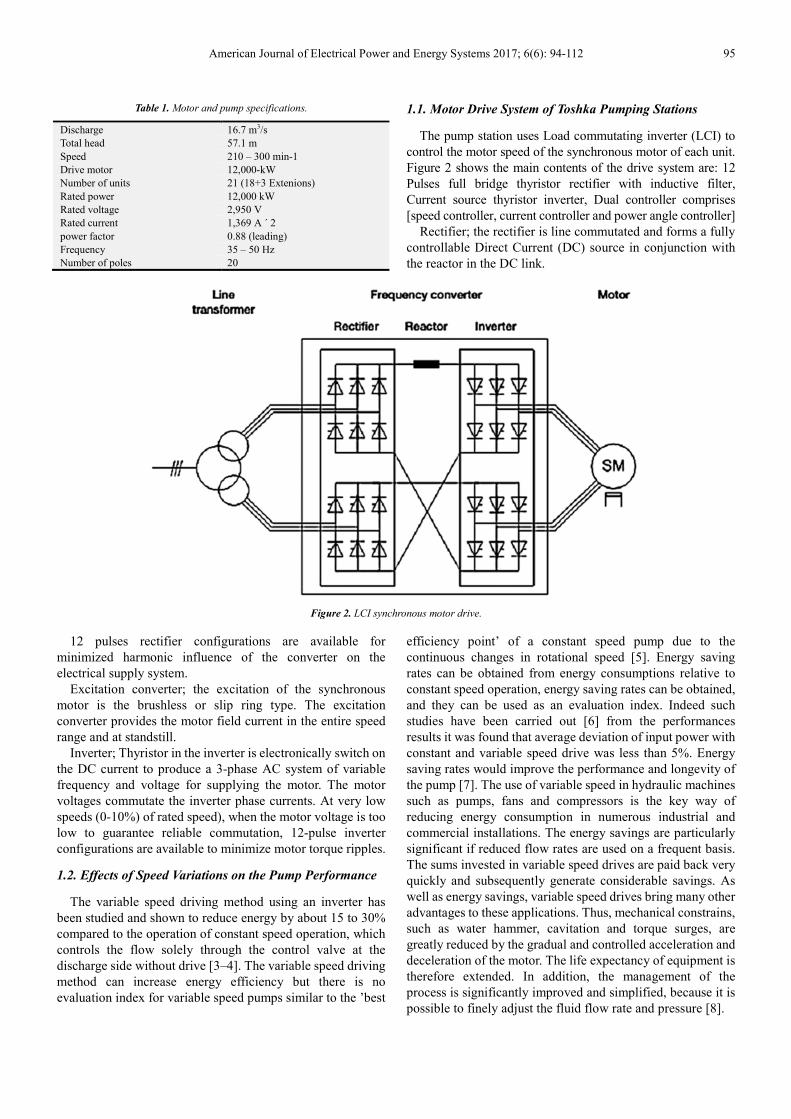
The pump station uses Load commutating inverter (LCI) to control the motor speed of the synchronous motor of each unit. Figure 2 shows the main contents of the drive system are: 12 Pulses full bridge thyristor rectifier with inductive filter, Current source thyristor inverter, Dual controller comprises [speed controller, current controller and power angle controller]
Rectifier; the rectifier is line commutated and forms a fully controllable Direct Current (DC) source in conjunction with the reactor in the DC link.
Figure 2. LCI synchronous motor drive.
12 pulses rectifier configurations are available for minimized harmonic influence of the converter on the electrical supply system.
Excitation converter; the excitation of the synchronous motor is the brushless or slip ring type. The excitation converter provides the motor field current in the entire speed range and at standstill.
Inverter; Thyristor in the inverter is electronically switch on the DC current to produce a 3-phase AC system of variable frequency and voltage for supplying the motor. The motor voltages commutate the inverter phase currents. At very low speeds (0-10%) of rated speed), when the motor voltage is too low to guarantee reliable commutation, 12-pulse inverter configurations are available to minimize motor torque ripples.
1.2. Effects of Speed Variations on the Pump Performance
The variable speed driving method using an inverter has been studied and shown to reduce energy by about 15 to 30% compared to the operation of constant speed operation, which controls the flow solely through the control valve at the discharge side without drive [3–4]. The variable speed driving method can increase energy efficiency but there is no evaluation index for variable speed pumps similar to the ’best
efficiency point’ of a constant speed pump due to the continuous changes in rotational speed [5]. Energy saving rates can be obtained from energy consumptions relative to constant speed operation, energy saving rates can be obtained, and they can be used as an evaluation index. Indeed such studies have been carried out [6] from the performances results it was found that average deviation of input power with constant and variable speed drive was less than 5%. Energy saving rates would improve the performance and longevity of the pump [7]. The use of variable speed in hydraulic machines such as pumps, fans and compressors is the key way of reducing energy consumption in numerous industrial and commercial installations. The energy savings are particularly significant if reduced flow rates are used on a frequent basis. The sums invested in variable speed drives are paid back very quickly and subsequently generate considerable savings. As well as energy savings, variable speed drives bring many other advantages to these applications. Thus, mechanical constrains, such as water hammer, cavitation and torque surges, are greatly reduced by the gradual and controlled acceleration and deceleration of the motor. The life expectancy of equipment is therefore extended. In addition, the management of the process is significantly improved and simplified, because it is possible to finely adjust the fluid flow rate and pressure [8].
96 Khaled Mohamed Kotb Fetyan: Effects of Toshka Pumping Station Operations on Power Quality and Stability of Electrical Grid
1.3. Stability of Toshka Electrical Feeding Systems
The operations of the stations in the first run only 16 units could be run and it cannot run the 18 units together this is due to voltage decreases with increasing of no of pump units due to longest transmissions lines [9]. The number of harmonic filters causes some problem for electrical grid. Such as; the total harmonic distortions is increases due to decreases no of harmonic filters but the grid can run the 18 units of the stations with no problems. Also it causes unstable operation for the grid [10]. Toshka pump station feeds from the electrical grid of Egypt network. The stations use rectifiers to convert the AC voltage to DC voltage to be uses in the LCI inverter so the system contains AC and DC voltage. There are some technical aspects related to multi converter AC/DC systems that are caused by the interaction between converters and can ultimately influence the overall performance of the integrated AC/DC systems. An important factor to study performance of the grid is the short-circuit ratio (SCR), and effective SCR (ESCR) concept. [11-13]. For multi-infeed HVDC systems, some factors describing the interaction between inverters, such as multi infeed interaction factor, are proposed, and then the SCR and ESCR concept applicable to single-infeed HVDC systems is extended to multi-infeed systems based on these interaction factors [14, 15]. The short-circuit ratio (SCR) is widely used in the planning process of DC transmissions to evaluate the capability of the AC system in maintaining the stability of the AC/DC system. The effectiveness of SCR in
determining the voltage stability and dynamic over-voltage of a single DC infeed system is analyzed in reference [16, 17].
2. Diagnosis System and Measurement
Strategy
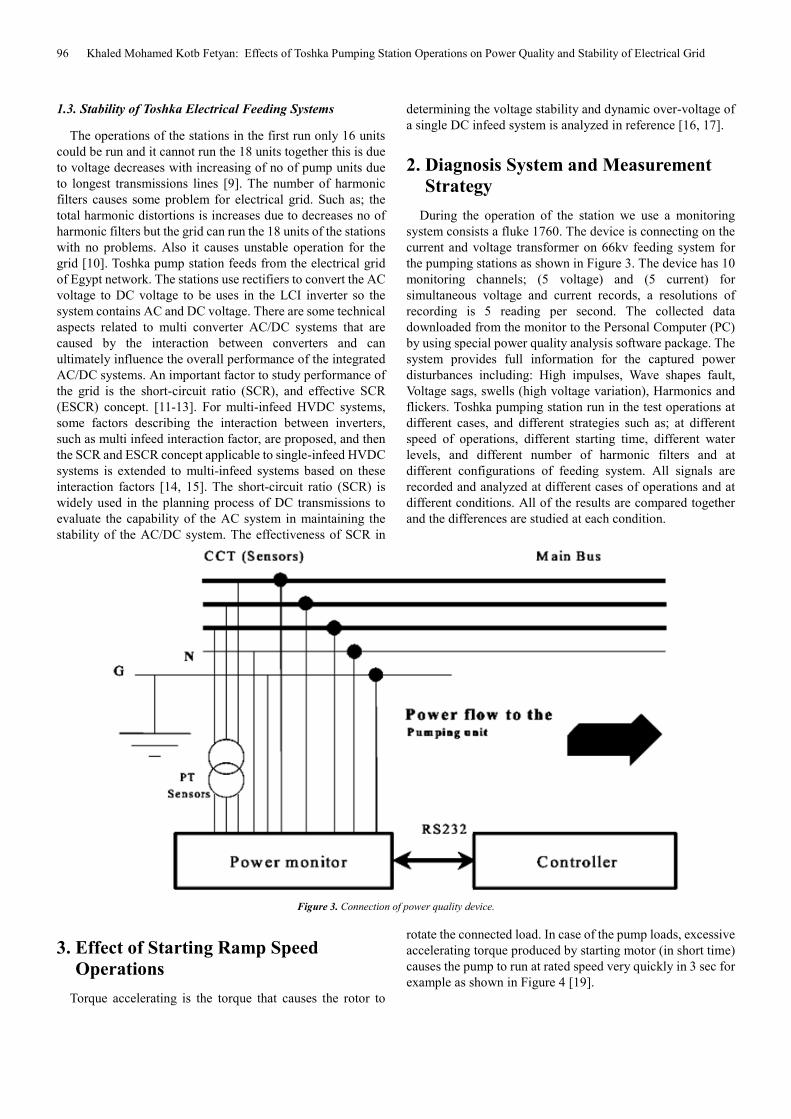
During the operation of the station we use a monitoring system consists a fluke 1760. The device is connecting on the current and voltage transformer on 66kv feeding system for the pumping stations as shown in Figure 3. The device has 10 monitoring channels; (5 voltage) and (5 current) for simultaneous voltage and current records, a resolutions of recording is 5 reading per second. The collected data downloaded from the monitor to the Personal Computer (PC) by using special power quality analysis software package. The system provides full information for the captured power disturbances including: High impulses, Wave shapes fault, Voltage sags, swells (high voltage variation), Harmonics and flickers. Toshka pumping station run in the test operations at different cases, and different strategies such as; at different speed of operations, different starting time, different water levels, and different number of harmonic filters and at different configurations of feeding system. All signals are recorded and analyzed at different cases of operations and at different conditions. All of the results are compared together and the differences are studied at each condition.
Figure 3. Connection of power quality device.
3. Effect of Starting Ramp Speed
Operations
Torque accelerating is the torque that causes the rotor to
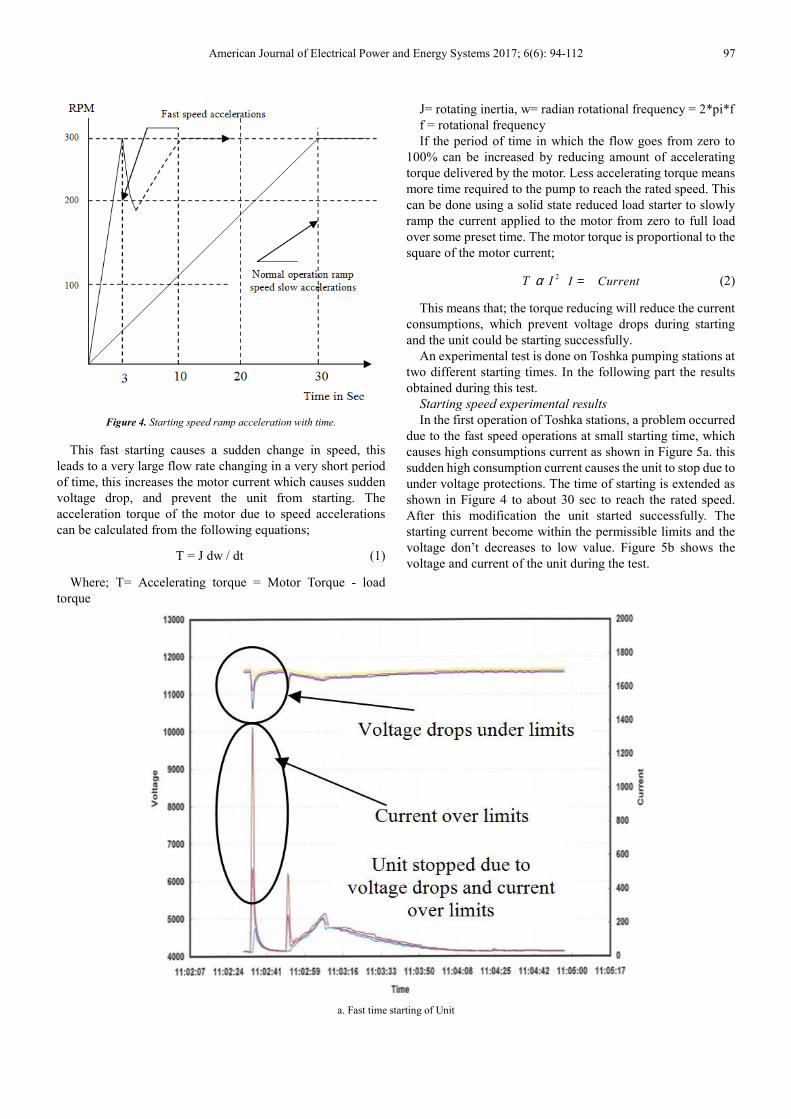
rotate the connected load. In case of the pump loads, excessive accelerating torque produced by starting motor (in short time) causes the pump to run at rated speed very quickly in 3 sec for example as shown in Figure 4 [19].
American Journal of Electrical Power and Energy Systems 2017; 6(6): 94-112 97
Figure 4. Starting speed ramp acceleration with time.
This fast starting causes a sudden change in speed, this leads to a very large flow rate changing in a very short period of time, this increases the motor current which causes sudden voltage drop, and prevent the unit from starting. The acceleration torque of the motor due to speed accelerations can be calculated from the following equations;
T = J dw / dt (1)
Where; T= Accelerating torque = Motor Torque - load torque
J= rotating inertia, w= radian rotational frequency = 2*pi*f f = rotational frequency If the period of time in which the flow goes from zero to
100% can be increased by reducing amount of accelerating torque delivered by the motor. Less accelerating torque means more time required to the pump to reach the rated speed. This can be done using a solid state reduced load starter to slowly ramp the current applied to the motor from zero to full load over some preset time. The motor torque is proportional to the square of the motor current;
2 T Iα I Current= (2)
This means that; the torque reducing will reduce the current consumptions, which prevent voltage drops during starting and the unit could be starting successfully.
An experimental test is done on Toshka pumping stations at two different starting times. In the following part the results obtained during this test.
Starting speed experimental results
In the first operation of Toshka stations, a problem occurred due to the fast speed operations at small starting time, which causes high consumptions current as shown in Figure 5a. this sudden high consumption current causes the unit to stop due to under voltage protections. The time of starting is extended as shown in Figure 4 to about 30 sec to reach the rated speed. After this modification the unit started successfully. The starting current become within the permissible limits and the voltage don’t decreases to low value. Figure 5b shows the voltage and current of the unit during the test.
a. Fast time starting of Unit
98 Khaled Mohamed Kotb Fetyan: Effects of Toshka Pumping Station Operations on Power Quality and Stability of Electrical Grid
b. slow time starting of unit
Figure 5. Effect of fast torque and speed operations during first starting of the unit.
4. Effects of Speed and Water Level
Variations on the Stations Performance
Toshka water pumping station is installed on Nasser Lake so the water level variations occur on the Nasser Lake needed the pump unit speed to be changing by the LCI control speed unit. Figure 6 shows water level variation of Nasser Lake during the period [1970-2006] [2].
The figure shows that during some years, the water level decreases to reach about 158m in case of little water coming from River Nile sources. In another year the water level increases to reach more than 180m due to more water comes from River Nile sources. During this water level changing, the unit speed is changing to maintain the water flow rate values nearly constant to maintain the water requirement nearly constant which is very important for the irrigations mechanism, and crops type.
Figure 6. Water level variations in Nasser Lake.
4.1. Pump Speed Calculations Due to Water Level Changing
The head discharge relationships for the pump and pipeline are described as follow;
For the pump, head delivered (Hp) at discharge (Q) is expressed by;
2pH AQ BQ C= + + (3)
and for the pipeline, the head required (Hs) to produce a discharge Q is given by;
2s sT mH H K Q= + (4)
Where; A, B, C, Km are constants, and Hst: static water level. The relations between the pump flow rate, the pump head,
and pump torque in case of variable speed operation are known as affinity laws. The relations between the pump speed and pump flow arte and pump torque at two operating speeds (N1, N2) are;
2 2
1 1
Q N
Q N= &
22 2
1 1
()
H N
H N= &
22 2
1 1
()
T N
T N= (5)
Where; N = Pump Speed, T = Pump Torque The plotting (H – Q) curves of Eq. (3) at different speeds is
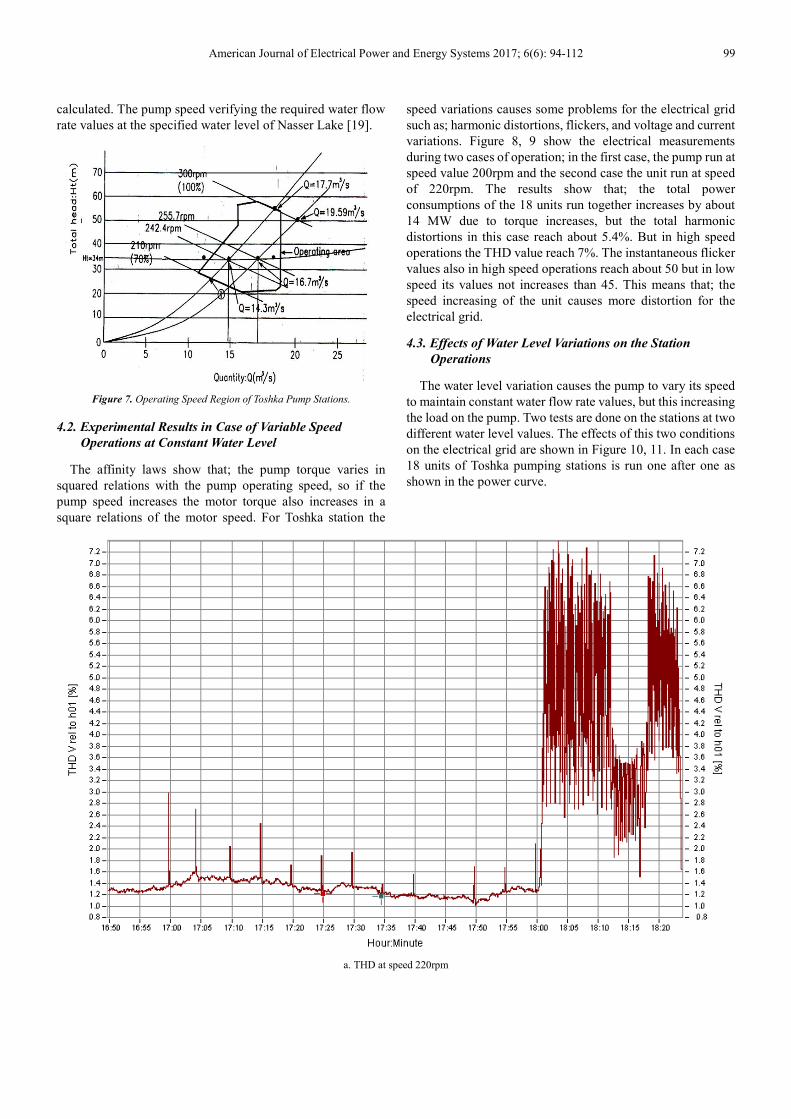
called the pump performance curves, and Eq.(4) describes the system curve, which depends on the static water level in suctions side and total head of the pipe line in suction and delivery sides of the pump. Figure 7 shows the operation range of Toshka pumping stations depends on the water level in Nasser Lake, and the water flow rate requirements. Also the (Q-H) curves at different speeds are plotted. To determine the pump speed, it’s required to know the static water level in the Nasser Lake, and the required water flow rate value. By selecting number of pumps to be run, the above equations (3, 4 and 5) can be solved together and the pump speed is
American Journal of Electrical Power and Energy Systems 2017; 6(6): 94-112 99
calculated. The pump speed verifying the required water flow rate values at the specified water level of Nasser Lake [19].
Figure 7. Operating Speed Region of Toshka Pump Stations.
4.2. Experimental Results in Case of Variable Speed
Operations at Constant Water Level
The affinity laws show that; the pump torque varies in squared relations with the pump operating speed, so if the pump speed increases the motor torque also increases in a square relations of the motor speed. For Toshka station the
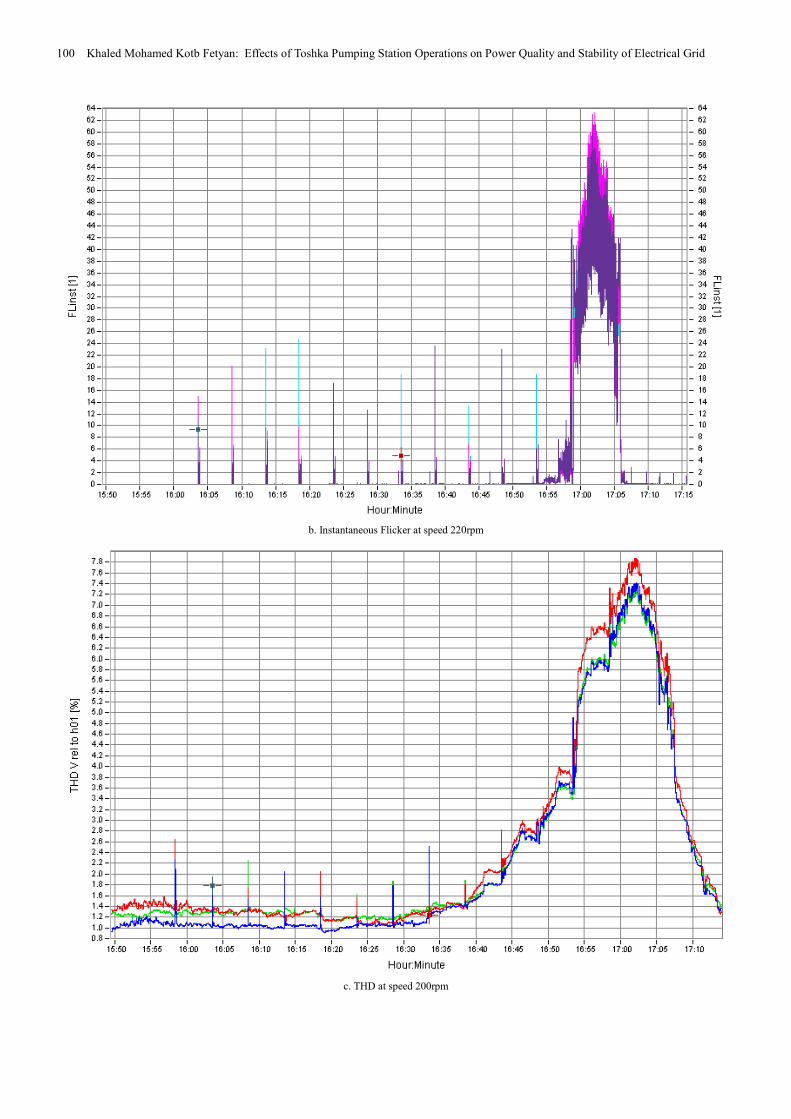
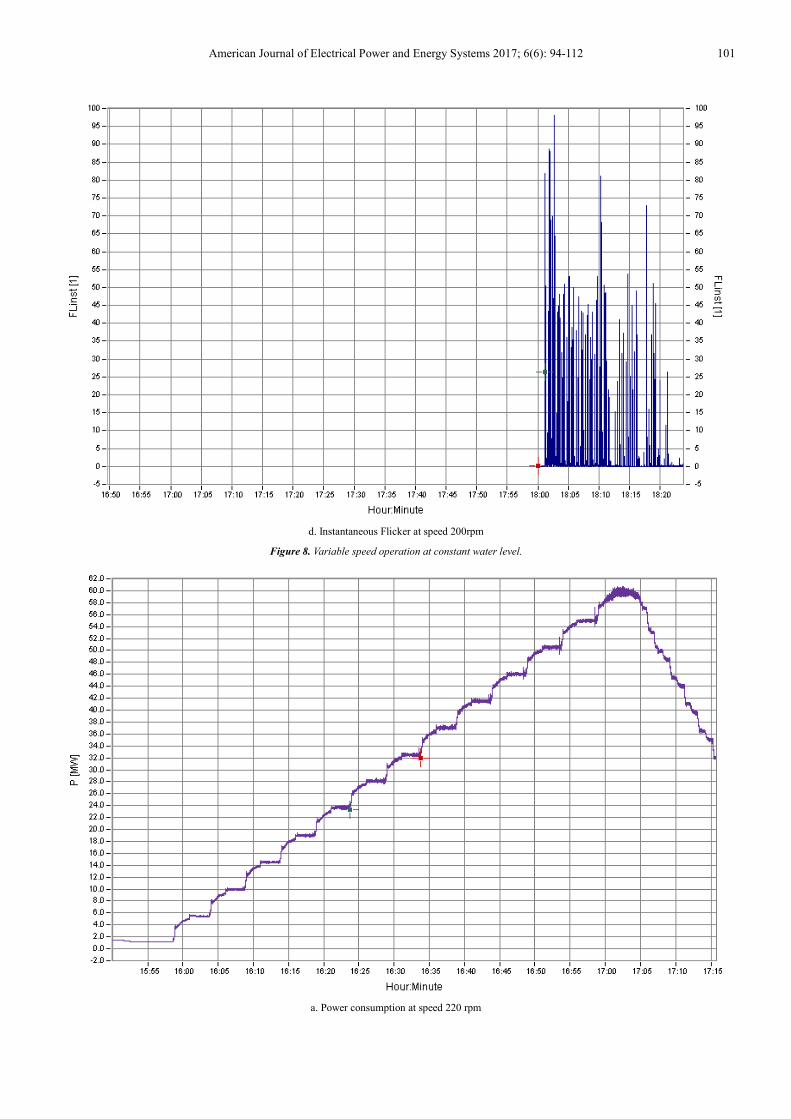
speed variations causes some problems for the electrical grid such as; harmonic distortions, flickers, and voltage and current variations. Figure 8, 9 show the electrical measurements during two cases of operation; in the first case, the pump run at speed value 200rpm and the second case the unit run at speed of 220rpm. The results show that; the total power consumptions of the 18 units run together increases by about 14 MW due to torque increases, but the total harmonic distortions in this case reach about 5.4%. But in high speed operations the THD value reach 7%. The instantaneous flicker values also in high speed operations reach about 50 but in low speed its values not increases than 45. This means that; the speed increasing of the unit causes more distortion for the electrical grid.
4.3. Effects of Water Level Variations on the Station
Operations
The water level variation causes the pump to vary its speed to maintain constant water flow rate values, but this increasing the load on the pump. Two tests are done on the stations at two different water level values. The effects of this two conditions on the electrical grid are shown in Figure 10, 11. In each case 18 units of Toshka pumping stations is run one after one as shown in the power curve.
a. THD at speed 220rpm
100 Khaled Mohamed Kotb Fetyan: Effects of Toshka Pumping Station Operations on Power Quality and Stability of Electrical Grid
b. Instantaneous Flicker at speed 220rpm
c. THD at speed 200rpm
American Journal of Electrical Power and Energy Systems 2017; 6(6): 94-112 101
d. Instantaneous Flicker at speed 200rpm
Figure 8. Variable speed operation at constant water level.
a. Power consumption at speed 220 rpm
102 Khaled Mohamed Kotb Fetyan: Effects of Toshka Pumping Station Operations on Power Quality and Stability of Electrical Grid
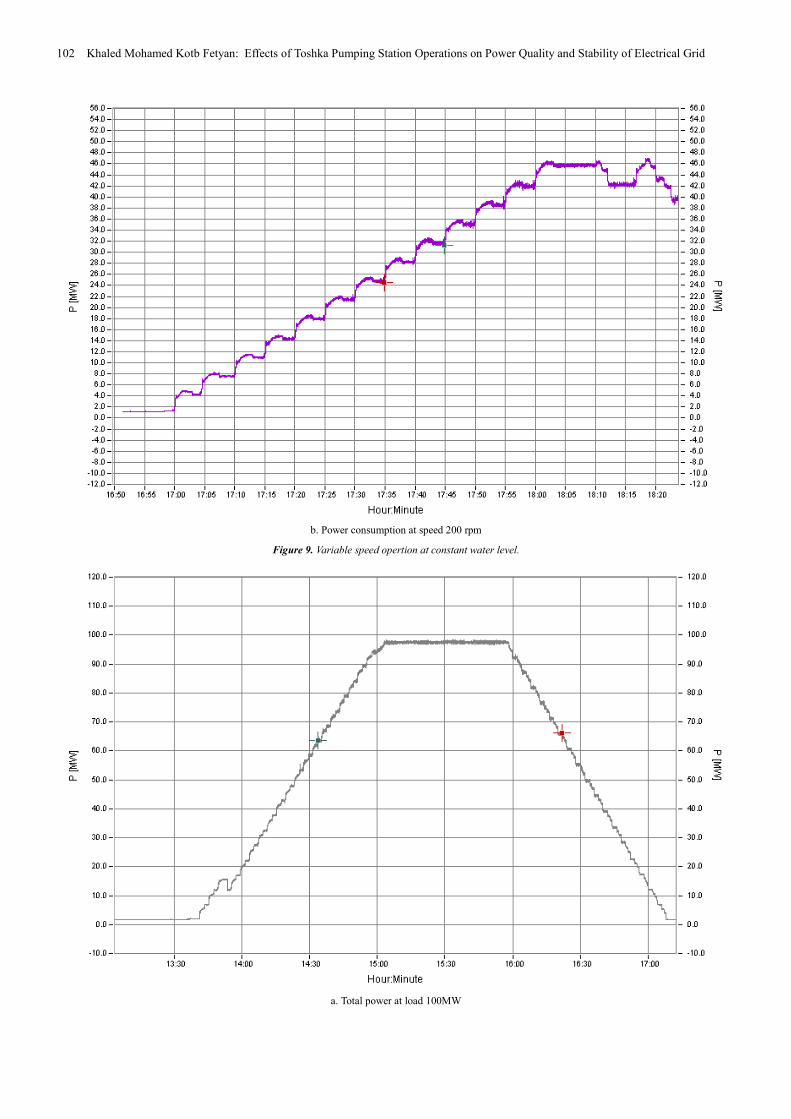
b. Power consumption at speed 200 rpm
Figure 9. Variable speed opertion at constant water level.
a. Total power at load 100MW
American Journal of Electrical Power and Energy Systems 2017; 6(6): 94-112 103
b. Total power at load 83MW
Figure 10. Effect of water level variation on the stations performance.
a. THD% at load 100MW
104 Khaled Mohamed Kotb Fetyan: Effects of Toshka Pumping Station Operations on Power Quality and Stability of Electrical Grid
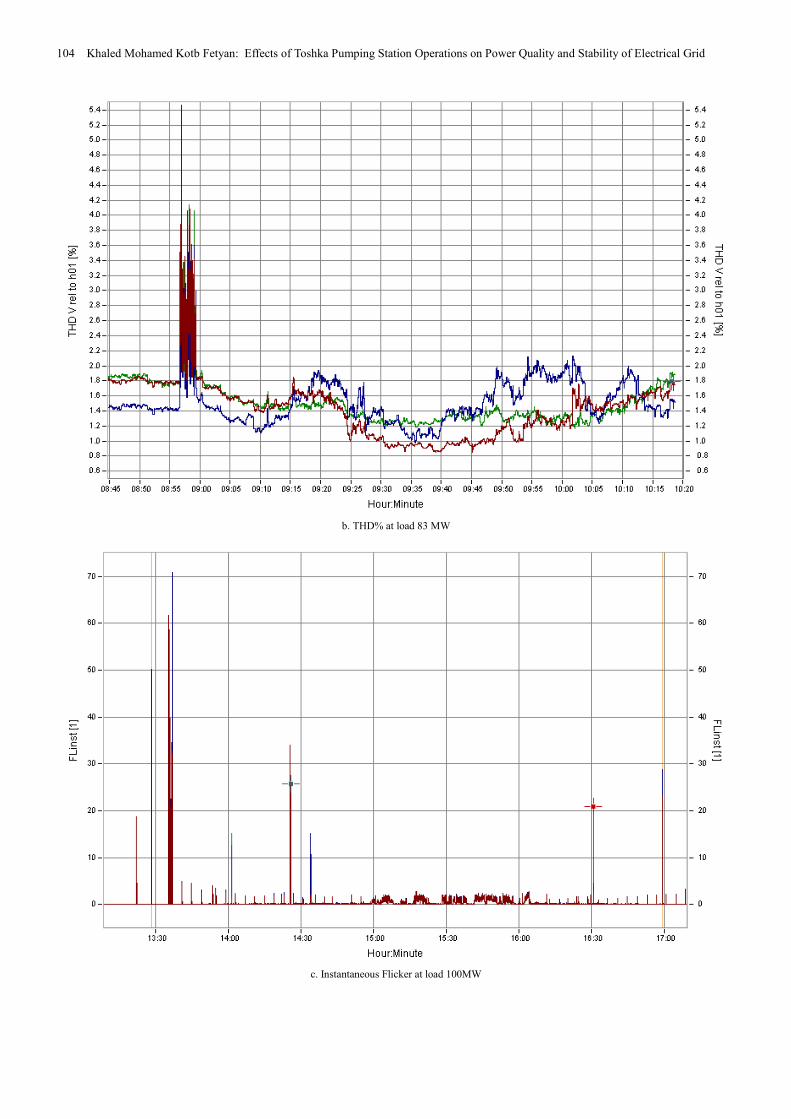
b. THD% at load 83 MW
c. Instantaneous Flicker at load 100MW
American Journal of Electrical Power and Energy Systems 2017; 6(6): 94-112 105
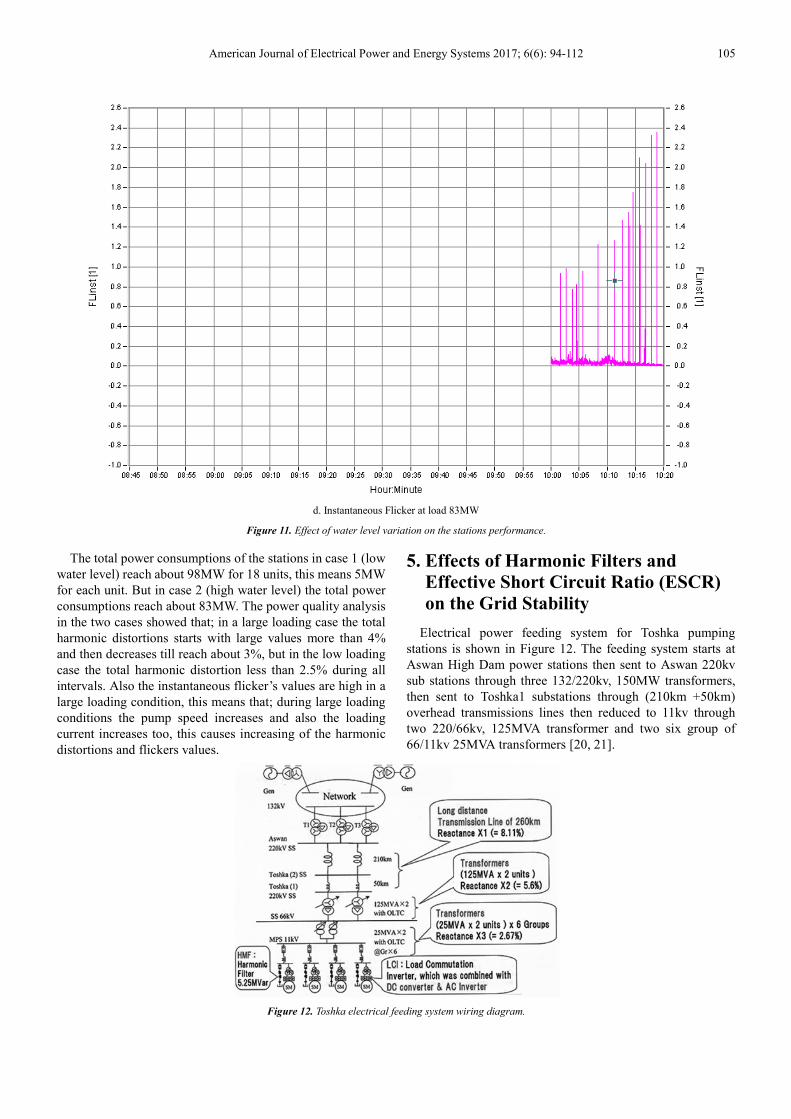
d. Instantaneous Flicker at load 83MW
Figure 11. Effect of water level variation on the stations performance.
The total power consumptions of the stations in case 1 (low water level) reach about 98MW for 18 units, this means 5MW for each unit. But in case 2 (high water level) the total power consumptions reach about 83MW. The power quality analysis in the two cases showed that; in a large loading case the total harmonic distortions starts with large values more than 4% and then decreases till reach about 3%, but in the low loading case the total harmonic distortion less than 2.5% during all intervals. Also the instantaneous flicker’s values are high in a large loading condition, this means that; during large loading conditions the pump speed increases and also the loading current increases too, this causes increasing of the harmonic distortions and flickers values.
5. Effects of Harmonic Filters and
Effective Short Circuit Ratio (ESCR)
on the Grid Stability
Electrical power feeding system for Toshka pumping stations is shown in Figure 12. The feeding system starts at Aswan High Dam power stations then sent to Aswan 220kv sub stations through three 132/220kv, 150MW transformers, then sent to Toshka1 substations through (210km +50km) overhead transmissions lines then reduced to 11kv through two 220/66kv, 125MVA transformer and two six group of 66/11kv 25MVA transformers [20, 21].
Figure 12. Toshka electrical feeding system wiring diagram.
106 Khaled Mohamed Kotb Fetyan: Effects of Toshka Pumping Station Operations on Power Quality and Stability of Electrical Grid
By using the above system configurations, The Effective short-circuit Ratio (ESCR) in high voltage DC system (HVDC) can be calculated by using the following formula [21];
Where; N is the Number of operating Pumps, Pdc DC power Qhmf is Reactive Capacity of HMF According to the standers; the strength of the AC network in
case of HVDC substations depends on the ESCR. The connections of capacitors and filters decreases the values of ESCR. The value of ESCR represents the strength of the network [15-18] as follow; strong systems if ESCR more than 3; medium strength if ESCR between 2 and 3 and weak
systems if ESCR less than 2.
5.1. Relations between ESCR Value and P - V Characteristic
According to the wiring diagram of the electrical feeding system to Toshka pump shown in Figure 11, the ESCR is calculated depends on number of harmonic filters use in the stations as shown in table 2.
Table 2. ESCR calculations depends on power circuit contents.
Power Transformers Aswan S. S Power Transformers Toshka stations Short Circuit Power ESCR 18 units Stat of HMF use
500 321 150 125 25
1 1 3 2 12 491 1.89 With 3rd HMF With 18 units HMF
1 1 3 2 12 491 2.04 Without 3rd HMF With 11 units HMF
Figure 13. Power voltage chart due to ESCR variations.
The power voltage curve (P-V) show that in case of lower ESCR (1.94) the staple operation area depends on the voltage decreasing, the power capability of the network can be 70MW
only but if the ESCR increases (more than 2.6) the power capability reach about 100MW during stable area operations as shown in Figure 13 [21].
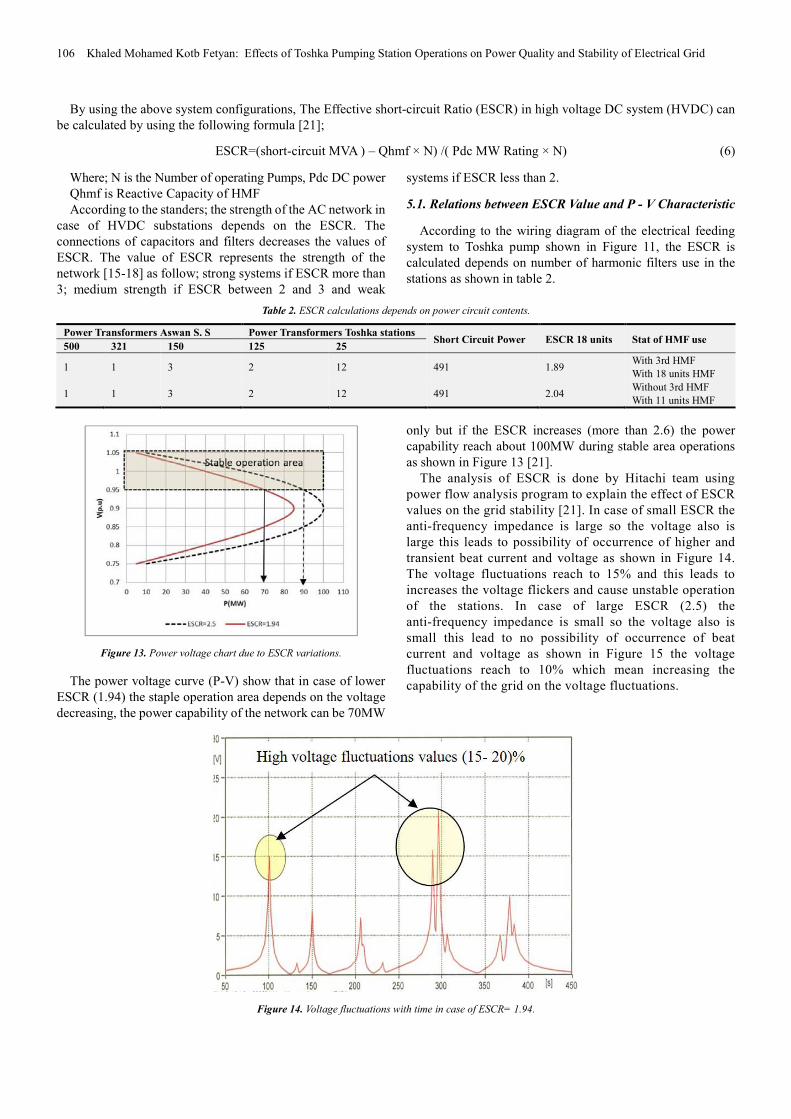
The analysis of ESCR is done by Hitachi team using power flow analysis program to explain the effect of ESCR values on the grid stability [21]. In case of small ESCR the anti-frequency impedance is large so the voltage also is large this leads to possibility of occurrence of higher and transient beat current and voltage as shown in Figure 14. The voltage fluctuations reach to 15% and this leads to increases the voltage flickers and cause unstable operation of the stations. In case of large ESCR (2.5) the anti-frequency impedance is small so the voltage also is small this lead to no possibility of occurrence of beat current and voltage as shown in Figure 15 the voltage fluctuations reach to 10% which mean increasing the capability of the grid on the voltage fluctuations.
Figure 14. Voltage fluctuations with time in case of ESCR= 1.94.
American Journal of Electrical Power and Energy Systems 2017; 6(6): 94-112 107
Figure 15. Voltage fluctuations with time in case of ESCR= 2.55.
5.2. Experimental Results of ESCR and Harmonic Filters on
Grid Stability
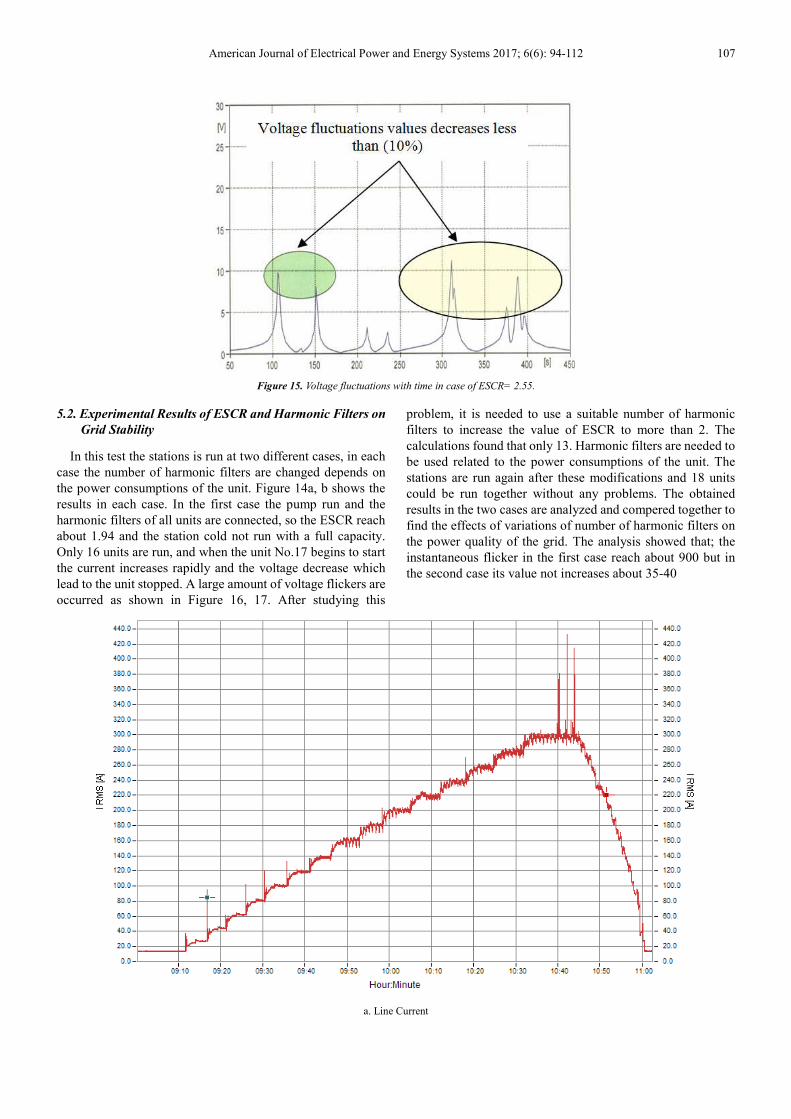
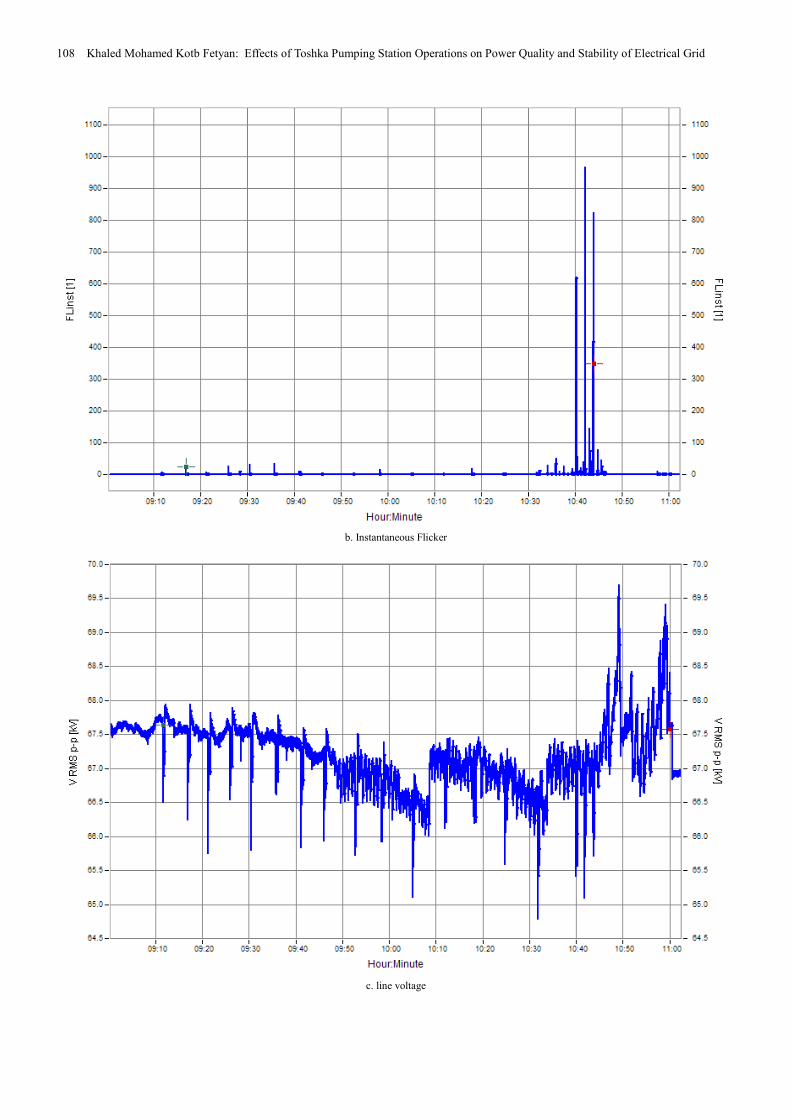
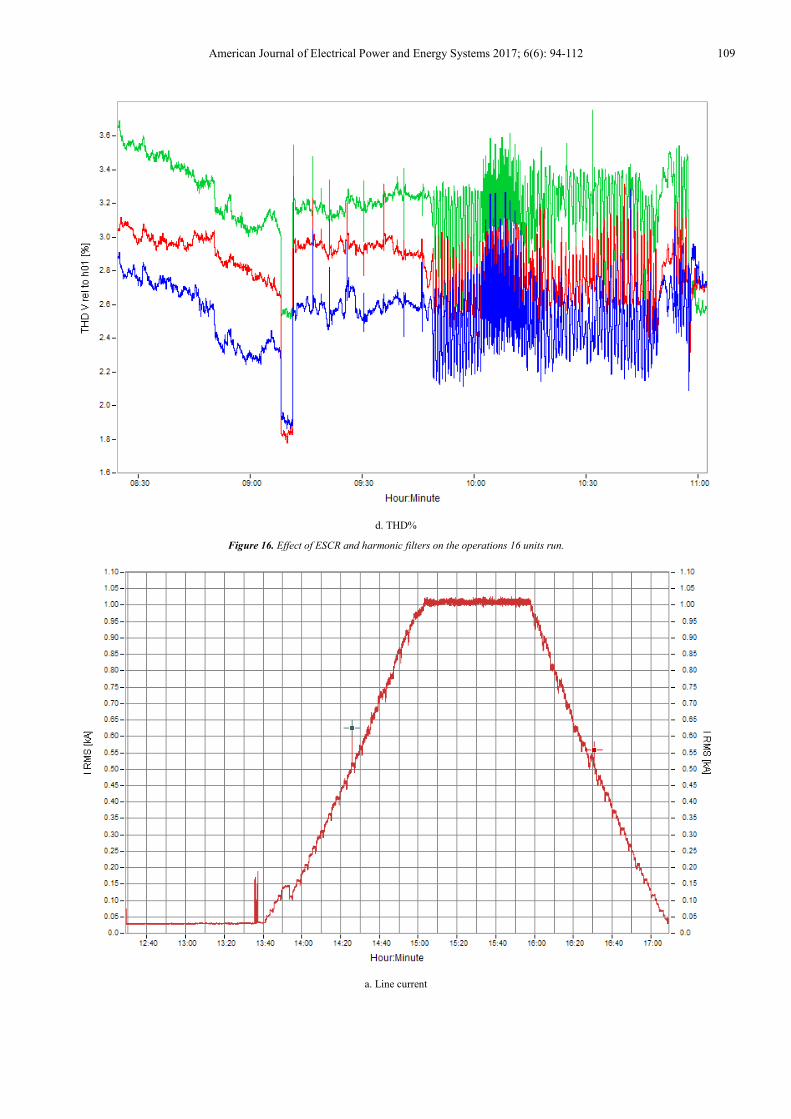
In this test the stations is run at two different cases, in each case the number of harmonic filters are changed depends on the power consumptions of the unit. Figure 14a, b shows the results in each case. In the first case the pump run and the harmonic filters of all units are connected, so the ESCR reach about 1.94 and the station cold not run with a full capacity. Only 16 units are run, and when the unit No.17 begins to start the current increases rapidly and the voltage decrease which lead to the unit stopped. A large amount of voltage flickers are occurred as shown in Figure 16, 17. After studying this
problem, it is needed to use a suitable number of harmonic filters to increase the value of ESCR to more than 2. The calculations found that only 13. Harmonic filters are needed to be used related to the power consumptions of the unit. The stations are run again after these modifications and 18 units could be run together without any problems. The obtained results in the two cases are analyzed and compered together to find the effects of variations of number of harmonic filters on the power quality of the grid. The analysis showed that; the instantaneous flicker in the first case reach about 900 but in the second case its value not increases about 35-40
a. Line Current
108 Khaled Mohamed Kotb Fetyan: Effects of Toshka Pumping Station Operations on Power Quality and Stability of Electrical Grid
b. Instantaneous Flicker
c. line voltage
American Journal of Electrical Power and Energy Systems 2017; 6(6): 94-112 109
d. THD%
Figure 16. Effect of ESCR and harmonic filters on the operations 16 units run.
a. Line current
110 Khaled Mohamed Kotb Fetyan: Effects of Toshka Pumping Station Operations on Power Quality and Stability of Electrical Grid
b. Instantaneous Flicker
c. line voltage
American Journal of Electrical Power and Energy Systems 2017; 6(6): 94-112 111
d. THD%
Figure 17. Effect of ESCR and harmonic filters on the operations 18 units run.
This means more stability grid voltage. The THD value in the first case is smaller than that in the second case due to decreases the number of harmonic filters, but the overall values not more than 5% according to standers condition.
6. Conclusions
Toshka Pumping station has large power rating and uses LCI to control the pump speed according to the water level. So, in the starting stage, and due to large load, it takes large time more than 30 sec to make the unit start and prevent sudden current increase leading to voltage drop and stop of unit starting. The speed of the unit is determined depends on the water level and also on the required water flow rate. The increasing of the pump speed causes more power consumptions and this increases the current consumed by the stations. So, THD is increased by about 2-3% and the values of instantaneous flicker increases. The water level increases for about 5m causing the power consumption of each unit increases by 1-1.5MW leading to increasing THD and flickers due to the speed increasing. The ESCR values less than 2 cause’s unstable operation of the grid and prevent the stations to run with the full rating due voltage fluctuations. Decreasing number of harmonic filters and modification of the grid improves the ESCR values (increases more than 2.5) and the 18 units could be run and consumed about 93MW, but the THD increases due to reduce number of harmonic filters.
Finally, this paper is very important for the designer of large water pump station to take into considerations the effects of operations of these stations on the electrical grid. Such large stations need stable and strong electrical feeding system for safe and stable operations
References
[1] MWRI, NWRC, “Toshka the first initiative of the comprehensive development in the South Valley”, 2000.
[2] MERI, “Study and Analysis of Mubarak Pumping Station Electrical Performance: 18 Units Test”, Technical Report, April, 2008.
[3] M.-H. Lim, B. W. Ahn, B. G. Kim, “Put investigation on the energy saving method using inverter driving for cooling pump at training ship”, Journal of the Korean Society of Marine Engineering, 33 (6), 880–885,(2009).
[4] S.-H. Suh. K. W. Kim, H. H. Kim, I. S. Yoon, M.-T. Cho, et al., “A study on energy saving rate for variable speed condition of multistage centrifugal pump”, Journal of Thermal Science 24 (6), 566–573, (2015).
[5] S.-H. Kim, J.-H. Kim, C.-Y. Jang, K.-d. Song, “The analysis of life cycle cost and cooling water circulating pump energy saving according to variable speed pressure differential set point control strategy”, KIEAE Journal 15 (4), 37–43, (2015).
112 Khaled Mohamed Kotb Fetyan: Effects of Toshka Pumping Station Operations on Power Quality and Stability of Electrical Grid
[6] S.-H. Suh. H.-H. Kim, R. Rakibuzzaman, K.-W. Kim, I.-S. Yoon, “A study on the performance evaluation of variable-speed drive pump”, The KSFM Journal of Fluid Machinery 17 (5), 83–88, (2014).
[7] Rakibuzzamana, Kyungwuk Kima, Hyoung-Ho Kima, Sang-Ho, “Energy saving rates for a multistage centrifugal pump with variable speed drive”, Journal of Power Technologies, P (1–6), 2016.
[8] Jacques Schonek, “Energy efficiency: benefits of variable speed control in pumps, fans and compressors”, May 2008, http://www.technicalpublications.schneider-electric.com
[9] Khaled Fetyan, Mustafa Abu-Zied, Sami Abdelfattah, “Electrical performance of 18 unit (216 MW) operation of Toshka pumping station”, Fifteenth International Middle East Power Systems Conference, Alexandria, Egypt, December 23-25, 2012, (MEPCON'12).
[10] Khaled fetyan, Mustafa Abu-zied, Sami Abdelfatah, “Effects of harmonics filters on the operation and performance of Toshka pumping station”, Al-Azhar university engineering journal, jaues, Vol. 7, No. 3, p 236-246, Dec. 2012.
[11] B. Davies, A. Williamson, and S. Filizadeh, “Systems with multiple DC infeed”, CIGRÉ Working Group B4.41. Dec. 2008, Publ. 364.
[12] E. Rahim, A. M. Gole, and J. B. Davies, “Analysis of multi -infeed HVDC systems with inverter and rectifier connected to the same AC network,” IET International Conference on AC/ DC Power Transmission, London, England, 2010.
[13] Z. Liu, Y. Biao, W. Zhang, and Y. Zhang, “Study on voltage class series for HVDC transmission system”, Proceedings of the CSEE, vol. 28, pp. 1-8, Apr. 2008.
[14] D. Lee and G. Anderson, “Voltage stability analysis of multi-infeed HVDC systems,” IEEE Trans. Power Del., Vol. 12, No. 3, pp. 1309-1317, July. 1997.
[15] D. Lee and G. Anderson, “Power stability analysis of multi-infeed HVDC systems,” IEEE Trans. Power Del., Vol. 13, No. 1, pp: 923-931, July. 1998.
[16] C. G. Hodge, J O Flower, A Macalindin, “DC power system stability”, Paper presented at ESTS 2009, Baltimore, Maryland, USA.
[17] Feng Wang & Yu Chen, “Voltage/Power Stability Study upon Power System with Multiple-Infeed Configuration of HVDC Links Using Quasi-static Modal Analysis Approach”, Master’s thesis, Power System, ABB, Ludvika, March, 2006.
[18] Shiwu Liao, Wei Yao, Xiaomeng Ai, Jinyu Wen, and Jingzhe, “An Improved Multi-Infeed Effective Short-Circuit Ratio for AC/DC Power Systems with Massive Shunt Capacitors Installed”, Energies 2017, 10, 396; doi: 10.3390. En10030396.
[19] MERI internal report, “Electrical performance of Toshka pumping stations in the first run”, August 2007.
[20] MERI internal report, “Electrical performance of Toshka pumping stations in first operations test (16 units)”, April 2008.
[21] Hitachi. ltd, report, “18 units operations test supplement reply”, May 2008.