Journal of the Optical Society of America and Review of Scientific Instruments Vol. 9 JULY, 1924 Number 1 EFFECTS OF VARYING THE WAVE LENGTH OF THE STIMULATING LIGHT UPON THE ELECTRICAL RESPONSE OF THE RETINA BY E. L. CHAFFEE AND ALICE HAMPSON INTRODUCTION When the retina of an eye is stimulated by light the nerve responses set up thereby are accompanied by changes in the electrical potential difference between portions of the nerve tissue as, for instance, between the front of the retina and the optic nerve. These changes in the elec- trical state of the nerves may, with considerable justification, be used as a measure of the actual nerve responses. In a previous paper 1 * by Chaffee, Bovie and Hampson, the method and apparatus adopted for the measurement of these electrical changes are described and a study of these responses is presented when the stimulating light is white. The reader is referred to this previous paper for a more detailed description of the apparatus and method than the following brief outline gives. The eye of an etherized frog is cut in half. The posterior half con- taining the retina is mounted in a moist chamber shown in Fig. 1 and connections made to it through threads moistened with Ringer's solution. One thread is connected with the protruding optic nerve and the other thread is usually arranged to touch end on to a point on the front surface of the retina. These threads at their other ends con- nect through non-polarizable electrodes to a two-stage resistance- coupled amplifier utilizing thermionic vacuum tubes. (See Fig. 2 for a schematic diagram of the apparatus.) The output of the amplifier passes to a string galvanometer so arranged that the excursions of the string are photographed on a moving piece of bromide paper. By means * Citation numbers throughout refer to Bibliography at end of this paper. 1
Transcript
Journal of the
Optical Society of America and
Review of Scientific Instruments Vol. 9 JULY, 1924 Number 1
EFFECTS OF VARYING THE WAVE LENGTH OF THE STIMULATING LIGHT UPON THE ELECTRICAL
RESPONSE OF THE RETINA
B Y E. L. CHAFFEE AND ALICE HAMPSON
INTRODUCTION
When the retina of an eye is stimulated by light the nerve responses set up thereby are accompanied by changes in the electrical potential difference between portions of the nerve tissue as, for instance, between the front of the retina and the optic nerve. These changes in the electrical state of the nerves may, with considerable justification, be used as a measure of the actual nerve responses. In a previous paper1* by Chaffee, Bovie and Hampson, the method and apparatus adopted for the measurement of these electrical changes are described and a study of these responses is presented when the stimulating light is white. The reader is referred to this previous paper for a more detailed description of the apparatus and method than the following brief outline gives.
The eye of an etherized frog is cut in half. The posterior half containing the retina is mounted in a moist chamber shown in Fig. 1 and connections made to it through threads moistened with Ringer's solution. One thread is connected with the protruding optic nerve and the other thread is usually arranged to touch end on to a point on the front surface of the retina. These threads at their other ends connect through non-polarizable electrodes to a two-stage resistance-coupled amplifier utilizing thermionic vacuum tubes. (See Fig. 2 for a schematic diagram of the apparatus.) The output of the amplifier passes to a string galvanometer so arranged that the excursions of the string are photographed on a moving piece of bromide paper. By means
* Citation numbers throughout refer to Bibliography at end of this paper.
1
2 CHAFFEE AND HAMPSON [J.O.S.A. & R.S.I., 9
of this apparatus the variations with time of the potentials of the retina are magnified and automatically recorded. The stimulation is caused by light from a source the intensity of which can be adjusted to known values.
FIG. 1. The general arrangement of the apparatus.
FIG. 2. The eye chamber.
The conclusions of the first paper are given below to furnish foundation for the present report.
1. An improved apparatus is used in studying the electrical response of the retina. This apparatus makes use of a two-stage thermionic amplifier which makes possible the measurement of small potentials with the absorption of no energy.
July, 1924] RETINAL RESPONSE 3
2. In preliminary work the electrical response was obtained when using the whole eyeball and the resulting curves are similar in principal characteristics to those obtained by previous experimenters.
3. The response curve of the whole eyeball undergoes marked progressive changes as the eye ages. The most notable change with age is the decrease in first positive increase in potential of injury and the development of a second relatively long negative deflection.
4. Much superior results are obtained by using only the posterior half of the eyeball and making direct connection to a small point on the surface of the retina.
5. Using the improved method of connection to the retina, the responses are greater, and the response curves reveal much fine structure showing that the reactions are more complex than can be explained by the two-or three-substances theories.
6. The complex curves are analysed into four definite and typical components called the first, second, third and fourth maxima. The first and second parts appear to be independent of each other. The time from the beginning of response to the first maximum is practically constant and equal to 0.27 seconds. The time to the second maximum measured in the same manner is also essentially constant and equal to 0.70 seconds. The times to the third and fourth maxima vary greatly according to the energy of light stimulation. The time to the third decreases and the time to the fourth increases as the energy increases. I t is believed that the first and third maxima are related.
7. The apparently unrelated first and second maxima can be reasonably attributed to the reactions of the two types of visual cells in the retina, the cones and rods.
8. Synthetic curves resembling many of the observed curves are built up from two assumed types of fundamental curves. The two distinct types of fundamental curves are considered to be the responses of the two types of sensory receptors, the cones and rods. The shapes of the fundamental curves have been chosen with due regard to the performance of nerves.
9. The changes with time in the response curves of the posterior half of the eyeball are studied and graphs obtained The shape of the response as well as its magnitude undergoes a change with age. Responses have been obtained for twenty-two hours after excision of the eye.
10. The changes in maximum height of the response curves, used as a measure of the intensity of sensation, are plotted against the corresponding intensities of excitation. For low intensities the law
Sensation α √Stimulation approximately holds: for medium intensities of excitation the Weber-Fechner law (S∞ K log I+C) is obeyed.
While studying the responses of the eye to white light a rough experiment was made to see if any marked effects were observable with colored light. Three color screens were made, a red, a green and a blue, and adjusted in density so that the brightness of the transmitted light for all three appeared to be equal as judged by the authors and several others. The responses of the frog's eye to the three colors were by no means equal. The red gave practically no response while the blue caused a very great change in potential. Green gave a response intermediate between the blue and red. This crude test showed that the color sensitivity of the frog's eye is very different from that of the human eye. Because of this anomaly quantitative experiments using colored lights have been made and the results of these experiments comprise the main subject of the present publication.
4 CHAFFEE AND HAMPSON [J.O.S.A. & R.S.I., 9
I. HISTORICAL REVIEW
Previous investigators of the electrical response of the eye have also been interested in the effects of color upon these responses. Very little quantitative work, however, has been done, for most of the tests using colored lights have been incidental in the use of white light by the investigators and the results are in most cases merely qualitative observations.
Practically all of the earlier workers agree that the electrical response of the eye is greater for the middle of the visible spectrum than for the ends. There is some disagreement, however, concerning the wave length which gives the maximum stimulation. A few observed that the wave length which produces the maximum response depends upon intensity. It was expected that the responses for different colors would show qualitative differences which would assist in explaining color vision but there is disagreement in this particular among the investigators. More specifically the results of early work are as follows:
Holmgren2 observed that with the frog's eye green is more potent than red or blue.
Dewar and M'Kendrick3 stated that for a frog yellow gives greater response than green.
Chatin4 using Crustacea, insects, and mollusks believed that red and blue give the least response.
Ishihara5 showed that the response of the frog's eye is less with red than with green.
Einthoven and Jolly6 demonstrated that for the same energy of stimulation green light gives more response than red or blue.
Himstedt and Nagel7 stated that for weak stimulation of a dark-adapted frog's eye a wave length of 544 mμ and for strong illumination of a light adapted eye a wave length of 590 mμ give the greatest responses.
Piper's results8,9 indicate that for the cephalopod a wave length of 500 mμ gives maximum response. His results with a frog's eye confirm those of Himstedt and Nagel. He also stated that the rod eye of night birds and the dark-adapted human eye give maximum response for the same wave length and the cone eye of the day birds and the light-adapted human eye give maximum response for the same wave length.
Gotch10 differed from the general trend of results and believed that the frog is more sensitive to red than to blue. He found that the latent period varies with wave length. According to him all responses are of the same general type whether evoked by colored or white light.
July, 1924] RETINAL RESPONSE 5
Waller's11,12,13 conclusions for the frog's eye may be summed up as follows: All colors seem to act in the same direction more or less powerfully according as they are more or less luminous. There is no complementary or antagonistic influence. The eye excessively stimulated by one color shows the same fatigue for the complementary color as for all colors. In the light of the above he believes there is no qualitative effect of color.
De Haas14 obtained results similar to Waller's and suggested that the frog may be totally color blind.
Brossa and Kohlrausch16 made more careful experiments with color than many of the others. Subjecting the frog's eye to time exposures they stated.that there is a qualitative difference in the response curves for different colors. The differences occur in the latent periods and in the shape of the curve during the latter part of exposures of several seconds. They found further16 that this qualitative difference is absent with owls' eyes but present with pigeons' eyes.
Fröhlich17 found oscillations in the response of the eye of the cepha-lopod. He concluded that the frequency and intensity of these oscillations depend upon the brightness and color of the stimulating light. He also found that the blue end of the spectrum is more effective than the red end in producing potentials in the retina.
Sheard and McPeek18 showed that for long exposures there is a gradual shift in potential which depends upon the color of the stimulating light.
I I . APPARATUS
The method of measuring and recording the electrical response of the retina has already been alluded to in the first part of this paper and described in detail in the previous publication.1 In this previous work only white light was used. In order to make a thorough and systematic study of the effects of colored lights it was necessary to set up and accurately calibrate apparatus for giving approximately monochromatic radiation of known energy and to provide means for varying the energy as well as the color through a large range.
Fig. 3 gives a diagram of the apparatus for obtaining light of various colors. The light from a 600-watt motion-picture lamp, the current through which is maintained constant at 20 amperes, is focused by condensing lenses on the first slit S1 . A water cell is placed in the path of the light to absorb the invisible heat. Beyond slit S1 the light is
6 CHAFFEE AND HAMPSON [J.O.S.A. & R.S.I., 9
resolved into colors by the two prisms PP. These prisms can be rotated by a graduated screw so that as the latter is turned the spectrum formed by the prisms travels over the second slit S2 . If this slit is narrow a limited region of the spectrum is selected, according to the position of the screw, and passes to the eye chamber. The screw for varying the color was calibrated in terms of wave length of the light.
FIG. 3. Optical system by means of which the wave length and the intensity of the stimulating light can be varied. ■
Since this monochromatic illuminator gave a small amount of scattered white light together with the colored light it was necessary to use color niters for absorbing all portions of the spectrum except a narrow region about the color being used. Eight Coming-glass filters
July, 1924] RETINAL RESPONSE 7
and one dye filter, when used in certain predetermined combinations,. divided the spectrum into six overlapping regions.
The tungsten lamp gives a small amount of energy in the violet end of the spectrum compared to the energy of the red radiation. Consequently, in order to reduce the energy in the red end, neutral absorbing filters were used. These filters, of which there are four of different densities, were used with the colored filters and were chosen so that the energy which passes through the whole filter combination is roughly the same throughout the spectrum.
All neutral and colored filters, with the exception of the one dye filter, are optically plane and the coloring or absorbing matter is in the glass so that these filters could be assumed to be reasonably permanent. The one dye filter which was necessary to make the series complete was always the most remote filter of the series from the lamp so as to reduce the fading to a minimum.
The intensity of any color was varied by two methods in combination. Varying the width of. slit S2 changes the intensity proportional to the slit width. The width of the slit was determined by a calibrated micrometer screw. The other method of varying the intensity was by means of a photographic wedge placed immediately in front of the slit S1. This wedge, a photograph of which was shown in the previous paper, consists of a piece of photographic plate cut in circular form and exposed to an increasing extent around in a circle forming a circular wedge. This plate is mounted in a graduated ring so that it can be rotated. The light passes through a narrow aperture and through a greater or less dense portion of the wedge according to its setting. The wedge gives a variation of energy of approximately one hundred fold.
The relative magnitudes of light energy were measured and the wedge, slit, and color screens were calibrated by means of a Coblentz21
vacuum thermopile connected to a sensitive Weston galvanometer. Seventeen colors ranging in even steps from .395μ to .700μ were
chosen and the setting of slit S2 determined for each color so that the energy passing through the appropriate filter combination and slit S2
is the same in each case. A table of the color filters and setting of S2
for each color gave the necessary adjustments for obtaining responses to constant energy throughout the spectrum. The value of this constant energy could be increased or decreased by known amounts either by the wedge or by varying slit S1.
8 CHAFFEE AND HAMPSON [J.O.S.A. & R.S.I., 9
III. RESULTS
The first type of experiment performed to investigate the effects of varying the color of the stimulating light comprised photographing the responses to short flashes of light of various colors while maintaining the energy of the stimuli constant. If the maximum heights of the responses be assumed to be proportional to sensation as was discussed in the first paper, then a curve plotted with maximum heights against wave length gives the color-response curve of the eye for constant energy. Such a graph is shown in Fig. 4. The striking feature about this curve is its height in the blue and violet regions of the spectrum.
It might be objected that since the lens and vitreous humor have been removed in these experiments, violet and blue light which might be absorbed by these media now act directly to give apparently higher responses in the blue end. To eliminate any error due to the possible
FIG. 4. Maximum height of the response of the frog's eye for various wave lengths at constant energy.
absorption in the lens and humor, the same type of curve was run with the whole eyeball and the resulting curve shows the same characteristics as that of Fig. 4.
In Fig. 5 a family of constant energy curves, of the same type as that of Fig. 4, is plotted, the separate curves being for different values of the energy. The relative values of the energy of stimulation are indicated on the curves. Each observation as before was taken for a flash of light of 1/25 second duration. At low intensities the responses drop in the blue end. As the intensity is decreased the wave length which gives maximum response shifts toward the violet. A shift in the sensitivity of the human eye toward the violet for low intensities has
July, 1924] RETINAL RESPONSE 9
been observed psychologically and is called the Purkinje effect. (See Parsons20 p . 57.) The shift shown in Fig. 5 cannot be interpreted as due entirely to the Purkinje effect because the method of obtaining the results is different from the method adopted to demonstrate the psychological effect.
If, now, instead of maintaining the energy constant, the energy of the stimulating light flashes is varied by means of the wedge while the color is kept the same and the heights of the responses plotted against intensity, a curve is obtained giving the relation between response or sensation and intensity. Such a curve for green light is shown by the I—R curve of Fig. 6. In order to derive the form of the mathematical
FIG. 5. Maximum height of the response of the frog's eye for various wave lengths at constant energy for five values of the energy
law connecting the variables, the logarithm of the response is plotted against the logarithm of the intensity yielding the log I—log R graph of Fig. 6. This plot shows a definite straight portion. On the other hand, if R is plotted directly against log I the dotted curve of Fig. 6 is obtained which also has a straight portion. These graphs are exactly similar in all respects to the corresponding graphs for white light given in the previous paper. I t is evident that the intensity-response curve can be divided into three regions, i.e., the first region for low intensities for which region the log R-log I graph is straight, the second region of medium intensities for which the R-log I graph is straight, and the third region of relatively high intensities for which no law has been deduced. The responses for this third region have nearly reached a
10 CHAFFEE AND HAMPSON [J.O.S.A. & R.S.I., 9
maximum saturation value and a further increase of intensity produces only changes in the last parts of the response curves long after the cessation of the stimulus and called in the first paper the "fourth maximum."
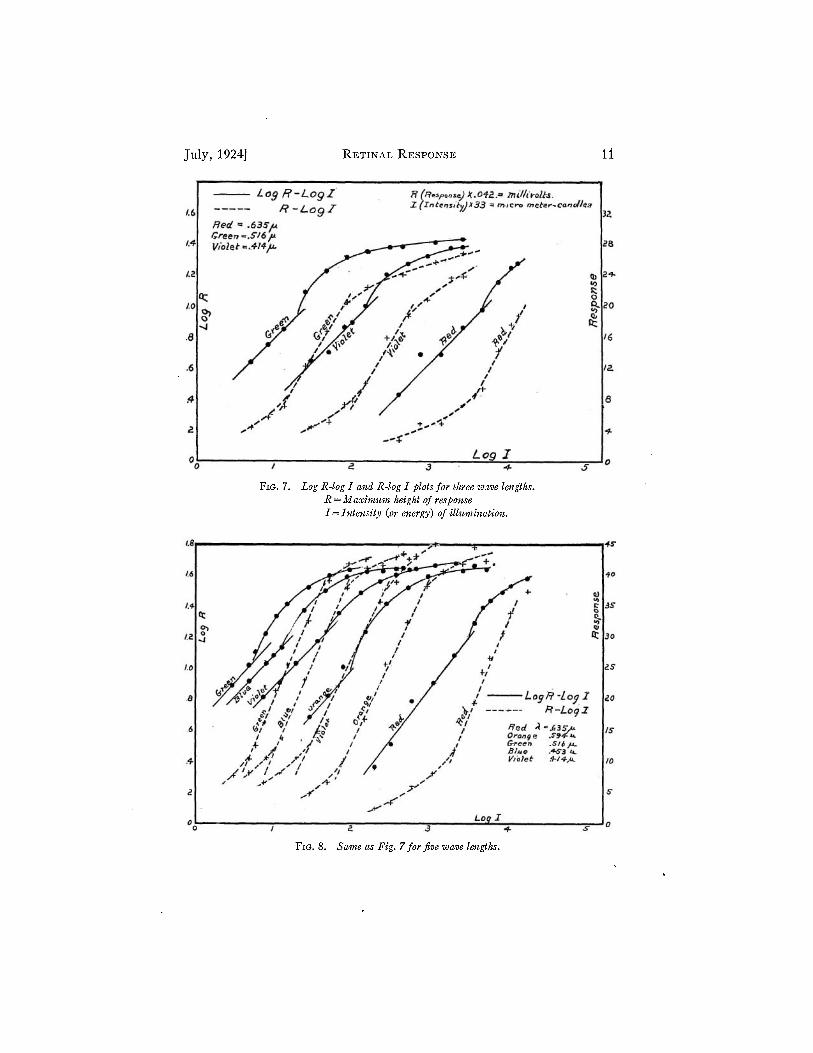
Fig. 7 is a plot of experimental data giving the log R -log I and the R- log I plots for three colors, the plot for green being the same as that of Fig. 6. Fig. 8 is a similar plot for five colors.
FIG. 6. Curves showing the relation of the maximum height of the response of the frog's eye, R, to the intensity of illumination, I, for wave length .516μ.
The possible experimental errors in obtaining data for curves of the type shown in Figs. 7 and 8 are great due largely to inherent irregularities of the apparatus and changes in the eye because of the long time required to obtain a complete set of data. Since the data for Fig. 7 were taken for only three colors, the run was correspondingly short and the error due to changing of the* eye was reduced. For this reason Fig. 7 shows better the outstanding characteristics of plots of this type. Many plots of the type shown in Fig. 7 have been made and all more or less definitely conform to certain characteristics which will now be discussed referring to Fig. 7 as representative.
The notable points about Fig. 7 are that the log R - log I plots for all colors are parallel straight lines for the first range of intensities, and
July, 1924] RETINAL RESPONSE 11
FIG. 7. Log R-log I and R-log I plots for three wave lengths. R = Maximum height of response I = Intensity (or energy) of illumination.
FIG. 8. Same as Fig. 7 for five wave lengths.
12 CHAFFEE AND HAMPSON [J.O.S.A. & R.S.I., 9
that the law breaks down abruptly at approximately the same height of response for all colors. The straight line R—log I graphs for the second range of intensities are also parallel and this law, too, breaks down at the second break point which occurs at practically the same height of response for all colors.
It was shown in the previous paper that for white light the responses in the first and second regions can be expressed by certain mathematical laws as follows: In the first region the law is of the form,
where the average value of n was found to be 2. The second region follows the Weber-Fechner law which can be expressed in the form
where K and C are constants. Since the plots of Fig. 7 are exactly similar in shape to the plots for
white light, then the laws for the plots of Fig. 7 must be similar to those for white light.
The law for the straight line portion of the log R—log I curve can evidently be written
or
where A\ is a constant for any one color but a function of the wave length, and n has the value 2 for all colors.
The straight line portion of the R— log I curves can be expressed in a form similar to equation (2), i.e.
or
where K is a constant and the same for all colors because the lines are parallel, and Bλ is a constant for any one color but a function of the wave length.
If it may be assumed, as is strongly suggested by the experimental results, that the corresponding break points in the laws all occur at the same level, or in other words, at the same response for the several colors, then it of necessity follows that the horizontal distance between the straight portions of the full-line graphs for any two colors is the same as the distance between the straight-line portions of the dotted graphs for the same colors. This is not absolutely true in Fig. 7 but the results
July, 1924] RETINAL RESPONSE 13
of a large number of similar experiments support the assumption. It is, therefore, evident that the intercepts of the two sets of straight line graphs on the log I axis, which intercepts determine the values of log Aλ and log Bλ, respectively, have the same relative spacings, but those for one set, such as for the R —log I graphs, are displaced by a constant amount from those of the other set which displacement may be denoted by log p. Then it follows that
Then equation (4) can be written
In equations (3) and (6) the only factor which depends upon color is Aλ , a factor which is constant for any one color but which is a function of the wave length and measures the true sensitivity of the retina to various colors independent of intensity within the range of the first and second laws.
The fact that Aλ occurs only as a multiplier of I indicates that the corresponding laws of response to the different colors are identical, but the reacting substance in the retina has a different sensitivity to the different colors.
From the above results it may be concluded that for the frog's eye there is no qualitative difference in the laws of variation of maximum response for different colors.
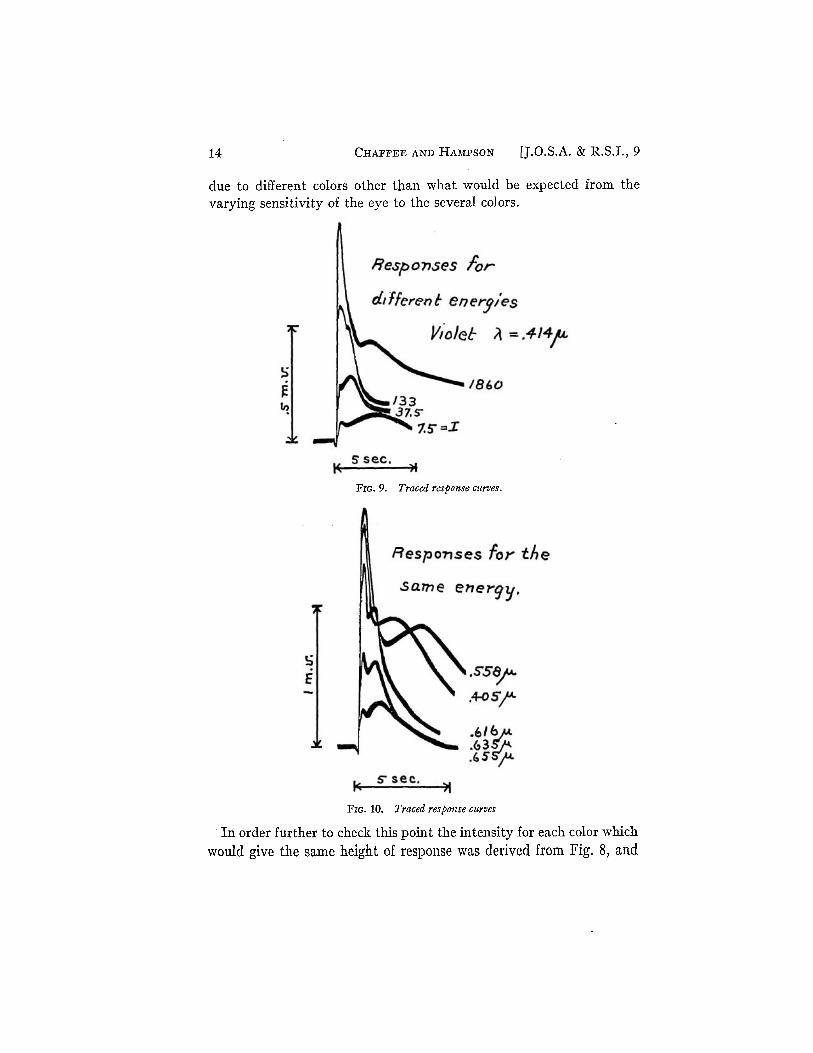
As was pointed out in the first paper the typical response to a flash of light consists of several well defined maxima the first two of which are important in this discussion. Fig. 9 presents some tracings of response curves all for the same color but different energies indicated on the curves. At low intensities, that is, intensities in the first region, the second maximum is more prominent as shown in Fig. 9 for the curves marked 1 = 7.5 and 37.5. As the intensity is increased the first maximum increases more rapidly than the second and becomes of the same height as the second maximum at the intensity corresponding to the break point between the first and second laws. At high intensities the second maximum may be so large as practically to mask the second maximum. Fig. 10 is a tracing of response curves for which the energy was the same but the colors different. Comparing Figs. 9 and 10 it is obvious that the responses go through the same changes in shape when the color is varied as they do when the intensity is varied. In other words, there is no qualitative difference in shape of the response curves
14 CHAFFEE AND HAMPSON [J.O.S.A. & R.S.I., 9
due to different colors other than what would be expected from the varying sensitivity of the eye to the several colors.
FIG. 9. Traced response curves.
FIG. 10. Traced response curves
In order further to check this point the intensity for each color which would give the same height of response was derived from Fig. 8, and
July, 1924] RETINAL RESPONSE 15
experiments made in which the intensity was adjusted to these values for the several colors. Figs. 11 and 12 are tracings of the results. It will be seen that in neither figure are the heights of the responses the same as was intended but this is not surprising when it is realized that the data for setting the apparatus were obtained from the results of a
FIG. 11. Traced response curves of the same shape for several colors.
different eye. The curves are sufficiently close, however, to show conclusively that for the same height of response the shape of the response curve is the same for all colors. This further confirms the conclusion that there is no qualitative difference in the main characteristics of the response curves for different colors.
FIG. 12. Traced response curves of the same shape for several colors.
Brossa and Kohlrausch, in a very careful series of experiments, apparently found a qualitative difference in the shape of the responses for different colors when the intensity of time exposures was adjusted to give the same maximum response. This is contrary to the conclusions of this paper and it may be suggested that if high intensities falling in the various portions of the third region are used, the response curves
16 CHAFFEE AND HAMPSON [J.O.S.A. & R.S.I., 9
do not increase materially in height but do broaden out and without an investigation of the kind described in this paper it would be impossible to draw their conclusions.
Several experiments were made in which the eye was exposed constantly to one color and the responses measured for flashes of another color. These experiments were designed to determine if totally different mechanisms are active for different colors. The results confirm the observations of Waller in that apparently so far as the response curves show there is no selective fatigue due to exposure to a single color and that the fatigue due to one color affects the responses of all colors.
In the previous paper it was suggested that the first maximum of the response is due to the cones and the second to the rods. This conclusion is in agreement with a psychological test which is very easy to perform. If the observer's eye is illuminated by a flash of colored light so led into the eye that the eye cannot focus on any form, two sensations of light are observed the first of which is colored and the second un-colored. This is easily observed if the intensity of the colored stimulus is not too great and is more easily seen with blue and green than with red light. It has been shown in the previous paper that when the illumination is not extremely low the time to the first maximum is about .27 second and to the second about .70 second. As far as could be judged the times to the colored and gray sensations in the psychological test corresponded to these figures. Parsons20 (pp. 87, 88) speaks of this effect.
The conclusions so far drawn from the data may be briefly summed up in the following statement. There is no apparent qualitative difference in the character of the response curves to different colors which can be used as a basis for explaining color sensation. Any differences for different colors which may be in the responses to convey to the brain the sensation of color must exist in the finer individual responses of the end organs and nerves the sum total of which make up the gross curves discussed in this paper. Response curves for different colors have been shown to conform to definite mathematical laws similar in all respects to the laws deduced for white light. The only effect of varying color is to change the value of a single parameter Aλ of the curves.
Returning now to a further discussion of the data it is interesting to deduce the color sensitivity or visibility curve of the frog's eye as has been done for human vision.
July, 1924] RETINAL RESPONSE 17
The common definition of visibility of radiant energy given for instance, in the paper by Gibson and Tyndall19 on the "Visibility of Radiant Energy" is
where V\ is the visibility at wave length λ, usually expressed as relative visibility with reference to unity at the maximum; L\ is the luminosity, and Eλ (the same as Iλ in this paper) the energy at wave length λ. This definition does not specify whether V\ is to be determined by maintaining Eλ constant and measuring Lλ , or by keeping L\ the same and measuring Eλ . In fact the definition implies that the two processes are equivalent which, however, is not the case.
Referring to Fig. 7, it is evident that if the color is varied while the intensity is maintained constant, the variation in sensitivity of the eye is so great that the law of response is different for different colors. If the law of response changes then of course the responses are not a function only of sensitivity. For instance, referring again to Fig. 7, suppose that the intensity were such that log I = 2.4, then for red light the eye would be responding according to the log R —log I law, for violet light the second law, R — log I would hold, and for green light the response is so great that it falls in the third region where neither law holds. I t is clear that, at least for the frog, no intensity can be found for which the law of response for all colors is the same. Hence for every curve of Fig. 5 the law of response changes one or more times along the curve. According to Fig. 7 if the response is maintained constant and the energy measured which, for each color evokes this same response, then no matter what value of constant response is chosen the law is the same for all colors. Since the law remains constant the sensitivity is a function only of the energy and is inversely proportional to the energy. S. Hecht,22 in a paper on the reactions of Mya to light of different colors, recognized that the only correct method of measuring the sensitivity of the organism to different colors is to determine the energy at each color which produces the same response.
I t is reasonable to assume that the human eye has somewhat the same characteristics depicted in Fig. 7 so that it can be asserted that visibility should be determined by measuring the energy to produce a constant response or sensation and not by the converse process used for obtaining the curves of Fig. 5. Using the former process, a plot of the reciprocals of the energies referred to the maximum value of the reciprocal gives a true color sensitivity or relative visibility curve of the eye.
18 CHAFFEE AND HAMPSON [J.O.S.A. & R.S.I., 9
I t is suggested that the definition for relative visibility be changed to
where Emin is the energy for that wave length requiring the minimum energy to evoke the chosen response, and E\ is the energy at any wave length λ to produce the same response.
Practically all of the methods adopted for determining the visibility curve for man such as the "step-by-step" or "equality of brightness" method, the "flicker photometer" method, etc., measure the energy for constant values of brightness and hence the methods are justified according to the above consideration. In fact psychologically it would be very difficult to use the converse process. With the frog's eye or any eye subjected to test by the apparatus used in these experiments, it is easier to measure responses for constant energy than by cut-and-try process to obtain the same response.
Referring back to equations (3) and (6), assume that R is maintained constant. Then Aλ Iλ must be constant as λ is changed. In other
words, for constant response and hence the sensitivity of the
eye to different colors is proportional to Aλ . Equation (7) for visibility can then be written
The value of log A\ can be found from the intercepts of both the log R—log I lines and the R—log I lines on the log I axis. The circles of Fig. 13 show values of A\ determined from the log R— log I lines of several experiments while the crosses give the values of the same quantity taken from the R— log I lines of the same experiments. The average values are shown by the large circles at the right. The ratio
, or visibility from these average values is shown by circles in
Fig. 14. Although it is difficult to adjust intensities to produce the same
response because the image of the galvanometer fibre moves so rapidly that the maximum deflection is uncertain, and the repeated exposures necessary to adjust the responses to the same values would rapidly fatigue the eye, nevertheless, one experiment of this sort was made. In this experiment the energy was varied for each color until the first two maxima of the response curve described above were of the same
July, 1924] RETINAL RESPONSE 19
height. It has been shown that when this is true the response corresponds to the break point between the first and second laws and hence means that the response has the same height for all colors. The relative visibilities from these data are shown by the crosses in Fig. 14. The curve averaging the crosses and circles is the best representation according to the data at hand of the true visibility curve of the frog's retina.
FIG. 13. Values of (— log A) for seven wave lengths.
The dotted curve of Fig. 14 is an average of a great many determinations of the photopic or chromatic visibility curve of human vision. This curve is taken from a paper by Gibson and Tyndall.19
The curves of Fig. 14 show that the visibility curve of the frog's retina is of the same general shape as, although somewhat wider than, the human photopic visibility curve, but it is displaced roughly .040μ
20 CHAFFEE AND HAMPSON [J.O.S.A. & R.S.I., 9
toward the violet end of the spectrum. The wave length which gives maximum response in the frog's retina is .51бμ.
Several experiments to determine the scotopic or low intensity visibility curve for human vision have been made, probably the most successful of which is that of Hecht.23 His curve has its maximum at .511lμ and is similar in shape to the photopic visibility curve shown by the dotted curve of Fig. 14. The scotopic curve falls inside the frog's visibility curve and is reproduced in the dot-and-dash line in Fig. 14.
FIG. 14. The visibility curve of the frog's eye {full line), the "adopted visibility curve"19
{photopic) of the human eye {dotted line) and the scotopic visibility curve of the human eye {dot-and-dash line).
Considering the three curves of Fig: 14, particularly in view of the near coincidence-of the frog's visibility curve with the scotopic human visibility curve, it seems that we may entertain two hypotheses, one, that the frog has some color vision and that the full line curve of Fig. 14 represents its color sensitivity curve, perhaps somewhat modified by the presence of rod vision, and two, that the frog has no or very little color sense and that the results of Fig. 14 give the achromatic visibility curve of the rods.
In considering the first hypothesis it is important again to call attention to the fact that two laws for the height of the responses are observed, which fact strongly suggests two mechanisms in the retina
July, 1924] RETINAL RESPONSE 21
and the natural assumption, which is strengthened by the psychological test referred to on page 16 is that one law is due to the rods and the other to the cones. Furthermore, it should be emphasized that the intensities of light used in obtaining the frog's visibility curve ranged from about the threshold of vision far up into the intensities which excite the sensation of color as judged by the author's eyes. Therefore, although the experiments were made on dark adapted eyes, the intensities were great enough to give color sense if that exists in the frog. From these considerations it is reasonable to assume that the cones contribute their effect to the response curves although, as Ecker and Wiedersheims24 show, there are about three times as many rods as cones. If then the color sensitivity curves of the rods and cones are differently situated with respect to the wave length axis, the value of Aλ obtained from the high and low intensities of stimulation should differ. As shown in Fig. 13 this is not the case, at least within the experimental error. Therefore, if the cones are active, it must be concluded that their color sensitivity curve coincides or nearly coincides with the rod curve, and both are given by the observed curve of Fig. 14.
The second hypothesis, that the vision of the frog is essentially rod vision, and that the frog has little or no color sense is supported by the relative paucity of cones, the near coincidence of the observed visibility curve and the scotopic curve for human vision, and the fact that Aλ is the same for all intensities. If this hypothesis is correct then the existence of two laws and the two humps in the response curves must be explained in some other way than ascribing them to the rods and cones.
I t is impossible to decide at present which of the hypotheses is correct, or whether or not a compromise between them is more probable. Further experiments are necessary.
IV. SUGGESTIONS FOR FUTURE WORK
The results of this investigation indicate that further work is highly desirable to derive more accurately the color sensitivity curve. I t would then be possible to determine if there is a difference between the visibility curves for high and low intensities and according as the eye is light or dark adapted. The range of wave lengths should be extended further into the violet.
Since the method is applicable to any eye it would be extremely valuable to obtain the visibility curves for a great many kinds of eyes including those containing only rods or only cones. Such results should
22 CHAFFEE AND HAMPSON [J.O.S.A. & R.S.I., 9
throw a great deal of light upon the evolution of color sensation and enable one definitely to separate and to determine the shapes of the response curves of the rods and cones.
It is probable that to obtain an insight into the true nature of color sensation some method must be devised for further analysing the response curves into the finer pulses arising from a single rod or cone.
V. SUMMARY OF RESULTS
1. A color illuminator, used in conjunction with color filters to exclude stray white light, was calibrated so that the eye could be stimulated with light of any known wave length and known energy.
2. The electric potentials, called electric responses, produced in the retina by the action of light, were measured by means of a thermionic amplifier connected to an Einthoven galvanometer. The measuring apparatus is the same as used in the previous paper.
The electrical responses to colored light show the same general characteristics as those to white light.
3. Curves were plotted giving the maximum height of the electrical response of the retina for various colors, the energy of stimulation remaining constant for any one curve. One of the outstanding features of these curves is the fact that the responses in the violet are relatively great for the highest intensities.
4. The maximum height of the responses was measured for varying energy for constant colors and the results conform to certain mathematical laws similar to the laws deduced for the responses to white light.
5. The results of the mathematical analysis show that for any color the intensity-response curve may be divided into three regions corresponding to three ranges of intensities. In the first region the plot of log (response) against log (intensity) is a straight line. In the second region the plot of (response) against log (intensity) is a straight line. In the third region no law has been deduced.
6. The first region for which log R— log I is straight corresponds to the same range of responses for different colors but to different ranges of intensities.
7. The second region for which the R—log I plot is straight corresponds to the same range of responses for different colors but to different ranges of intensities.
8. The responses in the first region obey the law
July, 1924] RETINAL RESPONSE 23
where R is the response, I the intensity, n a constant and the same for all colors, and A\ a constant for any one color but a function of wave length.
9. The responses in the second region obey the law R=K log (Aλ I)+ log p
where R is the response, I is the intensity, K and p constants and the same for all colors, and A\ the same constant as in 8.
10. The factor Aλ is the only factor dependent upon color and hence the laws for various colors are the same, but for a different range of intensities.
11. There is no difference in the law of maximum response for different colors.
12. Exposures made within the limits of the two laws for different energies so adjusted as to give the maximum response the same for several colors, give responses of the same shape, so that it is concluded that there is no qualitative difference in the shape of responses for different colors.
13. There is no selective fatigue when the retina is exposed to light of one color.
14. As a result of 11, 12, and 13, there is no qualitative difference in the responses to different colors which can be used as a basis to explain color vision.
15. The value of A\ for seven wave lengths is deduced from the first and second regions of several experiments and is plotted against wave length giving the true color sensitivity or visibility curve of the frog's eye.
16. The visibility curve of 15 is confirmed by observations of energy necessary to produce the same response for fourteen wave lengths.
17. A new definition of visibility is suggested which ensures that visibility be always determined by measuring the energy to produce the same response at different wave lengths; namely,
18. The constant energy curve (3) is not the true visibility curve because the laws of at least two regions are concerned in every possible curve.
19. The visibility curve for the frog's eye derived from (15) and (16) is similar in shape to the generally accepted visibility curve for color vision of the human eye but it is shifted approximately .040μ
24 CHAFFEE AND HAMPSON [J.O.S.A. & R.S.I., 9
toward the violet end of the spectrum. The maximum sensitivity-occurs approximately at .516μ. This curve nearly coincides with the low intensity or achromatic visibility curve of human vision.
This paper is the second of a series of investigations on the electrical response of the retina, conducted in the J. Collins Warren Laboratory of Bio-Physics of the Cancer Commission of Harvard University. The investigation was undertaken in collaboration with Dr. W. T. Bovie. The first paper1 of the series has already been referred to in the text. Due acknowledgment is here made of the assistance of Dr. Bovie and the Cancer Commission in this investigation.
CRUFT LABORATORY, HARVARD UNIVERSITY
CAMBRIDGE, MASSACHUSETTS.
BIBLIOGRAPHY 1 Chaffee, E. L., Bovie, W. T., and Hampson, A. The Electrical Response of the Eye
under Stimulation by Light. J. of Optical Soc. of Amer. 7, No. 1; 1923. 2 Holmgren. Physiol. Untersuch, Heidelberg, 2; 1882. 3 Dewar and M'Kendrick. On the Physiological Action of Light. Trans. Roy. Soc. Edin.,
27, p . 141; 1873. 4 Chatin. Sur la valeur comparée des impressions monochromatiques chez les invertébrés.
Conapt. rend, de l'Acad. des Sciences, 90, p . 41; 1880. 5 Ishihara, M. Versuch einer Deutung der photoelektrischen Schwankungen am Frosch-
auge. Pflüger's Arch., 114, p. 569; 1906. 6 Einthoven, W, and Jolly, W. A. The Form and Magnitude of the Electrical Response
of the Eye to Stimulation by Light at Various Intensities. Quar. Jour. Exp. Physiol., 1, p. 373; 1908.
7 Himstedt und Nagel. Berichte der Naturforschenden Gesellschaft, 11, p. 149; 1901. 8 Piper, H. Das elektromotorische Verhalten der Retina bei Eledone moschata. Arch. f.
Physiol., p. 453; 1904. 9 Piper, H. Untersuchungen über das elektromotorische Verhalten der Netzhaut bei
Warmblutern. Arch. f. Anat. u. Physiol., Suppl.-Bd., p. 133; 1905. 10 Gotch, F. The Time Relations of the Photo-electric Changes Produced in the Eyeball
of the Frog by Means of Colored Light. J. of Physiol., 31, p. 1; 1904. 11 Waller, A. D. On the Retinal Currents of the Frog's Eye, Excited by Light and Excited
Electrically. Phil. Trans. R. S. and B., 193, p. 123; 1900. 12 Waller, A. D. The Signs of Life. London, 1903. 13 Waller, A. D. On the Double Nature of the Photo-electrical Response of the Frog's
Retina. Quar. Jour, of Exp. Physiol., 2, p. 169; 1909. 14 de Haas. Lichtprikkels en retinastroomen in hum quantitivi verband. Dissertation,
Leiden; 1903. 15 Brossa, A. and Kohlrausch, A. Die Aktionsströme der Netzhaut bei Reizung mit
homogenen Lichtern. Arch. f. Physiol., p. 449; 1913. 16 Kohlrausch, A. and Brossa, A. Die photoelektrische Reaktion der Tag- und Nachtvogel-
netzhaut auf Licht verschiedener Wellenlänge. Arch. f. Physiol., p . 421; 1914. 17 Fröhlich, Fr. W. Vcrglcichcnde Untersuchungen über Licht- und Farbensinn. Deutsch.
med. Woch., 39, p. 1453; 1913.
July, 1924] RETINAL RESPONSE 25 18 Sheard, Chas. and McPeek, C. On the Electrical Response of the Eye to Stimulation
by Light of Various Wave Lengths. Am. J. of Physiol., 48, p. 45; 1919. 19 Gibson, K. S. and Tyndall, E. P. T. Visibility of Radiant Energy. Scientific Papers of
the Bureau of Standards, No 475. 1923. 20 Parsons, J. Herbert. An Introduction to the Study of Color Vision. Published by the
University Press of Cambridge, England, 1915. 21 Coblentz, W. W. A Portable Vacuum Thermopile. Scientific Papers of the Bureau of
Standards, No. 413. 1921. 22 Hecht, Selig. The Relation between the Wave-Length of Light and its Effect on the
Photosensory Process p. 383 J. of General Physiol. 3] No. 3. pp. 375-390; Jan. 20, 1921. 23 Hecht, Selig, and Williams, Robert E. The Visibility of Monochromatic Radiation and
the Absorption Spectrum of Visual Purple. J. of General Physiology. 5, No. 1, pp. 1-33; Sept. 20, 1922.
24 Ecker, A., und Wiedersheims, R.; Anatomie des Frosches. vol. 3, p. 828; 1901-1904.