Page 1
Effects of Water Deficit on Pollen Development
in Rice
by
Giao Ngoc Nguyen
A thesis submitted in fulfillment of the requirements
for the degree of
DOCTOR OF PHILOSOPHY
Faculty of Agriculture, Food and Natural Resources
The University of Sydney
March 2008
Page 2
STATEMENT OF ORIGINALITY
The research presented in this thesis is the result of my own investigation, except where
acknowledgement is given, and has not previously been submitted for the award of a degree
at any institution.
Giao Ngoc Nguyen
Page 3
ABSTRACT
Rice (Oryza sativa L.) is very susceptible to water deficit at any time during its
life cycle as a semi-aquatic cereal crop. However, the consequential damage is
particularly severe if water deficit occurs during reproductive phases. The conspicuous
injury often observed in rice plants exposed to water stress during meiosis of the pollen
mother cell is the reduction of grain set, which is attributed to the decline of male
fertility. In spite of much research on drought-induced male sterility in rice, the
underlying mechanisms of the problem are poorly understood.
This project was therefore conducted to investigate the molecular mechanisms of
water deficit-induced pollen sterility in rice. In this study three consecutive days of
water deficit treatment at -0.5 MPa osmotic potential during anther development
effectively reduced the leaf water potential (ψleaf) and the number of viable pollen which
later led to a decrease in grain set. Moreover, this thesis demonstrates that the
immediate deleterious effects of water deficit to plant fertility could be estimated using
a young microspore viability index, which showed a strong correlation with mature
viable pollen and grain set. The present work has also illustrated that oxidative stress
appears to be a plausible cause for the decline of male fertility and grain set. Water
deficit has induced the excessive production of reactive oxygen species (ROS) above
the redox balance, which in turn caused detrimental effects to cellular DNA and might
result in programmed cell death (PCD) in the anthers. Moreover, ROS accumulation
effectively influenced ATP synthesis leading to a decrease in the level of ATP in the
anthers. Excessive ROS accumulation after drought could be the consequence of
insufficient activity of the antioxidant system, which has been illustrated by qRT-PCR
expression analysis of major antioxidant genes. Down-regulation of those genes would
increase the incidence of oxidative damage. In contrast, stable or up-regulated
expression of these genes resulted in less oxidative damage.
Page 4
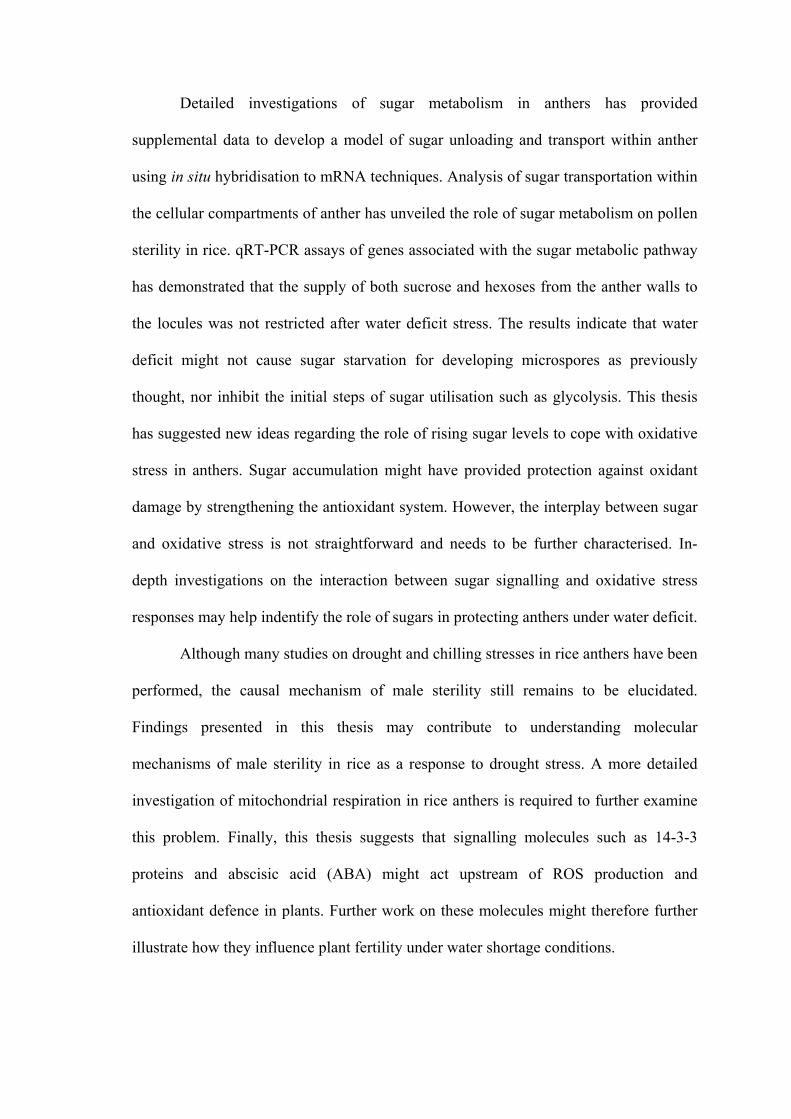
Detailed investigations of sugar metabolism in anthers has provided
supplemental data to develop a model of sugar unloading and transport within anther
using in situ hybridisation to mRNA techniques. Analysis of sugar transportation within
the cellular compartments of anther has unveiled the role of sugar metabolism on pollen
sterility in rice. qRT-PCR assays of genes associated with the sugar metabolic pathway
has demonstrated that the supply of both sucrose and hexoses from the anther walls to
the locules was not restricted after water deficit stress. The results indicate that water
deficit might not cause sugar starvation for developing microspores as previously
thought, nor inhibit the initial steps of sugar utilisation such as glycolysis. This thesis
has suggested new ideas regarding the role of rising sugar levels to cope with oxidative
stress in anthers. Sugar accumulation might have provided protection against oxidant
damage by strengthening the antioxidant system. However, the interplay between sugar
and oxidative stress is not straightforward and needs to be further characterised. In-
depth investigations on the interaction between sugar signalling and oxidative stress
responses may help indentify the role of sugars in protecting anthers under water deficit.
Although many studies on drought and chilling stresses in rice anthers have been
performed, the causal mechanism of male sterility still remains to be elucidated.
Findings presented in this thesis may contribute to understanding molecular
mechanisms of male sterility in rice as a response to drought stress. A more detailed
investigation of mitochondrial respiration in rice anthers is required to further examine
this problem. Finally, this thesis suggests that signalling molecules such as 14-3-3
proteins and abscisic acid (ABA) might act upstream of ROS production and
antioxidant defence in plants. Further work on these molecules might therefore further
illustrate how they influence plant fertility under water shortage conditions.
Page 5
ACKNOWLEDGEMENTS
I would like to express many sincere thanks to my supervisor Professor Bruce Sutton
who has provided me encouragement, enthusiasm, guidance and support during my PhD
research, which has enabled the production of this thesis. I also would like to
acknowledge my associate supervisors: Dr Deborah Hailstones and Dr Meredith
Wilkes. Many thanks go to Dr Deborah Hailstones of the Elizabeth Macarthur
Agricultural Institute for having brought me to a new fabulous area of molecular
biology with modern quantitative RT-PCR techniques. Many thanks also go to Dr
Meredith Wilkes for reminding me of biochemical knowledge, her availability when
needed, endless discussions and helping me to overcome difficulties of written language
while writing this thesis.
I would like to thank Dr Laurence Cantrill of the Children's Hospital at Westmead for
his helpful discussions, assistance with confocal microscopy techniques, and critical
reading Chapters 4 & 5 of this thesis.
Thanks are given to those people listed hereafter, who have assisted me while I was
conducting my PhD research: Dr Mohammad Ezaz Al Mamun for helping with the
preliminary development of research proposal; Dr Zhong-an Li for technical
suggestions on live anther observation; Dr Jane Radford of the Department of
Pathology, Medicine Faculty for helping with the initial set up of rice floret paraffin
embedding; Dr Sanzeev Alfred for technical tips of whole rice floret embedding in
paraffin; Ms Michelle Flack, Ms Aida and Dr Tracey Berg of the Plant Molecular
Biology laboratory, Elizabeth Macarthur Agricultural Institute for helping me with
preliminary inception of quantitative RT-PCR and cloning experiments.
Page 6
I also would like to extend my thanks to the Faculty of Agriculture, Food and Natural
Resources and its members for their invaluable assistance to my research. My gratitude
goes to Ivan Desailly and Jarka Geisler for helping me set up glasshouse experiments,
and helping with purchasing chemicals and equipment. Many thanks are also given to
the Elizabeth Macarthur Agricultural Institute and its members for their kindly
assistance while I conducted molecular biology experiments.
Thanks also go to Professor Robyn Overall for providing me with laboratory space and
confocal microscopy facilities; Professors Lester Burgess and David Guest for allowing
me use of their molecular biology laboratory and fluorescent microscopy; Professor
Ivan Kennedy for allowing me use of microplate reader in his laboratory; Dr Xiaochun
Zhao for providing me with R31 cultivar seed and helpful suggestions on the use of
hydroponic systems.
My deep gratitude is given to the Government of Vietnam for having granted me this
doctoral scholarship sponsored by the Ministry of Education and Training (MOET).
I dedicate this work to my family for their lifetime of love and support. I owe my
deepest gratitude to my parents, my dear mother Nguyen Thi Thanh and my late father
Nguyen Ngoc Linh, for nurturing me and inspiring me to pursue post-secondary
education. Thanks also go to my siblings for their psychological encouragements.
Finally, I wish to thank my beloved wife Ha Phuong Dung, who have continuously
encouraged me and psychologically supported me to overcome the most desperate
moments while completing this PhD programme.
.
Page 7
PUBLICATIONS AND PRESENTATIONS
Giao N. Nguyen, D. Hailstones, M. Wilkes, B. G. Sutton (2007) Water deficit induced
pollen sterility associated with a programmed cell death and oxidative stress in rice anthers.
In 'Proceedings of The 2nd International Conference on Rice for the Future, 5-9 November
2007'. Bangkok, Thailand pp. 202-209.
Giao N. Nguyen, B.G. Sutton (2008) Water deficit reduced fertility of young microspores
resulting in a decline of viable mature pollen and grain set in rice. Journal of Agronomy
and Crop Science. (Accepted subject to revision).
Giao N. Nguyen, D. Hailstones, M. Wilkes, B. G. Sutton (2008) Effects of water deficit to
male reproductive development in rice (Oryza sativa L.). Submitted to Journal of
Agronomy and Crop Science on 18 April 2008.
Giao N. Nguyen, M. Wilkes, D. Hailstones, B. G. Sutton (2008) The effect of water stress
on carbohydrate metabolism in rice anthers. Poster presented to the American Association
of Cereal Chemistry (AACC) International Annual Meeting, September 21 – 24, 2008
(Accepted 26 May 2008).
Page 8
TABLE OF CONTENTS ABBREVIATIONS.......................................................................................................... i
LIST OF FIGURES.......................................................................................................iii
LIST OF TABLES.......................................................................................................... x
CHAPTER 1: REVIEW OF LITERATURE AND AIMS.......................................... 1
1.1. Introduction....................................................................................................... 1
1.2. Studies on male gametophyte development in rice .......................................... 3
1.3. Water stress causes male sterility: sensitive stages and nature of the damage . 8
1.4. Studies on mechanisms of male sterility in rice ............................................. 10
1.4.1. Disturbance of sugar metabolism in anthers........................................... 10
1.4.1.1. Lack of starch in mature pollen and accumulation of sugar ........... 10
1.4.1.2. Activity of relevant metabolic enzymes ......................................... 12
1.4.1.3. Transportation of sugar to sink tissues ........................................... 14
1.4.2. Oxidative stress and programmed cell death .......................................... 17
1.4.2.1 Death terminologies............................................................................ 17
1.4.2.2 Role of PCD during reproductive development ................................. 19
1.4.2.3 Reactive oxygen species (ROS) and antioxidants .............................. 20
1.4.2.4 Relationship between oxidative stress and PCD................................. 23
1.4.2.5 Oxidative stress and pollen sterility.................................................... 24
1.5. Aims of this project......................................................................................... 24
CHAPTER 2: MATERIALS AND GENERAL METHODS ................................... 26
2.1. Plant materials................................................................................................. 26
2.2.1. Soil system for initial trials......................................................................... 26
2.2.2. Hydroponic system ..................................................................................... 27
2.3. Water stress system......................................................................................... 29
2.3.1. Water stress inducer.................................................................................... 29
2.3.2. Plants grown in hydroponic system............................................................ 29
2.3.3. Plants grown in soil system ........................................................................ 30
2.4. Anther sampling.............................................................................................. 31
2.5. RNA extractions ............................................................................................. 33
2.6. Quantitative Reverse Transcription Polymerase Chain Reaction (qRT-PCR)34
2.6.1. Primer design .............................................................................................. 34
2.6.2. cDNA amplication and sequencing analysis .............................................. 34
2.6.3. House keeping gene for standard control and qRT-PCR reaction.............. 35
Page 9
2.6.4. Statistical analysis of raw data.................................................................... 36
2.7. Sample preparation for immunological localization....................................... 39
CHAPTER 3: EFFECTS OF WATER DEFICIT ON MALE FERTILITY IN
RICE .............................................................................................................................. 41
3.1. Introduction..................................................................................................... 41
3.2. Materials and methods .................................................................................... 43
3.2.1. Plant materials and water stress treatment .............................................. 43
3.2.2. Auricle distance scale and timing of stress............................................. 43
3.2.3. Plant water status .................................................................................... 45
3.2.4. Gas exchange analysis ............................................................................ 45
3.2.5. Grain set measurement............................................................................ 45
3.2.6. Mature pollen viability............................................................................ 46
3.2.7. Young microspore viability .................................................................... 46
3.2.8. Statistical analysis................................................................................... 47
3.3. Results............................................................................................................. 47
3.3.1. Influence of PEG on root morphology ................................................... 47
3.3.2. Influence of water deficit on leaf water status........................................ 48
3.3.3. Changes in leaf gas exchange parameters under water deficit stress ..... 49
3.3.4. Water deficit affects grain set ................................................................. 51
3.3.5. Water deficit affects pollen viability and young microspore viability ... 52
3.3.6. Relationship between grain set, pollen viability and microspore viability
under water deficit stress at the PMC stage............................................................ 54
3.3.7. Association of Ψleaf with grain set, pollen viability and microspore
viability under water deficit stress at PMC stage ................................................... 56
3.4. Discussion....................................................................................................... 58
3.4.1. PEG as an ideal osmotic inducer to control levels of water deficit ........ 58
3.4.2. Water deficit stress reduced male fertility .............................................. 62
3.4.3. Association of Ψleaf with reduction of grain set and pollen viability ...... 64
3.5. Conclusion ...................................................................................................... 65
CHAPTER 4: WATER DEFICIT AFFECTS SUGAR METABOLISM IN
ANTHERS ..................................................................................................................... 66
4.1. Introduction..................................................................................................... 66
4.2. Materials and methods .................................................................................... 67
Page 10
4.2.1. Plant materials, water stress treatment and anther collection ................. 67
4.2.2. Carbohydrate extraction and measurement............................................. 68
4.2.2.1. Total soluble sugars ........................................................................ 68
4.2.2.2. Reducing sugars.............................................................................. 68
4.2.2.3. Sucrose and hexoses ....................................................................... 69
4.2.3. RNA extraction and real time qRT-PCR ................................................ 69
4.2.4. In situ hybridisation ................................................................................ 71
4.2.4.1. Maintenance of an RNase free environment................................... 71
4.2.4.2. Paraffin embedded section preparations ......................................... 71
4.2.4.3. Single stranded RNA probes........................................................... 71
4.2.4.4. Hybridisation .................................................................................. 74
4.2.4.5. Immunological detection ................................................................ 76
4.3. Results............................................................................................................. 77
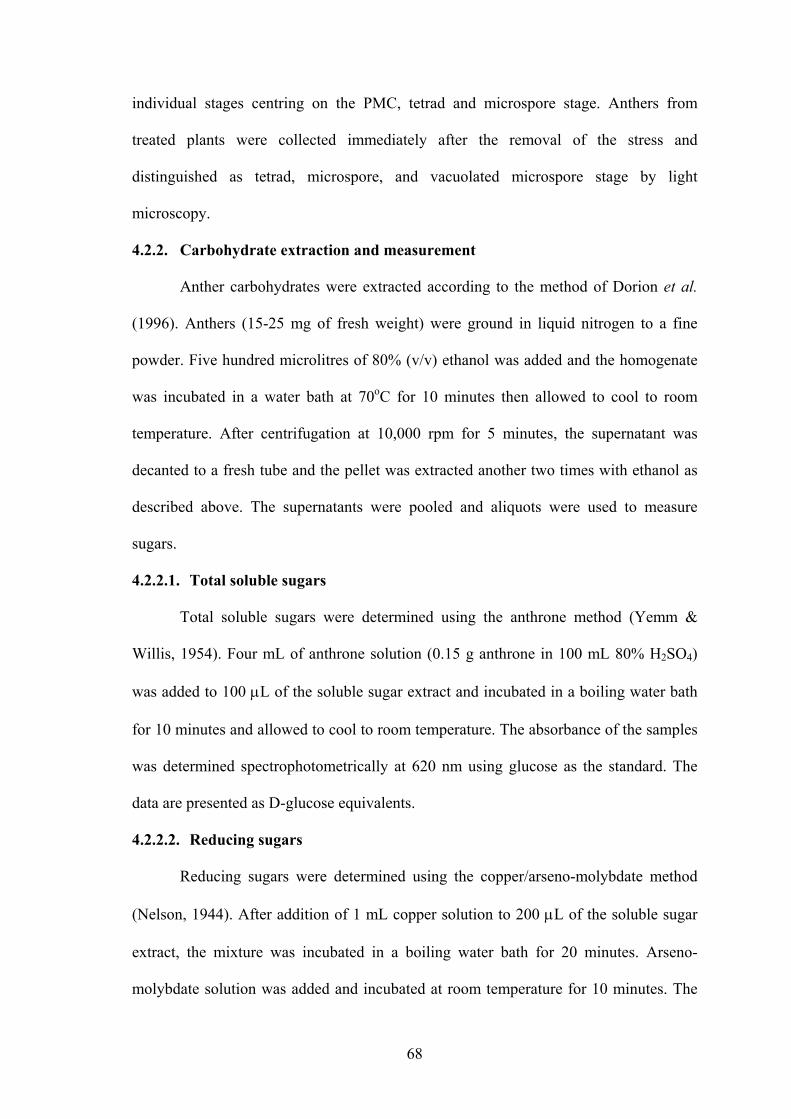
4.3.1. Changes in the level of carbohydrate...................................................... 77
4.3.2. Expression of the cell wall acid invertase gene OsCIN4........................ 81
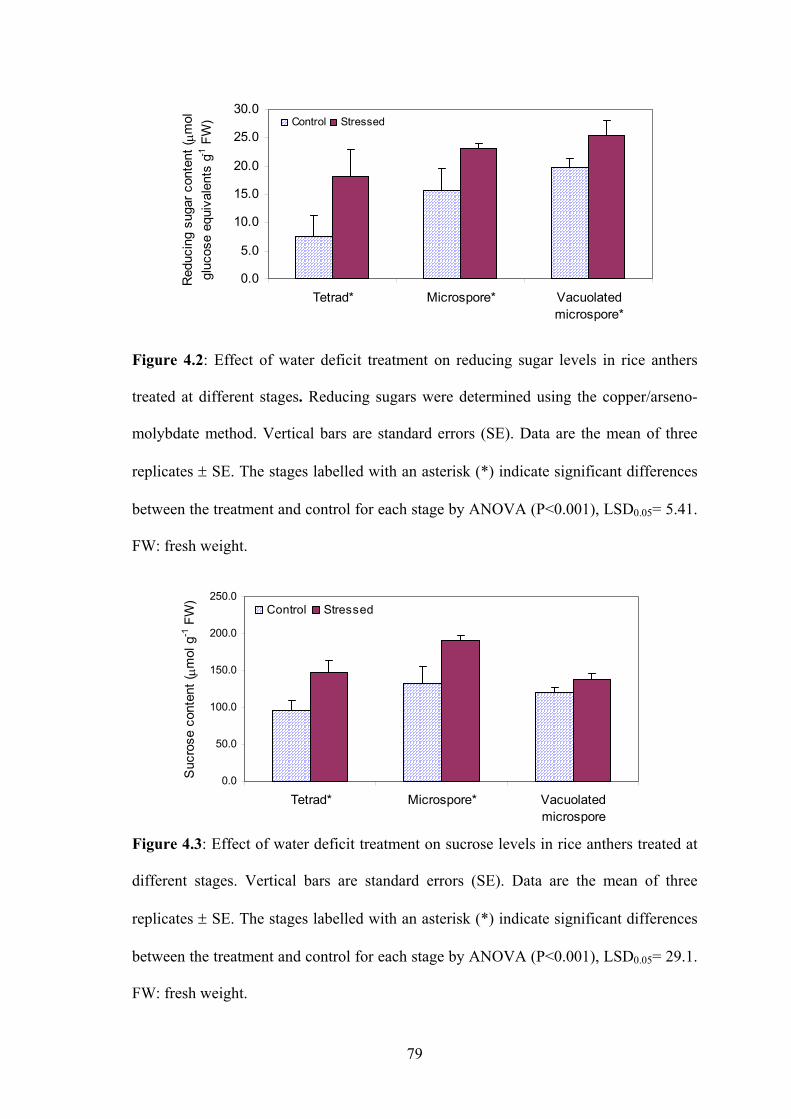
4.3.3. Expression of the sucrose transporter gene OsSUT5.............................. 84
4.3.4. Expression of the monosaccharide transporter gene OsMST7............... 87
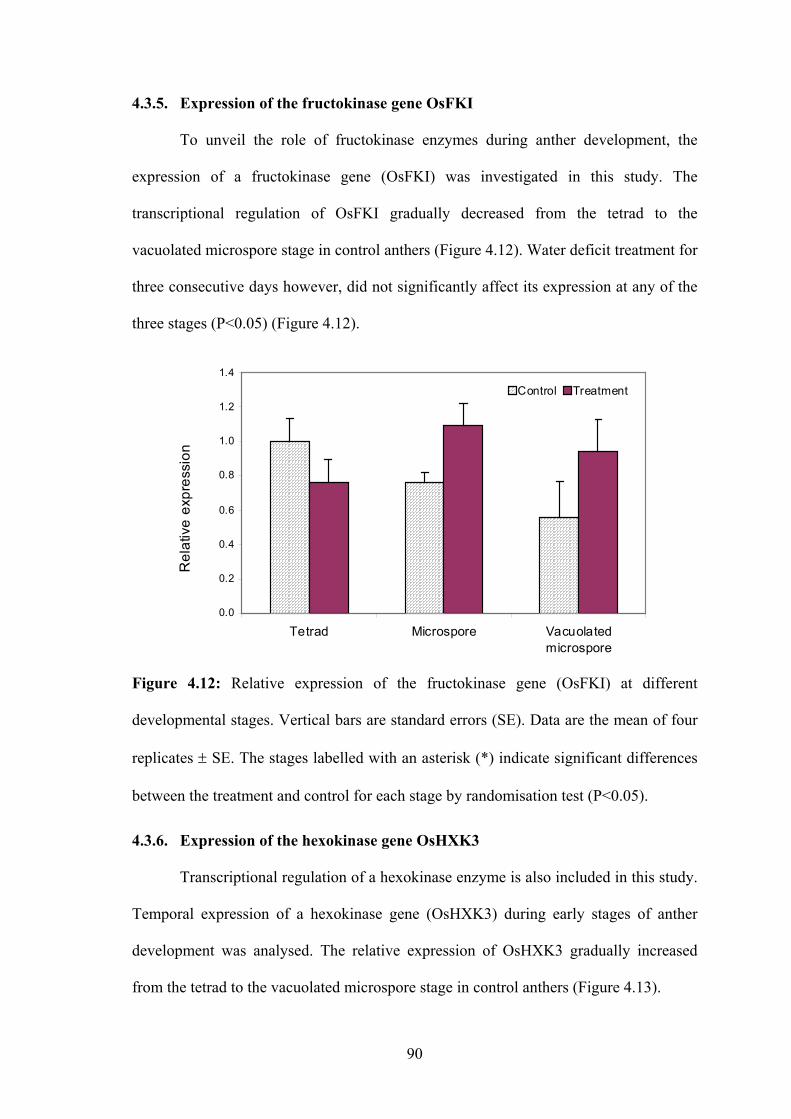
4.3.5. Expression of the fructokinase gene OsFKI ........................................... 90
4.3.6. Expression of the hexokinase gene OsHXK3......................................... 90
4.4. Discussion....................................................................................................... 92
4.4.1. Understanding carbohydrate unloading and transport in anthers ........... 92
4.4.2. Sugar modulated gene expression in anther under drought .................... 98
4.4.3. Association of carbohydrate metabolism with abortion of young
microspores post water stress ............................................................................... 102
4.5. Conclusion .................................................................................................... 105
CHAPTER 5: WATER DEFICIT INDUCED PROGRAMMED CELL
DEATH AND OXIDATIVE STRESS IN RICE ANTHERS.................................. 106
5.1. Introduction................................................................................................... 106
5.2. Materials and methods .................................................................................. 108
5.2.1. Plant materials and water stress treatment ............................................ 108
5.2.2. TdT-mediated dUTP nick-end labelling (TUNEL) assay..................... 108
5.2.3. DNA extraction and electrophoresis to detect DNA fragmentation ..... 109
5.2.4. RNA extraction and real-time qRT-PCR.............................................. 110
Page 11
5.2.5. Adenosine triphosphate (ATP) assay.................................................... 111
5.2.6. Hydrogen peroxide assay...................................................................... 112
5.2.7. Mitochondrial activity staining............................................................. 113
5.2.8. Statistical analysis................................................................................. 113
5.3. Results........................................................................................................... 114
5.3.1. Nuclear DNA degradation caused by water deficit .................................. 114
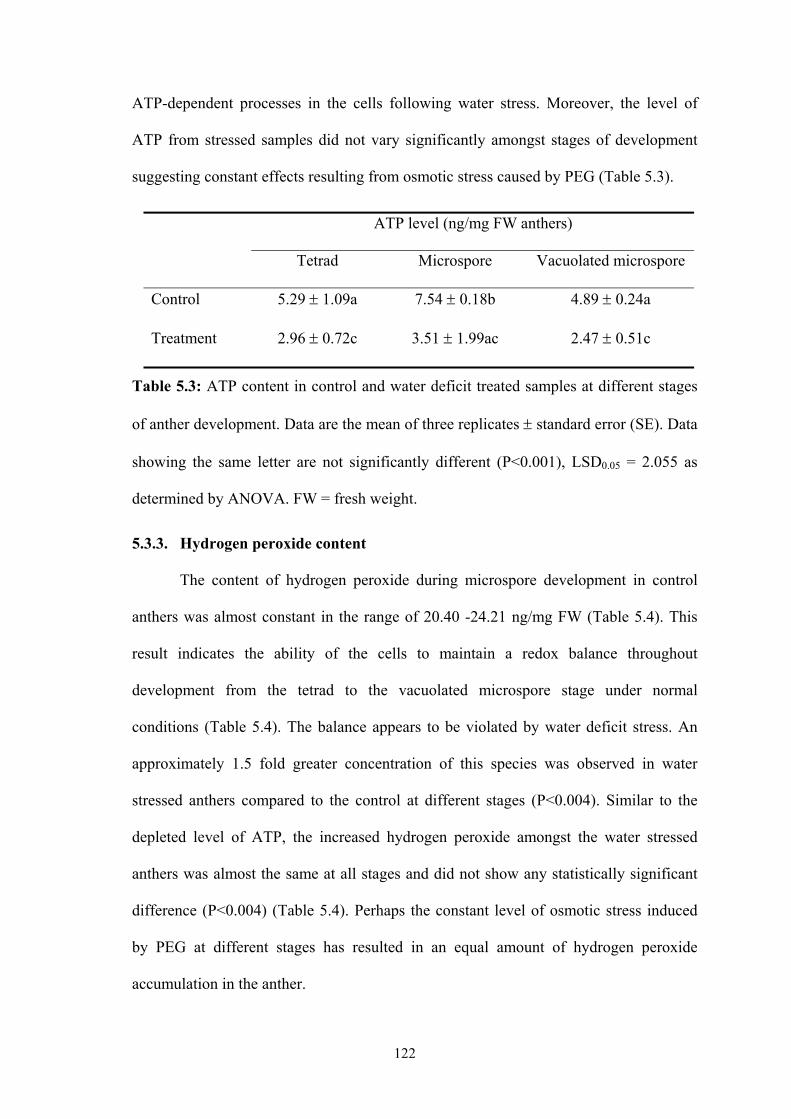
5.3.2. ATP level in rice anthers .......................................................................... 121
5.3.3. Hydrogen peroxide content....................................................................... 122
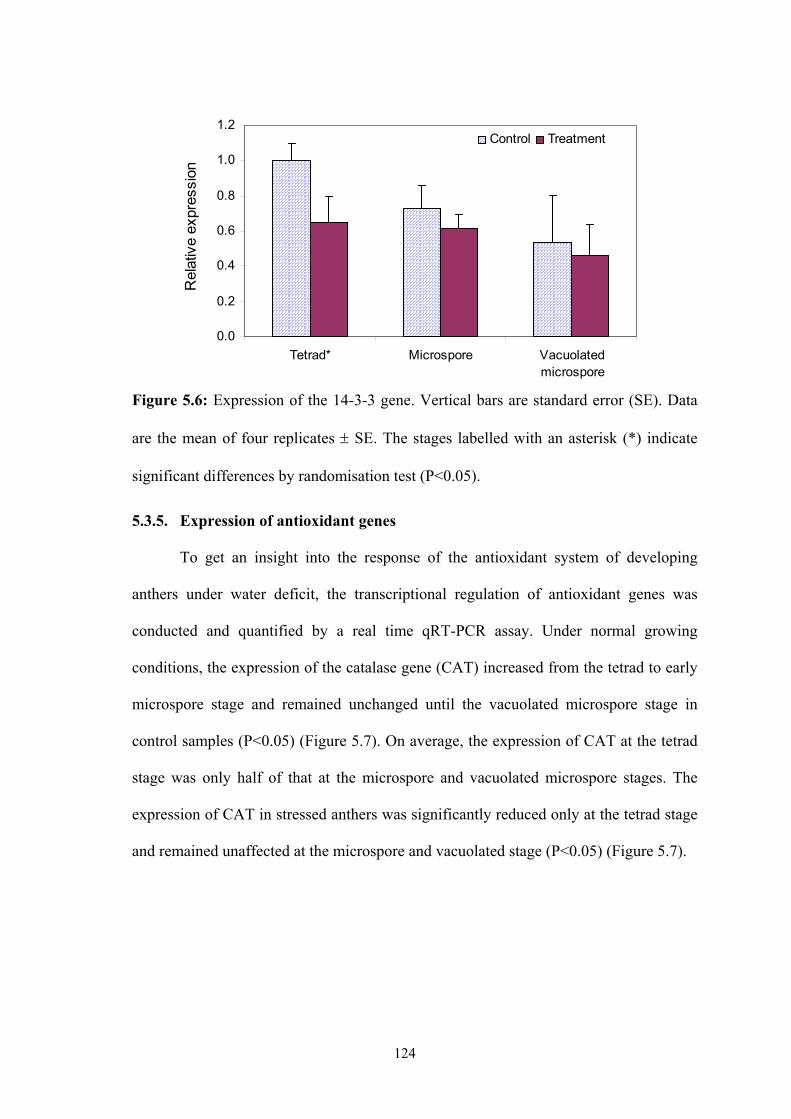
5.3.4. Expression of the 14-3-3 gene .................................................................. 123
5.3.5. Expression of antioxidant genes ............................................................... 124
5.3.6. Mitochondrial activity............................................................................... 127
5.4. Discussion..................................................................................................... 129
5.4.1. Water deficit induced PCD in anthers ...................................................... 129
5.4.2. Molecular and biochemical events associated with PCD ......................... 130
5.4.3. Water deficit induced oxidative stress ...................................................... 132
5.4.4. Role of the tapetal mitochondria............................................................... 134
5.5. Conclusion .................................................................................................... 136
CHAPTER 6: GENERAL DISCUSSION AND CONCLUSIONS ..................... 137
6.1. Introduction................................................................................................... 137
6.2. Young microspore viability as a determinant of grain set ............................ 138
6.3. Molecular mechanism of microspore abortion under drought...................... 138
6.4. Causal relationship between oxidative stress and sugar accumulation......... 140
6.5. Sensitive stages of anther development to water deficit............................... 145
6.6. Involvement of signalling molecules to pollen sterility under drought ........ 145
6.7. Concluding remarks...................................................................................... 147
REFERENCES............................................................................................................ 149
APPENDIX I ............................................................................................................... 173
Page 12
i
ABBREVIATIONS ABA Abscisic acid
AD Auricle distance
ATP Adenosine triphosphate
BSA Bovine serum albumin
cDNA Complementary deoxyribonucleic acid
DEPC Diethylene pyrocarbonate
DIG Digoxigenin
dNTP Deoxyribonucleotide triphosphate
DTT Dithiothreitol
EDTA Ethylenediamine tetraacetic acid
FDA Fluorescein diacetate
MOPS 3-(N-morpholino)propanesulfonic acid
mRNA Messenger ribonucleic acid
MST Monosaccharide transporter
NADP Nicotinamide adenine dinucleotide phosphate
PPT Parts per thousand
PBS Phosphate buffered saline
PCD Programmed cell death
PCR Polymerase chain reaction
PEG Polyethylene glycol
PI Propidium iodide
q RT-PCR Quantitative reverse transcription polymerase chain reaction
Page 13
ii
RT-PCR Reverse transcription polymerase chain reaction
SSC Sodium chloride sodium citrate buffer
SUT Sucrose transporter
TCA Tricarboxylic acid
TE Tris-EDTA
TEM Transmission electron microscopy
t-RNA Transfer ribonucleic acid
TUNEL TdT-mediated dUTP nick-end labelling
Page 14
iii
LIST OF FIGURES Figure 1.1: Morphology of a rice floret. ........................................................................... 3
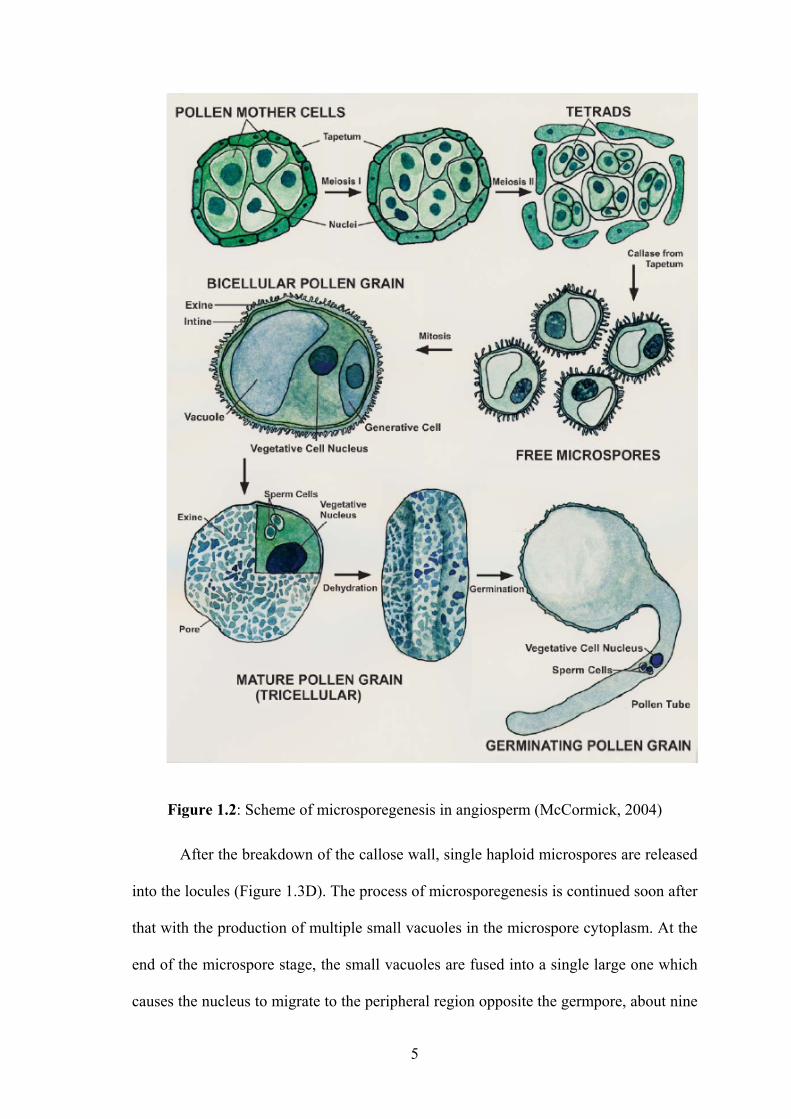
Figure 1.2: Scheme of microsporegenesis in angiosperm (McCormick, 2004) ............... 5
Figure 1.3: TEM images of anther development in rice at different stages. Photographs
kindly provided by Li (2005). ........................................................................ 7
Figure 1.4: Model of phloem unloading of assimilates in the sink cells during
development. ................................................................................................ 16
Figure 2.1: Rice grown using a soil system. A- Plants with roots covered by sock and
dialysis membrane supported by a plastic trainer. The dialysis membrane
and sock was only used when the plants were exposed to water stress using
PEG. B- Plants held upright and grown in plastic boxes. ............................ 28
Figure 2.2: The hydroponic system. ............................................................................... 28
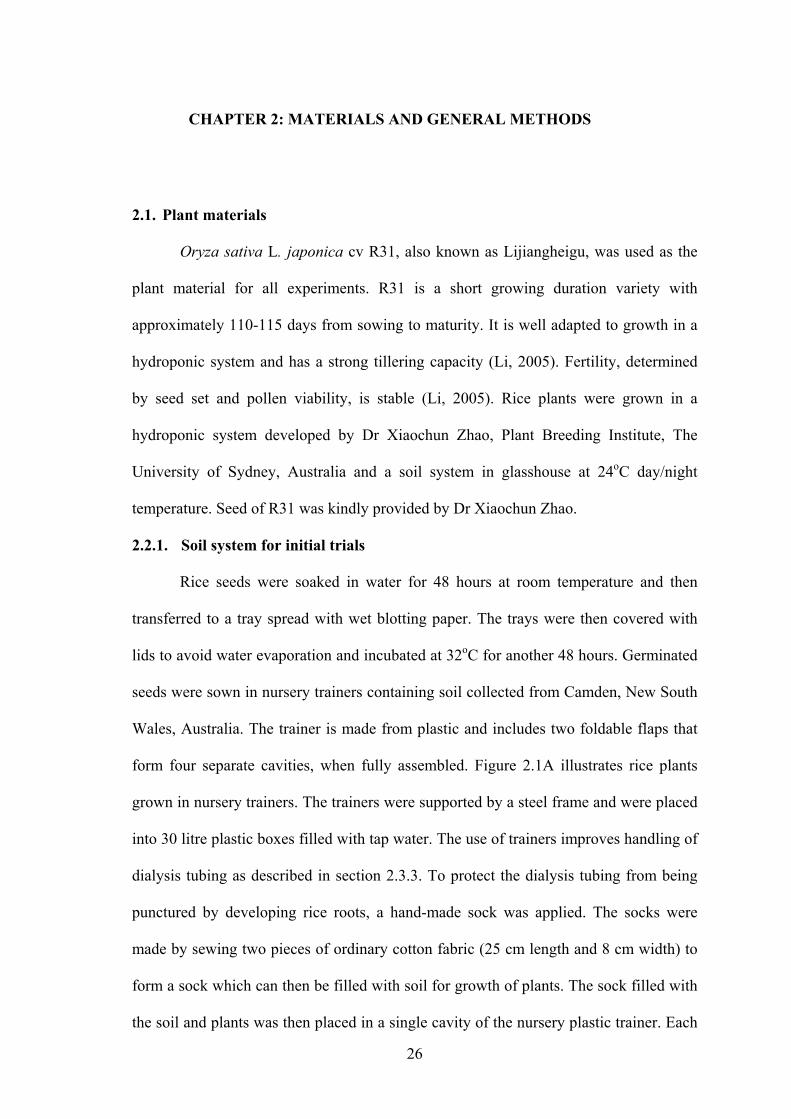
Figure 2.3: Water stress system. A) Rice plants being stressed in PEG solution. B)
Aerating device: air-pump (right) and air-stone (left). ................................ 30
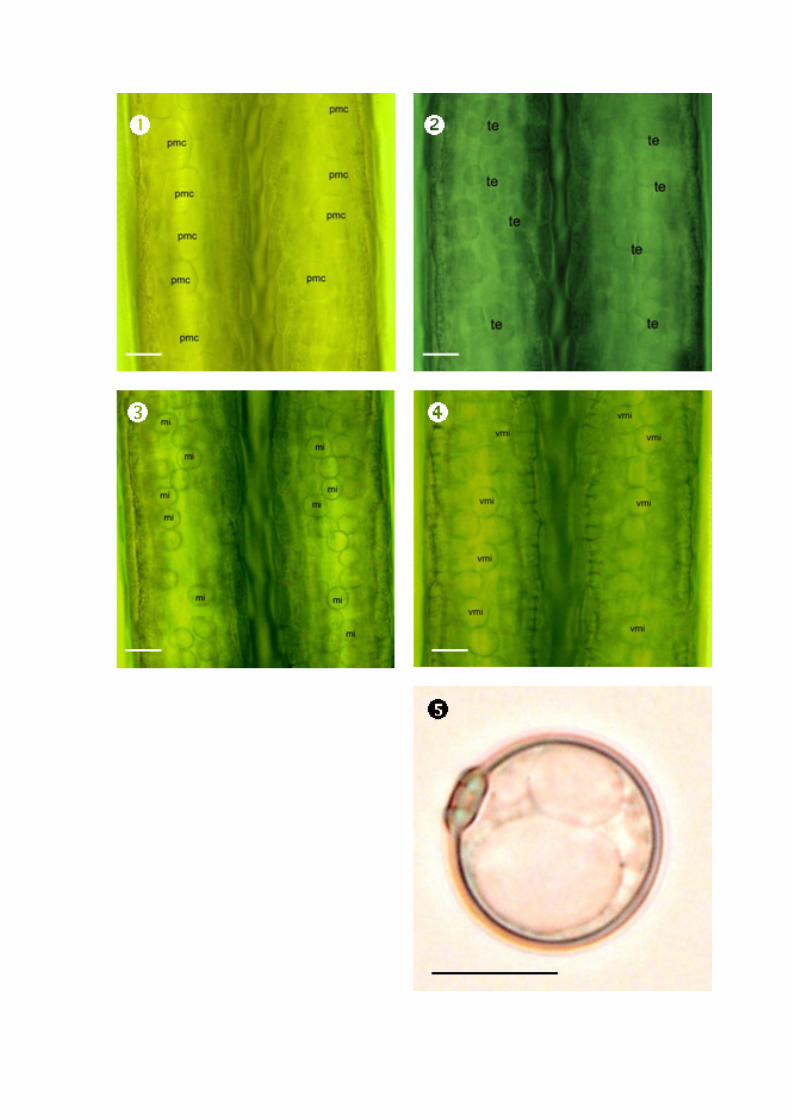
Figure 2.4: Light microscopcic observation of three stages of anther development:
Pollen mother cell stage; Tetrad stage; Microspore stage; &
Vacuolated microspore. pmc pollen mother cell. te tetrad. mi microspore.
vmi vacuolated mcirospore. Scale bars: 20 µm ( ) and 10 µm ( ).32
Figure 2.5: Normalised fluorescence of OsTuba1 at different anther developmental
stages. Channels indicate fluorescence signals of diffrent individual
samples. The red horizontal bar indicates threshold cycle of PCR reactions.
...................................................................................................................... 38
Figure 2.6: Standard curve of OsTuba1 gene generated by Rotor-Gene 2000 software
using two fold dilution of total RNA. R2 is the correlation coefficient of the
curve (0.99125); M is the slope (-2.975); B is the intercept (19.889); E is the
PCR reaction efficiency (1.17). ................................................................... 38
Page 15
iv
Figure 2.7: Paraffin embedded cross section of a normal anther stained with toluidine
blue O (microspore stage). ........................................................................... 34
Figure 3.1: Changes of leaf water potential in rice plants withheld water for four days
during reproductive development (Reproduced from Sheoran & Saini,
1996). ........................................................................................................... 42
Figure 3.2: Auricle distance of rice plants...................................................................... 44
Figure 3.3: Panel (A) Auricle distance scale, and corresponding anther developmental
stage. Stages in the rectangles indicate the time for anther sampling. Panel
(B) Relative stress schemes for seed set measurement of cultivar R31.
Broken arrows indicate the period at which the plant was experiencing
maximum stress. PMC = pollen mother cell................................................ 44
Figure 3.4: Effect of PEG on root morphology of rice plants after three days exposure to
water deficit stress at -0.5MPa. A. Roots before PEG exposure. B. Roots
after PEG exposure. C. Roots of control plants. D. Roots of control plants
after three days. ............................................................................................ 48
Figure 3.5: Pre-dawn leaf water potential (Ψleaf) of rice plants exposed to different water
deficit stress treatments. Water stress treatments were initiated at day zero
and removed at day three. Error bars represent standard error (SE). Data
points labelled with the same letter are not significantly different (P<0.05)
as determined by ANOVA (n=10). WD = water deficit. ns not significant.49
Figure 3.6: Leaf net photosynthesis (A) of rice plants exposed to different water stress
treatment. Water stress treatments were imposed at day zero and removed at
day three. Data are the means of ten replicates with standard errors (SE)
shown by vertical bars. WD = water deficit. ............................................... 50
Figure 3.7: Leaf transpiration rate (E) of rice plants exposed to different water stress
treatments. Water stress treatments were imposed at day zero and removed
at day three. Data are the means of ten replicates with standard errors (SE)
shown by vertical bars. WD = water deficit. ............................................... 51
Page 16
v
Figure 3.8: Leaf stomatal conductance (gs) of rice plants exposed to different water
stress treatment. Water stress treatments were imposed at day zero and
removed at day three. Data are the means of ten replicates with standard
errors (SE) shown by vertical bars. WD = water deficit.............................. 51
Figure 3.9: Grain set (%) of rice plants exposed to different water deficit treatments
during anther development. Data are the mean of five replicates with
standard errors (SE) shown by vertical bars. Bars showing the same letter at
any stage are not significantly different (P<0.001) as determined by
ANOVA (n=5). LSD0.05 = 10.79. PMC = pollen mother cell, VM =
vacuolated microspore. ................................................................................ 52
Figure 3.10: Microscopic observation of mature pollen and young microspores stained
with KI/I2 and FDA/PI, respectively. Control (A) and stressed (B) mature
pollen stained with KI/I2.Unviable pollen is not stained with KI/I2 resulting
in a yellow colour (white arrows) in contrast to viable pollen which is
stained dark blue. Control (C) and stressed (D) young microspres. PI stained
unviable microspores resulting in red fluorescence (white arrows) in
contrast to viable microspores stained by FDA (yellow to green)............... 53
Figure 3.11: Relationship between grain set and pollen viability of rice plants exposed
to water deficit stress during PMC stage. .................................................... 55
Figure 3.12: Relationship between grain set and young microspore viability of rice
plants exposed to water deficit stress during PMC stage............................. 55
Figure 3.13: Relationship between grain set and leaf water potential (Ψleaf) of rice plants
exposed to water deficit stress during PMC stage. ...................................... 56
Figure 3.14: Relationship between percentage viability of pollen and leaf water potential
(Ψleaf) of rice plants exposed to water deficit stress during PMC stage....... 57
Figure 3.15: Relationship between percentage viability of young microspore and leaf
water potential (Ψleaf) of rice plants exposed to water deficit stress during
the PMC stage. ............................................................................................. 57
Page 17
vi
Figure 4.1: Effect of water deficit treatment on total sugar levels in rice anthers treated
at different stages. Total carbohydrate was measured using the anthrone
method. Vertical bars are standard errors (SE). Data are the mean of three
replicates ± SE. The stages labelled with an asterisk (*) indicate significant
differences between the treatment and control for each stage by ANOVA
(P<0.001), LSD0.05= 28.32. FW: fresh weight. ............................................ 78
Figure 4.2: Effect of water deficit treatment on reducing sugar levels in rice anthers
treated at different stages. Reducing sugars were determined using the
copper/arseno-molybdate method. Vertical bars are standard errors (SE).
Data are the mean of three replicates ± SE. The stages labelled with an
asterisk (*) indicate significant differences between the treatment and
control for each stage by ANOVA (P<0.001), LSD0.05= 5.41. FW: fresh
weight........................................................................................................... 79
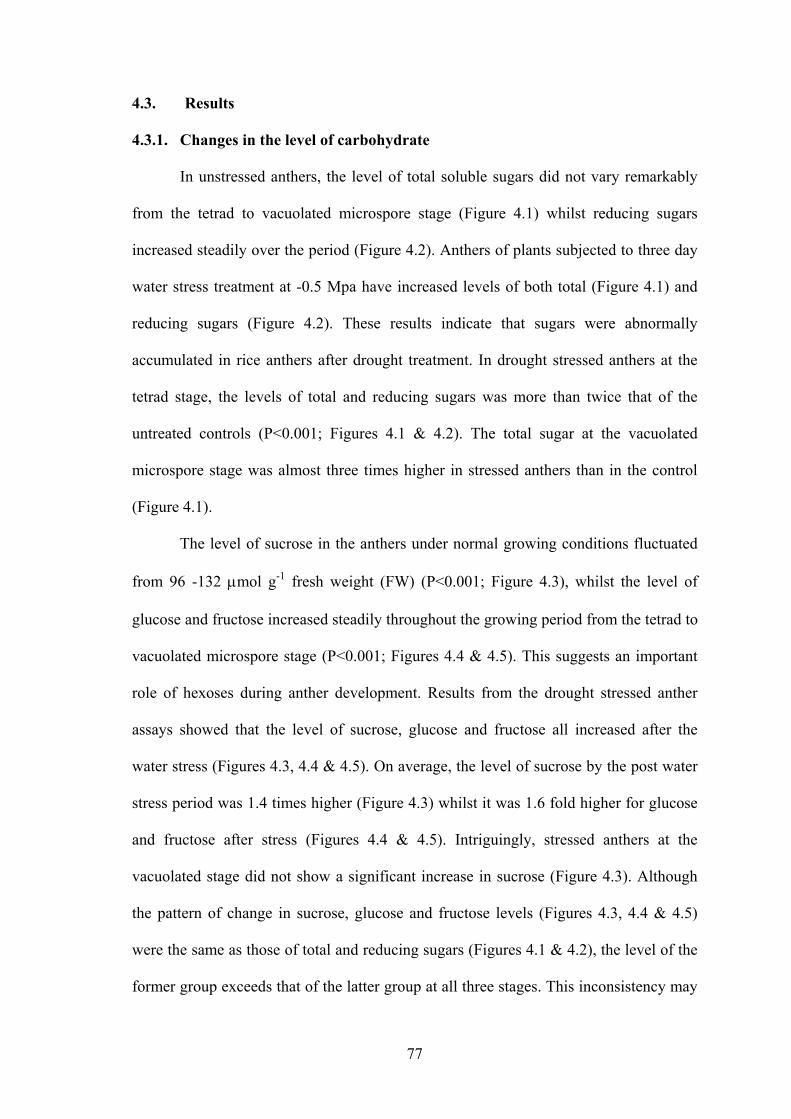
Figure 4.3: Effect of water deficit treatment on sucrose levels in rice anthers treated at
different stages. Vertical bars are standard errors (SE). Data are the mean of
three replicates ± SE. The stages labelled with an asterisk (*) indicate
significant differences between the treatment and control for each stage by
ANOVA (P<0.001), LSD0.05= 29.1. FW: fresh weight. .............................. 79
Figure 4.4: Effect of water deficit treatment on glucose levels in rice anthers treated at
different stages. Vertical bars are standard errors (SE). Data are the mean of
three replicates ± SE. The stages labelled with an asterisk (*) indicate
significant differences between the treatment and control for each stage by
ANOVA (P<0.001), LSD0.05= 8.8. FW: fresh weight. ................................ 80
Figure 4.5: Effect of water deficit treatment on fructose levels in rice anthers treated at
different stages. Vertical bars are standard errors (SE). Data are the mean of
three replicates ± SE. The stages labelled with an asterisk (*) indicate
significant differences between the treatment and control for each stage by
ANOVA (P<0.001), LSD0.05= 10.29. FW: fresh weight. ............................ 80
Figure 4.6: Relative expression of the cell wall acid invertase gene (OsCIN4) at
different developmental stages. Vertical bars are standard errors (SE). Data
Page 18
vii
are the mean of four replicates ± SE. The stages labelled with an asterisk (*)
indicate significant differences between the treatment and control for each
stage by randomisation test (P<0.05)........................................................... 82
Figure 4.7: Localisation of the cell wall acid invertase gene OsCIN4 within transverse
sections of anther by in situ hybridisation. ml middle layer; t tapetum; lo
locule; vb vascular bundle; mi microspore. Scale bars: 20 µm. ................. 83
Figure 4.8: Relative expression of the sucrose transporter gene (OsSUT5) at different
developmental stages. Vertical bars are standard errors (SE). Data are the
mean of four replicates ± SE. The stages labelled with an asterisk (*)
indicate significant differences between the treatment and control for each
stage by randomisation test (P<0.05)........................................................... 84
Figure 4.9: Localisation of the sucrose transporter gene OsSUT5 within anther sections
by in situ hybridisation. ml middle layer; t tapetum; lo locule; vb vascular
bundle. mi microspore. Scale bars: 20 µm................................................... 86
Figure 4.10: Relative expression of the monosaccharide transporter gene (OsMST7) at
different developmental stages. Vertical bars are standard errors (SE). Data
are the mean of four replicates ± SE. The stages labelled with an asterisk (*)
indicate significant differences between the treatment and control for each
stage by randomisation test (P<0.05)........................................................... 87
Figure 4.11: Localisation of the monosaccharide transporter gene OsMST7 within
anther sections by in situ hybridisation. ml middle layer; t tapetum; lo
locule; vb vascular bundle. mi microspore. Scale bars: 20 µm. .................. 89
Figure 4.12: Relative expression of the fructokinase gene (OsFKI) at different
developmental stages. Vertical bars are standard errors (SE). Data are the
mean of four replicates ± SE. The stages labelled with an asterisk (*)
indicate significant differences between the treatment and control for each
stage by randomisation test (P<0.05)........................................................... 90
Figure 4.13: Relative expression of the hexokinase gene (OsHXK3) at different
Page 19
viii
developmental stages. Vertical bars are standard errors (SE). Data are the
mean of four replicates ± SE. The stages labelled with an asterisk (*)
indicate significant differences between the treatment and control for each
stage by randomisation test (P<0.05)........................................................... 91
Figure 4.14: Proposed model of sugar transport at different stages of anther
development. Adapted from Alfred (2006). ................................................ 97
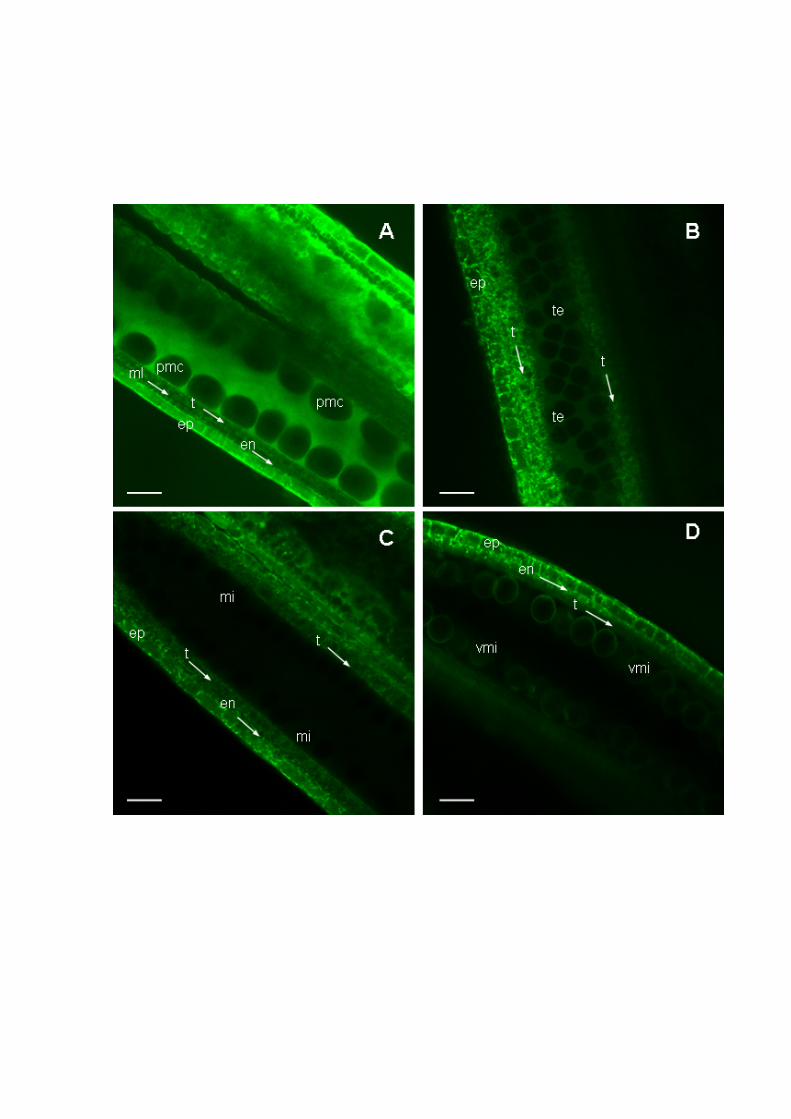
Figure 5.1: In situ fluorescence labelling of DNA cleavage by TUNEL staining in rice
anthers (transverse sections). ..................................................................... 116
Figure 5.2: DNA damage in rice anthers at the tetrad stage. DNA breaks in the nuclei
were detected by TUNEL staining............................................................. 117
Figure 5.3: DNA damage in rice anthers at the microspore stage. DNA breaks in the
nuclei were detected by TUNEL staining. ................................................. 118
Figure 5.4: DNA damage in rice anthers at the vacuolated microspore stage. DNA
breaks in the nuclei were detected by TUNEL staining. ........................... 119
Figure 5.5: Agarose gel analysis of DNA in anthers from control and stressed plants.
Total anther genomic DNA (1 µg) was loaded in each lane and
electrophoresed using a 1% agarose gel stained with ethidium bromide. M
DNA marker 1 kb plus (Invitrogen, Australia); CT control; TM treatment.
.................................................................................................................... 121
Figure 5.6: Expression of the 14-3-3 gene. Vertical bars are standard error (SE). Data
are the mean of four replicates ± SE. The stages labelled with an asterisk (*)
indicate significant differences by randomisation test (P<0.05)................ 124
Figure 5.7: Expression of the catalase gene (CAT). Vertical bars are standard error (SE).
Data are the mean of four replicates ± SE. The stages labelled with an
asterisk (*) indicate significant differences by randomisation test (P<0.05).
.................................................................................................................... 125
Figure 5.8: Expression of the ascorbate peroxidase gene (APX). Vertical bars are
Page 20
ix
standard error (SE). Data are the mean of four replicates ± SE. The stages
labelled with an asterisk (*) indicate significant differences by
randomisation test (P<0.05). ...................................................................... 126
Figure 5.9: Expression of the dehydroascorbate reductase gene (DHAR). Vertical bars
are standard error (SE). Data are the mean of four replicates ± SE. The
stages labelled with an asterisk (*) indicate significant differences by
randomisation test (P<0.05). ...................................................................... 126
Figure 5.10: Rhodamine 123 staining of active mitochondria in normal anthers......... 128
Figure 6.1: Involvement of NADPH in ascorbate – glutathione cycle. Adapted from
Noctor & Foyer (1998). Where: GSH glutathione; GSSG oxidized
glutathione; AA ascorbate; DHA dehydroascorbate; MHDA
monohydroascorbate; GR glutathione reductase; DHAR dehydroascorbate
reductase; MDHAR monodehydroascorbate reductase; APX ascorbate
peroxidase; SOD superoxide dismutase..................................................... 142
Figure 6.2: The role of glucose as building block of ascorbic acid. Adapted from
Wheeler et al. (1998). Enzymes of reactions from 1-9: 1, hexose phosphate
isomerase; 2, phosphomannose isomerase; 3, phosphomannose mutase; 4,
GDP-D-mannose pyrophosphorylase; 5, GDP-D-mannose-3,5-epimerase; 8,
L-galactose dehydrogenase; 9, L-galactono-1,4-lactone dehydrogenase. . 143
Page 21
x
LIST OF TABLES Table 1.1: List of major antioxidant enzymes (Noctor & Foyer, 1998) ......................... 21
Table 3.1: Percentage of young microspore and mature pollen viability of plants under
different levels of water deficit stress during the PMC stage, as determined
by FDA/PI and KI/I2 vital staining, respectively. Data are the mean of five
replicates with standard errors (SE). Data in a column showing the same
letter are not significantly different (P<0.001) as determined by ANOVA. 54
Table 4.1: Target genes for analysis of expression profiles. (*) Primer sequence adapted
from Aoki et al.(2003). F forward primer, R reverse primer....................... 70
Table 4.2: Cycling profiles for real time qRT-PCR reactions. ....................................... 70
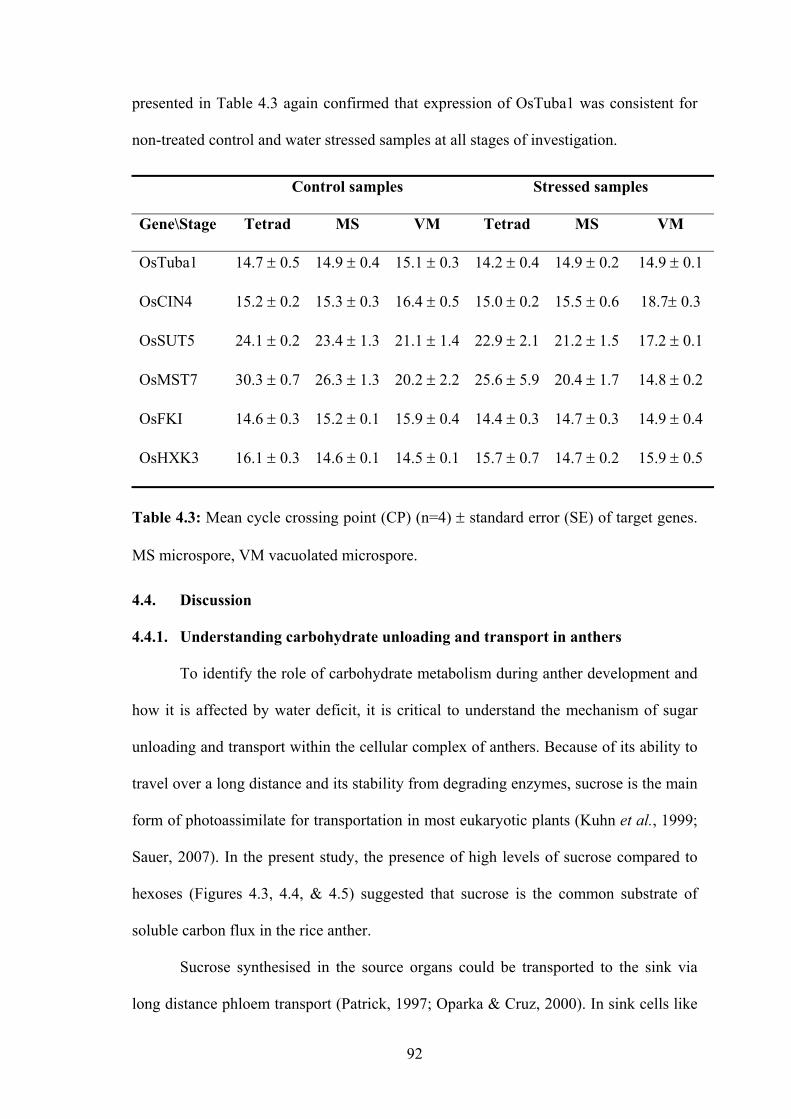
Table 4.3: Mean cycle crossing point (CP) (n=4) ± standard error (SE) of target genes.
MS microspore, VM vacuolated microspore. .............................................. 92
Table 5.1: Target genes for analysis of expression profiles. F forward primer; R reverse
primer. ........................................................................................................ 110
Table 5.2: Cycling profiles for real time qRT-PCR reactions. ..................................... 111
Table 5.3: ATP content in control and water deficit treated samples at different stages of
anther development. Data are the mean of three replicates ± standard error
(SE). Data showing the same letter are not significantly different (P<0.001),
LSD0.05 = 2.055 as determined by ANOVA. FW = fresh weight. ............. 122
Table 5.4: Content of hydrogen peroxide in the control and water treated anthers. Data
are the mean of three replicates ± standard error (SE). Data showing the
same letter are not significantly different (P<0.004), LSD0.05 = 6.9 as
determined by ANOVA. FW = fresh weight. ............................................ 123
Page 22
1
CHAPTER 1: REVIEW OF LITERATURE AND AIMS
1.1. Introduction
Rice (Oryza sativa L.) is one of the most widely adapted crops and is cultivated
on approximately 154 million hectares worldwide, occupying about 11% of the world’s
arable land. The plant is considered the world’s single most important cereal crop
providing food for more than half the world’s population (Khush, 2005), and
constituting over 30% of the calories consumed in Asia (Narciso & Hossain, 2005). Due
to its importance, total global rice production has been increasing steadily from 126
million tons in 1961 to 619 million tons in 2005 through adoption of technical advances
such as modern cultivars, increased investment in irrigation, greater use of fertiliser, and
expansion in areas cultivated (Narciso & Hossain, 2005). The most important constraint
on world rice production is the limited area of irrigated land available, in a context of
increasing global population. According to Mygatt (2006), the world’s irrigated area per
capita has dropped from 48 ha to below 44 ha per 1000 people between the late 1970s
and 2003 respectively. Still, rice production needs to be increased by 40% by 2030 in
order to meet the growing demand (Khush, 2005).
Although rice can be adapted to different growing ecosystems such as irrigated
land, rainfed lowland, upland and flood prone land (Khush, 1984), as a semi-aquatic
plant the most productive growth of rice requires abundant water supplies compared to
other cereal crops. Bhuiyan (1992) calculated that the amount of water required to
produce 1 kg of rice is significantly larger than for other cereal crops. Productivity of
rice in terms of water input is only 0.3-0.7 g of rice per kg of water while this parameter
is 0.8-1.6 g for wheat and 1.6-3.9 g for corn, respectively (Tuong, 1999). Despite the
strong requirement of non-flooded rice cultural practices for the industry, research on
the production of rice under non-flooded conditions conducted by several investigators
Page 23
2
showed a large decrease in grain yield as a result of reduction of grain bearing panicles,
increased floret sterility and lower individual grain mass (Blackwell et al., 1985;
Muirhead et al., 1989; Vories et al., 2002). Among factors limiting rice yield, drought is
considered one of the main constraints in rainfed and poorly irrigated areas (O'Toole &
Chang, 1979). There are at least 23 million ha of drought-prone rice growing land
occupying 20% of the total rice production area in Asia (Pandey et al., 2007). It is
estimated that drought can cause a rice annual yield loss of up to 18 million metric tons
which can have a value of $US3,600 million (Widawsky & O'Toole, 1990; Evenson et
al., 1996).
Of the strategies to improve rice production in drought prone areas, breeding for
tolerant or resistant varieties is the most promising. However, progress in breeding for
drought tolerant cultivars has been reported to be slow for a number of reasons.
Problems include difficulty in precisely defining the target environment, complex
interactions of drought tolerance with the environment, and a lack of appropriate,
systematic screening methods of rice germplasm (Cooper et al., 1999; Wade et al.,
1999). Moreover, genetic characterisations of drought tolerance are difficult as
resistance is a complicated trait often consisting of different physiological and
biological processes at different cellular levels and stages of plant development
(Tripathy et al., 2000). This combined with a lack of knowledge of the genetic basis and
mechanism of drought resistance in real field conditions, especially at reproductive
stages, restricts progress in breeding for drought tolerant varieties (Yue et al., 2005;
2006). In addition, the drought damage depends not only on the level of water deficit
but also on the timing of the stress. Loss of grain is particularly more serious if drought
occurs during reproductive development which usually determines grain yield (Saini &
Westgate, 2000; Pantuwan et al., 2002). Thus, strategic breeding criteria for drought
Page 24
3
resistance at reproductive stages are crucially important (Yue et al., 2006). Although
some factors conferring greater drought tolerance in regards to pollen viability have
been identified, the actual underlying mechanism of water stress damage remains poorly
understood to some extent. This chapter will therefore outline the current knowledge of
abiotic stress-induced pollen abortion in this context, with emphasis on water stress
induced sterility in rice.
1.2. Studies on male gametophyte development in rice
The rice inflorescence, or panicle, usually consists of the rachis, rachilla,
primary, secondary or tertiary branches, pedicel, and florets (Takeoka et al., 1992). The
rice floret has six distinct stamens as the male organ of the flower (Figure 1.1).
Figure 1.1: Morphology of a rice floret.
(Adapted from http://www.gramene.org/species/oryza/rice_illustrations.html#sativapan)
Page 25
4
Male gametophytes form within the reproductive floral organ, the stamen. Each
stamen has two morphologically distinct parts: a stalk-like filament and the anther that
is situated on the top of the filament. The filament is tube-like and consists largely of
vascular tissue that bears the stamen to the flower and serves as a conduit for the
movement of water and nutrients. Male sporogenous cells enveloped in the anther
differentiate and undergo meiosis to produce microspores, which develop further to
pollen grains, while other cell types contribute to pollen maturation, protection, or
release (Scott et al., 2004). There have been several excellent reviews of male
gametophyte development of angiosperms in the past (Mascarenhas, 1989; Goldberg et
al., 1993; McCormick, 1993). Figure 1.2 illustrates a schematic of typical
microsporegenesis of most angiosperms (McCormick, 2004).
Numerous studies on male gametophyte development in rice have also been
published (Raghavan, 1988; Wada et al., 1990; 1992; Li, 2005; Mamun et al., 2005b,
a). An ultrastructural study of normal anthers at different stages of development is
shown in Figure 1.3. Like other species, pollen development in rice occurs within the
locules of the anther. At the pre-meiotic stage, the sporogenous cells are large,
containing cytoplasm with some scattered organelles. Sporogenous cells are
interconnected by plasmodestamal connections (Mamun et al., 2005a). At the start of
meiosis, the sporogenous cells are surrounded by a special callose wall (β-1, 3 glucan)
and then differentiate into pollen mother cells (Figure 1.3B) (Li, 2005). No
plasmodesmatal connection is observed between the meiocytes or meiocytes and the
tapetum layer (Mamun et al., 2005b). The pollen mother cells separate from each other
and undergo two distinct episodes of meiotic division to produce haploid meiocytes, the
dyads, after the first meiosis and the tetrads after the second meiosis. The newly formed
tetrads are enveloped by a callose wall (Figure 1.3C) (Li, 2005; Mamun et al., 2005b).
Page 26
5
Figure 1.2: Scheme of microsporegenesis in angiosperm (McCormick, 2004)
After the breakdown of the callose wall, single haploid microspores are released
into the locules (Figure 1.3D). The process of microsporegenesis is continued soon after
that with the production of multiple small vacuoles in the microspore cytoplasm. At the
end of the microspore stage, the small vacuoles are fused into a single large one which
causes the nucleus to migrate to the peripheral region opposite the germpore, about nine
Page 27
6
days before anthesis (Figure 1.3E) (Li, 2005). These uninucleate microspores undergo
the first mitotic division resulting in binucleate cells known as pollen. Pollen contains
two types of cells: the vegetative and generative cells (Figure 1.3F) (Li, 2005). Before
pollen is shed from the plants, the generative cell undergoes a second mitosis to form
two sperm cells. Starch granules start to increase rapidly in the cytoplasm of the
vegetative cell about five days before anthesis (Wada et al., 1992; Li, 2005). As pollen
grains enlarge, the central vacuole decreases in size and starch deposition increases
further. At anthesis, the starch granules mainly localize near the germpore (Wada et al.,
1992; Li, 2005). This starch is an important source of energy for pollen germination and
pollen tube growth during pollination.
Concurrent with the development of pollen, anther walls also evolve. Normally,
a rice anther consists of four microsporangia, which are seen as four circular lobes in
transverse sections and are linked by connective tissue. Each anther lobe differentiates
into four distinct layers: epidermis, endothecium, middle layer and the tapetum with
sporogenous cells at the centre of the lobe (Figure 1.3) (Li, 2005; Mamun et al., 2005a,
b). Different layers of the anther perform different functions during pollen development.
The epidermis is the outermost layer of the anther and is composed of highly vacuolated
and quadrate cells with peripheral cytoplasm. The cuticle coating the outer wall of the
anther epidermis is a protective layer to prevent water loss during anther development
(Goldberg et al., 1993; Mamun et al., 2005b). The endothecium underlying the
epidermis has been considered as a supportive layer for the development of
sporogenous cells and may play a role in pollen dehiscence (Bonner & Dickinson, 1989;
Pacini, 1994; Matsui et al., 1999). In addition, it has also been suggested as a storage
organ which controls the level of sugars being transported to the developing meiocytes
(Clement & Audran, 1995).
Page 28
7
Figure 1.3: TEM images of anther development in rice at different stages. Photographs
kindly provided by Li (2005).
A- Transverse section of a typical anther (microspore stage).
B- Pollen mother cell stage.
C- Tetrad stage.
D- Early microspore stage.
E- Vacuolated microspore stage.
F- Binucleate stage.
ll large lobes; sl small lobes; ct connective tissue; st stomia; ep epidermis; en
endothecium; ml middle layer; t tapetum; lo locule containing sporogenous cells; bs
bundle sheath; vb vascular bundle. x xylem elements; ste sieve tube element. cw callose
wall; pmc pollen mother cell; te tetrad; mi microspore.
Page 30
8
The middle layer is the inner layer to the endothecium. During anther
development, the middle layer may serve as an ordinary structure to support the anther
walls (Goldberg et al., 1993) or may be involved in sugar unloading (Li, 2005). The
tapetum is the layer situated between the somatic cells and sporogenous cells (Mamun
et al., 2005a). This tissue envelops the pollen sac at the onset of anther development,
self degenerates during the later phase, and does not exist as a systematised organ in
mature anthers (Esau, 1977). The distinct role of the tapetum during anther development
has been well documented in the literature. It is generally considered as a nourishing
layer which provides nutrients and structural components for developing microspores
(Pacini et al., 1985; Pacini, 1990; Piffanelli & Murphy, 1998). All nutrients required for
the pollen mother cell and developing microspore must pass through this specialised
secretory layer. Also, the tapetum secretes 1,3-β-glucanase to break down the callose
wall, facilitating the release of young microspores into the locule and synthesizes
precursors such as sporopollenin and pollen coat (Pacini, 1994; Piffanelli et al., 1998).
Frequently, organelles like mitochondria have been seen with increasing numbers in the
tapetum during anther development, implying a role of supplying nutrition to
developing microspores (Mamun et al., 2005b).
1.3. Water stress causes male sterility: sensitive stages and nature of the damage
Water deficit occurring during reproduction results in a decline of grain yield in
rice (O'Toole & Moya, 1981). The nature of the damage is dependent on the degree,
duration and the particular stages that stress occurred (O'Toole & Moya, 1981). The
physical and molecular effects of drought stress on the reproductive development of
cereal crops in general and rice in particular have been reviewed intensively in the past
(Saini, 1997; Saini & Lalonde, 1998; Saini & Westgate, 2000; Barnabas et al., 2008 and
references cited therein). Two stages of high sensitivity to water deficit have been well
documented in the literature. The first vulnerable stage to water deficit centres on anther
Page 31
9
meiosis, while the second one is during anthesis or flowering of rice plants (Saini &
Westgate, 2000).
The obvious damage often observed in rice plants exposed to water stress during
meiosis of the pollen mother cell is the decline of the grain set and number of engorged
pollen, which are similar to symptoms for rice under chilling stress. The decrease in the
number of engorged pollen has been regarded as the main cause for sterility of rice
plants if chilling occurs during the microspore stage (Nishiyama, 1983; Heenan, 1984;
Matsuo et al., 1995). The reduction in the number of engorged pollen could be
attributed to several factors such as failure of young microspores to differentiate
(Satake, 1991), the decline in the number of dehisced anthers (Sawada, 1978), and the
repression of anther development (Nishiyama, 1984). Consequently, the reduction in the
number of pollen grains will result in a decrease in the number of available pollen
grains falling on stigma, ultimately leading to unsuccessful or poor pollination
(Nishiyama, 1984). Gunawardena et al. (2003) have concluded that 830 engorged
pollen grains per anther are generally required to maintain levels of sterility less than
10% if chilling occured during the microspore stage.
Likewise drought stress has been reported to induce adverse effects on male
gametophyte development resulting in a reduction in the number of viable pollen in rice
(Namuco & O'Toole, 1986; Sheoran & Saini, 1996). The similarities between the
responses of rice, wheat and other crops during reproductive stages to water deficit have
been well documented (Sheoran & Saini, 1996). Experiments on wheat have confirmed
that the critical drought sensitive stage is during the period from meiosis to tetrad
breakup in anthers (Bingham, 1966; Saini & Aspinall, 1981; Dembinska et al., 1992).
Interestingly, while anthers suffer a serious fertility loss, female fertility is not affected
at the same stress level and only starts to deteriorate under much more severe stress
(Saini & Aspinall, 1981). Rice plants subjected to water deficit during anthesis decrease
Page 32
10
grain yield as a result of failure in full panicle exsertion, delayed flowering, spikelet
desiccation, inhibition of spikelet opening and fertilisation (O'Toole & Namuco, 1983;
Cruz & O'Toole, 1984; Ekanayake et al., 1989).
Although pollen abortion of cereals caused by environmental stresses such as
drought has been the subject of numerous studies and attempts have been made to
describe the cellular and metabolic processes associated with this event (Saini &
Westgate, 2000; Barnabas et al., 2008), the primary trigger for this fertility reduction
remains to be identified. In the following sections mechanisms that have been suggested
to be the causes of pollen failure in rice will be discussed.
1.4. Studies on mechanisms of male sterility in rice
1.4.1. Disturbance of sugar metabolism in anthers
1.4.1.1. Lack of starch in mature pollen and accumulation of sugar
During reproductive development, starch is reserved as a temporary source of
sugar in anthers to provide energy for microspore develoment (Bhandari, 1984). Starch
is considered a major source of the energy required for pollen development, pollination,
and pollen tube growth (Pacini & Franchi, 1988; Clement et al., 1994). Generally,
sterile pollen grains of cereals, such as wheat, have been shown to contain no starch
granules (Saini & Aspinall, 1981; Saini et al., 1984). Due to this important role, the
starch content in mature pollen has been used as a measure to assess pollen viability in
rice (Gunawardena et al., 2003). Two main phases have been reported to be involved
with changes to starch levels in anthers of Lilium (Clement et al., 1994; Castro &
Clement, 2007). The first phase is from anther meiosis to the vacuolated microspore
stage. Starch is mainly located in the anther walls and decreases gradually during this
phase. This degradation of starch is assumed to provide energy for developing
microspores (Clement et al., 1994). The second phase is from the late vacuolated stage
to pollen maturation. This phase is characterised by intensive starch deposition in pollen
Page 33
11
grains (Clement et al., 1994; Castro & Clement, 2007). Spatially, starch of wheat
anthers has been shown to be deposited in anther walls during meiosis, disappearing and
deposited again in the mature pollen (Saini et al., 1984). Likewise, deposition of starch
in rice anthers was mainly found in the anther walls from the pollen mother cell to the
later vacuolated stage (Li, 2005). Moreover, starch levels have been shown to first
decline from meiosis to the microspore stage and then steadily increase from pollen
mitosis until maturation in rice and wheat anthers (Dorion et al., 1996; Sheoran & Saini,
1996). These observations suggest that starch is perhaps stored mainly in the anther
walls at early stages as a reserve material for pollen development, while its deposition in
pollen grains at maturation is to provide energy for pollen germination and pollen tube
growth in rice as well as other cereals.
A common feature of stress-induced sterile mature pollen is a lack of starch
granules, in contrast to the number of starch granules observed in fertile pollen. Starch
levels have been shown to be reduced in pollen from rice and wheat plants exposed to
drought stress (Saini & Aspinall, 1981; Dorion et al., 1996; Sheoran & Saini, 1996;
Lalonde et al., 1997a) and chilling stress (Gunawardena et al., 2003; Imin et al., 2004;
Oliver et al., 2005). Dorion et al. (1996) measured the starch content in wheat anthers
after water stress and also determined that there was approximately 30% less starch than
the controls at anthesis. Similarly, Sheoran & Saini (1996) demonstrated that mature
pollen from rice plants subjected to water stress at meiotic stages had low levels of
starch, and the stressed anthers contained only about half the amount of starch as normal
anthers at pollen maturity. Likewise, a 70% reduction in anther starch content at
anthesis has been reported in rice plants chilled for four days at meiosis (Ito, 1978). As
discussed above, the second starch depostion in the anther is mainly in mature pollen.
These observations suggest that both chilling and drought stress have resulted in mature
pollen with lower levels of starch content, indicating less viability.
Page 34
12
Concomitant with the lack of starch deposition in mature pollen, stressed anthers
from identical plants show an abnormal accumulation of sugars. Earlier studies clearly
demonstrated that water deficit stress at the meiotic stage resulted in an accumulation of
non-reducing sugars in wheat and rice anthers (Dorion et al., 1996; Sheoran & Saini,
1996). Dorion et al. (1996) reported that sucrose levels in wheat anthers from plants
subjected to water deficit for four days at the meiotic stage, increased by 32% compared
to the controls during the treatment period. Likewise, levels of non-reducing sugars in
water stressed rice anthers were twice as great as the controls (Sheoran & Saini, 1996).
This abnormal accumulation of sugar probably preludes disturbance of sugar
metabolism in anthers under stress.
1.4.1.2. Activity of relevant metabolic enzymes
Paradoxically, while stressed mature pollen lacks starch to supply energy for
further developmental processes, the sugar precursors involved in starch synthesis
appear to increase under stress (Dorion et al., 1996; Sheoran & Saini, 1996). This
phenomenon suggests that downstream pathways of sugar utilisation may have been
disrupted. Division of carbon into starch reservoirs in plant tissues depends on
photosynthate supply as well as its requirement (Preiss, 1982). The reduction of starch
in water stressed pollen as discussed above could, therefore, be attributed either to
insufficient assimilate during this intensive reserve period or to a direct deterioration or
down regulation of enzymes in the pathway leading to starch synthesis (Dorion et al.,
1996; Sheoran & Saini, 1996). Indeed, decreased activity of starch synthetic enzymes
such as ADP-glucose pyrophosphorylase and soluble starch synthase might result in
poor starch deposition in mature pollen of drought stressed rice (Sheoran & Saini,
1996). However, this was not the case for drought stressed wheat (Dorion et al., 1996).
Of the other enzymes involved in the downstream sugar utilisation pathways,
invertase enzymes are the most interesting. Cleavage of sucrose in plants can be
Page 35
13
catalysed by either invertase or sucrose synthase (Sturm & Tang, 1999). Sucrose
synthase (EC 2.4.1.13) reversibly hydrolyses sucrose into glucose and fructose
(Copeland, 1990). Coupled with sucrose synthases, invertases (β-D-fructofuranosidase)
(EC. 3.2.1.26) play a crucial role in maintaining the sucrose concentration in sink
organs (Sturm & Tang, 1999). Invertase catalyses irreversible cleavage of sucrose into
glucose and fructose, an initial step in sucrose metabolism pathways (Sturm, 1999).
Nevertheless, the domination of invertases over sucrose synthase during anther
development has been illustrated in several reports (Dorion et al., 1996; Sheoran &
Saini, 1996). In higher plants, invertases are classified into several types on the basis of
their biochemical characteristics such as pH optima, solubility and cellular location
(Tymowska-Lalanne & Kreis, 1998). Three main classes of invertase are generally
accepted to exist in plants: the soluble acid invertase located in the vacuole sometimes
called vacuolar invertase, the insoluble acid invertase localised in the cell wall, which
has been known by different names such as cell wall or extracellular or apoplastic acid
invertase, and the alkaline soluble invertase or neutral invertase present in the cytoplasm
(Tymowska-Lalanne & Kreis, 1998). Environmental stresses have been shown to affect
activity of invertases in anthers, which was associated with rising levels of sugars and
pollen abortion in cereal plants (Dorion et al., 1996; Sheoran & Saini, 1996; Koonjul et
al., 2005; Oliver et al., 2005). Decreased activity of acid invertases is predicted to block
the supply of hexoses to developing pollen, which later results in male sterility (Koonjul
et al., 2005; Oliver et al., 2005). The transcriptional regulation of acid invertase genes
during pollen development has been first demonstrated using genetic engineering
technology. Goetz et al.(2001) found that antisense inhibition of a cell wall invertase
gene Nin88, which is specifically expressed in the anther tapetum and developing
pollen, resulted in male sterility in tobacco. Likewise, the repression of expression of
vacuolar and cell wall invertase genes in pollen has been claimed to be associated with
Page 36
14
pollen abortion in drought stressed wheat (Koonjul et al., 2005). Similarly, down
regulation of an anther specific cell wall invertase gene, OsINV4, in the tapetum has
been shown to result in disruption of hexose supply to developing pollen and caused
their death (Oliver et al., 2005). However, the causal relationship between sugars and
their associated metabolic enzymes needs to be carefully assessed in a specific context
as sugars can modulate gene expression and hence their translated protein (Koch, 1996;
Roitsch, 1999; Smeekens, 2000).
1.4.1.3. Transportation of sugar to sink tissues
Whilst glucose is the dominant transport sugar in animals, sucrose is the major
substrate of phloem sap in plants due to its non-reducing characteristics that help it
avoid reactions with proteins and other compounds (Lambers et al., 1998a). Sucrose
synthesised in the mesophyll cells of the source leaves is initially loaded into the sieve
element (SE) - companion cell (CC) complex (phloem loading) either by
plasmodesmatal connections (symplastically) or by active sucrose carriers
(apoplastically) and then it is translocated to other tissues of the plants via long distance
transport (phloem transport) (Lalonde et al., 2003). In sink tissues, transported sucrose
can be unloaded either symplastically or apoplastically depending on the sink type.
Several sink cells employ symplastic connections to the phloem to allow direct
importation of sucrose and other assimilates (Oparka & Gates, 1981; Patrick & Offler,
1995; Imlau et al., 1999), whilst in others both symplastic and apoplastic pathways are
active concomitantly (Clement & Audran, 1995; Wu et al., 2004). Ladone (2003)
proposed a model of sugar unloading in the sink tissue, in which sucrose could be
discharged from the SE - CC complex either symplastically or apoplastically (Figure
1.4). In the case of rice anthers, the pollen mother cell has been shown to be
symplastically isolated after meiosis and the formation of the callose wall (Li, 2005;
Mamun et al., 2005b). Therefore the exportation of sucrose into the locules and
Page 37
15
developing microspores might require active transporters. The sucrose can be exported
directly to the inner cell layers by active carriers or can be first hydrolysed by cell wall
invertases into glucose and fructose which are then taken up via monosaccharide
transporters (Lalonde et al., 1999; Sturm, 1999). Sugar carriers and cell wall invertases
may work coordinately to regulate the supply of sugar for developing microspores.
Recent publications have indicated that down regulation of a cell wall invertase gene,
OsINV4, and a monosaccharide transporter, OsMST8, might lead to insufficient
supplies of hexoses for anther development (Alfred, 2006; Mamun et al., 2006)
resulting in suppression of young microspore development after chilling. In addition,
abnormal starch accumulation in anther walls has been reported for chilling rice and
drought stressed wheat (Saini et al., 1984; Lalonde et al., 1997a; Li, 2005; Mamun et
al., 2006). However, Clement & Audran (1995) demonstrated that although excessive
sugar would result in accumulation of starch in the anther walls of Lilium, the anthers
continued to develop normally and produced viable pollen. This observation suggests
that abnormal deposition of starch in the anther walls after stress is not necessarily
relevant to pollen abortion. Moreover, this abnormal accumulation of starch in anther
walls was assumed to result from the redirection of sugar flux in anthers by active sugar
carriers (Oliver et al., 2005). These observations and assumptions need to be further
validated under drought stress conditions.
Page 38
16
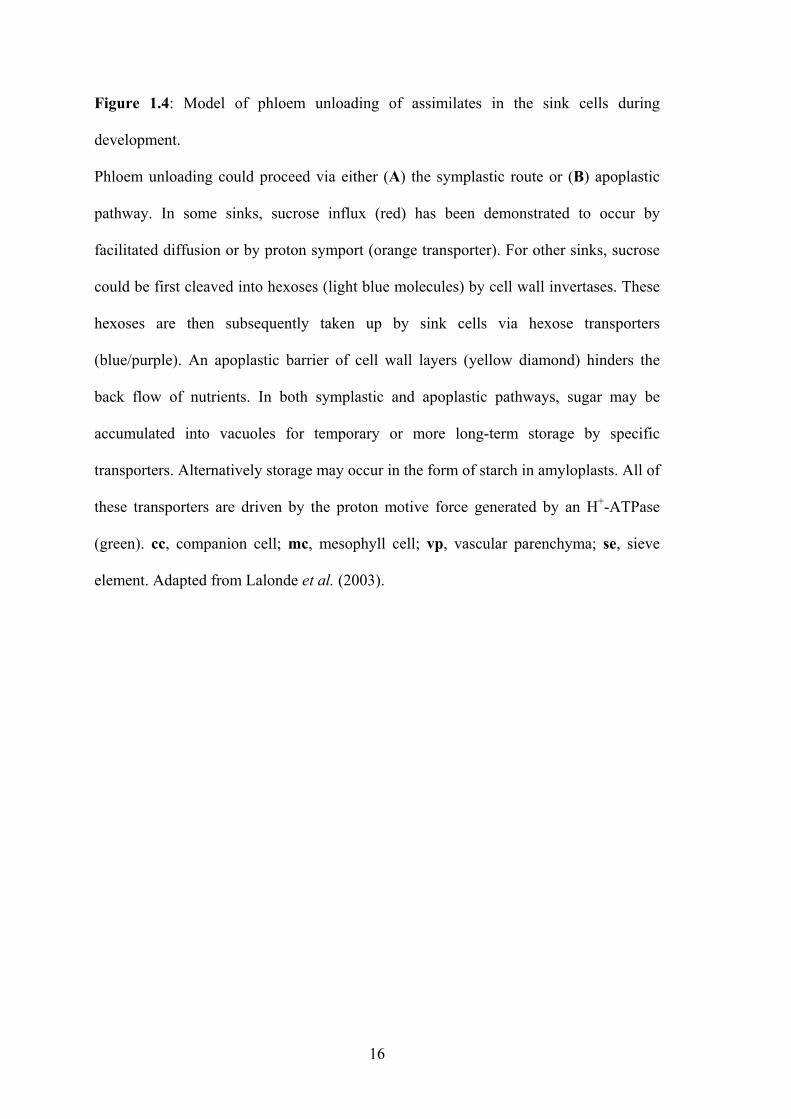
Figure 1.4: Model of phloem unloading of assimilates in the sink cells during
development.
Phloem unloading could proceed via either (A) the symplastic route or (B) apoplastic
pathway. In some sinks, sucrose influx (red) has been demonstrated to occur by
facilitated diffusion or by proton symport (orange transporter). For other sinks, sucrose
could be first cleaved into hexoses (light blue molecules) by cell wall invertases. These
hexoses are then subsequently taken up by sink cells via hexose transporters
(blue/purple). An apoplastic barrier of cell wall layers (yellow diamond) hinders the
back flow of nutrients. In both symplastic and apoplastic pathways, sugar may be
accumulated into vacuoles for temporary or more long-term storage by specific
transporters. Alternatively storage may occur in the form of starch in amyloplasts. All of
these transporters are driven by the proton motive force generated by an H+-ATPase
(green). cc, companion cell; mc, mesophyll cell; vp, vascular parenchyma; se, sieve
element. Adapted from Lalonde et al. (2003).
Page 40
17
1.4.2. Oxidative stress and programmed cell death
1.4.2.1 Death terminologies
The Nomenclature Committee on Cell Death has defined the phenomenon of
dead cells based on three molecular or morphological categories: 1) plasma membrane
of the cell has lost integrity; 2) the cell including its nucleus has completely fragmented
into apoptotic bodies; 3) cell fragments have been engulfed by a neighbouring cell
(Kroemer et al., 2005). Based on these categories, cell death has been further classified
into several types such as apoptosis, autophagy, necrosis, mitotic catastrophe, anoikis,
excitotoxicity, wallerian degeneration, and cornification (Kroemer et al., 2005).
Of those, three main types of cell death are of particular interest. Apoptosis is a
type of cell death that is characterised by specific cytological and morphological
hallmarks including chromatin and nuclear condensation; endonuclease-mediated DNA
fragmentation into nucleosomal units known as DNA laddering; nuclear blebbing and
the formation of apoptotic bodies (Kerr et al., 1972; Kerr & Harmon, 1991; Cohen,
1993; Lawen, 2003). Apoptosis can be understood as a cellular self-destruction process
under normal conditions so that the organism benefits from getting rid of unwanted or
harmful cells (Zong & Thompson, 2006). Another type of cell death is autophagy (“self-
eating”), a catabolic process involving self-degradation of cytoplasmic components
within lysosomal vacuoles (Klionsky & Emr, 2000). Autophagy occurs without
chromatin condensation and is characterised by a massive accumulation of double
membrane autophagic vacuoles in the cytoplasm (Levine & Klionsky, 2004; Kondo et
al., 2005). Necrosis is a passive form of cell death that results from acute cellular injury
in which the cell rapidly becomes unable to maintain homeostasis, and undergoes early
plasma membrane rupture and dilatation of cytoplasmic organelles (Kerr & Harmon,
1991; Denecker et al., 2001; Golstein & Kroemer, 2007). This type of accidental cell
Page 41
18
death only occurs when induced by external stress stimuli. There are few features to
distinguish between apoptosis and necrosis. Apoptosis is an energy independent process
while necrosis is often characterised by bioenergetic catastrophe (Zong & Thompson,
2006). The key events of necrosis are bioenergetic failure, loss of membrane integrity,
often associated with an increasing production of reactive oxygen species (ROS) and a
failure to generate ATP (Zong & Thompson, 2006).
Another death phenomenon regarded as programmed cell death (PCD) has
sometimes been used as a synonym to apoptosis. PCD is used as to imply that the death
of the cells has been genetically programmed (Heemels, 2000; Varnier et al., 2005) and
is therefore opposite to necrosis. Nevertheless, this synonymous use perhaps should be
avoided as sometimes it is difficult to distinguish whether the dead cells underwent a
programmed or necrotic death (Kroemer et al., 2005). Necrosis has been found not
absolutely accidental and can be programmed (Galluzzi et al., 2007). However, van
Doorn & Woltering (2005) illustrated that apoptosis might not exist in plants and that
many other forms of cell death belonging to the autophagic type may be apparent during
plant development. Mea et al. (2007) argued that it is sometimes difficult to
differentiate either programmed or accidental cell death in many cases because the
above mentioned definitions are only based on morphological observation in vitro
without clear confirmation of biochemical mechanisms. For instance, adding H2O2 into
cell culture has been reported to induce PCD in Arabidopsis (Tiwari et al., 2002);
actually it should be considered necrosis. Moreover, Li et al. (2004) also claimed that
pollen of cytoplasmic male sterile (CMS) rice underwent PCD during development,
which might have been recognised as apoptosis due to the plant showing hallmarks of
apoptosis such as TUNEL positive staining and DNA laddering. In addition, this
process was genetically programmed, as there were no stress stimuli in this case. Zong
Page 42
19
& Thompson (2006) concluded that stimulants can induce apoptosis at lower
concentrations and necrosis at higher doses and hence necrosis can be a controlled form
of cell death independent of apoptosis.
In this context, Van Breusegem & Dat (2006) proposed two terminologies to
indicate some forms of cell death in plants. The first type, necrosis, is a passive form of
cell death, indiscriminate and often followed by irreversible injury. The second type,
PCD or active cell death, is a form of cell death involving a single or series of molecular
and cellular orderly processes, which can be induced. Therefore, despite some
controversy over terminologies, the term PCD hereafter will be used in a general sense
to indicate the death of cells in this document, whereas a more detailed term will be
used in some specific circumstances as appropriate.
1.4.2.2 Role of PCD during reproductive development
In vivo, PCD plays a critical role in the normal development of angiosperms, as
well as in response to a variety of diseases, by controlling cell number or strategically
eliminating infected or damaged cells in defence (Greenberg, 1996, 1997; Vaux &
Korsmeyer, 1999). During reproduction, several tissues of plants such as the developing
xylem, the anther stomium and the tapetum have been found to experience a PCD as
part of their normal development (Greenberg, 1996; Beers, 1997; Pennell & Lamb,
1997; Wu & Cheung, 2000; Varnier et al., 2005).
Failure or improper function of PCD in anthers has been reported to result in
abnormal pollen development and subsequent sterility (Sanders et al., 2000; Wu &
Cheung, 2000). The degeneration of the tapetum in anthers is a typical example of PCD
during reproductive development. In normal development, the self-degraded process of
the tapetum is characterised by cytoplasm shrinkage and subsequent separation from the
cell wall. As the tapetum undergoes PCD, tapetal cells produce components for the coat
Page 43
20
of the mature pollen grains. This degeneration of the tapetal cells in anthers has been
well known as a tightly controlled PCD, which must occur in an orderly manner
(Bedinger, 1992; Papini et al., 1999). Failure to do so frequently results in pollen
sterility (Ku et al., 2003; Li et al., 2004). Moreover, abiotic stresses such as heat (Chen
et al., 1999) and oxidative stress (Slater et al., 1995; Dumont et al., 1999) are known to
induce PCD in plants. It is therefore interesting to know if pollen sterility under drought
stress associates with PCD in anthers.
1.4.2.3 Reactive oxygen species (ROS) and antioxidants
ROS is a terminology used to indicate some reduced forms of oxygen, which
result from aerobic respiration and enzymatic activities, such as superoxide (O2-),
hydrogen peroxide (H2O2), hydroxyl radicals (OH.) and nitric oxide (NO.) (Smirnoff,
1993; Halliwell, 2006). The mitochondrial electron transport chain is the major souce of
ROS in plants (Moller, 2001). Meanwhile, by-products of enzymatic reactions such as
those catalysed by glycolate oxidase in the peroxisomes during photorespiration and the
production of O2- on the outer surface of the plasma membrane by NADPH oxidase are
also important sources of ROS (Moller et al., 2007). The formation of some ROS can be
summarised by the following four consecutive reactions (reactions 1-4) (Smirnoff,
1993):
Page 44
21
When the level of ROS is low, the antioxidant system of the plant can neutralise
them and maintain the redox balance. However, under some adverse conditions this
redox homeostasis is easily violated, potentially resulting in a significant ROS
accumulation (Van Breusegem & Dat, 2006). Excessive production of this ROS in cells
can lead to oxidative stress and potentially cause damage to various constituents such as
proteins, lipids, DNA and other components of the cell (Beckman & Ames, 1997;
Berlett & Stadtman, 1997; Halliwell & Whiteman, 2004).
Naturally, the plants cope with excessive accumulation of ROS by minimizing
the level of ROS production by using a system of scavenging enzymes to neutralise the
species (Halliwell, 2006). Table 1.1 lists the major enzymes of the scavenging system.
Enzyme Abbreviation EC number
Superoxide dismutase SOD 1.15.1.1
Ascorbate peroxidase APX 1.11.1.11
Monodehydroascorbate reductase MDHAR 1.6.5.4
Dehydroascorbate reductase DHAR 1.8.5.1
Glutathione reductase GR 1.6.4.2
Catalase CAT 1.11.1.6
Glutathione peroxidase GPX 1.11.1.9
Guaiacol-type peroxidases — 1.11.1.7
Glutathione S-transferases GST 2.5.1.18
Table 1.1: List of major antioxidant enzymes (Noctor & Foyer, 1998)
The principal enzymatic reactions of ROS scavenging are presented below
(reactions 5 – 12) (Apel & Hirt, 2004):
Page 45
22
*GSH glutathione; **GSSG oxidised glutathione.
Within the cell, superoxide dismutases (SODs) are amongst the most important
enzymes that catalyse the first scavenging reactions against ROS. Three distinctive
types of SOD have been well characterised in plants namely: Cu/ZnSOD, MnSOD, and
FeSOD (Alscher et al., 2002). MnSOD has shown to result in better tolerance to
drought in engineered transgenic rice compared to the wild type (Wang et al., 2005).
The SODs catalyse the disproportionation of superoxide to hydrogen peroxide (reaction
5). Subsequently hydrogen peroxide produced from the above reaction can be broken
down to water by some enzymes in different pathways. Hydrogen peroxide can be
neutralised by catalase (CAT) to form water and molecular oxygen (reaction 6)
(Willekens et al., 1995). The ascobate –glutathione cycle is initiated by ascorbate
peroxidase (APX) to convert hydrogen peroxide to water (reaction 7) following a series
of reactions to regenerate the ascorbate substrate (reaction 8-10). Similarly to APX,
glutathione peroxidase (GPX) can detoxify hydrogen peroxide to water using
Page 46
23
glutathione (GSH) directly as a reducing reagent (reaction 11). The GPX cycle is
completed with a reaction to regenerate GSH from oxidised glutathione (GSSG)
catalysed by glutathione reductase (GR) (reaction 12).
1.4.2.4 Relationship between oxidative stress and PCD
The association of ROS and PCD has been the object of several reviews (Lam,
2004; Van Breusegem & Dat, 2006; Zong & Thompson, 2006; Ryter et al., 2007;
Scherz-Shouval & Elazar, 2007). The accumulation of ROS to induce PCD was first
illustrated based on the correlation between increased ROS levels and cell death by
Levine et al.(1994). Evidence of exogenous hydrogen peroxide application triggering
PCD in cell suspension cultures of soybean (Glycine max L.) showed that increasing
levels of hydrogen peroxide caused a corresponding level of cell death (Levine et al.,
1994).
Foyer & Noctor (2005b) proposed that ROS could trigger PCD in compartments
with low antioxidant buffering capacity or where ROS production is high. The crucial
role of antioxidants in maintaining the redox balance has been demonstrated in
transgenic tobacco plants. Plants with a low level of antioxidants to detoxify ROS have
been shown to activate PCD in response to minor pathogen attacks which did not trigger
the activation of PCD in control plants (Mittler et al., 1999). Likewise, high levels of
hydrogen peroxide accumulated under photorespiratory conditions have been found to
cause an active cell death program which also exhibits several PCD hallmarks in
transgenic tobacco leaves with deficient catalase activity (Dat et al., 2003). Li et al.
(2004) concluded that excessive accumulation of ROS causes a chronic oxidative stress
which may trigger the tissue-specific PCD in anthers of CMS rice.
In summary, there is accumulating evidence of PCD in plants triggered by ROS.
ROS-dependent PCD usually takes place when the level of ROS exceeds the scavenging
Page 47
24
capacity of plants leading to oxidative stress. This oxidative stress results in necrotic
cell death in extreme cases while lower levels of ROS will switch the direct execution
of the cell to PCD (Van Breusegem & Dat, 2006).
1.4.2.5 Oxidative stress and pollen sterility
Although a considerable amount of information is available on water deficit
induced oxidative stress and reduction of antioxidants (Bowler et al., 1992; Baisak et
al., 1994; Moran et al., 1994; Sairam & Srivastava, 2001; Pan et al., 2006), there is little
work regarding the sequential effects of the oxidative stress on microsporegenesis in
plants. To date only a few reports demonstrate the involvement of oxidative stress on
pollen sterility in CMS rice and cotton (Li et al., 2004; Jiang et al., 2007; Wan et al.,
2007). In these plants, increased levels of ROS coupled with reduced antioxidant
capability have resulted in oxidative damage to developing pollen. Moreover, oxidative
stress has hampered mitochondrial activity leading to a depletion of the ATP pool in the
anthers. Therefore a high percentage of sterile pollen in CMS plants has been
considered as the result of oxidative damage and energy shortage in comparison to the
controls (Wan et al., 2007). Results from studies by Selote & Khanna-Chopra (2004)
indicate that an inefficient antioxidant system in panicles may be the cause of drought
induced spikelet sterility in rice. However, direct sequential impacts of drought stress on
pollen formation have not been explored.
1.5. Aims of this project
Abiotic stresses in general, or water deficit-induced male sterility in rice in
particular, is not a new phenomenon. Although a vast amount of literature has discussed
this symptom from different aspects, no conclusive evidence for the causes of pollen
sterility under drought conditions has been achieved so far. There are still large gaps in
our understanding of some of the fundamental processes involved in pollen formation
Page 48
25
and its response to water deficit. The overall objectives of this project are, therefore, to
gain insight of the possible mechanisms or signalling processes that lead to pollen
sterility in rice under water shortage conditions. The concrete aims of the project are to:
1. Determine the critical level where a short transitory period of water deficit
effectively influences male fertility using a reliable and easily reproducible drought-
induction method. Experiments will be conducted to test if mild water deficit levels
do reduce pollen viability and grain set. Male fertility will be tested immediately
after exposure to drought stress to detect any changes in young microspore viability.
2. Examine possible molecular mechanisms of pollen sterility with emphasis on
carbohydrate metabolism in rice anthers under drought. These experiments will be
carried out in order to test the hypothesis that disturbances in carbohydrate
metabolism in rice anthers actually repress pollen development and subsequently
affect formation of grain set.
3. Investigate the association of pollen sterility with PCD and oxidative stress in rice
anthers under drought. On the basis of accumulating evidence of involvement of
PCD and oxidative stress in plants under environmental stresses, experiments will
be conducted to test hypotheses that oxidative conditions occur during drought and
that drought induces a PCD in rice anthers. In addition, it will be determined if these
biological events are physiologically relevant to pollen sterility.
Page 49
26
CHAPTER 2: MATERIALS AND GENERAL METHODS 2.1. Plant materials
Oryza sativa L. japonica cv R31, also known as Lijiangheigu, was used as the
plant material for all experiments. R31 is a short growing duration variety with
approximately 110-115 days from sowing to maturity. It is well adapted to growth in a
hydroponic system and has a strong tillering capacity (Li, 2005). Fertility, determined
by seed set and pollen viability, is stable (Li, 2005). Rice plants were grown in a
hydroponic system developed by Dr Xiaochun Zhao, Plant Breeding Institute, The
University of Sydney, Australia and a soil system in glasshouse at 24oC day/night
temperature. Seed of R31 was kindly provided by Dr Xiaochun Zhao.
2.2.1. Soil system for initial trials
Rice seeds were soaked in water for 48 hours at room temperature and then
transferred to a tray spread with wet blotting paper. The trays were then covered with
lids to avoid water evaporation and incubated at 32oC for another 48 hours. Germinated
seeds were sown in nursery trainers containing soil collected from Camden, New South
Wales, Australia. The trainer is made from plastic and includes two foldable flaps that
form four separate cavities, when fully assembled. Figure 2.1A illustrates rice plants
grown in nursery trainers. The trainers were supported by a steel frame and were placed
into 30 litre plastic boxes filled with tap water. The use of trainers improves handling of
dialysis tubing as described in section 2.3.3. To protect the dialysis tubing from being
punctured by developing rice roots, a hand-made sock was applied. The socks were
made by sewing two pieces of ordinary cotton fabric (25 cm length and 8 cm width) to
form a sock which can then be filled with soil for growth of plants. The sock filled with
the soil and plants was then placed in a single cavity of the nursery plastic trainer. Each
Page 50
27
trainer could hold four plants. The water level in the tray was kept approximately 3-5
cm above the trainer's surface. Nutrients including urea (10 g); KH2PO4 (10 g); KCl (5
g); Ca(NO3)2 (2 g) and chelated micronutrient mixture (1.5 g) (BMX, Librel, Ciba
Speciality Chemicals, UK) were applied to every trainer before sowing (Figure 2.1).
2.2.2. Hydroponic system
The hydroponic system used in this study was assembled from several plastic
channels. Each channel contained holes cut to the size of the plastic pots. The channels
were interconnected by plastic irrigation pipes with a barrel storing the hydroponic
medium and an immersed pump (Pond Master, PM-1000) that continuously circulated
nutrients from the storage barrel to the channels. A floating cistern valve connected to
the main water supply was used to maintain the level of water in the barrel (Figure 2.2).
About 10 geminated seeds were sown every two weeks in a support medium
consisting of coarse sand, perlite and pine bark (1:1:10) in 80 mm Jiffy pots (Yates,
Australia) to avoid leakage of this mixture into the hydroponic system. To prevent
degradation, each Jiffy pot was placed inside a 100 mm plastic pot. All pots were
secured to the plastic channels through the holes. The culture medium contained
(NH4)2SO4 (0.15 g), KNO3 (0.04 g), KH2PO4 (0.3 g), NH4NO3 (0.3 g), Mg(NO3)2 (0.15
g), Ca(NO3)2 (0.16 g) and chelated micronutrient mixture (0.15 g) (BMX, Librel, Ciba
Speciality Chemicals, UK) per litre of tap water.
The nutrient concentration and pH were controlled using a pH/electrical
conductivity meter (Combo HI 98130, Hanna Instruments Inc.). The pH of the solution
was checked every two or three days and kept between 5.0 - 6.0. The pH value was
adjusted using either 1 M KOH or 1 M HNO3. The level of total dissolved solids
(TDSs) was kept between 0.7-1.0 parts per thousand (ppt) and adjusted with either the
stock nutrient solution or fresh water. About two months after sowing, plants were
pruned and only 2-3 main culms were allowed to continue growing.
Page 51
28
Figure 2.1: Rice grown using a soil system. A- Plants with roots covered by sock and
dialysis membrane supported by a plastic trainer. The dialysis membrane and sock was
only used when the plants were exposed to water stress using PEG. B- Plants held
upright and grown in plastic boxes.
Figure 2.2: The hydroponic system.
Page 52
29
2.3. Water stress system
2.3.1. Water stress inducer
Polyethylene glycol (PEG) molecular weight 20,000, pharmaceutical grade
(Merck, Germany) was used as a water stress inducer. The osmotic potential of the PEG
solution was measured using a vapor pressure osmometer (WESCOR 5500). The
osmometer was first stabilised using commercial standard solutions of NaCl 100, 290
and 1,000 mOsmoles (WESCOR Inc). Measurements were made after calibration with
NaCl solutions (Lang, 1967). The osmotic potential of the culture medium was
controlled by either adding PEG or fresh water to maintain the water potential of the
solution at the desired level. The PEG solution can be reused several times without
reduction in its osmotic effects (Plaut & Federman, 1985).
2.3.2. Plants grown in hydroponic system
Water stress was imposed by moving plants from the hydroponic system and
placing them directly into a 2 L pot containing a PEG solution of the designated osmotic
potential (Figure 2.3A). It is critical to avoid physical damage to plant roots at this step.
Plants were kept upright by a home-made plastic supporting holder. To minimize PEG
precipitation and to provide oxygen for plant growth, the PEG solution was slightly
aerated by an air-stone connected to an air-pump (Figure 2.3B). Water lost through
evaporation was replenished several times during the days of stress treatment. A piece
of plastic cling wrap was also used to cover plants around the edge of the pot to
minimize the rate of evaporation.
Page 53
30
Figure 2.3: Water stress system. A) Rice plants being stressed in PEG solution. B)
Aerating device: air-pump (right) and air-stone (left).
2.3.3. Plants grown in soil system
Water stress for the plants growing in soil was conducted similarly to the
hydroponic stress as described above with some additional steps. About three months
after sowing, plants growing in soil were carefully taken out of the supporting trainers
and placed into a MEMBRA-CEL dialysis tubing MC-97 (Viskase Inc, USA). The
tubing membrane size was 104 mm wide (dry flat) with a molecular weight cut off of
12,000-16,000 and a pore size about 25 Å. The aim of using the tubing membrane was
to help plant roots avoid direct contact with PEG. Therefore, care was taken to make
sure that the whole plant root system was covered with the membrane. Plants with roots
wrapped in dialysis tubing were moved back into trainers and continued to grow until
the desired stages. Water stress was induced by placing plants into 25 L plastic storage
boxes containing the PEG solution of designated potential.
Water stress was released by simply removing the plants from the PEG solutions
and returning them to the normal growing conditions. It was essential to ensure that all
Page 54
31
PEG residues were completely washed off the root system. Stressed plants were
carefully washed by hand under running water to remove PEG from the roots. These
plants were then soaked in a new storage box containing nutrient solution for four
hours; the solution was changed every two hours. After soaking they were returned to
the hydroponic system to continue normal growth.
2.4. Anther sampling
Rice anthers at three developmental stages were routinely harvested; the tetrad
stage, the microspore stage and the vacuolated microspore stage. All stages were
distinguished based on definitions by Wada et al.(1990; 1992). Anthers from parallel
control plants were sampled at identical stages of development. The stages of
development were confirmed by microscopic inspection of representative anthers. The
spikelets of the top three primary branches were dissected with a scalpel and fine
forceps using a dissection microscope to remove the enclosed anthers. In order to take
more synchronous anther samples, only the main tillers of the rice plants were used for
the experiments. Anthers within the same length range were collected and immediately
frozen in liquid nitrogen and stored at -80oC until use. Anther samples belonging to the
same anther developmental stages were pooled to obtain sufficient materials for each
developmental stage (Figure 2.4).
Page 55
32
Figure 2.4: Light microscopcic observation of three stages of anther development:
Pollen mother cell stage; Tetrad stage; Microspore stage; & Vacuolated
microspore. pmc pollen mother cell. te tetrad. mi microspore. vmi vacuolated
mcirospore. Scale bars: 20 µm ( ) and 10 µm ( ).
Page 57
33
2.5. RNA extractions
Total RNA, from frozen anthers of desired stages (tetrad, microspore and
vacuolated microspore) of both treated and control plants, was extracted using a RNeasy
Plant Mini kit (Qiagen, Australia) following the manufacturer’s protocol. Briefly,
anthers were ground to a fine powder in liquid nitrogen. Approximately 10-15 mg of
this anther powder was transferred to a microcentrifuge tube containing 450 µL of RLC
buffer with 4.5 µL β-mercaptoethanol and vortexed vigorously. The homogenised
mixture was then transferred directly to a Qiagen shredder column placed in a 2 mL
collection tube and centrifuged for 2 minutes at 13,000 rpm in a microcentrifuge. The
clear flow-through lysate was then transferred to a new collection tube and mixed with
225 µL of 96% ethanol. This mixture was transferred to a RNeasy column in a 2 mL
centrifuge tube and spun for 15 seconds at 11,000 rpm. The RNeasy column was
subsequently washed with 350 µL of RW1 buffer and centrifuged for 15 seconds at
11,000 rpm. Potential contaminant genomic DNA was digested on-column with RNase-
free DNase set (Qiagen, Australia). A DNase I mix containing 10 µL DNase I stock
solution and 70 µL buffer RDD was pipetted directly onto the RNeasy spin column
membrane and incubated for 15 minutes at room temperature. After incubation, the spin
column was washed with 350 µL of RW1 buffer and centrifuged for 15 seconds at
11,000 rpm. The spin column was washed twice with 500 µL of 96% ethanol-added
RPE buffer by centrifugation. The total RNA was eluted from the spin column with 50
µL RNase free water. Total RNA was quantified using a NanoDrop® ND-1000
spectrophotometer (Biosciences, Australia). Total RNA was diluted with RNase free
PCR grade water to desired concentrations for RT-PCR as required. The RNA was
stored at -80oC.
Page 58
34
2.6. Quantitative Reverse Transcription Polymerase Chain Reaction (qRT-PCR)
2.6.1. Primer design
Gene specific primers were either sought from the literature or designed based
on sequence information from the gene bank (http://www.ncbi.nlm.nih.gov). Primers
were designed to cross exon-exon junctions of the genomic DNA to avoid possible
amplification of contaminant DNA during the RT-PCR process (Bustin, 2000).
2.6.2. cDNA amplication and sequencing analysis
Initial conventional RT-PCR tests were applied to all genes under investigation.
Transcripts of the specific genes were reverse transcribed into corresponding cDNA
using SuperscriptTM III One-Step RT-PCR Platinum® Taq (Invitrogen, Australia).
Briefly, a 20 µL reaction mixture consisted of 10 µL of 2X reaction mix, 0.4 µL
SuperScriptTM III RT/platinum Taq enzyme, 0.4 µL of 10 µM gene specific primers,
RNase free PCR grade water, and 1 µL total RNA. RT-PCR was performed on a
Mastercycler® Gradient (Eppendorf, Australia). The cycling profile of the standard RT-
PCR was initiated with a reverse transcription step at 50oC for 40 minutes, initial
denaturation at 94oC for 2 minutes followed by 30-35 cycles of 94oC for 20 seconds
denaturing, 55-65oC for 30 seconds annealing, 62-72oC for 25 seconds elongation
depending on gene target. Amplified products were electrophoresed in a 1% agarose gel
for 1.5 hours at 90V. A commercial standard 1 Kb plus DNA marker (Invitrogen,
Australia) was run in parallel. The gel was stained in a water bath containing ethidium
bromide (0.5 µg/mL) for 20 minutes. The DNA bands on the gel were then visualised
under a UV light. An image of the gel was captured using Gel Doc (Bio-Rad, Australia)
digital imaging system. Complete removal of possible contaminating genomic DNA in
the RNA extract was also confirmed by replicating the RT-PCR in another tube
containing gene specific primers but Platinum® Taq DNA Polymerase (Invitrogen,
Page 59
35
Australia) was substituted for SuperScriptTM III RT/platinum Taq enzyme. cDNA was
purified using a QIAquick PCR Purification Kit (QIAGEN, Australia) according to the
manufacturer's instructions. In brief, 5 volumes of supplied buffer PB were pre-mixed
with 1 volume of the PCR sample and applied to the binding column with subsequent
centrifugation at 13,000 rpm for 1 minute. After removal of the flow through, the spin
column was washed with 0.75 mL of buffer PE by centrifugation for 1 minute at 13,000
rpm. An additional 1 minute centrifugation at 13,000 rpm was applied to completely
remove any ethanol from the PE buffer. cDNA was eluted in 50 µL EB buffer (10 mM
Tris-Cl, pH 8.5).
The purified cDNA sample was sent to Sydney University Prince Alfred
Molecular Analysis Centre (SUPAMAC) for sequencing. Procedures of sample
preparation for sequencing analysis using Applied Biosystems DNA Analyser (ABI
3730) were followed (http://www.supamac.com/content/index.php). Sequencing data
was analysed with BioEdit and Chromas software. This sequence data was aligned
against the gene bank using Basic Local Search Tool (BLAST)
(http://www.ncbi.nlm.nih.gov/BLAST) to confirm the identity of cloned cDNAs with
target sequences.
2.6.3. House keeping gene for standard control and qRT-PCR reaction
Rice OsTuba1 gene (Genebank ID AF182523) was chosen as an internal standard
control for the qRT-PCR system in this study. OsTuba1 gene specific primers were as
follows: forward primer 5’-GGCTTGTGTCTCAGGTTATCTCATC and reverse primer
5’-CATGGAGGATGGCTCGAAGG (Oliver et al., 2005). OsTuba1 gene has been
reported as being unregulated by any known environmental stimulus (Yamaguchi et al.,
2004; Oliver et al., 2005) and was recently used as a standard in real-time qRT-PCR for
rice anthers (Kong et al., 2007).
Page 60
36
The real-time qRT-PCR reaction was carried out using SuperscriptTM III
Platinum® SYBR® Green One-Step qRT-PCR (Invitrogen, Australia). Components and
reaction conditions are similar to standard RT-PCR with some minor modifications. In
short, a 20 µL reaction mixture containing 1x SYBR® Green reaction mix, 0.4 µL
SuperScriptTM III RT/platinum Taq enzyme, 200 nM gene specific primers, PCR grade
water, and 40 ng total RNA was pipetted into a real time PCR tube (Integrated Sciences,
Australia). Detection and quantification of the RNA transcripts of targeted genes in
water stressed and control samples in real time was performed on the Rotor-Gene 2000
(Corbett, Australia). A 2-fold dilution series of total RNA with RNase free PCR grade
water (160, 80, 40, 20 and 10 ng) was used to develop a standard curve for each target
gene.
Duplicate qRT-PCR reactions for OsTuba1 gene generally consisted of an initial
reverse transcription step at 50oC for 20 minutes, initial denaturation at 94oC for 5
minutes following 35-40 cycles of 94oC for 20 seconds denaturing, 65oC for 30 seconds
annealing, 68oC for 25 seconds elongation. Specificity of amplified products and primer
dimer formation were monitored by an additional step at 79oC for 15 seconds during
cycles, and a melt curve at the end of the RT-PCR reaction. Fluorescence signals were
also acquired at the last step during each cycle (Figure 2-5). qRT-PCR was
independently run on two different RNA extractions with double replicates for each
sample.
2.6.4. Statistical analysis of raw data
Raw signals from real-time amplification reactions were analysed using Rotor-
Gene 2000 software version 5.0. Cycle crossing point (CP), sometimes called cycle
threshold (Ct), is the point at which the raw fluorescent signals of a real time PCR
reaction becomes statistically significantly higher than the background level during the
Page 61
37
exponential phase of the amplification (Bustin, 2000). The CP value is reported for
every sample and has been illustrated to be proportional to the number of copies of
mRNA in the sample (Heid et al., 1996). Therefore the CP value can be used to indicate
the absolute number of mRNA copies in the sample by developing a standard curve
(Bustin, 2000). The CP value of individual reactions in this study was calculated based
on a standard curve which was generated by plotting the logarithm of input amount of
total RNA versus cycle crossing point values (Figure 2.6). The real-time PCR efficiency
(E) was calculated by Rotor-Gene 2000 software which is based on the slope of the
standard curve. Relative expression ratios of treated and controlled samples at different
stages were calculated and compared by individual reaction CPs and reaction efficiency
according to the following formula (Pfaffl, 2001):
targettarget
refref
CP (Control-Sample)
CP (Control-Sample)
(E )Ratio
(E )
∆
∆=
where: Etarget is the real-time PCR efficiency of the target gene transcript; Eref is
the real-time PCR efficiency of a reference gene transcript; CPtarget is the CP deviation
of control – sample of the target gene transcript; CPref is CP deviation of control –
sample of reference gene transcript.
Statistical analysis of real time RT-PCR results, the randomisation test, was
performed by using a Relative Expression Software Tool (REST©) (Pfaffl et al., 2002).
The expression of the targeted gene in the control samples at the tetrad stage was
normalised at 1 and used to compare the relative expression of the control and treated
samples from other stages.
Page 62
38
Cycle5 10 15 20 25 30 35 40
Nor
m. F
luor
o.
0.55
0.5
0.45
0.4
0.35
0.3
0.25
0.2
0.15
0.1
0.05
0 Threshold
Figure 2.5: Normalised fluorescence of OsTuba1 at different anther developmental
stages. Channels indicate fluorescence signals of different individual samples. The red
horizontal bar indicates threshold cycle of PCR reactions.
Figure 2.6: Standard curve of OsTuba1 gene generated by Rotor-Gene 2000 software
using two fold dilution of total RNA. R2 is the correlation coefficient of the curve
(0.99125); M is the slope (-2.975); B is the intercept (19.889); E is the PCR reaction
efficiency (1.17).
Page 63
39
2.7. Sample preparation for immunological localization
Florets of desired stages of anther development were selected for this experiment.
After removal of the tips, the florets were immediately fixed in 1X phosphate buffered
saline (PBS) solution (pH 7.2) containing 4% (v/v) (para) formaldehyde (ProSciTech,
Australia) and 2.5 % (w/v) sucrose, in a vacuum desiccator at room temperature
overnight (~14 hours). The samples were dehydrated through an ethanol series of 30,
50, 70, 95 and 100% on the following day. The samples were then pre-infiltrated in
xylene for 2 hours and manually embedded in Paraplast (Sigma-Aldrich, Australia) at
60oC. The blocks were microtomed into 8 µm sections for further procedures.
The structure of the embedded section was confirmed by light microscopy with
toluidine blue O staining as follows: 8 µm sections were dewaxed twice in fresh xylene
for 10 minutes each time, and rehydrated in a series of ethanol washes (100%, 95%, and
70%), once for 5 minutes each series, and washed in distilled water twice for 2 minutes
each. Dewaxed sections were then incubated in an aqueous solution containing 0.05%
(w/v) toluidine blue O in 0.1 M phosphate buffer at pH 6.8 for 5 minutes. The sections
were then washed twice with distilled water for one minute each, air-dried and observed
immediately under the light microscope. Figure 2.7 represents the detailed structure of a
paraffin embedded transverse section of an anther.
Page 64
40
Figure 2.7: Paraffin embedded cross section of a normal anther stained with toluidine
blue O (microspore stage).
A. Transverse section of an anther
B. Details of a single lobe
ct connective tissue; ep epidermis; en endothecium; ml middle layer; t tapetum; lo
locule; vb vascular bundle; mi microspore. Scale bars: 20 µm.
Page 66
41
CHAPTER 3: EFFECTS OF WATER DEFICIT ON MALE FERTILITY IN RICE
3.1. Introduction
Water deficit has been known to impair the growth and development of rice
plants (Oryza sativa. L) with the nature of the damage strongly dependent on the level
and duration of the stress at the time of exposure. Water stress occurring at the
vegetative stage mainly reduces tiller number and appears less detrimental to grain yield
(De Datta et al., 1975; Lilley & Fukai, 1994). However, the consequential damage of
water deficit is particularly serious if the stress occurs during the reproductive phase
(Steponkus et al., 1980; O'Toole & Moya, 1981). Effects of drought stress during anther
development have been well characterised for wheat (Saini & Aspinall, 1981, 1982;
Saini et al., 1984; Dorion et al., 1996; Lalonde et al., 1997a; 1997b; Koonjul et al.,
2005) and to a much lesser extent for rice. The major effect of water deficit at meiosis is
the decline in the number of engorged pollen that leads to poor, or failure of, pollination
at flowering (Namuco & O'Toole, 1986; Sheoran & Saini, 1996). Therefore, pollen
viability has been employed as a indicator of fertility for cereal plants exposed to abiotic
stresses (Saini & Aspinall, 1981; Heenan, 1984; Satake, 1991; Gunawardena et al.,
2003; Oliver et al., 2005).
Grain yield reductions ranging from 20% to 70% of the control have been
observed in rice under water deficit treatment during the reproductive stage (Lilley &
Fukai, 1994). Sheoran and Saini (1996) reported a serious decline of grain set from 92%
to 22% by withholding water for 4 days during the meiotic stage of pollen mother cells.
This decrease of grain set corresponds to the reduction of leaf water potential from -1.2
MPa to -2.3 MPa (Figure 3.1). However, those experiments have not quantitatively
assessed the immediate effects of drought on male fertility at the time of exposure. The
Page 67
42
direct relationship between grain set and pollen viability which attributes to the success
of pollination has not been validated.
Figure 3.1: Changes of leaf water potential in rice plants withheld water for four days
during reproductive development (Reproduced from Sheoran & Saini, 1996).
O'Toole & Cruz (1980) reported that, in practice, the leaf water potential of the
above mentioned experiment can only be observed in fully rolled leaves of some
cultivars and thus is considered too low. The sharp changes of leaf water potential
observed in this experiment indicate that plant water status was uncontrolled and
therefore it might be difficult to reproduce in later trials. On the other hand, the
development of spikelets within the same panicle of cereals like wheat and rice is not
simultaneous; the top spikelets are generally senescent and ripen earlier than the lower
ones. Consequently, the top spikelets appear to suffer less detrimental effects than the
lower ones do. Due to the difficulties of regulating drought experimentally (Graham-
Bryce, 1967; Krizek, 1985), a reliable and easily reproducible method of inducing water
stress in this context is required.
This experiment was therefore designed to determine the critical level of drought
stress that starts affecting fertility of rice plants during anther meiosis using a reliable
Page 68
43
and experimentally reproducible stressing method. The association between leaf water
potential (Ψleaf), pollen viability and grain set will be presented and discussed.
Moreover, results about the immediate effects of drought on young microspore fertility
and its causal relationship with grain set will also be discussed.
3.2. Materials and methods
3.2.1. Plant materials and water stress treatment
The rice cultivar used for this experiment was as described in Chapter 2 (Section
2.1). Tentative experiments were first conducted with plants grown in soil (Section
2.2.1 & 2.3.3). Due to problems with the semi-permeable membrane, which will be
discussed below, plants for all other experiments were grown hydroponically and
stressed as described in Section 2.2.2 & 2.3.2, Chapter 2, unless otherwise stated. Three
levels of water stress, -0.25 MPa, -0.5 MPa and -0.75 MPa were applied.
3.2.2. Auricle distance scale and timing of stress
In order to stress plants at a designated, specific stage, an auricle distance
measurement method was applied (Matsushima, 1957; Satake & Hayase, 1970; Heenan,
1984). The auricle distance (AD) is the distance between the auricles of the flag leaf and
the penultimate leaf (Figure 3.2). By measuring the auricle distance, the developmental
stages of rice anthers can be estimated. If the auricle of the flag leaf is inside the
penultimate leaf, the AD value is negative. By contrast, if the auricle of the flag leaf is
outside the penultimate leaf, the AD value is positive. Figure 3.3 presents a relative
empirical scale of AD for R31 cultivar, and water stress treatment scheme.
Page 69
44
Figure 3.2: Auricle distance of rice plants
(Adapted from http://www.ikisan.com/links/ap_ricemorp.shtml)
Figure 3.3: Panel (A) Auricle distance scale, and corresponding anther developmental
stage. Stages in the rectangles indicate the time for anther sampling. Panel (B) Relative
stress schemes for seed set measurement of cultivar R31. Broken arrows indicate the
period at which the plant was experiencing maximum stress. PMC = pollen mother cell.
Page 70
45
3.2.3. Plant water status
The leaf water potential from control and treated plants was measured using the
pressure bomb technique as described by Scholander et al. (1965). Leaf measurements
were conducted at predawn (5.00 - 6.00 am) commencing at day zero (exposure to water
stress) and throughout the duration of the experiment (six days). Second to the youngest
fully expanded leaves were cut about 2.0 cm below the leaf collar. These leaves were
kept in a sealed polyethylene bag to protect from vapour pressure loss. The measuring
leaf was placed in a pressure chamber in such a way that the cut portion of the surface
was just protruding into the atmosphere through the seal on the top of the chamber. The
pressure to the leaf blade was adjusted slowly until the meniscus just returned to the cut
surface. This pressure was taken as the water potential of the leaves.
3.2.4. Gas exchange analysis
Net photosynthesis, transpiration rate, and stomatal conductance of the second
fully expanded leaf from the top were measured using a portable infrared gas analyzer
(LI-6400, Li-COR Inc.). The quantum flux density at the leaf surface, flow rate in the
chamber, and leaf temperature were maintained at 1,000 µmol m-2 s-1, 500 µmol s-1 and
25oC, respectively. Leaf gas exchange measurements were conducted at midday on day
zero (exposure to water stress) and continued throughout the duration of the experiment
(six days).
3.2.5. Grain set measurement
Water deficit was imposed at several times during the development of anthers
from the PMC to the vacuolated microspore stage, estimated by using the AD scale
(Figure 3.3). Because florets from the same panicle do not develop synchronously, a
three consecutive day water deficit treatment at either -0.25, -0.5 or -0.75 MPa was used
to stress a maximal number of spikelets at the desired sensitive stage. Appropriate
Page 71
46
untreated plants were conducted at the same time. After the stress treatment, the treated
plant roots were washed carefully to remove all residues of PEG and returned to the
glasshouse hydroponics system and allowed to continue development until mature seed
was formed. Grain set, expressed as the number of grains produced as a percentage of
fully developed florets, both in control and water stress treatments, was recorded when
grains were mature.
3.2.6. Mature pollen viability
Starch pollen was stained with KI/I2 (0.5 g of I2 and 2 g of KI in 100 mL of H2O)
according to the method of Gunawardena et al. (2003) with slight modifications. Five
florets were sampled from the uppermost primary branches per panicle and four
panicles from different plants were used for pollen viability. Pollen contained in the
anthers of each floret was released onto a slide in a drop of KI/I2. Slides were then
incubated at room temperature for one minute and covered with cover slips.
Observation and photography was conducted using a light microscope with a digital
camera attached to a computer. Ten view areas were photographed for pollen viability
counting of each sample. Viable and unviable pollen were immediately manually
counted by using Adobe Photoshop software.
3.2.7. Young microspore viability
Young microspores were dually stained with a mixture of fluorescein diacetate
(FDA) and propidium iodide (PI) (Li, 2005; Oliver et al., 2005). Anthers from a few
representative plants were selected for this experiment. Anthers were dissected from the
panicle and pressed onto a glass slide by a scalpel to release young microspores. One
drop of anther culture medium containing 2 µg/mL FDA and 10 µg/mL PI was applied
directly to the newly released microspores, covered and incubated for 5 minutes in the
dark. The recipe for the anther culture medium was adapted from Li (2005) and
Page 72
47
consisted of KCl (1,500 mg/L), KH2PO
4 (500 mg/L), MgSO
4.7H
2O (180 mg/L), EDTA
(32 mg/L), MnSO4.H
2O (17 mg/L), KI 0.8 (mg/L), ZnSO
4.7H
2O (8.6 mg/L), Ca(NO
3)
2
(300 mg/L) and sucrose (80 g/L) (pH 6.5). Observation and photography was analyzed
using a fluorescence microscope (Olympus BX51, Japan) and ten view areas were
captured for further analysis. Viable and unviable young microspores were immediately
manually counted as described for mature pollen staining.
3.2.8. Statistical analysis
The results are reported as means ± standard error (SE). The significance of
results was determined by analysis of variance (ANOVA) using Genstat statistical
software (version 8.0).
3.3. Results
3.3.1. Influence of PEG on root morphology
Figure 3.4 compares the morphology of rice roots before (A) and after (B) three
days exposure to osmotic stress induced by PEG at -0.5MPa. The images illustrate that
the water deficit treatment did not inhibit development of the roots; rather it appeared to
stimulate the elongation of the roots after stress. The roots appeared healthy and no
symptoms of root necrosis or toxicity were observed (Figure 3.4B). Roots of the non-
treated control showed less elongated after three days than the treated one (Figure 3.4C
& D).
Page 73
48
Figure 3.4: Effect of PEG on root morphology of rice plants after three days exposure
to water deficit stress at -0.5MPa. A. Roots before PEG exposure. B. Roots after PEG
exposure. C. Roots of control plants. D. Roots of control plants after three days.
3.3.2. Influence of water deficit on leaf water status
Rice plants subjected to three different levels of water deficit stress; -0.25 MPa, -
0.5 MPa and -0.75 MPa showed a significant and continuous decline of predawn leaf
water potential (Ψleaf) compared with the controls at the same period (P<0.01; Figure
3.5). Greater reductions of Ψleaf were observed in plants exposed to higher levels of
osmotic stress e.g. -0.5 MPa and -0.75 MPa (Figure 3.5), while, osmotic stress at -0.25
MPa only reduced Ψleaf slightly and caused mild leaf rolling. Two days after the
application of stress, the Ψleaf stayed constant for each treatment throughout the duration
of the stress (Figure 3.5). Once the water deficit stress was removed at day three, the
plant leaves rehydrated to the normal Ψleaf after one day (Figure 3.5). Complete
Page 74
49
recovery of the Ψleaf within one day after the removal of stress indicates that the stress
caused by PEG in this instance is reversible.
-1.2
-1
-0.8
-0.6
-0.4
-0.2
0
Day 0 (WDinitiated) Day 1 Day 2
Day 3 (WDremoved) Day 4 Day 5
Days
Leaf
wat
er p
oten
tial (
MP
a)
Control-0.25 MPa-0.5 MPa-0.75 MPa
Figure 3.5: Pre-dawn leaf water potential (Ψleaf) of rice plants exposed to different
water deficit stress treatments. Water stress treatments were initiated at day zero and
removed at day three. Error bars represent standard error (SE). Data points labelled with
the same letter are not significantly different (P<0.05) as determined by ANOVA
(n=10). WD = water deficit. ns not significant.
3.3.3. Changes in leaf gas exchange parameters under water deficit stress
Different osmotic levels in the growing media induced by PEG significantly
inhibited gas exchange of leaves in all treatments. Similar to the Ψleaf, water deficit
caused an instant decline in leaf net photosynthesis (A) (Figure 3.6), transpiration rate
(E) (Figure 3.7) and stomatal conductance (gs) (Figure 3.8) after one day of exposure.
When water deficit stress was relieved A, E and gs returned completely to the initial
level within two days (Figures 3.6, 3.7 & 3.8). Interestingly, the osmotic effect of the
growing media appeared to impact on the activities of leaf gas exchange more rapidly
than it did the Ψleaf (Figure 3.4). While it took only one day to reach a constant level of
leaf gas exchange, the water deficit required two days to completely reduce the Ψleaf to a
constant level. The level of A, E and gs was constant during the stress period, and the
a
bc
d
ns a
be
f
ns a
be
f
ns
Page 75
50
lower osmotic potentials of the growing media caused a greater reduction in A, E and gs
(Figures 3.6, 3.7 & 3.8).
0.0
5.0
10.0
15.0
20.0
25.0
30.0
Day 0 (WDinitiated)
Day 1 Day 2 Day 3 (WDremoved)
Day 4 Day 5
Days
Net
pho
tosy
nthe
sis
( µm
ol m
-2 s-1
)
Control
-0.25 MPa
-0.5 MPa
-0.75 MPa
Figure 3.6: Leaf net photosynthesis (A) of rice plants exposed to different water stress
treatment. Water stress treatments were imposed at day zero and removed at day three.
Data are the means of ten replicates with standard errors (SE) shown by vertical bars.
WD = water deficit.
0.0
2.0
4.0
6.0
8.0
10.0
Day 0 (WDinitiated)
Day 1 Day 2 Day 3 (WDremoved)
Day 4 Day 5
Days
Tran
spira
tion
rate
(mm
ol m
-2 s-1
)
Control
-0.25 MPa
-0.5 MPa
-0.75 MPa
Figure 3.7: Leaf transpiration rate (E) of rice plants exposed to different water stress
treatments. Water stress treatments were imposed at day zero and removed at day three.
Data are the means of ten replicates with standard errors (SE) shown by vertical bars.
WD = water deficit.
Page 76
51
0.0
0.2
0.4
0.6
0.8
Day 0 (WDinitiated)
Day 1 Day 2 Day 3 (WDremoved)
Day 4 Day 5
Days
Sto
mat
al c
ondu
ctan
ce (m
ol m
-2 s-1
)
Control
-0.25 MPa
-0.5 MPa
-0.75 MPa
Figure 3.8: Leaf stomatal conductance (gs) of rice plants exposed to different water
stress treatment. Water stress treatments were imposed at day zero and removed at day
three. Data are the means of ten replicates with standard errors (SE) shown by vertical
bars. WD = water deficit.
3.3.4. Water deficit affects grain set
To assess the effect of water stress on the grain set of rice plants, osmotic stress
was imposed for three consecutive days at -0.25, -0.5 and -0.75 MPa during anther
development. The results showed that low stress levels (-0.25 MPa) did not significantly
decrease the percentage of grain set compared with the control at any stage (Figure 3.9).
Meanwhile, higher levels of osmotic stress; -0.5 MPa and -0.75 MPa, caused a serious
decline in grain set (P<0.001). On average, a reduction of 24% and 34% of grain set was
recorded for plants subjected to osmotic stress at -0.5 and -0.75 MPa, respectively
(Figure 3.9).
Page 77
52
Figure 3.9: Grain set (%) of rice plants exposed to different water deficit treatments
during anther development. Data are the mean of five replicates with standard errors
(SE) shown by vertical bars. Bars showing the same letter at any stage are not
significantly different (P<0.001) as determined by ANOVA (n=5). LSD0.05 = 10.79.
PMC = pollen mother cell, VM = vacuolated microspore.
The greatest decrease in grain set was observed in the -0.75 MPa treatment
imposed during the PMC and tetrad stages (P<0.001; Figure 3.9). In general, the
percentage of grain set was less affected by water deficit treatment imposed during
microspore and vacuolated microspore stages.
3.3.5. Water deficit affects pollen viability and young microspore viability
Microscopic observations of vital staining for mature pollens and young
microspores of control and stressed plants by KI/I2 and FDA/PI respectively are shown
in Figure 3.10.
Page 78
53
Figure 3.10: Microscopic observation of mature pollen and young microspores stained
with KI/I2 and FDA/PI, respectively. Control (A) and stressed (B) mature pollen stained
with KI/I2.Unviable pollen is not stained with KI/I2 resulting in a yellow colour (white
arrows) in contrast to viable pollen which is stained dark blue. Control (C) and stressed
(D) young microspres. PI stained unviable microspores resulting in red fluorescence
(white arrows) in contrast to viable microspores stained by FDA (yellow to green).
Table 3.1 represents the percentage of viable mature pollen, and young
microspores of plants under different levels of water deficit stress during the PMC
stage. The data show a significant reduction of viable pollen at -0.5 and -0.75 MPa of
osmotic stress, while the percentage of viable pollen at osmotic stress of -0.25 MPa
remained unchanged when compared to the control viable pollen (P<0.001). Osmotic
stress caused approximately 16% and 24.5% reduction of viable pollen at -0.5 and -0.75
MPa, respectively (Table 3.1). Vital staining of young microspores with dual dyes
Page 79
54
(FDA/PI) showed a similar decreasing trend of young microspore viability during water
deficit stress (Table 3.1). Mild water stress of -0.25 MPa did not cause a significant
reduction of viable young microspores in comparison with the control (P<0.001),
however, higher levels of osmotic stress at -0.5 and -0.75 MPa caused a 20% and 35%
decline in viability of young microspores, respectively (P<0.001).
Viability (%)
Young microspore Pollen
Control 86.9 ± 6.0a 83.07 ± 6.85a
-0.25 MPa 82.7 ± 6.4a 79.09 ± 4.29a
-0.50 MPa 66.8 ± 6.6b 67.06 ± 14.46b
-0.75 MPa 52.1 ± 5.2c 53.63 ± 15.66c
LSD0.05 7.32 11.1
Table 3.1: Percentage of young microspore and mature pollen viability of plants under
different levels of water deficit stress during the PMC stage, as determined by FDA/PI
and KI/I2 vital staining, respectively. Data are the mean of five replicates with standard
errors (SE). Data in a column showing the same letter are not significantly different
(P<0.001) as determined by ANOVA.
3.3.6. Relationship between grain set, pollen viability and microspore viability
under water deficit stress at the PMC stage
To investigate the relationship between grain set, pollen viability and microspore
viability, a linear correlation was examined. Figure 3.11 presents the linear regression
analysis between grain set and pollen viability and Figure 3.12 presents the linear
regression analysis between grain set and young microspore viability. The data indicates
that there is a strong correlation between grain set and pollen viability (P<0.001, r2 =
Page 80
55
0.8168; Figure 3.11) at these stages. Likewise, grain set also exhibited a strong
correlation with young microspore viability (P<0.001, r2 = 0.8223; Figure 3.12). These
data indicate the important role of pollen viability and young microspore viability in
successful pollination and grain set.
y = 1.1085x - 10.781R2 = 0.8168
0
20
40
60
80
100
20 40 60 80 100
Pollen viability (%)
Gra
in s
et (%
)
Figure 3.11: Relationship between grain set and pollen viability of rice plants exposed
to water deficit stress during PMC stage.
y = 1.117x - 15.248R2 = 0.8223
0
20
40
60
80
100
40 50 60 70 80 90 100
Young microspore viability (%)
Gra
in s
et (%
)
Figure 3.12: Relationship between grain set and young microspore viability of rice
plants exposed to water deficit stress during PMC stage.
Page 81
56
3.3.7. Association of Ψleaf with grain set, pollen viability and microspore viability
under water deficit stress at PMC stage
The relationship between Ψleaf with grain set, pollen viability and microspore
viability was also determined. Under water deficit stress during the PMC stage, a strong
correlation between percentage of grain set and Ψleaf was observed (P<0.001, r2 =
0.8165; Figure 3.13). Similarly, Ψleaf also exhibited a strong relationship with the
number of viable mature pollen (P<0.001, r2 = 0.8016; Figure 3.14) and viable young
microspores (P<0.001, r2 = 0.8728; Figure 3.15). These results indicate the crucial
influence of the Ψleaf on percentage of viable pollen as well as grain set.
y = 60.289x + 98.856R2 = 0.8165
0
20
40
60
80
100
-1.2-1-0.8-0.6-0.4-0.20
Leaf water potential (MPa)
Gra
in s
et (%
)
Figure 3.13: Relationship between grain set and leaf water potential (Ψleaf) of rice
plants exposed to water deficit stress during PMC stage.
Page 82
57
y = 42.141x + 94.407R2 = 0.8016
0
20
40
60
80
100
-1.2-1-0.8-0.6-0.4-0.20
Leaf water potential (MPa)
Pol
len
viab
ility
(%)
Figure 3.14: Relationship between percentage viability of pollen and leaf water
potential (Ψleaf) of rice plants exposed to water deficit stress during PMC stage.
y = 49.101x + 95.473R2 = 0.8728
20
40
60
80
100
-1.2-1-0.8-0.6-0.4-0.20
Leaf water potential (MPa)
Mic
rosp
ore
viab
ility
(%)
Figure 3.15: Relationship between percentage viability of young microspore and leaf
water potential (Ψleaf) of rice plants exposed to water deficit stress during the PMC
stage.
Page 83
58
3.4. Discussion
3.4.1. PEG as an ideal osmotic inducer to control levels of water deficit
The concept of using an osmoticum such as PEG for controlling continuous and
constant soil water potential has been reported in the past (Painter, 1966; Zur, 1966).
Before the advent of PEG, withholding water from the soil was a widely accepted
technique to experimentally induce water stress to plants (Krizek, 1985). While the
water potential of a PEG solution can be controllable, it is almost impossible to know
the water potential at the root surface of plants grown in soil using water withholding
methods as water is continuously taken up by the root system (Krizek, 1985). High
solubility in water, low toxicity to mammals (Lawlor, 1970) and ability to control the
water potential are characteristics that make PEG popular as an osmoticum to decrease
the water potential of the growing medium for studying responses of higher plants to
water deficit.
Often, the application of PEG as an osmotic stress inducer involves the use of a
semi-permeable membrane to overcome problems of ionic effects. There have been
concerns about the ionic toxicity of PEG absorbed by plants (Janes, 1966; Lawlor,
1970; Kaufmann & Eckard, 1971; Janes, 1974). The deposition of high molecular
weight PEG can be found in leaves causing leaf tip necrosis (Lawlor, 1970) and large
amounts of heavy metals, especially aluminum and magnesium, in PEG compounds
may be toxic to plants (Lagerwerff et al., 1961). PEG has also been found to inhibit the
passage of phosphorus and water into plants (Emmert, 1974). However, PEG only
causes detrimental effects once it enters the tissue via damaged roots (Lawlor, 1970).
Carpita et al. (1979) reported that PEG molecules with molecular weights ≥ 6,000 are
unable to penetrate the cell wall pores and therefore, as a result of movement of water
out of the cell wall, only causes plasmolysis in severe cases (Oparka, 1994). To ensure
Page 84
59
there are no ionic effects, only PEG with a high molecular weight (20,000) and high
purification (pharmaceutical grade) was used in these experiments.
At the onset of this study, many attempts were made to apply the osmotic stress
produced by PEG to rice plants growing in soil using a semi-permeable membrane
(Chapter 2, Section 2.2.1). Using a membrane might potentially help overcome the
problem of direct contact between PEG and roots that might cause toxicity to the root
system. However, after several trials, it was decided that the membrane appeared to be
causing a restriction of movement of water across the membrane (personal
observations). In addition, it was technically very difficult to keep the membrane intact
during the experimental period. The membrane degraded quickly due to natural
microbial action. In addition, strong root development punctured the membrane within
one to two weeks. Replacing the membrane repeatedly and using other protective
materials (hand-made socks) did not aid in maintaining membrane integrity.
Another approach was to expose plants grown in the soil directly to the PEG
solution, but this was also ineffective. Because the water retention capacity of the soil
was high, it took too long for the water deficit stress to take effect. A trial was
conducted by withholding water to some plants and observing how long it would take
for them to be stressed. The plants did not show any stress symptoms (leaf rolling) after
4 - 5 days. This would make it very difficult to coincide the stress with the sensitive
developmental stages of the plants e.g. pollen mother cell stage. In addition, PEG can
potentially permeate through the soil, which might result in a permanent water deficit
stress, as PEG could not be removed completely after exposure.
In this case growing plants hydroponically was decided to be more feasible and
the most reliable method for stress induction. The idea was that potting mix (mainly tree
bark and coarse sand) is very poor in water holding capacity (and perhaps once applied
Page 85
60
stress would take effect very quickly). Moreover, the root system of plants grown
hydroponically can easily come into contact with the hydroponic medium containing
PEG. This characteristic makes it easy to stress as all roots are exposed directly to the
chemical. Successful employment of PEG to induce water stress in cotton, maize
(Lawlor, 1970; Stikic & Davies, 2000), pepper (Janes, 1974), potato (Bussis et al.,
1998; Zgallai et al., 2005), wheat, oats and barley (Kaul, 1966) and rice (Choi et al.,
2000; Cabuslay et al., 2002; Lian et al., 2004; Zhou et al., 2007) support the use of PEG
as an osmotic stress inducer without a membrane.
The results from the experiments conducted in this study show that rice plants
subjected to osmotic stress induced by PEG, at any level, significantly decreased Ψleaf in
comparison to the control (Figure 3.5). Moreover, water stress also decreased the level
of A (Figure 3.6), E (Figure 3.7) and gs (Figure 3.8). In general, the advantage of PEG
to induce water deficit compared to a withholding water method (Figure 3.1) is to
generate more precise and constant osmotic stress to plants. The results from Ψleaf
(Figure 3.5) and gas exchange measurements (Figures 3.6, 3.7 & 3.8) indicate that the
PEG solution produced an almost constant osmotic level throughout the stress period.
Moreover, no symptoms of toxicity were found in rice plants exposed to the PEG
solution for three successive days in this experiment. Complete recovery of Ψleaf, A, E
and gs (Figures 3.5, 3.6, 3.7 & 3.8) indicates that the stress caused by PEG was not
permanent and could be reversed when PEG was removed.
There are several hypotheses on how PEG causes osmotic effects. Some authors
suggest that PEG may block transpiration pathways of plants and thus cause stress
(Janes, 1961; Lawlor, 1970). Janes (1966) conducted experiments on bean and pepper
and concluded that imposing an osmotic stress on the roots reduces the rate of water
entry and thus the water supply to leaves.
Page 86
61
However, the chemical structure of PEG may be the most reasonable
explanation for its osmotic effect. Structurally, PEG is described as a linear polymer of
ethylene oxide with a hydroxyl terminal. In water it is soluble at moderate temperatures
in any concentration over a wide range of degrees of polymerization (Hui et al., 1999).
The chains of repeating ethylene oxide monomers form helical coils which maximize
hydrogen bonding while minimizing the number of exposed hydrophobic groups
(Kjellander & Florin, 1981). Therefore, it is believed that the water solubility of PEG is
the result of the coil structure of its backbone (Beily & Koleske, 1987; Schiller et al.,
1988), where the hydrogen of water interacts with the oxygen of the ethylene oxide
group by hydrogen bonding (Graham & Chen, 1993). Although the oxygen atom of the
helical chain has been shown to associate with one or several molecules of water to
form various hydrates (Liu, 1968; Maxfield & Shepherd, 1975), it has been
demonstrated that each ethylene oxide group in the helix chain requires three water
molecules to form a stable hydrated complex (Liu & Parsons, 1969; Graham et al.,
1982). This interaction between PEG and water has resulted in a substantially lower
diffusion coefficient of water near the polymer chain than that in bulk water. Blow et al.
(1978) demonstrated that there is no free water at 45% PEG. This high affinity for water
is responsible for the unusual osmotic reduction of PEG solutions.
The decline of available oxygen in PEG solutions (with molecular weight ≥
4,000 and osmotic potential ≤ -0.7 MPa) has also been considered a possible cause of
root growth inhibition (Mexal et al., 1975). This possibility, however, may not be the
case in rice plants because of the ability of rice shoots to supply sufficient oxygen to
roots while growing in anaerobic environments (John et al., 1974). Moreover, healthy
roots observed after osmotic stress by PEG in this study (Figure 3.4) eliminate this
Page 87
62
hypothesis. Perhaps more branched and elongated roots after stress treatment might
indicate the response of the rice roots in the search for water.
3.4.2. Water deficit stress reduced male fertility
Three consecutive days of exposure to mild water deficit at -0.25 MPa did not
significantly reduce grain set, whilst a serious decline of grain set was obvious at -0.5
MPa and -0.75 MPa of osmotic stress (Figure 3.9). Water deficit occurring at any time
during pollen development from PMC to VM stages resulted in significant grain loss
(Figure 3.9). This characteristic has been well documented in the literature (Saini &
Westgate, 2000). Although analysis of variance was only meaningfully different at the
microspore stage at -0.5 MPa osmotic stress, plants subjected to water deficit stress at
PMC to tetrad stage seemed to suffer the most damage (Figure 3.9). These data are
supported by earlier findings of sensitive stages of rice plants to water stress which
claimed that the most sensitive stage centres around meiosis (Saini & Lalonde, 1998;
Saini & Westgate, 2000; Yang et al., 2007). The reduction of grain set could be ascribed
to the decrease in number of viable pollen in the present study (Table 3.1).
Theoretically, only a single pollen grain is needed for fertilization in every individual
floret. In practice, however, a large number of engorged pollen is required for the
successful pollination of the floret. Therefore, the number of viable pollen has been
used as an indicator of fertility in rice (Gunawardena et al., 2003; Oliver et al., 2005)
and other cereals (Saini & Aspinall, 1981; Schoper et al., 1986). The strong positive
linear relationship between grain set and pollen viability confirms this hypothesis
(Figure 3.11).
The result of pollen vital staining with KI/I2 showed a considerable amount of
unstained pollen that signifies a lack of starch (Figure 3.10B & Table 3.1). Starch is
considered a major energy source for pollen development and germination (Pacini &
Page 88
63
Franchi, 1988; Clement et al., 1994), hence the absence of this energy source could lead
to pollen sterility. The level of starch has been found to be reduced in anthers from
plants exposed to water stress (Dorion et al., 1996; Sheoran & Saini, 1996; Lalonde et
al., 1997a) and chilling stress (Gunawardena et al., 2003; Oliver et al., 2005). These
findings indicate that the process of starch biosynthesis and deposition in pollen grains
is somehow inhibited by stresses. However, this starch staining method by KI/I2 can
only be used to validate mature pollen at the late developmental stages that may not
truly tell the immediate effects of water deficit on the developing microspores.
Moreover, starch filling in rice pollen occurs a few days prior to anthesis (Raghavan,
1988) and it is probable that water stress could have already caused the failure of young
microspores before they reach the starch filling stage.
Heslop-Harrison & Heslop-Harrison (1970) developed a vital staining method
using FDA to test the integrity of the cellular plasma membrane which was claimed to
be closely correlated with pollen viability. The principle of the method is that the
fluorescent dye in the form of an esterase is readily hydrolyzed by enzymes secreted
from intact cellular plasma membranes. The fluorescein will be intracellularly entrapped
and therefore can be detected by its fluorescence. Meanwhile, damaged cellular
membranes cannot hold the intracellular fluorescein and it will diffuse back to the
culture medium. Huang et al. (1986) developed a method using a mixture of double
dyes FDA and PI to test the viability of aleurone protoplasts from barley. By contrast to
FDA, PI cannot generally enter the intact cells, but it can easily penetrate the cells with
damaged plasma membranes resulting in fluorochromasia of both the nucleus and
cytoplasm in dead cells (Huang et al., 1986). Therefore double staining using a mixture
of FDA/PI dyes can differentiate the intact cells (potentially viable) and damaged cells
(potentially unviable). Dual staining with FDA and PI has been applied successfully in
Page 89
64
the past by some investigators (Zhang et al., 1992; Li, 2005; Oliver et al., 2005) to test
young microspore viability. Therefore, a vital staining method combining FDA and PI
has been the method of choice in this study in addition to KI/I2. Interestingly, the results
from dual staining for young microspore viability demonstrated a serious reduction of
fertility immediately after the water deficit was removed (Figure 3.10D & Table 3.1). A
strong positive relationship between grain set and number of viable young microspores
(Figure 3.12) supports this idea. This reduction of viable young microspores might
therefore be considered to result from instant effects of water deficit on developing
microspores.
3.4.3. Association of Ψleaf with reduction of grain set and pollen viability
Amongst the criteria representing plant-water relationships, Ψleaf is most widely
used and often recognized as an index for whole plant water status (Turner, 1982).
Under drought conditions, rice lines which could maintain a high Ψleaf had a lower
percentage of spikelet sterility (Jongdee et al., 2002) and maintenance of a high Ψleaf
during the flowering stage has been reported to be associated with high spikelet fertility
(O'Toole & Namuco, 1983; Ekanayake et al., 1989). An increase in spikelet sterility has
been shown to be related to a serious decline in the panicle turgor potential and relative
water content at anthesis (Selote & Khanna-Chopra, 2004). A decline in the flag leaf
Ψleaf from -0.5 MPa to -0.9 MPa in comparison to the corresponding controls has been
reported to result in an approximate reduction of 30% grain set (Selote & Khanna-
Chopra, 2004). Therefore, Ψleaf has been proposed as an indicator for selecting drought
tolerant rice varieties (Jongdee et al., 2002). Consistent with previous reports, the
results in this study show that there was a strong positive linear relationship between
Ψleaf at day three of water deficit stress during PMC with grain set (P<0.001, r2 =
0.8165; Figure 3.13), mature pollen viability (P<0.001, r2 = 0.8016; Figure 3.14) and
Page 90
65
young microspore viability (P<0.001, r2 = 0.8728; Figure 3.15). On average, the decline
of the predawn Ψleaf during the six days since the initiation of water deficit stress from -
0.26 MPa (control) to -0.35 Mpa (-0.25 MPa treatment) did not cause a significant
reduction of plant fertility, meanwhile the predawn Ψleaf of -0.49 MPa (-0.5 MPa
treatment) and -0.58 MPa (-0.75 MPa treatment) significantly decreased plant fertility
(Figures 3.5 & 3.9). The decrease of the grain set and plant fertility in the present study
could directly be attributed to the decline in Ψleaf under water deficit stress induced by
PEG.
3.5. Conclusion
This chapter has illustrated the feasibility of using PEG as an osmotic regulator
for controlling, precisely and constantly, water deficit stress in rice plants grown
hydroponically. Some concerns regarding the possible toxicity of PEG in inducing
osmotic stress could be negated by using high molecular weight and high grade PEG.
The results presented in this chapter also demonstrate that a three day consecutive
exposure to -0.5 MPa and -0.75 MPa osmotic stress significantly reduced grain set and
pollen viability, whilst lower levels of osmotic stress at -0.25 MPa did not significantly
affect these parameters. Therefore the osmotic level of -0.5 MPa, which has been
regarded as a mild stress level in some reports (Cabuslay et al., 2002), could be
considered as a critical point and hence will be applied to all other experiments hereafter
unless otherwise stated. Moreover, the strong correlation between grain set, pollen
viability and microspore viability again proved that fertility of rice plants under water
deficit stress could be assessed at the early stage using a young microspore viability
index which could be determined immediately after removal of the water deficit stress.
Page 91
66
CHAPTER 4: WATER DEFICIT AFFECTS SUGAR METABOLISM IN ANTHERS
4.1. Introduction
Many investigators have focussed on the effects of environmental stresses such as
chilling and drought on carbohydrate metabolism in rice anthers (Sheoran & Saini,
1996; Oliver et al., 2005; Alfred, 2006) with particular interest in the role of acid
invertases. As discussed in Chapter 1, abnormally high levels of non-reducing sugars
(mainly sucrose) and reducing sugars (mainly glucose and fructose) from anthers of
plants subjected to water and chilling stress have been proposed to be the result of
impairment of vacuolar and cell wall acid invertases (Ito, 1978; Dorion et al., 1996;
Sheoran & Saini, 1996; Koonjul et al., 2005; Oliver et al., 2005). Transcriptional down
regulation of cell wall invertases has been claimed to cause the blockage of sugar
supplies to developing microspores, consequently leading to a failure of starch
deposition in unviable pollen (Koonjul et al., 2005; Oliver et al., 2005; Alfred, 2006).
However, there is little information in regard to the immediate effects of stresses on
sugar metabolism in anthers. Results from dual staining of early microspores with FDA
and PI (Chapter 3) illustrated that water deficit imposed for three consecutive days
caused a significant impairment of early microspore development. Dead microspores
might directly result from improper functioning of respiratory pathways such as
glycolysis, TCA cycle and oxidative phospholylation, which are considered as central
energy generators for growing anthers.
Moreover, morphological and cytological studies of male gametophyte
development of rice anthers have shown that plasmodesmatal connections between the
tapetum and other cell layers of the anther wall are not detectable post meiosis, and
formation of the callose wall (β-1, 3 glucan) segregates the meiocytes from the anther
Page 92
67
walls (Raghavan, 1988; Li, 2005; Mamun et al., 2005b). The tapetum layer plays a
critical role in controlling pollen development and ultimately plant fertility, by
supplying nutrients to the developing pollen and pollen wall (Pacini, 1990; Piffanelli &
Murphy, 1998). Because of this symplastic isolation, carbohydrate supply to the
tapetum cells and the developing microspores might require apoplastic transport
(Clement & Audran, 1995; Truernit et al., 1999; Mamun et al., 2006). In other words,
the importation of sugars from connective tissues into the anther locules to support
developing microspores may involve the activity of several disaccharide and
monosaccharide transporters. Active sugar carriers such as sucrose transporters and
monosaccharide transporters have been known to play crucial roles during flowering
and grain development in rice (Takeda et al., 2001; Lim et al., 2006) and other plants
(Sauer, 2007). However, there is a lack of information regarding this mode of sugar
unloading and transport in anthers. Some models of sugar unloading and transport in
Lilium and rice anthers have been proposed (Clement & Audran, 1995; Alfred, 2006),
however they all remain speculative and incomplete.
This chapter will therefore extend previous work by further exploring the effects
of water deficit stress on carbohydrate metabolism in rice anthers. New findings that
supplement the existing models of sugar unloading and transport in the anther are
presented. Moreover, the association of carbohydrate metabolism in rice anthers with
pollen abortion under drought is also discussed in detail.
4.2. Materials and methods
4.2.1. Plant materials, water stress treatment and anther collection
Plant culture and anther collection are carried out as described in Chapter 2
(Section 2.2.2 & 2.4). Mild water stress treatment at -0.5 MPa was initiated as described
in Chapter 2 (Section 2.3.2). Plants were stressed for three consecutive days at
Page 93
68
individual stages centring on the PMC, tetrad and microspore stage. Anthers from
treated plants were collected immediately after the removal of the stress and
distinguished as tetrad, microspore, and vacuolated microspore stage by light
microscopy.
4.2.2. Carbohydrate extraction and measurement
Anther carbohydrates were extracted according to the method of Dorion et al.
(1996). Anthers (15-25 mg of fresh weight) were ground in liquid nitrogen to a fine
powder. Five hundred microlitres of 80% (v/v) ethanol was added and the homogenate
was incubated in a water bath at 70oC for 10 minutes then allowed to cool to room
temperature. After centrifugation at 10,000 rpm for 5 minutes, the supernatant was
decanted to a fresh tube and the pellet was extracted another two times with ethanol as
described above. The supernatants were pooled and aliquots were used to measure
sugars.
4.2.2.1. Total soluble sugars
Total soluble sugars were determined using the anthrone method (Yemm &
Willis, 1954). Four mL of anthrone solution (0.15 g anthrone in 100 mL 80% H2SO4)
was added to 100 µL of the soluble sugar extract and incubated in a boiling water bath
for 10 minutes and allowed to cool to room temperature. The absorbance of the samples
was determined spectrophotometrically at 620 nm using glucose as the standard. The
data are presented as D-glucose equivalents.
4.2.2.2. Reducing sugars
Reducing sugars were determined using the copper/arseno-molybdate method
(Nelson, 1944). After addition of 1 mL copper solution to 200 µL of the soluble sugar
extract, the mixture was incubated in a boiling water bath for 20 minutes. Arseno-
molybdate solution was added and incubated at room temperature for 10 minutes. The
Page 94
69
absorbance of the samples was determined spectrophotometrically at 500 nm using
glucose as the standard. The data are presented as D-glucose equivalents.
4.2.2.3. Sucrose and hexoses
Sucrose and hexoses were determined enzymatically using a Sucrose, D-
Fructose and D-Glucose assay kit (Megazyme International Ireland Limited). In brief, a
0.1 mL aliquot of the extract was mixed with 2.42 mL buffer, which contained 2.1 mL
distilled water, 0.1 mL imidazole buffer, 0.1 mL NADP+/ATP, and 0.02 mL HK/G6P-
DH (all unit definitions are according to the supplier Megazyme) to convert D-glucose
to glucose-6-phosphate, which is then oxidised by NADP+ to gluconate-6-phosphate.
NADPH production by this reaction was measured at 340 nm and was used as a
measure for the amount of D-glucose in the sample. Phosphosglucose isomerase (PGI)
(0.02 mL) was then added to the reaction to convert fructose-6-phosphate to glucose-6-
phosphate. The glucose-6-phosphate thus formed reacts in turn with NADP+ forming
gluconate-6-phosphate and NADPH, leading to a further rise in absorbance that
accounts for the amount of D-fructose. The sucrose in the extract was first hydrolysed
by adding 0.2 mL β-fructosidase to the reaction buffer and the total D-glucose in the
sample following the hydrolysis of sucrose was determined as described above. The
sucrose content is calculated from the difference in D-glucose concentrations before and
after hydrolysis by β-fructosidase.
All measurements were carried out on three extracts prepared from different sets
of plants, grown at different times and treated under the same conditions, unless
otherwise stated.
4.2.3. RNA extraction and real time qRT-PCR
Total RNA extraction and quantification are as described in Chapter 2 (Section
2.5 & 2.6). Table 4.1 shows specific primers of the targeted genes. Initial conventional
Page 95
70
RT-PCRs for detection and cDNA sequencing to confirm homology of amplified
products and transcripts of interest were carried out as described in Chapter 2 (Section
2.6). Rice OsTuba1 gene (Genebank ID AF182523) was used as a reference control in
the real-time qRT-PCR as described in Chapter 2 (Section 2.6). The reaction mixture
using gene specific primers is as described in Chapter 2 (Section 2.6).
Protein (gene) name Genebank ID Primer sequence (5’-3’) cDNA size (bp)
Apoplastic invertase AY578161 [F] GATCAAGGGAACTGATACTTTACA 195
(OsCIN4) [R] CTCGTCCATGTTATCAGAGGCA
Sucrose transporter AB091674 [F] CTAGTGCGAAACTCCATCAAA 249*
(OsSUT5) [R] AAAATATTTGGGTTTCCTGAGAT
Monosaccharide transporter AY643749 [F] GTGCTGTTCAAGACCATCGG 184
(OsMST7) [R] TCAGTGTCCCAAGAATAAAC TG
Fructokinase AF429948 [F] CAGGGATTTCCGCGGAGCTGT 134
(OsFKI) [R] GCTTCTTCTGATCTTGCAACGAT
Hexokinase DQ116385 [F] CACTACTGAGGGTTTATTCAACTT 178
(OsHXK3) [R] CGTGTCTCTGATGGAAAATCC TT
Table 4.1: Target genes for analysis of expression profiles. (*) Primer sequence adapted
from Aoki et al.(2003). F forward primer, R reverse primer.
Gene name Denaturing Annealing Elongation Optional step
OsCIN4 94°C – 20secs 61oC – 30secs 72oC - 25secs Not applied
OsSUT5 94oC – 15secs 55oC – 30secs 68oC - 20secs 79oC – 15secs
OsMST7 94oC – 20secs 60oC – 30secs 68oC - 15secs 79oC – 15secs
OsFKI 94oC – 20secs 63oC – 30secs 72oC - 25secs Not applied
OsHXK3 94oC – 20secs 62oC – 30secs 68oC - 25secs Not applied
Table 4.2: Cycling profiles for real time qRT-PCR reactions.
Page 96
71
In general, qRT-PCR consisted of a reverse transcription step at 50oC for 20
minutes, and then initial denaturation at 94oC for 5 minutes following 35-40 cycles, was
applied to duplicate samples of all genes under investigation. Variations in temperature
and steps during the cycles of individual genes are presented in Table 4.2. Specificity of
amplified products was monitored by an optional step and a melt curve at the end of
RT-PCR reactions. Fluorescent signals were acquired at the last step during cycles. The
real-time amplification data were statistically analysed as described in Chapter 2
(Section 2.6).
4.2.4. In situ hybridisation
4.2.4.1. Maintenance of an RNase free environment
It is crucial to maintain an RNase free environment for the whole process of in
situ hybridisation. All equipment e.g. glassware, slide holders, etc. used for the
procedure were pre-soaked in 2% Pyroneg overnight, cleaned thoroughly with double
distilled water and autoclaved at 121oC for 20 minutes. A final rinse was carried out
with 0.1% diethylene pyrocarbonate (DEPC) treated water shortly before use to ensure
complete elimination of RNase (Sambrook & Russell, 2001). All solutions were made
using DEPC treated water. Bench surfaces and fumehood areas were soaked with
RNase Away (Sigma-Aldrich, Australia) and wiped off using RNase free towels before
use.
4.2.4.2. Paraffin embedded section preparations
Paraffin embedded sections were prepared as described in Chapter 2 (Section
2.7).
4.2.4.3. Single stranded RNA probes
Because of its higher effectiveness and sensitivity compared to double stranded
RNA or nick translated DNA probes (Cox et al., 1984), single stranded RNA probes
Page 97
72
were chosen for this in situ hybridisation experiment. cDNAs of targeted genes were
cloned into a pGEM-T-easy vector (Promega, Australia), which contains restriction
sites within the multiple cloning regions, according to the manufacturer's instructions. In
brief, 1 µL of cDNA fragment was ligated with 1 µL pGEM-T-easy vector in a reaction
mixture including 2 µL sterilised distilled water, 5 µL 2X rapid ligation buffer, and 1
µL T4 ligase enzyme. After a 60 minute incubation at room temperature, the
recombinant vector was subsequently transformed into JM109 high efficiency
competent cells by heat shock at 42oC for 45 seconds and further incubated in 950 µL of
SOC medium (Appendix I) at 37oC with shaking for 1.5 hours. 100 µL of the
transformation mix was evenly spread on an ampicillin Luria-Bertani (LB) agar plate
(Appendix I) which contained 20 µL of 50 mg/mL X-Gal (5-Bromo-4-chloro-3-indolyl
β-D-galactopyranoside) (Sigma-Aldrich, Australia) and 100 µL of 100 mM isopropyl β-
D-1-thiogalactopyranoside (IPTG) (Sigma-Aldrich, Australia). The plates were then
incubated upside down overnight at 37oC.
PCR screening of recombinant plasmids was carried out by the method of Lee &
Cooper (1995) the following day. The white bacterial colonies, which often carry cDNA
inserts, were individually inoculated onto fresh ampicillin LB plates and incubated at
37oC. Part of this same colony was also resuspended in a 1.5 mL microcentrifuge tube
containing 100 µL of sterile double distilled water and incubated at 95oC for 5 minutes.
The suspension was centrifuged at 13,000 rpm for 5 minutes to remove cell debris. The
supernatant was used for subsequent PCR. The PCR mixture of 10 µL contained: 1X
PCR buffer, 200 µM dNTPs, 1.6 mM MgCl2, and 200 nM gene specific primers. The
PCR profile was similar to the RT-PCR described in Chapter 2 (Section 2.6.2) with the
exception that the RT cycle was omitted. Amplified products were electrophoresed in a
1% agarose gel for 1.5 hours at 90 V. The agarose gel was post stained in a water bath
Page 98
73
containing ethidium bromide and visualised under a UV light. The bacterial colonies,
which yielded PCR products with a similar band size to the cDNA from the RT-PCR
reaction of the same gene, were considered positive and subcultured again.
Plasmid DNA was isolated from the screened bacterial colonies using Wizard®
Plus SV Minipreps DNA purification kit (Promega, Australia) following the
manufacturer’s instructions with some modifications. Briefly, the subcultured cells were
directly resuspended in a 1.5 mL microcentrifuge tube containing 250 µL of cell
resuspension solution and vortexed. A subsequent 250 µL of cell lysis solution was
added and gently mixed by inverting the tube. The mixture was further incubated with
10 µL of alkaline protease solution for 5 minutes at room temperature. The bacterial
lysate was centrifuged for 10 minutes at 13,000 rpm after adding 350 µL of
neutralisation solution. The cleared lysate was decanted to a spin column and
centrifuged at 13,000 rpm for 1 minute at room temperature. The column was washed
twice with column wash solution containing 95% ethanol. The plasmids were eluted by
adding 50 µL of nuclease-free water and centrifuged for 1 minute at 13,000 rpm.
The orientation of the DNA insert within the pGEM vector was confirmed by
sequencing analysis so that the appropriate RNA polymerase (T7/SP6) could be applied
to generate either sense or antisense probes. The procedure used to prepare plasmids for
sequencing analysis was similar for cDNA as described in Chapter 2 (Section 2.6.2).
Plasmids containing DNA inserts of interest were linearised with either NcoI or
SpeI restriction enzyme which generates DNA fragments with 5’ protruding ends
(Schenborn & Mierendorf, 1985). Linearised plasmids were purified using a QIAquick
PCR purification kit (QIAGEN, Australia) as described in Chapter 2 (Section 2.6.2).
RNA probe synthesis was carried out in vitro using a DIG RNA labelling kit (SP6/T7)
(Roche, Australia) according to the manufacturer’s instructions. Briefly, 1 µg of
Page 99
74
purified template DNA was incorporated in 13 µL labelling mix containing 2 µL 10X
NTP labeling mixture, 2 µL 10X transcription buffer, 2 µL protector RNase inhibitor
and 2 µL appropriate RNA polymerase. The mixture was centrifuged briefly and
incubated at 37oC for 2 hours. 2 µL of DNA I RNase free was added to remove template
DNA and further 15 minute incubation was conducted. The reaction was stopped by
adding 2 µL 0.2 M EDTA (pH 8.0).
Newly transcribed RNA probes were analysed by formaldehyde agarose (FA)
gel electrophoresis. A mini FA gel (1% agarose) was prepared by melting 0.3 g ultra
pure agarose in 27 mL DEPC treated H2O. After cooling to 65°C, the gel mixture was
further supplemented with 3 mL 10X 3-morpholinopropanesulfonic acid (MOPS) buffer
(pH 7.0), 0.3 mL of 37% ultra pure formaldehyde (PCR grade) and 2 µL of a 10 mg/mL
ethidium bromide solution. The gel was then poured and allowed to set for around 40
minutes. About 2 µL of RNA marker (Sigma, Australia) and 6 µL of probes were
individually mixed with RNA loading buffer [(62.5% (v/v) deionised formamide, 1.14
M ultrapure formaldehyde, 1.25X MESA buffer (50 mM MOPS, 12.5 mM sodium
acetate, and 1.25 mM EDTA, pH 7.0), 200 µg/mL bromphenol blue, 200 µg/mL xylene
cyanole FF)], incubated at 65oC for 5 minutes, then immediately chilled on ice and
subsequently loaded onto the gel. The gel was electrophoresed for 1 hour at 90 V in 1X
MOPS buffer (pH 7.0) with 1% ultra-pure formaldehyde solution, then visualised and
photographed under a UV light. Care was taken to prevent RNase contamination during
the electrophoresis step. All gel apparatus was soaked in a 0.2% SDS solution overnight
and thoroughly washed with tap water and then DEPC water.
4.2.4.4. Hybridisation
The hybridisation procedure was carried out following the method of
Komminoth (2002) with some modifications. In brief, 8 µm thick paraffin embedded
Page 100
75
sections were dewaxed twice in fresh xylene for 10 minutes each time, and rehydrated
in a series of ethanol washes (100%, 95%, and 70%) once for 5 minutes each series and
washed in DEPC treated water twice for 2 minutes each. The sections were then
incubated in 0.2 M HCl containing 0.1% pepsin at 37oC for 15 minutes. After washing
twice for 5 minutes in DEPC treated 1X PBS, the sections were further permeabilised
for 30 minutes at 37oC with TE buffer containing 50 µg/mL RNase free Proteinase K.
Proteinase K treatment was stopped by incubating sections for 1 minute in 2 mg/mL
glycine in PBS followed by two 1 minute incubations in DEPC treated PBS. Post-fixing
the sections was carried out for 5 minutes with 4% paraformaldehyde in PBS.
Following fixation, the sections were washed twice for 5 minutes each with DEPC
treated PBS. Acetylation of sections was carried out in 0.1 M triethanolamine (TEA)
buffer at pH 8.0, containing 0.25% (v/v) acetic anhydride for 10 minutes with vigorous
agitation on a shaker. After treatment with acetic anhydride, the sections were rinsed
twice for 1 minute each in PBS buffer.
Hybridisation was carried out by incubating each section with 30 µL of
hybridisation buffer containing 40% deionized formamide, 10% dextran sulfate, 1X
Denhardt’s solution, 4X SSC, 10 mM DTT, 1 mg/mL yeast t-RNA, 1 mg/mL fish sperm
DNA and 10 ng of RNA probe. Sections were then covered with hydrophobic
hybridisation slips and incubated at 50oC overnight in a humidified chamber. Negative
controls were carried out by substituting sense for antisense probes in the hybridisation
solution. The following day, coverslips were removed from sections by immersing
slides for 5 min in 2X sodium chloride sodium citrate buffer (SSC). Stringent washes
for sections with 2X SSC were conducted in a shaking water bath at 37oC, twice for 15
minutes each. To eliminate any single-stranded RNA probe, sections were incubated for
30 minutes at 37oC in NTE buffer (500 mM NaCl, 10 mM Tris, 1 mM EDTA, pH 8.0)
Page 101
76
containing 20 µg/mL RNase A. Two final washes with 0.1X SSC were also carried out
in a shaking water bath at 37oC for 15 minutes each.
4.2.4.5. Immunological detection
Immunological detection of DIG labelled RNA probes was carried out using a
DIG nucleic acid detection kit (Roche, Australia) following the manufacturer’s
instructions. In brief, following the 0.1X SSC wash, the sections were incubated twice
in washing buffer which contains 0.1 M maleic acid, 0.15 M NaCl, pH 7.5, 0.3% (v/v)
Tween 20, for 5 minutes each at room temperature. Afterwards, the sections were
incubated with blocking solution (0.1 M maleic acid, 0.15 M NaCl, pH 7.5, 1%
blocking reagent) for 30 min at room temperature. Further incubation was performed on
sections in a humidified chamber for 2 hours at 25°C with anti-DIG-AP in blocking
solution (ratio 1:200). Two wash steps were carried out afterwards with washing buffer
for 5 minutes each. After 10 minutes equilibration with detection buffer (0.1 M Tris-
HCl, 0.1 M NaCl, pH 9.5), each section was covered with 50 µL colour substrate
solution containing nitroblue tetrazolium chloride/5-bromo-4-chloro-3-indolyl-
phosphate, toluidine salt (NBT/BCIP) stock solution and detection buffer at a ratio of
1:20 and incubated in a humidified chamber overnight at 25°C in the dark. When colour
development was clearly visible, the colour reaction was stopped by incubating the
slides in TE buffer (10 mM Tris-HCl, 1 mM EDTA, pH 8.0). Sections were dehydrated
briefly through a series of ethanol washes (70%, 95%, and 100%), covered and sealed
with nail polish, and allowed to air dry for 5 minutes. The slides were then directly
viewed under a light microscope (Olympus BX51, Japan) using bright field and images
were captured for further analysis.
Page 102
77
4.3. Results
4.3.1. Changes in the level of carbohydrate
In unstressed anthers, the level of total soluble sugars did not vary remarkably
from the tetrad to vacuolated microspore stage (Figure 4.1) whilst reducing sugars
increased steadily over the period (Figure 4.2). Anthers of plants subjected to three day
water stress treatment at -0.5 Mpa have increased levels of both total (Figure 4.1) and
reducing sugars (Figure 4.2). These results indicate that sugars were abnormally
accumulated in rice anthers after drought treatment. In drought stressed anthers at the
tetrad stage, the levels of total and reducing sugars was more than twice that of the
untreated controls (P<0.001; Figures 4.1 & 4.2). The total sugar at the vacuolated
microspore stage was almost three times higher in stressed anthers than in the control
(Figure 4.1).
The level of sucrose in the anthers under normal growing conditions fluctuated
from 96 -132 µmol g-1 fresh weight (FW) (P<0.001; Figure 4.3), whilst the level of
glucose and fructose increased steadily throughout the growing period from the tetrad to
vacuolated microspore stage (P<0.001; Figures 4.4 & 4.5). This suggests an important
role of hexoses during anther development. Results from the drought stressed anther
assays showed that the level of sucrose, glucose and fructose all increased after the
water stress (Figures 4.3, 4.4 & 4.5). On average, the level of sucrose by the post water
stress period was 1.4 times higher (Figure 4.3) whilst it was 1.6 fold higher for glucose
and fructose after stress (Figures 4.4 & 4.5). Intriguingly, stressed anthers at the
vacuolated stage did not show a significant increase in sucrose (Figure 4.3). Although
the pattern of change in sucrose, glucose and fructose levels (Figures 4.3, 4.4 & 4.5)
were the same as those of total and reducing sugars (Figures 4.1 & 4.2), the level of the
former group exceeds that of the latter group at all three stages. This inconsistency may
Page 103
78
be a result of the sample variation and the difference in the techniques used in the two
cases. The total and reducing sugars were measured indirectly based on amount of
glucose equivalents standard, while measurement of sucrose, glucose and fructose were
quantified individually based on enzymatic reactions. Similar discrepancies have been
reported in other carbohydrate assays (Dorion et al., 1996; Oliver et al., 2005).
0.0
40.0
80.0
120.0
160.0
200.0
Tetrad* Microspore* Vacuolated microspore*Tota
l car
bohy
drat
e ( µ
mol
glu
cose
equ
ival
ents
g-1
FW
)
Control Stressed
Figure 4.1: Effect of water deficit treatment on total sugar levels in rice anthers treated
at different stages. Total carbohydrate was measured using the anthrone method.
Vertical bars are standard errors (SE). Data are the mean of three replicates ± SE. The
stages labelled with an asterisk (*) indicate significant differences between the
treatment and control for each stage by ANOVA (P<0.001), LSD0.05= 28.32. FW: fresh
weight.
Page 104
79
0.0
5.0
10.0
15.0
20.0
25.0
30.0
Tetrad* Microspore* Vacuolatedmicrospore*
Red
ucin
g su
gar c
onte
nt ( µ
mol
gl
ucos
e eq
uiva
lent
s g-1
FW
) Control Stressed
Figure 4.2: Effect of water deficit treatment on reducing sugar levels in rice anthers
treated at different stages. Reducing sugars were determined using the copper/arseno-
molybdate method. Vertical bars are standard errors (SE). Data are the mean of three
replicates ± SE. The stages labelled with an asterisk (*) indicate significant differences
between the treatment and control for each stage by ANOVA (P<0.001), LSD0.05= 5.41.
FW: fresh weight.
0.0
50.0
100.0
150.0
200.0
250.0
Tetrad* Microspore* Vacuolatedmicrospore
Suc
rose
con
tent
( µm
ol g
-1 F
W)
Control Stressed
Figure 4.3: Effect of water deficit treatment on sucrose levels in rice anthers treated at
different stages. Vertical bars are standard errors (SE). Data are the mean of three
replicates ± SE. The stages labelled with an asterisk (*) indicate significant differences
between the treatment and control for each stage by ANOVA (P<0.001), LSD0.05= 29.1.
FW: fresh weight.
Page 105
80
0.0
10.0
20.0
30.0
40.0
50.0
Tetrad* Microspore* Vacuolatedmicrospore*
Glu
cose
con
tent
( µm
ol g
-1 F
W) Control Stressed
Figure 4.4: Effect of water deficit treatment on glucose levels in rice anthers treated at
different stages. Vertical bars are standard errors (SE). Data are the mean of three
replicates ± SE. The stages labelled with an asterisk (*) indicate significant differences
between the treatment and control for each stage by ANOVA (P<0.001), LSD0.05= 8.8.
FW: fresh weight.
0.0
10.0
20.0
30.0
40.0
50.0
60.0
Tetrad* Microspore* Vacuolatedmicrospore*
Fruc
tose
con
tent
( µm
ol g
-1 F
W)
Control Stressed
Figure 4.5: Effect of water deficit treatment on fructose levels in rice anthers treated at
different stages. Vertical bars are standard errors (SE). Data are the mean of three
replicates ± SE. The stages labelled with an asterisk (*) indicate significant differences
between the treatment and control for each stage by ANOVA (P<0.001), LSD0.05=
10.29. FW: fresh weight.
Page 106
81
4.3.2. Expression of the cell wall acid invertase gene OsCIN4
To investigate transcriptional regulation of cell wall acid invertase during anther
development, anthers at three stages were selected from both control and water stressed
plants. Temporal expression of the cell wall acid invertase gene OsCIN4 in control
anthers remained almost unchanged at early stages (tetrad, microspore) (Figure 4.6).
This transcript was less abundant at the vacuolated microspore stage (Figure 4.6). Three
days of water deficit treatment resulted in partial repression of expression of this gene
only at the vacuolated microspore stage (P<0.05; Figure 4.6). On average, a 6-fold
reduction of this mRNA compared to the non-treated control was recorded at this stage
(Figure 4.6). Spatial expression of this gene was further localised within the anther
locule by in situ hybridisation (Figure 4.7). Hybridisation with antisense labelled probes
showed strong expression of OsCIN4 in the growing microspore and tapetum (Figures
4.7A & 4.7C). Reduced expression of OsCIN4 was also observed in the middle layer
and expression of this mRNA was only minor in the vascular bundle (Figures 4.7A &
4.7C). Images taken at a higher magnification clearly show the position of OsCIN4
within the anther locule i.e. in the young microspore, tapetum and middle layer cells
(Figures 4.7E). Water deficit stress did not alter the spatial expression of OsCIN4 in the
anther (Figure 4.7B & 4.7D). Negative controls for the hybridisation procedure with
sense probe did not show any DIG positive signals (Figure 4.7F).
Page 107
82
0.0
0.2
0.4
0.6
0.8
1.0
1.2
1.4
Tetrad Microspore Vacuolated microspore*
Rel
ativ
e ex
pres
sion
Control Treatment
Figure 4.6: Relative expression of the cell wall acid invertase gene (OsCIN4) at
different developmental stages. Vertical bars are standard errors (SE). Data are the mean
of four replicates ± SE. The stages labelled with an asterisk (*) indicate significant
differences between the treatment and control for each stage by randomisation test
(P<0.05).
Page 108
83
Figure 4.7: Localisation of the cell wall acid invertase gene OsCIN4 within transverse
sections of anther by in situ hybridisation. ml middle layer; t tapetum; lo locule; vb
vascular bundle; mi microspore. Scale bars: 20 µm.
Hybridisation using antisense probes: (A) Section from a control plant at the microspore
stage. Strong expression was observed in tapetum layer and microspores (black arrows).
Weak positive signals were also found at the vascular bundle. (B) Section from a
stressed plant at the microspore stage. OsCIN4 expressed strongly in the tapetum layer
and microspores and to a much lesser extent in the vascular bundle (black arrows). (C)
and (D) Sections from control and stressed plants respectively at the vacuolated
microspore stage. Expression of OsCIN4 at this stage was similar to the microspore
stage: strongly expressed in the tapetum and microspores and weakly expressed in the
vascular bundle. (E) Close up image of an anther locule shows DIG positive signal
mainly found in the tapetum, microspores and to a lesser extent in the middle layer.
Hybridisation using sense probes as negative control. (F) No positive DIG signal was
observed.
Page 110
84
4.3.3. Expression of the sucrose transporter gene OsSUT5
Expression of the sucrose transporter gene OsSUT5 was also analysed using
qRT-PCR and in situ hybridisation. qRT-PCR assays illustrated a gradually increasing
level of this transcript in control anthers during the course of development from the
tetrad to the vacuolated microspore stage (Figure 4.8). Approximately 9 times the
amount of this mRNA was recorded in untreated plants in this period (Figure 4.8).
Three days of water deficit treatment did not influence the relative expression of
OsSUT5 at the tetrad stage. However, the transcriptional regulation of this gene was
dramatically stimulated at the microspore and vacuolated microspore stage (Figure 4.8).
0
10
20
30
40
50
60
70
80
90
Tetrad Microspore* Vacuolated microspore*
Rel
ativ
e ex
pres
sion
Control Treatment
Figure 4.8: Relative expression of the sucrose transporter gene (OsSUT5) at different
developmental stages. Vertical bars are standard errors (SE). Data are the mean of four
replicates ± SE. The stages labelled with an asterisk (*) indicate significant differences
between the treatment and control for each stage by randomisation test (P<0.05).
On average, the relative expression of OsSUT5 in stressed anthers was four fold
and ten fold higher at the microspore and vacuolated microspore stages in comparison
to the respective control (Figure 4.8). In order to understand the mechanism of this
Page 111
85
transcriptional up-regulation, spatial expression of this gene was further explored by in
situ hybridisation. As early as the microspore stage of anther development, OsSUT5
was expressed strongly in the tapetum layer and the young microspores (Figure 4.9A).
No clear hybridisation signal was seen in the vascular bundle at the microspore stage
(Figures 4.9A & 4.9B). However, expression of this transcript has been found at low
levels in the vascular bundle tissues at the vacuolated microspore stage (Figures 4.9C,
4.9D).
Although this is a qualitative assay, in situ hybridisation also suggested an
increasing expression of the gene in the later stages of development compared to earlier
stages (Figures 4.9A & 4.9C). This result is consistent with the data obtained using the
qRT-PCR assay (Figure 4.8). Similar to the spatial expression of OsCIN4 presented
above, water deficit treatment did not alter the positional expression of OsSUT5
(Figures 4.9B & 4.9D). Close up images of in situ hybridisation ascertained the position
of OsSUT5 within the anther locule (Figure 4.9E). The hybridisation signal of OsSUT5
was found in the young microspores, and the inner tapetal and middle layers of the
anther (Figure 4.9E). The negative control did not show any evidence of DIG labelling
within the section (Figure 4.9F).
Page 112
86
Figure 4.9: Localisation of the sucrose transporter gene OsSUT5 within anther sections
by in situ hybridisation. ml middle layer; t tapetum; lo locule; vb vascular bundle. mi
microspore. Scale bars: 20 µm.
Hybridisation using antisense probes: (A) and (B) Sections from control and stressed
plants respectively at the microspore stage. Strong expression was observed in the
tapetum layer and microspores (black arrows). Little or no expression was found in the
vascular bundle. (C) and (D) Sections from control and stressed plants respectively at
vacuolated microspore stage. Strong expression of OsSUT5 was observed at the
tapetum; microspores and to a lesser extent at the vascular bundle. (E) Close up image
of an anther locule shows DIG positive signal distinctively in tapetum, middle layer and
microspores (black arrows).
Hybridisation using sense probes as negative control (F) No positive DIG signal was
observed.
Page 114
87
4.3.4. Expression of the monosaccharide transporter gene OsMST7
Monosaccharide transporters play an important role as active carriers for
transportation of hexoses e.g. glucose, fructose, etc, within living cells. To elucidate the
contribution of these proteins to anther development, temporal and spatial expression of
a monosaccharide transporter gene (OsMST7) was investigated. The data showed that
expression of this gene was at low levels as early as the tetrad stage of anther
development (Figure 4.10, inset). During the course of development, the transcriptional
regulation of OsMST7 became more abundant from the microspore to the vacuolated
microspore stage (Figure 4.10).
Figure 4.10: Relative expression of the monosaccharide transporter gene (OsMST7) at
different developmental stages. Vertical bars are standard errors (SE). Data are the mean
of four replicates ± SE. The stages labelled with an asterisk (*) indicate significant
differences between the treatment and control for each stage by randomisation test
(P<0.05).
1
10
100
1,000
10,000
100,000
Microspore* Vacuolated microspore*
Rel
ativ
e ex
pres
sion
Control Treatment
05
10152025
Tetrad
`
Page 115
88
Expression of OsMST7 appeared up-regulated in the post-stress period at the
tetrad stage (Figure 4.10). However, this up-regulation was not statistically significant
because of high variation between the samples (P>0.05) (Figure 4.10 & Table 4.3).
Nevertheless, water deficit effectively induced expression of this gene at the microspore
and vacuolated microspore stage (P<0.05) (Figure 4.10). OsMST7 expression was about
60 and 30 fold more abundant in stressed anthers at the microspore and vacuolated
microspore stage respectively in comparison to the non-treated control (P<0.05) (Figure
4.10).
Localisation of this gene within the anthers is presented in Figure 4.11. During
development from the microspore to vacuolated microspore stage, expression of this
gene was found at high levels in the young microspores, tapetal cells and to a much
lesser extent in the vascular bundle as well as the middle layer (Figures 4.11A, 4.11C &
4.11E). OsMST7 expression did not change position post water stress (Figures 4.11B &
4.11D). In situ hybridisation results also indicated that this gene was up-regulated after
the three day water deficit stress compared to the control during the same
developmental period (Figure 4.11B & 4.11D). These data agree with results from the
qRT-PCR assay presented above (Figure 4.10).
Page 116
89
Figure 4.11: Localisation of the monosaccharide transporter gene OsMST7 within
anther sections by in situ hybridisation. ml middle layer; t tapetum; lo locule; vb
vascular bundle. mi microspore. Scale bars: 20 µm.
Hybridisation using antisense probes: (A) and (B) Sections from control and stressed
plants respectively at the microspore stage. Strong expression was observed in the
tapetum layer and microspores (black arrows). Little expression was found in the
vascular bundle. (C) and (D) Sections from control and stressed plants respectively at
the vacuolated microspore stage. Strong expression of OsMST7 was observed in the
tapetum; microspores and to a lesser extent in the vascular bundle. (E) Close up images
of an anther locule show strong DIG positive signal in the tapetum, microspores and to
a lesser extent in the middle layer (black arrows).
Hybridisation using sense probes as negative control (F) No positive DIG signal was
observed.
Page 118
90
4.3.5. Expression of the fructokinase gene OsFKI
To unveil the role of fructokinase enzymes during anther development, the
expression of a fructokinase gene (OsFKI) was investigated in this study. The
transcriptional regulation of OsFKI gradually decreased from the tetrad to the
vacuolated microspore stage in control anthers (Figure 4.12). Water deficit treatment for
three consecutive days however, did not significantly affect its expression at any of the
three stages (P<0.05) (Figure 4.12).
0.0
0.2
0.4
0.6
0.8
1.0
1.2
1.4
Tetrad Microspore Vacuolatedmicrospore
Rel
ativ
e ex
pres
sion
Control Treatment
Figure 4.12: Relative expression of the fructokinase gene (OsFKI) at different
developmental stages. Vertical bars are standard errors (SE). Data are the mean of four
replicates ± SE. The stages labelled with an asterisk (*) indicate significant differences
between the treatment and control for each stage by randomisation test (P<0.05).
4.3.6. Expression of the hexokinase gene OsHXK3
Transcriptional regulation of a hexokinase enzyme is also included in this study.
Temporal expression of a hexokinase gene (OsHXK3) during early stages of anther
development was analysed. The relative expression of OsHXK3 gradually increased
from the tetrad to the vacuolated microspore stage in control anthers (Figure 4.13).
Page 119
91
0.0
1.0
2.0
3.0
4.0
5.0
Tetrad Microspore Vacuolatedmicrospore*
Rel
ativ
e ex
pres
sion
Control Treatment
Figure 4.13: Relative expression of the hexokinase gene (OsHXK3) at different
developmental stages. Vertical bars are standard errors (SE). Data are the mean of four
replicates ± SE. The stages labelled with an asterisk (*) indicate significant differences
between the treatment and control for each stage by randomisation test (P<0.05).
A three day water deficit treatment did not affect expression of this gene at the
tetrad and microspore stage (Figure 4.13). However, water deficit occurring at the
vacuolated microspore stage significantly repressed expression of this gene by 3-fold
compared to the control anthers (Figure 4.13).
To ascertain the role of the aforementioned genes during anther development, the
abundance of their transcripts during time course was compared with the house keeping
gene OsTuba1 (see Chapter 2) using cycle crossing point (CP) values derived from
qRT-PCR reactions. The more abundant the transcripts, the fewer PCR cycles it takes to
reach the CP. Results illustrate that the CP of OsTuba1 is around the 15th cycle (Table
4.3) which is considered to be abundantly expressed (Oliver et al., 2005). The
expression of OsCIN4, OsFKI and OsHXK3 may be considered high in this context
(Table 4.3). Nevertheless, expression of OsSUT5 and OsMST7 was lower at the early
stage (tetrad) and increased steadily at later stages (Table 4.3). Moreover, the data
Page 120
92
presented in Table 4.3 again confirmed that expression of OsTuba1 was consistent for
non-treated control and water stressed samples at all stages of investigation.
Control samples Stressed samples
Gene\Stage Tetrad MS VM Tetrad MS VM
OsTuba1 14.7 ± 0.5 14.9 ± 0.4 15.1 ± 0.3 14.2 ± 0.4 14.9 ± 0.2 14.9 ± 0.1
OsCIN4 15.2 ± 0.2 15.3 ± 0.3 16.4 ± 0.5 15.0 ± 0.2 15.5 ± 0.6 18.7± 0.3
OsSUT5 24.1 ± 0.2 23.4 ± 1.3 21.1 ± 1.4 22.9 ± 2.1 21.2 ± 1.5 17.2 ± 0.1
OsMST7 30.3 ± 0.7 26.3 ± 1.3 20.2 ± 2.2 25.6 ± 5.9 20.4 ± 1.7 14.8 ± 0.2
OsFKI 14.6 ± 0.3 15.2 ± 0.1 15.9 ± 0.4 14.4 ± 0.3 14.7 ± 0.3 14.9 ± 0.4
OsHXK3 16.1 ± 0.3 14.6 ± 0.1 14.5 ± 0.1 15.7 ± 0.7 14.7 ± 0.2 15.9 ± 0.5
Table 4.3: Mean cycle crossing point (CP) (n=4) ± standard error (SE) of target genes.
MS microspore, VM vacuolated microspore.
4.4. Discussion
4.4.1. Understanding carbohydrate unloading and transport in anthers
To identify the role of carbohydrate metabolism during anther development and
how it is affected by water deficit, it is critical to understand the mechanism of sugar
unloading and transport within the cellular complex of anthers. Because of its ability to
travel over a long distance and its stability from degrading enzymes, sucrose is the main
form of photoassimilate for transportation in most eukaryotic plants (Kuhn et al., 1999;
Sauer, 2007). In the present study, the presence of high levels of sucrose compared to
hexoses (Figures 4.3, 4.4, & 4.5) suggested that sucrose is the common substrate of
soluble carbon flux in the rice anther.
Sucrose synthesised in the source organs could be transported to the sink via
long distance phloem transport (Patrick, 1997; Oparka & Cruz, 2000). In sink cells like
Page 121
93
those in anthers, this disaccharide could be unloaded at the connective tissue, which is
continuous with the epidermis and endothecium and further exported to inner layers and
locules by different mechanisms (Lalonde et al., 2003). The presence of OsCIN4,
OsSUT5 and OsMST7 at the vascular bundle (Figures 4.7AC, 4.9C & 4.11AC) suggests
that these proteins may be involved in the apoplastic unloading of sugar from the sieve
element – companion cell complex (Lalonde et al., 1999; 2003). Nevertheless, Alfred
(2006) demonstrated that symplastic unloading of sugar is also potentially active.
Perhaps, both symplastic and apoplastic pathways of sugar unloading are working
concurrently in the anther.
As mentioned in Chapter 1, sucrose unloaded in the anther connective tissue
could either be effluxed directly to the inner layers and locules via sucrose transporters
or be first hydrolysed by cell wall invertases and then newly formed hexoses would be
imported to the locules by monosaccharide transporters (Lalonde et al., 1999; Sturm &
Tang, 1999). Before meiosis, the supply of sugar from the connective tissue to the
tapetum and locules might not involve apoplastic pathways due to the availability of the
plasmodesmatal connection between most cell layers in rice anthers (Li, 2005; Mamun
et al., 2005a). Transported sugar from the source leaves could discharge at the vascular
bundle and diffuse to anther wall layers and locules via plasmodesmata. In addition, as
the meiocytes are connected by cytoplasmic channels that disappear concurrently with
deposition of the callose wall (Li, 2005; Mamun et al., 2005a), the meiocytes may
absorb nutrient and sugar directly from the locular fluid or from adjacent cells by a
simple passive diffusion. The advent of apoplastic transport is generally signalled by
low plasmodesmatal frequency (Turgeon, 1996) and enhanced activity of its crucial
facilitators such as sucrose hydrolytic enzymes and active sugar carriers. However,
expression of cell wall acid invertase (OsINV4) and monosaccharide transporter
Page 122
94
(OsMST8) genes has not been detected until the tetrad stage in rice anthers (Oliver,
2004; Alfred, 2006). Consistent with these reports, data in this study show that
transcripts of another monosaccharide transporter (OsMST7) and a sucrose transporter
(OsSUT5) were not abundant in the anther at the tetrad stage (Figures 4.8, 4.10 & Table
4.5). These data might again confirm that symplastic unloading of sugar is the most
likely mechanism before the meiotic stage of anther development. It is possible that
apoplastic transport of sugar only occurs from the tetrad stage onwards because the
newly formed tetrad microspores are symplastically isolated from the anther wall layers
i.e. tapetum, middle layer and callose walls (Li, 2005; Mamun et al., 2005b) and are
coupled with gradually increased activity of sugar carriers such as OsMST8 (Alfred,
2006), OsSUT5 and OsMST7 (Figures 4.8, 4.10 & Table 4.5). Although the tapetum
starts to degenerate at the vacuolated microspore stage, the middle layer remains
unchanged (Clement & Audran, 1995; Li, 2005), therefore the apoplastic pathway may
continue to remain a crucial and sole mode for sugar transport from the middle layer to
the locules during development of microspores from the tetrad stage through to mature
pollen.
There are some proposed models of sugar unloading and transport within the
anther locule in the literature. Clement and Audran (1995) hypothesised a model of
sugar unloading in the anther of Lilium where sugars could be discharged at the middle
layer and apoplastically transported to tapetal cells and finally to the locules. Likewise,
the uptake of sugars from the developing microspore could also be carried out via
apoplastic carriers. Alfred (2006) observed a monosaccharide loading into rice anthers
under laser confocal microscopy using the fluorescent sugar analogue probe 6-deoxy-N-
(7-nitrobenz-2-oxa-1,3-diazol-4-yl)-aminoglucose (6NBDG). The author assumed that
the 6NBDG could be transported via diffusion from the connective tissue into the
Page 123
95
locular fluid and into the cytoplasm of the developing microspores via a
monosaccharide transporter (OsMST8) (Alfred, 2006). Finally a model of sugar
transport combining information from spatial expression of OsINV4, OsMST8 and
6NBDG in rice anther at different stages of development was proposed (Figure 4.15)
(Alfred, 2006). Nevertheless, the involvement and actual role of sucrose transporters
have not been experimentally determined.
The results from the present study, using the in situ hybridisation technique,
agree with the findings of Alfred (2006) and clearly demonstrate the presence and
strong expression of a monosaccharide transporter gene within the anther i.e. OsMST7
(Figure 4.11). The surose being transported might be first hydrolysed into hexoses by a
cell wall acid invertase OsCIN4 (Figure 4.7) that was coordinately expressed with the
OsMST7 (Figure 4.11). Spatially, these two genes were detected in mainly the young
developing microspores, tapetum, and to a much lesser extent in the middle layer and
vascular bundle (Figures 4.7 & 4.11). The expression pattern of these genes indicates a
distinct mode of sugar transport from the anther walls to the locules and young
microspores. However, as also reported in the above-mentioned model, carbohydrate
present in the anther locule and young microspores is not restricted to monosaccharides
alone. The existence of cell wall acid invertases OsCIN4 (Figure 4.7) and OsINV4
(Oliver et al., 2005), in young microspores logically infers the presence of soluble
sucrose in the anther locule. In addition to results presented in previous reports (Alfred,
2006), the in situ hybridisation results in the present experiments have indicated that
there was participation of a sucrose transporter, OsSUT5, in the apoplastic transport of
surose (Figure 4.9) in the anther. Similarly to OsCIN4 and OsMST7, OsSUT5 was
found to be abundantly expressed in young microspores, the tapetum, and middle layer
and to a much lesser degree in the vascular bundle (Figures 4.9A & 4.9C). Strong
Page 124
96
expression of OsSUT5 in the middle layer suggests that this layer is likely to be the site
for sucrose retrieval, which will be then transported to the tapetum and anther locules
without prior cleavage to hexoses by cell wall acid invertase (Figure 4.9E). Indeed,
another isoform of OsSUT5, the sucrose transporter OsSUT2, has been known to be
expressed in developing pollen (Takeda et al., 2001). Kong et al. (2007) confirmed the
important role of a sucrose transporter gene OsSUT3 during anther development in
CMS and fertile lines. Moreover, a recent publication by Castro & Clement (2007) has
proved the presence of sucrose in the anther locule of Lilium. The authors reported that
high levels of sucrose have been found in locular spaces and to a lesser extent in the
anther walls and young microspores during early stages of anther development.
In summary, there is strong evidence of sucrose unloading in the vascular bundle
followed by symplastic transport to the middle layer. The symplastic transport of
sucrose from the middle layer to inner sites could be continued until meiosis. Due to the
formation of the callose wall around the pollen mother cells, and compression and
degeneration of the middle layer, the transport of sucrose from the middle layer inwards
switches from the symplastic to apoplastic mode during meiosis. Co-existence of
OsCIN4, OsSUT5 and OsMST7 in the middle layer, tapetum and young microspores
from the tetrad stage onwards supports this hypothesis (Figures 4.7E, 4.9E & 4.11E).
Page 125
97
Figure 4.14: Proposed model of sugar transport at different stages of anther
development. Adapted from Alfred (2006).
Page 127
98
4.4.2. Sugar modulated gene expression in anther under drought
The present results clearly illustrate that anthers from plants experiencing mild
water stress for three consecutive days accumulated total soluble sugars (Figure 4.1).
The accumulation of the total soluble sugars, however, was not restricted to any
particular stage, but applied to all developmental stages i.e. water stress imposed at any
time during anther development from the pollen mother cell to vacuolated microspore
stage caused a statistically significant accumulation of sugar (P<0.05) (Figure 4.1). The
data also show that the level of reducing sugars, mainly glucose and fructose, was also
remarkably increased after stress (P<0.05) (Figure 4.2). Significantly increased levels of
individual sugars such as sucrose, glucose and fructose were also observed in anthers
from stressed plants (P<0.05) (Figures 4.3, 4.4 & 4.5).
Earlier work by Dorion et al. (1996) and Sheoran & Saini (1996) has illustrated
that severe water deficit stress occurring during reproductive phases can cause an
accumulation of total sugar and non-reducing sugars in wheat and rice anthers, while the
level of reducing sugars fluctuated. Accumulation of non-reducing sugars (mainly
sucrose) was predicted to be the result of impairment of the vacuolar and cell wall acid
invertase (Saini & Westgate, 2000).
Similar to the rising level of non-reducing sugars, the accumulation of reducing
sugars e.g. glucose and fructose, in stressed anthers may also imply that other
downstream pathways of hexose utilisation e.g. glycolysis, might have been disrupted.
It could be proposed that the accumulation of reducing sugars might be partly the result
of down regulation of enzymes involved in glycolysis in the anthers after water stress.
Down regulation of these enzymes might potentially hamper input supplies such as
pyruvate for the TCA cycle in mitochondria, which subsequently affects ATP
production in the cell.
Page 128
99
Of the enzymes involved in this pathway, fructokinase and hexokinase are the
most important enzymes for initial steps in hexose phosphorylation in sink tissues
(Quick & Schaffer, 1996). Fructokinases play a critical role in sucrose metabolism to
maintain hexose flux in the sink cells. They phosphorylate hexoses, especially fructose,
to provide energy and input for the tricarboxylic acid cycle (TCA). Fructokinase protein
has been shown to be present in rice anthers (Kerim et al., 2003). Hexokinases are also
important enzymes that catalyse the initial step of sugar phosphorylation in sink cells.
Along with fructokinases, they utilise hexoses as substrates to provide energy and input
for the TCA cycle. Activity of these two enzymes has been shown to be affected under
environmental stress. Karni & Aloni (2002) demonstrated that fructokinase activities
were decreased by approximately 50% and 30% in pollen grains and developing anthers
respectively in Bell pepper (Capsicum annuum L.) after heat stress. Likewise, the
authors also proved that heat stress caused about 50% reduction of hexokinase activity
in developing anthers.
Intriguingly, qRT-PCR data illustrated that a water deficit of -0.5 MPa osmotic
potential did not significantly affect expression of OsCIN4 at early stages i.e. the tetrad
and microspore stage (P<0.05) (Figure 4.6). Likewise, expression of OsFKI in the
stressed samples did not change significantly when compared to the control after water
deficit treatment in all stages (P<0.05) (Figure 4.12). Similarly, expression of OsHXK3
remained unchanged at the tetrad and microspore stage (P<0.05) (Figure 4.13). A
relatively high expression of these mRNAs compared to the housing keeping gene,
OsTuba1 (Table 4.5), suggests that their corresponding proteins might be functionally
very active during the early stages of anther development. These results refute that
glycolysis, or the down regulation of enzymes involved in glycolysis, are the cause for
soluble sugar accumulation. These results pose an interesting question; are changes in
Page 129
100
gene expression caused by sugar accumulation after water deficit treatment or vice
versa? As mentioned above, down regulation of some sucrose hydrolytic enzymes has
been assumed as the reason for sugar accumulation in rice and wheat anthers post stress
(Dorion et al., 1996; Sheoran & Saini, 1996; Oliver et al., 2005). However, it is
reasonable to expect that abnormally high levels of sugar might repress or induce sugar-
regulated genes and hence influence their transcription under water deficit conditions
(Koch, 1996; Roitsch, 1999; Ho et al., 2001; Ramanjulu & Bartels, 2002; Rolland et al.,
2006; Huang et al., 2007). Indeed, transcription and post-transcription of two acid
invertase genes Ivr1 and Ivr2, which are expressed abundantly in pollen and anthers of
maize (Zea mays L), was found to be differentially modulated by either sucrose or
glucose application; high concentrations of sugars significantly repressed Ivr1, whereas
they enhanced Ivr2 (Xu et al., 1996). Likewise, expression of a sink specific cell wall
acid invertase gene, Lin6 in tomato (Lycopersicon esculentum cv Moneymaker), has
been shown to be induced by glucose (Godt & Roitsch, 1997). Moreover, sugar
modulates not only transcriptional expression of metabolic enzymes but active sugar
carriers and their transport activity as well. Application of exogenous sugar (either
sucrose or glucose) at high concentrations effectively decreased expression of both
sucrose transporter, VfSUT1, and monosaccharide transporter, VfSTP1, in fava been
cotyledons (Weber et al., 1997). Similarly, high levels of exogenous sucrose have
repressed transcription of a sucrose transporter gene, BvSUT1, and its functional protein
in sugar beet leaves (Beta vulgaris Linnaeus) (Chiou & Bush, 1998; Vaughn et al.,
2002). In contrast, increased levels of endogenous sugar have been known to induce
transcriptional expression of OsSUT1 in the rice embryo (Matsukura et al., 2000).
Different glucose concentrations in the cell suspension culture medium have been
shown to regulate the expression of a monosaccharide transporter VvHT1, its protein
Page 130
101
and sugar transport activity in grape (Vitis vinifera) (Conde et al., 2006). High
concentrations of exogenous glucose reduced VvHT1 transcription and glucose uptake,
whereas low glucose concentrations induced VvHT1 expression and glucose
consumption of suspension cultured cells (Conde et al., 2006).
Consistent with those reports, drought-induced accumulation of sugar might
have down-regulated expression of OsCIN4 (Figure 4.6) and OsHXK3 (Figure 4.13) in
the late stages, while it had no effect on OsFKI (4.12) in the present study. In contrast,
the expression of OsSUT5 (Figures 4.8) and OsMST7 (Figure 4.10) were strongly
induced from the microspore to vacuolated microspore stage. It is pertinent to remember
that water stress affected expression of OsCIN4 and OsHXK3 in the same manner i.e.
no alteration at the tetrad and microspore stages, and sharp down-regulation at the
vacuolated microspore stage (P<0.05) (Figures 4.6 & 4.13), while at the same time,
stress affected expression of OsSUT5 and OsMST7 showed the reverse trend i.e. no
change at the tetrad stage, and gradually becoming up-regulated from the microspore to
vacuolated stage (P<0.05) (Figures 4.8 & 4.10). In addition, the level of total sugars
(Figure 4.1) and hexoses (Figures 4.4 & 4.5) were shown to reach the highest level at
the vacuolated stage compared to the tetrad and microspore stage under water deficit
conditions. It may be that this very high level of sugar at the vacuolated microspore
stage suppressed expression of OsCIN4 and OsHXK3 in the present study (P<0.05)
(Figures 4.6 & 4.13). Similarly, the accumulation of sugar induced the expression
OsSUT5 and OsMST7 at the microspore and vacuolated stage (P<0.05) (Figures 4.8 &
4.10). Perhaps, accumulation of sugar at the tetrad stage (Figures 4.1, 4.4 & 4.5) was
not high enough to up-regulate OsSUT5 and OsMST7 genes in the stressed anther
compared to the controls.
Page 131
102
4.4.3. Association of carbohydrate metabolism with abortion of young
microspores post water stress
As discussed in the introduction to this chapter, the most important question
remains as to whether the disturbance of sugar metabolism in rice anthers is the cause
of, or at least associated with, the failure of young microspore development after water
deficit stress.
Some studies suggested that transcriptional down-regulation of sugar
transporters and sucrose hydrolytic enzymes (e.g. vacuolar and cell wall acid invertases)
might have resulted in a blockage of sugar supply to the developing microspore, which
later caused pollen sterility in rice under chilling stress (Oliver et al., 2005; Alfred,
2006) and in wheat under drought stress (Koonjul et al., 2005). However, this may not
be the case in the current experiments. As discussed in the previous sections, temporal
expression of OsSUT5 and OsMST7 increased gradually from the tetrad to the
vacuolated microspore stage suggesting that they play an important role during anther
development under normal growing conditions (Figures 4.8 & 4.10). Spatially, these
two isoforms are expressed mainly in young microspores, the tapetum and middle layer
and to a much lesser extent in the vascular bundle of the anther (Figures 4.9A, 4.9C,
4.11A & 4.11C), which may imply that they facilitate the inward flux of sugar to the
tapetal cells and the locules, which become symplastically isolated by the end of
meiosis (Li, 2005; Mamun et al., 2005b). Three-day water deficit induced expression of
OsSUT5 and OsMST7 gradually from the microspore to the vacuolated microspore
stage with no changes of spatial expression of these genes (Figures 4.9B, 4.9D, 4.11B &
4.11D). These data suggest that the level of sugar e.g. sucrose and hexoses was not
depleted in the tapetum and anther locules after water deficit treatment; in contrast it
probably increased substantially. The down-regulation of OsCIN4 (P<0.05) (Figure
Page 132
103
4.6), which is mainly expressed in the tapetum and microspore (Figure 4.7) and
OsHXK3 (P<0.05) (Figure 4.13) at the vacuolated microspore stage, may be caused by
this very high concentration of sugar in the tapetum and microspore.
Hence, it could be speculated that the reduction of male fertility under drought
was attributed to the failure of downstream sugar utilisation during respiration which
caused a lack of energy for the developing microspores. Indeed, sterile anthers under
chilling stress have been reported to be closely correlated with considerably lowered
respiratory activity (Toriyama & Hinata, 1984). Respiratory pathways in plants can be
classified into three main categories: glycolysis, the TCA cycle which is in the
mitochondrial matrix and the electron transport chain which is in the inner
mitochondrial membrane, and all are essential sources of energy and other physiological
functions (Fernie et al., 2004). Although the pentose phosphate pathway cannot produce
ATP directly from glucose like glycolysis, it plays an important role in producing
intermediates e.g. amino acids, nucleotides and NADPH (Lambers et al., 1998b).
Glycolysis which occurs in both the cytosol and the plastid oxidises hexoses to generate
ATP and pyruvate, an important fuel of the TCA cycle (Plaxton, 1996). Neverthelss, the
qRT-PCR data in this study show that water deficit did not affect expression of OsFKI
(P<0.05) (Figure 4.12) nor OsHXK3 at least at the tetrad and microspore stage (P<0.05)
(Figure 4.13). These findings suggest that the problem might not be due to glycolysis in
this case.
There are two assumptions to consider at this point. Firstly, even though
phosphorylated sugar is made available to feed downstream processes, respiratory
pathways (e.g. the TCA cycle and oxidative phospholylation) in mitochondria, might
have failed to utilise this resource leading to a shortage of energy and hence causing
young microspore death. Secondly, water deficit might have induced production of
Page 133
104
lethal sporocides such as reactive oxygen species (ROS) that in turn cause direct
damage to the cell. Thus there might have been accumulation of sugar in order to
protect young microspores from this damage. Either of these assumptions might be
possible in this case.
On the one hand, accumulation of osmolytes like sugars in the cytoplasm has
been reported to provide a better osmotic balance under dehydration conditions while
not interfering with normal metabolic pathways (Bray, 1997; Bray et al., 2000; Bartels
& Sunkar, 2005). The ability to maintain osmotic adjustment has been proposed as an
important agronomic criterion for improving drought tolerance in rice (Jongdee et al.,
2002). Higher levels of sugar observed in the present work might have conferred a
protection to the young microspores rather than causing sterility as male fertility was
less affected (Chapter 3) when the level of sugars was rising under drought (Figures 4.1,
4.2, 4.3, 4.4 & 4.5). Indeed, increasing levels of endogenous soluble sugar have been
shown to better maintain osmotic adjustment for water stressed medicinal plants (Tan et
al., 2006). Accumulation of trehalose, a non-reducing disaccharide of glucose, has been
illustrated to provide a better protection for transgenic rice under abiotic stress such as
salinity, drought and chilling conditions (Garg et al., 2002). Similarly, high levels of
other sugars such as raffinose and galactinol have been shown to improve drought
tolerance during seed development in transgenic Arabidopsis (Taji et al., 2002).
Possible molecular mechanisms for the protection provided by sugar against drought
will be further discussed in Chapter 6.
On the other hand, it has been well documented in the literature that
mitochondrial respiration plays an important role in energy generation and carbon
metabolism of plant cells (Siedow & Day, 2000). Possibly, mitochondrial respiration
has failed to generate sufficient energy for the developing microspores. Concurrently
Page 134
105
the improper respiration could lead to excessive production of ROS during electron
transport, at the same time resulting in oxidative damage. Failure of mitochondrial
functions has also been reported to be associated with an excessive generation of ROS,
depletion of the ATP pool, and pollen failure in CMS rice (Li et al., 2004; Wan et al.,
2007) and these events will be the topic for further investigation in Chapter 5.
4.5. Conclusion
This chapter has provided a comprehensive review of sugar metabolism in rice
anthers. The level of carbohydrates and the expression of the cell wall acid invertase
OsCIN4, the sucrose transporter OsSUT5, the monosaccharide transporter OsMST7,
and the two genes of glycolytic pathways, OsFKI and OsHXK3 have been presented
under water deficit stress. Supplemental data to support the existing model of
carbohydrate unloading and transport within the rice anther (Alfred, 2006) has been
postulated and discussed. Water deficit-induced accumulation of sugars has been shown
to be correlated with repressed expression of OsCIN4, OsHXK3 and with the up-
regulation of OsSUT5 and OsMST7. Up-regulation of OsSUT5 and OsMST7 seems to
provide a better sugar supply to the tapetum and anther locules and this corresponds to
the alleviation of male fertility reduction under drought (Chapter 3). Although the
present work only looked at transcriptional regulation of sugar metabolism in rice
anthers, the results indicate that water deficit might not cause sugar starvation for
developing microspores as previously thought, nor inhibit the initial steps of sugar
utilisation e.g. glycolysis. Nevertheless, it remains to be identified whether water deficit
has disturbed respiratory pathways in mitochondria, which would result in an
insufficient supply of energy and possible production of sporocides such as ROS.
Page 135
106
CHAPTER 5: WATER DEFICIT INDUCED PROGRAMMED CELL DEATH
AND OXIDATIVE STRESS IN RICE ANTHERS
5.1. Introduction
As demonstrated in the Chapter 3, a water deficit treatment of equal to or less
than -0.5 MPa osmotic potential imposed for three consecutive days during reproductive
development significantly inhibited microspore development and reduced grain set. The
decreased number of viable mature pollen leading to unsuccessful or poor pollination at
flowering is also a well-known feature of cytoplasmic male sterility (CMS) phenotypes
(Schnable & Wise, 1998). CMS is a maternally inherited trait and is characterised by
the inability to produce functional pollen, although vegetative development is
unaffected (Duviek, 1965; Edwardson, 1970). CMS is believed to be a consequence of
the inability of mitochondria to meet the energy demands of male gametophyte
development. Studies on CMS rice illustrated that pollen abortion of the sterile rice
plants was attributed to programmed cell death (PCD) at meiosis and chronic oxidative
stress in mitochondria during microspore development (Li et al., 2004; Wan et al.,
2007).
As introduced in Chapter 1, PCD, which is an active and inducible process,
plays a critical role in the normal development of angiosperms, as well as a response to
a variety of diseases, by controlling cell numbers or strategically eliminating infected,
damaged cells in defence (Greenberg, 1996, 1997; Vaux & Korsmeyer, 1999).
Molecular characteristics often observed in PCD include the release of cytochrome c,
activation of cysteine proteases, changes in calcium flux, decreases in the ATP pool,
excessive production of ROS, and decreased activity of antioxidant enzymes (Saraste &
Pulkki, 2000; Moller, 2001; Tiwari et al., 2002; Moller et al., 2007; Ryter et al., 2007).
Page 136
107
During male reproductive development, improper functioning of PCD can lead to
abnormal pollen development and subsequent sterility (Sanders et al., 2000; Wu &
Cheung, 2000; Ku et al., 2003). Water deficit stress has been shown to cause oxidative
stress in plants as a response (Flexas et al., 2006; Zhou et al., 2007) which in turn can
stimulate a PCD (Slater et al., 1995; Dumont et al., 1999; Tiwari et al., 2002).
Moreover, signaling proteins associated with PCD events such as 14-3-3 have
attracted much attention for several decades. 14-3-3 protein is assumed to act as a dimer
binding with other functional proteins and to be involved in many biochemical
processes (Fu et al., 2000). In plants, this ubiquitous protein has been shown to be
relevant to not only PCD but also a variety of metabolic activities. Several studies have
suggested that 14-3-3 proteins can play an anti-apoptotic function (Zhang et al., 1999;
Fu et al., 2000; Xing et al., 2000). 14-3-3 proteins also play a fundamental role in the
regulation of starch synthesis, ATP production, peroxide detoxification, and participate
in modulation of several other important biochemical pathways as an intermediate of
ABA signal transduction, gene regulation and environmental stress response (Ferl,
1996; Fulgosi et al., 2002; Schoonheim et al., 2007).
However, there is no information regarding association of PCD and relevant
events with pollen sterility under water deficit stress to date. A recent study reported
that chilling stress during male reproductive development induced PCD that was
associated with pollen sterility in rice anthers (Li, 2005) suggesting a similar symptom
might occur in drought-stressed rice. This chapter will present findings about PCD,
DNA laddering and related events such as ATP, ROS and the antioxidant system in rice
anthers under drought stress. Moreover, expression of a 14-3-3 gene that is claimed to
be associated with apoptotic events in mammal and plant tissues is also considered.
Page 137
108
5.2. Materials and methods
5.2.1. Plant materials and water stress treatment
Rice plants were grown hydroponically as described in the Chapter 2, Section
2.2.2. Water stress exposure was conducted as described in the Chapter 2, Section 2.3.2.
5.2.2. TdT-mediated dUTP nick-end labelling (TUNEL) assay
Transverse sections of florets embedded in paraffin for immunological
localisation were prepared as described in Chapter 2, Section 2.7. After de-
paraffinisation and rehydration, sections were pretreated with Proteinase K working
solution (20 µg/mL in 10 mM Tris-HCl, pH 7.5) at room temperature for 10 minutes.
Sections were then washed in PBS buffer, pH 7.2 (160 mM NaCl, 2.7 mM KCl, 8 mM
Na2HPO4, and 1.5 mM KH2PO4) twice for two minutes each time.
In situ nick-end labelling of nuclear DNA fragmentation was performed in a
humidity chamber for 1 h in the dark at 37oC with an In Situ Cell Death Detection Kit,
Fluorescein (Roche Applied Science, Australia) according to the manufacturer’s
instructions. In brief, a 50 µL TUNEL reaction mixture containing 10 µL of terminal
transferase enzyme solution and 40 µL of label solution was applied directly onto
sections. Sections used for positive control were pretreated with 200 U/mL recombinant
DNase I (50 µL DNase I stock solution, 1 mg bovine serum albumin (BSA) and 950 µL
of 50 mM Tris-HCl, pH 7.5) for 10 min at 15-25oC to induce DNA strand breaks, prior
to labelling procedures. Sections used for negative controls were incubated in 50 µL
label solution without enzyme. Labelled sections were immediately observed under a
fluorescence microscope (Olympus BX51, Japan) and images were captured for further
analysis.
Page 138
109
5.2.3. DNA extraction and electrophoresis to detect DNA fragmentation
Anthers were collected for genomic DNA extraction as described in Chapter 2,
Section 2.4. DNA was extracted using cetyl triethylammonium bromide (CTAB)
(Sambrook & Russell, 2001). Approximately 30 mg of frozen anthers were ground in
liquid nitrogen and 450 µL of extraction buffer containing 50 mM Tris-HCl, 0.7 M
NaCl, 10 mM ethylenediaminetetraacetic acid (EDTA), 1% (w/v) CTAB, 1% β-
mercaptoethanol, pH 8.0 was added. After vigorous mixing, samples were incubated at
65oC for 30 minutes in a water bath with occasional mixing of the contents. The mixture
was incubated with 6 µL of Proteinase K (20 mg/mL) at 37oC for 90 minutes and then
900 µL of chloroform: isoamyl alcohol (24:1) was added and emulsified by shaking.
Extracts were centrifuged for 5 minutes at 11,000 rpm at room temperature and the top
aqueous layer was transferred to a clean 1.5 mL microcentrifuge tube. The interface
between the top and bottom layer in the original tube was washed with a further 40 µL
of extraction buffer, centrifuged as before and pooled with the previous extracted
aqueous solution. DNA in the aqueous solution was precipitated by adding 400 µL of
cold isopropanol and centrifuging for 2 minutes at 11,000 rpm. The DNA pellet was
dissolved in 1 mL of cold 70% ethanol and precipitated by centrifugation at 11,000 rpm
for 10 minutes. After air drying for 60 minutes in a fume hood, the pellets were re-
suspended in 50 µL of TE buffer pH 8.0 (10 mM Tris-HCl, 1 mM EDTA) and stored at
-20oC until required.
DNA samples were quantified using a NanoDrop® ND-1000 spectrophotometer
(Biosciences, Australia). Control and stressed samples containing 1 µg of DNA from
different stages were electrophoresed in a 1.5% agarose gel at 90V for 1.5 hours. The
agarose gel was post-stained in a water bath containing 1.5% ethidium bromide and
Page 139
110
visualised under a UV light. The image of the gel was captured by a Gel Doc (Bio-Rad,
Australia) digital imaging system.
5.2.4. RNA extraction and real-time qRT-PCR
Total RNA extraction and quantitation are as described in Chapter 2, Section
2.5. Table 5.1 shows specific primers of the targeted genes. Initial conventional RT-
PCRs for detection and cDNA sequencing to confirm homology of amplified products
and transcripts of interest were carried out as described in Chapter 2, Section 2.6. Rice
OsTuba1 gene (Genebank ID AF182523) was used as a reference control in the real-
time qRT-PCR as described in Chapter 2, Section 2.6. The reaction mixture using gene
specific primers is as described in Chapter 2, Section 2.6.
Gene name Genebank ID Primer sequence (5’-3’) cDNA size (bp)
14-3-3 AJ276594 [F] CCACTGAGAAAAACACAAACAGT 152
[R] TCAGAGTCAACTGTCTTAGCAAC
Catalase X61626 [F] CTCTCCCAGTGTGATGAGTCGTT 154
[R] TGCATCTGACATTGTCTGGCCTT
Ascorbate Peroxidase D45423 [F] TTACTTCACGGAGCTTCTGAGTG 127
[R] GAAAGCCTTCTCATCTGCAGCAT
Dehydroascorbate Reductase AY074786 [F] TGAGTATGCATCAGTGGGATCAAA 144
[R] ATAAAGGGGCCATGAGCTTTCAG
Table 5.1: Target genes for analysis of expression profiles. F forward primer; R reverse
primer.
In general, duplicate qRT-PCR reactions consisting of a reverse transcription
step at 50oC for 20 mins, then initial denaturation at 94oC for 5 mins following 35-40
cycles were applied to all genes under investigation. Variations in temperature and steps
during the cycles of individual genes are presented in Table 5.2. Specificity of amplified
products was monitored by an optional step and a melt curve at the end of qRT-PCR
Page 140
111
reactions. Fluorescent signals were acquired at the last step during cycles. The real-time
amplification data were statistically analysed as described in Chapter 2, Section 2.6.
Gene name Denaturing Annealing Elongation Optional step
14-3-3 94°C – 20secs 61oC – 30secs 72oC - 25secs 77oC – 15secs
Catalase 94oC – 20secs 64oC – 30secs 72oC - 25secs not applied
Ascorbate Peroxidase 94oC – 20secs 62oC – 30secs 68oC - 25secs not applied
Dehydroascorbate Reductase 94oC – 20secs 62oC – 30secs 68oC - 25secs not applied
Table 5.2: Cycling profiles for real time qRT-PCR reactions.
5.2.5. Adenosine triphosphate (ATP) assay
ATP was extracted from anther samples according to the method of Botrel and
Kaiser (1997) with some modifications. Briefly, frozen anthers (20 mg) were ground in
liquid nitrogen. 750 µL of 4.5% HClO4 was added to the frozen tissue powder in a
microcentrifuge tube and vortexed vigorously. After thawing, 18 µL Tris (2 M) was
added and the samples were incubated on ice for 30 minutes. The suspension was
clarified by centrifugation at 11,000 rpm for 1 min. After removal of the precipitate, the
supernatant was adjusted with 5 M K2CO3 to pH 7.8 (about 90 µL 5 M K2CO3) and
centrifuged at 11,000 rpm for 2 minutes. The supernatant was transferred to a new
microcentrifuge tube and diluted to 1 mL with sterile water and stored at -80oC until
required. ATP concentration was quantified luminometrically by a luciferin-luciferase
method (Deluca & McElroy, 1978) following the manufacturer’s protocol included in
the ATP Bioluminescent assay kit (Sigma-Aldrich, Australia) with some modifications.
In brief, 75 µL of samples was pipetted into each well of a Microlite1+ microwell plate
(Pathtech, Australia) designed for luminescent assays. A 50 µL ATP assay mix which
includes luciferase, luciferin, MgSO4, DTT, EDTA, bovine serum albumin and tricine
Page 141
112
buffer salts was added to each well using a multichannel pippetor. The mixture was then
immediately measured in a Fluoroskan Ascent® FL microplate reader (Thermo
Labsystems, Australia) using the luminometric function. The same procedure was
applied to an ATP standard curve of known concentrations. The ATP content of
samples was calculated using this standard curve.
5.2.6. Hydrogen peroxide assay
About 50 mg of frozen anthers were ground in liquid nitrogen and homogenised
in 800 µL of ice cold 5% (w/v) trichloroacetic acid (TCA) (Warm & Laties, 1982). The
mixture was then vortexed vigorously for 1 minute and incubated on ice for 15 minutes.
The cell lysate was subsequently centrifuged at 13,000 rpm for 10 minutes at 4oC. The
supernatant was decanted and made to 1 mL with ice cold 5% TCA. Samples were
stored at -80oC if not used immediately. Hydrogen peroxide levels in stressed and
control samples were measured using the QuantiChromTM peroxide assay kit (BioAssay
Systems, Australia) following the manufacturer’s instructions. This measurement is
based on the oxidation of ferrous ion with hydrogen peroxide in the presence of xylenol
orange as an indicator (Wolff, 1994). Briefly, a mixture consisting of 20 µL of TCA
extract from treated and control samples and 100 µL of working reagent containing
sulfuric acid, ferrous ammonium sulfate and xylenol orange was pipetted into clear-
bottom 96-well microtitre plates. A similar mixture with 100 µL working reagent
containing sulfuric acid and xylenol orange was used as a control blank. The mixtures
were incubated for 30 min at room temperature and absorbance was read at 585 nm
using a Multiskan Ascent microplate reader (Thermo Labsystems, Australia). The
sample peroxide content was calculated by comparing the sample absorbance ∆OD and a
calibration curve of known H2O2 concentrations.
Page 142
113
5.2.7. Mitochondrial activity staining
The staining protocol for mitochondrial activity was adapted from the method of
Mamun et al. (2005a) with modifications. Rhodamine 123 (Molecular Probes)
(25 mg/L) was used to stain mitochondria. The dye was made up in an anther culture
medium as described in Section 3.2.7, Chapter 3 with omission of sucrose. Additional
components to the previous anther culture medium (Section 3.2.7, Chapter 3) were as
follows: glutamine (500 mg/L), myo-inositol (100 mg/L), arginine (50 mg/L),
asparagine (50 mg/L), cystine (50 mg/L), cytidine (50 mg/L), histidine (50 mg/L),
isoleucine (50 mg/L), lysine (50 mg/L), methionine (50 mg/L), phenylalanine (50
mg/L), proline (50 mg/L), serine (50 mg/L), threonine (50 mg/L), tryptophan 50 (mg/L),
uridine (50 mg/L), valine (50 mg/L), nicotinic acid (1 mg/L), pyridoxine HCl (1 mg/L),
thyamine HCl (1 mg/L), maltose (14,4 g/L), and ATP (1 g/L) (Cantrill et al., pers.
comm.).
Due to their highly hydrophobic nature and to facilitate the dye uptake, living
anthers were dissected longitudinally along the mid-line of the anther filament, and
incubated in the dye mixture for 1 h to allow sufficient dye penetration through the cut
surface before capture of images. The photos of stained sections were taken using a
Zeiss LSM 5 Pascal confocal microscope attached to a Zeiss Axiovert 200M (Carl
Zeiss, Germany) illuminated with the 488 nm line of the argon laser.
5.2.8. Statistical analysis
All the experiments were conducted in triplicate unless otherwise stated; the
values are expressed as means of three replicates plus standard error, and analysed by
one way analysis of variance using Genstat (version 8.0). Least significant differences
were calculated to compare significant effects at the 5% level.
Page 143
114
5.3. Results
5.3.1. Nuclear DNA degradation caused by water deficit
To test whether water deficit induced a PCD in anthers, a TUNEL assay was
performed on both stressed and control anthers. A range of developmental stages was
taken into account including tetrad, microspore, and vacuolated microspore stages. To
control the background level of TUNEL, both negative and positive control sections
were included in the assay for every experiment. For the negative control, terminal
transferase enzyme was omitted from the labelling mix and this resulted only in green
fluorescent background staining of cell walls and microspore walls (Figure 5.1A). By
contrast, the sections for the positive control were first incubated with DNase I to
induce DNA strand breaks and then continued with the standard labelling procedure.
TUNEL assay showed that pretreatment with DNase I caused an intensive staining of all
cell nuclei within the section (white arrows) (Figure 5.1B). Clearly distinct stained
nuclei (bright yellow to green spots) were found in single anther lobes, young
microspores (Figure 5.1C), and the vascular bundle (Figure 5.1D). Due to the nature of
paraffin embedded sections and fluorescence resolution, this staining technique could
not accurately localise the signals within anther walls. However, it appears that different
anther layers could be identified by TUNEL positive signals represented by concentric
circles formed by bright green spots (Figure 5.1B). This information can be used to
estimate the amount of positive signals, or the percentage of dead cells, within anther
layers.
Detailed TUNEL staining of anthers at the tetrad stage is presented in Figure
5.2. The results indicate that no positive signal was found in control anthers (Figure
5.2A). In contrast, there was more positive staining with TUNEL in the stressed anthers
(Figure 5.2B). Figure 5.2C and Figure 5.2D are close-up images showing a single anther
Page 144
115
lobe and vascular bundle, respectively, of an anther at the tetrad stage. Positive signals
(white arrows) were found in different cell layers of the anther walls (Figure 5.2C) and
vascular bundle (Figure 5.2C). Similarly, TUNEL staining of control anthers at the
microspore stage did not show any positive signal (Figure 5.3A). However, a large
number of TUNEL positive signals were observed in the stressed anthers (Figure 5.3B).
TUNEL positive signals (white arrows) were found abundantly in the single lobe of
anthers, the inner most layer (the tapetum), the young tetrads (Figure 5.3C) and vascular
bundle (5.3D).
Page 145
116
Figure 5.1: In situ fluorescence labelling of DNA cleavage by TUNEL staining in rice
anthers (transverse sections).
mi microspore; lo anther lobe; vb vascular bundle. White arrows indicate TUNEL
positive signals. Scale bars: 20 µm.
A. Negative control: section labelled without terminal transferase enzyme: only
green fluorescence was observed. There was no TUNEL positive signal.
B. Positive control: section was pre-treated with DNase I and labelled following
standard procedure. Bright green spots indicate TUNEL positive signals.
C. Positive control: detailed TUNEL staining for single lobe.
D. Positive control: close-up image of TUNEL staining for vascular bundle.
Page 147
117
Figure 5.2: DNA damage in rice anthers at the tetrad stage. DNA breaks in the nuclei
were detected by TUNEL staining.
mi microspore; lo anther lobe; vb vascular bundle. White arrows indicate TUNEL
positive signals. Scale bars: 20 µm.
A. Control anthers: only green fluorescence of the background was observed; no
TUNEL positive signals were seen.
B. Water stressed anthers: many TUNEL positive signals were observed.
C. Detailed TUNEL staining for single lobe of water stressed anthers.
D. Close-up image of TUNEL staining for vascular bundle of water stressed
anthers.
Page 149
118
Figure 5.3: DNA damage in rice anthers at the microspore stage. DNA breaks in the
nuclei were detected by TUNEL staining.
mi microspore; lo anther lobe; vb vascular bundle. White arrows indicate TUNEL
positive signals. Scale bars: 20 µm.
A. Control anthers: only green fluorescence of the background was observed; no
positive signals were seen.
B. Water stressed anthers: many TUNEL positive signals were observed.
C. Detailed TUNEL staining for single lobe of water stressed anthers.
D. Close-up image of TUNEL staining for vascular bundle of water stressed
anthers.
Page 151
119
Figure 5.4: DNA damage in rice anthers at the vacuolated microspore stage. DNA
breaks in the nuclei were detected by TUNEL staining.
mi microspore; lo anther lobe; vb vascular bundle. White arrows indicate TUNEL
positive signals. Scale bars: 20 µm.
A. Control anthers: only green fluorescence of the background was observed; no
positive signals were seen.
B. Water stressed anthers: many TUNEL positive signals were observed.
C. Detailed TUNEL staining for single lobe of water stressed anthers.
D. Close-up image of TUNEL staining for vascular bundle of water stressed
anthers.
Page 153
120
Figure 5.4 illustrates TUNEL staining results for the control and water stressed
anthers at the vacuolated stage. As visualised for the control anthers at the tetrad and
microspore stage, only a green fluorescent background was observed in the control
anthers indicating no TUNEL positive signals (Figure 5.4A). Some positive signals
(white arrows) were detected in the stressed anthers (Figure 5.4B). TUNEL signals
(white arrows) were found in anther walls within a single lobe (Figure 5.4C) and
vascular bundle (Figure 5.4D).
The results of the TUNEL assay clearly indicate that no positive signal was
found in control anthers at any of the three stages at the light microscope level (Figures
5.2A, 5.3A, & 5.4A). Stressed anthers, in contrast showed positive staining with
TUNEL (Figures 5.2B, 5.3B, & 5.4B). These data illustrate that water deficit imposed at
any stage during anther development has caused damage to cellular DNA shown by the
positive staining with TUNEL. Although the TUNEL assay remains only a qualitative
method, it appears that the number of dead cells gradually decreased in developmental
order from the tetrad to the vacuolated microspore stage (Figures 5.2B, 5.3B, & 5.4B).
This suggests that the level of cellular DNA damage caused by water deficit stress
varies depending on the stages of anther development.
To further identify the nature of cellular DNA damage, 1 µg of isolated genomic
DNA was electrophoresed in 1% agarose gel. Intriguingly, results shown in Figure 5.5
indicate that no pattern of DNA laddering was found in either the control or stressed
samples at different stages of anther development compared to the reference DNA
marker. There are only some smear-like patterns in the lanes loaded with DNA from
stressed samples (Figure 5.5). The size indicates the smear might be nucleotides. These
results suggest that water deficit did not completely fragment the DNA strand.
However, it might have caused some nicked DNA damage.
Page 154
121
Figure 5.5: Agarose gel analysis of DNA in anthers from control and stressed plants.
Total anther genomic DNA (1 µg) was loaded in each lane and electrophoresed using a
1% agarose gel stained with ethidium bromide. M DNA marker 1 kb plus (Invitrogen,
Australia); CT control; TM treatment.
5.3.2. ATP level in rice anthers
Possible causes of water deficit-induced PCD were further explored by
measuring the concentration of the ATP pool in rice anthers. In control anthers, the level
of ATP increased from the tetrad stage (5.29 ng/mg FW) to the microspore stage (7.54
ng/mg FW), and then decreased at the vacuolated microspore stage (4.89 ng/mg FW)
(Table 5.3). High levels of ATP during the tetrad and microspore stage indicate
essential energy demand for early microspore formation. Interestingly, ATP levels
dropped almost by half in stressed anthers compared to the controls at all stages
(P<0.001). The decline of this important metabolite might signal adverse effects for
Page 155
122
ATP-dependent processes in the cells following water stress. Moreover, the level of
ATP from stressed samples did not vary significantly amongst stages of development
suggesting constant effects resulting from osmotic stress caused by PEG (Table 5.3).
ATP level (ng/mg FW anthers)
Tetrad Microspore Vacuolated microspore
Control 5.29 ± 1.09a 7.54 ± 0.18b 4.89 ± 0.24a
Treatment 2.96 ± 0.72c 3.51 ± 1.99ac 2.47 ± 0.51c
Table 5.3: ATP content in control and water deficit treated samples at different stages
of anther development. Data are the mean of three replicates ± standard error (SE). Data
showing the same letter are not significantly different (P<0.001), LSD0.05 = 2.055 as
determined by ANOVA. FW = fresh weight.
5.3.3. Hydrogen peroxide content
The content of hydrogen peroxide during microspore development in control
anthers was almost constant in the range of 20.40 -24.21 ng/mg FW (Table 5.4). This
result indicates the ability of the cells to maintain a redox balance throughout
development from the tetrad to the vacuolated microspore stage under normal
conditions (Table 5.4). The balance appears to be violated by water deficit stress. An
approximately 1.5 fold greater concentration of this species was observed in water
stressed anthers compared to the control at different stages (P<0.004). Similar to the
depleted level of ATP, the increased hydrogen peroxide amongst the water stressed
anthers was almost the same at all stages and did not show any statistically significant
difference (P<0.004) (Table 5.4). Perhaps the constant level of osmotic stress induced
by PEG at different stages has resulted in an equal amount of hydrogen peroxide
accumulation in the anther.
Page 156
123
Hydrogen peroxide content (ng/mg FW anthers)
Tetrad Microspore Vacuolated microspore
Control 22.34 ± 1.54a 20.40 ± 3.30a 24.21 ± 3.38ab
Treatment 30.57 ± 1.45bc 30.51 ± 7.43bc 34.87 ± 2.90c
Table 5.4: Content of hydrogen peroxide in the control and water treated anthers. Data
are the mean of three replicates ± standard error (SE). Data showing the same letter are
not significantly different (P<0.004), LSD0.05 = 6.9 as determined by ANOVA. FW =
fresh weight.
5.3.4. Expression of the 14-3-3 gene
To investigate events associated with PCD at a molecular level, qRT-PCR was
conducted on a 14-3-3 gene. As shown in Figure 5.6, the expression of this 14-3-3 gene
during microsporegenesis is differentially regulated. In control anthers, the level of
expression of the 14-3-3 gene reduced gradually during development from the tetrad to
the vacuolated microspore stage (P<0.05) (Figure 5.6). Significant down regulation of
this gene from stressed anthers was recorded only at the tetrad stage which appears to
have the highest level of dead cells (Figure 5.2), while it remained unchanged at the
microspore and vacuolated stage (P<0.05) (Figure 5.6).
Page 157
124
0.0
0.2
0.4
0.6
0.8
1.0
1.2
Tetrad* Microspore Vacuolatedmicrospore
Rel
ativ
e ex
pres
sion
Control Treatment
Figure 5.6: Expression of the 14-3-3 gene. Vertical bars are standard error (SE). Data
are the mean of four replicates ± SE. The stages labelled with an asterisk (*) indicate
significant differences by randomisation test (P<0.05).
5.3.5. Expression of antioxidant genes
To get an insight into the response of the antioxidant system of developing
anthers under water deficit, the transcriptional regulation of antioxidant genes was
conducted and quantified by a real time qRT-PCR assay. Under normal growing
conditions, the expression of the catalase gene (CAT) increased from the tetrad to early
microspore stage and remained unchanged until the vacuolated microspore stage in
control samples (P<0.05) (Figure 5.7). On average, the expression of CAT at the tetrad
stage was only half of that at the microspore and vacuolated microspore stages. The
expression of CAT in stressed anthers was significantly reduced only at the tetrad stage
and remained unaffected at the microspore and vacuolated stage (P<0.05) (Figure 5.7).
Page 158
125
0.0
0.5
1.0
1.5
2.0
2.5
3.0
3.5
4.0
Tetrad* Microspore Vacuolated microspore
Rel
ativ
e ex
pres
sion
Control Treatment
Figure 5.7: Expression of the catalase gene (CAT). Vertical bars are standard error
(SE). Data are the mean of four replicates ± SE. The stages labelled with an asterisk (*)
indicate significant differences by randomisation test (P<0.05).
The expression pattern of the ascorbate peroxidase gene (APX) throughout
microspore development (Figure 5.8) was the inverse to that of CAT in control anthers.
The expression of APX gradually decreased, approximately by half in control samples,
from the tetrad to the vacuolated microspore stage (P<0.05) (Figure 5.8). Water deficit
appeared to keep APX expressed constantly at all three stages in stressed anthers. The
APX gene was significantly down-regulated by roughly 50% at the tetrad stage while it
was consistent at the microspore stage under water deficit (P<0.05). However its
expression was significantly up-regulated at the vacuolated microspore stage in stressed
samples (Figure 5.8).
Page 159
126
0.0
0.2
0.4
0.6
0.8
1.0
1.2
1.4
Tetrad* Microspore Vacuolatedmicrospore*
Rel
ativ
e ex
pres
sion
Control Treatment
Figure 5.8: Expression of the ascorbate peroxidase gene (APX). Vertical bars are
standard error (SE). Data are the mean of four replicates ± SE. The stages labelled with
an asterisk (*) indicate significant differences by randomisation test (P<0.05).
0.0
0.2
0.4
0.6
0.8
1.0
1.2
1.4
Tetrad* Microspore Vacuolatedmicrospore
Rel
ativ
e ex
pres
sion
Control Treatment
Figure 5.9: Expression of the dehydroascorbate reductase gene (DHAR). Vertical bars
are standard error (SE). Data are the mean of four replicates ± SE. The stages labelled
with an asterisk (*) indicate significant differences by randomisation test (P<0.05).
Unlike the expression of CAT and APX, the expression of the dehydroascorbate
reductase gene (DHAR) remained almost constant throughout the developmental stages
studied in control anthers (Figure 5.9). Noticeably water deficit effectively repressed the
expression of DHAR by approximately 60% at the tetrad stage (P<0.05). However
Page 160
127
expression of this gene did not decline significantly between control and stressed
samples at the microspore and vacuolated microspore stage (Figure 5.9).
These qRT-PCR results indicate that expression of all three antioxidant genes
was significantly suppressed if water deficit stress occurred around meiosis, while their
expression was differentially regulated if water stress took place at other stages.
5.3.6. Mitochondrial activity
Figure 5.10 shows staining results for active mitochondria in longitudinal optical
sections of normal anthers. Functional mitochondria were stained with Rhodamine 123
resulting in bright green dots (clumps) within the section. High mitochondrial activity
was observed at the pollen mother cell and tetrad stage (Figures 5.10A & 5.10B). At the
pollen mother cell stage, active mitochondria appeared to be distributed with similar
density within the tapetal and endothecial layer (white arrows) (Figure 5.10A). The
middle layer was dark and thin at this stage and seemed to have no mitochondrial
staining (Figure 5.10A). However, during the tetrad stage, the highest staining was
observed in the tapetum layer compared to other layers within the anther locule (Figure
5.10B, right and left sides). The endothecium layer was difficult to resolve by confocal
microscopy at the tetrad stage due to very densely stained areas in the tapetum (Figure
5.10B, left side). The activity of mitochondria seemed to decrease at the microspore to
the vacuolated microspore stage compared to previous stages (Figures 5.10C & 5.10D).
Noticeably, the activity of mitochondria in the tapetal layer apprears to have been
strongly reduced at the late stages e.g. the microspores and vacuolated microspore stage
(Figures 5.10C & 5.10D).
Page 161
128
Figure 5.10: Rhodamine 123 staining of active mitochondria in normal anthers.
ep epidermis; en endothecium; ml middle layer; t tapetum; pmc pollen mother cell; mi
microspore; vmi vacuolated microspore. White arrows indicate separate layers. Bright
green dots (clumps) are mitochondria. Scale bars: 20 µm.
A. Pollen mother cell stage.
B. Tetrad stage.
C. Microspore stage
D. Vacuolated microspore stage
Page 163
129
5.4. Discussion
5.4.1. Water deficit induced PCD in anthers
PCD is a phenomenon associated with biochemical and physical changes in the
cytoplasm, nucleus and plasma membrane. A hallmark often observed in PCD is the
fragmentation of genomic DNA, sometimes called DNA laddering (Arends et al., 1990;
Collins et al., 1997; Saraste & Pulkki, 2000). PCD can be analysed by the TUNEL
assay which allows for in situ detection of nicked DNA and DNA breaks at the single
cell level (Gavrieli et al., 1992) or by the typical DNA laddering that can be visualised
using agarose gel electrophoresis (Hale et al., 1996). In this work, a TUNEL assay
using anthers from three different stages of development illustrated that PCD did not
occur in anthers growing under normal conditions during these investigated periods
(Figures 5.2A, 5.3A & 5.4A). However many positive TUNEL signals were observed in
water stressed samples (Figures 5.2B, 5.3B & 5.4B) indicating detrimental effects of
water deficit on the cellular DNA within the anther and therefore suggesting that an
induced PCD had occurred. TUNEL positive signals appear not to be locally restricted
to certain cell types. Rather, they could be found in different sites within the transverse
section of the anther such as the vascular bundle, tapetum, middle layer and even young
microspores (Figures 5.2B, 5.3B & 5.4B). In the water stressed samples, the level of
nuclear DNA damage appeared more serious at the tetrad stage (Figure 5.2B), which
coincides with water deficit stress during meiosis, compared to the other stages such as
the microspore and vacuolated microspore (Figures 5.3B & 5.4B). This symptom was
concurrent with a serious reduction of grain set and viable young microspores at the
tetrad stage (Chapter 3). These results are also consistent with findings of PCD in rice
anthers induced by chilling stress (Li, 2005).
Page 164
130
The nature of the PCD was further investigated using a DNA laddering assay
(Figure 5.5). Surprisingly, agarose gel electrophoresis did not show orderly fragments
of the total genomic DNA ranging from 180 to 200 base pairs, which is often observed
in a normal apoptotic process (Bortner et al., 1995). There was no evidence for the
formation of DNA ladders in this study (Figure 5.5). This discrepancy again confirmed
that an induced PCD rather than a regular apoptosis might have occurred. Indeed, a
positive TUNEL result has been known to indicate not only the presence of double-
stranded DNA breaks but that of single-stranded DNA breaks with free 3'-OH terminals
as well (Gavrieli et al., 1992). Moreover, positive TUNEL signals have been reported to
be found in both necrotic cell death as well as apoptotic cell death (Grasl-Kraupp B et
al., 1995; Yasuda et al., 1995). Fath et al. (1999) also reported a PCD in barley aleurone
cells incubated with gibberellic acid. The treated cells showed nuclear DNA degradation
resulting in positive TUNEL staining while no DNA laddering was observed using
agarose gel electrophoresis. All of these findings suggest that water deficit directly
contributes to cell nuclear DNA damage via PCD in rice anthers.
5.4.2. Molecular and biochemical events associated with PCD
Commonly, PCD takes place in conjunction with biochemical events such as
ROS accumulation and reductions in the ATP pool. ATP is a coenzyme and one of the
most important compounds in the cellular metabolism of all eukaryotic organisms. ATP
is required to maintain the normal function and metabolism in cells. Depletion or
inadequate supply of this biological energy source could adversely affect ATP-
dependent processes and subsequently cause cell death (Carson et al., 1986; Eguchi et
al., 1997; Leist et al., 1997). Therefore, possible causes of water deficit induced PCD
were further explored by measuring the concentration of the ATP pool in rice anthers.
The data presented illustrate that rice anthers experiencing water deficit at any stage for
Page 165
131
three consecutive days showed a decrease in ATP (Table 5.3). Water stress has been
known to perturb the ATP pool in plants for some time (Meyer & de Kouchkovsky,
1992; Tezara et al., 1999). This reduction in ATP might have potentially caused
disturbance to some dependent biological pathways and consequently caused the cell
death observed in the present study.
A decrease of ATP levels that leads to cell death, either via apoptosis or
necrosis (a type of induced cell death), has been demonstrated to be dependent on the
level of ATP reduction (Skulachev, 2006). Maintenance of the ATP pool is required for
apoptosis while depletion of ATP favours necrosis, because apoptosis is an energy-
dependent process but necrosis is not (Liu et al., 1996; Eguchi et al., 1997; Leist et al.,
1997; Grusch et al., 2002; Troyano et al., 2003). As PEG treatment of -0.5 MPa only
causes mild water deficit (Chapter 3), it is likely that PCD rather than necrosis has been
induced in this case (Van Breusegem & Dat, 2006). Therefore, this might again confirm
that water deficit stress has resulted in an induced PCD in the present study, which is
consistent with the results from the DNA laddering assay (Figure 5.5).
Microsporegenesis requires a high input of energy for development, therefore the
shortage of this ATP will probably disturb downstream dependent processes and these
may be the physiological causes for the loss of young microspores in rice under water
deficit as discussed in Chapter 3.
In vivo, ATP is regenerated from ADP by the F type ATP synthase, which is
present in mitochondria and chloroplasts (Sambongi et al., 1999; Stock et al., 1999).
During oxidative phosphorylation, ATP synthase reversibly hydrolyses ATP to ADP
and phosphate ions. Wasteful hydrolysis of ATP under low oxygen conditions is
circumvented by a mechanism that allows IF1, a natural protein, to inhibit this
hydrolytic activity (Cabezon et al., 2000). Bunney et al. (2001) described the role of a
Page 166
132
novel protein, 14-3-3, as a regulator of mitochondrial and chloroplast ATP synthases via
an interaction with the F1 β-subunit. Their experiments on isolated mitochondia and
chloroplasts from barley plants illustrated that the 14-3-3 protein is an inhibitor of ATP
synthase hydrolytic activities. Abnormal expression of the 14-3-3 gene will also impact
adversely on other 14-3-3 regulated cell processes. The differential down-regulation of
the 14-3-3 gene in this context (Figure 5.6) might have contributed to the depletion of
the ATP pool (Table 5.3) and thus activation of a cell death programme (Figures 5.2B,
5.3B & 5.4B) (Richter et al., 1996).
5.4.3. Water deficit induced oxidative stress
Water stress could possibly stimulate oxidative conditions in rice anthers. This
was signalled in the present study by the increased level of hydrogen peroxide in the
stressed anthers at all stages of development in comparison to the respective controls
(Table 5.4). As a by-product of respiratory metabolism, ROS have been known to
increase under biotic and abiotic stresses in plants (Smirnoff, 1993; Tambussi et al.,
2000; Tiwari et al., 2002). Failure to control ROS could result in their excessive
accumulation and lead to oxidative stress (Foyer & Noctor, 2005a) which in turn
decreases the ATP pool. Consistently higher levels of ROS have been shown to cause
damage to various biological molecules such as cell membranes, lipoproteins, DNA,
and eventually leads to PCD (Droge, 2002; Moller et al., 2007; Ryter et al., 2007).
Excessive ROS has also been reported to induce PCD in soybean cells (Levine et al.,
1994; 1996) and Arabidopsis suspension cultured cells (Desikan et al., 1998). Under
normal growing conditions, plants produce a variety of antioxidants to cope with ROS
generation to retain an appropriate redox status within the cells. Catalases and
peroxidases are the two major systems for the enzymatic removal of hydrogen peroxide
in plants. Catalases catalyse the decomposition of hydrogen peroxide to water and
Page 167
133
oxygen. Ascorbate peroxidases are enzymes that detoxify peroxides such as hydrogen
peroxide using ascorbate as a substrate. The reaction they catalyse is the transfer of an
electron from ascorbate to peroxide producing dehydroascorbate and water as products.
Dehydroascorbate reductase is also a critical enzyme playing an important role in
maintaining an appropriate level of ascorbate in plant cells to overcome the possible
problems of oxidation (Kato et al., 1997). All of these enzymes are responsible for
maintaining a favourable redox status in the cells preventing oxidative damage. Indeed,
oxidative stress occurring in rice panicles has been shown to be correlated with an
inefficient antioxidant defence, which leads to pollen sterility under water stress (Selote
& Khanna-Chopra, 2004). Similarly, oxidative damage in anthers of CMS rice resulted
from changes in antioxidant pools (Li et al., 2004; Wan et al., 2007). Increased activity
of antioxidant enzymes has been demonstrated to confer a better protection for rice from
chilling damage (Kuk et al., 2003). In this current work, antioxidant transcripts such as
CAT (Figure 5.7), APX (Figure 5.8) and DHAR (Figure 5.9) appeared to be expressed
in a coordinated way throughout the development of anthers from the tetrad to
vacuolated microspore stage under normal growing conditions. Differential down-
regulation of these genes after three days of water deficit stress illustrates that some
dysfunction of the antioxidant defence system has occurred. Significant down-
regulation of all scavenging genes at the tetrad stage (Figures 5.7, 5.8, & 5.9) after water
deficit stress might imply the vulnerability of the antioxidant system around this stage,
which is in agreement with the serious decline of viable microspores and hence grain set
(Chapter 3). By contrast, stable (Figures 5.7 & 5.9) or even up-regulated (P<0.05)
(Figure 5.8) expression of these genes at the vacuolated microspore stage resulted in
fewer detrimental effects to the anthers.
Page 168
134
5.4.4. Role of the tapetal mitochondria
Staining results for mitochondrial activity in the present work clearly illustrated
that there were a large number of functional mitochondria at the pollen mother cell to
the tetrad stage that decreased gradually at later stages e.g. microspore and vacuolated
microspore stage (Figure 5.10). These data suggest that there was probably a high-
energy demand during the pollen mother cell and tetrad stage. Moreover, the presence
of numerous active mitochondria in the tapetal layer at the tetrad stage compared to
other stages indicates a special requirement of energy supply from the tapetum to young
microspores at this stage (Figure 5.10B). Indeed, the tapetum has generally been
accepted as the nourishing layer within the anther providing the nutrients and structural
components for the developing microspores in the locules (Pacini, 1994; Raghavan,
1997). Morphologically, the number of mitochondria have been shown to increase 20
and 40 fold in pollen mother cells and tapetal cells, respectively, between the pre-
callose and tetrad stages in maize anthers during development (Lee & Warmke, 1979).
Similarly, a significantly increased number of mitochondria was observed in the
tapetum layer after meiosis in rice by TEM techniques (Li, 2005; Mamun et al., 2005b)
suggesting a role for tapetal mitochondria in providing energy for developing
microspores.
Tapetal dysfunction has been shown to be associated with chilling induced male
sterility in rice (Nishiyama, 1984, 1997). Striking similarities between chilling and
drought induced pollen sterility in rice suggest similar events could occur in rice anthers
under water deficit. In the present work, attempts were made to compare the number of
functional mitochondria between the control and drought stressed anthers. However,
mitochondrial staining with Rhodamine 123 failed to differentiate the number of active
mitochondria in these two types of samples (data not shown) even though it is a specific
Page 169
135
probe for localisation and measurement of mitochondrial membrane potential (Johnson
et al., 1980; 1981; Chen, 1988). Possibly, Rhodamine 123 staining of mitochondria in
living anthers and the laser scanning confocal microscopy technique did not have
sufficient resolution to determine subtle changes in mitochondrial membrane potential
under this mild water deficit condition (Cantrill, pers. comm.). Nevertheless, evidence
from the literature and the current work suggests that the actual problem might reside
with mitochondrial activity. For example mitochondrial respiration is major source of
ATP synthesis and ROS generation. In addition, mitochondrial malfunction has been
associated with ATP reduction and PCD in CMS rice (Li et al., 2004), and this was
attributed to excessive accumulation of ROS causing damage to mitochondrial DNA
(Wan et al., 2007). Further work is required to confirm if a similar problem does occur
under water deficit conditions.
Although water deficit stress for three consecutive days resulted in similar levels
of ATP and hydrogen peroxide for all stages of anther development (Tables 5.3 & 5.4),
the final consequential effects of drought on the grain set were different among the
stages (Chapter 3). This phenomenon is possibly associated not only with the
antioxidant defence as discussed in above sections but also with varied allocation of
mitochondria within cell layers and amongst stages of anther development. For example
anthers at the tetrad stage suffered the most damage which coincides with the highest
density of mitochondrial staining in the tapetal cells (Figures 10A & 10B), whereas a
lower staining density of mitochondria in the tapetum during the microspore and
vacuolated microspore stages (Figures 10C & 10D) was associated with milder water
stress effects. This might also explain the tapetal dysfunction mentioned above.
Nevertheless, this association needs to be further explored.
Page 170
136
5.5. Conclusion
This chapter has attempted to draw a comprehensive and clear picture about
impacts of water stress on anthers, which can directly or indirectly cause pollen sterility
in rice plants. In summary, three days of mild water stress at -0.5 MPa enhanced ROS
production and suppressed the expression, to some extent, of antioxidant genes in rice
anthers. Significantly increasing levels of ROS may have caused damage to various
cells and led to the depletion of the ATP pool. As a result, PCD was induced and DNA
breaks were detected in various cell compartments of the anthers, including developing
microspores. This process has also been signalled by differential expression of the 14-3-
3 gene. All in all, there is strong evidence of oxidative damage, which is caused by
water deficit in this study. Male reproductive development is a complicated and highly
organised process that requires harmonious activities of different pathways in a system.
Failure or improper functioning of one pathway or whole systems would possibly result
in repression of microspore development and subsequent death. Water deficit might
have induced oxidative stress in rice anthers which later resulted in PCD and repressed
microspore development. This might be one of the main reasons for the reduction of
viable microspores post stress, which has been discussed in Chapter 3.
Page 171
137
CHAPTER 6: GENERAL DISCUSSION AND CONCLUSIONS
6.1. Introduction
Water deficit occurring during reproductive development frequently results in a
decline in grain set which is attributed to a decrease in male fertility (Saini & Westgate,
2000; Boyer & Westgate, 2004). This work has therefore attempted to elucidate the
events associated with male fertility reduction under water deficit stress using
comprehensive investigations covering different aspects from physiology, biochemistry,
and molecular biology.
Initial work in this study involved designing and assessing an osmotic stress
induction protocol, which aimed to develop a precise, controllable and easily
reproducible drought-induction method. Several levels of osmotic stress were applied to
determine the critical osmotic level that effectively influences male fertility represented
by parameters such as pollen viability and grain set (Chapter 3). To further explore
possible causes of male sterility, a significant part of this work was devoted to
understanding carbohydrate metabolism in anthers under normal and water deficit
conditions. New findings supplementing to existing models of sugar unloading and
transport in anther have been presented and discussed (Chapter 4). Finally, the
relationship between PCD, oxidative damage, antioxidant defences stress has been
investigated in detail to determine if oxidative stress is the main cause of pollen sterility
under water deficit (Chapter 5). This chapter will summarise main findings presented in
this thesis and discuss them in a broader context.
Page 172
138
6.2. Young microspore viability as a determinant of grain set
Undoubtedly, the final outcome of the male reproductive process is the
formation of viable mature pollen which is the key determinant for pollination and
establishment of grain set. This important agronomic trait has been used in selecting for
drought tolerance in rice (Venuprasad et al., 2007). Many studies have attempted to
identify the molecular mechanism of pollen abortion in cereals under abiotic stresses in
general and drought in particular (Barnabas et al., 2008). It is quite well known from the
literature that the reduction of viable pollen will potentially result in a decline of grain
set under adverse conditions. This was also the case in the present work. The results
presented in this study clearly demonstrate that osmotic stress equal to or more intense
than -0.5 MPa successfully reduced grain set which attributed to a decrease in the
number of viable pollen (Chapter 3).
Moreover, the causal relationship between grain set and pollen viability appears
to rely on the development of pollen at early stages, as a strong correlation between
grain set and viable young microspore has been demonstrated (Chapter 3). It is likely
that the reduction of young microspore viability will later determine the number of
sterile mature pollen leading to poor or failure of pollination. Hence, the reduction of
viable young microspores was demonstrated to indirectly affect the formation of grain
set (Chapter 3). Therefore the young microspore viability could be used as an indicator
of male fertility at an early stage. Apart from this, young microspore viability could be
used to measure the immediate effects of drought on fertility (Chapter 3).
6.3. Molecular mechanism of microspore abortion under drought
Previous work illustrated that carbohydrate metabolism during male
reproduction of wheat and rice anthers is disturbed by chilling and drought stress
(Dorion et al., 1996; Sheoran & Saini, 1996; Koonjul et al., 2005; Oliver et al., 2005).
Page 173
139
Failure to supply hexoses, important substrates of respiratory pathways, has been
assumed to cause pollen abortion in cold stressed rice. Chilling stress in rice has
resulted in a blockage of sugar supply from the connective tissues to the tapetum and
anther locules caused by transcriptional down-regulation of OsINV4 and OsMST8
(Oliver, 2004; Alfred, 2006). However, the results in this study demonstrated that the
supply of both sucrose and hexoses from the anther walls to the locules might not be
restricted after water deficit stress (Chapter 4). Up-regulation of OsSUT5 and OsMST7
for all three stages of anther development supports this finding (Chapter 4). Clearly the
developing microspores were not starved of sugar, a crucial substrate for initial steps in
downstream respiratory pathways. Moreover, stable expression of OsFKI and OsHXK3
at the most sensitive period e.g. the PMC and tetrad stage (Chapter 3), confirmed that
initial steps of sugar phosphorylation in the glycolytic pathway were not affected by
water deficit stress (Chapter 4). Still, one could argue that although OsCIN4 was not
affected at the most sensitive stages, selective transcriptional down-regulation of other
invertase genes, as occured in drought-stressed wheat (Koonjul et al., 2005), might
affect hydrolysis of sucrose within the anther locules leading to a shortage of hexose
supply for young microspores. However, results from sugar assays indicated that water
deficit caused an increase not only of non-reducing sugar (mainly sucrose), but also of
reducing sugar (mainly glucose and fructose) (Chapter 4). As mentioned in Chapter 4,
the down-regulation of invertase genes and their translated protein as reported from
other research (Dorion et al., 1996; Sheoran & Saini, 1996; Koonjul et al., 2005) might
be potentially regulated by increased levels of sugars (Koch, 1996; Roitsch, 1999; Ho et
al., 2001; Ramanjulu & Bartels, 2002; Rolland et al., 2006; Huang et al., 2007). At this
point, one might infer that immediate reduction of male fertility after drought could
potentially result from perturbation of one or several crucial pathways providing energy
Page 174
140
for developing microspores. Of those, respiratory pathways such as glycolysis and TCA
cycle are particularly interesting. Intriguingly, results from the Chapter 5 strongly
suggested that water deficit has induced the production of hydrogen peroxide, a major
form of ROS, above the redox balance, which in turn caused detrimental effects to
cellular DNA resulting in a PCD in the anthers. In addition, hydrogen peroxide
accumulation effectively influenced ATP synthesis leading to a decrease in the level of
ATP in the anthers (Chapter 5). Excessive hydrogen peroxide accumulation after
drought could be the consequence of insufficient activity of an antioxidant system,
which has been illustrated by qRT-PCR expression analysis of major antioxidant genes
(Chapter 5). A down-regulation of those genes would increase the chance for oxidative
damage, in contrast stable or up-regulated expression of them showed lesser oxidant
damage (Chapter 5). All of these findings suggest that oxidative stress might be a direct
cause of abortion of young microspores under water deficit, which has been illustrated
in CMS crops from other studies (Li et al., 2004; Jiang et al., 2007; Wan et al., 2007).
6.4. Causal relationship between oxidative stress and sugar accumulation
Many studies have attempted to assess the relationship between oxidative stress
and increased levels of carbohydrate under abiotic stress, however direct consequential
effects of ROS on sugar levels or vice versa have not been confirmed. Sugars have been
shown to be associated with both ROS producing and scavenging pathways via NADPH
metabolism (Couee et al., 2006; Ying, 2008). Soluble sugars can take part in ROS
producing pathways such as increased respiration or activation of NADPH oxidases
(Foreman et al., 2003; Ying, 2008). On the other hand, they can enhance NADPH
producing metabolism, e.g. oxidative pentose-phosphate pathway, which contributes to
the ROS scavenging system (Couee et al., 2006).
Page 175
141
Some examples on causal effects of sugars on the production and scavenging of
ROS have been demonstrated in yeast and animals. Although sugars, especially glucose,
are the most favourable nutrition for yeast growth, excessive amounts of sugar supply in
the absence of additional nutrients has been reported to induce cell death in yeast in
conjunction with rising levels of ROS (Granot et al., 2003). Likewise, high glucose
concentrations have been reported to activate NADPH oxidase, which catalyses the
production of superoxide (O2-.) (Babior, 1999), one of the reasons for glucotoxicity in
animal cells (Bonnefont-Rousselot, 2002). Similarly, Susztak et al. (2006) illustrated
that high concentrations of extracellular glucose increased ROS production by
activation of both plasma membrane NADPH oxidase and mitochondrial ROS
generation, which later triggers apoptosis at the onset of diabetic nephropathy.
In contrast, the presence of glucose has been demonstrated to protect hamster
ovary cells against oxidative damage caused by exogenous hydrogen peroxide. The role
of glucose in this protection was attributed to activation of the pentose phosphate
pathway and hence enhanced activity of antioxidant enzymes such as catalase and
glutathione (Averillbates & Przybytkowski, 1994). Likewise, increased levels of sugars
have been reported to provide protection to cells from oxidant damage in plants. High
levels of sugars have been demonstrated to maintain cellular NADPH concentrations, an
important precursor for the production of antioxidant substrates such as ascorbic acid
and glutathione in an ascorbate-glutathione cycle (Figure 6.1) (Noctor & Foyer, 1998).
Consistent with this hypothesis, elevated levels of NADPH in transgenic rice resulting
from over expression of a reductase gene YK1, has been thought to enhance the
antioxidant pool and hence reduce cell death caused by exogenous hydrogen peroxide
(Hayashi et al., 2005; Takahashi et al., 2006).
Page 176
142
Figure 6.1: Involvement of NADPH in ascorbate – glutathione cycle. Adapted from
Noctor & Foyer (1998). Where: GSH glutathione; GSSG oxidized glutathione; AA
ascorbate; DHA dehydroascorbate; MHDA monohydroascorbate; GR glutathione
reductase; DHAR dehydroascorbate reductase; MDHAR monodehydroascorbate
reductase; APX ascorbate peroxidase; SOD superoxide dismutase.
Page 177
143
Moreover, high levels of glucose could directly increase the production of
ascorbic acid, an important substrate of the anti-oxidant system (Figure 6.2) (Wheeler et
al., 1998). In support of this hypothesis, Smirnoff & Pallanca (1996) postulated that
feeding excised leaves of barley (Hordeum vulgare) seedlings either glucose or sucrose
in the dark partially recovered the ascorbate pool. Similarly, Nishikawa et al.(2005)
reported that application of exogenous sucrose can compensate for the loss of ascorbate
content in excised broccoli (Brassica oleracea L. var. italica) florets.
Figure 6.2: The role of glucose as building block of ascorbic acid. Adapted from
Wheeler et al. (1998). Enzymes of reactions from 1-9: 1, hexose phosphate isomerase;
2, phosphomannose isomerase; 3, phosphomannose mutase; 4, GDP-D-mannose
pyrophosphorylase; 5, GDP-D-mannose-3,5-epimerase; 8, L-galactose dehydrogenase;
9, L-galactono-1,4-lactone dehydrogenase.
Page 178
144
In the present study, higher levels of sugars (both total and reducing) at all three
stages (Chapter 4) seemed to be associated with some measure of protection to the
anthers against oxidative stress (Chapters 3 & 5). Induced expression of OsSUT5 and
OsMST7 might have maintained the high level of sugar in the tapetum and the locules
(Chapter 4), which alleviated oxidant damage caused by excessive ROS generation
(Chapter 5). As a result, the higher the levels of sugars in the tapetal layer, the less
cellular damage was observed (Chapters 4 & 5). Consequently, less damage to the
anther and young microspores was recorded (Chapters 3 & 5). In addition, this
assumption could be further inferred by reviewing abnormalities observed in chilling
and drought stressed anthers from other research. It has been well demonstrated that
stressed anthers from rice and wheat showed abnormal phenomena called tapetal
swelling, which is assumed to be related to tapetal dysfunction (Lalonde et al., 1997a;
Li, 2005; Mamun et al., 2006). Water stress in the present study might have induced
excessive ROS production in the tapetum where many mitochondria were located
(Chapter 5). High concentrations of sugar in the tapetum and the locules could be a
natural response to oxidative stress and therefore increased turgor pressure which in turn
causes tapetal swelling or hypertrophy, a common symptom associated with pollen
sterility often observed in chilling stressed anthers (Nishiyama, 1984; Li, 2005; Mamun
et al., 2006). Similar abnormalities have also been postulated for wheat anthers under
water stress (Lalonde et al., 1997a). In the present study, sugar flux to the tapetum and
anther locules was increased after water deficit, which might help alleviate detrimental
effects caused by excessive ROS generation. Nevertheless, as mentioned at the start of
this section, sugars are not simply accumulated to enhance antioxidant defence; instead
they appear to play a dual role in response to water deficit stress. Therefore, this causal
relationship between sugars and ROS needs to be further characterised.
Page 179
145
6.5. Sensitive stages of anther development to water deficit
It has been well documented in the literature that one of the most sensitive
stages of anther development to drought stress is around anther meiosis. This rule
applies for most cereal crops in general and rice in particular (Saini & Westgate, 2000;
Yang et al., 2007) and results presented in this current work concur (Chapter 3).
Nevertheless, there has been no proper interpretation of this phenomenon to date. As
discussed in the aforementioned sections, there is accumulating evidence of oxidative
stress in the anther after a short water deficit period, which detrimentally affects
microspore development (Chapter 5). As mitochondrial respiration is the main source of
ROS production (Moller, 2001), it is suggested that the increased number of
mitochondria located in the tapetal cells are the main reason for the increased
susceptibility of anthers to water deficit around anther meiosis to tetrad breakup. Fewer
mitochondria are present at other stages such as microspore and vacuolated microspore
and this may contribute to milder oxidative effects observed (Chapters 3 & 5).
Nevertheless, this assumption needs to be further validated with proper quantitative
methods for mitochondrial activity.
6.6. Involvement of signalling molecules to pollen sterility under drought
As mentioned in Chapter 1, chilling and drought stress have been known to
result in abnormal starch accumulation in the connective tissue of rice and wheat
anthers (Lalonde et al., 1997a; Mamun et al., 2006). The cause of this abnormal starch
accumulation remains unknown although it is found to be associated with pollen
sterility (Lalonde et al., 1997a; Li, 2005). As discussed in Chapter 5, down regulation of
14-3-3 gene at the tetrad stage took place in conjunction with a serious decline in plant
fertility (Chapter 3). It appears that expression of 14-3-3 gene is not only relevant to
ATP synthesis and apoptosis, but also to other events such as starch synthesis. Down-
Page 180
146
regulation of 14-3-3 protein has been shown to result in a two to four fold increase in
starch accumulation in Arabidopsis leaf (Sehnke et al., 2001). It is possible that water
stress in the present study might also induce starch accumulation in the anther and thus
this would take place in parallel with decreased expression of 14-3-3 gene as discussed
in Chapter 5. This finding suggests the role of 14-3-3 transcripts as a signalling
molecule under drought conditions. Abnormal behavior of this molecule would signal a
disturbance in metabolic activity in anthers leading to pollen sterility in the present
study.
In addition, recent reports have demonstrated the role of 14-3-3 proteins as
intermediates of abscisic acid (ABA) signal transduction (Schoonheim et al., 2007;
Wasilewska et al., 2008). The accumulation of ABA as a water deficit stress response
has been well documented in the literature (Davies & Zhang, 1991; Shinozaki &
Yamaguchi-Shinozaki, 2007) although the molecular mechanism of this phenomenon is
not clear. Nevertheless, the involvement of ABA on reproductive tissue has been long
considered as part of a signalling system under chilling and drought stress (Saini &
Westgate, 2000; Oliver et al., 2007). This phytohormone has been considered as an
endogenous sporocide that can induce spikelet sterility under water stress in some
reports (Saini & Westgate, 2000). Indeed, high levels of endogenous ABA have been
found to be associated with pollen and spikelet sterility in wheat under drought
(Morgan, 1980; Saini & Aspinall, 1982; Westgate et al., 1996) and in rice under chilling
(Oliver et al., 2007). Decreased levels of endogenous ABA have been hypothesised to
be associated with cold tolerance in rice (Oliver et al., 2007). Accumulation of ABA
under drought stress has been regarded as a key inducer of ROS production and
induction of ABA is an upstream event of ROS generation (Guan et al., 2000; Jiang &
Page 181
147
Zhang, 2002b; Hu et al., 2005; 2006), which in turn causes direct detrimental effects on
tissues.
However, there is also some evidence that an increase in endogenous ABA does
not affect fertility in wheat under drought (Dembinska et al., 1992). Water deficit-
induced ABA accumulation has been shown to enhance the antioxidant system and
hence provide a protection against ROS production in maize seedlings (Jiang & Zhang,
2002a). A very recent study on water stressed rice during meiosis illustrated that the
levels of endogenous ABA are not different between sensitive and drought resistant
cultivars (Yang et al., 2007). In contrast, the inhibition of endogenous ABA synthesis
has been shown to cause spikelet sterility for both drought stressed and control plants in
rice suggesting a protective role of elevated ABA under drought condition (Yang et al.,
2007). Therefore, it poses an interesting question on the underlying molecular
mechanism of ABA accumulation in plant tissues under drought. It is likely that the
actual impact of ABA on plant tissues strongly depends on its concentration. Low
concentrations of ABA have been reported to enhance antioxidant defence against
oxidative damage, whereas high concentrations result in excessive accumulation of
ROS and lead to oxidative damage (Jiang & Zhang, 2001). More work needs to be done
to unveil the actual impacts of ABA on plants during drought.
This information suggests that signalling molecules such as 14-3-3 proteins and
ABA appear to act upstream of ROS production and antioxidant defence in plants.
Further work on these molecules might therefore give an interesting picture on how they
influence plant fertility under water shortage condition.
6.7. Concluding remarks
This thesis has contributed to the understanding of the cellular and molecular
basis of pollen sterility in rice under water shortage conditions. New information
Page 182
148
regarding the possible molecular mechanisms of pollen sterility under drought
conditions has proposed and discussed. Oxidative stress appears to be a plausible reason
for the decline of pollen viability and grain set in the present work. Indeed, transgenic
rice engineered with MnSOD, a ROS scavenging enzyme, does show better tolerance to
dought induced by PEG in comparison to the wild type (Wang et al., 2005).
Nevertheless, a more detailed investigation of mitochondrial respiration in rice anthers
is required to further examine this problem. Moreover, this thesis has suggested new
ideas regarding the role of rising sugar levels to cope with oxidative stress in anthers.
Sugar accumulation might have provided protection against oxidant damage by
strengthening the antioxidant system. However, the interplay between sugar and
oxidative stress is not straightforward and needs to be further characterised. In-depth
investigations on the interaction between sugar signaling and oxidative stress responses
may help indentify the role of sugars in protecting anthers under water deficit.
Although many studies on drought and chilling stresses in rice anthers have been
performed, the causal mechanism of male sterility, to some extent, is still poorly
understood. Findings presented in this thesis may contribute to understandings of
drought stress responses in rice. Furthermore, the mechanisms underlying water deficit
induced pollen sterility in this study can be not only applied for rice plants but also
extended to other cereals crops. Findings from this thesis may assist in developing
better breeding strategies for improving drought tolerance in rice.
-----------------------------
Page 183
149
REFERENCES Alfred S. (2006) Low temperature effects on sugar metabolism in rice anthers. PhD
thesis, The University of Sydney. Alscher R.G., Erturk N., Heath L.S. (2002) Role of superoxide dismutases (SODs) in
controlling oxidative stress in plants. Journal of Experimental Botany 53, 1331-1341.
Aoki N., Hirose T., Scofield G.N., Whitfeld P.R., Furbank R.T. (2003) The sucrose
transporter gene family in rice. Plant & Cell Physiology 44, 223-232. Apel K., Hirt H. (2004) Reactive oxygen species: metabolism, oxidative stress, and
signal transduction. Annual Review of Plant Biology 55, 373-399. Arends M.J., Morris R.G., Wyllie A.H. (1990) Apoptosis. The role of the
endonuclease. American Journal of Pathology 136, 593-608. Averillbates D.A., Przybytkowski E. (1994) The role of glucose in cellular defenses
against cytotoxicity of hydrogen peroxide in Chinese hamster ovary cells. Archives of Biochemistry and Biophysics 312, 52-58.
Babior B.M. (1999) NADPH oxidase: an update. Blood 93, 1464-1476. Baisak R., Rana D., Acharya P.B.B., Kar M. (1994) Alterations in the activities of
active oxygen scavenging enzymes of wheat leaves subjected to water stress. Plant & Cell Physiology 35, 489-495.
Barnabas B., Jager K., Feher A. (2008) The effect of drought and heat stress on
reproductive processes in cereals. Plant, Cell & Environment 31, 11-38. Bartels D., Sunkar R. (2005) Drought and salt tolerance in plants. Critical Reviews in
Plant Sciences 24, 23 - 58. Beckman K.B., Ames B.N. (1997) Oxidative decay of DNA. Journal of Biological
Chemistry 272, 19633-19636. Bedinger P. (1992) The remarkable biology of pollen. Plant Cell 4, 879-887. Beers E.P. (1997) Programmed cell death during plant growth and development. Cell
Death & Differentiation 4, 649-661. Beily F.E., Koleske J.V. (1987) Configuration and hydrodynamic properties of the
polyethylene chain in solution. In 'Nonionic surfactants'. (Ed. M. J. Schick). (Marcel Dekker: New York)
Berlett B.S., Stadtman E.R. (1997) Protein oxidation in aging, disease, and oxidative
stress. Journal of Biological Chemistry 272, 20313-20316.
Page 184
150
Bhandari N.N. (1984) The microsporangium. In 'Embryology of Angiosperms'. (Ed. B. M. Johri) pp. 53-121. (Springer: Berlin, Heidelberg, New York)
Bhuiyan S.I. (1992) Water management in relation to crop production: case study on
rice. Outlook on Agriculture 21, 293-299. Bingham J. (1966) Varietal response in wheat to water supply in the field, and male
sterility caused by a period of drought in a glasshouse experiment. Annals of Applied Biology 57, 365-377.
Blackwell J., Meyer W., Smith R. (1985) Growth and yield of rice under sprinkler
irrigation on a free-draining soil. Australian Journal of Experimental Agriculture 25, 636-641.
Blow A.M.J., Botham G.M., Fisher D., Goodall A.H., Tilcock C.P.S., Lucy J.A.
(1978) Water and calcium ions in cell fusion induced by poly(ethylene glycol). FEBS Letters 94, 305-310.
Bonnefont-Rousselot D. (2002) Glucose and reactive oxygen species. Current Opinion
in Clinical Nutrition & Metabolic Care 5, 561-568. Bonner L.J., Dickinson H.G. (1989) Anther dehiscence in Lycopersicon esculentum
Mill. I. Structural aspects. New Phytologist 113, 97-115. Bortner C.D., Oldenburg N.B.E., Cidlowski J.A. (1995) The role of DNA
fragmentation in apoptosis. Trends in Cell Biology 5, 21-26. Botrel A., Kaiser W.M. (1997) Nitrate reductase activation state in barley roots in
relation to the energy and carbohydrate status. Planta 201, 496-501. Bowler C., Montagu M.V., Inze D. (1992) Superoxide dismutase and stress tolerance.
Annual Review of Plant Physiology and Plant Molecular Biology 43, 83-116. Boyer J.S., Westgate M.E. (2004) Grain yields with limited water. Journal of
Experimental Botany 55, 2385-2394. Bray E.A. (1997) Plant responses to water deficit. Trends in Plant Science 2, 48-54. Bray E.A., Bailey-Serres J., Weretilnyk E. (2000) Responses to abiotic stresses. In
'Biochemistry & Molecular Biology of Plants'. (Eds B. B. Buchanan, W. Gruissem and R. Jones) pp. 1158-1203. (American Society of Plant Physiologists: Rockville, MD)
Bunney T.D., van Walraven H.S., de Boer A.H. (2001) 14-3-3 protein is a regulator
of the mitochondrial and chloroplast ATP synthase. PNAS 98, 4249-4254. Bussis D., Kauder F., Heineke D. (1998) Acclimation of potato plants to polyethylene
glycol-induced water deficit I. Photosynthesis and metabolism. Journal of Experimental Botany 49, 1349-1360.
Page 185
151
Bustin S.A. (2000) Absolute quantification of mRNA using real-time reverse transcription polymerase chain reaction assays. Journal of Molecular Endocrinology 25, 169-193.
Cabezon E., Arechaga I., Jonathan P., Butler G., Walker J.E. (2000) Dimerization
of bovine F1-ATPase by binding the inhibitor protein, IF1. Journal of Biological Chemistry 275, 28353-28355.
Cabuslay G.S., Ito O., Alejar A.A. (2002) Physiological evaluation of responses of
rice (Oryza sativa L.) to water deficit. Plant Science 163, 815-827. Carpita N., Sabularse D., Montezinos D., Delmer D.P. (1979) Determination of the
pore size of cell walls of living plant cells. Science 205, 1144-1147. Carson D.A., Seto S., Wasson D.B., Carrera C.J. (1986) DNA strand breaks, NAD
metabolism, and programmed cell death. Experimental Cell Research 164, 273-281.
Castro A., Clement C. (2007) Sucrose and starch catabolism in the anther of Lilium
during its development: a comparative study among the anther wall, locular fluid and microspore/pollen fractions. Planta 225, 1573-1582.
Chen H., Yan C., Jiang X., Dai Y.R. (1999) Hyperthermia-induced apoptosis and the
inhibition of DNA laddering by zinc supplementation and withdrawal of calcium and magnesium in suspension culture of tobacco cells. Cellular and Molecular Life Sciences 55, 303-309.
Chen L.B. (1988) Mitochondrial membrane potential in living cells. Annual Review of
Cell Biology 4, 155-181. Chiou T.J., Bush D.R. (1998) Sucrose is a signal molecule in assimilate partitioning.
PNAS 95, 4784-4788. Choi W.Y., Kang S.H., Park H.K., Kim S.S., Lee K.S., Lee K.S., Shin H.T., Choi
S.Y. (2000) Effects of water stress by PEG on growth and physiological traits in rice seedlings. Korean Journal of Crop Science 45, 112-117.
Clement C., Audran J.C. (1995) Anther wall layers control pollen sugar nutrition in
Lilium. Protoplasma 187, 172-181. Clement C., Chavant L., Burrus M., Audran J.C. (1994) Anther starch variations in
Lilium during pollen development. Sexual Plant Reproduction 7, 347-356. Cohen J.J. (1993) Apoptosis. Immunology Today 14, 126-130. Collins J.A., Schandl C.A., Young K.K., Vesely J., Willingham M.C. (1997) Major
DNA fragmentation is a late event in apoptosis. Journal of Histochemistry & Cytochemistry 45, 923-934.
Page 186
152
Conde C., Agasse A., Glissant D., Tavares R., Geros H., Delrot S. (2006) Pathways of glucose regulation of monosaccharide transport in grape cells. Plant Physiology 141, 1563-1577.
Cooper M., Fukai S., Wade L.J. (1999) How can breeding contribute to more
productive and sustainable rainfed lowland rice systems? Field Crops Research 64, 199-209.
Copeland L. (1990) Enzymes of sucrose metabolism. In 'Methods in Plant
Biochemistry Vol. 3' pp. 73-85. (Academic Press Limited) Couee I., Sulmon C., Gouesbet G., El Amrani A. (2006) Involvement of soluble
sugars in reactive oxygen species balance and responses to oxidative stress in plants. Journal of Experimental Botany 57, 449-459.
Cox K.H., DeLeon D.V., Angerer L.M., Angerer R.C. (1984) Detection of mRNAs in
sea urchin embryos by in situ hybridization using asymmetric RNA probes. Developmental Biology 101, 485-502.
Cruz R.T., O'Toole J.C. (1984) Dryland rice response to an irrigation gradient at
flowering stage. Agronomy Journal 76, 178-183. Dat J.F., Pellinen R., Van De Cotte B., Langebartels C., Kangasjarvi J., Inze D.,
Van Breusegem F. (2003) Changes in hydrogen peroxide homeostasis trigger an active cell death process in tobacco. The Plant Journal 33, 621-632.
Davies W.J., Zhang J. (1991) Root signals and the regulation of growth and
development of plants in drying soil. Annual Review of Plant Physiology and Plant Molecular Biology 42, 55-76.
De Datta S.K., Chang T.T., Yoshida S. (1975) Drought tolerance in upland rice. In
'Major Research in Upland Rice' pp. 101-116. (International Rice Research Institute: Los Banos, Philippines)
Deluca M., McElroy W.D. (1978) Purification and properties of firefly luciferase.
Methods in Enzymology 57, 3-15. Dembinska O., Lalonde S., Saini H.S. (1992) Evidence against the regulation of grain
set by spikelet abscisic acid levels in water-stressed wheat. Plant Physiology 100, 1599-1602.
Denecker G., Vercammen D., Declercq W., Vandenabeele P. (2001) Apoptotic and
necrotic cell death induced by death domain receptors. Cellular and Molecular Life Sciences 58, 356-370.
Desikan R., Reynolds A., Hancock J.T., Neill S.J. (1998) Harpin and hydrogen
peroxide both initiate programmed cell death but have differential effects on defence gene expression in Arabidopsis suspension cultures. Biochemical Journal 330, 115-120.
Page 187
153
Dorion S., Lalonde S., Saini H.S. (1996) Induction of male sterility in wheat by meiotic-stage water deficit is preceded by a decline in invertase activity and changes in carbohydrate metabolism in anthers. Plant Physiology 111, 137-145.
Droge W. (2002) Free radicals in the physiological control of cell function.
Physiological Reviews 82, 47-95. Dumont A., Hehner S.P., Hofmann T.G., Ueffing M., Dröge W., Schmitz M.L.
(1999) Hydrogen peroxide-induced apoptosis is CD95-independent, requires the release of mitochondria-derived reactive oxygen species and the activation of NF-KB. Oncogene 18, 747-757.
Duviek D.N. (1965) Cytoplasmic pollen sterility in corn. Advances in Genetics 13, 1-
56. Edwardson I.R. (1970) Cytoplasmic male sterility. Botanical Review 36, 341-420. Eguchi Y., Shimizu S., Tsujimoto Y. (1997) Intracellular ATP levels determine cell
death fate by apoptosis or necrosis. Cancer Research 57, 1835-1840. Ekanayake I.J., De Datta S.K., Steponkus P.L. (1989) Spikelet sterility and flowering
response of rice to water stress at anthesis. Annals of Botany 63, 257-264. Emmert F.H. (1974) Inhibition of phosphorus and water passage across intact roots by
polyethylene glycol and phenylmercuric acetate. Plant Physiology 53, 663-665. Esau K. (1977) 'Anatomy of Seed Plants.' (Willey: New York) Evenson R.E., Herdt R.W., Hossain M. (Eds) (1996) 'Rice research in Asia: progress
and priorities.' (International Rice Research Institute: Los Banos, Laguna, Philippines)
Fath A., Bethke P.C., Jones R.L. (1999) Barley aleurone cell death is not apoptotic:
characterization of nuclease activities and DNA degradation. The Plant Journal 20, 305-315.
Ferl R.J. (1996) 14-3-3 proteins and signal transduction. Annual Review of Plant
Physiology and Plant Molecular Biology 47, 49-73. Fernie A.R., Carrari F., Sweetlove L.J. (2004) Respiratory metabolism: glycolysis,
the TCA cycle and mitochondrial electron transport. Current Opinion in Plant Biology 7, 254-261.
Flexas J., Bota J., Galmes J., Medrano H., Ribas-Carbo M. (2006) Keeping a
positive carbon balance under adverse conditions: responses of photosynthesis and respiration to water stress. Physiologia Plantarum 127, 343-352.
Foreman J., Demidchik V., Bothwell J.H.F., Mylona P., Miedema H., Torres M.A.,
Linstead P., Costa S., Brownlee C., Jones J.D.G., Davies J.M., Dolan L.
Page 188
154
(2003) Reactive oxygen species produced by NADPH oxidase regulate plant cell growth. Nature 422, 442-446.
Foyer C.H., Noctor G. (2005a) Oxidant and antioxidant signalling in plants: a re-
evaluation of the concept of oxidative stress in a physiological context. Plant, Cell & Environment 28, 1056-1071.
Foyer C.H., Noctor G. (2005b) Redox homeostasis and antioxidant signaling: a
metabolic interface between stress perception and physiological pesponses. Plant Cell 17, 1866-1875.
Fu H., Subramanian R.R., Masters S.C. (2000) 14-3-3 Proteins: Structure, Function,
and Regulation. Annual Reviews of Pharmacology & Toxicology 40, 617-647. Fulgosi H., Soll J., de Faria Maraschin S., Korthout H.A.A.J., Wang M., Testerink
C. (2002) 14-3-3 proteins and plant development. Plant Molecular Biology 50, 1019-1029.
Galluzzi L., Maiuri M.C., Vitale I., Zischka H., Castedo M., Zitvogel L., Kroemer
G. (2007) Cell death modalities: classification and pathophysiological implications. Cell Death and Differentiation 14, 1237.
Garg A.K., Kim J.K., Owens T.G., Ranwala A.P., Choi Y.D., Kochian L.V., Wu
R.J. (2002) Trehalose accumulation in rice plants confers high tolerance levels to different abiotic stresses. PNAS 99, 15898-15903.
Gavrieli Y., Sherman Y., Ben-Sasson S.A. (1992) Identification of programmed cell
death in situ via specific labeling of nuclear DNA fragmentation. Journal of Cell Biology 119, 493-501.
Godt D.E., Roitsch T. (1997) Regulation and tissue-specific distribution of mRNAs for
three extracellular invertase isoenzymes of tomato suggests an important function in establishing and maintaining sink metabolism. Plant Physiology 115, 273-282.
Goetz M., Godt D.E., Guivarc'h A., Kahmann U., Chriqui D., Roitsch T. (2001)
Induction of male sterility in plants by metabolic engineering of the carbohydrate supply. PNAS 98, 6522-6527.
Goldberg R.B., Beals T.P., Sanders P.M. (1993) Anther development: basic principles
and practical applications. Plant Cell 5, 1217-1229. Golstein P., Kroemer G. (2007) Cell death by necrosis: towards a molecular definition.
Trends in Biochemical Sciences 32, 37-43. Graham N.B., Chen C.F. (1993) Interaction of poly(ethylene oxide) with solvent -5.
The densities of water/poly(ethylene glycol) mixtures. European Polymer Journal 29, 149-151.
Page 189
155
Graham N.B., Nwachuku N.E., Walsh D.J. (1982) Interaction of poly(ethylene oxide) with solvents: 1. Preparation and swelling of a crosslinked poly(ethylene oxide) hydrogel. Polymer 23, 1345-1349.
Graham-Bryce I.J. (1967) Method of supplying water to soil at osmotically controlled
potentials. Chemistry and Industry (London) 9, 353-354. Granot D., Levine A., Dor Hefetz E. (2003) Sugar-induced apoptosis in yeast cells.
FEMS Yeast Research 4, 7-13. Grasl-Kraupp B, Ruttkay-Nedecky B, Koudelka H, Bukowska K, Bursch W,
Schulte-Hermann R. (1995) In situ detection of fragmented DNA (TUNEL assay) fails to discriminate among apoptosis, necrosis, and autolytic cell death: a cautionary note. Hepatology 21, 1465-1468.
Greenberg J.T. (1996) Programmed cell death: A way of life for plants. PNAS 93,
12094-12097. Greenberg J.T. (1997) Programmed cell death in plant pathogen interactions. Annual
Review of Plant Physiology and Plant Molecular Biology 48, 525-545. Grusch M., Polgar D., Gfatter S., Leuhuber K., Huettenbrenner S., Leisser C.,
Fuhrmann G., Kassie F., Steinkellner H., Smid K., Peters G.J., Jayaram H.N., Klepal W., Szekeres T., Knasmüller S., Krupitza G. (2002) Maintenance of ATP favours apoptosis over necrosis triggered by benzamide riboside. Cell Death and Differentiation 9, 169.
Guan L.M., Zhao J., Scandalios J.G. (2000) Cis-elements and trans-factors that
regulate expression of the maize Cat1 antioxidant gene in response to ABA and osmotic stress: H2O2 is the likely intermediary signaling molecule for the response. The Plant Journal 22, 87-95.
Gunawardena T.A., Fukai S., Blamey F.P.C. (2003) Low temperature induced
spikelet sterility in rice. I. Nitrogen fertilization and sensitive reproductive period. Australian Journal of Agricultural Research 54, 937-946.
Hale A.J., Smith C.A., Sutherland L.C., Stoneman V.E.A., Longthorne V.L.,
Culhane A.C., Williams G.T. (1996) Apoptosis: molecular regulation of cell death. European Journal of Biochemistry 236, 1-26.
Halliwell B. (2006) Reactive species and antioxidants. Redox biology is a fundamental
theme of aerobic life. Plant Physiology 141, 312-322. Halliwell B., Whiteman M. (2004) Measuring reactive species and oxidative damage
in vivo and in cell culture: how should you do it and what do the results mean? British Journal of Pharmacology 142, 231-255.
Hayashi M., Takahashi H., Tamura K., Huang J., Yu L.H., Kawai-Yamada M.,
Tezuka T., Uchimiya H. (2005) Enhanced dihydroflavonol-4-reductase activity
Page 190
156
and NAD homeostasis leading to cell death tolerance in transgenic rice. PNAS 102, 7020-7025.
Heemels M. (2000) Apoptosis. Nature 407, 769. Heenan D.P. (1984) Low temperature induced floret sterility in the rice cultivars
Calrose and Inga as influenced by nitrogen supply. Australian Journal of Experimental Agriculture 24, 255-259.
Heid C.A., Stevens J., Livak K.J., Williams P.M. (1996) Real time quantitative PCR.
Genome Research 6, 986-994. Heslop-Harrison J., Heslop-Harrison Y. (1970) Evaluation of pollen viability by
enzymatically induced fluorescence; intracellular hydrolysis of fluorescein diacetate. Stain technology 45, 115-120.
Ho S.L., Chao Y.C., Tong W.F., Yu S.M. (2001) Sugar coordinately and differentially
regulates growth and stress-related gene expression via a complex signal transduction network and multiple control mechanisms. Plant Physiology 125, 877-890.
Hu X., Jiang M., Zhang A., Lu J. (2005) Abscisic acid-induced apoplastic H2O2
accumulation up-regulates the activities of chloroplastic and cytosolic antioxidant enzymes in maize leaves. Planta 223, 57-68.
Hu X., Zhang A., Zhang J., Jiang M. (2006) Abscisic acid is a key inducer of
hydrogen peroxide production in leaves of maize plants exposed to water stress. Plant & Cell Physiology 47, 1484-1495.
Huang C.N., Cornejo M.J., Bush D.S., Jones R.L. (1986) Estimating viability of plant
protoplasts using double and single staining. Protoplasma 135, 80-87. Huang L.F., Bocock P.N., Davis J.M., Koch K.E. (2007) Regulation of invertase: a
suite of transcriptional and post-transcriptional mechanisms. Functional Plant Biology 34, 499-507.
Hui S.W., Kuhl T.L., Guo Y.Q., Israelachvili J. (1999) Use of poly(ethylene glycol)
to control cell aggregation and fusion. Colloid Surf. B-Biointerfaces 14, 213-222. Imin N., Kerim T., Rolfe B.G., Weinman J.J. (2004) Effect of early cold stress on the
maturation of rice anthers. Proteomics 4, 1873-1882. Imlau A., Truernit E., Sauer N. (1999) Cell to cell and long-distance trafficking of the
green fluorescent protein in the phloem and symplastic unloading of the protein into sink tissues. Plant Cell 11, 309-322.
Ito N. (1978) Male sterility caused by cooling treatment at the young microspore stage
in rice plants. XVI. Changes in carbohydrates, nitrogenous and phosphorus compounds in rice anthers after cooling treatment. Japanese Journal of Crop Science 47, 318-323.
Page 191
157
Janes B.E. (1961) Use of polyethylene glycol as a solute to increase the osmotic
pressure of nutrient solutions in studies of the physiology of water in plants. Plant physiology 36, Suppl. XXIV.
Janes B.E. (1966) Adjustment mechanism of plants subjected to varied osmotic
pressures of nutrient solution. Soil Science 101, 180-188. Janes B.E. (1974) The effect of molecular size, concentration in nutrient solution, and
exposure time on the amount and distribution of polyethylence glycol in pepper plants. Plant Physiology 54, 226-230.
Jiang M., Zhang J. (2001) Effect of abscisic acid on active oxygen species,
antioxidative defence system and oxidative damage in leaves of maize seedlings. Plant & Cell Physiology 42, 1265-1273.
Jiang M., Zhang J. (2002a) Role of abscisic acid in water stress-induced antioxidant
defense in leaves of maize seedlings. Free Radical Research 36, 1001 - 1015. Jiang M., Zhang J. (2002b) Water stress-induced abscisic acid accumulation triggers
the increased generation of reactive oxygen species and up-regulates the activities of antioxidant enzymes in maize leaves. Journal of Experimental Botany 53, 2401-2410.
Jiang P., Zhang X., Zhu Y., Zhu W., Xie H., Wang X. (2007) Metabolism of reactive
oxygen species in cotton cytoplasmic male sterility and its restoration. Plant Cell Reports 26, 1627-1634.
John C.D., Limpinuntana V., Greenway H. (1974) Adaptation of rice to anaerobiosis.
Australian Journal of Plant Physiology. Johnson L., Walsh M., Bockus B., Chen L. (1981) Monitoring of relative
mitochondrial membrane potential in living cells by fluorescence microscopy. Journal of Cell Biology 88, 526-535.
Johnson L.V., Walsh M.L., Chen L.B. (1980) Localization of mitochondria in living
cells with Rhodamine 123. PNAS 77, 990-994. Jongdee B., Fukai S., Cooper M. (2002) Leaf water potential and osmotic adjustment
as physiological traits to improve drought tolerance in rice. Field Crops Research 76, 153-163.
Karni L., Aloni B. (2002) Fructokinase and hexokinase from pollen grains of Bell
pepper (Capsicum annuum L.): possible role in pollen germination under conditions of high temperature and CO2 enrichment. Annals of Botany 90, 607-612.
Kato Y., Urano J.i., Maki Y., Ushimaru T. (1997) Purification and characterization of
dehydroascorbate reductase from rice. Plant & Cell Physiology 38, 173-178.
Page 192
158
Kaufmann M.R., Eckard A.N. (1971) Evaluation of water stress control with polyethylene glycols and analysis of guttation. Plant Physiology 47, 453-456.
Kaul R. (1966) Relative growth rates of spring wheat, oats, and barley under
polyethylene glycol induced water stress. Canadian journal of plant science 46, 611-617.
Kerim T., Imin N., Weinman J.J., Rolfe B.G. (2003) Proteome analysis of male
gametophyte development in rice anthers. Proteomics 3, 738-751. Kerr J.F., Wyllie A.H., Currie A.R. (1972) Apoptosis: a basic biological phenomenon
with wide-ranging implications in tissue kinetics. British Journal of Cancer 26, 239-257.
Kerr J.F.R., Harmon B.V. (1991) Definition and incidence of apoptosis: an historical
perspective. In 'Apoptosis: The Molecular Basis of Cell Death'. (Eds L. D. Tomei and F. O. Cope) pp. 5-29. (Cold Spring Harbor Laboratory Press: NY)
Khush G.S. (1984) Terminology for rice growing environments. In 'Terminology of
rice growing environments' pp. 5-10. (Rice Research Institute. P.O. Box 933, Manila, Philippines)
Khush G.S. (2005) What it will take to Feed 5.0 Billion Rice consumers in 2030. Plant
Molecular Biology 59, 1-6. Kjellander R., Florin E. (1981) Water structure and changes in thermal stability of the
system poly(ethylene oxide)–water. Journal of the Chemical Society, Faraday Transactions 1 77, 2053-2077.
Klionsky D.J., Emr S.D. (2000) Autophagy as a regulated pathway of cellular
degradation. Science 290, 1717-1721. Koch K.E. (1996) Carbohydrate modulated gene experession in plants. Annual Review
of Plant Physiology and Plant Molecular Biology 47, 509-540. Komminoth P. (2002) Detection of mRNA in tissue sections using DIG-labeled RNA
and oligonucleotide probes. In 'DIG Application Manual for Non-Radioactive in Situ Hybridization, 3rd edn.' (Eds D. Eisel, S. Grunewald-Janho and B. Kruchen) pp. 149–163. (Roche Diagnostics: Penzberg, Germany)
Kondo Y., Kanzawa T., Sawaya R., Kondo S. (2005) The role of autophagy in cancer
development and response to therapy. Nature Reviews Cancer 5, 726-734. Kong J., Li Z., Tan Y.P., Wan C.X., Li S.Q., Zhu Y.G. (2007) Different gene
expression patterns of sucrose-starch metabolism during pollen maturation in cytoplasmic male-sterile and male-fertile lines of rice. Physiologia Plantarum 130, 136-147.
Koonjul P.K., Minhas J.S., Nunes C., Sheoran I.S., Saini H.S. (2005) Selective
transcriptional down-regulation of anther invertases precedes the failure of pollen
Page 193
159
development in water-stressed wheat. Journal of Experimental Botany 56, 179-190.
Krizek D.T. (1985) Methods of inducing water stress in plants. Horticultural science
20, 1028-1038. Kroemer G., El-Deiry W.S., Golstein P., Peter M.E., Vaux D., Vandenabeele P.,
Zhivotovsky B., Blagosklonny M.V., Malorni W., Knight R.A., Piacentini M., Nagata S., Melino G. (2005) Classification of cell death: recommendations of the Nomenclature Committee on Cell Death. Cell Death & Differentiation 12, 1463-1467.
Ku S., Yoon H., Suh H.S., Chung Y.Y. (2003) Male-sterility of thermosensitive genic
male-sterile rice is associated with premature programmed cell death of the tapetum. Planta 217, 559-565.
Kuhn C., Barker L., Burkle L., Frommer W. (1999) Update on sucrose transport in
higher plants. Journal of Experimental Botany 50, 935-953. Kuk Y.I., Shin J.S., Burgos N.R., Hwang T.E., Han O., Cho B.H., Jung S., Guh
J.O. (2003) Antioxidative enzymes offer protection from chilling damage in rice plants. Crop Science 43, 2109-2117.
Lagerwerff J.V., Ogata G., Eagle H.E. (1961) Control of osmotic pressure of culture
solutions with polyethylene glycol. Science 133, 1486-1487. Lalonde S., Beebe D.U., Saini H.S. (1997a) Early signs of disruption of wheat anther
development associated with the induction of male sterility by meiotic-stage water deficit. Sexual Plant Reproduction 10, 40-48.
Lalonde S., Boles E., Hellmann H., Barker L., Patrick J.W., Frommer W.B., Ward
J.M. (1999) The dual function of sugar carriers: transport and sugar sensing. Plant Cell 11, 707-726.
Lalonde S., Morse D., Saini H.S. (1997b) Expression of a wheat ADP-glucose
pyrophosphorylase gene during development of normal and water-stress-affected anthers. Plant Molecular Biology 34, 445-453.
Lalonde S., Tegeder M., Throne-Holst M., Frommer W.B., Patrick J.W. (2003)
Phloem loading and unloading of sugars and amino acids. Plant, Cell & Environment 26, 37-56.
Lam E. (2004) Controlled cell death, plant survival and development. Nature Reviews
Molecular Cell Biology 5, 305-315. Lambers H., Chapin III F.S., Pons T.L. (1998a) Long distance transport of
assimilates. In 'Plant Physiological Ecology' pp. 140-153. (Springer-Verlag New York Inc: New York)
Page 194
160
Lambers H., Chapin III F.S., Pons T.L. (1998b) Respiration. In 'Plant Physiological Ecology' pp. 96-139. (Springer-Verlag New York Inc: New York)
Lang A.R.G. (1967) Osmotic coefficients and water potentials of sodium chloride
solutions from 0 to 40oC. Australian Journal of Chemistry 20, 2017-2023. Lawen A. (2003) Apoptosis - an introduction. BioEssays 25, 888-896. Lawlor D.W. (1970) Absorption of polyethylene glycols by plants and their effects on
plant growth. New Phytologist 69, 501-513. Lee A.B., Cooper T.A. (1995) Improved direct PCR screen for bacterial colonies:
wooden toothpicks inhibit PCR amplification. Biotechniques 18, 225–226. Lee S.L.J., Warmke H.E. (1979) Organelle size and number in fertile and T-
Cytoplasmic male sterile corn. American Journal of Botany 66, 141-148. Leist M., Single B., Castoldi A.F., Kuhnle S., Nicotera P. (1997) Intracellular
adenosine triphosphate (ATP) concentration: a switch in the decision between apoptosis and necrosis. Journal of Experimental Medicine 185, 1481-1486.
Levine A., Pennell R.I., Alvarez M.E., Palmer R., Lamb C. (1996) Calcium-
mediated apoptosis in a plant hypersensitive disease resistance response. Current Biology 6, 427-437.
Levine A., Tenhaken R., Dixon R., Lamb C. (1994) H2O2 from the oxidative burst
orchestrates the plant hypersensitive disease resistance response. Cell 79, 583-593.
Levine B., Klionsky D.J. (2004) Development by self-digestion: molecular
mechanisms and biological functions of autophagy. Developmental Cell 6, 463-477.
Li S., Wan C., Kong J., Zhang Z., Li Y., Zhu Y. (2004) Programmed cell death
during microgenesis in a Honglian CMS line of rice is correlated with oxidative stress in mitochondria. Functional Plant Biology 31, 369-376.
Li Z.A. (2005) Cellular and molecular biology of chilling damage in rice anthers. PhD
thesis, The University of Sydney. Lian H.L., Yu X., Ye Q., Ding X.S., Kitagawa Y., Kwak S.S., Su W.A., Tang Z.C.
(2004) The role of aquaporin RWC3 in drought avoidance in rice. Plant & Cell Physiology 45, 481-489.
Lilley J.M., Fukai S. (1994) Effect of timing and severity of water deficit on four
diverse rice cultivars III. Phenological development, crop growth and grain yield. Field Crops Research 37, 225-234.
Lim J.D., Cho J.I., Park Y.I., Hahn T.R., Choi S.B., Jeon J.S. (2006) Sucrose
transport from source to sink seeds in rice. Physiologia Plantarum 126, 572-584.
Page 195
161
Liu K.J. (1968) Nuclear magnetic resonance studies of polymer solutions. IV.
Polyethylene glycols. Macromolecules 1, 213-217. Liu K.J., Parsons J.L. (1969) Solvent effects on the preferred conformation of poly
(ethylene glycols). Macromolecules 2, 529-533. Liu X., Kim C.N., Yang J., Jemmerson R., Wang X. (1996) Induction of apoptotic
program in cell free extracts: requirement for dATP and cytochrome c. Cell 86, 147-157.
Mamun E.A., Alfred S., Cantrill L.C., Overall R.L., Sutton B.G. (2006) Effects of
chilling on male gametophyte development in rice. Cell Biology International 30, 583-591.
Mamun E.A., Cantrill L.C., Overall R.L., Sutton B.G. (2005a) Cellular organisation
and differentiation of organelles in pre-meiotic rice anthers. Cell Biology International 29, 792-802.
Mamun E.A., Cantrill L.C., Overall R.L., Sutton B.G. (2005b) Cellular organisation
in meiotic and early post-meiotic rice anthers. Cell Biology International 29, 903-913.
Mascarenhas J.P. (1989) The male gametophyte of flowering plants. Plant Cell 1, 657-
664. Matsui T., Omasa K., Horie T. (1999) Mechanism of anther dehiscence in rice (Oryza
sativa L.). Annals of Botany 84, 501-506. Matsukura C., Saitoh T., Hirose T., Ohsugi R., Perata P., Yamaguchi J. (2000)
Sugar uptake and transport in rice embryo. Expression of companion cell-specific sucrose transporter (OsSUT1) induced by sugar and light. Plant Physiology 124, 85-94.
Matsuo T., Kumazawa K., Ishii R., Ishihara K., Hirata H. (1995) 'Science of the rice
plant. Volume 2: Physiology.' (Food and Agriculture Policy Research Center: Tokyo, Japan)
Matsushima S. (1957) Analysis of developmental factors determining yield and yield
prediction in lowland rice. Bulletin of the National Institute of Agricultural Science Japan A5, 1–271.
Maxfield J., Shepherd I.W. (1975) Conformation of poly(ethylene oxide) in the solid
state, melt and solution measured by Raman scattering. Polymer 16, 505-509. McCormick S. (1993) Male gametophyte development. Plant Cell 5, 1265-1275. McCormick S. (2004) Control of male gametophyte development. Plant Cell 16, S142-
153.
Page 196
162
Mea M.D., Serafini-Fracassini D., Duca S.D. (2007) Programmed cell death: similarities and differences in animals and plants. A flower paradigm. Amino Acids 33, 395-404.
Mexal J., Fisher J.T., Osteryoung J., Reid C.P.P. (1975) Oxygen availability in
polyethylene glycol solutions and its implications in plant water relations. Plant Physiology 55, 20-24.
Meyer S., de Kouchkovsky Y. (1992) ATPase state and activity in thylakoids from
normal and water-stressed lupin. FEBS Letters 303, 233-236. Mittler R., Herr E.H., Orvar B.L., van Camp W., Willekens H., Inze D., Ellis B.E.
(1999) Transgenic tobacco plants with reduced capability to detoxify reactive oxygen intermediates are hyperresponsive to pathogen infection. PNAS 96, 14165-14170.
Moller I.M. (2001) Plant mitochondria and oxidative stress: electron transport, NADPH
turnover, and metabolism of reactive oxygen species. Annual Review of Plant Physiology and Plant Molecular Biology 52, 561-591.
Moller I.M., Jensen P.E., Hansson A. (2007) Oxidative modifications to cellular
components in plants. Annual Review of Plant Biology 58, 459-481. Moran J.F., Becana M., Iturbe-Ormaetxe I.a., Frechilla S., Klucas R.V., Aparicio-
Tejo P. (1994) Drought induces oxidative stress in pea plants. Planta 194, 346-352.
Morgan J.M. (1980) Possible role of abscisic acid in reducing seed set in water
stressed wheat plants. Nature 289, 655-657. Muirhead W.A., Blackwell J., Humphreys E., White R.J.G. (1989) The growth and
nitrogen economy of rice under sprinkler and flood irrigation in South East Australia. Irrigation Science 10, 183-199.
Mygatt E. (2006) World's water resources face mounting pressure http://www.earth-
policy.org/Indicators/Water/2006.htm. In 'Eco-Economy Indicators: Trends to Track'. (Earth Policy Institute)
Namuco O.S., O'Toole J.C. (1986) Reproductive stage water stress and sterility. I.
Effect of stress during meiosis. Crop Science 26, 317-321. Narciso J., Hossain M. (2005). In 'World Rice Statistics
http://www.irri.org/science/ricestat.' (International Rice Research Insititute) Nelson N. (1944) A photometric adaptation of the Somogyi method for the
determination of glucose. Journal of Biological Chemistry 153, 375-380. Nishikawa F., Kato M., Hyodo H., Ikoma Y., Sugiura M., Yano M. (2005) Effect of
sucrose on ascorbate level and expression of genes involved in the ascorbate
Page 197
163
biosynthesis and recycling pathway in harvested broccoli florets. Journal of Experimental Botany 56, 65-72.
Nishiyama I. (1983) Male sterility caused by cooling treatment at the young microspore
stage in rice plants. XXVI. The number of ripened pollen grains and the difference in susceptibility to coolness among spikelets on the panicle. Japanese Journal of Crop Science 52, 307-313.
Nishiyama I. (1984) Climatic influence on pollen formation and fertilization. In
'Biology of rice'. (Eds S. Tsunoda and N. Takahashi) pp. 153–171. (Japan Scientific Societies Press/Elsevier: Tokyo, Japan)
Nishiyama I. (1997) Morphological damages caused by the cool weather. In 'Science of
the Rice Plant'. (Eds T. Matsuo and K. Hoshikawa) pp. 580–585. (Food and Agriculture Policy Research Centre: Tokyo, Japan)
Noctor G., Foyer C.H. (1998) Ascorbate and glutathione: keeping active oxygen under
control. Annual Review of Plant Physiology and Plant Molecular Biology 49, 249-279.
Oliver S.N. (2004) Indentification and characterization of genes affected by cold
treatment of rice anthers. PhD thesis, Charles Sturt University. Oliver S.N., Dennis E.S., Dolferus R. (2007) ABA regulates apoplastic sugar transport
and is a potential signal for cold-induced pollen sterility in rice. Plant & Cell Physiology 48, 1319-1330.
Oliver S.N., Van Dongen J.T., Alfred S.C., Mamun E.A., Zhao X., Saini H.S.,
Fernandes S.F., Blanchard C.L., Sutton B.G., Geigenberger P., Dennis E.S., Dolferus R. (2005) Cold-induced repression of the rice anther-specific cell wall invertase gene OSINV4 is correlated with sucrose accumulation and pollen sterility. Plant, Cell & Environment 28, 1534-1551.
Oparka K.J. (1994) Tansley review No 67. Plasmolysis: new insights into an old
process. New Phytologist 126, 571-591. Oparka K.J., Cruz S.S. (2000) The great escape: phloem transport and unloading of
macromolecules. Annual Review of Plant Physiology and Plant Molecular Biology 51, 323-347.
Oparka K.J., Gates P. (1981) Transport of assimilates in the developing caryopsis of
rice (Oryza sativa L.). Planta 152, 388-396. O'Toole J.C., Chang T.T. (1979) Drought resistance in cereals. Rice: a case study. In
'Stress Physiology in Crop Plants'. (Eds H. Mussell and R. C. Staples) pp. 373–405. (Wiley Interscience: New York)
O'Toole J.C., Cruz R.T. (1980) Response of leaf water potential, stomatal resistance,
and leaf rolling to water stress. Plant Physiology 65, 428-432.
Page 198
164
O'Toole J.C., Moya T.B. (1981) Water deficits and yield in upland rice. Field Crops Research 4, 247-259.
O'Toole J.C., Namuco O.S. (1983) Role of panicle exsertion in water stress induced
sterility. Crop Science 23, 1093-1097. Pacini E. (1990) Tapetum and microspore function. In 'Microspores, evolution and
ontogeny'. (Eds S. Blackmore and R. B. Knox). (Academic Press: London; Sydney)
Pacini E. (1994) Cell biology of anther and pollen development. In 'Genetic control of
self-incompatibility and reproductive development in flowering plants'. (Ed. E. G. Williams). (Kluwer Academic Publishers)
Pacini E., Franchi G.G. (1988) Amylogenesis and amylosis during pollen grain
development. In 'Sexual reproduction in higher plants'. (Eds M. Cresti, P. Gori and E. Pacini) pp. 181-186. (Springer-Verlag: Berlin)
Pacini E., Franchi G.G., Hesse M. (1985) The tapetum: Its form, function, and
possible phylogeny in Embryophyta. Plant Systematics and Evolution 149, 155-185.
Painter L. (1966) Method of subjecting growing plants to a continuous soil moisture
stress. Agronomy Journal 58, 459-460. Pan Y., Wu L., Yu Z. (2006) Effect of salt and drought stress on antioxidant enzymes
activities and SOD isoenzymes of liquorice (Glycyrrhiza uralensis Fisch). Plant Growth Regulation 49, 157-165.
Pandey S., Bhandari H., Hardy B. (2007) 'Economic costs of drought and rice
farmers' coping mechanism: a cross country comparative analysis.' (Los Baños (Philippines): International Rice Research Institute)
Pantuwan G., Fukai S., Cooper M., Rajatasereekul S., O'Toole J.C. (2002) Yield
response of rice (Oryza sativa L.) genotypes to different types of drought under rainfed lowlands: Part 1. Grain yield and yield components. Field Crops Research 73, 153-168.
Papini A., Mosti S., Brighigna L. (1999) Programmed-cell-death events during
tapetum development of angiosperms. Protoplasma 207, 213-221. Patrick J., Offler C. (1995) Post sieve element transport of sucrose in developing
seeds. Functional Plant Biology 22, 681-702. Patrick J.W. (1997) Phloem unloading: sieve element unloading and post sieve
element transport. Annual Review of Plant Physiology and Plant Molecular Biology 48, 191-222.
Pennell R.I., Lamb C. (1997) Programmed cell death in plants. Plant Cell 9, 1157-
1168.
Page 199
165
Pfaffl M.W. (2001) A new mathematical model for relative quantification in real-time
RT-PCR. Nucleic acids research 29, e45-. Pfaffl M.W., Horgan G.W., Dempfle L. (2002) Relative expression software tool
(REST) for group-wise comparison and statistical analysis of relative expression results in real-time PCR. Nucleic acids research 30, e36.
Piffanelli P., Murphy D.J. (1998) Novel organelles and targeting mechanisms in the
anther tapetum. Trends in Plant Science 3, 250-253. Piffanelli P., Ross J.H.E., Murphy D.J. (1998) Biogenesis and function of the lipidic
structures of pollen grains. Sexual Plant Reproduction 11, 65-80. Plaut Z., Federman E. (1985) A simple procedure to overcome polyethylene glycol
toxicity on whole plants. Plant Physiology 79, 559-561. Plaxton W.C. (1996) The organization and regulation of plant glycolysis. Annual
Review of Plant Physiology and Plant Molecular Biology 47, 185-214. Preiss J. (1982) Regulation of the biosynthesis and degradation of starch. Annual
Review of Plant Physiology 33, 431-454. Quick W.P., Schaffer A.A. (1996) Sucrose metabolism in sources and sinks. In
'Photoassimilate Distribution in Plants and Crops: Source-Sink Relationships'. (Eds E. Zamski and A. A. Schaffer) pp. 115–156. (New York, Basel, Hong Kong: Marcel Dekker, Inc)
Raghavan V. (1988) Anther and pollen development in rice (Oryza sativa). American
Journal of Botany 75, 183-196. Raghavan V. (1997) 'Molecular embryology of flowering plants.' (Cambridge
University Press Cambridge) Ramanjulu S., Bartels D. (2002) Drought- and desiccation-induced modulation of
gene expression in plants. Plant, Cell & Environment 25, 141-151. Richter C., Schweizer M., Cossarizza A., Franceschi C. (1996) Control of apoptosis
by the cellular ATP level. FEBS Letters 378, 107-110. Roitsch T. (1999) Source-sink regulation by sugar and stress. Current Opinion in Plant
Biology 2, 198-206. Rolland F., Baena-Gonzalez E., Sheen J. (2006) Sugar sensing and signaling in
plants: conserved and novel mechanisms. Annual Review of Plant Biology 57, 675-709.
Ryter S.W., Kim H.P., Hoetzel A., Park J.W., Nakahira K., Wang X., Choi A.M.K.
(2007) Mechanisms of cell death in oxidative stress. Antioxidants & Redox Signaling 9, 49-89.
Page 200
166
Saini H.S. (1997) Effects of water stress on male gametophyte development in plants.
Sexual Plant Reproduction 10, 67-73. Saini H.S., Aspinall D. (1981) Effect of water deficit on sporogenesis in wheat
(Triticum aestivum L.). Annals of Botany 48, 623-633. Saini H.S., Aspinall D. (1982) Sterility in wheat (Triticum aestivum L.) induced by
water deficit or high temperature: possible mediation by abscisic acid. Australian Journal of Plant Physiology 9, 529-537.
Saini H.S., Lalonde S. (1998) Injuries to reproductive development under water stress,
and their consequences for crop productivity. Journal of Crop Production 1, 223-248.
Saini H.S., Sedgley M., Aspinall D. (1984) Developmental anatomy in wheat of male
sterility induced by heat stress, water deficit or abscisic acid. Autralian Journal of Plant Physiology 11, 243-253.
Saini H.S., Westgate M.E. (2000) Reproductive development in grain crops during
drought. Advances in Agronomy 68, 59-96. Sairam R.K., Srivastava G.C. (2001) Water stress tolerance of wheat (Triticum
aestivum L.): variations in hydrogen peroxide accumulation and antioxidant activity in tolerant and susceptible genotypes. Journal of Agronomy and Crop Science 186, 63-70.
Sambongi Y., Iko Y., Tanabe M., Omote H., Iwamoto-Kihara A., Ueda I.,
Yanagida T., Wada Y., Futai M. (1999) Mechanical rotation of the c subunit oligomer in ATP synthase (F0F1): direct observation. Science 286, 1722-1724.
Sambrook J., Russell D.W. (2001) 'Molecular cloning: a laboratory manual.' (Cold
Spring Harbor Laboratory Press: Cold Spring Harbor, New York) Sanders P.M., Lee P.Y., Biesgen C., Boone J.D., Beals T.P., Weiler E.W., Goldberg
R.B. (2000) The arabidopsis DELAYED DEHISCENCE1 gene encodes an enzyme in the jasmonic acid synthesis pathway. Plant Cell 12, 1041-1062.
Saraste A., Pulkki K. (2000) Morphologic and biochemical hallmarks of apoptosis.
Cardiovascular Research 45, 528-537. Satake T. (1991) Male sterility caused by cooling treatment at the young microspore
stage in rice plants. XXX. Relation between fertilization and the number of engorged pollen grains among spikelets cooled at different pollen developmental stages. Japanese Journal of Crop Science 60, 523-528.
Satake T., Hayase H. (1970) Male sterility caused by cooling treatment at the young
microspore stage in rice plants. V. Estimations of pollen developmental stage and the most sensitive stage to coolness. Proceedings of the Crop Science Society of Japan (Nihon Sakumotsugakkai Kiji) 39, 469-473.
Page 201
167
Sauer N. (2007) Molecular physiology of higher plant sucrose transporters. FEBS
Letters 581, 2309-2317. Sawada S. (1978) Study of sterile-type cool injury in rice plants with special reference
to the mechanism and inheritance of sterility. Research Bulletin, Obihiro University 10, 837-883.
Schenborn E.T., Mierendorf R.C., Jr. (1985) A novel transcription property of SP6
and T7 RNA polymerases: dependence on template structure. Nucleic Acids Research 13, 6223-6236.
Scherz-Shouval R., Elazar Z. (2007) ROS, mitochondria and the regulation of
autophagy. Trends in Cell Biology 17, 422-427. Schiller L.R., Emmett M., Santa Ana C.A., Fordtran J.S. (1988) Osmotic effects of
polyethylene glycol. Gastroenterology 94, 933-941. Schnable P.S., Wise R.P. (1998) The molecular basis of cytoplasmic male sterility and
fertility restoration. Trends in Plant Science 3, 175-180. Scholander P.F., Hammel H.T., Bradstreet E.D., Hemmingsen E.A. (1965) Sap
pressure in vascular plants. Science 148, 339 - 346. Schoonheim P.J., Sinnige M.P., Casaretto J.A., Veiga H., Bunney T.D., Quatrano
R.S., de Boer A.H. (2007) 14-3-3 adaptor proteins are intermediates in ABA signal transduction during barley seed germination. The Plant Journal 49, 289-301.
Schoper J.B., Lambert R.J., Vasilas B.L. (1986) Maize pollen viability and ear
receptivity under water and high temperature stress. Crop Science 26, 1029-1033. Scott R.J., Spielman M., Dickinson H.G. (2004) Stamen structure and function. Plant
Cell 16, S46-60. Sehnke P.C., Chung H.J., Wu K., Ferl R.J. (2001) Regulation of starch accumulation
by granule-associated plant 14-3-3 proteins. PNAS 98, 765-770. Selote D.S., Khanna-Chopra R. (2004) Drought-induced spikelet sterility is associated
with an inefficient antioxidant defence in rice panicles. Physiologia Plantarum 121, 462-471.
Sheoran I.S., Saini H.S. (1996) Drought-induced male sterility in rice: changes in
carbohydrate levels and enzyme activities associated with the inhibition of starch accumulation in pollen. Sexual Plant Reproduction 9, 161-169.
Shinozaki K., Yamaguchi-Shinozaki K. (2007) Gene networks involved in drought
stress response and tolerance. Journal of Experimental Botany 58, 221-227.
Page 202
168
Siedow J.N., Day D.A. (2000) Respiration and photorespiration. In 'Biochemistry & molecular biology of plants'. (Eds B. B. Buchanan, W. Gruissem and R. L. Jones) pp. 676-728. (Rockville, Md : American Society of Plant Physiologists)
Skulachev V. (2006) Bioenergetic aspects of apoptosis, necrosis and mitoptosis.
Apoptosis 11, 473-485. Slater A.F., Stefan C., Nobel I., van den Dobbelsteen D.J., Orrenius S. (1995)
Signalling mechanisms and oxidative stress in apoptosis. Toxicology letters 82-83, 149-53.
Smeekens S. (2000) Sugar-induced signal transduction in plants. Annual Review of
Plant Physiology and Plant Molecular Biology 51, 49-81. Smirnoff N. (1993) Tansley review No 52. The role of active oxygen in the response of
plants to water deficit and desiccation. New Phytologist 125, 27-58. Smirnoff N., Pallanca J. (1996) Ascorbate metabolism in relation to oxidative stress.
Biochemical Society Transactions 24, 472-478. Steponkus P.L., Cutler J.M., O'Toole J.C. (1980) Adaptation to water stress in rice.
In 'Adaptation of plants to water and high temperature stress'. (Eds N. C. Turner and P. J. Kramer) pp. 401–418. ( Wiley Interscience, New York)
Stikic R., Davies W.J. (2000) Stomatal reactions of two different maize lines to
osmotically induced drought stress. Biologia Plantarum 43, 399-405. Stock D., Leslie A.G.W., Walker J.E. (1999) Molecular architecture of the rotary
motor in ATP synthase. Science 286, 1700-1705. Sturm A. (1999) Invertases. Primary structures, functions, and roles in plant
development and sucrose partitioning. Plant Physiology 121, 1-8. Sturm A., Tang G.Q. (1999) The sucrose-cleaving enzymes of plants are crucial for
development, growth and carbon partitioning. Trends in Plant Science 4, 401-407. Susztak K., Raff A.C., Schiffer M., Bottinger E.P. (2006) Glucose-Induced Reactive
Oxygen Species Cause Apoptosis of Podocytes and Podocyte Depletion at the Onset of Diabetic Nephropathy. Diabetes 55, 225-233.
Taji T., Ohsumi C., Iuchi S., Seki M., Kasuga M., Kobayashi M., Yamaguchi-
Shinozaki K., Shinozaki K. (2002) Important roles of drought and cold-inducible genes for galactinol synthase in stress tolerance in Arabidopsis thaliana. The Plant Journal 29, 417-426.
Takahashi H., Hayashi M., Goto F., Sato S., Soga T., Nishioka T., Tomita M.,
Kawai-Yamada M., Uchimiya H. (2006) Evaluation of metabolic alteration in transgenic rice overexpressing dihydroflavonol-4-reductase. Annals of Botany 98, 819-825.
Page 203
169
Takeda T., Toyofuku K., Matsukura C., Yamaguchi J. (2001) Sugar transporters involved in flowering and grain development of rice. Journal of Plant Physiology 158, 465-470.
Takeoka Y., Mamun A.A., Wada T., Kaufman P.B. (1992) 'Reproductive adaptation
of rice to environmental stress.' (Elsevier Science Publishers Amsterdam: Netherlands)
Tambussi E.A., Bartoli C.G., Beltrano J., Guiamet J.J., Araus J.L. (2000) Oxidative
damage to thylakoid proteins in water-stressed leaves of wheat (Triticum aestivum). Physiologia Plantarum 108, 398-404.
Tan Y., Liang Z., Shao H., Du F. (2006) Effect of water deficits on the activity of anti-
oxidative enzymes and osmoregulation among three different genotypes of Radix Astragali at seeding stage. Colloids and Surfaces B: Biointerfaces 49, 60-65.
Tezara W., Mitchell V.J., Driscoll S.D., Lawlor D.W. (1999) Water stress inhibits
plant photosynthesis by decreasing coupling factor and ATP. Nature 401, 914-917.
Tiwari B.S., Belenghi B., Levine A. (2002) Oxidative stress increased respiration and
generation of reactive oxygen species, resulting in ATP depletion, opening of mitochondrial permeability transition, and programmed cell death. Plant Physiology 128, 1271-1281.
Toriyama K., Hinata K. (1984) Anther respiratory activity and chilling resistance in
rice. Plant & Cell Physiology 25, 1215-1221. Tripathy J.N., Zhang J., Robin S., Nguyen T.T., Nguyen H.T. (2000) QTLs for cell-
membrane stability mapped in rice (Oryza sativa L.) under drought stress. TAG Theoretical and Applied Genetics 100, 1197-1202.
Troyano A., Sancho P., Fernández C., Blas E.d., Bernardi P., Aller P. (2003) The
selection between apoptosis and necrosis is differentially regulated in hydrogen peroxide-treated and glutathione-depleted human promonocytic cells. Cell Death and Differentiation 10, 889.
Truernit E., Stadler R., Baier K., Sauer N. (1999) A male gametophyte-specific
monosaccharide transporter in Arabidopsis. The Plant Journal 17, 191-201. Tuong T.P. (1999) Productive water use in rice production: opportunities and
limitations. Journal of Crop Production 2, 241-264. Turgeon R. (1996) Phloem loading and plasmodesmata. Trends in Plant Science 1,
418-423. Turner N.C. (1982) The role of shoot characteristics in drought tolerance of crop
plants. In 'Drought Tolerance in Crop with Emphasis on Rice' pp. 115–134. (International Rice Research Institute: Los Banos, Manila, Philippines)
Page 204
170
Tymowska-Lalanne Z., Kreis M. (1998) The plant invertases: physiology, biochemistry and molecular biology. Advances in Botanical Research 28, 71-117.
Van Breusegem F., Dat J.F. (2006) Reactive oxygen species in plant cell death. Plant
Physiology 141, 384-390. van Doorn W.G., Woltering E.J. (2005) Many ways to exit? Cell death categories in
plants. Trends in Plant Science 10, 117-122. Varnier A.L., Mazeyrat-Gourbeyre F., Sangwan R.S., Clement C. (2005)
Programmed cell death progressively models the development of anther sporophytic tissues from the tapetum and is triggered in pollen grains during maturation. Journal of Structural Biology 152, 118-128.
Vaughn M.W., Harrington G.N., Bush D.R. (2002) Sucrose-mediated transcriptional
regulation of sucrose symporter activity in the phloem. PNAS 99, 10876-10880. Vaux D.L., Korsmeyer S.J. (1999) Cell death in development. Cell 96, 245-254. Venuprasad R., Lafitte H.R., Atlin G.N. (2007) Response to direct selection for grain
yield under drought stress in rice. Crop Science 47, 285-293. Vories E., Counce P., Keisling T. (2002) Comparison of flooded and furrow-irrigated
rice on clay. Irrigation Science 21, 139-144. Wada T., Ito T., Ito M., Takeoka Y. (1992) Light microscopic observations on pollen
and anther in rice (Oryza sativa L.). II. Stages from early microspore to mature pollen. Japanese Journal of Crop Science 61, 136-144.
Wada T., Ogawa K., Ito T., Suzuki H., Takeoka Y. (1990) Light microscopic
observations on pollen and anther development in rice (Oryza sativa L.). I. Stages from pollen mother cells to tetrads. Japanese Journal of Crop Science 59, 769-777.
Wade L.J., McLaren C.G., Quintana L., Harnpichitvitaya D., Rajatasereekul S.,
Sarawgi A.K., Kumar A., Ahmed H.U., Sarwoto, Singh A.K., Rodriguez R., Siopongco J., Sarkarung S. (1999) Genotype by environment interactions across diverse rainfed lowland rice environments. Field Crops Research 64, 35-50.
Wan C., Li S., Wen L., Kong J., Wang K., Zhu Y. (2007) Damage of oxidative stress
on mitochondria during microspores development in Honglian CMS line of rice. Plant Cell Reports 26, 373-382.
Wang F.Z., Wang Q.B., Kwon S.Y., Kwak S.S., Su W.A. (2005) Enhanced drought
tolerance of transgenic rice plants expressing a pea manganese superoxide dismutase. Journal of Plant Physiology 162, 465-472.
Warm E., Laties G.G. (1982) Quantification of hydrogen peroxide in plant extracts by
the chemiluminescence reaction with luminol. Phytochemistry 21, 827-831.
Page 205
171
Wasilewska A., Vlad F., Sirichandra C., Redko Y., Jammes F., Valon C., Frey N.F.d., Leung J. (2008) An update on abscisic acid signaling in plants and more ... Molecular Plant, (published online).
Weber H., Borisjuk L., Heim U., Sauer N., Wobus U. (1997) A role for sugar
transporters during seed development: molecular characterization of a hexose and a sucrose carrier in fava bean seeds. Plant Cell 9, 895-908.
Westgate M.E., Passioura J.B., Munns R. (1996) Water status and ABA content of
floral organs in drought stressed wheat. Australian Journal of Plant Physiology 23, 763 - 772.
Wheeler G.L., Jones M.A., Smirnoff N. (1998) The biosynthetic pathway of vitamin
C in higher plants. Nature 393, 365-369. Widawsky D.A., O'Toole J.C. (Eds) (1990) 'Prioritizing the rice biotechnology
research agenda for eastern India.' (The Rockefeller Foundation: New York, USA) Willekens H., Inze D., Van Montagu M., van Camp W. (1995) Catalases in plants.
Molecular Breeding 1, 207-228. Wolff S.P. (1994) Ferrous ion oxidation in presence of ferric ion indicator xylenol
orange for measurement of hydroperoxides. Methods in Enzymology 233, 182-189.
Wu G.L., Zhang X.Y., Zhang L.Y., Pan Q.H., Shen Y.Y., Zhang D.P. (2004)
Phloem unloading in developing walnut fruit is symplasmic in the seed pericarp and apoplasmic in the fleshy pericarp. Plant & Cell Physiology 45, 1461-1470.
Wu H.M., Cheung A.Y. (2000) Programmed cell death in plant reproduction. Plant
Molecular Biology 44, 267-281. Xing H., Zhang S., Weinheimer C., Kovacs A., Muslin A.J. (2000) 14-3-3 proteins
block apoptosis and differentially regulate MAPK cascades. EMBO Journal 19, 349–358.
Xu J., Avigne W.T., McCarty D.R., Koch K.E. (1996) A similar dichotomy of sugar
modulation and developmental expression affects both paths of sucrose metabolism: evidence from a maize invertase gene family. Plant Cell 8, 1209-1220.
Yamaguchi T., Nakayama K., Hayashi T., Yazaki J., Kishimoto N., Kikuchi S.,
Koike S. (2004) cDNA microarray analysis of rice anther genes under chilling stress at the microsporogenesis stage revealed two genes with DNA transposon castaway in the 5'-flanking region. Bioscience, Biotechnology, and Biochemistry 68, 1315-1323.
Yang J., Zhang J., Liu K., Wang Z., Liu L. (2007) Abscisic acid and ethylene interact
in rice spikelets in response to water stress during meiosis. Journal of Plant Growth Regulation 26, 318-328.
Page 206
172
Yasuda M., Umemura S., Osamura Y., Kenjo T., Tsutsumi Y. (1995) Apoptotic
cells in the human endometrium and placental villi: pitfalls in applying the TUNEL method. Archives of Histology & Cytology 58, 185–190.
Yemm E.W., Willis A.J. (1954) The estimation of carbohydrates in the plant extracts
by anthrone. Biochemical Journal 57, 508-514. Ying W. (2008) NAD+/NADH and NADP+/NADPH in cellular functions and cell
death: regulation and biological consequences. Antioxidants & Redox Signaling 10, 179-206.
Yue B., Xiong L., Xue W., Xing Y., Luo L., Xu C. (2005) Genetic analysis for
drought resistance of rice at reproductive stage in field with different types of soil. TAG Theoretical and Applied Genetics 111, 1127-1136.
Yue B., Xue W., Xiong L., Yu X., Luo L., Cui K., Jin D., Xing Y., Zhang Q. (2006)
Genetic basis of drought resistance at reproductive stage in rice: separation of drought tolerance from drought avoidance. Genetics 172, 1213-1228.
Zgallai H., Steppe K., Lemeur R. (2005) Photosynthetic, physiological and
biochemical responses of tomato plants to polyethylene glycol-induced water deficit. Journal of Integrative Plant Biology 47, 1470-1478.
Zhang G., Campenot M.K., McGann L.E., Cass D.D. (1992) Flow cytometric
characteristics of sperm cells isolated from pollen of Zea mays L. Plant Physiology 99, 54-59.
Zhang L., Chen J., Fu H. (1999) Suppression of apoptosis signal-regulating kinase 1-
induced cell death by 14-3-3 proteins. PNAS 96, 8511-8515. Zhou Y., Lam H.M., Zhang J. (2007) Inhibition of photosynthesis and energy
dissipation induced by water and high light stresses in rice. Journal of Experimental Botany 58, 1207-1217.
Zong W.X., Thompson C.B. (2006) Necrotic death as a cell fate. Genes &
Development 20, 1-15. Zur B. (1966) Osmotic control of the matric soil - water potential. I. Soil - Water
system. Soil Science 102, 394-398.
Page 207
173
APPENDIX I
Components of SOC medium
Components Quantity
Bacto®Trypton 2.0g
Bacto®yeast extract 0.5g
1M NaCl 1ml
1M KCl 0.25 ml
2M Mg2+ stock, filter-sterilized 1ml
2M glucose, filter-sterilized 1ml
Sterile ddH2O make up to 100 ml
Components of ampicillin LB plate
Components Quantity
Bacto®Trypton 5 g
Bacto®yeast extract 2.5 g
NaCl 2.5 g
Agar 7.5 g
100 mg/ml stock ampicillin 0.5 ml
Sterile ddH2O make up to 500 ml