Page 1
EFFICACY OF FOREST RESTORATION TREATMENTS ACROSS A 40-YEAR
CHRONOSEQUENCE AT REDWOOD NATIONAL PARK
By
Kevin Soland
A Thesis Presented to
The Faculty of Humboldt State University
In Partial Fulfillment of the Requirements for the Degree
Master of Science in Natural Resources: Forestry, Watershed, and Wildland Sciences
Committee Membership
Dr. Lucy Kerhoulas, Committee Chair
Dr. Erin Kelly, Committee Member
Dr. Nicholas Kerhoulas, Committee Member
Dr. Erin Kelly, Graduate Coordinator
May 2020
Page 2
ii
ABSTRACT
EFFICACY OF FOREST RESTORATION TREATMENTS ACROSS A 40-YEAR
CHRONOSEQUENCE AT REDWOOD NATIONAL PARK
Kevin Soland
Following 20th century logging, much of the natural coast redwood (Sequoia
sempervirens) range consists of dense second-growth stands with slow tree growth and
low biodiversity. There is a landscape-scale effort in much of coastal northern California
to increase tree growth rates and ecosystem biodiversity via thinning treatments, thereby
hopefully accelerating the development of old-growth forest characteristics. Redwood
National Park (RNP) has been experimenting with thinning in these forest types since the
1970s. Given the interesting history of logging and restoration in RNP and the future
plans for widespread thinning in this region, my thesis examined the effects of land
management on forest productivity, biodiversity, and ecocultural resources. The first
chapter provides a basic history of land management within the North Coast region. The
second chapter investigates how redwood physiology, redwood growth, and forest
biodiversity respond to restoration treatments. My Chapter 2 investigations found that
thinning second-growth redwood forests 1) does not meaningfully influence tree water
status, 2) increases tree gas exchange in the short-term, 3) increases tree growth in the
long-term, 4) increases understory plant diversity, and 5) does not affect bird or mammal
diversity. Collectively, these findings demonstrate that thinning second-growth redwood
Page 3
iii
forests has the potential to accelerate the development of old-growth characteristics. This
verification of the efficacy of restoration treatments is important information for land
managers, as plans are currently underway to apply these treatments at the landscape-
scale. Ideally, this thesis can provide useful baseline data to aid future assessments of
long-term forest responses to contemporary restoration efforts.
Page 4
iv
ACKNOWLEDGEMENTS
I thank Dr. Lucy Kerhoulas for the opportunity to undertake this project and for
her assistance with study design, fieldwork, data analysis, and thesis preparation. I am
grateful to Save the Redwoods League for providing partial funding for this study
(Research Grant #: 131) and to Redwood National Park for granting us permission to
work on Holter Ridge (Study #: REDW-00247). In particular, I thank Jason Teraoka and
Scott Powell for sharing their valuable expertise and plot data. Thanks also to Christopher
Villarruel, Davi Vasquez, Gabriel Goff, and Wade Polda for assistance with fieldwork as
well as to Dr. Harold Zald, Dr. Rosemary Sherriff, James Lamping, Jill Beckman, and
Kelly Muth for help with dendrochronological analyses. Additional thanks and
appreciation to George Pease for use of field equipment, Stassia Samuels for help with
plant identification, and Rachael Heller for editorial help with writing. Finally, gratitude
to my committee members: Dr. Nicholas Kerhoulas for his assistance with study design,
fieldwork, and thesis preparation, and Dr. Erin Kelly for her assistance with thesis
preparation and mentorship on the preparation of Chapter 1.
Page 5
v
TABLE OF CONTENTS
ABSTRACT ........................................................................................................................ ii
ACKNOWLEDGEMENTS ............................................................................................... iv
LIST OF TABLES ............................................................................................................ vii
LIST OF FIGURES ........................................................................................................... ix
CHAPTER 1: A HISTORY OF LAND USE CHANGES IN THE REDWOOD REGION
............................................................................................................................................. 1
INTRODUCTION AND METHODS ................................................................................ 1
SUBSISTENCE AND ECOCULTURAL RESOURCES .................................................. 4
WESTWARD EXPANSION .............................................................................................. 9
A HISTORY OF LOGGING IN THE REDWOOD REGION ........................................ 11
EARLY REDWOOD CONSERVATION EFFORTS...................................................... 19
THE FIGHT FOR A REDWOOD NATIONAL PARK ................................................... 21
REDWOOD NATIONAL PARK IS ESTABLISHED (AND EXPANDED) ................. 27
MODERN IMPLICATIONS ............................................................................................ 35
CHAPTER 2: EFFICACY OF FOREST RESTORATION TREATMENTS ACROSS A
40-YEAR CHRONOSEQUENCE AT REDWOOD NATIONAL PARK ...................... 39
INTRODUCTION ............................................................................................................ 39
MATERIALS AND METHODS ...................................................................................... 46
Study Site and Design ................................................................................................... 46
Physiological Measurements ........................................................................................ 50
Dendrochronological Measurements ............................................................................ 52
Biodiversity Measurements .......................................................................................... 54
Page 6
vi
Statistical Analyses ....................................................................................................... 55
RESULTS ......................................................................................................................... 57
Physiology .................................................................................................................... 57
Growth .......................................................................................................................... 62
Biodiversity ................................................................................................................... 64
DISCUSSION ................................................................................................................... 71
Physiology .................................................................................................................... 72
Growth .......................................................................................................................... 76
Biodiversity ................................................................................................................... 78
CONCLUSIONS............................................................................................................... 83
LITERATURE CITED ..................................................................................................... 85
Page 7
vii
LIST OF TABLES
Table 1. Timeline of historical events in the redwood region. Abbreviation of terms
include: Redwood State Park (RSP), Redwood National Park (RNP), Lyndon B. Johnson
(LBJ), and California Environmental Quality Act (CEQA). .............................................. 3
Table 2. Plot-level attributes of the nine study plots on Holter Ridge in Redwood
National Park (RNP). Each plot is 0.25 ha and was treated using a low-thin prescription
that targeted Douglas-fir removal. Plots were treated in 1978, 2009, and 2017, with
control plots untreated. The 1978 and 2009 plots were thinned to a target basal area (BA)
reduction of 40%. The 2017 plots were treated using variable density thinning (VDT)
with five BA reduction treatments: 0, 25, 40, 55, and 75%. The VDT plots used in this
study were predominantly thinned using a 40% BA reduction treatment. ....................... 48
Table 3. Mean (± SE) predawn water potential (Ψpd), midday water potential (Ψmd), and
stomatal conductance (gs) for redwood trees in the control plots and plots thinned in
1978, 2009, and 2017 in Redwood National Park. In 2018, leaf pd and md
measurements were made in July using a pressure chamber. In 2019, xylem pd
measurements were made in September using stem psychrometers and leaf md
measurements were made in July using a pressure chamber. In 2018 and 2019 gs
measurements were made in July using a leaf porometer. For each variable, treatments
not sharing an uppercase letter are significantly different, with the one-way ANOVA
statistics provided. For md and gs, within each treatment, years not sharing the same
lowercase letter are significantly different. ....................................................................... 61
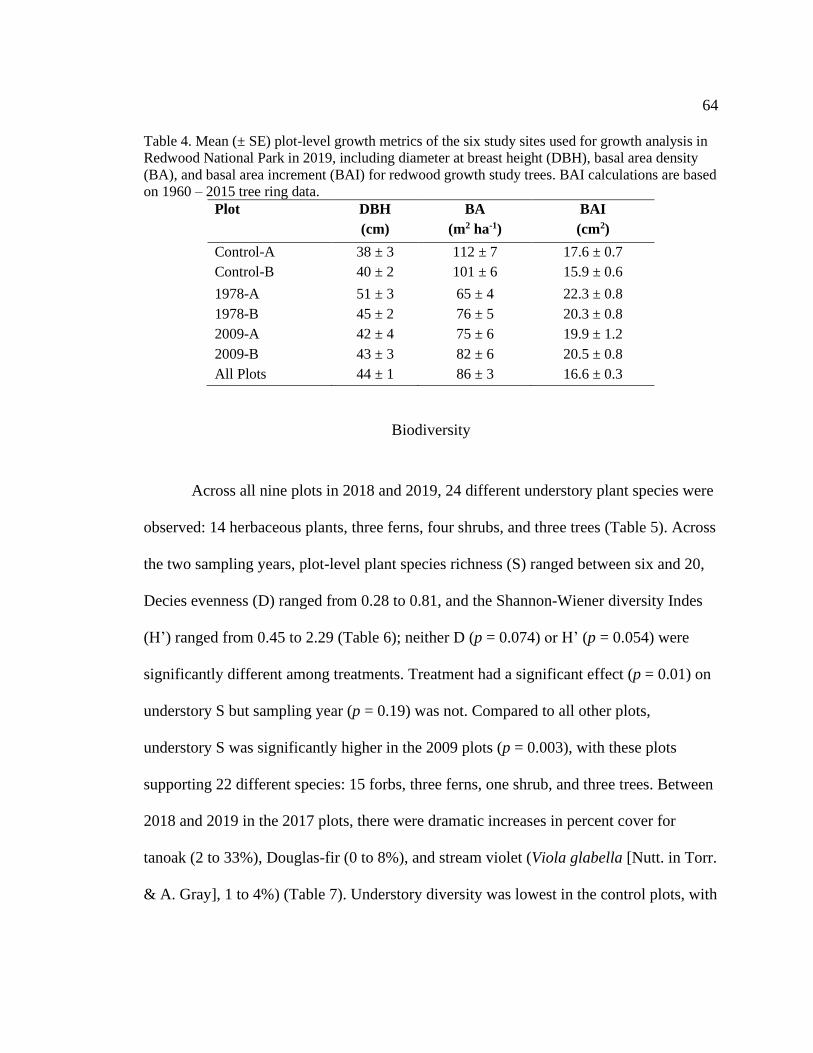
Table 4. Mean (± SE) plot-level growth metrics of the six study sites used for growth
analysis in Redwood National Park in 2019, including diameter at breast height (DBH),
basal area density (BA), and basal area increment (BAI) for redwood growth study trees.
BAI calculations are based on 1960 – 2015 tree ring data. .............................................. 64
Table 5. List of vascular plants observed across the nine study sites in Redwood National
Park in July 2018 and 2019 in control plots and plots thinned in 1978, 2009, and 2017.
Growth forms: herbaceous forb (H), fern (F), shrub (S), and tree (T). “X” Denotes
presence............................................................................................................................. 66
Table 6. Species richness (S), species evenness (D), and Shannon-Wiener diversity index
(H’) for plants, birds, and mammals among the control, 1978, 2009, and 2017 plots in
2018 and 2019 in Redwood National Park. In both years, understory plant surveys were
conducted in May, bird point count surveys were conducted in June, and mammals were
inventoried for three weeks in October using trail cameras. ............................................ 67
Page 8
viii
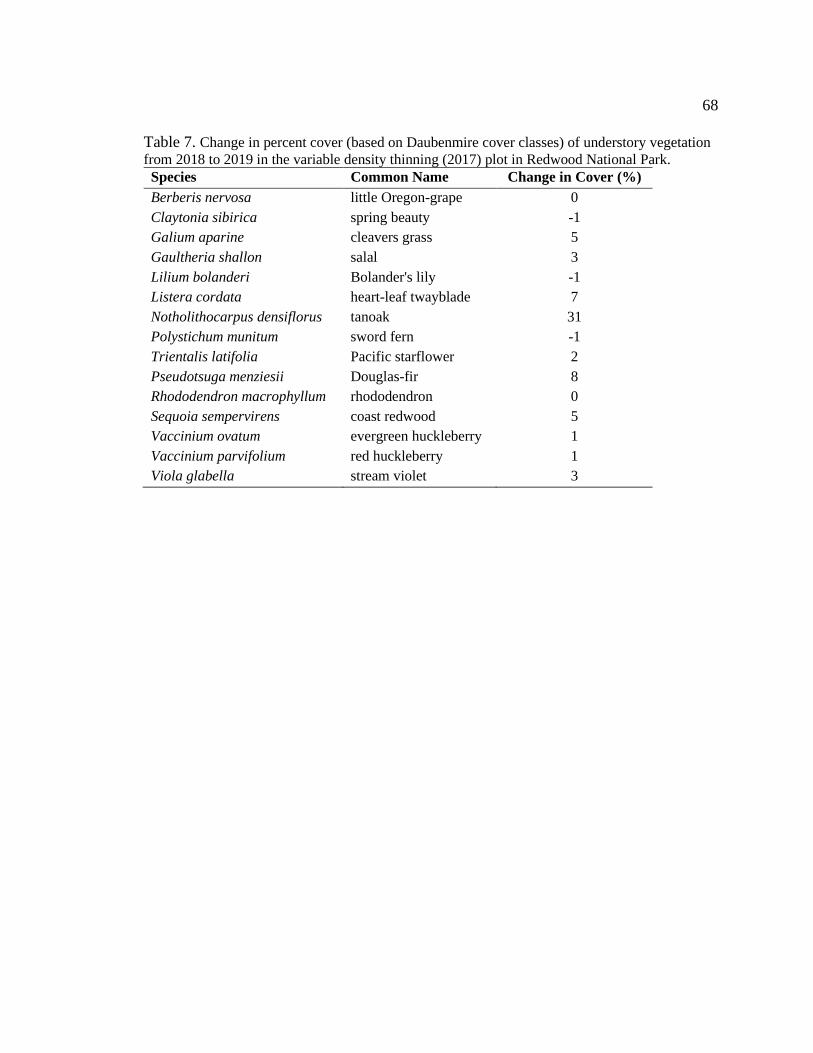
Table 7. Change in percent cover (based on Daubenmire cover classes) of understory
vegetation from 2018 to 2019 in the variable density thinning (2017) plot in Redwood
National Park. ................................................................................................................... 68
Table 8 List of avian species observed in Redwood National Park in June of 2018 and
2019 in control plots and plots thinned in 1978, 2009, and 2017. “X” Denotes presence.
Species denoted with an asterisk (*) are federally listed under the Endangered Species
Act. .................................................................................................................................... 69
Table 9. List of mammals observed in Redwood National Park in October of 2018 and
2019 in control plots and plots thinned in 1978, 2009, and 2017. “X” Denotes presence.
Species denoted with a double asterisk (**) are federally listed under the Endangered
Species Act as Proposed Threatened. ............................................................................... 70
Page 9
ix
LIST OF FIGURES
Figure 1. Map of Redwood National and State Parks and surrounding areas located in
northern California. ............................................................................................................. 2
Figure 2. “Local Northwest California Tribes.” Credit: Northern California Indian
Development Council. ........................................................................................................ 5
Figure 3. “Lumbermen pose with a team of oxen ready to yard logs out of the forest.”
Credit: Palmquist collection. ............................................................................................. 12
Figure 4. “Donkey steam engine logging a steep slope in Humboldt County.” Credit: Ray
Jerome Baker. ................................................................................................................... 13
Figure 5. “Pre-WWII tractor in the woods.” Credit: Boyle Collection. ........................... 15
Figure 6. “Clear cut hillside, train on trestle loaded with logs.” Credit: Palmquist
collection. .......................................................................................................................... 18
Figure 7. Bumper sticker advertising the timber industry’s alternate plan, the Redwood
Park and Recreation Plan. ................................................................................................ 25
Figure 8. A nine metric-ton redwood log carved as a peanut loaded on a flatbed semi-
trailer with a sign reading, “It may be peanuts to you, but it’s jobs to us.” Credit:
Associated California Loggers. ......................................................................................... 32
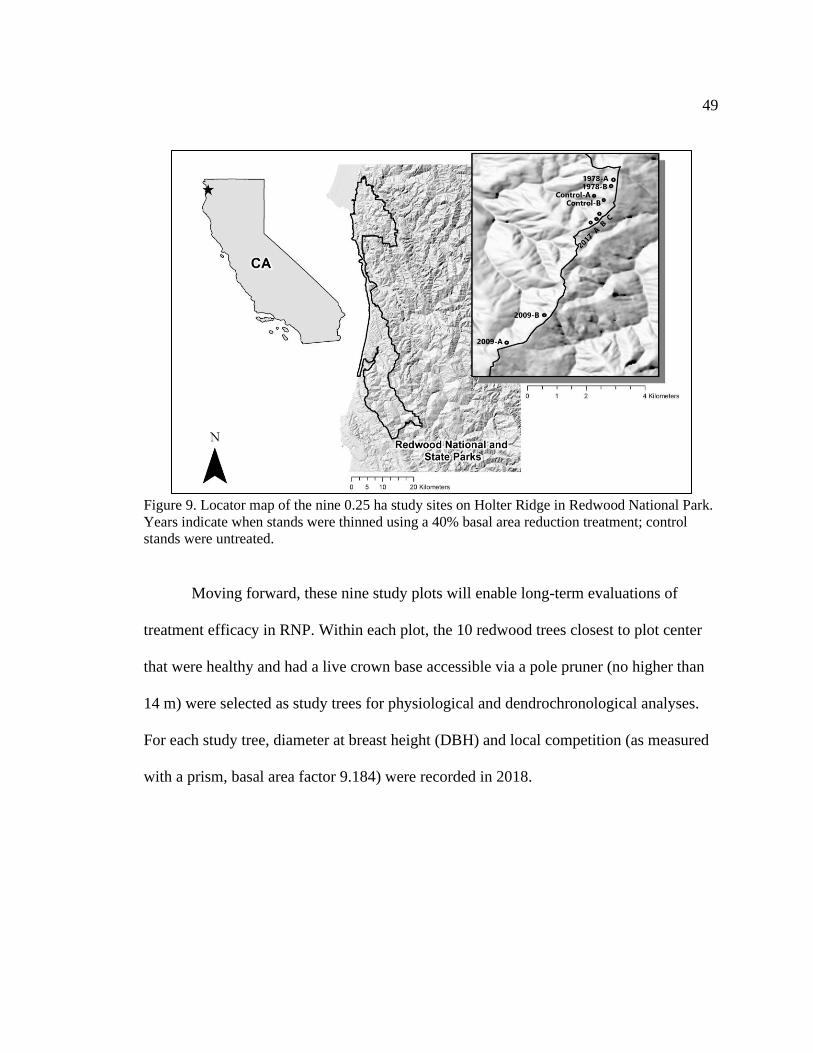
Figure 9. Locator map of the nine 0.25 ha study sites on Holter Ridge in Redwood
National Park. Years indicate when stands were thinned using a 40% basal area reduction
treatment; control stands were untreated. ......................................................................... 49
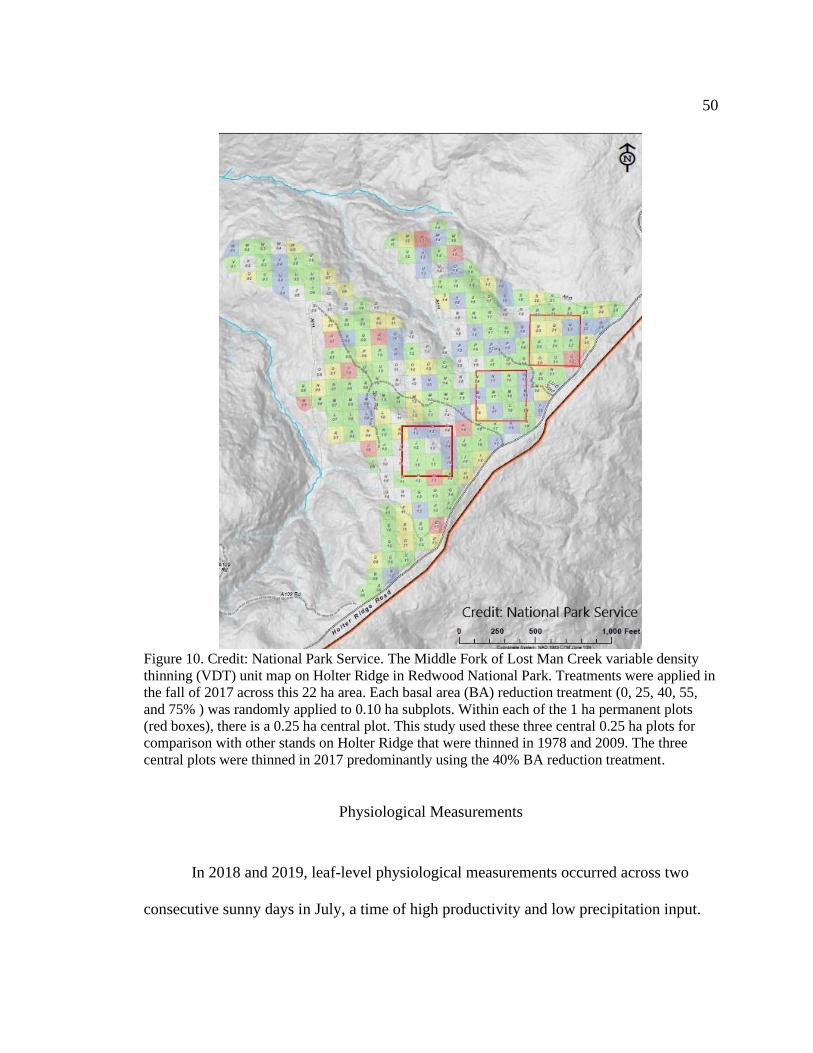
Figure 10. Credit: National Park Service. The Middle Fork of Lost Man Creek variable
density thinning (VDT) unit map on Holter Ridge in Redwood National Park. Treatments
were applied in the fall of 2017 across this 22 ha area. Each basal area (BA) reduction
treatment (0, 25, 40, 55, and 75% ) was randomly applied to 0.10 ha subplots. Within
each of the 1 ha permanent plots (red boxes), there is a 0.25 ha central plot. This study
used these three central 0.25 ha plots for comparison with other stands on Holter Ridge
that were thinned in 1978 and 2009. The three central plots were thinned in 2017
predominantly using the 40% BA reduction treatment..................................................... 50
Page 10
x
Figure 11. Daily xylem water potential (Ψ) for redwood trees in the control (black line),
1978 (black dots), 2009 (gray line), and 2017 (gray dashes) treatment plots.
Measurements were taken with a stem psychrometer every 30 minutes from August 31
through September 6, 2019 in Redwood National Park. The anomalous drop in on
September 5 at all plots was likely due to an issue with data retrieval from the
psychrometer data box on September 4. ........................................................................... 58
Figure 12. Mean (± SE) water potential (Ψ) and stomatal conductance (gs) in 2018
(white) and 2019 (gray) in Redwood National Park in control plots and plots thinned in
1978, 2009, and 2017. A) Leaf predawn water potential (Ψpd) measured in July 2018 with
a pressure chamber and xylem Ψpd measured in September 2019 with stem
psychrometers. B) Leaf midday water potential (Ψmd) measured in July 2018 and July
2019 with a pressure chamber. C) gs measured in July 2018 and July 2019 with a leaf
porometer. For each panel, treatments within a year not sharing the same uppercase letter
are significantly different. For the md and gs panels, within a treatment, years not
sharing the same lowercase letter are significantly different. In each panel, p-values for
one-way ANOVAs comparing treatment means within each year are provided. ............. 59
Figure 13. Redwood physiological relationships between A) xylem Ψ and leaf Ψ, B)
xylem Ψ and gs, and C) leaf Ψ and gs. On each tree, these midday measurements of xylem
Ψ (using a stem psychrometer), leaf (using a pressure chamber), and gs (using a leaf
porometer) were taken within a 10-minute window of each other in Redwood National
Park. Panels (A) and (B) show measurements from August 25, 2019 using seven trees
instrumented with stem psychrometers. Panel (C) shows all measurements taken in July
2018 and 2019. .................................................................................................................. 60
Figure 14. Mean annual growth, as measured by basal area increment (BAI), for redwood
trees in each treatment: control (black solid line), 1978 treatment (small black dashes),
and 2009 treatment (large black dashes) across 55 years (1960-2015) in Redwood
National Park. Tree sample depth (gray dots) is also shown on the right vertical axis. ... 63
Figure 15. Mean (± SE) post-/pre-treatment basal area increment (BAI) for redwood trees
in control plots and plots treated in 1978 and 2009 in Redwood National Park. Within the
1978 plots, pre-and post-treatment years were 1971-1977 and 1980-1986, respectively;
pre- and post-treatment years for the 2009 plots were 2002-2008 and 2011-2017,
respectively. These same time periods were used for comparison with the control plots. 63
Page 11
1
CHAPTER 1: A HISTORY OF LAND USE CHANGES IN THE REDWOOD REGION
INTRODUCTION AND METHODS
The first chapter of this thesis examines land and forest management practices in
the redwood region over time. Because the second chapter of this thesis is based in
Redwood National Park (RNP) on land that was managed and inhabited by the Yurok
people for millennia prior to RNP establishment, it seemed appropriate to first provide an
overview of past land use at this richly-historied site before scientifically exploring the
interactions between contemporary forest management and forest responses. Through an
analysis of primary and secondary literature, I provide a basic overview of land use and
ownership changes for the land that is currently RNP.
The following presentation and interpretation of archival material tells the story of
land management, land acquisition, and sociocultural ties across time. A significant
amount of the literature presented was researched through primary and secondary sources
in the Special Collections and Archives room of the Humboldt State University Library.
Other sources of information include official government and Tribal webpages. The
temporal window (1895-1968) on which RNP was created spanned 13 U.S. presidencies
and the addition of six states to the Union (Table 1). The events leading up to the
establishment of the RNP are controversial, from the removal of indigenous peoples
almost completely off their ancestral homelands by the end of the nineteenth century, to
the first federal ‘legislative taking’1 of private land in U.S. history in 1968.
Page 12
2
Figure 1. Map of Redwood National and State Parks and surrounding areas located in northern
California.
Page 13
3
Table 1. Timeline of historical events in the redwood region. Abbreviation of terms include: Redwood State Park (RSP), Redwood
National Park (RNP), Lyndon B. Johnson (LBJ), and California Environmental Quality Act (CEQA). Year Historical Event Year Historical Event
1841 Pre-emption Act 1949 Warren T. Hannum's call for sustainable logging
1850 First operational sawmill on Humboldt Bay 1958 Annual redwood harvest peaks
1852 Henry A. Crabb proposes RSP 1963 National Geographic funds a study, The Redwoods
1855 Yurok Reservation established 1964 Findings from The Redwoods publicly released
1856 First commercially felled redwood 1964 Responses to The Redwoods
1862 Homestead Act 1965-1968 President LBJ delivers conservative messages calling for RNP
1878 Timber & Stone Act 1966 LBJ issues moratorium on logging within proposed RNP
1879 Carl Schurz proposes RSP 1968 LBJ voices support for RNP in State of the Union address
1882 Steam Donkey invented 1968 RNP established
1889 First written records of lumber production 1971 Bayside Timber v. San Mateo County Board of Supervisors
1895 First concept of RNP introduced 1972-1973 Findings from Redwood Creek watershed study released
1899 All redwood forest land privately owned 1973 Z'berg-Nejedly Act passed
1900 Steam Donkey upgraded with high-line cable 1975 CA Supreme Court rules Forest Practice Rules subject to CEQA
1902 First RSP established at Big Basin 1977 Jimmy Carter becomes president
1906 San Francisco earthquake 1977 RNP Expansion Act introduced
1918 Save the Redwoods League established 1977 Carter's Environmental Message delivered
1923 Prairie Creek RSP established 1978 RNP expanded to include Redwood Creek watershed
1925 Del Norte Coast RSP established 1978 First restoration treatments in RNP undertaken on Holter Ridge
1929 Jedediah Smith RSP established 2002 RNP expanded to include Mill Creek watershed
1929 Onset of Great Depression 2019 Yurok Lands Act introduced
1945 Forest Practice Act passed
Page 14
4
SUBSISTENCE AND ECOCULTURAL RESOURCES
The first people to see the coast redwoods (Sequoia sempervirens [D.Don.] Endl.)
were most likely the ancestors of indigenous peoples who migrated throughout North
America and lived on these lands since time immemorial.2 Through archaeology and
historiography, the land comprising and surrounding RNP (Figure 1) can be traced in
ownership at the time of European arrival to four indigenous tribes: the Chilula, Hupa,
Tolowa, and Yurok (Figure 2). In the pre-European era, this land and its many
ecosystems stood at the center of the aforementioned tribes’ ecocultural resources and
subsistence practices. Each aspect of the forest, prairies, and oak woodlands was, and
remains to this day, paramount to indigenous life. In addition to depending on the land
spiritually and socio-culturally, tribes were historically physically dependent on the
landscape for tools, shelter, and migration routes. Prior to presenting my scientific study
of RNP sites on lands historically occupied by the Yurok people, I will first describe the
deep connection between these lands and their indigenous peoples.
Page 15
5
Figure 2. “Local Northwest California Tribes.” Credit: Northern California Indian Development
Council.3
A continuous thread connects the soil that provides water and nutrients essential
for plant growth, the animals that depend on these plants, and the peoples who spiritually,
culturally, and physically depend on these lands, plants, and animals. Due to their deep
cultural connection to the environment, the Yurok focused on land, subsistence, and
resource management practices that were sustainable for their population’s continued
Page 16
6
use4. This management balance between spiritual and material needs can be described as
follows:
The relationship was a dynamic one: the Yurok used various
tools to maintain and develop their forest, and at the same
time they let the environment guide them in determining
where to live and in other aspects of life. Much of this
information is embodied in Yurok spiritual tradition.5
According to Yurok legend, when their ancestors first arrived in the lower
Klamath River region, they were given land by their creator, Wah-Peck-oo-May-ow. On
that land, the tallest trees on earth grew and the Yurok were given instruction on how to
utilize them:
In the beginning, when Wah-Peck-oo-May-ow permitted the
spirits to decide what they wanted to be on earth, two of them
chose to be Redwood Trees. After they had grown to
adulthood and were five or six feet in diameter, a great war
between human beings raged around Cappel, a village on the
Klamath River, and once the trees were wounded…Wah-
Peck-oo-May-ow decreed that in the future the Redwood
must not be used for fire wood but could be used by human
beings to build their homes and canoes. To prevent burning,
he gathered the bark of the Cascarea, the dogwood bark, the
fern bark and other bitter barks and dried them in them into
a flour. To this he added swamp water and poured this
medicine on the tops of the Redwood Trees. This made the
wood so bitter that fire would not eat it.6
The Yurok believe that items made from redwood contain spirits and that these items
therefore embody the Yurok’s sacred connection to the land.7 This spiritual bond between
peoples and land was honored by the Yurok, as evidenced by their persistent dedication
to sustainably manage the natural resources on which they depended.8 With an expansive
Page 17
7
territory including prairies, oak woodlands, and redwood forests, the Yurok used the
Klamath River as a main waterway to efficiently access both food and ecocultural
resources. Redwood canoes enabled this efficient transportation and secured spiritual
connections between tribes. Transportation between tribes’ villages and subsistence sites
was also achieved through a series of trail systems; Holter Ridge, the study location for
the second chapter of this thesis, was an important intertribal trail.9 Accessibility to these
different sites ensured that the Yurok were able to sustainably forage for both food and
ecocultural resources, as the widespread collection of resources ensured that no areas
were completely depleted.
In addition to functioning as a transportation system, the Klamath River also
provided salmon, a major staple of the traditional Yurok diet. The Yurok utilized
underbrush and trimmings to make temporary dams, catching and often smoking the fish
on the banks. 10 Within forests and prairies, foraging practices fostered grass seed,
mushrooms, chinquapin nuts, and other plants. Oak groves were also especially important
to traditional subsistence methods, as they provided acorns which was the main starch.11
Coastal areas of the Yurok territory yielded shellfish, seaweed, and salt. In addition to
food resources, this varied terrain provided multiple ecocultural resources for useful
products such as baskets and shelters12. Plant fibers gathered from multiple landscapes
supported a rich culture of basketry, a sacred tradition alive and well today.
To complement their low-impact reliance on multiple foraging, hunting, and
gathering zones for subsistence and ecocultural resources, the Yurok also used fire to
Page 18
8
manage manage the landscape. These indigenous peoples effectively used controlled
burning to prevent Douglas-fir (Pseudotsuga menziesii [Mirbel] Franco) encroachment in
prairies, woodlands, and forests.13 Controlled burning also cleared understory vegetation
and stimulated sprouting in many plant species, thereby creating a steady supply of
materials needed for daily life. For example, autumn burning of hazelnut (Corylus
cornuta Marshall) would produce young one- to two-foot shoots the following spring that
could be gathered to make large baskets.14 Today, although European settlers have
encroached and appropriated their land, the Yurok continue to maintain spiritual, cultural,
and ancestral connections with the land through traditional activities such as basketry,
hunting, fishing, and harvesting acorns.
The complex ties between people and the landscape for the Yurok and other
indigenous tribes of this area such as the Karuk, Hoopa, Tolowa, and Wiyot are too
numerous to fully examine in this study. Nevertheless, the perspectives provided here
exemplify how indigenous subsistence and ecocultural resource management shaped the
landscape prior to pre-European settlement. These tribes’ sustained stewardship of
natural resources are admirable and a standard towards which contemporary societies
should aspire.
Page 19
9
WESTWARD EXPANSION
When Euro-American settlers arrived in the redwood region, they brought with
them the belief that white Americans were destined to conquer all of North America. This
rallying cry was known as Manifest Destiny and according to its principals, “American
Anglo-Saxons were an innately superior people who were destined to bring good
government, commercial prosperity, and Christianity to the American continent and the
world.”15 Early settlers deemed the indigenous people unsuited to care for the land in the
way their God intended. These settlers cleared brush and trees, including redwood, to
farm and ranch on the land.16 Eradication methods such as repeated burning and grass
seeding were commonly used to extripate native vegetation.17 Today, the local landscape
and views on forest management are largely legacies of these settler-colonial land use
practices.18 In 1855, the federal government established the Yurok Reservation and the
Tribe was forced to relocate away from their ancestral homeland.19 Within a short time,
most of the Yuroks’ land was claimed by the settlers.
The early land ownership laws were simple and readily used by the timber
companies and ranchers to acquire large tracts of land. The federal government wanted
the land ‘settled up’ as fast as possible and offered cheap land to Americans willing to
stake a claim in newly acquired states. The Pre-emption Act of 1841 permitted nearly
anyone to purchase public land for $1.25 ($31.40 adjusted for inflation in 2019)20 per 0.4
hectares (1 acre) and under the Homestead Act of 1862 they could claim up to 64.7
hectares (160 acres) of surveyed public land.21, 22 In 1878, the Timber and Stone Act was
Page 20
10
passed, allowing for the purchase of 64.7 hectares (160 acres) of timberland for $2.50
($62.12 adjusted for inflation in 2019)23, so long as the land was improved through
logging and mining.24 By the end of the 19th century, all of the redwood forested land in
Humboldt County, CA was owned by lumbermen and ranchers.25
One example of how these early land ownership laws were exploited can be found
in Eureka, CA. Local bagmen, individuals who profit from clandestine activities, would
find groups of stand-by sailors and take them to the government land office where each
would file a claim on 64.7 hectares (160 acres) of timberland. The sailor would then
redeed the claim for around $50 ($1,025 adjusted for inflation in 2019)26 to the bagman
who would then redeed that same claim to a timber company eager to acquire more
land.27 Numerous individuals went to jail for breaking the Homestead Act, which was
recounted in a book by convicted Oregon timberland fraud kingpin Stephen Puter. He and
his business partner, Horace G. McKinley, illegally acquired 776 hectares (1,920 acres)
in Oregon City, OR28 and 6,993 hectares (17,280 acres) in Deschutes County, OR29 by
using false names, bribing Deputy Clerks, and providing false affidavits and proofs of
homesteading. It is very likely that other timberland owners used similar tactics to amass
an untold number of land deeds and substantially increase their land holdings.
Page 21
11
A HISTORY OF LOGGING IN THE REDWOOD REGION
In 1850, the first operational sawmill on Humboldt Bay was constructed and
commercial logging in Humboldt County began. Spruce (Picea sitchensis [Bong.]
Carrière) and fir (Abies grandis [Douglas ex D. Don] Lindl.) were the genera most
familiar to the early lumber pioneers, predominantly from the eastern U.S., and were the
first to be felled. Logging occurred very close to Humboldt Bay because water provided a
reliable transportation system. Several logs would be tied together to make a raft and then
floated across the water to a sawmill. Due to the immense size of redwood and lack of
appropriate sawmill machinery, it wouldn’t be until 1856 that lumbermen were able to
successfully fell and saw these massive trees.30
Redwood sparked a craze in San Francisco because of its unique red color, ease to
work with, non-warping qualities, and resistance to rot.31 Once the uses and benefits of
redwood were fully realized, demand around the country began to grow, albeit cyclically.
When demand was high, production would often over compensate and in-turn, cause a
sharp decline in price. Sawmill owners large and small understood that they needed to
expand current markets and create new ones to stay in business. A number of them
banded together, pooling financial resources to form a ‘joint Stock Company,’ but less
than a year later it failed.32 This example demonstrates how due to the cyclical price of
redwood, it was difficult for small mills to make ends meet when the market was low;
consequently, only large timber companies survived the early years of logging.33
Page 22
12
Harvesting redwood has never been an easy process, as it is often dangerous and
difficult.34 A tree was usually cut about two to three meters above the ground to ensure
that none of the non-merchantable lumber associated with the large, buttressed bases
made it to the mill.35 After a chopper felled a tree, the branches were removed and the
bark was peeled off. When this material dried out, it was set on fire to clear away debris
that would otherwise hinder processing. After the trunk was sawed into several small
logs, they were dragged out of the forest by a team of oxen to a skid road (Figure 3).36
For the largest redwood logs, measuring five to six meters in diameter, the lumbermen
would drill a hole into the center, deploy an explosives cartridge, and blast the log into
quarter sections easier for oxen to move.37 This practice of dragging logs across the forest
floor commonly damaged the soil and lower trunks of residual trees.38
Figure 3. “Lumbermen pose with a team of oxen ready to yard logs out of the forest.” Credit:
Palmquist collection.39
Page 23
13
Eventually, logging sites moved too far into the forest for oxen to be used and
railroads had to be built. The first railroads (aka tramways or pole roads) were made of
wood and built along ravines. They helped to extend the reach of timber harvesting
farther into the forest.40 Temporary dams were built on streams to collect the spring flood
water where logs would be stored in the reservoirs created by the dam until it was time to
transport them to the mill. When that time came, the dam was blown up with explosives,
allowing the force of water to transport the logs down to Humboldt Bay.41 Although
logging technology was still in its infancy, in 1881 a Eureka, CA lumberman and
inventor, John Dolbeer, revolutionized the timber industry with his new logging machine.
Figure 4. “Donkey steam engine logging a steep slope in Humboldt County.” Credit: Ray Jerome
Baker.42
Page 24
14
The steam donkey, termed for its size and lack of horsepower, consisted of a
boiler, a steam engine, and a winch that together could drag logs out of the woods faster
than oxen (Figure 4). The winch also allowed for self-transportation up steep grades,
making previously inaccessible timberlands harvestable.43 Although there were no
written records of lumber production until 1889, estimates based on the harvested
hectarage indicate that 5,895,126 m3 (2,498,213,317 board feet [one board foot measures
12 in x 12 in x 1 in]) of merchantable lumber were cut in Humboldt County between
1855 and 1888.44 In the early 1900s, the steam donkey was upgraded with a high-line
cable, launching a new method of timber extraction, termed high-lead yarding: logs
would be dragged on one end while the other end was suspended in the air by a system of
cables. With the advancement of railroads and technologies, logging of all trees on nearly
all terrain became possible and eventually oxen teams went obsolete.
The earthquake that devastated San Francisco on April 18, 1906 and the resulting
fires that engulfed approximately 24,000 structures pushed both the demand for and price
of lumber to all-time highs.45 Two days following the earthquake, with fires still burning,
lumber was already being hauled in to rebuild the city. About 189 m3 (80,000 board feet)
of lumber was brought in to Golden Gate Park every day for the construction of
outhouses and barracks. In the two weeks following the earthquake, 2,676 m3 (1,134,000
board feet) of lumber was used to construct housing for 7,500 people.46 To meet the
demand for lumber, with redwood being preferred due to its fire-resistant qualities,
logging companies increased the number of employees’ daily work hours and operated
Page 25
15
mills on double time. In October 1906, the volume of redwood shipped to San Francisco
was twice what it was in October 1905, a record-setting month in itself.47
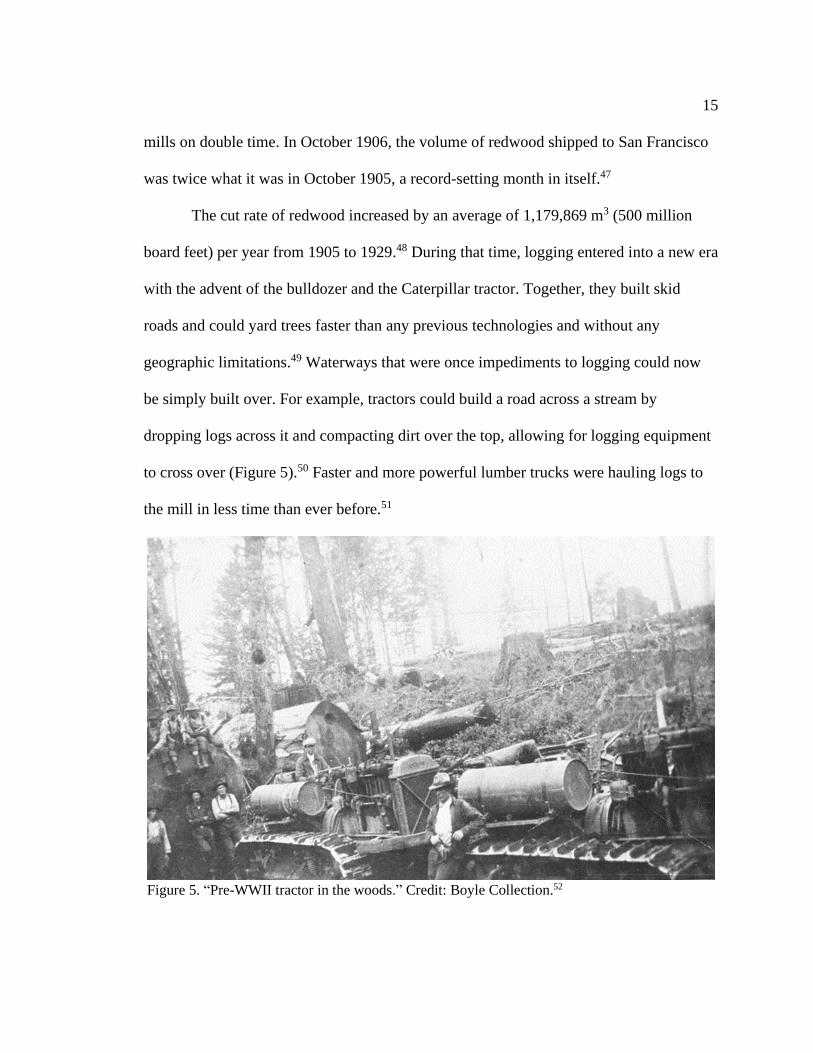
The cut rate of redwood increased by an average of 1,179,869 m3 (500 million
board feet) per year from 1905 to 1929.48 During that time, logging entered into a new era
with the advent of the bulldozer and the Caterpillar tractor. Together, they built skid
roads and could yard trees faster than any previous technologies and without any
geographic limitations.49 Waterways that were once impediments to logging could now
be simply built over. For example, tractors could build a road across a stream by
dropping logs across it and compacting dirt over the top, allowing for logging equipment
to cross over (Figure 5).50 Faster and more powerful lumber trucks were hauling logs to
the mill in less time than ever before.51
Figure 5. “Pre-WWII tractor in the woods.” Credit: Boyle Collection.52
Page 26
16
In August 1929, the U.S. entered the Great Depression. During those years, the
annual cut rate of redwood fell to 318,565 m3 (135 million board feet).53 Mills were shut
down and many people who relied on the forest, both directly and indirectly, lost their
livelihoods. Many timber companies and land owners were unable to meet their financial
obligations and as a result had to forfeit whatever holdings they had back to their
respective creditors. Governments that had to take back land were eager to sell it off as
fast as possible. One such example occurred during the early 1940s in Del Norte County
when the Board of Supervisors was selling 4,407 hectares (10,000 acres) of forfeited land
for $1.00 ($14.41 adjusted for inflation in 2019)54 per 0.4 hectare (1 acre). Due to a
typographical error, the land was actually advertised for $0.10 ($1.44 adjusted for
inflation in 2019)55 per 0.4 hectare (1 acre). The County did nothing to fix the mistake
and sold the land off to local residents at this remarkably low cost. Some of these buyers
turned around and sold their deeds to the timber companies for a nice profit.56
In 1945, the State Board of Forestry passed the California Forest Practice Act,
requiring timber harvests to leave 10 seed trees per hectare (four per acre). Although this
self-regulating Board of Forestry consisted of industry executives who theoretically had
good intentions to create sustainable yield standards, ‘high-grading’ was a common
practice and the residual seed trees were generally low-quality. Lumbermen didn’t want
to take these low-quality trees to the sawmill anyway, as their meager profit would not
justify the efforts and costs associated with felling and transportation, so it was not a
considerable loss to leave behind a few seed trees.
Page 27
17
Thus, when the thriving post-WWII housing industry created a boom for the
timber industry, sustainable land management practices were a low priority.57 In this era,
demand for homes skyrocketed with the onset of the ‘baby boomer’ generation and
advances in logging technology made fulfillment of those demands possible. Although in
1947 many tracts of old-growth redwood forest still existed, redwoods were felled
throughout the 1950s three times faster than any year prior to 1950, with a peak annual
cut of over 2,359,737 m3 (1 billion board feet)58 occurring in 1958.59 As forests were
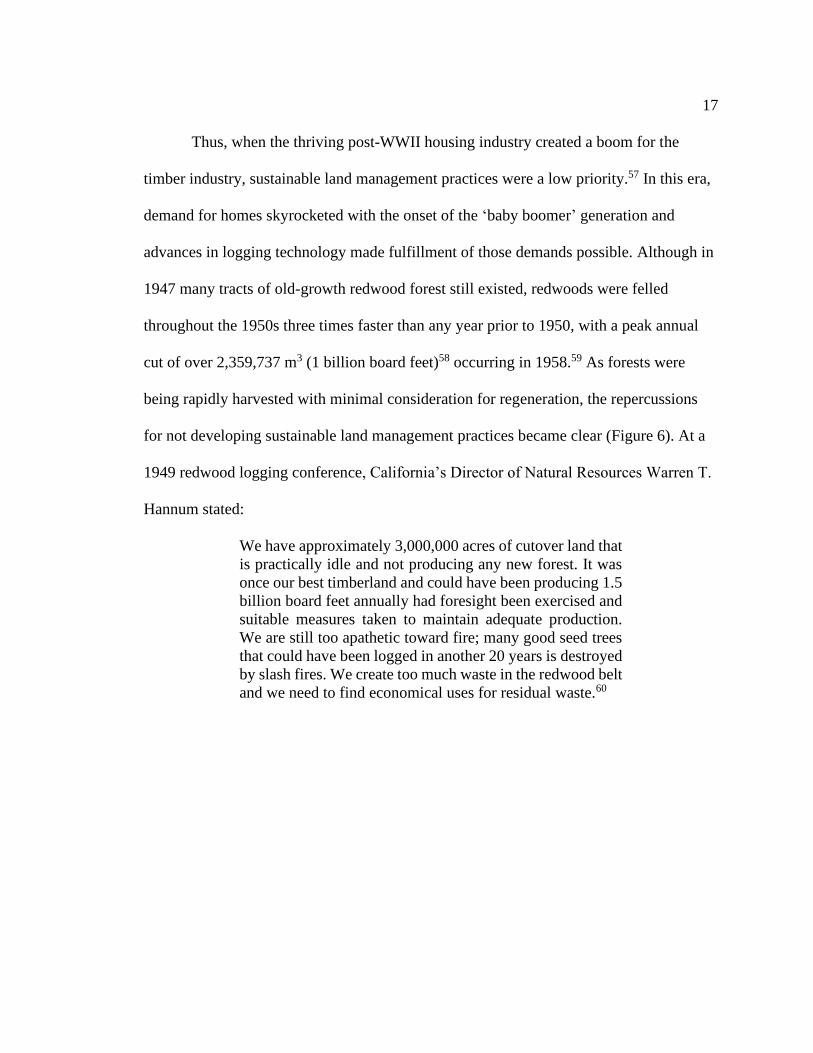
being rapidly harvested with minimal consideration for regeneration, the repercussions
for not developing sustainable land management practices became clear (Figure 6). At a
1949 redwood logging conference, California’s Director of Natural Resources Warren T.
Hannum stated:
We have approximately 3,000,000 acres of cutover land that
is practically idle and not producing any new forest. It was
once our best timberland and could have been producing 1.5
billion board feet annually had foresight been exercised and
suitable measures taken to maintain adequate production.
We are still too apathetic toward fire; many good seed trees
that could have been logged in another 20 years is destroyed
by slash fires. We create too much waste in the redwood belt
and we need to find economical uses for residual waste.60
Page 28
18
Figure 6. “Clear cut hillside, train on trestle loaded with logs.” Credit: Palmquist collection.61
The expansion of the logging industry and increasing population greatly
contributed to the emergence of the conservation movement. Americans were once again
seeking to expand their horizons and they found this in the form of outdoor recreation. A
surge in automobile ownership during the 1950s and the expansion of the National
Highway System in 1955 allowed families to travel to never-been-before places62 such as
the redwood forest. They expected to see wild landscapes and hear the sounds of the
natural world but instead they saw logging trucks and heard chainsaws.63 These
experiences greatly contributed to the emergence of the conservation movement and
increased opposition to logging.
Page 29
19
EARLY REDWOOD CONSERVATION EFFORTS
Two of the earliest attempts to create a redwood state park were made by Henry
A. Crabb of the California Legislature in 1852 and Secretary of the Interior Carl Schurz
in 1879. Due to a lack of public support their efforts were unsuccessful. Finally, through
efforts made by the Sempervirens Club and a passionate environmentalist named Phoebe
Hearst, Big Basin Redwoods State Park was established in 1902 in Santa Cruz County.
In 1918, Save the Redwoods League (hereafter, the League) was formed by a trio
of individuals who wanted to purchase old-growth redwood forests and create redwood
parks for recreation and preservation. They advocated for the State of California to use
taxpayer dollars to match funds the League acquired through private donations to
purchase redwood forests for public enjoyment. Throughout the 1920s, three Redwoods
State Parks were founded thanks to efforts made by the League: Prairie Creek (1923), Del
Norte Coast (1925), and Jedediah Smith (1929).64 Land owners played a key role in the
development of the Parks by selling tracts of their land to the League.
One of the first concepts of a national park for redwoods was made by an early
member of the Sierra Club in 1895. When the idea was pitched six years later in 1901 to
the ‘Conservation President’ Theodore Roosevelt, he took no action to create a park but
stated he was concerned over the redwoods’ eventual fate. In 1908, the first federal park
dedicated to preserving redwoods was established at Muir Woods in Marin County.65
Two other recommendations for a redwood national park were made to Congress, one in
1920 and the other in 1946, but these efforts were unsuccessful.66 Then, in April 1963,
Page 30
20
the National Geographic Society funded a study, The Redwoods: A National Opportunity
for Conservation and Alternatives for Action. The study was led by the National Park
Service and the goal was to find the most effective way to preserve redwood forests for
public recreation and enjoyment.67
On September 15, 1964, findings from The Redwoods were released. It
approximated that of the original 809,371 hectares (2,000,000 acres) of old-growth
redwood forest, only 303,514 hectares (750,000 acres) remained, and that of this
remaining hectarage, only 121,405 hectares (300,000 acres) were untouched by
commercial timber operations with only 19,580 hectares (48,383 acres, roughly 2.5% of
the original forest) preserved in state parks.68 The report estimated that if a federal park
were created, revenues generated by rougly 1.2 million annual visitors would mitigate
economic losses potentially realized by local timber communities. There was also
mention of a prospective land trade between affected timber companies and the federal
government.69 The report concluded it was of national interest to immediately preserve
old-growth redwood forests in the form of a national park for enjoyment by future
generations.70 While the ‘national enthusiasm’ for a redwood national park was
overwhelming, there nevertheless were opponents, largely members of the timber
industry and would-be affected communities. As such, a heated controversy developed
between supporters and adeversaries as options to preserve the remaining old-growth
redwoods were explored.
Page 31
21
THE FIGHT FOR A REDWOOD NATIONAL PARK
Upon release of The Redwoods report, conflict arose among neighboring
communities in northern California about the headquarters location for the proposed park.
McKinleyville lobbied to be the headquarters location due to its close proximity to both
Humboldt State University and commercial aviation. Orick competed for the
headquarters location as the small timber-based town hoped this attraction would bolster
their economy. Klamath argued to host the location as it would complement the new
town being built along the Klamath River. Crescent City wanted the location because
their town would be the terminal point of the ‘Yellowstone-to-the-Redwoods’ project, if
it were to be realized; this idea was for a national scenic highway connecting
Yellowstone National Park to a redwood national park.71 The one thing all communities
unanimously agreed upon was the economic downturn that would surely hit their
communities following park establishment.
Five timber companies were slated to have land fedearlly annexed for the creation
of the park: 1) Arcata Redwood Company, 7,284 hectares (18,000 acres); 2) Georgia-
Pacific, 5,463 hectares (13,500 acres); 3) Pacific Lumber Company, 1,619 hectares
(4,000 acres); 4) Rellim (Miller) Redwood Company, 1,821 hectares (4,500 acres); and 5)
Simpson Timber Company, 4,047 hectares (10,000 acres). The plan was for
approximately 25,269 hectares (62,440 acres) of timberland, including 13,549 hectares
(33,480) of old-growth, to be withdrawn from these five companies, a few other
Page 32
22
landowners, and Prairie Creek Redwood State Park; these lands would then be preserved
in a national park for redwoods.72
At the center of the controversy between government-backed conservationists
wanting to establish a park and the timber industry wanting to keep harvesting trees was
Orick, a small community centered around logging. Many local residents argued that
Orick would be in financial ruins if the federal government annexed the surrounding
private timberlands. In response to The Redwoods, K.F. Laudenschlager, Comptroller of
the Arcata Redwood Company, gave a presentation on October 1, 1964 and stated:
It [The Redwoods] is a masterful presentation illustrated in
color; a genuine work of art climaxed by the discovery of
some unusually tall trees on our property. This piece of
colossal bad luck is the appealing peg on which the whole
proposal is hung. We have old-growth timber which will last
our company 44 years at the present rate of cutting, plus an
indefinite period of life on young growth. I hope to convince
you that this move is totally unnecessary and to urge each of
you to take action in order to prevent this land grab.73
The Arcata Redwood Company was the main employer and driver of the local economy,
paying $350,000 ($2,926,849 adjusted for inflation in 2019)74 in taxes annually.
Laudenschlager rebutted the idea of a possible land trade with the government saying that
it “would amount to robbing Peter to pay Paul.” He argued some mill operators would
lose their log supply and that the U.S. Forest Service was unlikely to willingly give land
holdings to the Department of the Interior for a redwood national park. Six Rivers
National Forest owned 5,666 hectares (14,000 acres) of old-growth redwood forest along
the Klamath River, and The Redwoods report was unclear about what specific federal
Page 33
23
land would be traded for inclusion in the national park. In response to the idea that 1.2
million tourists would fill the tax gap, Laudenschlager countered that tourist dollars
would not drive economic development to the same degree as local communities, as
“tourists don’t make major purchases or spend close to 100% of their paychecks
locally.”75 The next day during a presentation to the Orick Chamber of Commerce,
Arcata Redwood Company comptroller L.J. Chapman stated that 52.6% of the Orick
Elementary School budget came from their company. He argued that national parks don’t
pay taxes and therefore a substantial hole would open up in the community’s budget.76
Local governments echoed the concern of tax revenue losses and felt they should be
compensated for it.
The Humboldt County Board of Supervisors stated in their response to The
Redwoods that “serious consideration should be given by the Federal Government to
some sort of in lieu tax…we are not only talking about the tax base of county government
but of schools.” The Board had a vision of what the long-term economic and social
repercussions would entail. Their statement went on to say:
As the interim report points out, the economic picture in
Humboldt County is not bright (pp. 37 & 50). Any Federal
land acquisition could compound this situation as to jobs,
industry, and tax structure. The result could be a new pocket
of poverty, precisely the type of thing that the Federal
Government is now trying to combat…and it could result in
new Federal expenses and responsibilities in combating
future conditions in Humboldt County.77
Page 34
24
The Del Norte County Board of Supervisors sent a letter to President Lyndon B.
Johnson on October 5, 1964 informing him of the economic downturn that was sure to hit
the regional timber communities if a national park were created. They also wrote that the
Secretary of the Department of the Interior, Stewart Udall, “is not exercising the
leadership necessary for the responsibility he holds. He is exercising socialistic tactics to
gain a Government land grab of private property with no regard for private enterprise or
for private industry.” The Board went on to say that the “methods of data collection were
biased and unfair.”78 Their concerns were soon supported by industry analysts who
agreed the methods and facts stated in the report were not well-founded. The Northern
California Section of the Society of American Foresters reviewed The Redwoods with its
members and National Park Service officials. When comments were issued in November
1964, the Society stated:
The report does not provide even the minimum factual basis
essential for serious study as to whether or not the long-time
public interest would be best served by the establishment of
the proposed park. Redwood is not a vanishing species as the
report implies on pages 17, 33 and elsewhere. Generalized
statements on the ecology and growth of redwood are
incomplete and misleading. The economic analysis portion
of the report is erroneous, admittedly incomplete, and failed
to consider many of the important aspects which are
involved.79
Some argued that friction among the public, government, conservationists, and
industry could be eased if an alternative park were created. The oldest conservation group
in the U.S., the American Forestry Association, called for an alternate park that would
Page 35
25
provide both a sustainable yield operation and places for people to recreate. The redwood
timber industry financed their own report, the Redwood Park and Recreation Plan, which
proposed an alternate park that balanced land use for both recreation and industry (Figure
7).80 Sonoma State College professor, botanist, and ecologist Dr. Kenneth Stocking stated
that the timber companies should try to “control the park’s intelligent development rather
than fight it.”81 He further argued that the costs to acquire the proposed park lands could
be used to reforest agriculture lands that were once productive redwood forests.
Figure 7. Bumper sticker advertising the timber industry’s alternate plan, the Redwood Park and
Recreation Plan.82
In addition to these tensions surrounding the effects of a national park on the local
economy, there were also feelings of maliaise concerning the annexation of lands to form
such a park. In September 1968, The Times-Standard, a local newspaper based out of
Eureka, CA, featured a Yurok family’s 120-acre property on the south spit of the
Klamath River. The land was originally deeded to the family by the U.S. Calvary and by
President Grover Cleveland. Later in 1907, President Theodore Roosevelt renewed the
Page 36
26
title. When the family learned that the proposed annexation included their land, they
charged California Congressman Don H. Clausen as responsible. In his defense,
Congressman Clausen explained that the clandestine move was made during a House-
Senate conference without his prior knowledge.83 Despite this, lawmakers and
conservationists proceeded with efforts to create a redwood national park.
Page 37
27
REDWOOD NATIONAL PARK IS ESTABLISHED (AND EXPANDED)
In the 1960s, President Lyndon B. Johnson strongly supported the establishment
of RNP. In his 1965, 1966, 1967, and 1968 messeages on conservation affiars, he asked
Congress to take action toward this goal. And, in his internationally broadcasted 1968
State of the Union address, he also voiced this support.84 Even after his messages to
Congress, old-growth redwood stands continued to be harvested, causing great concern
among the public, government, and conservationists. In 1966, Secretary of the
Department of the Interior, Stewart Udall, asked the five timber companies owning lands
proposed for the annexation to agree to a logging moratorium on these lands. The
president of Rellim Redwood Company, Harold Miller, initially refused to comply with
Secretary Udall’s request, and only abided after receiving a presidential appeal.
On September 19th, 1968, the Redwood National Park Conference, led by Senator
Henry M. Jackson of Washington, presented the final text of bill S.2515. In his
presentation of the bill’s reallocation of land to form RNP, Senator Jackson sought to
equally address the interests of logging companies, conservationists, and consumers.85
Senators at this conference understood the extensive impacts that this‘legislative taking,’
when the federal government pays ‘just compensation’ to acquire lands, would have on
timber companies, communities, and economies. A congressional agreement was reached
for the park acquisition to be fixed at 23,472 hectares (58,000 acres) and a cost of
$92,000,000 ($685,647,101 adjusted for inflation in 2019).86 On October 2, 1968
Page 38
28
President Johnson signed S.2515 into law and for the first time in U.S. history,
‘legislative taking’ of private land occurred.87
Immediately after the signing, Arcata Redwood Company, Georgia-Pacific, and
Simpson Timber Company began harvesting their remaining tracts of old-growth within
the Redwood Creek watershed, lands upslope of the soon-to-be Redwood National Park.
The Sierra Club had repeatedly asked Secretary Udall to expand the proposed boundaries
of RNP to include these upslope lands, but these requests had not been granted. As such,
even though the new park would protect a 0.4 km-wide land strip on either side of
Redwood Creek (‘the Worm’), the above hillsides were still free to be clearcut, creating
substantial ecological problems in the watershed.
Thus, after RNP was established, conservationists lobbied to expand timber
regulations to the vulnerable privately owned hillsides adjacent to the park ‘Worm.’ As
popularity for environmentalism and ecological sustainability increased nationwide,
activists and local communities pressured federal and state legistlation to stop destructive
forestry practices. In an article titled “The Second Battle of the Redwoods,” the author
describes tourists in the serene majesty of RNP being hauntingly dismayed by the sounds
of chainsaws and falling timber on adjacent lands owned by timber companies.88
Many conservation groups including Save the Redwoods League and the Sierra
Club invested time and money attempting to acquire additional land and stop forest
harvesting on RNP-adjacent lands. In section 2a of S.2515, the Secretary of the Interior
was given authority to modify RNP boundaries to “minimiz[e] siltation of the streams,
Page 39
29
damage on the timber, and assur[e] the preservation of the scenery within the boundaries
of the national park as depicted on said maps”.89 To move forward with RNP expansion
under this guide, conservation groups pooled resources to study the effects of logging on
RNP water quality, erosion, plant and animal biodiversity, forest health, and scenery
aesthetics. In turn, timber companies retained Winzler and Kelly Consulting Engineers to
conduct the same research from their perspective. Though the data gathered from both
projects was similar, the conclusions were opposite. Upon the presentation of both sets of
findings, the California Board of Forestry recruited an outside perspective. Henry A.
Froelich of Oregon State University reviewed both party’s data and concluded that no
significant damage to any of the above factors could occur due to clearcuts. This
professional assessment ended a many-year campaign to expand RNP boundaries.
The Department of the Interior claimed that timber harvests on adjacent private
lands did not jeopardize RNP. To back up this claim, they ordered two new studies of the
Redwood Creek watershed. When completed in 1972 and 1973, both studies
recommended a 244 meter (800 feet) no-harvest buffer zone around RNP and federal
protection of the Redwood Creek watershed. These recommendations were not heeded by
the Nixon Administration and the reports were never publicized.90 Although
conservationists perceived this legislative apathy as a major setback, the courts were full
of environmentalist victories.
One of those victories was Bayside Timber v. San Mateo County, 1971. Bayside
Timber, a logging company, wanted to build a road connecting its timber stands to a state
Page 40
30
highway in San Mateo County. The San Mateo Board of Supervisors declined the permit
on the grounds of increased risk of watershed damage. Bayside sued and the case went to
court where the permit was declined again. The California Court of Appeals ruled in
favor of the Board of Supervisors, deeming the 1945 Forest Practice Act unconstitutional
due to the fact that the Board of Forestry was made up of timber industry executives, a
notable conflict of interest.91 Rebutting this view, the North Coast Timber Association
stated in a January 1972 memo that the State legislature “wisely decided in 1945 that the
industry itself could best determine what practical actions should be taken to leave the
land in a productive condition after logging and to prevent present and future forest crops
from destruction.”92 The timber industry was dealt a major setback when this era of self-
regulation ended and conservationists could use the legal system to their advantage.
Further support for conservation in forestry came in January 1973 when
California passed the Z’Berg-Nejedly Forest Practice Act. With it came a set of Forest
Practice Rules created to assure that “maximum sustained production of high-quality
timber products is achieved while giving consideration to values related to recreation,
watershed, wildlife, range and forage, regional economic vitality, employment, and
aesthetic enjoyment.”93 Private timber companies were now required to complete a
Timber Harvest Plan (THP), which would be reviewed by multiple agencies, before
harvesting any timber on their land and private citizens were allowed to review those
plans.
Page 41
31
This new law was well-received by the Sierra Club, Governor Ronald Reagan,
and the forest industry. Feeling pressure from a Sierra Club lawsuit, the National Park
Service requested stricter enforcement of the new Forest Practices Law and water quality
standards in the Redwood Creek watershed. Their requests were denied and permits for
logging in the watershed continued to be issued through 1974. As a result of Bayside
Timber v. Board of Supervisors, on January 19th, 1975 the State Supreme Court ruled the
new Forest Practices Act was subject to the recently passed California Environmental
Quality Act (CEQA). This Act required the Board of Forestry to amend and more strictly
enforce logging regulations for increased timber sustainability. The following year, the
First District Court of Appeal, Division 2 ruled in Natural Resources Defense Council,
Inc. v. Arcata National Corp., 1976 that THPs are projects under CEQA94. Because
projects are discretionary actions by a government agency that will cause direct or
indirect environmental impacts, they require multi-agency reviews and cumulative
impacts analyses.
In January 1977, President Jimmy Carter was sworn into office and his pledge for
governmental environmental stewardship was quickly acted on by the Sierra Club. An
Act to extend the boundaries of RNP was introduced in February and subsequent
hearings took place in April. The fears of another economic downturn were realized when
the Department of the Interior stated that 1,000 jobs would be lost (the timber industry
estimated 2,000) in Humboldt County where unemployment already ranged between 14
and 18%. In an effort by the North Coast Timber Association to gain nationwide support
Page 42
32
against RNP expansion, a convoy of 23 logging trucks, led by a truck carrying a nine
metric-ton redwood log carved as a peanut (Figure 8), left Eureka and headed for
Washington, D.C. On May 23, while President Carter delivered his environmental
message to Congress,95 the logging truck convoy drove by the U.S. Capitol with a sign
attached to the peanut-log that read “It may be peanuts to you, but it’s jobs to us.”96 The
peanut-log was a gift for the president, which The White House turned down, and was in
reference to Carter’s upbringing as a peanut farmer in Georgia.
Figure 8. A nine metric-ton redwood log carved as a peanut loaded on a flatbed semi-trailer with
a sign reading, “It may be peanuts to you, but it’s jobs to us.” Credit: Associated California
Loggers.97
The Office of Management and Budget also opposed the proposed RNP
expansion as this would become the most-costly land acquisition in history, costing
taxpayers an estimated $359 million ($1,426,810,418 adjusted for inflation in 2019)98 for
19,425 hectares (48,000 acres). Nevertheless, Americans overwhelmingly supported the
Act and after many debates, testimonies, and hearings, on March 27, 1978 President
Page 43
33
Carter signed The Redwood National Park Expansion Act, thereby enacting Public Law
95-250.99 The law enlarged RNP boundaries to include the entire Redwood Creek
watershed, ridge to ridge, to protect resources from damage resulting from upstream and
upslope land use activities. Furthermore, a small piece of legislation within this Act
provided the foundation for all future restoration efforts in RNP:
(6) In subsection 3(e)…the Secretary, in consultation with
the Secretary of Agriculture, is further authorized, pursuant
to contract or cooperative agreement with agencies of the
Federal Executive, the State of California, any political or
governmental subdivision thereof, any corporation, not-for-
profit corporation, private entity or person, to initiate,
provide funds, equipment, and personnel for the
development and implementation of a program for the
rehabilitation of areas within and upstream from the park
contributing significant sedimentation because of past
logging disturbances and road conditions, and, to the extent
feasible, to reduce risk of damage to upstream areas
adjacent to Redwood Creek and for other reasons…
Sec. 104 (b) stated that RNP must submit a comprehensive general management plan to
the Committee on Interior and Insular Affairs of the House of Representatives, and to the
Committee on Energy and Natural Resources of the Senate by January 1, 1980 that would
include:
(1) the objectives, goals, and proposed actions designed to
assure the preservation and perpetuation of a natural
redwood forest ecosystem;
(2) the type and level of visitor use to be accommodated by
the park, by specific area, with specific indications of
carrying capacities consistent with the protection of park
resources;
(3) the type, extent, and estimated cost of development
proposed to accommodate visitor use and to protect the
Page 44
34
resource, to include anticipated location of all major
development areas, roads, and trails; and
(4) the specific locations and types of foot trail access to
the Tall Trees Grove, of which one route shall, unless
shown by the Secretary to be inadvisable, principally
traverse the east side of Redwood Creek through the
essentially virgin forest, connecting with the roadhead on
the west side of the park east of Orick.100
In 1994, Humboldt Redwoods State Park, Prairie Creek Redwoods State Park, Del
Norte Coast Redwoods State Park (RNSP), and RNP merged into one cohesive unit,
Redwood National and State Parks, to be cooperatively managed. In 2002, Save the
Redwoods League purchased the Mill Creek watershed (north of the Redwood Creek
watershed); in 2005 they donated the land to Del Norte Coast Redwoods State Park,
thereby expanding RNSP boundaries by 10,117 hectares (25,000 acres) to a total size of
53,412 hectares (131,983 acres).101, 102 All four parks follow the same management
guidelines for natural and ecocultural resources, with lands divided into 11 management
zones.
Page 45
35
MODERN IMPLICATIONS
Because many of the forests acquired in RNSP were previously industrial
timberlands, much of the RNSP consists of dense second-growth redwood forests with
unnaturally high representations of Douglas-fir (largely from aerial seeding following
clearcut harvests). Low tree vigor and low biodiversity are the results of these overly
dense conditions in RNSP. Forest managers at RNSP have therefore utilized many
different restoration treatments over the last 40 years, encouraging restoration on other
state and federal lands as well. One of the first projects following the 1978 expansion was
a large-scale thinning treatment across several 25-year old stands. The objectives were to
increase redwood dominance by removing Douglas-fir and to reduce overall stand
densities. Following these treatments, stands were still above desired densities, and even
though Douglas-fir representation was reduced to roughly 40% of all trees, greater
redwood dominance was still needed to regain historical stand composition.103 In the
1990s and 2000s, similar thinning treatments were replicated across RNSP lands.
In 2017, RNSP experimented with a more holistic approach to forest restoration
using variable density thinning (Carey, 2003). This treatment creates a mosaic of varying
tree densities across the landscape to mimic natural mortality patterns and create suitable
wildlife habitat. Interestingly, RNSP negotiated an arrangement where excess biomass
(predominantly Douglas-fir) generated from thinning operations was awarded to
contractors to help finance the costs of restoration. This project highlights the potential
for private industry and the federal government to work together in mutually beneficial
Page 46
36
ways.104 Coming full circle, this working relationship also reflects what proponents of the
Redwood Park and Recreation Plan had envisioned decades earlier: a dual use of land for
preservation and perpetual timber extraction. Another RNSP restoration project involves
decommissioning1,046 kilometers (650 miles) of failing logging roads. Approximately
402 kilometers (250 miles) have been restored since 1978, but another 161 kilometers
(100 miles) of high-priority road removal still exists. The cost of logging road restoration
is costly, ranging from about $128,747 to $643,736 per kilometer ($80,000 - $400,000
per mile).105
Redwoods Rising, a collaborative effort between RNSP and Save the Redwoods
League, is trying to finance these expensive restoration projects by pooling resources,
federal and state budgets, and private donations. Their goal is to raise $120 million by
2022 to further restoration of second-growth redwood stands impaired from past
disturbances and to acquire additional redwood forests for protection. To accomplish the
restoration goals, they will provide support needed to foster healthy watersheds and
streams, create suitable wildlife habitat, and remove invasive species.106 These
collaborative efforts among all stakeholders will help to accelerate the development of
old-growth characteristics in impaired redwood forests.
As anticipated, in the years following the creation of RNP, the logging
community of Orick experienced a remarkable loss of livelihood. Located one mile south
of town, the Freshwater Spit had been a popular recreation location for RV-goers,
campers, and local commercial fishermen. Money spent by these groups provided the
Page 47
37
Orick community with much-needed revenue after the collapse of the logging industry.
However, in the summer of 2001, the National Park Service closed the Spit, deeming it
environmentally hazardous to have people camping on ecologically fragile land, and
consequently that revenue disappeared. Additionally, in the early 2000s commercial
fishing permits were no longer being issued or renewed by the National Park Service,
thereby ending another local livelihood. In July 2001, the community hosted an event, the
Freedom Rally, to build support against federal land closures like what happened at the
Freshwater Spit. Confirming their sense of minimal importance, they had hoped this
event would attract a few thousand people, but only about 200 people attended.107 With
minimal employment opportunities related to resource extraction, this tiny logging town
suffers from a depressed economy; the 2017 median household income in Orick,
$37,500, was far below the county ($43,718), state ($67,169), and national ($57,672)
medians.108
In addition to RNSP restoration efforts, legislators have recently proposed federal
bills to revive traditional indigenous land management practices on state and federal park
lands. Agencies such as the U.S. Forest Service and National Park Service are earnestly
trying to incorporate indigenous governance in public land management programs. By
advocating for the cultivation and maintenance of plants important to indigenous people,
agencies can protect and preserve valuable ecocultural resources.109 Since European
settlement, the indigenous tribes of the redwood region have continuously sought to
preserve their spiritual, cultural, physical, and ancestral connections to the land. From the
Page 48
38
expansion of reservations and the continuation of sacred traditions such as basketry,
indigenous peoples of this area have strived to regain sustainable management of their
ancestral homeland. Tribal council websites for the Yurok and Karuk show their
continued commitment to sustainable land stewardship via publications of their own
management plans and programs.110,111
As a recent bill proposed by Representative Jared Huffman, the Yurok Land’s Act
of 2019, requires continued cooperation between federal, state, and tribal agencies112 and
continued access to park lands for research, these tribal management plans provide
important indigenous perspectives to be included in RNSP management policies moving
forward. Continued access to RNSP lands for research like the scientific study presented
in the second chapter of this thesis is essential for adaptive and effective forest
management. Future use of holistic, multidisciplinary forest science to examine
management effects on forest productivity, biodiversity, and ecocultural resources, could
assist management practices that support the interests of indigenous peoples,
conservationists, scientists, timber companies, and local communities.
Page 49
39
CHAPTER 2: EFFICACY OF FOREST RESTORATION TREATMENTS ACROSS A
40-YEAR CHRONOSEQUENCE AT REDWOOD NATIONAL PARK
INTRODUCTION
Although the iconic coast redwood (Sequoia sempervirens [D.Don.] Endl.) is
currently restricted to a narrow natural range along the coast of northern California and
southern Oregon, ancestors of this species were once dominant and widespread around
the Northern Hemisphere. The most ancient redwood clade fossils are from northern
France and northeastern China and date back 146 million years to the Jurassic era (Fliche
and Zeiller, 1904; Endo, 1951; Scott et al., 2016). Redwood first showed up in the North
America fossil record approximately 66 mya in Wyoming, 58 mya in Nevada and Idaho,
and 24 mya in Oregon (Noss, 2000). Coast redwood has been in California for
approximately 20 million years, although approximately 1 myr ago advancing ice sheets
reduced this species to its current range – a thin belt along the coasts of northern
California and southern Oregon (Dewitt, 1982).
Within this restricted range, redwood persistence has been threatened by
numerous factors. Soon after European settlement in California, redwood became prized
for its giant size and rot-resistant, red heartwood and commercial logging began in 1856
(Nixon, 1966). Following redwood harvests, eradication methods such as repetitive
burning and grass-seeding were used to convert prior forestlands to grasslands for
ranching and farming (Dewitt, 1982), further reducing redwoods’ range. Due to over 150
Page 50
40
years of commercial logging and ranching, today less than 5% of the original old-growth
redwood forest remains (Noss, 2000; Sillet and Van Pelt, 2014). Further, redwood’s
narrow range restricted to the foggy coast is vulnerable to climate change, as over the last
century, the frequency of summer fog, an important water input, has reduced by 33%
(Johnstone and Dawson, 2010), and over the last 50 years, mean temperature has
increased by approximately 0.5º C (Koopman et al., 2014). There is therefore a need to
restore the current matrix of young second-growth stands surrounding the few remaining
old-growth patches to serve as habitat corridors for wildlife and act as buffers against
forest edge effects (O’Hara et al., 2010).
Compared to old-growth redwood forests, second- and third-growth forests,
typically established after industrial timber practices, support unnaturally high tree
densities, low redwood dominance, low biodiversity, and relatively low tree vigor
(Teraoka and Keyes, 2011). Due to this shade-tolerant forest type, exceptionally high tree
densities can preclude the development of old forest features for decades (Veirs and
Lennox, 1982; Thornburgh et al., 2000). It is therefore important for land managers to use
active restoration techniques in overly dense second-growth stands to accelerate natural
thinning, improve forest health, and promote the development of old-growth
characteristics. While the re-introduction of fire has the potential to return lands to
historical conditions, prescribed burning is often not a feasible option due to numerous
logistical, bureaucratic, and political barriers (Berrill et al., 2013) as well as increased
annual precipitation over the last century (Woodward et al., 2020), and relatively wet fuel
Page 51
41
loads in this forest type. Alternatively, forest managers can use thinning to prevent stand
stagnation (Oliver and Larson, 1996; O’Hara et al., 2010) and increase forest
biodiversity, the latter a fundamental guiding principal for ecologically sustainable forest
management (Carey, 2003; Larsson and Dannell, 2010; Lindenmayer and Franklin,
2002).
Redwood National Park (RNP) is centrally located within redwood’s range and is
comprised of over 20,000 ha of second-growth forests (Sarr et al., 2004), the majority in
need of active restoration. Annexed in 1968 and 1978, these lands were largely impaired
due to former use as industrial timberlands (Teraoka and Keyes, 2011). Since annexation,
these lands have been largely unmanaged and today exhibit a high degree of even-aged
trees with homogenous stand structure, and a disproportionate amount of Douglas-fir
(Pseudotsuga menziesii [Mirbel] Franco) and tanoak (Notholithocarpus densiflorus
[Hook and Arn.] Manos, C.H. Cannon, & S. Oh) (Chittick and Keyes, 2007). In 1978,
RNP began actively managing the second-growth trees to rehabilitate the inherited
impaired ecosystems.
For over 40 years, RNP has sought to use restoration to accelerate the
development of old-growth conditions in second-growth forests (Chittick and Keyes,
2007) and in 1999 this goal became formally included in the Redwood National and State
Parks’ General Management Plan (California State Park and Recreation Commission and
Service, 2000). As such, since 1978 there have been numerous restoration treatments
implemented across the park. Notably, in 2017 RNP conducted a variable density
Page 52
42
thinning (VDT) trial experiment across 22 ha on Holter Ridge (Figure ). On this same
ridge, earlier thinning treatments were conducted in 1978 (Veirs and Lennox, 1982) and
2009 (Teraoka, 2012). Thus, although RNP has been investigating the effectiveness of
thinning prescriptions to restore second-growth forests for decades, circumstances such
as climate change, increasing catastrophic wildfires, forest pathogens, and urban
development highlight the need to increase the scale of these practices (Burns et al.,
2018).
Given the resource-intensive costs of forest restoration, it is important to monitor
the efficacy of treatments to improve adaptive management efforts (Teraoka, 2012).
Growth (Kerhoulas et al., 2013; King et al., 2013) and, less commonly, physiology (Skov
et al., 2004) are two ways to evaluate and monitor forest responses to management
treatments. Growth is often evaluated using tree-rings to measure radial increments and
basal area increments (BAI); these metrics can also be calculated using repeated diameter
measurements. While most investigations of forest tree responses to treatments rely on
breast height diameter growth (Skov et al., 2005), this growth-based approach can take
approximately four years to detect (Roberts and Harrington, 2008; Dagley et al., 2018)
and can fail to detect a response if newly available carbon is allocated to fine roots, leaf
area, or sugar reserves rather than to diameter growth. In complement to long-term
growth-based evaluations, physiological measurements such as water potential (Ψ) and
stomatal conductance of water vapor (gs) can provide useful information about shorter-
term tree responses (Skov et al., 2004). Predawn Ψ (Ψpd) is a surrogate for plant available
Page 53
43
water and represents the most hydrated daily status, while midday Ψ (Ψmd) represents the
most stressed daily water status.
Plants exchange gases through stomata. Photosynthesis involves CO2 uptake
through these stomata and is positively correlated with the rate of water transpired out of
these pores. Thus, gs measurements can serve as a proxy measurement for photosynthesis.
Physiological measurements also have the potential to identify adverse initial responses
to thinning, ‘thinning shock’ (Harrington and Reukema, 1983), which could be useful
information when formulating prescriptions and predicting short- and long-term forest
responses. Despite these appeals, physiological measurements can be time consuming to
conduct and require specialized equipment and skills. Unsurprisingly, few studies have
investigated leaf-level physiological responses to restoration. Given the lack of published
measurements of redwood physiology in these forest types, knowledge about redwood
physiology in suppressed forests would provide useful baseline data for long-term
monitoring of forest responses to treatments.
Fostering healthy understory vegetation (e.g., forbs, grasses, and shrubs) supports
wildlife diversity, as these plants provide essential food sources and habitat for animals.
Under closed canopies, understory vegetation is minimal and can take decades to re-
establish as it requires increased light originating from the formation of canopy gaps
(Oliver and Larson, 1996). In Pacific Northwest forests, although herbaceous understory
cover can initially increase following treatments, these responses are often short-lived
and can frequently cause vegetation to shift towards shrub dominance (Cole et al., 2017;
Page 54
44
Goodwin et al., 2018). Furthermore, while thinning can accelerate the development of
old-growth conditions capapble of supporting a wide array of animals, the short-term loss
of understory vegetation following thinning operations can reduce reduce wildlife
diversity (Hayes et al., 1997; Carey, 2003). More specifically, treatments such as VDT
that increase stand heterogeneity seem particularly effective at creating suitable habitat
for a variety of fauna (Carey, 2003; Verschuyl et al., 2011). As such, silvicultural
treatments such as low thinning and VDT are often used in forest restoration treatments
(Carey, 2003; Teraoka and Keyes, 2011). Low thinning treatments remove smaller trees
and retain larger trees, while VDT treatments increase spatial variability by creating a
mosaic of different tree densities across the landscape. Although low thinning has been a
popular prescription, investigations indicate that VDT is a more effective approach to
holistic forest restoration (Carey, 2003) and the use of VDT is becoming increasingly
widespread (Chittick and Keyes, 2007; O’Hara et al., 2010).
In this study I examined physiological, growth, and biodiversity responses to
restoration treatments applied across a chronosequence of sites in RNP that range in
years-since-thinning from 40 to 1, as well as untreated sites to serve as a control. To
improve our understanding of ecosystem-scale responses to restoration treatments, I
investigated three questions and hypotheses. First, does treatment affect redwood
physiology (Ψ and gs), and if so, how persistent are these responses? I hypothesized that
in response to thinning, redwood Ψ would decrease due to greater
evapotranspirational water losses, redwood gs would increase due to greater light
Page 55
45
availability, and that these responses would decrease with time-since-treatment. Second,
does treatment affect tree growth (as measured by BAI), and if so, and how long does this
response persist? I hypothesized that thinning would increase growth, that this increase
would be delayed a few years following treatment, and that this response would be
relatively short-lived due to quick canopy reclosure in this temperate forest. And finally,
does treatment affect biodiversity, and if so, how persistent are these responses? I
hypothesized that while treatments increase understory plant diversity due to increased
light availability, wildlife diversity would be slow to respond due to the loss of
understory vegetation resulting from thinning operations.
Page 56
46
MATERIALS AND METHODS
Study Site and Design
The coast redwood range extends approximately 724 km along the Pacific Ocean
from southwestern Oregon to Monterey County, CA (Stuart and Sawyer, 2001). Centrally
located within redwood’s range, this study occurred approximately 13.2 km east of Orick,
CA, USA on the top of Holter Ridge in RNP. This region has a Mediterranean climate
with cool, wet winters and warm, typically rainless, foggy summers. Based on 1981-2010
climate data at the Orick Prairie, CA Weather Station, the average annual temperature
and average annual precipitation are 10.6º C and 168.6 cm, respectively (NOAA:
https://www.ncdc.noaa.gov/cdo-web/datatools/normals).
Historically an upland coast redwood old-growth forest (Veirs, 1986), Holter
Ridge now consists of dense, second-growth stands largely dominated by Douglas-fir and
supporting low biodiversity (Chittick and Keyes, 2007). In 1978, RNP experimentally
thinned several 25-year-old second-growth stands on Holter Ridge with goals to reduce
competition for residual trees, promote redwood dominance, and increase biodiversity
(Veirs and Lennox, 1982). In 1978, average stand density on Holter Ridge averaged
2,400 stems ha-1 with some stands having 7,400 stems ha-1 (Veirs, 1986; Chittick and
Keyes, 2007). For comparison, stand density in redwood-dominated old-growth stands
typically ranges from 25 to 90 trees ha-1, with a minor representation of Douglas-fir
(typically 3 to 10 trees ha-1) (Chittick, 2005). Other less common tree species found in the
Page 57
47
Holter Ridge area include western hemlock (Tsuga heterophylla [Raf.] Sarg.), grand fir
(Abies grandis [Dougl. ex D. Don] Lindl.), tanoak, and Pacific madrone (Arbutus
menziesii [Pursh.]). The understory vegetation is comprised mainly of evergreen
huckleberry (Vaccinium ovatum [Pursh.]), red huckleberry (Vaccinium parvifolium
[Sm.]), salal (Gaultheria shallon [Pursh.]), rhododendron (Rhododendron macrophyllum
[D.Don], and sword fern (Polystichum munitum [Kaulf.] C. Presl) (Veirs, 1986; Chittick
and Keyes, 2007).
Due to past experimental thinning treatments in RNP, this study was able to use
nine existing 0.25 ha plots that ranged in time-since-thinning from 40 years to one year
and were otherwise comparable in most respects: two unthinned control plots, two plots
thinned in 1978, two plots thinned in 2009, and three plots thinned in 2017 (Table 2,
Figure 9). Plots thinned in 1978 were treated using a low-thinning prescription that
reduced Douglas-fir numbers to 60% of redwood numbers (Veirs and Lennox, 1982); this
treatment reduced stand basal area (BA) density by approximately 40%. Similarly, plots
thinned in 2009 were also treated with a low-thinning prescription that targeted Douglas-
fir removal and reduced stand BA density by approximately 40%. Plots thinned in 2017
were treated using a variable density thinning (VDT) prescription that removed
approximately 0, 25, 40, 55, and 75% of BA density, with each reduction treatment
randomly applied in 0.10 ha cells across 22 ha of Holter Ridge (Figure 10). To monitor
VDT treatment efficacy, RNP established three permanent 1 ha plots, each with a 0.25 ha
central subplot that was predominantly thinned to a 40% BA reduction. Thus, to compare
Page 58
48
tree responses to 40% BA reduction treatments across time (1978 to 2017), these inner
0.25 ha VDT plots were compared against the 0.25 ha plots thinned in 1978 and 2009. In
all plots, Douglas-fir was targeted for removal to promote redwood dominance.
Table 2. Plot-level attributes of the nine study plots on Holter Ridge in Redwood National Park
(RNP). Each plot is 0.25 ha and was treated using a low-thin prescription that targeted Douglas-
fir removal. Plots were treated in 1978, 2009, and 2017, with control plots untreated. The 1978
and 2009 plots were thinned to a target basal area (BA) reduction of 40%. The 2017 plots were
treated using variable density thinning (VDT) with five BA reduction treatments: 0, 25, 40, 55,
and 75%. The VDT plots used in this study were predominantly thinned using a 40% BA
reduction treatment.
Plot RNP Elevation Aspect Slope Treatment DBH BA
Name (m)
Year (cm) (m2 ha-1)
Control-A Control-3 501 NE 10º n/a 29 ± 2 111 ± 10
Control-B Control-4 504 E 14º n/a 40 ± 4 96 ± 8
1978-A IB2-2 522 SW 10º 1978 48 ± 4 62 ± 5
1978-B IB2-4 515 SW 15º 1978 44 ± 2 73 ± 7
2009-A 40L1-1 679 NNW 14º 2009 37 ± 2 73 ± 8
2009-B 40L1-3 631 NNW 8º 2009 42 ± 2 70 ± 9
2017-A VDT-1 512 E 9º 2017 45 ± 7 61 ± 19
2017-B VDT-2 511 N 12º 2017 52 ± 15 81 ± 8
2017-C VDT-3 504 NE 8º 2017 27 ± 4 76 ± 9
Page 59
49
Figure 9. Locator map of the nine 0.25 ha study sites on Holter Ridge in Redwood National Park.
Years indicate when stands were thinned using a 40% basal area reduction treatment; control
stands were untreated.
Moving forward, these nine study plots will enable long-term evaluations of
treatment efficacy in RNP. Within each plot, the 10 redwood trees closest to plot center
that were healthy and had a live crown base accessible via a pole pruner (no higher than
14 m) were selected as study trees for physiological and dendrochronological analyses.
For each study tree, diameter at breast height (DBH) and local competition (as measured
with a prism, basal area factor 9.184) were recorded in 2018.
Page 60
50
Figure 10. Credit: National Park Service. The Middle Fork of Lost Man Creek variable density
thinning (VDT) unit map on Holter Ridge in Redwood National Park. Treatments were applied in
the fall of 2017 across this 22 ha area. Each basal area (BA) reduction treatment (0, 25, 40, 55,
and 75% ) was randomly applied to 0.10 ha subplots. Within each of the 1 ha permanent plots
(red boxes), there is a 0.25 ha central plot. This study used these three central 0.25 ha plots for
comparison with other stands on Holter Ridge that were thinned in 1978 and 2009. The three
central plots were thinned in 2017 predominantly using the 40% BA reduction treatment.
Physiological Measurements
In 2018 and 2019, leaf-level physiological measurements occurred across two
consecutive sunny days in July, a time of high productivity and low precipitation input.
Page 61
51
Leaf water potential (l) was measured using a pressure chamber (Model 600, PMS
Instruments, Corvalis, OR) and gs was measured using a leaf porometer (Model SC-1,
Decagon Devices, Pullman, WA). For leaf Ψ and gs measurements, a pole pruner was
used to clip one small branch from the lower crown of each study tree at predawn (pd)
and at midday (md). Leaf pd was only measured in 2018, not 2019. At midday, care
was taken to collect the branch from a well illuminated portion of the crown. From each
predawn branch, three pd measurements were immediately taken from three different
branchlets cut from the collected branch and averaged into a single pd value for that
tree. Similarly, from each midday branch, three md and gs measurements were
immediately taken and averaged into single values for that tree.
In 2019, stem psychrometers (Model PSY1, ICT International, Australia) were
used to continuously measure xylem during the last week of August and first week of
September. For these measurements, one study tree per plot was instrumented and
measured every 30 minutes for 17 consecutive days from August 22 to September 8; trees
were chosen such that the nine study trees were comparable in size and local competition
(BA density). Unfortunately the stem psychrometers in two plots (2009-A and 2017-C)
did not function properly; data from these two plots were therefore not included in my
analyses or results. For each instrumented tree, on each monitoring day, the highest
value occurring between 00:00 – 05:00 hours was identified as xylem pd and the lowest
value occurring between 11:00 hours – 16:00 hours was identified as xylem md. Due
Page 62
52
to instrument noise, I only used a seven-day window (August 31 to September 6) for
analysis of xylem .
To evaluate the relationships among xylem , leaf , and gs, I measured these
three variables at midday (between 11:00 – 16:00 hours) on August 25, 2019 on each tree
instrumented with a stem psychrometer. Stem psychrometers were used to measure
xylem , a pressure chamber was used to measure leaf , and a leaf porometer was used
to measure gs. On each study tree, all three measurements were obtained within a 10-
minute window of time.
Dendrochronological Measurements
To evaluate tree growth responses to thinning treatments using
dendrochronological analyses, growth was measured in trees from the control plots, plots
thinned in 1978, and plots thinned in 2009. The VDT plots, thinned in 2017, were
omitted from this analysis as it was deemed that insufficient time had passed since
treatment (< 2 years) to reliably detect a radial growth response. Within the 1978 plots,
the pre- and post-treatment years were 1971-1977 and 1980-1986, respectively. The pre-
and post-treatment years for the 2009 plots were 2002-2008 and 2011-2017, respectively.
Treatment year and the year immediately following treatment were excluded from growth
analyses to avoid the influence of any thinning shock on residual trees (Reukema, 1959).
In March 2019, two breast height increment cores (5 mm diameter) were taken at
90º angles from each other on the upslope side of each study tree used for physiological
Page 63
53
measurements (n = 10 trees per plot). Ten more redwood trees from each included plot
were added for this growth analysis to make a total of 20 trees per plot. These additional
trees were selected based on randomly chosen azimuths from plot center. For all study
trees in my dendrochronological analyses, DBH and BA (as measured with a prism, basal
area factor 9.184) were recorded.
In spring 2019, following standard dendrochronology techniques (Stokes and
Smiley, 1968), cores were mounted, sanded to 600 grit, and scanned at 2400 dpi (Epson
America, Inc., Long Beach, CA). Cores that were damaged or had unreadable tree-rings
were excluded from analysis (n = 16 out of 240 cores). Attempts were made to cross-
date cores using COFECHA software, but these efforts were unsuccessful, likely due to
complacent growth across all plots as well as short time series (< 50 years on most trees).
Thus, cores were visually measured and cross-dated using WinDendro (Régent
Instruments Inc., Québec, Canada) and a list of marker years. Using this method, cores
were reliably cross-dated from 1960 to 2017. On each study tree, annual radial growth
measurements from the two cores were averaged into a single value. These radial growth
measurements were then used with tree DBH measurements and bark thickness (BT)
estimates to calculate basal area increment (BAI) using the dplR statistical package with
the bai.out function in R. To calculate an estimate of BT for each tree, a locally-derived
regression equation for coast redwoods on Holter Ridge (Lalemand, 2018) was used:
coast redwood BT = 9.939 + 0.722 ∗ Diameter (1)
Page 64
54
where Diameter is tree breast height diameter (including bark). To evaluate the
magnitude and persistence of growth responses to treatment, I used a ratio of mean
annual post-treatment BAI (n = 7 years, excluding treatment year and first post-thinning
year) over mean annual pre-treatment BAI (n = 7 years).
Biodiversity Measurements
To investigate understory plant diversity, understory plants were inventoried in
June (peak flowering season) of 2018 and 2019. Five circular subplots (radius = 1.78 m;
10 m2) were installed within each of the nine 0.25 ha study plots. Subplots were
systematically placed within each plot: one per corner (NW, NE, SW, SE) and one
directly over plot center. Within each subplot, species present, slope, aspect, and percent
cover per species were recorded. Percent cover was recorded using the Daubenmire cover
class scale (1 = 0-5%, 2 = 5-25%, 3 = 25-50%, 4 = 50-75%, 5 = 75-95%, 6 = 95-100%).
Wildlife diversity (IACUC No. 17/18.FWR.37-A) was inventoried in 2018 and
2019, largely following protocols established by California State Park wildlife biologists.
In both years, mammalian diversity was quantified using camera traps in October, a
period of high mammalian activity. Camera traps (three per plot placed at 0, 120, and
240 orientations 10 m from plot center) recorded wildlife activity on the forest floor for
three weeks during each sampling period. Incidental observations of mammal scat were
also recorded but not included in species diversity estimates. In 2018, the use of Sherman
live traps baited with peanut butter and oats was attempted, but due to bear activity and
Page 65
55
poor capture rates, this method of sampling was aborted. To evaluate bird abundance in
each plot, three consecutive 10-minute point counts were conducted within 90 minutes
before or after sunrise across two consecutive sunny days in June (a period of high bird
song activity) in 2018 and 2019. All avian species were identified by sight and/or sound.
For each of the nine study plots, understory plants, birds, and mammals were
evaluated via three diversity metrics: species richness (S), species evenness (D)
calculated using the following equation:
D = 1 – ∑ 𝑛𝑖(𝑛𝑖 – 1)𝑆
𝑖=1
𝑁(𝑁 – 1) (2)
and the Shannon-Wiener diversity values (H’) calculated using the following equation:
H′ = − ∑𝑛𝑖
𝑁∗ ln
𝑛𝑖
𝑁
S
𝑖=1
(3)
where ni = relative cover of each species and N = total number of species.
Statistical Analyses
Using R software version 3.5.1 (R Core Team, 2016), one-way ANOVAs were
used to determine the influence of treatement (control, 1978, 2009, 2017) on tree
physiology and growth. Paired t-tests were used to test for differences in Ψmd and gs
between years (2018 and 2019). Understory plant diversity, avian diversity, and
mammalian diversity were analyzed with two-way ANOVAs using treatment and
sampling year as effects. To test the assumption of equal variances among groups, Levine
and Bartlett tests were used; when this assumption was violated, Welch tests were used to
Page 66
56
determine whether or not groups significantly differed. To test the assumption that data
were normally distributed, Shapiro-Wilk goodness-of-fit tests were used; when this
assumption was violated, Kruskal-Wallis tests were used to determine whether or not
groups significantly differed. If groups significantly differed, Tukey’s HSD multiple
means comparisons were used to identify significant differences among groups.
Regression analyses were also conducted to investigate relationships among xylem ,
leaf , and gs. For all statistical analyses, an α level of 0.05 was used.
Page 67
57
RESULTS
Physiology
Across all plots used in my physiology analysis (control, 1978, and 2009, each
with two replicates, and 2017 with three replicates), there were 87 study trees. On
average, these trees had DBH 41 ± 3 cm and BA density was 79 ± 3 m2 ha-1. Among all
physiology plots, DBH was not statistically different (p = 0.48) however BA density was
significantly higher (p < 0.0001) in the control as compared the 1978, 2009, and 2017
plots.
In 2018 and 2019, water potential (Ψ) was measured on a pressure chamber (leaf
) and with stem psychrometers (xylem ), respectively. In 2019, leaf md was also
measured in July using a pressure chamber to enable interannual comparisons. Both
xylem and leaf measurements were consistently high, not dropping below -2 MPa in
2018 or 2019. Across seven days in September 2019, continuous stem psychrometer
measurements showed that the 1978 and 2009 plots generally experienced the highest and
lowest xylem Ψ, respectively (Figure 11). In 2018, leaf pd was significantly higher in
the 2009 plots compared to all other plots (p = 0.0002, Figure 12A, Table 4). In 2019,
xylem Ψpd was highest in the 1978 plots compared to all other plots, although not
significant (p = 0.15, Figure 12A, Table 3). Due to differing methods of Ψpd collection,
Ψpd between 2018 (leaf Ψpd) and 2019 (xylem Ψpd) could not be compared.
Page 68
58
At midday, the 2017 plots experienced lower leaf md than all other plots in 2018
(p < 0.0001) and in 2019 (p < 0.0001, Figure 12B, Table 3). Between years, leaf Ψmd was
significantly higher in 2019 than 2018 for all plots: control (p = 0.0001), 1978 (p <
0.0001), 2009 (p < 0.0001), and 2017 (p = 0.006). Regression analyses found no
significant relationships between xylem Ψmd and leaf Ψmd (p = 0.92, R2 = 0.002, Figure
13A), xylem Ψmd and gs (p = 0.35, R2 = 0.17, Figure 13B), or between leaf Ψmd and gs (p
= 0.10, R2 = 0.02, Figure 13C).
In 2018, gs was significantly higher in the 2017 plots compared to the 2009 plots
(, Figure 12C, Table 3). Similarly, in 2019, gs was significantly higher in the 2017 plots
compared to the control plots (p = 0.01). Compared to 2018, gs values in 2019 were
significantly higher in the 1978 (p = 0.01), 2009 (p < 0.0001), and 2017 (p = 0.001) plots,
but not in the control plots (p = 0.59).
Figure 11. Daily xylem water potential (Ψ) for redwood trees in the control (black line), 1978
(black dots), 2009 (gray line), and 2017 (gray dashes) treatment plots. Measurements were taken
with a stem psychrometer every 30 minutes from August 31 through September 6, 2019 in
Redwood National Park. The anomalous drop in on September 5 at all plots was likely due to
an issue with data retrieval from the psychrometer data box on September 4.
Page 69
59
Figure 12. Mean (± SE) water potential (Ψ) and stomatal conductance (gs) in 2018 (white) and
2019 (gray) in Redwood National Park in control plots and plots thinned in 1978, 2009, and 2017.
A) Leaf predawn water potential (Ψpd) measured in July 2018 with a pressure chamber and xylem
Ψpd measured in September 2019 with stem psychrometers. B) Leaf midday water potential (Ψmd)
measured in July 2018 and July 2019 with a pressure chamber. C) gs measured in July 2018 and
July 2019 with a leaf porometer. For each panel, treatments within a year not sharing the same
uppercase letter are significantly different. For the md and gs panels, within a treatment, years
not sharing the same lowercase letter are significantly different. In each panel, p-values for one-
way ANOVAs comparing treatment means within each year are provided.
Page 70
60
Figure 13. Redwood physiological relationships between A) xylem Ψ and leaf Ψ, B) xylem Ψ and
gs, and C) leaf Ψ and gs. On each tree, these midday measurements of xylem Ψ (using a stem
psychrometer), leaf (using a pressure chamber), and gs (using a leaf porometer) were taken
within a 10-minute window of each other in Redwood National Park. Panels (A) and (B) show
measurements from August 25, 2019 using seven trees instrumented with stem psychrometers.
Panel (C) shows all measurements taken in July 2018 and 2019.
Page 71
61
Table 3. Mean (± SE) predawn water potential (Ψpd), midday water potential (Ψmd), and stomatal conductance (gs) for redwood trees in
the control plots and plots thinned in 1978, 2009, and 2017 in Redwood National Park. In 2018, leaf pd and md measurements were
made in July using a pressure chamber. In 2019, xylem pd measurements were made in September using stem psychrometers and leaf
md measurements were made in July using a pressure chamber. In 2018 and 2019 gs measurements were made in July using a leaf
porometer. For each variable, treatments not sharing an uppercase letter are significantly different, with the one-way ANOVA statistics
provided. For md and gs, within each treatment, years not sharing the same lowercase letter are significantly different.
Variable Control 1978 2009 2017 p-value F-stat df
Leaf Ψpd 2018 -0.67 ± 0.03A -0.64 ± 0.03A -0.59 ± 0.05B -0.69 ± 0.03A 0.0002 7.50 82
Xylem Ψpd 2019 -0.12 ± 0.08A -0.02 ± 0.02A -0.16 ± 0.10A -0.03 ± 0.00A 0.15 1.95 24
Leaf Ψmd 2018 -1.07 ± 0.03aA -1.16 ± 0.04aA -1.09 ± 0.02aA -1.37 ± 0.05aB <0.0001 14.94 81
Leaf Ψmd 2019 -0.93 ± 0.03bA -0.92 ± 0.03bA -0.81 ± 0.04bA -1.16 ± 0.04bB <0.0001 16.65 83
gs 2018 85 ± 4aAB 94 ± 5aAB 82 ± 5aA 98 ± 3aB 0.02 3.55 83
gs 2019 96 ± 5aA 112 ± 7bAB 111 ± 5bAB 127 ± 7bB 0.01 4.58 83
Page 72
62
Growth
Across all plots used in my growth analysis (control, 1978, and 2009, each with
two replicates), there were 115 study trees (20 trees per plot minus five trees that were
not cross-datable). On average, these trees had DBH 44 ± 1 cm, BA density 86 m2 ha-1 ±
3, and annual BAI (based on 1960 – 2015) 16.6 ± 0.3 cm2 yr-1 (Table 4). Among plots,
although DBH (p = 0.32) and annual BAI (p = 0.054) did not differ significantly, BA
density was significantly higher (p < 0.0001) in the control plots compared to the 1978
and 2009 plots. Overall, there was a general trend in all plots of increasing BAI starting
around 1990, with BAI generally being highest in the 1978 plots and lowest in the control
plots (Figure 14). However, an analysis of post-/pre-treatment growth responses
evaluating mean BAI seven years before and after treatment found no significant
differences among plots (p = 0.39, Figure 15).
Page 73
63
Figure 14. Mean annual growth, as measured by basal area increment (BAI), for redwood trees in
each treatment: control (black solid line), 1978 treatment (small black dashes), and 2009
treatment (large black dashes) across 55 years (1960-2015) in Redwood National Park. Tree
sample depth (gray dots) is also shown on the right vertical axis.
Figure 15. Mean (± SE) post-/pre-treatment basal area increment (BAI) for redwood trees in
control plots and plots treated in 1978 and 2009 in Redwood National Park. Within the 1978
plots, pre-and post-treatment years were 1971-1977 and 1980-1986, respectively; pre- and post-
treatment years for the 2009 plots were 2002-2008 and 2011-2017, respectively. These same time
periods were used for comparison with the control plots.
Page 74
64
Table 4. Mean (± SE) plot-level growth metrics of the six study sites used for growth analysis in
Redwood National Park in 2019, including diameter at breast height (DBH), basal area density
(BA), and basal area increment (BAI) for redwood growth study trees. BAI calculations are based
on 1960 – 2015 tree ring data.
Plot DBH BA BAI
(cm) (m2 ha-1) (cm2)
Control-A 38 ± 3 112 ± 7 17.6 ± 0.7
Control-B 40 ± 2 101 ± 6 15.9 ± 0.6
1978-A 51 ± 3 65 ± 4 22.3 ± 0.8
1978-B 45 ± 2 76 ± 5 20.3 ± 0.8
2009-A 42 ± 4 75 ± 6 19.9 ± 1.2
2009-B 43 ± 3 82 ± 6 20.5 ± 0.8
All Plots 44 ± 1 86 ± 3 16.6 ± 0.3
Biodiversity
Across all nine plots in 2018 and 2019, 24 different understory plant species were
observed: 14 herbaceous plants, three ferns, four shrubs, and three trees (Table 5). Across
the two sampling years, plot-level plant species richness (S) ranged between six and 20,
Decies evenness (D) ranged from 0.28 to 0.81, and the Shannon-Wiener diversity Indes
(H’) ranged from 0.45 to 2.29 (Table 6); neither D (p = 0.074) or H’ (p = 0.054) were
significantly different among treatments. Treatment had a significant effect (p = 0.01) on
understory S but sampling year (p = 0.19) was not. Compared to all other plots,
understory S was significantly higher in the 2009 plots (p = 0.003), with these plots
supporting 22 different species: 15 forbs, three ferns, one shrub, and three trees. Between
2018 and 2019 in the 2017 plots, there were dramatic increases in percent cover for
tanoak (2 to 33%), Douglas-fir (0 to 8%), and stream violet (Viola glabella [Nutt. in Torr.
& A. Gray], 1 to 4%) (Table 7). Understory diversity was lowest in the control plots, with
Page 75
65
these plots only supporting five different species, supporting no ferns, and having cover
dominated by forest litter (55%).
Across all nine study plots in 2018 and 2019, there were 29 avian species
observed, all of which are federally protected under the Migratory Bird Treaty Act (Table
8). Generally, avian diversity was relatively comparable among all plots based on S, D,
and H’. Across the two-year period, plot-level S ranged between 16 and 18, D ranged
from 0.87 to 0.92, and H’ ranged from 2.30 to 2.57 (Table 5). Among treatments, neither
S (p = 0.74), D (p = 0.38), nor H’ (p = 0.85) differed significantly. Notably, in 2019, a
marbled murrelet (Brachyramphus marmoratus), a species federally listed under the
Endangered Species Act as Proposed Threatened, was observed in the 1978 plots.
Among all study plots in 2018 and 2019, a total of nine identifiable mammals
were observed (Table 9). Across the two-year period, plot-level S ranged from 6 to 8, D
ranged from 0.73 to 0.83, and H’ ranged from 1.52 to 2.00 (Table 5). Similar to the trends
observed for birds, neither S (p = 0.90), D (p = 0.07), nor H’ (p = 0.56) differed
significantly among treatments for wildlife diversity. Although H’ was lower in 2019
compared to 2018 for all treatments, two new species were observed: Roosevelt elk
(Cervus canadensis roosevelti) in the 2009 plots and fisher (Pekania pennanti), a species
federally listed under the Endangered Species Act as Proposed Threatened, in the 1978
and 2009 plots
Page 76
66
Table 5. List of vascular plants observed across the nine study sites in Redwood National Park in July 2018 and 2019 in control plots
and plots thinned in 1978, 2009, and 2017. Growth forms: herbaceous forb (H), fern (F), shrub (S), and tree (T). “X” Denotes presence. Species Common Name Growth Form Control 1978 2009 2017
Achlys triphylla deer's foot H
X
Agrostis spp. grass H
X
Asarum caudatum western wild ginger H
X
Berberis nervosa little Oregon-grape H X
X X
Claytonia sibirica spring beauty H
X X
Corallorhiza maculata spotted coralroot H
X
Polypodium glycyrrhiza licorice fern F
X
Galium aparine cleavers grass H
X X
Gaultheria shallon salal H X X X X
Iris douglasiana Douglas' iris H
X
Listera cordata heart-leaf twayblade H
X X
Lilium bolanderi Bolander's lily H
X X X
Notholithocarpus densiflorus tanoak T X X X X
Polystichum munitum sword fern F
X X X
Pseudotsuga menziesii Douglas-fir T
X X
Pteridium aquilinum bracken fern F
X X
Rhododendron macrophyllum rhododendron S X
X
Rubus ursinus California blackberry S
X X
Sequoia sempervirens coast redwood T
X X
Trichostema ovatum San Joaquin blue curls H
X
Trientalis latifolia Pacific starflower H
X X
Vaccinium ovatum evergreen huckleberry S X X X X
Vaccinium parvifolium red huckleberry S
X
X
Viola glabella stream violet H X X
Page 77
67
Table 6. Species richness (S), species evenness (D), and Shannon-Wiener diversity index (H’) for plants, birds, and mammals among
the control, 1978, 2009, and 2017 plots in 2018 and 2019 in Redwood National Park. In both years, understory plant surveys were
conducted in May, bird point count surveys were conducted in June, and mammals were inventoried for three weeks in October using
trail cameras. Sampling Year 2018 2019
Diversity Metric Biodiversity Control 1978 2009 2017 Control 1978 2009 2017
Species Richness (S) Plants 5 6 17 11 5 6 20 15
Species Evenness (D) Plants 0.28 0.68 0.81 0.48 0.28 0.68 0.72 0.72
Shannon-Wiener Diversity Index (H') Plants 0.45 1.22 2.29 1.14 0.45 1.22 2.15 1.96
Species Richness (S) Birds 17 17 17 16 18 17 17 18
Species Evenness (D) Birds 0.89 0.92 0.87 0.90 0.88 0.91 0.91 0.91
Shannon-Wiener Diversity Index (H') Birds 2.36 2.57 2.27 2.37 2.34 2.30 2.43 2.40
Species Richness (S) Mammals 6 7 7 8 7 8 8 8
Species Evenness (D) Mammals 0.83 0.80 0.73 0.77 0.82 0.81 0.65 0.71
Shannon-Wiener Diversity Index (H') Mammals 1.73 1.72 1.52 2.00 1.63 1.63 1.48 1.36
Page 78
68
Table 7. Change in percent cover (based on Daubenmire cover classes) of understory vegetation
from 2018 to 2019 in the variable density thinning (2017) plot in Redwood National Park. Species Common Name Change in Cover (%)
Berberis nervosa little Oregon-grape 0
Claytonia sibirica spring beauty -1
Galium aparine cleavers grass 5
Gaultheria shallon salal 3
Lilium bolanderi Bolander's lily -1
Listera cordata heart-leaf twayblade 7
Notholithocarpus densiflorus tanoak 31
Polystichum munitum sword fern -1
Trientalis latifolia Pacific starflower 2
Pseudotsuga menziesii Douglas-fir 8
Rhododendron macrophyllum rhododendron 0
Sequoia sempervirens coast redwood 5
Vaccinium ovatum evergreen huckleberry 1
Vaccinium parvifolium red huckleberry 1
Viola glabella stream violet 3
Page 79
69
Table 8 List of avian species observed in Redwood National Park in June of 2018 and 2019 in
control plots and plots thinned in 1978, 2009, and 2017. “X” Denotes presence. Species denoted
with an asterisk (*) are federally listed under the Endangered Species Act.
Species Common Name Control 1978 2009 2017
Bombycilla cedrorum cedar waxwing
X
Brachyramphus marmoratus* marbled murrelet
X
Calypte anna Anna's hummingbird X
Catharus guttatus hermit thrush X X X X
Catharus ustulatus Swainson's thrush
X
X
Certhia americana brown creeper X X X X
Chaetura vauxi Vaux's swift
X
Contopus cooperi olive-sided flycatcher
X
Corvus brachyrhynchos American crow
X
Corvus corax common raven X
X X
Dryobates villosus hairy woodpecker
X
Dryocopus pileatus pileated woodpecker
X X X
Empidonax difficilis Pacific-slope Flycatcher X X X X
Ixoreus naevius varied thrush X X X X
Junco hyemalis dark-eyed junco X
X X
Patagioenas fasciata band-tailed pigeon X X X X
Pheucticus melanocephalus black-headed grosbeak X
Piranga ludoviciana western tanager
X X
Poecile rufescens chestnut-backed chickadee X X X X
Regulus satrapa golden-crowned kinglet X X X X
Selasphorus sasin Allen's hummingbird
X
Setophaga coronata yellow-rumped warbler X X X X
Setophaga sp. warbler spp. X X X X
Sialia mexicana western bluebird
X
Cardellina pusilla Wilson's warbler X X X X
Troglodytes hiemalis winter wren X X X X
Turdus migratorius American robin
X
X
Vireo huttoni Hutton's vireo X X X X
Zenaida macroura mourning dove X
Page 80
70
Table 9. List of mammals observed in Redwood National Park in October of 2018 and 2019 in
control plots and plots thinned in 1978, 2009, and 2017. “X” Denotes presence. Species denoted
with a double asterisk (**) are federally listed under the Endangered Species Act as Proposed
Threatened.
Species Common Name Control 1978 2009 2017
Cervus canadensis roosevelti Roosevelt elk
X
Glaucomys oregonensis Humboldt flying squirrel X X
X
Pekania pennanti** fisher
X X
Odocoileus hemionus black-tail deer X X X X
Sciuridae sp. squirrel sp. X X X X
Tamias sp. chipmunk sp. X X X X
Tamiasciurius douglasii Douglas squirrel X X X X
Ursus americanus American black bear X X X X
Rodentia sp. rodents X X X X
Page 81
71
DISCUSSION
This study’s assessment of forest restoration efficacy based on tree physiology (Ψ
and gs), annual growth (BAI), and biodiversity (understory vegetation, birds, and
mammals) metrics produced findings comparable with other studies (Thomas et al., 1999;
Chittick and Keyes, 2007; Verschuyl et al., 2011; O’Hara et al., 2015; Sohn et al., 2016;
Cole et al., 2017; Goodwin et al., 2018; Lalemand, 2018). In second-growth redwood
forests, the standard approach to evaluate treatment efficacy is typically to assess breast
height radial growth (Veirs, 1986; Lalemand, 2018). However, responses to treatment can
take years to detect when relying on these growth-based metrics (Dagley et al., 2018).
Thus, this study measured both physiology and growth to evaluate forest responses to
treatment in both the short- and long-terms, respectively. In support of the hypotheses,
restoration treatments on Holter Ridge in Redwood National Park (RNP) elicited positive
forest responses, as measured by redwood physiology, redwood growth, and biodiversity
of plants, birds, and mammals. Redwood physiological responses to treatment were
greatest in the most recently thinned plots and were otherwise relatively homogenous
across the 1978, 2009, and control plots. Similarly, redwood growth also responded to
treatment, with the time between thinning and increased growth ranging from four to 10-
years and the responses persisting for many years. Finally, treatments promoted
understory plant biodiversity through increased species richness and percent cover,
although this increased diversity was not detected for birds or mammals. Overall, these
Page 82
72
findings realize this study’s objective to inform on the capacity of second-growth
redwood forest restoration to accelerate the development of old-growth characteristics.
Physiology
Physiological responses to treatments were detectable in the 2017 plots but were
relatively muted in the 1978, 2009, and control plots, demonstrating that these types of
measurements can be useful to evaluate tree responses to treatments in the short-term.
Previous physiology-based studies, many based in arid environments such as the U.S.
Southwest, have shown that thinning treatments can increase leaf Ψpd in residual trees
during drought conditions (Skov et al., 2004; Sohn et al., 2016). In these dry, water-
limited ponderosa pine forests, pd and Ψmd are often negatively correlated with stand
density (Kolb et al., 1998), although in some stands density does not seem to affect
(Schmid et al., 1991). In RNP, thinning did not meaningfully affect leaf pd (almost all
values > 0.75 MPa), suggesting that in this coastal, wet, temperate rainforest, soil water
availability is ample throughout the year regardless of stand density. Corroborating this
speculation of ample water availability in this forest, redwood growth on Holter Ridge
was highly resistant to the recent 2012-2015 California drought (Williams et al., 2015;
Lalemand, 2018). Thus, this study and others collectively suggest that in its northern
range, substantial precipitation inputs of winter rain and summer fog (Litvak et al., 2011)
provide sufficient water for coast redwood.
Page 83
73
While pd indicated ample soil water availability regardless of treatment history
in this study, recent treatments did affect leaf md. The decreased leaf Ψmd measured in
the 2017 plots may result from increased evapotranspirational water loss due to increased
light availability (Gauthier and Jacobs, 2009). By contrast, in the 1978 and 2009 plots,
post-treatment times were likely sufficient to allow canopy re-closure such that light,
evapotranspiration, and resulting leaf md were indistinguishable from the controls.
Although leaf largely indicated that water status was invariable with treatment,
md in recently thinned plots being the exception, xylem suggested that treatments
might quantifiably affect tree water status, even in the long-term. Among treatments,
xylem was consistently lowest in the 2009 plots and highest in the 1978 plots. In the
2009 plots, it is possible that greater post-treatment light availability stimulated an
increase in the leaf area to sapwood area ratio in residual trees (Simonin et al., 2006),
thereby causing the measured reduction in xylem . Alternatively, because only one tree
per plot was instrumented, it is also possible that the relatively consistent ranking of
xylem from high to low in 1978, 2017, control, and 2009 plots, respectively, is the
result of differences in microclimate, growing space, and/or physiology of the
instrumented trees. Nevertheless, on the whole, xylem values (all > -2 MPa) generally
supported leaf findings, together indicating that redwoods at this site are not water-
limited.
Page 84
74
In July 2019, paired midday measurements showed that xylem was typically
lower than leaf and that there was not a strong relationship between the two metrics.
Previous studies using stem psychrometer and pressure chamber measurements of have
found strong (Milliron et al., 2018) and weak (Wright et al., 1988) correlations between
the data resulting from these two methods. It is possible that the pressure chamber
overestimated leaf due to issues with apoplastic solutes (Duniway, 1971; Milliron et
al., 2018). Interestingly and somewhat surprisingly, my measurements also yielded weak
relationships between md (xylem and leaf) and gs. My synchronized measurements of
xylem , leaf , and gs highlight that further work with a larger sample is needed to
better understand the dynamic relationships among these three metrics in redwood trees.
Increased gs in the 2017 treatments indicates that thinning can enhance carbon
assimilation rates in second-growth redwood forests for at least the first few years
following treatment. In 2019, gs was greatest in the 2017 plots that were thinned just two
years earlier. This finding, likely due to increased light availability increasing
transpiration in residual trees, showcases how thinning can rather immediately stimulate
gs. Similarly, in second-growth ponderosa pines of northern Arizona, gs often increases
within one- to three-years post-thinning (Kolb et al., 1998; Skov et al., 2004).
Additionally, black walnut (Juglans nigra L.) physiology responds to thinning via higher
photosynthetic rates resulting from increased light availability just one year after
treatment (Gauthier and Jacobs, 2009). Thus, in thinned second-growth redwood forests,
elevated gs in residual trees can be expected in the short-term. In the longer-term
Page 85
75
however, it is likely that this increase will relatively quickly recover to pre-treatment
rates due to canopy re-closure. In temperate forests of the United Kingdom (Valverde and
Silvertown, 2019) and forests of the eastern U.S. (Runkle et al., 2018), for example, the
canopy can re-close within just ten years of treatment. Given the results of these studies
coupled with muted gs rates in the 2009 plots (treated 10 years prior to this study), it
seems likely the 2017 plots will have muted gs responses by 2027. It would be
informative for future studies of the VDT treatments to include canopy openness
measurements to possibly quantify a correlation with gs rates.
Overall, these physiology measurements collectively demonstrate that this
redwood forest is not water-limited and that increased light availability following
thinning therefore has the potential to increase tree productivity until canopy re-closure
again limits light. Continued monitoring of and gs in the 2017 plots over the next five
to seven years would provide useful information about how long enhanced gas exchange
persists following thinning in this forest type. Given current projections for regional
climate change and widespread efforts to restore second-growth redwood forests in
northern California (Burns et al., 2018), these physiological measurements can serve as
useful baseline data to help land managers tailor thinning treatments for desired short-
and long-term responses and monitor forest responses to treatment and climate over time.
For example, the knowledge that leaf md is reduced immediately following thinning
could help minimize negative responses to treatment such as ‘thinning shock’
(Harrington and Reukema, 1983), particularly in a future with projected increases in
mean annual temperatures and decreased summer fog (Johnstone and Dawson, 2010).
Page 86
76
Growth
Given that increased leaf-level gas exchange is a typical short-term response to
reductions in stand density for multiple forest types, it reasons that growth should also
increase following thinning treatments. This type of ‘release effect’ has been detected for
ponderosa pine growth in Oregon and northern Arizona, with the response persisting for
four (O’Hara et al., 2010), 10 (Kerhoulas et al. 2013), and 20 (Latham and Tappeiner,
2002) years following treatment. In Sierra Nevada mixed-conifer forests, thinning was
observed to immediately promote increased tree growth (Callahan, 2019). In second-
growth redwood forests of northern California, this same type of response to thinning has
also been observed with the time between treatment and the onset of increased growth
varying from four (Dagley et al., 2018), to five (Roberts and Harrington, 2008), to 10
years post-treatment (O’Hara et al., 2010).
In agreement with these previous studies of redwood restoration, my work found
that treatment increased growth. This can be seen in the 1978 and 2009 treatments as
delayed departures from the controls (Figure 13). Remarkably, these increases in growth
have persisted through 2015 in both the 1978 and 2009 treatments, suggesting that the
benefits of thinning can be impressively long-lived in this system. Interestingly, although
not included in this study’s analyses, trees in the 2009 plots had detectable 2019 radial
growth when cored in early February, whereas trees in the control and 1978 plots did not
yet have any detectable growth at this time. This early onset of growth in recently thinned
Page 87
77
plots indicates that young residual redwoods are vigorous and respond favorably to
treatments.
As typically occurs in many forest systems, there was a delay between treatment
and a release in growth at this site. Trees in the 1978 and 2009 plots experienced a
growth-based departure from the control about 10- and four-years post-treatment,
respectively (Figure 13). This difference in lag time between treatment and release could
relate to tree age, as the single cohort of trees in the 1978 plots were approximately 25-
years-old at the time of treatment and the single cohort of trees in the 2009 plots were
approximately 45-years-old when thinned (Teraoka and Keyes, 2011; Veirs and Lennox,
1982). Only 25 years after clear-cutting, it is likely that in 1978 trees were not yet light
limited and thinning therefore did not immediately meaningfully increase a limiting
resource. Furthermore, because redwood prolifically sprouts in response to disturbance
after thinning (O’Hara et al., 2015), increased photosynthate likely was allocated to basal
sprout production rather than diameter growth. Diameter growth therefore likely did not
increase in the 1978 plots until the canopy had sufficiently closed over to suppress
sprouting, possibly explaining the 10-year delay between treatment and release. More
generally, reasons for the common lag between treatment and increased breast height
growth are variable, most notably including thinning shock (Harrington and Reukema,
1983) and the fact that newly available photosynthate from increased leaf-level carbon
uptake might first be allocated to numerous competing sinks other than breast height
diameter growth (Lagergren et al., 2019). Examples of alternative carbon sinks following
treatment include increased leaf area to take advantage of greater light availability
Page 88
78
(McDowell et al., 2003) and increased structural roots for improved stability under more
severe wind exposure (Thornburgh et al., 2000).
Likely due to the four- to 10-year lag that I detected between thinning and
increased growth, I did not detect a significant release effect when evaluating seven-year-
average post-/pre-treatment growth. Additionally, this failure to detect a release in growth
using this common post-/pre-treatment approach could indicate that the 40% BA
reductions used in 1978 and 2009 were insufficient in these stands with tree densities on
Holter Ridge of approximately 2,400 trees per hectare (TPH), compared to the historical
old-growth reference conditions of 25 – 90 TPH, and Douglas-fir continuing to be
overrepresented (Chittick, 2005). In fact, previous work in 40- to 50-year-old second-
growth redwood forests suggests that to foster the greatest increase in growth, BA
reductions ranging from 50 to 75% should be used (Oliver et al., 1994; O’Hara et al.,
2015). Thus, these physiology- and growth-based analyses as well as multiple other
studies on second-growth redwood forests all suggest that heavy basal area reductions, or
possibly silvicultural methods other than low thinning, are needed to elicit a large release
in residual trees.
Biodiversity
While common objectives for restoration treatments include increasing vigor in
residual trees, increasing biodiversity is another important goal. This is particularly true
in second-growth redwood forests where impenetrably dense thickets of suppressed trees
stalled in the stem exclusion phase of stand development can blanket extensive swaths of
Page 89
79
the landscape. Previous work in redwood forests (Chittick, 2005; Chittick and Keyes,
2007) and in mixed-conifer forests of the Sierra Nevada Mountains (Goodwin et al.,
2018) and Oregon (Cole et al., 2017) has shown that thinning treatments can help spur a
shift towards understory reinitiation with increased plant diversity (Oliver & Larson,
1996). However, in these studies, initial increases in understory plant diversity were often
followed by shrub dominance and a corresponding decrease in herbaceous cover. In RNP,
this shift from understory herbaceous dominance to shrub dominance can occur within
three years of a clearcut (Chittick, 2005; Muldavin et al., 1981), suggesting that heavy
thinnings should be avoided, if maximizing understory plant diversity is a high priority of
treatment. On the other end of the spectrum, low-intensity restoration treatments (e.g., the
40% BA reductions implemented on Holter Ridge) also typically accelerate the
development of large shrub thickets that can persist beyond canopy closure (Chittick,
2005; Thomas et al., 1999) and perhaps indefinitely (Teraoka, 2012).
Similar to previous work, restoration treatments in RNP promoted the
development of understory vegetation, as measured by increased species richness, species
evenness, Shannon-Wiener diversity indices, and percent cover compared to control
plots. In the 2017 plots, understory herbaceous cover dramatically increased from 2018 to
2019, as did all other biodiversity metrics, indicating a positive short-term response to
treatments. In 2019, the 2009 and 2017 plots supported markedly higher plant species
richness and herbaceous cover compared to the 1978 and control plots, which were
dominated by evergreen huckleberry and overstory litter, respectively. Plant community
structure in the 2009 and 2017 plots will likely follow this trajectory towards shrub
Page 90
80
dominance near the time of canopy re-closure due to decreased light availability. Pacific
Northwest plant communities can begin to recover pre-disturbance conditions after 20-30
years (Halpern and Spies, 2008; Jules et al., 2008) and for redwood forests, after about 55
years post-thinning (Jules et al., 2008). Thus, because in many forest types this initial
pulse of understory plant diversity following thinning seems to diminish relatively
quickly due to increasing shrub dominance, if promoting the development of understory
vegetation is an objective of management, then multiple treatment entries to keep the
upper canopy open for light availability may be needed to stall shrub dominance (Hayes
et al., 1997) without having to wait decades for pre-disturbance vegetation communities
to re-establish.
Research in diverse western forest types have reported positive effects of thinning
treatments on avian communities (Verschuyl et al., 2011). Contrastingly, there was no
detectable influence of restoration on birds in this study, as evidenced by relatively
homogenous species richness and diversity across all plots. This trend may continue until
old-growth features such as large trees, large diameter branches, and multiple canopy
layers are present to create habitats suitable for a wider array of avian life. Based on the
diversity of birds detected in this study, it seems that Holter Ridge stands are developing
these characteristics. For example, the federally threatened marbled murrelet (Hayes et
al., 1997), a species dependent on large diameter branches for viable nesting platforms,
was observed in the 1978 plots. And, in addition to the commonly-observed mixed-
conifer-dependent bird species, the chestnut-backed chickadee (Poecile rufescens), a
species dependent on hardwoods, likely tanoak in this study, was recorded in all plots
Page 91
81
during both sampling years (Hayes et al., 1997). The presence of this species confirms
the existence of suitable habitat and forage for hardwood-dependent avian species at this
site and verifies that the management objective to create tanoak codominant redwood
forests has been met. Additional evidence that these stands are on track to support rich
bird diversity, the Pacific-slope flycatcher (Empidonax difficilis), a species typically less
abundant in treated stands (Hagar et al., 1996; Hayes et al., 1997), was observed in all
study plots, suggesting that despite treatments, suitable habitats and forage existed. Thus,
while thinning treatments can quicken growth in residual trees and increase herbaceous
plant diversity, it seems that these treatments are slow to quantifiably boost bird diversity.
Nevertheless, the treated and untreated second-growth stands on Holter Ridge do appear
to support a rich mixture of bird species.
Similar to bird diversity, mammal diversity was also relatively homogenous
across all plots, suggesting that animals may be slow to respond to changes in forest
structure in the wake of thinning treatments. In hardwood and mixed pine-oak forests in
West Virginia (Muzika et al., 2004), ponderosa pine forests in the Southwestern U.S.
(Converse et al., 2006), and mixed-conifer forests in Washington (Carey, 2003), research
has shown thinning generally has a positive influence on small mammal abundance.
Although mammal species detections suggest low diversity across Holter Ridge, sensitive
species such as the fisher, Roosevelt elk, and the Humboldt flying squirrel (Glaucomys
oregonensis) were observed in the 2009 plots. The latter species is typically associated
with old-growth forests and is also the primary prey for the northern spotted owl (Strix
occidentalis caurina), a threatened species (Carey, 1991). Additionally, by feeding
Page 92
82
primarily on truffles and spreading truffle spores throughout the forest, flying squirrels
promote mycorrhizal networks that enhance plant absorption of water and nutrients
(Carey, 2003). Still, wildlife diversity has been shown to positively correlate with the
complexity of understory vegetation in eastern Canadian boreal (Desrochers and Major,
2013) and Pacific Northwest (Hayes et al., 1997; Thysell and Carey, 2001) forests,
therefore, it could be decades before biodiversity of birds and mammals are restored.
Thus, while old-growth features such as nesting cavities and large branches to
support birds and arboreal rodents are necessary to support high levels of wildlife
diversity, it appears that second-growth redwood forests can nevertheless support a
diverse collection of bird and mammal species. However, despite the presence of
sensitive species, the Holter Ridge 40-year chronosequence suggests that although
treatments can accelerate old-growth features beneficial for wildlife habitat (Noss, 2000;
O’Hara et al., 2017), animals can be slow to respond to these changes. Compellingly,
crown manipulations in second-growth redwood trees, while time-consuming and
requiring specialized training to implement, may be an effective way to accelerate the
development of wildlife habitat in developing canopies (Sillett et al., 2018).
Page 93
83
CONCLUSIONS
In forests of the Pacific Northwest, restoration treatments can open the upper
canopy to accelerate the development of old-growth forest features (Carey and Curtis,
1996; Hayes et al., 1997; McComb et al., 1993). The lower Redwood Creek basin and the
Little Lost Man Creek subbasin in Redwood National Park have been identified as
reference ecosystems for historical old-growth redwood conditions (Fritschle, 2009;
Russell and Jones, 2001). Managers at RNP are currently focused on accelerating the
development of these features in overly dense and impaired second-growth forests using
prescribed thinning as a tool for restoration. Results from this study verify that restoration
treatments in this forest type can improve growth conditions for residual trees in both the
short- and long-term. Importantly, this work also demonstrates the usefulness of
physiological measurements for short-term assessments of treatment efficacy when
increases in breast height growth are often delayed numerous post-treatment years.
Given the complexity of redwood ecosystems, managers must balance not only
forest, watershed, and landscape management but also logistical, social, and bureaucratic
challenges to achieve their objectives. Objectives could be achieved with a simplified
restoration process involving multiple-entries at regular intervals (e.g., six- to 10-year
cycles) with low-severity basal area reduction (10 – 25%) treatments that terrace down
stand density until historical old-growth conditions are reached. Canopy gaps created in
the overstory could provide light for patches of herbaceous understory to develop,
potentially benefiting wildlife, yet most of the stand would remain shaded, possibly
Page 94
84
suppressing Douglas-fir, a restoration objective of RNP for over 40 years (Veirs and
Lennox, 1982). The logistical reality is that each thinning cycle would require its own
series of consultations with regulatory agencies, fish and wildlife surveys, and possibly
Environmental Assessments. Thus, multiple-entry low-severity thinning treatments
would be expensive and time consuming to plan, prepare, and execute. Furthermore,
RNPs watershed management program is actively removing existing logging road
systems, accessing stands in need of restoration in the future may become difficult once
these roads are restored. Therefore, restoring areas of RNP concurrently with road
removal could reduce future ecosystem impacts and costs of building new skid roads
and/or having to use lop-and-scatter slash treatments.
Given the widespread need for restoration across RNP, managers are limited to
prescribing one-time single-entry treatments. Although VDT is complex and requires a
tremendous amount of time and resources to plan, prepare, and execute (O’Hara et al.,
2012), this treatment is a more holistic approach to restoration, fostering tree growth and
biodiversity of plants and animals (Carey, 2003). To realize RNPs objective to accelerate
the development of old-growth features in impaired second-growth forests, VDT seems
to be best-suited approach. Therefore, a future study of long-term tree growth and
biodiversity responses to the VDT treatment would help determine if the greater effort,
cost, and implementation-time are warranted as compared to traditional low-thin
treatments.
Page 95
85
LITERATURE CITED
Chapter 1: Endnotes
1 Senate Congressional Record. September 19, 1968. Section 3(b): Paragraph 1. This paragraph
thus provides for a legislative taking by the United States of all right, title and interest in
lands within the park boundaries. URL https://www.govinfo.gov/content/pkg/GPO-
CRECB-1968-pt21/pdf/GPO-CRECB-1968-pt21-3-1.pdf
2 Dewitt, J.B., 1982. California Redwood Parks and Preserves: a Guide to the Redwood Parks and
a Brief History of the Efforts to Save the Redwoods. Save the Redwoods League, p. 7.
HumCo F868.R4 D485
3 Northern California Indian Development Council. Local Northwest California Tribes.
https://www.ncidc.org/NWCA_Tribal_Map_and_Info (accessed 3 Mar. 2020).
4 Huntsinger, L; McCaffrey, S.; Watt, L.; Lee, M., 1994. A Yurok Forest History. University of
California at Berkeley.
5 Idib.
6 Warburton, A.D., Endert, J.F., 1966. Indian Lore of the North California Coast. Pacific Pueblo
Press, p. 50. HumCo E78 C15 W35
7 Ibid., p. 50
8 A Yurok Forest History. p. 53.
9 Gates, T.M., 1995. Along the Ridgelines: A History of the Yurok Trail Systems
(Doctoral dissertation). University of North Carolina, p. 135.
10 Thompson, L., 1913. To the American Indian: Reminiscences of a Yurok Woman. Borgo
Press, p. 51. HumCo E99.Y97 T47 1991*
11 A Yurok Forest History. p. 51.
12 Idib., p. 53.
13 Idib., p. 31.
14 Idib., p. 29.
Page 96
86
15 Horsman, R., 1986. Race and Manifest Destiny: The Origins of American Racial Anglo-
Saxonism. Harvard University Press, p. 2.
16 Kimmerer, R.W., Lake, F.K., 2001. The Role of Indigenous Burning in Land Management,
Journal of Forestry. 99, p. 3.
17 Dewitt, p. 8.
18 Kimmerer, p. 36.
19 The Yurok Tribe official website. URL www.yuroktribe.org/culture/culture.htm
(accessed 17 Feb. 2020).
20 The Inflation Calculator. URL https://westegg.com/inflation/ (accessed 9 Mar. 2020).
21 The Preemption Act of 1841. 27th Congress, Sess. 1. ch. 16, 5 Stat. 453.
22 The Homestead Act of 1862. 37th Congress, Sess. 2. ch. 75, 12 Stat. 392.
23 The Inflation Calculator.
24 The Timber and Stone Act of 1878. 45th Congress, Sess. 2. ch. 151, 20 Stat. 89.
25 Dewitt, p. 8.
26 The Inflation Calculator.
27 Nixon, S., 1966. Redwood Empire. Galahad Books, pp. 178-179. HumCo F861.N5
28 Puter, S.A.D; Stevens, H., 1908. Looters of the Public Domain. The Portland Printing House.
p. 46.
29 Idib., p. 80.
30 Nixon, p. 238.
31 Nixon, p. 178.
32 Mill Companies. 23 Sept. 1854. The Humboldt Times.
33 Nixon, pp. 178-179.
34 Fisher, R.T., 1903. The Redwood. Vol. 38, Washington DC Government Printing Office.
p. 19. HumCo SD397.R3 U56
Page 97
87
35 Kellogg, A., 1884. Redwood and Lumbering in California Forests, with Illustrations. Edgar
Cherry & Co., p. 39. HumCo SD397.R3 R3
36 Dewitt, p. 8.
37 Kellogg, p. 50.
38 Fisher, p. 19.
39 Palmquist Collection. Workers Pose with Ox Teams Ready to Pull Logs. Photo ID:
2003.01.0458. URL
http://library.humboldt.edu/humco/holdings/photodetail.php?R=17&S=oxen&CS
=All%20Collections&RS=ALL%20Regions&PS=Any%20Photographer&ST=A
LL%20words&SW=&C=40 (accessed 10 Jan. 2020).
40 Hittell, J.S., 1866. The Resources of California: Comprising the Society, Climate,
Salubrity, Scenery, Commerce and Industry of the State, 2nd ed. A. Roman and
Company, pp. 306-307.
41 Bearss, E.C., 1982. History Basic Data: Redwood National Park, DelNorte and
Humboldt Counties, California. U.S. Dept. of the Interior, National Park Service,
Division of History, Office of Archeology and Historic Preservation, p. 161. HumCo
F868.D4 B3 1982
42 Baker, J.R. Swanlund-Baker collection. Donkey and Engine Crew. Photo ID: 1999.01.0129.
URL http://library.humboldt.edu/humco/holdings/photodetail.php?R=3&S=steam%20d
onkey&CS=All%20Collections&RS=ALL%20Regions&PS=Any%20Photograph
er&ST=ALL%20words&SW=&C=122 (accessed 10 Feb. 2020).
43 Ibid., p. 186.
44 Redwood Lumber Manufacturers Association, p. 46.
45 Fradkin, P.L., 2006. The Great Earthquake and Firestorms of 1906. California Historical
Society, p. 246. HumCo F868.S357 F735 2005
46 Ibid., p. 210.
47 Ibid., p. 246.
48 Dewitt, p. 8.
49 Bearss, p. 189.
50 Wilson, P.G., 2001. The Legacy of the Log Boom Humboldt Count Logging from 1945 to
1955. Humboldt Digital Scholar, pp. 8-9. HumCo F868.H8 B37 2001 51 Bearss, p. 189.
Page 98
88
52 Boyle collection. Pre-World War II Tractor in Woods. Photo ID: 1999.03.0976. URL
http://library.humboldt.edu/humco/holdings/photodetail.php?S=tractor&CS=All%
20Collections&RS=ALL%20Regions&PS=Any%20Photographer&ST=ALL%20
words&SW=&C=15&R=8 (accessed 10 Feb. 2020).
53 Dewitt, p. 8.
54 The Inflation Calculator.
55 Idib.
56 Dunbar, I.R., 28 July 1964. A Bargain in Timber. Reflections of Del Norte County. The Del
Norte County Historical Society Bulletin. HumCo F868.D4 D4
57 Hannum, W.T., 27-28 May 1949, Redwood Region Logging Conference. Proceedings from
the 11th Annual Meeting and Equipment Show. Municipal Auditorium; Eureka, CA.
HumCo SD538.R44 1949
58 Dewitt, p. 8.
59 Schrepfer, S.R., 1983. The Fight to Save the Redwoods: A History of the Environmental
Reform, 1917-1978. University of Wisconsin Press, p. 108. HumCo SD397.R3 S37
1983
60 Idib., p. 33.
61 Palmquist collection. Clear Cut Hillside, Train on Trestle Loaded with Logs. Photo ID:
2003.01.0672. URL
http://library.humboldt.edu/humco/holdings/photodetail.php?R=5&S=train%20on
%20trestle%20loaded%20with%20logs&CS=All%20Collections&RS=ALL%20
Regions&PS=Any%20Photographer&ST=ALL%20words&SW=&C=10
(accessed 10 Feb. 2020).
62 Reid, K. June 2004. Happy days – for petroleum marketers, the 1950s lived up to the
nostalgia. National Petroleum News. pp. 24-25.
63 Batten, C. October 1979. The Second Battle of the Redwoods. URL
https://reason.com/1979/10/01/the-second-battle-of-the-redwo/
64 Ibid., pp. 27-28.
65 Dewitt, p. 9.
66 Assembly of the State of California, 1967. Conflict in the Redwoods. California
Assembly Committee Reports, 1965-67, Part 1, p. 28. HumCo L500.N3 1967
Page 99
89
67 The Redwoods: A National Opportunity for Conservation and Alternatives for Action, p. 37.
68 Ibid., p. 30 & 36.
69 Ibid., pp. 50-51.
70 Ibid., p. 37.
71 A Compromise Solution. 20 Sept. 1968. The Times-Standard, Eureka, CA, p. 4.
72 Hofsted, E.A., 2 Oct. 1964. Government Ownership, Economic Effects on Private
Industry. Presentation to the Society of American Foresters. Eureka, CA, HumCo
F868.R4 H8 Vol. 1
73 Laudenschlager, K.F., 1 Oct. 1964. Redwood National Park: Truths and Consequences.
Presentation to the Fortuna Rotary Club. HumCo F868.R4 H8 Vol. 1
74 The Inflation Calculator.
75 Truths and Consequences.
76 Chapman, L.J., 2 Oct. 1964. Presentation to the Orick Chamber of Commerce. Subject:
The Redwood National Park Proposal, pp. 1-10. HumCo F868.R4 H8 Vol. 1
77 Comments and Suggestions of Board of Supervisors of Humboldt County Pertaining to
Interim Report Concerning National Park Service Study of Coast Redwoods of
Northern California. 27 Oct. 1964. HumCo F868.R4 H8 Vol. 3
78 Del Norte County Board of Supervisors, 5 Oct. 1964. Letter to President Lyndon
Johnson regarding economic impact from proposed park. HumCo F868.R4 H8 Vol. 3
79 Northern California Section of the Society of American Foresters, Nov. 1964. A Review
of “The Redwoods.” HumCo F868.R4 H8 Vol. 6
80 Redwood Park and Recreation Committee, 1965. The Redwood Park and Recreation Plan.
Eureka, CA. HumCo F868.R4 H8 Vol. 3
81 Redwood Park Opponents Hit by SSC Professor. 7 Feb. 1965. Press Democrat, Santa Rosa,
CA.
82 Bumper sticker advertising the Redwood Park and Recreation Plan. HumCo F868.R4 H8 Vol.
6
83 Carlton, D., 12 Sept. 1968. Indians Charge New Park Steals Klamath Property. The Times-
Standard.
Page 100
90
84 CQ Almanac 1968, 24th ed., 11-434-11-439. Congress Clears Redwood National Park Bill.
Washington, DC. Congressional Quarterly.
85 Senate Congressional Record. September 19, 1968. 27578.
86 The Inflation Calculator.
87 Congress Clears Redwood National Park Bill.
88 Batten.
89 Public Law 90-545. An Act to establish a Redwood National Park in the State of
California, and for other purposes. S 2515 § 2(a) (90th). URL
https://www.govtrack.us/congress/bills/90/s2515/text
90 Schrepfer, pp. 186-189.
91 Bayside Timber Co. v. San Mateo County Board of Supervisors, Sept. 1971. Civ. No. 28244.
California First Appellate District, Division One.
92North Coast Timber Association, 10 Jan. 1972. Facts and Fiction About the Redwood Forests
Responsible Citizens Should Know Which is Which, p. 6.
93 Z’Berg Nejedly Forest Practice Act, 1973. Division 4, Chapter 8, Public Resources Code,
State of California, Sacramento, CA [§4551(a), §4581].
94 National Resources Defense Council, Inc. v. Arcata National Corp., 1976. 1 Civ. No. 37555
(Cal. Ct. App. July 8, 1976) URL https://elr.info/sites/default/files/litigation/6.20623.htm
95 Ibid., pp. 205-215.
96 Associated California Loggers, 1977. Enough is Enough. Video. Runtime: 17:02. URL
https://archive.org/details/carcht_000047 (accessed 10 Feb. 2020).
97 Idib., Time: 15:08.
98 The Inflation Calculator.
99 Schrepfer, p. 226.
100 Redwood National Park Expansion Act. 27 Mar. 1978. Public Law 95-250. 92 Stat. 163.
Title 1, Sec. 104(b).
101 Save the Redwoods League official website. URL
https://www.savetheredwoods.org/project/redwoods-rising/ (accessed 1 Feb 2020).
Page 101
91
102 National Park Service official webpage. Frequently Asked Questions. URL
https://www.nps.gov/redw/faqs.htm (accessed 2 Mar. 2020).
103 Veirs, S.D., Lennox, W.S., 1982. Rehabilitation and Long-Term Park Management of Cutover
Redwood Forests: Problems of Natural Succession. Symposium of Watershed
Rehabilitation in Redwood National Park and Other Pacific Coastal Areas. Arcata, CA.
On file in Redwood National Park, Arcata, CA.
104 Teraoka, J.R., Aug. 2012. Forest Restoration at Redwood National Park: A Case Study of an
Emerging Program. General Technical Report PSW-GTR-238.
105 National Park Service official website. URL
https://www.nps.gov/redw/learn/nature/loggingroads.htm (accessed 22 Jan. 2020).
106 Save the Redwoods League official website. URL
https://www.savetheredwoods.org/project/redwoods-rising/ (accessed 10 May 2020). 107 Love, S., Rufe, J., 2001. Orick, CA, U.S.A. Renderville Productions. DVD-R video, 48
minutes.
108 United States Census Bureau webpage. URL
https://factfinder.census.gov/faces/nav/jsf/pages/community_facts.xhtml?src=bkmk
(accessed 18 Feb. 2020).
109 Anderson, K., 2005. Tending the Wild: Native American Knowledge and the Management of
Californias Natural Resources. University of California Press. p. 312. HumCo E78.C15
A676 2004
110 Yurok official website. URL http://www.yuroktribe.org/departments/forestry/forestry.htm
(accessed 31 Mar. 2020).
111 Karuk official website. URL https://www.karuk.us/index.php/departments/natural-
resources/132-dnr-ecrmp (accessed 31 Mar. 2020).
112 House of Representatives official webpage. URL https://huffman.house.gov/media-center/in-
the-news/yurok-lands-act-introduced-by-huffman (accessed 1 Mar. 2020).
Chapter 2: Literature Cited
Page 102
92
Berrill, J.P., Beal, C.B., LaFever, D.H., Dagley, C.M., 2013. Modeling young stand development
towards the old-growth reference condition in evergreen mixed-conifer stands at
Headwaters Forest Reserve, California. Forests 4, 455–470.
https://doi.org/10.3390/f4020455
Burns, E.E., Campbell, R., Cowan, P.D., 2018. State of Redwoods Conservation Report. San
Francisco.
California State Park and Recreation Commission, Service, N.P., 2000. Redwood State and
National Parks General Management Plan.
Callahan, C., 2019. Effects of Thinning and Prescribed Burning on Tree Resistance to Extreme
Drought in a Sierra Nevada Mixed-Conifer Forest, California USA (master’s thesis).
Humboldt State University.
Carey, A.B., 2003. Biocomplexity and restoration of biodiversity in temperate coniferous forest:
inducing spatial heterogeneity with variable-density thinning. Forestry 76, 127–136.
https://doi.org/10.1093/forestry/76.2.127
Carey, A.B., 1991. The biology of arboreal rodents in Douglas-Fir forests, US Department of
Agriculture, Forest Service. Portland. https://doi.org/10.2737/PNW-GTR-276
Carey, A.B., Curtis, R.O., 1996. Conservation of biodiversity: A useful paradigm for forest
ecosystem management. Wildl. Soc. Bull. 24, 610–620.
Chittick, A.J., 2005. Stand Structure and Development Following Thinning in a Second-Growth
Forest, Redwood National Park (master’s thesis). Humboldt State University.
Chittick, A.J., Keyes, C.R., 2007. Holter Ridge thinning study, Redwood National Park:
Preliminary results of a 25-year retrospective. USDA Forest Service, General Technical
Report. PSW-GTR-194.
Cole, E., Newton, M., Bailey, J.D., 2017. Understory vegetation dynamics 15 years post-thinning
in 50-year-old Douglas-fir and Douglas-fir/western hemlock stands in western Oregon,
USA. For. Ecol. Manage. 384, 358–370. https://doi.org/10.1016/j.foreco.2016.11.003
Converse, S.J., White, G.C., Block, W.M., 2006. Small mammal responses to thinning and
wildfire in ponderosa pine–dominated forests of the Southwestern United States. J. Wildl.
Manage. 70, 1711–1722. https://doi.org/10.2193/0022-541x(2006)70[1711:smrtta]2.0.co;2
Dagley, C.M., Berrill, J.P., Leonard, L.P., Kim, Y.G., 2018. Restoration thinning enhances
growth and diversity in mixed redwood/Douglas-fir stands in northern California, U.S.A.
Restor. Ecol. 1–10. https://doi.org/10.1111/rec.12681
Desrochers, A., Major, M., 2013. Wildlife-mitigated precommercial thinning maintains the
Page 103
93
abundance of fruit shrubs in a boreal forest. Can. J. For. Res. 43, 306–310.
https://doi.org/10.1139/cjfr-2012-0422
Dewitt, J.B., 1982. California redwood parks and preserves. Save the Redwoods League, San
Francisco.
Duniway, J.M., 1971. Comparison of pressure chamber and thermocouple psychrometer
determinations of leaf water status in tomato. Plant Physiol. 48, 106–107.
https://doi.org/10.1104/pp.48.1.106
Fritschle, J.A., 2009. Pre-EuroAmerican settlement forests in Redwood National Park, California,
USA: A reconstruction using line summaries in historic land surveys. Landsc. Ecol. 24,
833–847. https://doi.org/10.1007/s10980-009-9361-9
Gauthier, M.M., Jacobs, D.F., 2009. Short-term physiological responses of black walnut (Juglans
nigra L.) to plantation thinning. For. Sci. 55, 221–229.
https://doi.org/10.1093/forestscience/55.3.221
Goodwin, M.J., North, M.P., Zald, H.S.J., Hurteau, M.D., 2018. The 15-year post-treatment
response of a mixed-conifer understory plant community to thinning and burning
treatments. For. Ecol. Manage. 429, 617–624. https://doi.org/10.1016/j.foreco.2018.07.058
Hagar, J.C., Mccomb, W.C., Emmingham, W.H., 1996. Bird communities in commercially
thinned and unthinned Douglas-fir stands of western Oregon. Wildl. Soc. Bull. 24, 353–366.
https://doi.org/10.1139/cjfr-31-9-1513
Halpern, C.B., Spies, T.A., 2008. Plant species diversity in natural and managed forests of the
Pacific Northwest. Ecol. Appl. 5, 913–934. https://doi.org/137.150.34.41
Harrington, C.A., Reukema, D.L., 1983. Initial shock and long-term stand development following
thinning in a Douglas-fir plantation. For. Sci. 29, 33–46.
Hayes, B.J.P., Chan, S., Emmingham, H., Tappeiner, C., Kellogg, L.D., Bailey, D., 1997.
Wildlife response to thinning young forests in the Pacific Northwest. J. For. 95, 28–33.
https://doi.org/doi.org/10.1093/jof/95.8.28
Johnstone, J.A., Dawson, T.E., 2010. Climatic context and ecological implications of summer fog
decline in the coast redwood region. Proc. Natl. Acad. Sci. U. S. A. 107, 4533–4538.
https://doi.org/10.1073/pnas.0915062107
Jules, M.J., Sawyer, J.O., Jules, E.S., 2008. Assessing the relationships between stand
development and understory vegetation using a 420-year chronosequence. For. Ecol.
Manage. 255, 2384–2393. https://doi.org/10.1016/j.foreco.2007.12.042
Kerhoulas, L.P., Kolb, T.E., Hurteau, M.D., Koch, G.W., 2013. Managing climate change
adaptation in forests: A case study from the U.S. Southwest. J. Appl. Ecol. 50, 1311–1320.
Page 104
94
https://doi.org/10.1111/1365-2664.12139
King, G.M., Gugerli, F., Fonti, P., Frank, D.C., 2013. Tree growth response along an elevational
gradient: Climate or genetics? Oecologia 173, 1587–1600. https://doi.org/10.1007/s00442-
013-2696-6
Kolb, T.E., Holmberg, K.M., Wagner, M.R., Stone, J.E., 1998. Regulation of ponderosa pine
foliar physiology and insect resistance mechanisms by basal area treatments. Tree Physiol.
18, 375–381. https://doi.org/10.1093/treephys/18.6.375
Koopman, M., DellaSala, D., van Mantgem, P., Blom, B., Teraoka, J., Shearer, R., LaFeber, D.,
Seney, J., 2014. Managing an ancient ecosystem for the modern world: Coast redwoods and
climate change. Geo-Institute 25. 1-27.
Lagergren, F., Jönsson, A.M., Linderson, H., Lindroth, A., 2019. Time shift between net and
gross CO2 uptake and growth derived from tree rings in pine and spruce. Trees 33, 765–
776. https://doi.org/10.1007/s00468-019-01814-9
Lalemand, L., 2018. Restoration and Tree Drought Resistance in Coast Redwood-Douglas-fir
Forests at Redwood National Park, California (master’s thesis). Humboldt State University.
Larsson, S., Dannell, K., 2010. Science and the management of boreal forest diversity. Scand. J.
For. Res. 16(2), 5-9. https://doi.org/10.1080/028275801300090528
Latham, P., Tappeiner, J., 2002. Response of old-growth conifers to reduction in stand density in
western Oregon forests. Tree Physiol. 22, 137–146. https://doi.org/10.1093/treephys/22.2-
3.137
Lindenmayer, D.B., Franklin, J.F., 2002. Conserving Forest Biodiversity: A Comprehensive
Multiscaled Approach. Island Press, Washington, D.C.
Litvak, E., McCarthy, H.R., Pataki, D.E., 2011. Water relations of coast redwood planted in the
semi-arid climate of southern California. Plant, Cell Environ. 34, 1384–1400.
https://doi.org/10.1111/j.1365-3040.2011.02339.x
McComb, W.C., Spies, T.A., Emmingham, W.H., 1993. Douglas-fir forests: Managing for timber
and mature-forest habitat. J. For. 91, 31–42. https://doi.org/10.1093/jof/91.12.31
McDowell, N., Brooks, J.R., Fitzgerald, S.A., Bond, B.J., 2003. Carbon isotope discrimination
and growth response of old Pinus ponderosa trees to stand density reductions. Plant, Cell
Environ. 26, 631–644. https://doi.org/10.1046/j.1365-3040.2003.00999.x
Milliron, L.K., Olivos, A., Saa, S., Sanden, B.L., Shackel, K.A., 2018. Dormant stem water
potential responds to laboratory manipulation of hydration as well as contrasting rainfall
field conditions in deciduous tree crops. Biosyst. Eng. 165, 2–9.
Page 105
95
https://doi.org/10.1016/j.biosystemseng.2017.09.001
Muldavin, E.H., Lenihan, J.M., Lennox, W.S., Veirs, S.D., 1981. Vegetation succession in the
first ten years following logging of the coast redwood forests. U.S. Department of Interior,
National Park Service, Redwood National Park, Technical Report No. 6.
Muzika, R.M., Grushecky, S.T., Liebhold, A.M., Smith, R.L., 2004. Using thinning as a
management tool for gypsy moth: The influence on small mammal abundance. For. Ecol.
Manage. 192, 349–359. https://doi.org/10.1016/j.foreco.2004.01.043
National Oceanic and Atmospheric Administration [https://www.ncdc.noaa.gov/cdo-
web/datatools/normals], 2019.
Nixon, S., 1966. Redwood Empire. Galahad Books.
Noss, R., 2000. The Redwood Forest: History, Ecology, and Conservation of the Coast
Redwoods. Island Press, San Francisco.
O’Hara, K.L., Cox, L.E., Nikolaeva, S., Bauer, J.J., Hedges, R., 2017. Regeneration dynamics of
coast redwood, a sprouting conifer species: a review with implications for management and
restoration. Forests 8, 1–19. https://doi.org/10.3390/f8050144
O’Hara, K.L., Leonard, L.P., Keyes, C.R., 2012. Variable-density thinning and a marking
paradox: comparing prescription protocols to attain stand variability in coast redwood.
West. J. Appl. For. 27, 143–149. https://doi.org/10.5849/wjaf.11-042
O’Hara, K.L., Narayan, L., Cahill, K.G., 2015. Twelve-year response of coast redwood to
precommercial thinning treatments. For. Sci. 61, 780–789. https://doi.org/10.5849/forsci.14-
178
O’Hara, K.L., Nesmith, J.C.B., Leonard, L., Porter, D.J., 2010. Restoration of old forest features
in coast redwood forests using early-stage variable density thinning. Restor. Ecol. 18, 125–
135. https://doi.org/10.1111/j.1526-100X.2010.00655.x
Oliver, D.D., Larson, B.C., 1996. Forest Stand Dynamics, Updated Edition. John Wiley & Sons,
New York. https://doi.org/10.1093/forestscience/42.3.397
Reukema, D., 1959. Missing annual rings in branches of young-growth Douglas-fir. Ecology 40,
480–482. https://doi.org/doi.org/10.2307/1929767
Roberts, S.D., Harrington, C.A., 2008. Individual tree growth response to variable-density
thinning in coastal Pacific Northwest forests. For. Ecol. Manage. 255, 2771–2781.
https://doi.org/10.1016/j.foreco.2008.01.043
Runkle, J.R., Natural, S., Journal, A., Deciduous, O.T., 2018. Gap dynamics of old-growth
Page 106
96
Eastern forests : Management implications. Nat. Areas J. 11, 19–25.
https://doi.org/137.150.34.41
Russell, W.H., Jones, C., 2001. The effects of timber harvesting on the structure and composition
of adjacent old-growth coast redwood forest, California, USA. Landsc. Ecol. 16, 731–741.
https://doi.org/10.1023/A:1014486030462
Sarr, D., Puettmann, K., Pabst, R., Cornett, M., Arguello, L., 2004. Restoration ecology: New
perspectives and opportunities for forestry. Restor. Ecol. 102, 20–24.
https://doi.org/10.1093/jof/102.5.20
Schmid, J.M., Mata, S.A., Watkins, R.K., Kaufmann, M.R., 1991. Water potential in ponderosa
pine stands of different growing-stock levels. Can. J. For. Res. 21, 750–755.
https://doi.org/10.1139/x91-107
Scott, A.D., Stenz, N.W.M., Ingvarsson, P.K., Baum, D.A., 2016. Whole genome duplication in
coast redwood (Sequoia sempervirens) and its implications for explaining the rarity of
polyploidy in conifers. New Phytol. 211, 186–193. https://doi.org/10.1111/nph.13930
Simonin, K., Kolb, T.E., Montes-Helu, M., Koch, G.W., 2006. Restoration thinning and influence
of tree size and leaf area to sapwood area ratio on water relations of Pinus ponderosa. Tree
Physiol. 26, 493–503. https://doi.org/10.1093/treephys/26.4.493
Skov, K.R., Kolb, T.E., Wallin, K.F., 2005. Difference in radial growth response to restoration
thinning and burning treatments between young and old ponderosa pine in Arizona. West. J.
Appl. For. 20, 36–43. https://doi.org/10.1093/wjaf/20.1.36
Skov, K.R., Kolb, T.E., Wallin, K.F., 2004. Tree size and drought affect ponderosa pine
physiological response to thinning and burning treatment. For. Sci. 50, 81–91.
https://doi.org/10.1093/forestscience/50.1.81
Sohn, J.A., Saha, S., Bauhus, J., 2016. Potential of forest thinning to mitigate drought stress: A
meta-analysis. For. Ecol. Manage. 380, 261–273.
https://doi.org/10.1016/j.foreco.2016.07.046
Stokes, M.A., Smiley, T.L., 1968. An Introduction to Tree-Ring Dating. University of Chicago
Press, Chicago.
Stuart, J.D., Sawyer, J.O., 2001. Trees and Shrubs of California, 1st ed. University of Caliornia
Press.
Teraoka, J.R., 2012. Forest restoration at Redwood National Park: a case study of an emerging
program, Proceedings of the coast redwood forests in a changing California: a symposium
for scientists and managers. Albany.
Teraoka, J.R., Keyes, C.R., 2011. Low thinning as a forest restoration tool at Redwood National
Park. West. J. Appl. For. 26, 91–93. https://doi.org/10.1093/wjaf/26.2.91
Page 107
97
Thomas, S.C., Halpern, C.B., Falk, D.A., Liguori, D.A., Austin, K.A., 1999. Plant diversity in
managed forests: Understory responses to thinning and fertilization. Ecol. Appl. 9, 864–879.
https://doi.org/10.1890/1051-0761(1999)009[0864:PDIMFU]2.0.CO;2
Thornburgh, D. A., Noss, R.F., Agelides, D.P., Olson, C.M., Euphrat, F., H. H. Welsh, J., 2000.
Managing Redwoods. Island Press, Washington, D.C.
Thornburgh, Dale A., Noss, R.F., Angelides, D.P., Olson, C.M., Euphrat, F., Welsh Jr., H.H.,
2000. Managing Redwoods, in: The Redwood Forest. Island Press, Covelo, pp. 229–261.
Thysell, D.R., Carey, A.B., 2001. Manipulation of density of Pseudotsuga menziesii canopies:
preliminary effects on understory vegetation. Can. J. For. Res. 31, 1513–1525.
https://doi.org/10.1139/cjfr-31-9-1513
Valverde, T., Silvertown, J., 2019. Canopy closure rate and forest structure. Ecology 78, 1555–
1562. https://doi.org/137.150.34.41
Veirs, S.D., 1986. Redwood second-growth forest stand rehabilitation study, Redwood National
Park: Evaluation of 1978-79 thinning experiments. On file, Redwood National Park, Orick,
CA.
Veirs, S.D., Lennox, W.S., 1982. Rehabilitation and long-term park management of cutover
redwood forest; problems of natural succession. On file, Redwood National Park, Orick,
CA.
Verschuyl, J., Riffell, S., Miller, D., Wigley, T.B., 2011. Biodiversity response to intensive
biomass production from forest thinning in North American forests - A meta-analysis. For.
Ecol. Manage. 261, 221–232. https://doi.org/10.1016/j.foreco.2010.10.010
Williams, A.P., Seager, R., Abatzoglou, J., Cook, B., Smerdon, J., Cook, E., 2015. Contribution
of anthropogenic warming to California drought during 2012 – 2014. Geophys. Res. Lett.
42, 6819–6828. https://doi.org/10.1002/2015GL064924.Received
Woodward, B.D., Romme, W.H., Evangelista, P.H., 2020. Early postfire response of a northern
range margin coast redwood forest community. For. Ecol. Manage. 462, 117966.
https://doi.org/10.1016/j.foreco.2020.117966
Wright, G.C., Rahmianna, A., Hatfield, P.M., 1988. A comparison of thermocouple psychrometer
and pressure chamber measurements of leaf water potential in peanuts. Exp. Agric. 24, 355–
359. https://doi.org/10.1017/S0014479700016203