Quarterly Journal of International Agriculture 52 (2013), No. 1: 51-77 Quarterly Journal of International Agriculture 52 (2013), No. 1; DLG-Verlag Frankfurt/M. Efficiency and Total Factor Productivity Growth in Indian Dairy Sector Ramphul Ohlan Maharshi Dayanand University, Rohtak, Haryana, India Abstract This paper assesses the total factor productivity (TFP) growth and efficiency levels in the Indian dairy processing industry using the Tornqvist index and data envelopment analysis (DEA) models over the period 1980-2008. We utilize a different empirical approach and extend the data sets. To examine the nature of scale inefficiency, non- increasing returns to scale DEA frontier is used. Our results suggest that total factor productivity in the Indian dairy processing industry has grown significantly. An average technical efficiency level of 72% which implies approximately a 38% inefficiency level is observed from the study. The decomposition of TFP growth indicates that growth is driven more by technical efficiency changes than by scale efficiency. Highest input slacks are observed for working capital. We note that a devaluation in terms of real effective exchange rate, profitability, export and import penetration and research stock play a significant role in explaining the productivity growth in the Indian dairy industry. The non-increasing returns to scale DEA frontier analysis suggests that on an average scale inefficiency is due to increasing returns to scale. Finally, it is noticed that in India, a high volume of milk does not reach to milk processing plants. It is suggested that for efficient utilization of existing processing capacity in dairy plants, a systematic investment is needed in logistics of raw milk collection and infrastructure development. The European model may be used as a benchmark in strengthening milk farmers for increasing farm size and building own processing capacity. Keywords: dairy, India, technical efficiency, scale efficiency, Europe JEL: Q10, C22, C61, L66 1 Introduction Dairy in India has witnessed a remarkable growth with the successful implementation of the White Revolution programme in conjunction with other dairy development programmes implemented by the state and central governments, and increased demand
Transcript
Quarterly Journal of International Agriculture 52 (2013), No. 1: 51-77
Quarterly Journal of International Agriculture 52 (2013), No. 1; DLG-Verlag Frankfurt/M.
Efficiency and Total Factor Productivity Growth in Indian Dairy Sector
Ramphul Ohlan Maharshi Dayanand University, Rohtak, Haryana, India
Abstract
This paper assesses the total factor productivity (TFP) growth and efficiency levels in the Indian dairy processing industry using the Tornqvist index and data envelopment analysis (DEA) models over the period 1980-2008. We utilize a different empirical approach and extend the data sets. To examine the nature of scale inefficiency, non-increasing returns to scale DEA frontier is used. Our results suggest that total factor productivity in the Indian dairy processing industry has grown significantly. An average technical efficiency level of 72% which implies approximately a 38% inefficiency level is observed from the study. The decomposition of TFP growth indicates that growth is driven more by technical efficiency changes than by scale efficiency. Highest input slacks are observed for working capital. We note that a devaluation in terms of real effective exchange rate, profitability, export and import penetration and research stock play a significant role in explaining the productivity growth in the Indian dairy industry. The non-increasing returns to scale DEA frontier analysis suggests that on an average scale inefficiency is due to increasing returns to scale. Finally, it is noticed that in India, a high volume of milk does not reach to milk processing plants. It is suggested that for efficient utilization of existing processing capacity in dairy plants, a systematic investment is needed in logistics of raw milk collection and infrastructure development. The European model may be used as a benchmark in strengthening milk farmers for increasing farm size and building own processing capacity.
Keywords: dairy, India, technical efficiency, scale efficiency, Europe JEL: Q10, C22, C61, L66
1 Introduction
Dairy in India has witnessed a remarkable growth with the successful implementation of the White Revolution programme in conjunction with other dairy development programmes implemented by the state and central governments, and increased demand
52 Ramphul Ohlan
Quarterly Journal of International Agriculture 52 (2013), No. 1; DLG-Verlag Frankfurt/M.
driven by increased population, higher incomes, growing urbanization, export opportunities and changing food habits, including heightened awareness about the benefits of milk (GAUTAM and PATHAK, 2010; SINGH, 2011; OHLAN, 2011). This evolution was accompanied by even a more marked increase in the number of dairy species and improvement in milk yields. It has transformed India from a country of acute milk shortage to the world’s top producer with production of 117 million tonnes in 2010, accounting for 16.03% of the world’s total milk production. Indeed, the dairy sector has a strong influence on millions of Indians’ health and on the long-term welfare of society, and often has a major impact on gainful employment in the rural sector, particularly among landless labourers, small and marginal farmers and women. Further, in dry-lands and mountain ecosystems, the livestock sector contributes anywhere between 50 to 75% of total household incomes of the rural population (PLANNING COMMISSION, 2011).
In the recent years, demand for dairy products has increased considerably across all household groups: rural, urban, rich and poor. Over the next decade dairy products demand is projected to grow at 5% per annum, while milk production has grown at about 3.5% annually in the recent past. Improving productivity of the dairy industry to meet the projected demand is a key developmental challenge facing the Indian dairy sector.
Milk production is an integral component of Indian agriculture supporting the livelihood of more than two-thirds of the rural population. India exhibits co-existing organized (cooperatives and modern-style private factories, including multinationals) and unorganized (private milk vendors, traditional halwais) sectors for marketing of milk and dairy products. The dairy cooperatives comprise the single largest formal organization in terms of market share and its share in total milk procurement. However, the informal sector still plays an important role in the Indian dairy sector as a supplier of good quality fresh milk. Cooperative and private sectors share nearly half-and-half of the marketable milk surplus. However, the cooperative sector sells liquid milk more than milk products unlike the private processors who produce more of dairy products. Unless India’s dairy production increases at the pace required, there is a possibility of a widening gap in the supply of milk products, which can lead to a dependency on imports.
Milk is highly perishable and requires immediate processing, storage and preservation, to move it from production areas to demand centres. Processing and market linkages are, therefore, prerequisites for value creation and addition. It is now well-known that development of milk processing infrastructure like silos, pasteurizers, storage tanks and refrigerators has increased the nation’s capacity to convert milk, a highly perishable commodity, into a commodity that may be stored and traded worldwide.
Efficiency and Total Factor Productivity Growth in Indian Dairy Sector 53
Quarterly Journal of International Agriculture 52 (2013), No. 1; DLG-Verlag Frankfurt/M.
Being the world’s largest producer and consumer of milk products, India represents one of the most lucrative dairy processing industries. The industry has been recorded an annual growth of 4% during the period 1990-2008, which is almost 3 times the average growth rate of the dairy industry in the world at large. The dairy industry in India is the second most important segment of the food-processing sector, accounting for 8% of total value added in 2008-2009. Presently, there are around 1,100 organized sector processing plants of dairy products in India with total installed capacity of around 100 million litres of milk per day. The value of their output was estimated at Rs. 426.47 billion in 2008-2009. As such, the dairy industry and its future growth potential hold critical value for the Indian economy. This has led to an intensive investigation of the features of growth in milk output, marketing, institutions, employ-ment and income generation, genetic improvement, animal health care, climate change, extension services, feed and fodder to call for increasing milk output (e.g., DOORNBOS et al., 1987; ATKINS, 1988; BELLUR et al., 1990; MUNSHI et al., 1994).
In both the Europe and India, milk is the top single product sector contributing to the value of agricultural output. At this juncture, it would be worthwhile to present a comparison of the trends and drivers for milk supply and demand, and the dairy chain in India with that of the European ones (the world’s leading exporter of dairy products).1 In terms of cost of milk production, India is a competitive producer. The cost of milk production in India reported at US$ 30 per/tonne is sizeably below that of the Western Europe, reported at US$ 54 per/tonne in 2010 (HEMME, 2011). It may partially be attributable to the feeding system, technology and management skills. Indian dairy farming is basically a smallholder production system. Indian farmers main-tain, on an average, a herd (cow and buffalo) of two to three dairy species. More than 40% of Indian farming households are engaged in milk production as this is a livestock enterprise in which they can engage with relative ease to improve their livelihoods. Growth of the dairy sector in India is demand-driven, inclusive and pro-poor.
On the other hand, the Europe has an average farm size of more than 31 cows (EUROPEAN COMMISSION, 2011). And the main aim of dairying is to generate expected returns on investment. Dairy farmers own the majority of processing capacity in the Europe. In India, there exists a long chain of intermediaries in a milk processing system which adversely affects the quality of milk marketed and increases the cost of dairy products. However, quality and safety standards in domestic and export value chains are managed through a number of regulations and implementing authorities like Agricultural and Processed Food Products Export Development Authority.
1 The author is grateful to an anonymous referee of the journal for bringing this point to his attention.
54 Ramphul Ohlan
Quarterly Journal of International Agriculture 52 (2013), No. 1; DLG-Verlag Frankfurt/M.
Given India’s herd size at extremely low level, considerable economies of size may be gained. The European dairy industry is very dominating in the world market and is leading exporter of many dairy products, most notably cheese. Contrary, despite the world’s largest producer of milk, India is not a significant exporter of dairy products. The European dairy industry transforms yearly about 77% of its total raw milk into a broad range of dairy products, both for consumption and for application in the production of many foods, feed and pharma products. While in India, milk is consumed mainly in raw form and only 35% of total milk production is processed, a large proportion is converted into traditional products in an unorganized sector such as cottage cheese, ghee, cottage butter, khoya, curd, malai, etc.
European dairy farms are generally large specialist commercial farms. Contracts and commercial relationships in the supply chain are highly developed and milk producers’ organizations utilize the collective bargaining power. In India, the unorganized sector still dominates in milk production, processing and distribution. Markets for dairy products are, by and large, unorganized, traditional and fragmented. The infrastructural facilities for collection and transportation of milk are quite poor. Milk procurement price is either on fat basis or on fat-and-SNF (solids-not-fat) basis. In Europe, the major dairy milk species are cows while in India 53% of total milk is produced solely by buffaloes. The seasonality in milk production is well-known in the Indian dairy sector and is more pronounced for buffaloes. The average milk yield of Indian cow is only about 3.4 kilograms a day against the Europe’s average of 18 kilograms a day. It may be added here that Finland has achieved cow yield as high as 23 kilograms a day. There appears to be considerable scope for improving India’s dairy farm performance by increasing the yield of dairy animals.
Indian dairy farming has been adversely affected by high prevalence of various animal diseases like foot and mouth disease, brucellosis, classical swine fever. To foster the dairy development in the country, adequate veterinary disease diagnosis, epidemiology, hospitals’ infrastructure and technical manpower need to be developed. It may be noted here that the European dairy industry is characterized by an oligopolistic market whereas Indian dairy industry is moving towards the perfect competitive market. Dairy products marketing in India is mainly through door to door sale which needs to be changed to supermarkets sale in large quantity as in the case of Europe, since large numbers of urban and rural households have refrigeration facilities at home.
Dairy productivity is a key variable needed to answer the question about India’s future dairy self-sufficiency and net trade situation. The rapid growth in India’s output has thus far been driven primarily by increased animal numbers rather than by higher yields (OHLAN, 2012b). So, what have been trends in dairy productivity in India? Although yields have not risen by much, has total factor productivity (TFP) increased?
Efficiency and Total Factor Productivity Growth in Indian Dairy Sector 55
Quarterly Journal of International Agriculture 52 (2013), No. 1; DLG-Verlag Frankfurt/M.
If it has, has productivity growth been due to the efficient conversion of inputs or scale efficiency. What are the major factors affecting growth in total factor productivity in the dairy industry in India? Is dairy processing industry fully technically efficient? If it has not, which factors are responsible for inefficiency? If efficiency has changed, is the rise (or fall) in efficiency due to increases (decreases) in technical efficiency or scale efficiency? How the productivity in the dairy processing industry in India (the world’s top milk producer) may be enhanced? In this paper, we seek to answer these questions.
Decomposition of growth in milk production remained of active interest to researchers and policy makers. A breakdown of milk output growth into various components, viz. number of dairy animals, and yield, etc., facilitates the output projection with alter-native targets and policies. Thus, decomposition of milk output among its constituent forces is of great importance. An analysis of the behavior of milk production in the past and estimation of its growth rates may provide a basis for further projections of milk output.
Quite a few studies have devoted to the estimation of the total factor productivity (TFP) growth in the Indian dairy industry. SINGH (2004) sought to scrutinize the performance of the Indian dairy industry applying a non-parametric method called data envelopment analysis using the data for the period 1980-1997. It was observed that in the Indian dairy industry, aggregate technical efficiency (TE) contributed more by pure technical efficiency (PTE) than by scale efficiency (SE), as PTE score was higher than the SE score (see section 2.4). SINGH et al. (2000) analyzed the performance of 13 dairy cooperative plants of two north-eastern states of India, viz. Punjab and Haryana for the period 1992-1993 to 1996-1997 and found an improvement in allocative and cost efficiencies over the period, whereas technical efficiency declined to some extent. ELUMALAI and BIRTHAL (2010) observed that during the 1980s, Indian dairy industry experienced TFP growth of 0.13% per annum, but surprisingly, it declined to 0.02% during the 1990s. KUMAR et al. (2005) examined the total factor productivity growth in the Indian livestock sector using the data for the period 1950-1995. They concluded that during the period under study the livestock sector output in the country grew at 2.59% per year. While the input index increased by 1.79% per year, total factor productivity (TFP) grew at about 0.8% only. The real upswing started during the 1980s when output growth touched nearly 4% per year, and TFP jumped to 1.8% per year. Similarly, NIN et al. (2003) found that India’s livestock sector experienced annual productivity growth rate of 0.83% during 1965-1994. In another study, NIN et al. (2007) reported that during 1981-1999 India’s livestock sector TFP grew by 1.66% annually. Growth in TFP was mainly supported by technical changes.
56 Ramphul Ohlan
Quarterly Journal of International Agriculture 52 (2013), No. 1; DLG-Verlag Frankfurt/M.
From the relevant literature, it has been observed that: (i) none of these studies touches the issue of the nature of scale inefficiency, i.e., whether it is due to increasing returns to scale or decreasing returns to scale, (ii) the factors affecting productivity growth in the Indian dairy processing industry have not been studied, (iii) analysis of the sources of milk output growth has not received as much attention as it deserves, and (iv) there is a dearth of comprehensive and systematic analysis to examine and understand the efficiency level and productivity growth in the Indian dairy industry in recent years. The study fills these gaps in the literature. In short, to understand the future of Indian dairy farming, and whether or not growth in the sector will add to increased production primarily through increases in dairy species numbers or by enhancing productivity, remains to be evaluated. The main aim of our study is to investigate the total factor productivity growth and efficiency level of India’s dairy processing industry. An attempt has also been made in the study to synthesize the available empirical methodology to assess the potential capacity of dairy processing in contributing to the increasing dairy output. The results of the present study are compared with that of earlier studies.
The organization of the study is as follows. In Section 2, we briefly outline the Tornqvist index used for estimating total factor productivity (TFP) growth and data envelopment analysis (DEA) models, viz. CHARNES et al. (1978) and BANKER et al. (1984) applied for efficiency measurement. In the same section, we also present a productivity function used to explain the productivity growth in India’s dairy processing industry, a log-linear regression model applied for estimating the elasticities of dairy output with respect to inputs used in processing, and describe the variables construction and sources of data. In Section 3, we present and discuss our results of the estimates of total factor productivity growth in the Indian dairy industry, efficiency levels and inputs’ slacks observed in the dairy industry, market conditions affecting the productivity growth and sources of growth of milk output and the present state of milk processing in India. In this way in Section 4, we summarize our main findings and draw their policy implications.
2 Methodology
Total factor productivity is defined as the ratio of aggregate output produced to the weighted combination of all inputs used. The productivity is raised when growth in output outpaces growth in input. The study estimates TFP growth for India’s dairy industry using a Thile-Tornqvist index. Data Envelopment Analysis (DEA) is also used to decompose the technical efficiency into pure technical efficiency and scale efficiency. To examine the nature of scale inefficiency of dairy processing industry, non-increasing returns to scale DEA frontier is used. The DEA model employed is an
Efficiency and Total Factor Productivity Growth in Indian Dairy Sector 57
Quarterly Journal of International Agriculture 52 (2013), No. 1; DLG-Verlag Frankfurt/M.
input-oriented model which seeks to identify technical efficiency as a proportional reduction in input usage. Growth in total factor productivity is explained using the multiple-linear regression model. These models are solely selected by data availability constraints. While there are no firm-level panel data available on which more sophisticated statistical technique can be used to decompose the total factor productivity growth into technical efficiency and technical change components. A brief introduction of the methods of analysis used in the study is given below.
2.1 Total Factor Productivity
To estimate the total factor productivity (TFP), we use the Tornqvist index. The Tornqvist index is a symmetric one, as it gives equal importance to period t and t+1. (COELLI et al., 2005) Mathematically, the Tornqvist index between any two consecutive time periods, t and t+1 may be expressed as:
(1)
1
1
21
, 1
, 1
2, 11
it it
jt jt
W W
it
t t itv vt t
t tjt
jt
yOutput Index y
In TFP InInput Index
x
x
= , 1 , 1t t t tIn Output Index In Input Index
= 1 1 1 11 1
1 1( )( ) ( )( )
2 2
N K
it it it it jt jt jt ji j
w w Iny Iny v v Inx Inx
where In = natural logarithm, yi = quantity of ith output, wi = share of the ith output in the value of total output, xj = quantity of jth input, vj = share of jth input in the total cost, t = time.
2.2 Efficiency
To know the efficiency level of the Indian dairy industry, we apply Data Envelopment Analysis. The DEA pioneered by FARRELL (1957), introduced by CHARNES et al. (1978) and later formalized by BANKER et al. (1984), is a non-parametric mathematical programming approach to estimate the efficient frontier for a group of decision making units (DMUs) with multiple number of the inputs and outputs. DEA can separate the efficient operating units (firms, organizations, managers, etc.) from inefficient on the basis of whether they lie on the efficient frontier which is spanned by the best units in a data set.
58 Ramphul Ohlan
Quarterly Journal of International Agriculture 52 (2013), No. 1; DLG-Verlag Frankfurt/M.
For the evaluation of overall efficiency of the Indian dairy industry, the present study applies two DEA models, viz. (i) Charnes, Cooper and Rhodes (CCR), and (ii) Banker, Charnes and Cooper (BCC). To carry out a more detailed investigation and enable a greater understanding of the factors involved in each element’s productivity or non-productivity, the study uses slack variable analysis. A brief introduction of these models is in order.
2.3 The CCR Model
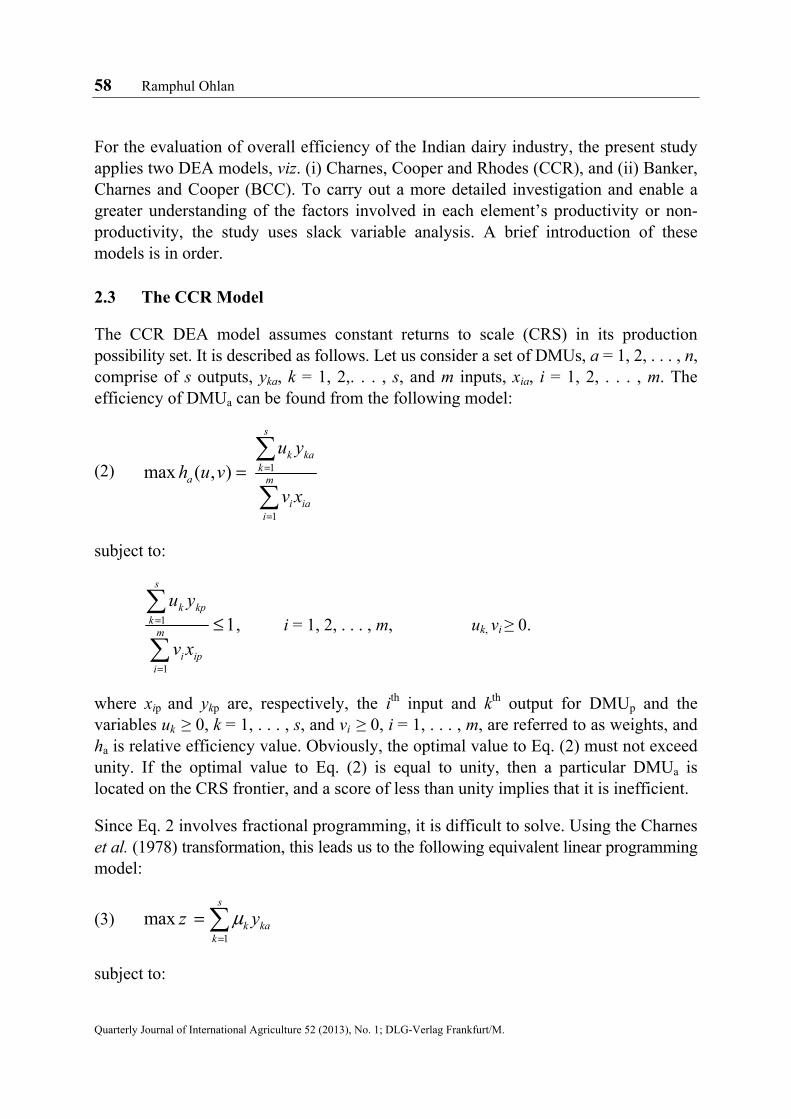
The CCR DEA model assumes constant returns to scale (CRS) in its production possibility set. It is described as follows. Let us consider a set of DMUs, a = 1, 2, . . . , n, comprise of s outputs, yka, k = 1, 2,. . . , s, and m inputs, xia, i = 1, 2, . . . , m. The efficiency of DMUa can be found from the following model:
(2) 1
1
max ( , )
s
k kak
a m
i iai
u yh u v
v x
subject to:
1
1
1
s
k kpk
m
i ipi
u y
v x, i = 1, 2, . . . , m, uk, vi ≥ 0.
where xip and ykp are, respectively, the ith input and kth output for DMUp and the variables uk ≥ 0, k = 1, . . . , s, and vi ≥ 0, i = 1, . . . , m, are referred to as weights, and ha is relative efficiency value. Obviously, the optimal value to Eq. (2) must not exceed unity. If the optimal value to Eq. (2) is equal to unity, then a particular DMUa is located on the CRS frontier, and a score of less than unity implies that it is inefficient.
Since Eq. 2 involves fractional programming, it is difficult to solve. Using the Charnes et al. (1978) transformation, this leads us to the following equivalent linear programming model:
(3) 1
max
s
k kak
z y
subject to:
Efficiency and Total Factor Productivity Growth in Indian Dairy Sector 59
Quarterly Journal of International Agriculture 52 (2013), No. 1; DLG-Verlag Frankfurt/M.
1 1
0
s m
k kp i ipk i
y x ;
1
1
m
i iai
x ;
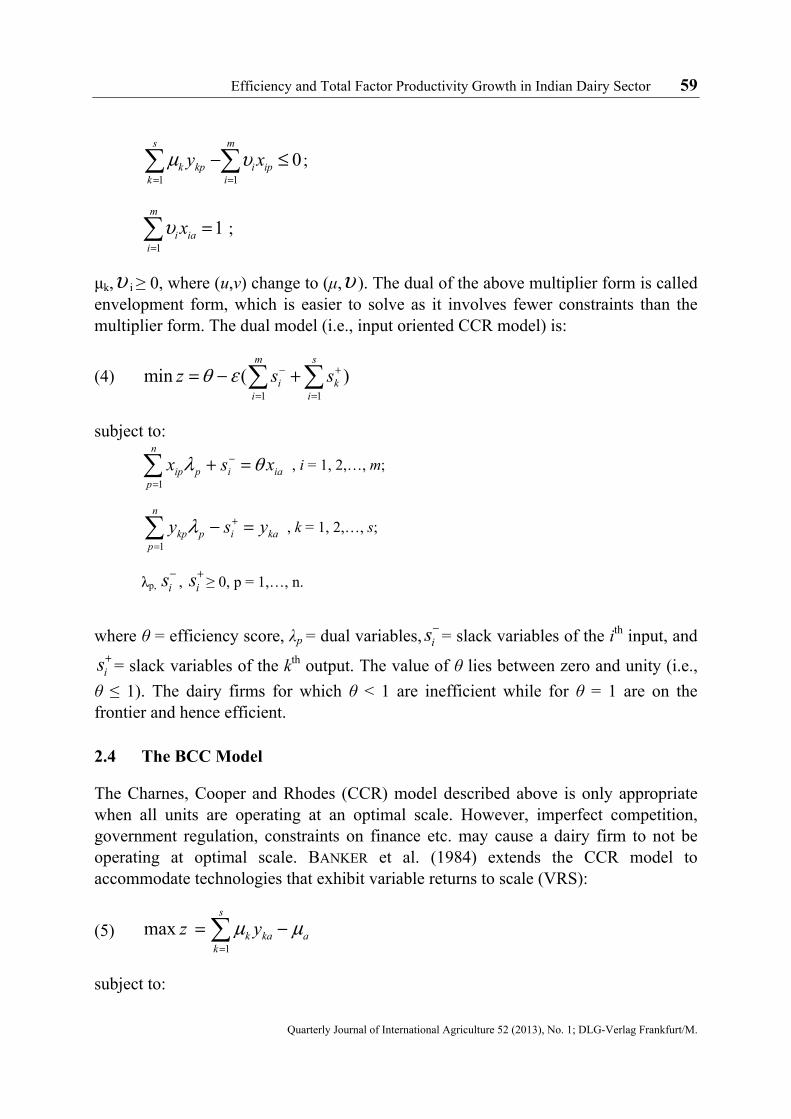
μk, i ≥ 0, where (u,v) change to (μ, ). The dual of the above multiplier form is called envelopment form, which is easier to solve as it involves fewer constraints than the multiplier form. The dual model (i.e., input oriented CCR model) is:
(4) 1 1
min ( )
m s
i ki i
z s s
subject to:
1
n
ip p i iap
x s x , i = 1, 2,…, m;
1
n
kp p i kap
y s y , k = 1, 2,…, s;
λp, is ,
is ≥ 0, p = 1,…, n.
where θ = efficiency score, λp = dual variables, is = slack variables of the ith input, and
is = slack variables of the kth output. The value of θ lies between zero and unity (i.e.,
θ ≤ 1). The dairy firms for which θ < 1 are inefficient while for θ = 1 are on the frontier and hence efficient.
2.4 The BCC Model
The Charnes, Cooper and Rhodes (CCR) model described above is only appropriate when all units are operating at an optimal scale. However, imperfect competition, government regulation, constraints on finance etc. may cause a dairy firm to not be operating at optimal scale. BANKER et al. (1984) extends the CCR model to accommodate technologies that exhibit variable returns to scale (VRS):
(5) 1
max
s
k ka ak
z y
subject to:
60 Ramphul Ohlan
Quarterly Journal of International Agriculture 52 (2013), No. 1; DLG-Verlag Frankfurt/M.
1 1
0
s m
k kp i ipk i
y x ;
1
1
m
i iai
x ;
p = 1,…, n; μk, i ≥ 0, k = 1, 2,…, s; i = 1, 2,…, m.
The dual model (i.e., input oriented BCC model) is as follows:
(6) 1 1
min ( )
m s
i ki i
z s s
subject to:
1
n
ip p i iap
x s x , i = 1, 2,…, m;
1
n
kp p i kap
y s y , k = 1, 2,…, s;
1
1
n
pp
λp, is ,
is ≥ 0, p = 1,…, n.
The CCR technical efficiency score can be decomposed into two components, viz. (a) scale efficiency, and (b) pure technical efficiency (BANKER et al., 1984). If there is a difference in the CCR and BCC technical efficiency scores for a particular firm, then this indicates that firm has scale inefficiency. The scale efficiency score is obtained by dividing the technical efficiency score resulting from the CCR model to the efficiency score resulting from the BCC model (technical efficiency = pure technical efficiency × scale efficiency). All of these efficiency scores are bounded between zero and unity.
Following PASCOE et al. (2003) and SINGH (2004), the analysis has been undertaken using the DEAP programme (COELLI, 1996). For the purpose of the estimation of capacity utilization, each observation is assumed to occur in the same time period. As time is a categorical variable, a separate analysis of one observation in each time period would result in every observation being at full capacity (as there are no other observations against which the output can be compared). Technical efficiency based on CRS model is decomposed into Pure Technical Efficiency (PTE) and Scale
Efficiency and Total Factor Productivity Growth in Indian Dairy Sector 61
Quarterly Journal of International Agriculture 52 (2013), No. 1; DLG-Verlag Frankfurt/M.
Efficiency (SE) by conducting both CRS and VRS DEA upon the same data. The scale efficiency score is worked out by dividing the CRS score by the VRS score. The decomposition depicts the sources of inefficiency, i.e., whether it is caused by inefficient operation (PTE) or by disadvantageous conditions displayed by the scale efficiency (SE) or both (COOPER et al., 2007).
2.5 Factors Affecting Industrial Productivity
The basic empirical framework used to estimate the various determinants of total factor productivity is based on a simple model of TFP:
(7) TFPt = α + Xit β + μt
where TFP refers to total factor productivity growth, Xi refers to the vector of determinants of TFP, t is time and μ is the error term.
In order to understand the impact of liberalization on TFP more precisely, the above equation is elaborated as follows:
where REER is the real effective exchange rate of Indian rupee (Rs) with the base year 1985 = 100. The export penetration index (EPI) is total dairy exports divided by the value of output of the domestic industry while the import penetration (IMP) is equal to total dairy import divided by total domestic dairy consumption. LRS is the livestock’s research stock, and LES is the livestock’s extension stock. IFM is the ratio of recent investment in fixed machinery (used as a proxy for technology acquisition) to the existing fixed capital stock. GMUP is the gross mark-up which is obtained as a ratio of profit to the value of output. DUMLIB is the dummy variable of India’s post-liberali-zation period (taking value one for 1991-1992 and onward and zero for earlier years).
2.6 Output Elasticity
It is useful to examine how will output response to the change in the level of inputs. This notion is examined by estimating the elasticities of output with respect to each input used. The elasticities of dairy’s output (Y) with respect to three main inputs, namely capital (k), labour (l) and material (m) are estimated applying Cobb-Douglas type of the production function in the log-linear form:
Quarterly Journal of International Agriculture 52 (2013), No. 1; DLG-Verlag Frankfurt/M.
where β2 = elasticity of output with respect to capital, β3 = elasticity of output with respect to labour and β4 = elasticity of output with respect to material.
Total elasticity (e) is estimated by adding elasticities of dairy’s output with respect to individual input:
(10) e = β2 + β3 + β4
2.7 Data
The study is based on secondary sources of data. For assessing the performance of the Indian dairy industry, the study is primarily concerned with the five main inputs, viz. fixed capital, working capital, labour, raw material and fuel. Their detail operational definitions are provided in Annual Survey of Industry (2008), Ministry of Commerce and Industry, Government of India (GoI), New Delhi. The data on the Indian dairy industry inputs, net value added (NVA), output and profit are obtained from Annual Survey of Industry, Ministry of Commerce and Industry, Government of India (GoI), New Delhi. The data used in our analysis, are based on firm-level data, are aggregated by cities and provinces by conducting surveys by Ministry of Commerce and Industry, Government of India (GoI), New Delhi. Data on the real effective exchange rate (REER) and price indices are taken from the Hand Book of Statistics on Indian Economy, Reserve Bank of India, Mumbai. Data on the world and India’s milk production, yield, and dairy exports and imports in milk equivalent terms are taken from the official website of the Food and Agriculture Organization (FAO) Rome. Data series on government expenditure (both central and states) in livestock research and extension are compiled from Combined Finance and Revenue Accounts of the Union and State Governments, Comptroller & Auditor General of India, Ministry of Finance (GoI), New Delhi. The data are annual. The sample period is 1980-1981 to 2008-2009. During this period, India’s milk output has been more than tripled. In India, the unorganized sector still dominates in milk production, distribution and processing. About 65% of total milk production has been consumed in raw form. Of total 35%, 20% milk is processed by the informal sector for which no data are available. The data used in our analysis, then, are confined to an organized sector only.
3 Results and Discussions
3.1 Total Factor Productivity Growth
Table 1 shows the trends in indices of output, input and total factor productivity for India’s dairy processing industry during 1980-1981 to 2008-2009 derived using Tornqvist index (Eq. 1). A glance at column 2 of Table 1 reveals that output index has
Efficiency and Total Factor Productivity Growth in Indian Dairy Sector 63
Quarterly Journal of International Agriculture 52 (2013), No. 1; DLG-Verlag Frankfurt/M.
been fluctuating during the period under study. In overall, it has shown a rising trend, the average upward shift in the output index being 8.7% per year. On the other hand, a look at column 3 of Table 1 shows that the aggregate input index for the period under investigation has presented a consistent rising trend, an annual average increase of 6.3%. The TFP of Indian dairy industry has grown at 2.4% per year. These results explain the positive growth in dairy processing output during the study period, but it is more due to the growth in inputs use than the TFP growth. The results reveal that during the last three decades the contribution of only 28% [1 - (input growth/output growth) × 100] of TFP growth is to the dairy output growth, and the contribution of inputs growth is 72%. It may be noted that growth in dairy industry output is above the growth rate experienced in the whole economy. However, sub-period-wise results are more revealing.
Note: The TFP is computed with one output, i.e., net value added and 5 inputs, viz. fixed capital, working capital, labour, fuel, and raw material.
Source: author’s calculation
64 Ramphul Ohlan
Quarterly Journal of International Agriculture 52 (2013), No. 1; DLG-Verlag Frankfurt/M.
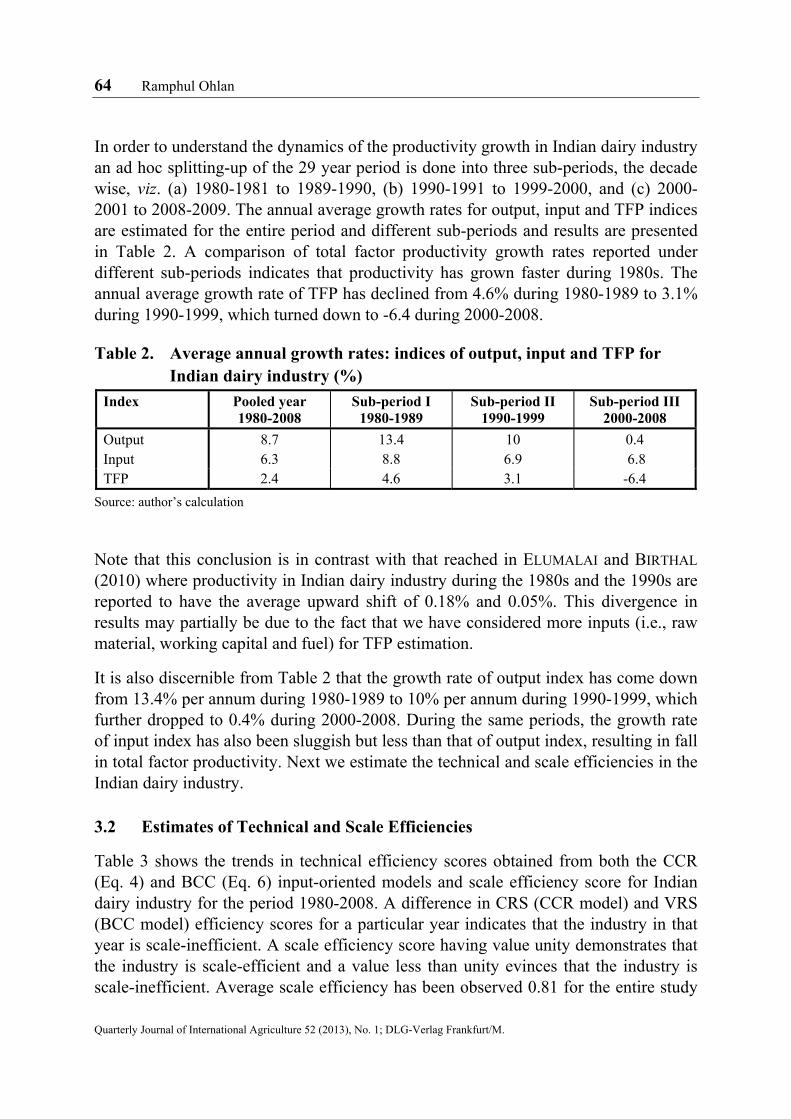
In order to understand the dynamics of the productivity growth in Indian dairy industry an ad hoc splitting-up of the 29 year period is done into three sub-periods, the decade wise, viz. (a) 1980-1981 to 1989-1990, (b) 1990-1991 to 1999-2000, and (c) 2000-2001 to 2008-2009. The annual average growth rates for output, input and TFP indices are estimated for the entire period and different sub-periods and results are presented in Table 2. A comparison of total factor productivity growth rates reported under different sub-periods indicates that productivity has grown faster during 1980s. The annual average growth rate of TFP has declined from 4.6% during 1980-1989 to 3.1% during 1990-1999, which turned down to -6.4 during 2000-2008.
Table 2. Average annual growth rates: indices of output, input and TFP for Indian dairy industry (%)
Note that this conclusion is in contrast with that reached in ELUMALAI and BIRTHAL (2010) where productivity in Indian dairy industry during the 1980s and the 1990s are reported to have the average upward shift of 0.18% and 0.05%. This divergence in results may partially be due to the fact that we have considered more inputs (i.e., raw material, working capital and fuel) for TFP estimation.
It is also discernible from Table 2 that the growth rate of output index has come down from 13.4% per annum during 1980-1989 to 10% per annum during 1990-1999, which further dropped to 0.4% during 2000-2008. During the same periods, the growth rate of input index has also been sluggish but less than that of output index, resulting in fall in total factor productivity. Next we estimate the technical and scale efficiencies in the Indian dairy industry.
3.2 Estimates of Technical and Scale Efficiencies
Table 3 shows the trends in technical efficiency scores obtained from both the CCR (Eq. 4) and BCC (Eq. 6) input-oriented models and scale efficiency score for Indian dairy industry for the period 1980-2008. A difference in CRS (CCR model) and VRS (BCC model) efficiency scores for a particular year indicates that the industry in that year is scale-inefficient. A scale efficiency score having value unity demonstrates that the industry is scale-efficient and a value less than unity evinces that the industry is scale-inefficient. Average scale efficiency has been observed 0.81 for the entire study
Efficiency and Total Factor Productivity Growth in Indian Dairy Sector 65
Quarterly Journal of International Agriculture 52 (2013), No. 1; DLG-Verlag Frankfurt/M.
period. Average TE and PTE efficiency scores, the distance of a DMU from the best practice, are worked out to be 0.72 and 0.87, respectively. The value of TE 0.72 means that India’s dairy processing industry may possibly reduce the consumption of inputs by 28% [(1 - TE) ×100] without reducing the output. It also implies approximately 38% [(1 - 0.72)/0.72] inefficiency exists in the industry.
Table 3. Trends in efficiency scores in Indian dairy industry
Note: same as in Table 1, irs =increasing returns to scale, and crs = constant returns to scale.
Source: author’s calculation
Comparing these three efficiencies, it is observed that in dairy industry aggregate efficiency has been contributed more by the efficient conversion of inputs than by the increase in size of plant, as PTE score is much higher than the SE score. A comparison
66 Ramphul Ohlan
Quarterly Journal of International Agriculture 52 (2013), No. 1; DLG-Verlag Frankfurt/M.
of dairy industry efficiency scores during different sub-periods brings out that over the period the industry has improved its technical and scale efficiencies. As against 0.58 and 0.63 average values of TE and SE scores observed during 1980-1989, average values of these scores increased to 0.70 and 0.87 during 1990-1999 and further to 0.88 and 0.95 during 2000-2008, respectively. However, the pure technical efficiency has seen deceleration – the PTE score has declined from 0.92 during 1980-1989 to 0.58 during 1990-1999 which recovered to 0.92 during 2000-2008. This implies that inefficiency in the dairy industry in the later period is more due to inefficient operation (PTE) than due to disadvantageous conditions demonstrated by scale efficiency. It is observed that up to 1989-1990, PTE has remained much higher than the SE, and as a result, technical efficiency has been contributed more by PTE than by SE.
In overall, the efficiency scores have exhibited an upward trend. Thus, the results of efficiency analysis reinforce the conclusion followed from the total factor productivity analysis. It can be verified that the average technical efficiency, PTE and SE scores are estimated 0.64, 0.75 and 0.84 over the period 1991-1992 to 1997-1998 as against 0.73, 0.81 and 0.89, respectively, reported in SINGH (2004). This divergence in efficiency scores may partially be due to the fact that for assessing the performance of the Indian dairy industry we have considered one more input, i.e., raw material.
Looking at the year-wise performance of the dairy industry, we observe that it obtains the value of the TE score (CCR score) unity for seven years, viz. 1989-1990, 1997-1998, 1998-1999, 2000-1901, 2001-2002, 2002-2003, and 2005-2006. This implies that in these years: (i) the industry is 100% technically efficient and there is no slack in the utilization of inputs (operation at full capacity), and (ii) the industry was operating under constant returns to scale. In all other years, CCR efficiency scores are less than unity, pointing out toward inefficiency in the application of resources. If efficiency scores based on the VRS (PTE scores) are taken into consideration in assessing the per-formance of the dairy industry during the period under study, it is found that about 35% years stand on the production frontier, as is obvious from the value of their respective score equal to unity. In case of scale efficiency, only nine years, viz. 1989-1990, 1994-1995, 1997-1998, 1998-1999, 2000-2003, 2005-2006, and 2008-2009 are found scale-efficient. For most of these years, these three efficiencies scores are equal to each other and are having the value of unity. In remaining years, the industry is scale-inefficient as it is having the value of SE score less than unity. PTE captures the resource conversion efficiencies feasible by observations irrespective of returns to scale consideration. On the basis of an average value of PTE score that is greater than that of SE, it may be concluded that the size of the plant (scale) has not turned out as much vital factor as the efficient conversion of inputs (PTE) in enhancing the overall efficiency of the dairy industry. Nevertheless, the results presented in column 5 of Table 3 indicate that dairy processing industry in India is operating under increasing returns to scale. The policy implication is that inefficiency may be reduced by increasing the scale of operation.
Efficiency and Total Factor Productivity Growth in Indian Dairy Sector 67
Quarterly Journal of International Agriculture 52 (2013), No. 1; DLG-Verlag Frankfurt/M.
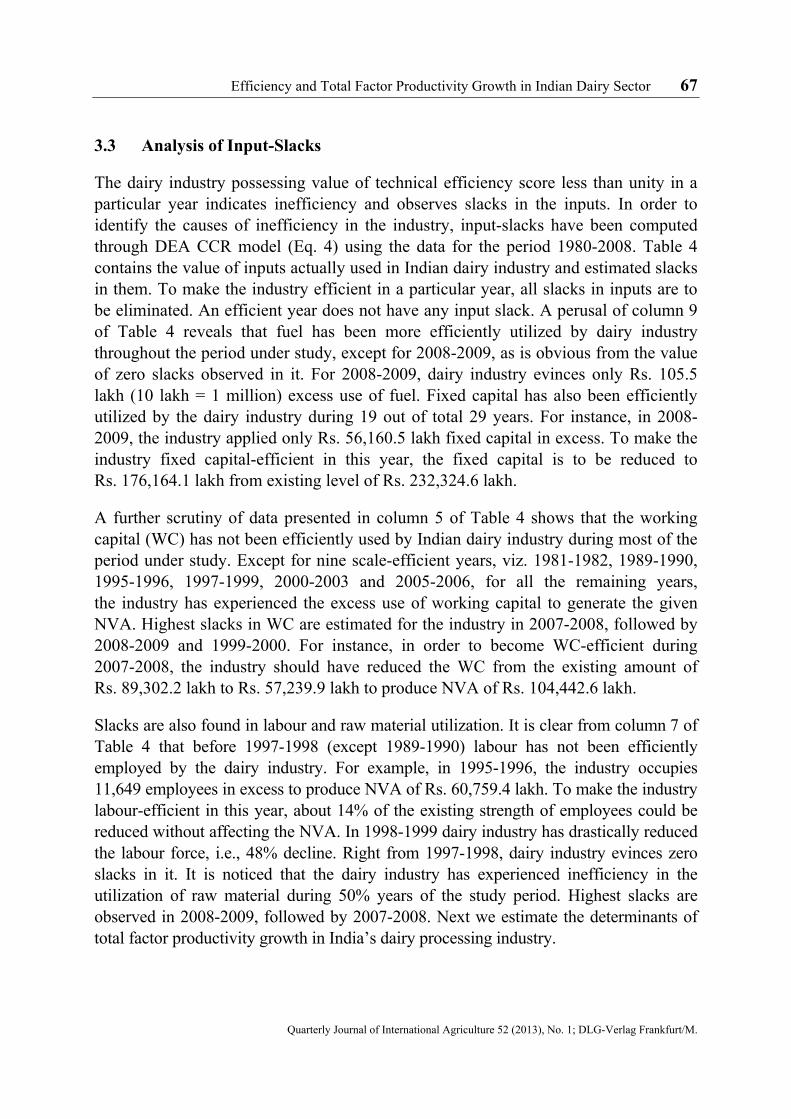
3.3 Analysis of Input-Slacks
The dairy industry possessing value of technical efficiency score less than unity in a particular year indicates inefficiency and observes slacks in the inputs. In order to identify the causes of inefficiency in the industry, input-slacks have been computed through DEA CCR model (Eq. 4) using the data for the period 1980-2008. Table 4 contains the value of inputs actually used in Indian dairy industry and estimated slacks in them. To make the industry efficient in a particular year, all slacks in inputs are to be eliminated. An efficient year does not have any input slack. A perusal of column 9 of Table 4 reveals that fuel has been more efficiently utilized by dairy industry throughout the period under study, except for 2008-2009, as is obvious from the value of zero slacks observed in it. For 2008-2009, dairy industry evinces only Rs. 105.5 lakh (10 lakh = 1 million) excess use of fuel. Fixed capital has also been efficiently utilized by the dairy industry during 19 out of total 29 years. For instance, in 2008-2009, the industry applied only Rs. 56,160.5 lakh fixed capital in excess. To make the industry fixed capital-efficient in this year, the fixed capital is to be reduced to Rs. 176,164.1 lakh from existing level of Rs. 232,324.6 lakh.
A further scrutiny of data presented in column 5 of Table 4 shows that the working capital (WC) has not been efficiently used by Indian dairy industry during most of the period under study. Except for nine scale-efficient years, viz. 1981-1982, 1989-1990, 1995-1996, 1997-1999, 2000-2003 and 2005-2006, for all the remaining years, the industry has experienced the excess use of working capital to generate the given NVA. Highest slacks in WC are estimated for the industry in 2007-2008, followed by 2008-2009 and 1999-2000. For instance, in order to become WC-efficient during 2007-2008, the industry should have reduced the WC from the existing amount of Rs. 89,302.2 lakh to Rs. 57,239.9 lakh to produce NVA of Rs. 104,442.6 lakh.
Slacks are also found in labour and raw material utilization. It is clear from column 7 of Table 4 that before 1997-1998 (except 1989-1990) labour has not been efficiently employed by the dairy industry. For example, in 1995-1996, the industry occupies 11,649 employees in excess to produce NVA of Rs. 60,759.4 lakh. To make the industry labour-efficient in this year, about 14% of the existing strength of employees could be reduced without affecting the NVA. In 1998-1999 dairy industry has drastically reduced the labour force, i.e., 48% decline. Right from 1997-1998, dairy industry evinces zero slacks in it. It is noticed that the dairy industry has experienced inefficiency in the utilization of raw material during 50% years of the study period. Highest slacks are observed in 2008-2009, followed by 2007-2008. Next we estimate the determinants of total factor productivity growth in India’s dairy processing industry.
Qua
rter
ly J
ourn
al o
f In
tern
atio
nal A
gric
ultu
re 5
2 (2
013)
, No.
1; D
LG
-Ver
lag
Fra
nkfu
rt/M
.
Tab
le 4
. T
ren
ds
in a
ctu
al in
pu
ts a
nd
est
imat
ed s
lack
inp
uts
(at
199
3-19
94 p
rice
s) f
or I
nd
ian
dai
ry in
dust
ry
Yea
r F
ixed
cap
ital
(R
s. la
kh*
) W
ork
ing
cap
ital
(R
s. la
kh
) N
o. o
f em
plo
yees
F
uel
s (R
s. la
kh
) R
aw m
ater
ial
(Rs.
lak
h)
Act
ual
Sla
ck
Act
ual
Sla
ck
Act
ual
Sla
ck
Act
ual
Sla
ck
Act
ual
Sla
ck
1980
42
,734
.6
0.0
19,3
56.4
2,
079.
8 36
,850
.0
6,35
2.9
7,66
8.4
0.0
179,
618.
4 0.
0 19
81
36,5
46.8
4,
153.
4 15
,233
.2
0.0
38,2
70.0
7,
830.
2 8,
362.
7 0.
0 20
2,86
2.5
1,25
6.8
1982
37
,796
.2
0.0
24,1
92.7
5,
375.
1 39
,271
.0
9,89
7.1
8,76
3.9
0.0
200,
587.
8 0.
0 19
83
42,8
40.1
3,
145.
9 52
,486
.0
11,9
07.7
43
,308
.0
4,87
3.1
9,67
2.6
0.0
240,
397.
8 1,
117.
7 19
84
49,7
26.3
5,
376.
1 28
,725
.4
3,17
3.8
53,1
18.0
10
,700
.6
11,6
32.4
0.
0 29
1,36
5.4
3,71
2.5
1985
45
,119
.1
818.
0 31
,863
.4
2,45
9.2
49,6
22.0
4,
134.
0 12
,085
.0
0.0
330,
430.
0 11
,398
.2
1986
55
,322
.8
3,12
8.4
45,9
84.5
9,
921.
3 52
,663
.0
5,19
7.2
14,1
17.7
0.
0 36
5,97
3.5
11,2
31.3
19
87
60,5
82.8
8,
435.
4 29
,201
.9
879.
2 51
,102
.0
6,06
1.3
13,7
64.6
0.
0 34
0,97
9.9
2,30
3.9
1988
61
,543
.6
0.0
38,1
64.5
8,
778.
0 52
,763
.0
10,6
12.7
15
,688
.5
0.0
349,
076.
5 0.
0 19
89
68,9
47.4
0.
0 39
,645
.0
0.0
60,2
78.0
0.
0 19
,520
.8
0.0
478,
938.
8 0.
0 19
90
63,4
48.1
0.
0 39
,211
.0
5,44
4.6
57,6
41.0
7,
127.
9 16
,821
.7
0.0
399,
766.
3 0.
0 19
91
57,8
64.3
0.
0 48
,460
.7
9,89
0.1
59,3
10.0
6,
359.
7 16
,700
.0
0.0
408,
093.
4 2,
861.
7 19
92
68,8
56.9
0.
0 60
,721
.5
16,2
20.5
67
,970
.0
9,57
8.3
20,8
03.7
0.
0 51
4,49
7.4
17,6
60.4
19
93
74,2
18.9
0.
0 58
,466
.7
9,78
9.9
73,5
57.0
6,
885.
0 21
,838
.0
0.0
571,
388.
0 25
,145
.3
1994
83
,728
.3
0.0
44,3
36.5
2,
954.
0 75
,945
.0
10,5
10.5
21
,710
.6
0.0
510,
125.
9 0.
0 19
95
129,
384.
9 32
,781
.5
43,9
65.2
0.
0 84
,431
.0
11,6
49.1
24
,213
.3
0.0
666,
631.
8 61
,309
.1
1996
93
,017
.4
0.0
72,0
25.3
10
,581
.2
77,1
90.0
2,
847.
7 25
,428
.5
0.0
599,
319.
7 0.
0 19
97
214,
274.
7 0.
0 53
,005
.7
0.0
80,0
82.0
0.
0 28
,535
.2
0.0
655,
154.
9 0.
0 19
98
114,
302.
1 0.
0 43
,445
.2
0.0
41,4
23.0
0.
0 24
,152
.7
0.0
659,
821.
8 0.
0 19
99
199,
791.
7 50
,855
.0
74,9
12.8
24
,367
.5
54,3
33.0
0.
0 37
,613
.7
0.0
814,
627.
2 0.
0 20
00
140,
112.
3 0.
0 43
,738
.8
0.0
51,3
76.0
0.
0 38
,349
.3
0.0
824,
040.
5 0.
0 20
01
141,
445.
5 0.
0 19
,262
.9
0.0
55,6
21.0
0.
0 43
,155
.2
0.0
821,
679.
2 0.
0 20
02
145,
989.
2 0.
0 39
,072
.3
0.0
51,6
44.0
0.
0 42
,585
.4
0.0
809,
804.
1 0.
0 20
03
135,
536.
9 0.
0 42
,168
.3
8,14
3.4
54,6
70.0
0.
0 43
,533
.5
0.0
901,
294.
2 0.
0 20
04
134,
438.
7 0.
0 48
,175
.1
14,6
45.0
55
,898
.0
0.0
44,5
74.9
0.
0 98
3,50
8.9
46,2
01.8
20
05
147,
585.
2 0.
0 30
,132
.2
0.0
62,2
23.0
0.
0 51
,375
.7
0.0
1,06
2,22
7.0
0.0
2006
14
8,43
6.8
0.0
41,6
80.6
5,
788.
8 64
,321
.0
0.0
50,9
82.1
0.
0 1,
153,
464.
0 59
,135
.1
2007
17
1,40
3.2
4,80
4.6
89,3
02.2
32
,062
.3
65,8
80.0
0.
0 52
,669
.1
0.0
1,29
5,04
2.0
125,
173.
5 20
08
232,
324.
6 56
,160
.5
63,1
91.2
25
,163
.0
70,7
09.0
0.
0 58
,503
.7
105.
5 1,
377,
958.
0 14
8,51
5.0
*10
lakh
= 1
mill
ion
Sou
rce:
aut
hor’
s ca
lcul
atio
n
Efficiency and Total Factor Productivity Growth in Indian Dairy Sector 69
Quarterly Journal of International Agriculture 52 (2013), No. 1; DLG-Verlag Frankfurt/M.
3.4 Determinants of Total Factor Productivity Growth
Table 5 contains the results of the estimates for determinants of total factor productiv-ity in Indian dairy industry. The results of regression model’s (Eq. 8) diagnostic tests presented in last four rows of Table 5 suggest that our results are fit for reliable interpretation. The adjusted R2 is 0.77 and only 2 of the 9 parameter estimates are non-significant at the 10% level. As suggested by Ramsey RESET test results that our model is well specified. Further, there is no problem of autocorrelation, multicollinearity and heteroskedasticity. The real effective exchange rate coefficient is statistically significant at the 1% level and has expected sign. It suggests that devaluation in terms of real effective exchange rate has a favourable impact on productivity growth in India’s dairy processing industry. This result is in line with the finding of CHAND and SEN (2002) who estimate the impact of trade liberalization on productivity growth in the Indian manufacturing industry as a whole. Both dairy export and import penetration indices are found to be positively affecting the productivity growth. This finding supports a key postulate of the new theories of endogenous growth which allow for the possibility that trade reforms may bring about a permanent change in productivity growth. The policy implication is that further liberalization of dairy trade policy can improve the productivity of the processing industry.
F-statistic 13.2204 0.00 Durbin-Watson d-statistic 2.1989 Breusch-Godfrey Serial Correlation LM Test 0.3813 0.69 White Heteroskedasticity Test 1.0147 0.49 Ramsey RESET Test 1.8692 0.19
Note: REER is constructed so that a decline indicates the deprecation.
Source: author’s calculation
70 Ramphul Ohlan
Quarterly Journal of International Agriculture 52 (2013), No. 1; DLG-Verlag Frankfurt/M.
Similarly, the dairy processing industry profitability (measured as the ratio of profit to value of output) statistically significantly contributes to total factor productivity growth. This result complements the business literature on the profit and productivity relationship developed by KUROSAWA (1975) and ELDOR and SUDIT (1981).
The estimate of India’s economic reforms’ dummy variable suggests that the reform process has its adverse impact on total factor productivity growth in the dairy pro-cessing industry. The government expenditure on research on livestock positively affects the dairy processing productivity. However, the extension stock variable coefficient has a negative sign, suggests that it hampers the productivity growth in the dairy industry. It might be in line with the negative consequences of Everett Rogers’s innovation diffusion theory, viz. pro innovation bias, individual blame bias, issue of equality and bias favour of larger and wealthier farmers (for details on the biases of livestock extension services delivered in India see, e.g., MATTHEWMAN and ASHLEY, 1996).
3.5 Output Elasticities
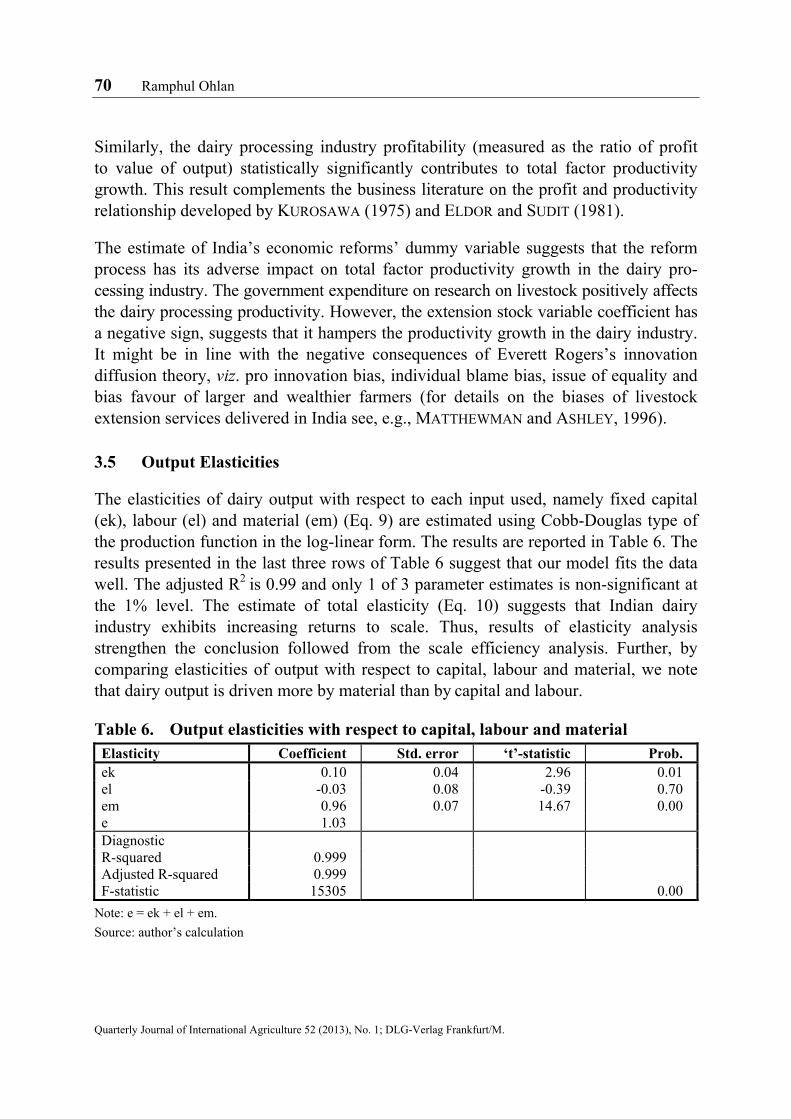
The elasticities of dairy output with respect to each input used, namely fixed capital (ek), labour (el) and material (em) (Eq. 9) are estimated using Cobb-Douglas type of the production function in the log-linear form. The results are reported in Table 6. The results presented in the last three rows of Table 6 suggest that our model fits the data well. The adjusted R2 is 0.99 and only 1 of 3 parameter estimates is non-significant at the 1% level. The estimate of total elasticity (Eq. 10) suggests that Indian dairy industry exhibits increasing returns to scale. Thus, results of elasticity analysis strengthen the conclusion followed from the scale efficiency analysis. Further, by comparing elasticities of output with respect to capital, labour and material, we note that dairy output is driven more by material than by capital and labour.
Table 6. Output elasticities with respect to capital, labour and material Elasticity Coefficient Std. error ‘t’-statistic Prob. ek 0.10 0.04 2.96 0.01 el -0.03 0.08 -0.39 0.70 em 0.96 0.07 14.67 0.00 e 1.03 Diagnostic R-squared 0.999 Adjusted R-squared 0.999 F-statistic 15305 0.00
Note: e = ek + el + em.
Source: author’s calculation
Efficiency and Total Factor Productivity Growth in Indian Dairy Sector 71
Quarterly Journal of International Agriculture 52 (2013), No. 1; DLG-Verlag Frankfurt/M.
The estimated material elasticity coefficient suggests that a 1% increase in raw material increases the total dairy output by 0.96%. The elasticity of fixed capital (0.10) has expected sign (i.e., positive) and is statistically significant at the 1% level. It suggests that increase in fixed capital expands the dairy output. The labour elasticity coefficient exhibits a negative sign, but it is statistically non-significant at any conven-tional level. We now examine the sources of milk output growth in India.
3.6 Sources of Growth of Milk Output
Our foregoing analysis of the dairy output elasticities establishes that the main driver for dairy processing industry output growth is raw material (mainly raw milk). Therefore, it is instructive to explore the sources of growth of milk output. An analysis of the relative contribution of the number of milch animals, yield and their interaction to change in milk output brings out that, on an average, during 1980-2009 growth in India’s milk output has mainly been on account of an increase in the population of dairy species (41.13% growth). While the yield and interaction effects have con-tributed to only 29.11 and 29.77% growth, respectively. A scrutiny of the data (available in FAO database) indicates that during the same period, India’s population of milch animal and milk yield grow by 2.35 and 1.83% per annum, respectively. The milk output has registered an annual average compound growth rate of 4.22%. It may be noted here that during 1980-2009, number of milch animals at the global level grows at 1.25% per annum, while the milk yield has declined at a marginal rate of 0.02% per annum. So, milk production has grown at a slower pace of 1.23% annually. Nonetheless, the developing world is the chief producer as well consumer of the dairy products (OHLAN, 2012a).
An ad-hoc splitting-up of 30 year period into two sub-periods, each of an equal duration, viz. (a) 1980-1981 to 1994-1995, and (b) 1995-1996 to 2009-2010 indicates that during the later period, India’s milk growth pace has been adversely affected. It has decelerated from 4.61% per annum during 1980-1994 to 3.79% per annum during 1995-2009. This deceleration has come through a slowdown in annual average growth rate of dairy species population from 3.56% to 1.79% during the same period. While the growth rate of India’s milk yield has improved from 1.01 per annum to 1.97 per annum during the same period.
As far as the international comparison of milk yield is concerned, it is noticed that India’s milk yield of 2.8 kg/day/animal is far below other leading milk producers like USA (24.49 kg/day/animal) and UK (19.69 kg/day/animal). It may partially be attributable to India’s major species of milk, i.e., buffalo. An examination of data reported by the PLANNING COMMISSION (2011) indicates that buffalo yield less milk than crossbred cow. Other likely reasons for India’s low yield are: (a) lack of use of
72 Ramphul Ohlan
Quarterly Journal of International Agriculture 52 (2013), No. 1; DLG-Verlag Frankfurt/M.
scientific practice in mulching, (b) inadequate availability and affordability of feed and fodder in all seasons, (c) improper veterinary health services, (d) lack of vaccinations, and (e) inadequate research capacity (GOI, 2011).
Nevertheless, a comparison of milk production cost (reported in HEMME et al., 2007) in the world’s major producers brings out that India ranks sixth in low cost milk producers. India’s average cost of milk production on a farm of two cows was reported US$ 23 per tonne in 2006. The corresponding figures for Switzerland and Finland were reported US$ 86 and US$ 72 per tonne, respectively.
A further scrutiny of data (available at FAO official website) reveals that the main species for global milk output is the cow which accounted for 84% of total production in triennium ending average (TE) 2009. It is followed by buffalo species with a share of 13% during the same period. The worldwide buffalo milk is estimated at 89.96 million tonnes in TE 2009 and continues to grow. Almost 91% of total volume of buffalo milk is solely produced by India (68%) and Pakistan (23.4%), smaller volumes in China, Egypt and Italy. Other animal species supplying milk for human consump-tion are: goat (2%), sheep (1%) and camel (0.2%). In 2009-2010, India’s major milk spices were: buffalo (53%), cow (43.3%) and goat (3.7%). During the same period, India ranks first in buffalo (56.7% of world’s buffaloes) and the second next to Brazil in cattle (12.5%) population. The buffalo population recorded a faster growth rate than that of cattle. Nevertheless, as is observed by KUMAR et al., (2005) that faster increase in yield from increasing adoption of crossbreed cows has resulted in the relative shares of cow and buffalo remain constant. On the basis of our foregoing analysis, it may be concluded that adoption of crossbred cows can provide the momentum to milk output in India.
Further, in order to increase milk output, GOI has focused on genetic up-gradation of cattle and streamlining artificial insemination (AI) services and support system since the year 2000. As noticed by PLANNING COMMISSION (2011) most government AI centres are still stationary due to deficiency of manpower and transport facility. Its component on propagation of indigenous milk breeds also did not make much mark. In this regard, it is contented that the National Dairy Plan, a World Bank funded project, due to
implement in early 2012 envisages increasing productivity of milk species through the provision
of good-quality semen, door step AI services and scientific feeding.
3.7 Milk Processing
Let us now discuss the present state of milk processing in India. As reported by the WORLD BANK (2009) approximately 20% of production is consumed on the farm, with a further 25% sold as raw milk to rural consumers. 20% is sold as raw milk to urban
Efficiency and Total Factor Productivity Growth in Indian Dairy Sector 73
Quarterly Journal of International Agriculture 52 (2013), No. 1; DLG-Verlag Frankfurt/M.
consumers, while 20% is processed by the informal sector. The balance (15%) is transformed into pasteurized milk and milk products through registered and regulated processing plants and marketed through cooperatives, dairies and vendors. Likewise, Swiss Agency for Development and Cooperation in its study CALPI (undated) observes that approximately 50% of milk is consumed by the people who produce it. Of the milk sold, 80% or more passes through informal channels - in 2002, an estimated 80% of Indian towns received milk only through the informal sector via small-scale market agents. This in turn has created conditions that fail to provide adequate market access to rural producers. It is clear that a high volume of milk does not reach to the milk processing plants. In this situation, it is rightly argued by BIRTHAL (2008) that in order to meet the increasing demand for niche dairy products modernization of supply chains starting from rural producers to urban consumer is required. It may be added here that such linking-up of the unorganized sector to the organized sector calls for a systematic investment in adequate logistics of milk collection and infrastructure leading to accelerated productivity, processing and marketing.
4 Conclusions and Policy Implications
In this study, we have assessed the total factor productivity growth in India’s dairy processing industry using the Tornqvist index, and measured the technical and scale efficiencies applying DEA models, viz. (i) Charnes, Cooper and Rhodes (CCR), and (ii) Banker, Charnes and Cooper (BCC). The sample period is 1980-2008. For a greater understanding of the factors involved in each element’s productivity or non-productivity, the slack variable analysis is undertaken. The results suggest that total factor productivity in the Indian dairy processing industry has grown statistically significantly. During 1980-1981 to 2008-2009, output growth is 8.7% per annum while the annual input growth is 6.3% resulting in TFP growth of 2.4% per year. We find that dairy processing industry is on an average 81% scale-efficient and has exhibited the signs of improvement. The decomposition of TFP growth indicates that growth is driven more by technical efficiency changes than by scale efficiency. Highest slacks are observed in the use of working capital. The policy implication is that India’s dairy industry can reduce the working capital use while at the same time maintaining the same level of output. A comparison of existing milk processing capacity and total raw milk production brings out that the country needs to create additional processing capacity. Increasing returns to scale observed in dairy processing also suggests for an increase in processing capacity. The policy implication is clear that in order to meet the faster growing demand India should focuses on genetic up-gradation of milk animals and their health.
74 Ramphul Ohlan
Quarterly Journal of International Agriculture 52 (2013), No. 1; DLG-Verlag Frankfurt/M.
The estimates of productivity function indicate that a devaluation in terms of real effective exchange rate, profitability, trade reforms and research stock play a significant role in explaining the productivity growth in India’s dairy processing industry. India’s economic reform process is found to have its adverse impact on total factor productivity growth in the dairy industry. In the early 1990s, the Government of India introduced major policy reforms, which favored increasing privatization and liberalization of the economy, and the dairy sector was no exception to this. The dairy industry was de-licensed in 1991 with a goal of encouraging private investment and the flow of capital and new technology into the sector. The de-licensing attracted a large number of players, and it has led to excess use of working capital, which adversely affects the TFP growth.
The decomposition of milk output in terms of yield, number of dairy species and their interaction shows that during the last one and a half decades India’s milk production growth rate has been sluggish, mainly due to fall in the growth pace of milk species whereas yield growth tempo has improved.
Annual milk yield per dairy animal in India is found about one-fifth of that achieved in the Europe, it calls for a technological breakthrough in animal breeding and production. Estimates of demand increases of milk and milk products indicate a surge ahead. For instance, the working group on Animal Husbandry & Dairying for India’s 12th Five-Year Plan has reported that by the end of 2017, demand for milk is expected to increase to 141 million tonnes. The increased demand for milk and milk products will have to be met by increasing domestic production. To realize the targeted output the country requires achieving 5% annual growth in milk production. It calls for enhancement of productivity of dairy animals and improved access of milk producers to the organized milk processing sector. In order to increase the milk yield at par with the European level, there is a need for genetic progress through scientific breeding and nutrition. For improving the genetics of milk producing animals and to encourage the use of the modern proven technologies in milk production, there is need to adopt a scientific approach and systematic process. The adoption of good-quality crossbred cows may play a dominant role in accelerating India’s milk output to meet the rapidly growing demand for milk in the country.
It is established that in India dairy processing industry output is highly sensitive to raw material. This may partially be because the fact that due to growth of processing capacity in the Indian dairy industry resulting from de-licensing and presence of a large unorganized sector, there is an reserve capacity in Indian dairy industry. In addition, we observe that a high volume of milk does not reach to the milk processing plants. To increase in the direct sale of milk to dairies, as in the Europe, village-based milk procurement system needs to be broadened by the base. To improve the quality
Efficiency and Total Factor Productivity Growth in Indian Dairy Sector 75
Quarterly Journal of International Agriculture 52 (2013), No. 1; DLG-Verlag Frankfurt/M.
and prolonged shelf life of milk being marketed, infrastructure up-gradation like the cold chain is called for. In order to increase the level of milk processing at par with the Europe, foreign direct investment in milk processing may be made more attractive. The main conclusion to be drawn from our analysis is that major improvements in dairy processing industry productivity are possible and can contribute to increase in the supply of dairy products in India, but increased investment in logistics of raw milk collection and infrastructure development is needed. The European model may be adopted to strengthen the milk farmers to be able to increase the farm size and building own processing capacity.
References ATKINS, P.J. (1988): Rejoinder: India’s dairy development and operation flood. In: Food Policy
13 (3): 305-312.
BANKER, R.D., A. CHARNES and W.W. COOPER (1984): Some models for estimating technical and scale inefficiency in data envelopment analysis. In: Management Science 30 (9): 1078-1092.
BELLUR, V.V., S.P. SINGH and R. CHAGANTI (1990): The white revolution – how Amul brought milk to India. In: Long Range Planning 23 (6): 71-79.
BIRTHAL, P.S. (2008): Linking smallholder livestock producers to markets: issues and approaches. In: Indian Journal of Agricultural Economics 63 (1): 19-37.
SWISS AGENCY FOR DEVELOPMENT AND COOPERATION (undated): Capitalization of Livestock Programme Experiences in India, CALPI. Milk marketing in India: a review paper on the role and performance of informal sector. SDC, Bern, Swiss.
CHAND, S. and K. SEN (2002): Trade liberalization and productivity growth: Evidence from Indian manufacturing. In: Review of Development Economics 6 (1): 120-132.
CHARNES, A., W.W. COOPER and E. RHODES (1978): Measuring the efficiency of decision making units. In: European Journal of Operations Research 2 (6): 429-444.
COELLI, T.J. (1996): A guide to DEAP version 2.1: A data envelopment analysis computer programme. CEPA Working Papers No. 8/96. University of New England, Armidale. Australia.
COELLI, T., D.S.P. RAO, C.J. O’DONNELL and G.E. BATTESE (2005): An introduction to efficiency and productivity analysis. 2nd edition. Springer, New York.
COOPER, W.W., L.M. SEIFORD and K. TONE (2007): Data envelopment analysis, a comprehensive text with models, applications, references and DEA-solver software. 2nd edition. Springer, Norwell, USA.
DOORNBOS, M., P.V. STUIJVENBERG and P. TERHAL (1987): Operation flood: impacts and issues. In: Food Policy 12 (4): 376-383.
ELUMALAI, K. and P.S. BIRTHAL (2010): Effect of trade liberalization on the efficiency of Indian dairy industry. In: Journal of International and Area Studies 17(1): 1-15.
ELDOR, D. and E. SUDIT (1981): Productivity-based financial net income analysis. In: Omega 9 (6): 605-611.
76 Ramphul Ohlan
Quarterly Journal of International Agriculture 52 (2013), No. 1; DLG-Verlag Frankfurt/M.
EUROPEAN COMMISSION (2011): EU dairy farms report-2011. Brussels.
FARREL, M.J. (1957): The measurement of productive efficiency. In: Journal of Royal Statistical Society, Series A General, 120 (3): 253-290.
GAUTAM, D.R.S. and V. PATHAK (2010): Indian dairy sector: time to revisit operation flood. In: Livestock Science 127 (3): 164-175.
GOI (Government of India) (2011): Economic survey. Ministry of Finance, Government of India, New Delhi.
GOLDAR, B. (2004): Indian manufacturing: productivity trends in pre- and post-reform periods. In: Economic and Political Weekly 39 (46/47): 5033-5043.
HEMME, T. (2007): IFCN dairy report 2007. International Farm Comparison Network, IFCN Dairy Research Center, Kiel, Germany.
– (2011): IFCN dairy report 2007. International Farm Comparison Network, IFCN Dairy Research Center, Kiel, Germany.
KUMAR, A., D. JHA and U.K. PANDEY (2005): Total factor productivity of the livestock sector in India. In: Joshi, P.K., S. Pal, P.S. Birthal and M.C.S. Bantilan (eds.): Impact of Agricultural Research: Post-Green Revolution Evidence from India. National Centre for Agricultural Economics and Policy Research, New Delhi.
KUROSAWA, K. (1975): An aggregate index for the analysis of productivity and profitability. In: Omega 3 (2): 157-168.
MATTHEWMAN, R. and S. ASHLEY (1996): The generation, assembly and delivery of information on livestock production: a case study of India. Natural Resources Institute, Chatham, England.
MUNSHI, K.D. and K.S. PARIKH (1994): Milk supply behavior in India: data integration, estimation and implications for dairy development. In: Journal of Development Economics 45 (2): 201-223.
NIN, A., C. ARNDT, T.W. HERTEL and P.V. PRECKEL (2003): Bridging the gap between partial and total factor productivity measures using directional distance functions. In: American Journal of Agricultural Economics 85 (4): 928-942.
NIN, A., S. EHUI and S. BENIN (2007): Livestock productivity in developing countries: an assessment. In: Handbook of Agriculture Economics 3 (1): 2461-2532.
OHLAN, R. (2011): Productivity and Efficiency Analysis of Haryana’s Dairy Industry. In: Productivity 52 (1): 42-50.
– (2012a): Globalization and world dairy trade: an assessment. In: The Journal of World Investment and Trade 13 (1): 77-103.
– (2012b): Globalization and competitiveness of Indian dairy sector. Major research project report, New Delhi. University Grants Commission, New Dehli.
PASCOE, S., J.E. KIRKELY and D.F. GREBOVAL (2003): Measuring and assessing capacity in fisheries: issues and methods. FAO, Rome.
PLANNING COMMISSION (2011): Report of the working group on animal husbandry & dairying: 12th Five Year Plan. Planning Commission, Government of India, New Delhi.
SINGH, M. (2011): Strategic environment and social assessment (SESA) for national dairy support project (NDSP). National Dairy Development Board IPP515, Anand, Gujarat, India.
Efficiency and Total Factor Productivity Growth in Indian Dairy Sector 77
Quarterly Journal of International Agriculture 52 (2013), No. 1; DLG-Verlag Frankfurt/M.
SINGH, S., E. FLEMING and T. COELLI (2000): Efficiency and productivity analysis of cooperative dairy plants in Haryana and Punjab states of India. Working Paper No. 2000-2. Graduate School of Agricultural and Resource Economics, University of New England, Armidales.
SINGH, S.P. (2004): Post WTO era: impact on export prospects of livestock products. Occasional Paper 32. Department of Economic Analysis and Research, National Bank for Agri-culture and Rural Development, Mumbai.
WORLD BANK (2009): South-south exchange: sharing of knowledge and innovation: the case of dairy sector in India, Uganda and Tanzania. Report No. 52074. Washington, DC.
Acknowledgements
The author acknowledges the valuable comments and suggestions of two anonymous reviewers, which permitted substantial improvements to the work. The author would like to acknowledge the financial support of the University Grants Commission, India.
Ramphul Ohlan Institute of Management Studies and Research, Maharshi Dayanand University, Rohtak - 124001, Haryana, India e-mail: [email protected]