16
EIOPA Stress Test 2011 Press Briefing Frankfurt am Main, 4 July 2011
| Date post: | 25-Dec-2015 |
| Category: |
Documents |
| Upload: | buddy-booker |
| View: | 221 times |
| Download: | 3 times |

EIOPA Stress Test 2011
Press BriefingFrankfurt am Main,4 July 2011

2
Topics
1.Objectives
2.Initial remarks
3.Framework
4.Participation
5.Results
6.Summary
7.Follow up
3
Objectives
Overall objective of the exercise:
•Assess the resilience of the EU insurance sector to major
shocks
•Understand evolution of capital position of insurers in
adverse situations
•Evaluate the overall stability of the insurance market
Regulation requires EIOPA to “initiate and coordinate
Union-wide stress tests”
4
Initial remarks
What is the EIOPA stress test?
•An important supervisory and risk management tool
•A test of “what if” scenarios to explore insurance
companies vulnerabilities
What is the EIOPA stress test not?
•A solvency exercise
•A second guess of capital requirements
5
Framework
• Stress test based on EU future risk-based regulation -
Solvency II
• Assets and liabilities valued on a market consistent basis
• Macroeconomic scenarios provided by the ECB
• Shock scenarios developed by EIOPA to highlight risks of
particular relevance to insurers
6
Framework
Three Scenarios
•Baseline (severe stress)
•Adverse (more severe market deterioration in the main macroeconomic variables)
•Inflation (increase in inflation -> rapid increase interest rates)
Risks
•Market (interest rate, equity, real estate)
•Credit (spread risk: investment grade, high yield)
•Insurance (natural catastrophe, pandemic event, reinsurance)
7
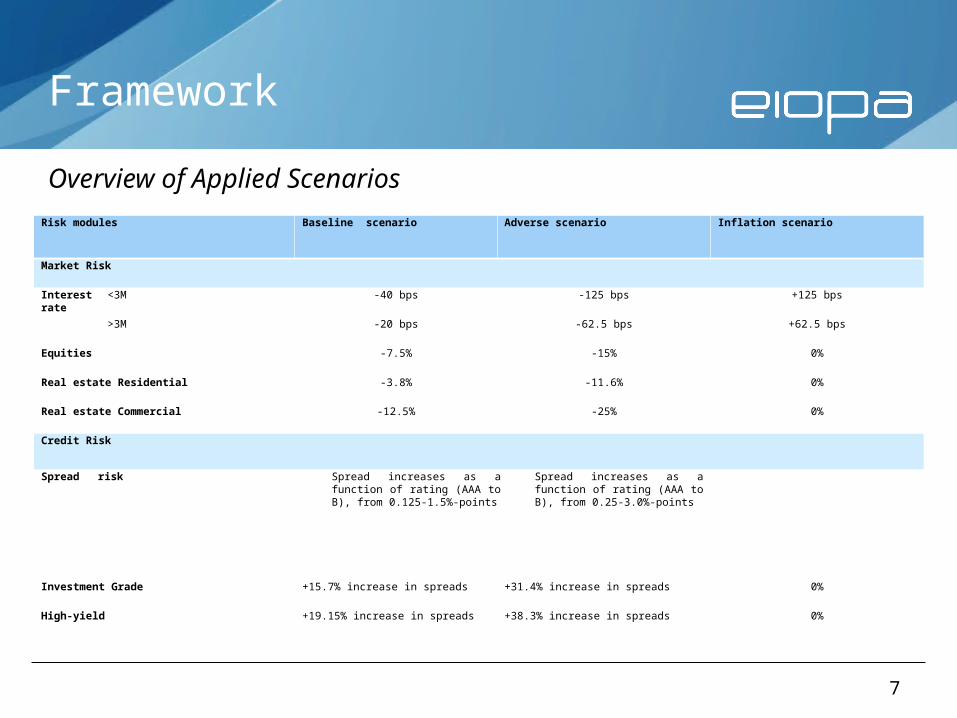
Framework
Overview of Applied ScenariosRisk modules Baseline scenario Adverse scenario Inflation scenario
Market Risk
Interest rate
<3M -40 bps -125 bps +125 bps
>3M -20 bps -62.5 bps +62.5 bps
Equities -7.5% -15% 0%
Real estate Residential -3.8% -11.6% 0%
Real estate Commercial -12.5% -25% 0%
Credit Risk
Spread risk Spread increases as a function of rating (AAA to B), from 0.125-1.5%-points
Spread increases as a function of rating (AAA to B), from 0.25-3.0%-points
Investment Grade +15.7% increase in spreads +31.4% increase in spreads 0%
High-yield +19.15% increase in spreads +38.3% increase in spreads 0%
8
Framework
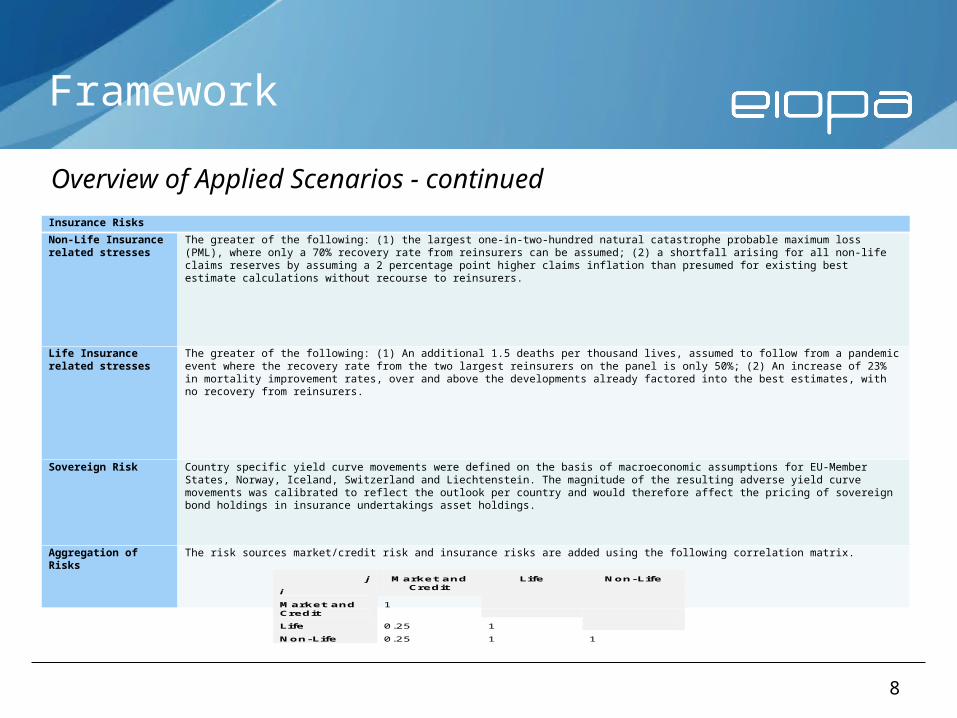
Insurance Risks
Non-Life Insurance related stresses
The greater of the following: (1) the largest one-in-two-hundred natural catastrophe probable maximum loss (PML), where only a 70% recovery rate from reinsurers can be assumed; (2) a shortfall arising for all non-life claims reserves by assuming a 2 percentage point higher claims inflation than presumed for existing best estimate calculations without recourse to reinsurers.
Life Insurance related stresses
The greater of the following: (1) An additional 1.5 deaths per thousand lives, assumed to follow from a pandemic event where the recovery rate from the two largest reinsurers on the panel is only 50%; (2) An increase of 23% in mortality improvement rates, over and above the developments already factored into the best estimates, with no recovery from reinsurers.
Sovereign Risk Country specific yield curve movements were defined on the basis of macroeconomic assumptions for EU-Member States, Norway, Iceland, Switzerland and Liechtenstein. The magnitude of the resulting adverse yield curve movements was calibrated to reflect the outlook per country and would therefore affect the pricing of sovereign bond holdings in insurance undertakings asset holdings.
Aggregation of Risks
The risk sources market/credit risk and insurance risks are added using the following correlation matrix.
Overview of Applied Scenarios - continued
j
i
Market and Credit
Life Non-Life
Market and Credit
1
Life 0.25 1
Non-Life 0.25 1 1
9
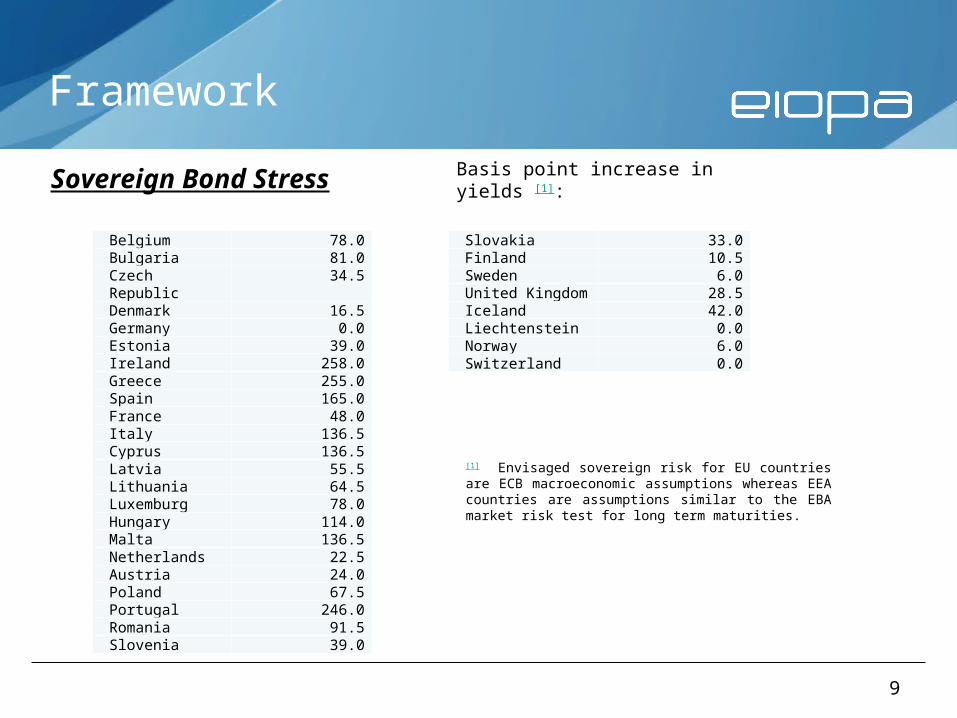
Framework
Sovereign Bond Stress
Belgium 78.0Bulgaria 81.0Czech Republic 34.5Denmark 16.5Germany 0.0Estonia 39.0Ireland 258.0Greece 255.0Spain 165.0France 48.0Italy 136.5Cyprus 136.5Latvia 55.5Lithuania 64.5Luxemburg 78.0Hungary 114.0Malta 136.5Netherlands 22.5Austria 24.0Poland 67.5Portugal 246.0Romania 91.5Slovenia 39.0
Basis point increase in yields [1]:
[1] Envisaged sovereign risk for EU countries are ECB macroeconomic assumptions whereas EEA countries are assumptions similar to the EBA market risk test for long term maturities.
Slovakia 33.0Finland 10.5Sweden 6.0United Kingdom 28.5Iceland 42.0Liechtenstein 0.0Norway 6.0Switzerland 0.0
10
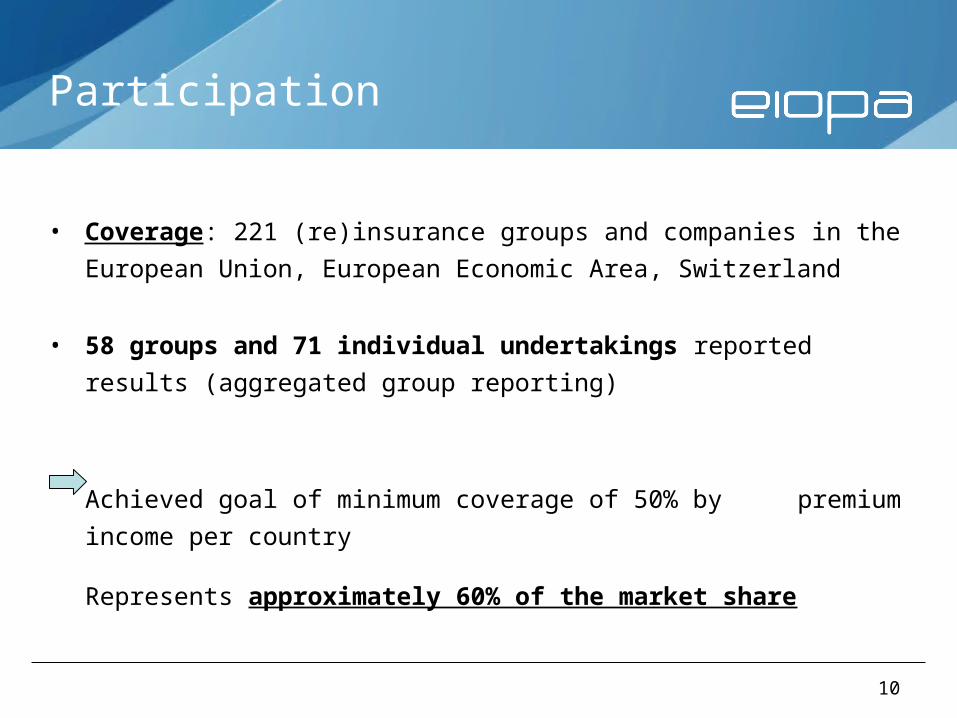
Participation
• Coverage: 221 (re)insurance groups and companies in the
European Union, European Economic Area, Switzerland
• 58 groups and 71 individual undertakings reported
results (aggregated group reporting)
Achieved goal of minimum coverage of 50% by premium
income per country
Represents approximately 60% of the market share
11
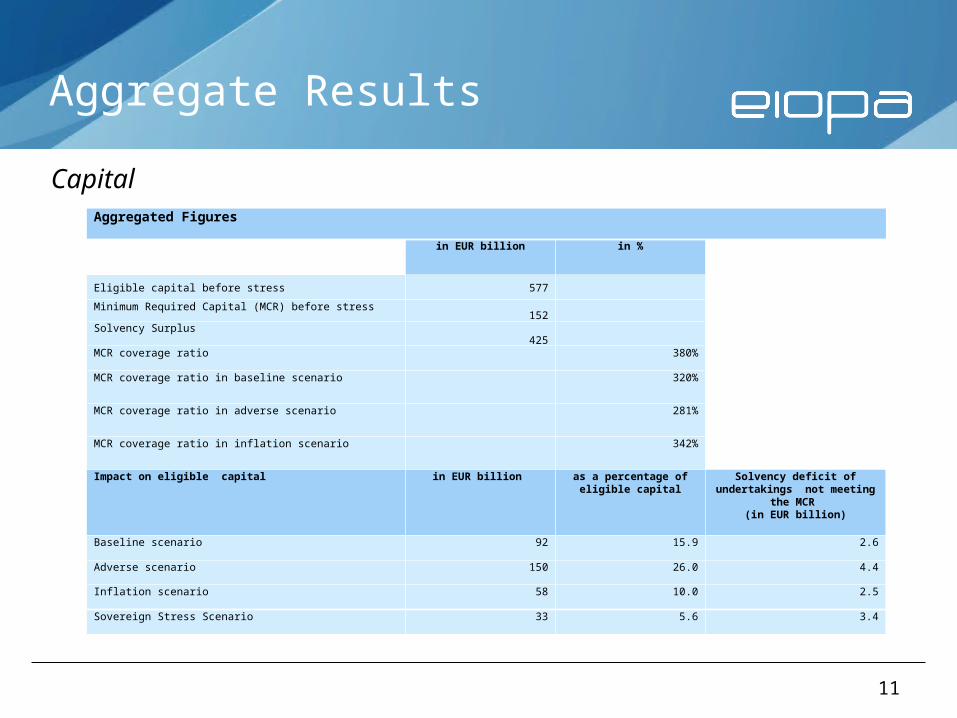
Aggregate Results
Aggregated Figures
in EUR billion in %
Eligible capital before stress 577
Minimum Required Capital (MCR) before stress152
Solvency Surplus 425
MCR coverage ratio
380%
MCR coverage ratio in baseline scenario 320%
MCR coverage ratio in adverse scenario 281%
MCR coverage ratio in inflation scenario 342%
Impact on eligible capital in EUR billion as a percentage of eligible capital
Solvency deficit of undertakings not meeting
the MCR (in EUR billion)
Baseline scenario 92 15.9 2.6
Adverse scenario 150 26.0 4.4
Inflation scenario 58 10.0 2.5
Sovereign Stress Scenario 33 5.6 3.4
Capital
12
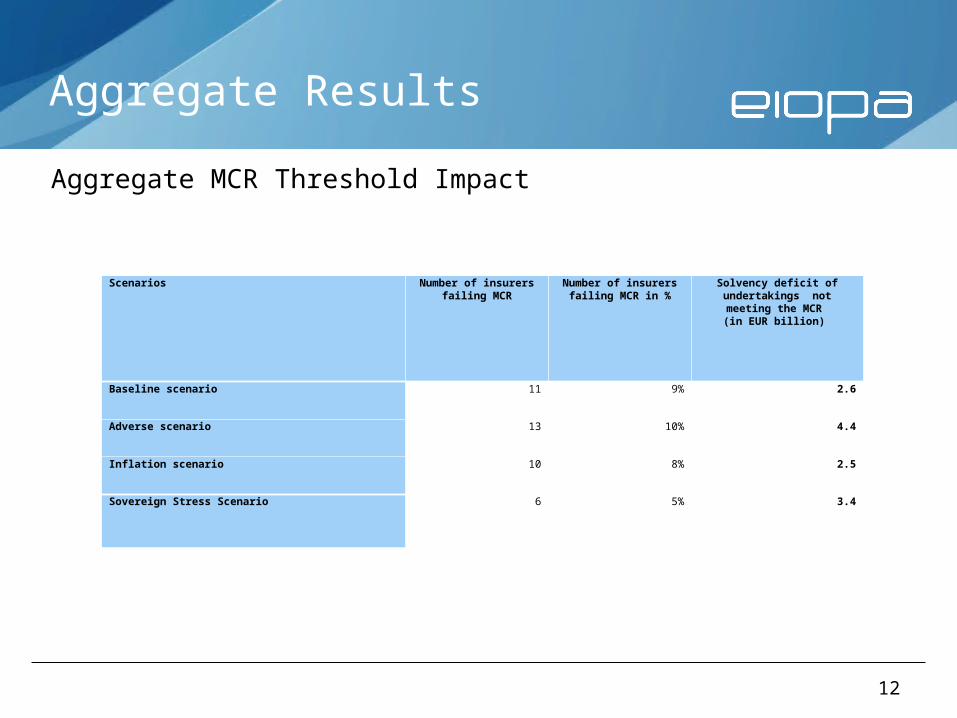
Aggregate Results
Aggregate MCR Threshold Impact
Scenarios Number of insurers failing MCR
Number of insurers failing MCR in %
Solvency deficit of undertakings not meeting the MCR (in EUR billion)
Baseline scenario 11 9% 2.6
Adverse scenario 13 10% 4.4
Inflation scenario 10 8% 2.5
Sovereign Stress Scenario 6 5% 3.4
13
Results: Drivers
• Asset:
Adverse developments in equity prices, interest rates and sovereign debt markets
• Liability:
Non-life risk more critical Increased claims inflation Natural disasters High sensitivity to reinsurance
Range of outcomes depends on the business model
employed by insurer (life vs. non-life)
14
Summary
• Overall the European insurance sector remains robust in the occurrence of major shocks
• 90% of the groups/undertakings tested continue to comply with the Minimum Capital Requirements even in the most adverse scenario
• Main vulnerabilities identified:
Adverse developments in yield curves and sovereign bond markets
Higher than expected rate of severe natural catastrophes combined with limited recourse to reinsurance facilities
15
Follow up
• EIOPA to continue to monitor the evolution of markets and
the main vulnerabilities identified
• National supervisors to discuss the main findings of the
stress test with insurance groups and undertakings
• Results of stress test to be embedded in the individual plans
and strategies to implement Solvency II
• Insurance undertakings to develop strategies to deal with
given scenarios and main vulnerabilities

16
Thank youFor additional questions please contactour press office:Sybille ReitzCommunications Officeremail: [email protected]: +49-69-95111968Mobile: +49-175-9334210


