Page 1
EDIBLE OILS-FATS PRODUCTS – EXPORT MARKETS & POTENTIAL EIP/STR/07/09/2016
(SECTORREPORT)
Export Initiatives & Partnerships Division,
Phone: +9714-4455333; Fax: +9714-4455355 E-mail: [email protected] ; Web: www.dedc.gov.ae
PO Box 123336, Dubai – UAE
Primary Information Source: ITC Trade Map Prepared – September, 2016
Disclaimer: While all attempts have been made to collect & present accurate information, DE makes no warranty, express or implied, as to the fitness, appropriateness of the above information for a particular purpose, or assumes any legal liability for the accuracy or usefulness of any contained information. All 3rd. party information sourced are either through subscriptions of the organization or information freely available on the internet, with no claims to such information, as its own.
Page 2
TABLE OF CONTENTS
# Description Page
Executive Summary 3
1 Top Edible Oils & Fats (HS 1514) Products Importing Countries 4
2 UAE’s Top Export Markets for Edible Oils & Fats (HS 1514) 7
3 HS 1514 - Charts & Maps on Exports & Potential 8
4 Top Edible Oils & Fats (HS 1516) Products Importing Countries 11
5 UAE’s Top Export Markets for Edible Oils & Fats (HS 1516) 14
6 HS 1516 - Charts & Maps on Exports & Potential 15
7 Top Edible Oils & Fats (HS 1518) Products Importing Countries 18
8 UAE’s Top Export Markets for Edible Oils & Fats (HS 1518) 21
9 HS 1518 - Charts & Maps on Exports & Potential 22
Page 3
Executive Summary
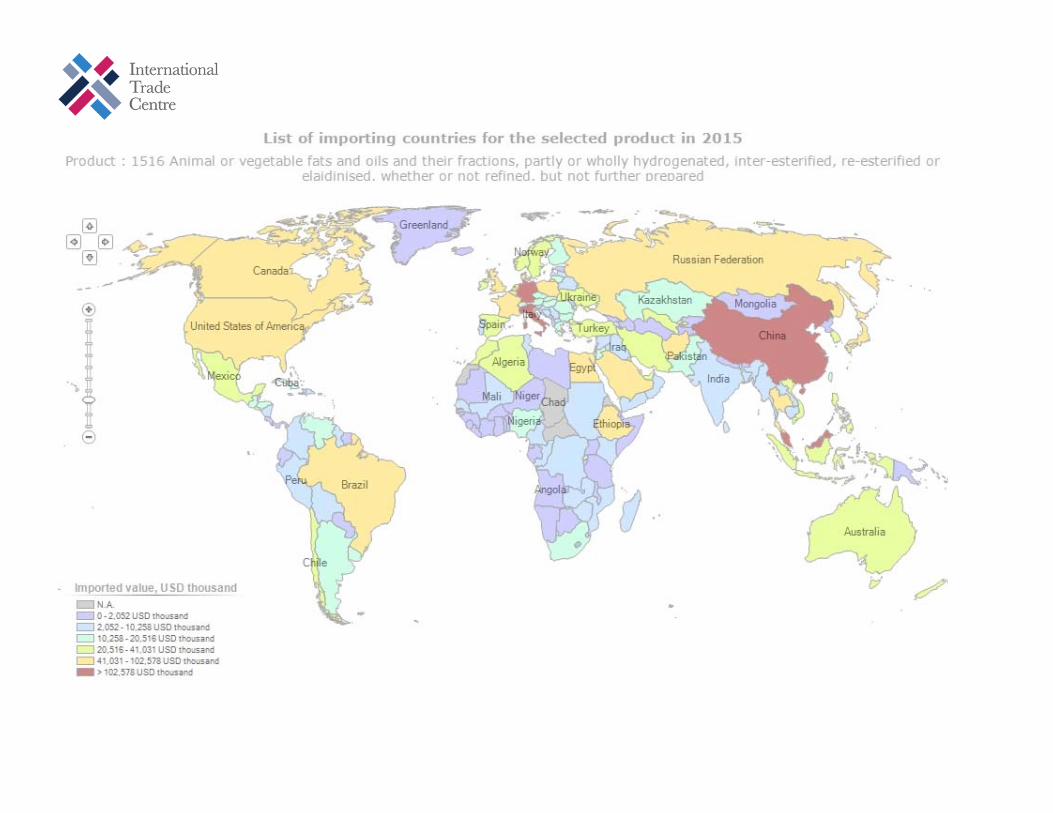
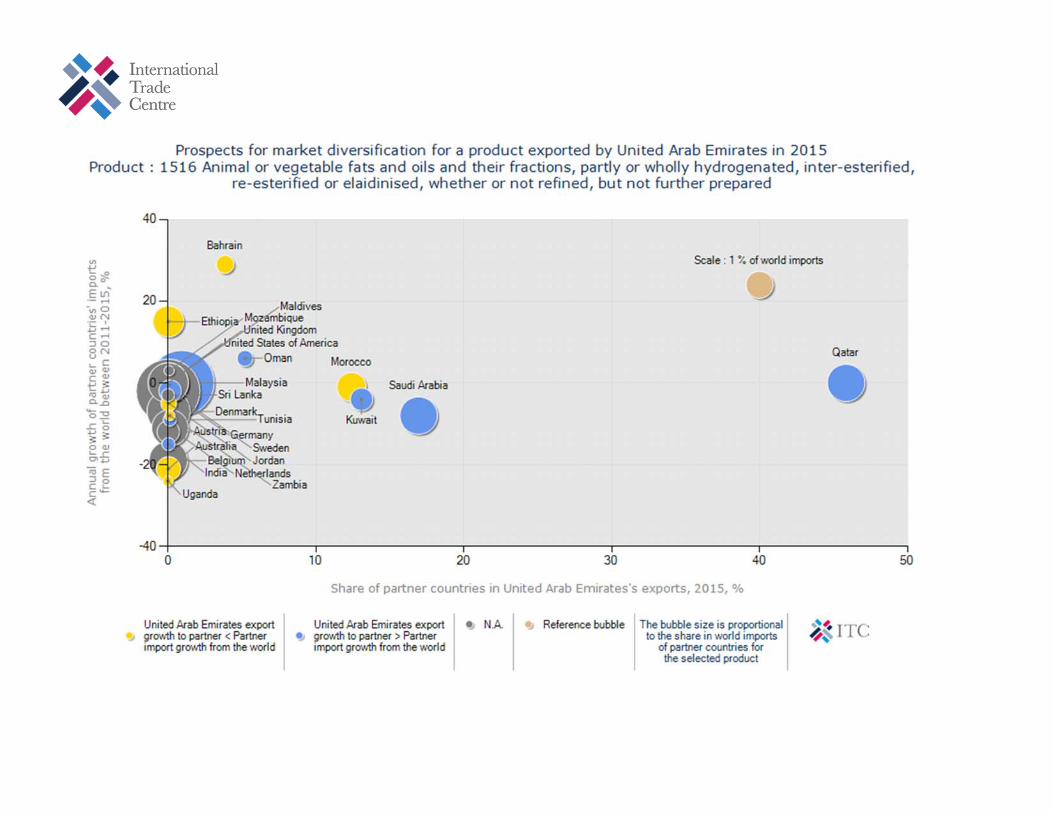
Unknown to many, there are quite a few edible oil producing companies in the UAE like Edible Oil Company LLC, Al Ghurair Resources and Abu Dhabi Vegetable Oil Company. In the year 2015, a global import value of nearly USD 89 Billion was seen in the product range of Animal or vegetable fats and oils and their cleavage products (HS Section 15). Countries with large populations like India, China and USA remain the largest importers of these products (collectively @ 27% of global imports) though the demand for these products spans the globe. This document aims to show you global demand of selected Edible Oil products & UAE role in distributing this product globally. HS 1514 Rape, colza or mustard oil.. As per 2015 ITC data, nearly USD 6 Billion worth of these products were imported globally. Largest importers of this product in 2015 were USA (25%), China (11%); Netherlands (@8.5%), Norway & India, at @ 5% each. UAE’s exports (in 2015) totaled nearly USD 268 Million, with India being the largest importer (at @82% of UAE’s exports), followed by China (14.5%), Malaysia (1.6%) and Singapore (@1%). Potential exists both in terms of market diversification to USA and the EU as also increased export potential to China and the region. HS 1516 Fats and oils, partly or wholly hydrogenated, inter-esterified… In 2015, ITC Data indicated an import value of more than USD 3 Billion. Top importers as a percentage of global imports include Malaysia & Germany (each @ 6.5%), China at 4.1% and Italy at 3.5%. The figures clearly indicate widespread global imports without concentration of imports in selected markets. Apart from exports to other GCC countries (@ 85% of UAE’s exports in 2015), the only other barely significant importers from UAE are in MENA region. As per the ITC Chart on prospects for market diversification, USA, Ethiopia, Zambia, Morocco and Australia are indicated as high potential markets for the UAE. HS 1518 Fats and oils, Boiled, oxidized, dehydrated… Out of a global import value of over USD 2 Billion in 2015, main importers were the EU (@60%), Philippines (16%), South America (@6.5%), followed by North America. UAE’s exports of this product in 2015 @ USD 11 Million was mainly to the EU (@ 93%), followed by smaller quantities to East Asia (Philippines & Malaysia) and Spain. Clearly potential exists for new markets in Africa, Germany & South America. The next few pages aims at giving statistical information on the global imports and UAE exports of these 3 products and we hope it will be useful to DE Members.
Page 4
Sources: ITC calculations based on UN COMTRADE statistics.
Imported value 2015 (USD '000)
Trade balance 2015 (USD '000)
Annual value growth 2011-15 (%, p.a.)
World 5,791,028 446,594 (8)United States of America 1,444,529 (1,336,724) (7)China 657,405 (651,895) (6)Netherlands 487,580 (181,296) (9)Norway 300,910 (300,885) (6)India 280,350 (275,089) 87Germany 269,343 539,787 (18)Belgium 258,887 (30,673) (13)Czech Republic 174,337 227,073 31Sweden 174,213 (141,655) (6)Italy 135,453 (126,030) (14)Austria 127,177 (91,744) (9)
France 123,959 105,809 (28)Slovakia 100,426 (7,591) 5Lithuania 92,416 (28,072) 17Poland 87,406 315,002 (6)
United Kingdom 83,465 104,819 (9)Korea, Republic of 82,392 (82,182) (12)Mexico 72,885 (70,376) (3)Chile 65,631 (60,998) 9
Denmark 59,237 32,485 (5)Spain 48,957 (34,429) 3Hong Kong, China 47,296 (42,881) (8)Latvia 42,094 (30,650) (10)Canada 41,710 2,074,390 (22)Hungary 41,243 12,470 0Malaysia 38,758 14,555 (4)
New Zealand 36,584 (36,057) (9)Israel 36,498 (36,462) (2)Portugal 30,695 (26,294) (14)Australia 27,871 105,389 10
Taipei, Chinese 23,806 (23,764) (12)Ireland 22,609 (17,978) (8)Colombia 19,974 (19,937) 0Japan 19,102 (17,146) (25)Brazil 18,542 (17,649) 11Singapore 16,543 (7,343) (15)Finland 14,230 (13,767) 3Croatia 12,975 (7,429) 10South Africa 12,239 (11,805) (12)Romania 10,682 17,813 (4)Slovenia 10,656 (2,254) 14
HS 1514 Rape, colza or mustard oil and fractions thereof.- Top Importers
Top Importing Countries
Trade Indicators
Page 5
Sources: ITC calculations based on UN COMTRADE statistics.
Imported value 2015 (USD '000)
Trade balance 2015 (USD '000)
Annual value growth 2011-15 (%, p.a.)
HS 1514 Rape, colza or mustard oil and fractions thereof.- Top Importers
Top Importing Countries
Trade Indicators
Indonesia 10,644 (10,643) 21Philippines 9,500 (9,500) 44Greece 8,321 (8,174) (1)Switzerland 6,608 (6,478) (15)Faroe Islands 6,206 (6,206) 115Bulgaria 5,109 8,678 70United Arab Emirates 5,060 263,080 5Saudi Arabia 4,984 (4,984) 12Macao, China 4,904 (4,904) (5)Morocco 4,774 (4,771) 187Estonia 4,102 32,567 (23)Argentina 3,676 2,871 8Panama 3,246 (3,246) 4Fiji 3,232 (3,111) (7)Ukraine 3,073 129,832 60Thailand 3,050 (2,949) 19Iceland 3,040 (3,040) 8Viet Nam 2,987 (2,973) (7)Uzbekistan 2,690 (2,690) 50
Turkey 2,558 (1,675) 16Honduras 2,399 (1,645) 46Tunisia 2,384 (2,384) (65)Guatemala 2,311 (2,310) 18El Salvador 2,061 (1,990) 10Belarus 1,974 86,085 7Lebanon 1,966 (1,966) (9)Dominican Republic 1,948 (1,948) (25)
Tajikistan 1,948 (1,948) (18)Russian Federation 1,832 189,051 0Cyprus 1,822 (1,811) (40)Kuwait 1,807 (1,807) 30Ecuador 1,506 (1,506) (16)Afghanistan 1,323 (1,323) (4)Costa Rica 1,206 (1,206) 10Kazakhstan 1,106 4,967 206Bahrain 984 (984) 21Mongolia 843 (843) 33Luxembourg 816 (751) 4Oman 779 (777) (13)Bhutan 629 (629)Malta 604 (604) (9)Trinidad and Tobago 550 (550) (17)Peru 484 (483) 3
Page 6
Sources: ITC calculations based on UN COMTRADE statistics.
Imported value 2015 (USD '000)
Trade balance 2015 (USD '000)
Annual value growth 2011-15 (%, p.a.)
HS 1514 Rape, colza or mustard oil and fractions thereof.- Top Importers
Top Importing Countries
Trade Indicators
Egypt 464 (294) 301Qatar 433 (427) 15Bermuda 422 (422) (6)French Polynesia 414 (414) (14)Bangladesh 411 3,476 15Serbia 396 7,975 (23)Myanmar 370 (370)Uruguay 369 345 2Mauritius 363 (363) (13)Sri Lanka 361 (361) (1)Iran, Islamic Republic of 356 (356) (24)Nicaragua 338 (338) 22British Virgin Islands 305 (305) 36Nepal 239 (23) (9)Bosnia and Herzegovina 214 1,417 (31)New Caledonia 210 (210) 23Bahamas 191 (191) 0Netherlands Antilles 186 (186) (11)Kenya 159 (159) 10Ghana 153 (153) (6)Nigeria 134 (131) 92Iraq 126 (126) 36Georgia 106 (106) 102
Page 7
Sources: ITC calculations based on UN COMTRADE statistics.
Exported value 2015 (USD '000)
Trade balance 2015 (USD thousand)
Share in United Arab Emirates's
exports (%)
Exported growth in value between 2011-2015 (%,
p.a.)
Total 268,140 263,080 100 (6)
India 219,809 218,887 82.0 84China 38,862 38,862 14.5 34Malaysia 4,498 4,498 1.7 22Singapore 2,688 2,688 1.0 (14)Saudi Arabia 945 945 0Philippines 613 613 0Oman 553 551 0 (21)Korea, Republic of 75 75 0Bahrain 59 59 0 (19)Maldives 21 21 0 14United States of America 9 (430) 0 (6)Qatar 5 5 0 (36)France 1 (1,674) 0 (97)Sweden 1 1 0Uganda 1 1 0 (2)United Kingdom 1 (5) 0
Product label
Trade Indicators
UAE's Exports to World - HS 1514 Rape, colza or mustard oil and fractions thereof.
Page 11
Sources: ITC calculations based on UN COMTRADE statistics.
Imported value 2015 (USD '000)
Trade balance 2015 (USD '000)
Annual value growth 2011-15 (%, p.a.)
World 3,079,754 354,119 (10)Malaysia 205,156 1,347,887 0Germany 200,885 33,793 (2)China 126,351 (125,774) (20)Italy 109,616 (100,882) 11Russian Federation 97,050 (89,050) (8)Poland 96,221 (89,028) (5)France 90,034 (58,785) (4)Denmark 86,065 (70,479) (7)United States of America 77,953 79,626 0United Kingdom 75,395 (31,359) 0Egypt 73,261 (59,590) (21)
Thailand 70,418 (35,335) (12)Canada 67,291 (53,642) (16)Belgium 67,213 (4,819) (19)Saudi Arabia 65,663 (40,944) (8)
Qatar 63,150 (62,720) 0Netherlands 61,779 189,863 (11)Afghanistan 59,858 (59,858) (25)Brazil 49,821 (40,654) 3
Japan 45,184 (39,375) (1)Ethiopia 43,541 (42,369) 15Turkey 40,924 (29,246) (4)Morocco 38,289 (35,096) (1)Algeria 37,717 (37,705) (13)Iran, Islamic Republic of 35,968 (35,483) 1Chile 35,012 (1,601) (10)
Ukraine 34,051 (28,276) (21)Rwanda 32,272 (32,165) 12Viet Nam 31,707 (30,699) 2Philippines 31,060 (24,846) 10
Spain 28,980 23,692 (11)Uzbekistan 27,247 (27,247) 31Mexico 26,809 (9,156) 14Ireland 26,482 (24,811) (6)Singapore 26,343 29,071 1Indonesia 25,476 153,816 (14)Australia 24,918 (16,120) (21)Norway 24,427 (24,408) 2Korea, Republic of 23,354 (11,564) 4Kuwait 22,397 (21,941) (4)
HS 1516 Animal or vegetable fats and oils and their fractions, partly or wholly hydrogenated - Top Importers
Top Importing Countries
Trade Indicators
Page 12
Sources: ITC calculations based on UN COMTRADE statistics.
Imported value 2015 (USD '000)
Trade balance 2015 (USD '000)
Annual value growth 2011-15 (%, p.a.)
HS 1516 Animal or vegetable fats and oils and their fractions, partly or wholly hydrogenated - Top Importers
Top Importing Countries
Trade Indicators
New Zealand 22,182 (21,652) (9)Sweden 22,035 55,969 (2)United Arab Emirates 20,730 90,221 (20)Austria 20,202 (18,238) (12)Romania 17,585 (15,290) (10)Israel 17,433 (17,413) (4)Kazakhstan 16,866 (14,370) (11)Hungary 16,749 (16,083) (5)Bulgaria 16,219 (9,418) (7)Pakistan 16,100 43,488 (24)Czech Republic 15,865 (13,437) (13)Guatemala 14,937 (1,253) 3Venezuela, Bolivarian Republic of 14,664 (14,664) 14Switzerland 14,321 (12,203) 4South Africa 13,986 (7,029) (8)Slovakia 13,882 10,065 (5)Taipei, Chinese 13,837 (11,049) 2Cuba 13,149 (13,149) (3)Uruguay 13,048 (13,048) 60El Salvador 12,495 (8,016) (22)
Argentina 11,566 (11,341) (8)Honduras 11,211 2,735 (8)Lithuania 11,199 (8,661) (2)Bahrain 11,073 (10,525) 29Greece 10,844 2,401 (8)Lebanon 10,589 (10,487) (4)Finland 10,562 (10,536) 5Jordan 10,409 (7,525) (5)
Nigeria 10,288 (10,256) (2)Peru 9,490 (5,370) 2Belarus 8,998 (7,929) 1Cambodia 8,728 (8,728) (16)Latvia 8,271 (2,198) (12)Oman 8,026 3,502 6Portugal 7,807 (5,867) (9)Zimbabwe 7,603 (7,603) 3Myanmar 7,534 (7,534) (3)Colombia 6,981 8,319 5Bangladesh 6,480 (6,164) (5)Sri Lanka 6,010 (3,255) (3)Tunisia 5,964 4,794 (9)Syrian Arab Republic 5,660 (5,273) (38)
Page 13
Sources: ITC calculations based on UN COMTRADE statistics.
Imported value 2015 (USD '000)
Trade balance 2015 (USD '000)
Annual value growth 2011-15 (%, p.a.)
HS 1516 Animal or vegetable fats and oils and their fractions, partly or wholly hydrogenated - Top Importers
Top Importing Countries
Trade Indicators
Lao People's Democratic Republic 5,491 (5,491) 5India 5,327 57,855 (15)Brunei Darussalam 5,236 (5,235) 10Iraq 4,630 (4,630) (69)Senegal 4,557 (4,555) (1)Guyana 4,461 (4,460) 3Bosnia and Herzegovina 4,154 (4,154) (18)Macedonia, The Former Yugoslav Re 4,126 (3,981) (8)Barbados 4,045 (4,038) (9)Yemen 4,001 (1,155) (16)Dominican Republic 3,763 (3,131) (22)Bolivia, Plurinational State of 3,473 (3,473) (2)Mauritius 3,352 (3,248) (15)Zambia 3,279 (1,074) (8)Mali 3,184 (3,078) 217Sudan (North + South) 2,920 (2,920) (23)Croatia 2,913 659 (33)Kenya 2,588 (1,587) (27)Mozambique 2,543 (2,543) 3Armenia 2,497 (2,493) (23)Trinidad and Tobago 2,423 (2,422) (14)Congo, Democratic Republic of the 2,402 (2,402) (35)Serbia 2,369 241 (6)Madagascar 2,281 (2,280) (7)Nicaragua 2,273 (2,149) (22)Congo 2,161 (2,161) 151Cameroon 2,146 (2,146) 117Slovenia 2,065 (2,000) (4)Paraguay 2,044 (2,044) 2
Page 14
Sources: ITC calculations based on UN COMTRADE statistics.
Exported value 2015 (USD '000)
Trade balance 2015 (USD thousand)
Share in United Arab Emirates's
exports (%)
Exported growth in value between 2011-2015 (%,
p.a.)
Total 110,951 90,221 100 4
Qatar 50,871 50,849 45.9 2Saudi Arabia 18,811 18,658 17.0 (1)Kuwait 14,526 14,425 13.1 24Morocco 13,774 13,774 12.4 (3)Oman 5,789 (2,378) 5.2 24Bahrain 4,293 4,097 3.9 18Malaysia 1,041 (4,218) 0.9 142Sweden 170 170 0 197Netherlands 162 162 0Zambia 150 150 0 (10)Tunisia 146 146 0 7Mozambique 97 97 0Jordan 67 67 0 (19)Denmark 56 18 0United States of America 51 (129) 0 (10)Australia 50 (571) 0 (25)India 48 (1,908) 0 181Ethiopia 41 41 0 (29)Austria 35 35 0Belgium 35 (65) 0United Kingdom 26 (16) 0Germany 22 (170) 0Sri Lanka 11 11 0Uganda 10 10 0 (44)Maldives 6 6 0 (26)Madagascar 5 5 0Tanzania, United Republic of 5 5 0 6Switzerland 3 3 0Indonesia 2 (585) 0 13Guinea 1 1 0 (46)Pakistan 1 1 0
Product label
Trade Indicators
UAE's Exports to World - HS 1516 Animal or vegetable fats and oils and their fractions, partly or wholly hydrogenated
Page 18
Sources: ITC calculations based on UN COMTRADE statistics.
Imported value 2015 (USD '000)
Trade balance 2015 (USD '000)
Annual value growth 2011-15 (%, p.a.)
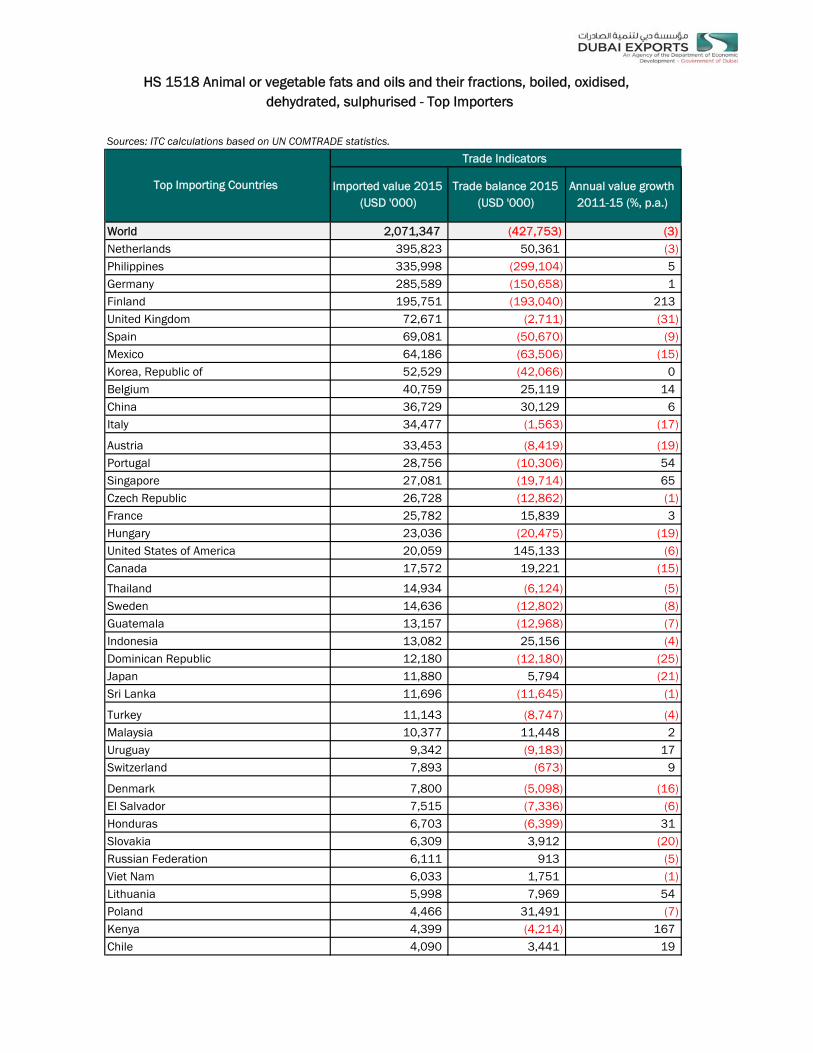
World 2,071,347 (427,753) (3)Netherlands 395,823 50,361 (3)Philippines 335,998 (299,104) 5Germany 285,589 (150,658) 1Finland 195,751 (193,040) 213United Kingdom 72,671 (2,711) (31)Spain 69,081 (50,670) (9)Mexico 64,186 (63,506) (15)Korea, Republic of 52,529 (42,066) 0Belgium 40,759 25,119 14China 36,729 30,129 6Italy 34,477 (1,563) (17)
Austria 33,453 (8,419) (19)Portugal 28,756 (10,306) 54Singapore 27,081 (19,714) 65Czech Republic 26,728 (12,862) (1)France 25,782 15,839 3Hungary 23,036 (20,475) (19)United States of America 20,059 145,133 (6)Canada 17,572 19,221 (15)
Thailand 14,934 (6,124) (5)Sweden 14,636 (12,802) (8)Guatemala 13,157 (12,968) (7)Indonesia 13,082 25,156 (4)Dominican Republic 12,180 (12,180) (25)Japan 11,880 5,794 (21)Sri Lanka 11,696 (11,645) (1)
Turkey 11,143 (8,747) (4)Malaysia 10,377 11,448 2Uruguay 9,342 (9,183) 17Switzerland 7,893 (673) 9
Denmark 7,800 (5,098) (16)El Salvador 7,515 (7,336) (6)Honduras 6,703 (6,399) 31Slovakia 6,309 3,912 (20)Russian Federation 6,111 913 (5)Viet Nam 6,033 1,751 (1)Lithuania 5,998 7,969 54Poland 4,466 31,491 (7)Kenya 4,399 (4,214) 167Chile 4,090 3,441 19
HS 1518 Animal or vegetable fats and oils and their fractions, boiled, oxidised, dehydrated, sulphurised - Top Importers
Top Importing Countries
Trade Indicators
Page 19
Sources: ITC calculations based on UN COMTRADE statistics.
Imported value 2015 (USD '000)
Trade balance 2015 (USD '000)
Annual value growth 2011-15 (%, p.a.)
HS 1518 Animal or vegetable fats and oils and their fractions, boiled, oxidised, dehydrated, sulphurised - Top Importers
Top Importing Countries
Trade Indicators
Hong Kong, China 3,974 5,674 (5)Venezuela, Bolivarian Republic of 3,936 (3,451) (57)Australia 3,786 (1,340) (7)Brazil 3,604 9,721 (15)Egypt 3,392 (1,246) (8)Peru 3,363 710 8Colombia 3,170 3,943 (11)Bangladesh 3,156 (3,035) 2Bosnia and Herzegovina 3,131 (2,931) (21)Ethiopia 2,888 (2,888) 106Pakistan 2,881 (2,881) (1)United Arab Emirates 2,727 8,565 15Romania 2,633 515 8Ireland 2,565 (2,144) (26)Iran, Islamic Republic of 2,465 (2,459) 0Burundi 2,398 (2,398) 718Congo, Democratic Republic of the 2,369 (2,369) (6)Myanmar 2,368 (2,367) (20)South Africa 2,266 3,678 (2)Qatar 2,221 (1,119) 39
Israel 1,946 (1,941) (15)Slovenia 1,855 2,618 (6)Costa Rica 1,694 (1,562) (26)Saudi Arabia 1,650 (1,122) 0Trinidad and Tobago 1,618 (1,172) (3)Angola 1,461 (1,461) 143Syrian Arab Republic 1,359 (1,359) (24)India 1,344 31,226 (6)
Norway 1,274 2,811 (38)Greece 1,228 (1,159) (3)Croatia 1,124 1,574 (26)Iraq 885 (885) (16)Bulgaria 858 1,603 (53)Jamaica 857 (857) (34)Taipei, Chinese 839 33,652 (25)New Zealand 838 (321) (16)Nicaragua 760 (748) (20)Kuwait 727 850Luxembourg 717 (621) 1Ecuador 717 (612) (5)Tanzania, United Republic of 701 5,702 294
Page 20
Sources: ITC calculations based on UN COMTRADE statistics.
Imported value 2015 (USD '000)
Trade balance 2015 (USD '000)
Annual value growth 2011-15 (%, p.a.)
HS 1518 Animal or vegetable fats and oils and their fractions, boiled, oxidised, dehydrated, sulphurised - Top Importers
Top Importing Countries
Trade Indicators
Panama 679 (679) (2)Malawi 675 (675) (5)Tunisia 619 1,029 14Ukraine 520 107 2Nigeria 509 (509) (17)Morocco 477 2,385 (12)Djibouti 454 (447) 33Uganda 453 (230) 425Argentina 369 80,318 (20)Malta 365 (365) 96Yemen 360 (360) 23Kazakhstan 341 (341) 7Serbia 334 1,242 1Sudan (North + South) 298 (298) 4Papua New Guinea 281 (273) 22Côte d'Ivoire 271 (271) 0Haiti 267 (267)Cuba 265 (264) 29Lebanon 251 3,819 (5)Belarus 249 4,974 (52)Free Zones 216 212 27Ghana 211 161 (9)Cambodia 194 27 (7)Jordan 180 724 (3)Brunei Darussalam 160 (160) (34)
Page 21
Sources: ITC calculations based on UN COMTRADE statistics.
Exported value 2015 (USD '000)
Trade balance 2015 (USD thousand)
Share in United Arab Emirates's
exports (%)
Exported growth in value between 2011-2015 (%,
p.a.)
Total 11,292 8,565 100 64
Netherlands 6,031 5,937 53.4United Kingdom 4,270 4,264 37.8Spain 348 348 3.1Germany 266 243 2.4Philippines 240 240 2.1Malaysia 40 40 0Saudi Arabia 29 29 0Oman 27 (11) 0India 23 (319) 0 (45)Mozambique 5 5 0Pakistan 4 4 0Kuwait 3 (148) 0Madagascar 2 2 0Qatar 1 (893) 0 208Sweden 1 1 0Uganda 1 1 0Tanzania, United Republic of 1 1 0 (25)
Product label
Trade Indicators
UAE's Exports to World - HS 1518 Animal or vegetable fats and oils and their fractions, boiled, oxidised, dehydrated, sulphurised


![[MC 1516] Questionnaire](https://static.documents.pub/doc/80x56/568ca9051a28ab186d9bbee1/mc-1516-questionnaire.jpg)