+ All Categories
Home > Documents > Electric transmission line routing using a decision - SOAR

Electric transmission line routing using a decision - SOAR

Date post: 12-Mar-2022
Category:
Upload: others
View: 2 times
Download: 0 times
Share this document with a friend
93
ELECTRIC TRANSMISSION LINE ROUTING USING A DECISION LANDSCAPE BASED METHODOLOGY A Thesis by Ramandeep Singh Gill B.Tech, Punjab Technical University, Jalandhar, 2002 Submitted to College of Engineering and the faculty of the Graduate School of Wichita State University in Partial fulfillment of the requirements for the degree of Master of Science December 2005
Transcript

ELECTRIC TRANSMISSION LINE ROUTING USING A DECISION LANDSCAPE BASED METHODOLOGY

A Thesis by

Ramandeep Singh Gill

B.Tech, Punjab Technical University, Jalandhar, 2002

Submitted to College of Engineering

and the faculty of the Graduate School of Wichita State University in Partial fulfillment of

the requirements for the degree of Master of Science

December 2005

ii

ELECTRIC TRANSMISSION LINE ROUTING USING A DECISION LANDSCAPE BASED METHODOLOGY

I have examined the final copy of this thesis for form and content and recommend that it be accepted in partial fulfillment of the requirements for the degree of Master of Science with a major in Electrical Engineering.

_________________________________

Ward T. Jewell, Ph.D., Committee Chair

We have read this thesis and recommend its acceptance:

_________________________________

John Watkins, Ph.D., Committee Member

_________________________________

David T. Hughes, Ph.D., Committee Member

iii

ACKNOWLEDGMENTS

I would like to take this opportunity to acknowledge the immense support and inspiration

given to me by my advisor, Dr. Ward T. Jewell, throughout my tenure at Wichita State

University, in general, and for my thesis research project, in particular. I feel honored to have

been able to work with him. Without his help, this work would not be possible. I would like to

thank Dr. Ted Grossardt of University of Kentucky and Dr. Keiron Bailey of University of

Arizona for their guidance and support in learning Geographic Information System.

I also would like to extend my sincere gratitude to members of the committee Dr. John

Watkins and Dr. David T. Hughes, for taking time to attend my defense and for their useful

comments and suggestions. I would also like to acknowledge all my friends and classmates in

electrical engineering. Lastly, I am very grateful to my parents for their constant care and

support.

iv

ABSTRACT

Transmission line construction is one of the most complex engineering projects. Routing

a transmission line is much more difficult than routing any other public infrastructure. The

present system used by utilities is time consuming and does not produce satisfactory results.

Actual construction of a large transmission line can be completed in a year or two, but due to

complexities involved in the approval procedure, and opposition from various groups it can take

years to build a line, and in some cases projects are stopped altogether.

The Geographic Information System is used in several ways by transmission line

designers but its use in routing is limited. A new method, analytical minimum impedance surface

(AMIS), developed by the University of Kentucky Transportation Research Center for routing

highways is being adapted to routing transmission lines. This method will enhance the public

involvement in the routing process, reduce opposition from stakeholders, and increase the

probability of acceptance of the project.

This thesis contains the preliminary work required to apply AMIS to transmission line

routing. Landscape features that affect the route of the line are the most significant part of this

research. These features are incorporated into raster based GIS, and using information gathered

from stakeholders, the route with minimum opposition is developed between two substations.

Routing a line is also affected by the rules and regulations in a particular state. In this thesis a

brief introduction is given to the main legal requirements involved in line routing. Non-point

impacts that are independent of terrain are also given in detail. Potential stakeholders and there

importance in the routing process is also explained in this thesis.

v

TABLE OF CONTENTS

Chapter Page 1. INTRODUCTION .................................................................................................................. 1 1.1 Background...………………………………………………………………………....... 1 1.2 Objective……………………………………………………………………................. 3 1.3 Thesis Organization……………………………………………………………………. 3 2. LANDSCAPE FEATURES FOR LINE ROUTING................................................................ 4

2.1 Introduction to landscape Features…………………….……….………........................ 4

2.2 Socio-Economic Features................................................................................................ 5 2.2.1 Visual Effect………………………………………………………………..... 5 2.2.2 Land Values…………………………………………………………...............7 2.2.3 Relocation………………………………………………………………..........7 2.2.4 Employment…………………………………………………...........................8 2.2.5 Native American land………………………………………............................8 2.2.6 Linear Developments………………………………………………………….8 2.2.7 Land Clearing…………………………………………………….................... 9 2.2.8 Industrial Development……………………………………………................. 9 2.2.9 Population Density………………………………………….............................9

2.3 Environmental features……………………………………………………….............. 10 2.3.1 Construction…………………………………………………………............ 10 2.3.2 Seismology………………………………………………………………….. 11 2.3.3 Water Quality……………………………………………………………….. 11 2.3.4 Air Quality………………………………………………………………….. 12 2.3.5 Vegetation……………………………………………………………………12 2.3.6 Wildlife………………………………………………………....................... 13 2.3.7 Fish Habitat…………………………………………………………………. 13 2.4 Health and Safety features……………………………………………………………. 14

2.4.1 Electric Fields………………………………………………………………. 14 2.4.2 Magnetic fields……………………………………………………………... 15 2.4.3 Audible Noise………………………………………………………………. 16 2.4.4 Hazardous Materials…………………………………………..……………. 16 2.4.5 Fire………………………………………………………………………….. 17 2.4.6 Induced Currents……………………………………………………………. 17 2.5 Engineering Features…………………………………………………………..............18

2.5.1 Electromagnetic Interference…………………………...................................18 2.5.2 Lightning……………………………………………………………………..19

vi

2.5.3 Wind………………………………………………………………………… 19 2.5.4 Ice Loading…………………………………………………………………. 20 2.5.5 Forest Fire……………………………………………………………………20 2.5.6 Compact Line……………………………………………………………….. 21 2.6 GIS Features………………………………………………………………………….. 21

3 JUDICIAL REQUIREMENTS FOR TRANSMISSION LINE……………………............. 23 3.1 Introduction to routing laws…………………………………………………………... 23 3.2 State Commission……………………………………………………......................... 23 3.3 Certificate of Public Convenience & Necessity………………………………............ 25 3.3.1 Need for Transmission Line………………………………………………….26 3.3.2 Interference…………………………………………………………………. 26 3.3.3 Project Cost…………………………………………………………………. 27 3.3.4 Land Easement……………………………………………………………….27 3.3.5 Environment Impact…………………………………………………………28 3.4 National Environmental Policy Act…………………………………………................29

4 STAKE-HOLDERS IN TRANSMISSION LINE ROUTING……………………………....30 4.1 Introduction…………………………………………………………………………….30 4.2 Electric Utilities………………………………………………………………………..30 4.3 Telecom Utilities……………………………………………………………………….31 4.4 Railroad Companies……………………………………………………………………31 4.5 Highway authorities…………………………………………………………………....31 4.6 Radio & TV companies………………………………………………………………..31 4.7 Land owners……………………………………………………………………............32 4.8 Indian tribes…………………………………………………………………………....32 4.9 Airport authorities………………………………………………………………...........32 4.10 Chemical Industries…………………………………………………………………....33 4.11 Archeological & historic conservation agencies……………………………………….33 4.12 Cultural & religious bodies…………………………………………………….............33 4.13 Military Installations…………………………………………………………………...33

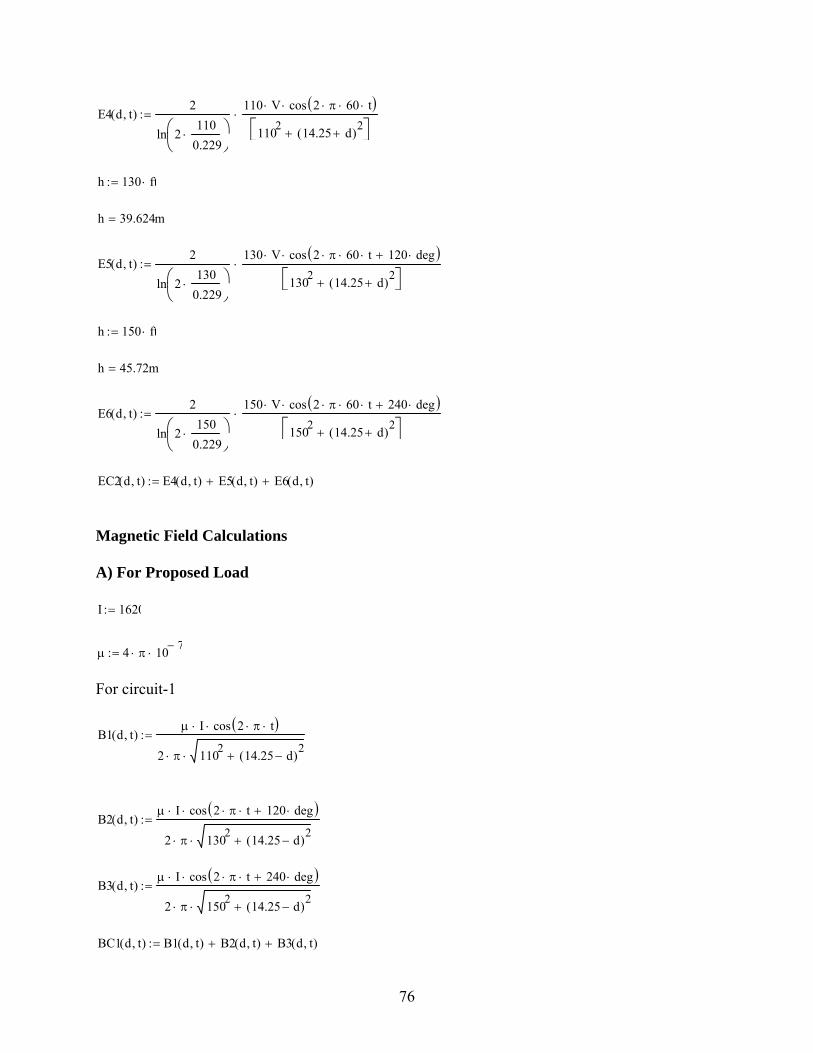
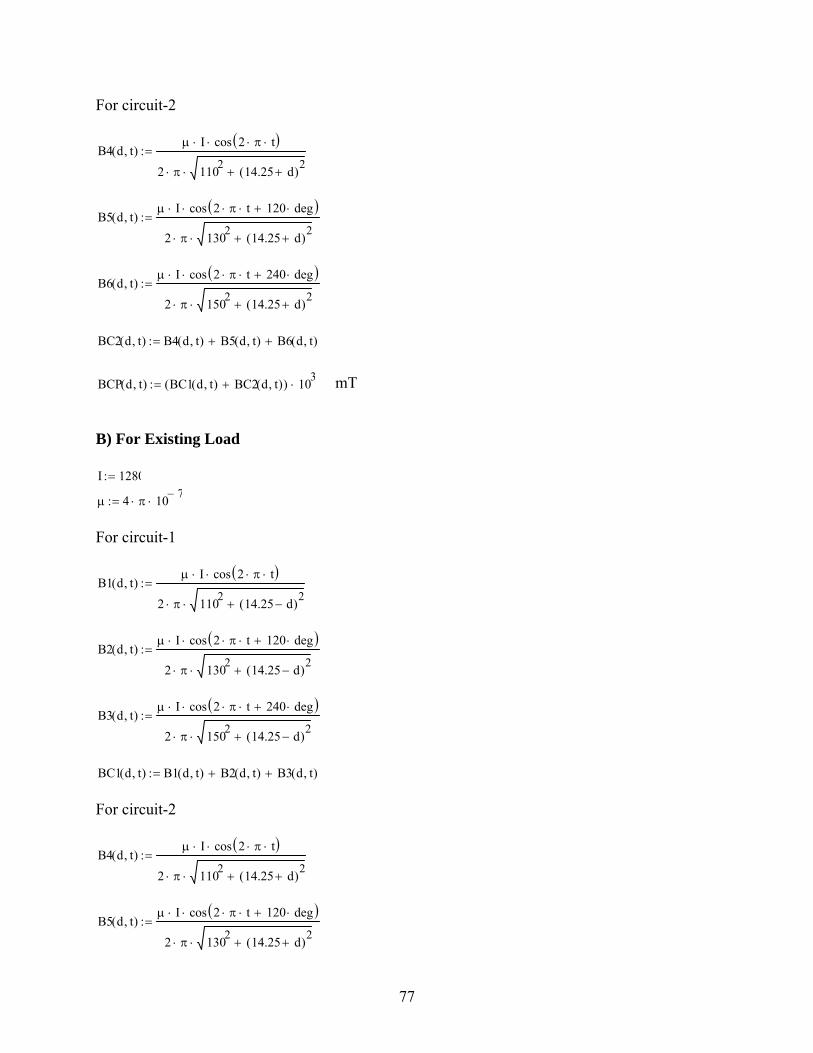
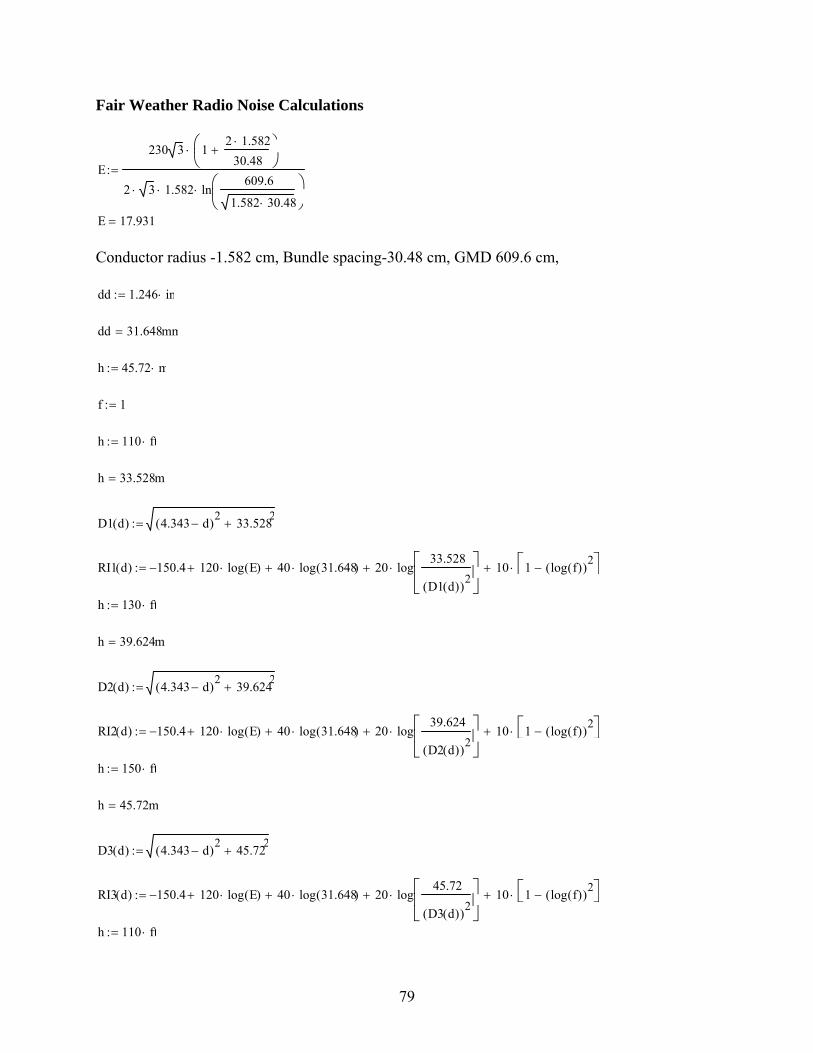
5 NON-POINT IMPACT FEATURES………………………………………………………..35 5.1 Introduction to Non-point Impact features…………………………………………….35 5.2 Electric Fields………………………………………………………………………….36 5.3 Magnetic Fields………………………………………………………………………...39 5.4 Radio Noise…………………………………………………………………………….40 5.5 Audible Noise………………………………………………………………………….41

6 CONCLUSIONS & RECOMMENDATIONS………………………………………………47 6.1 Future Work……………………………………………………………………………48

LIST OF REFERENCES……………………………………………………………...…………..49

vii

APPENDICES……………………………………………………………………………………..52 Appendix-A………………………………………………………………………………………..53 Vertical Clearances…………………………………………………………………………..53 Horizontal Clearances………………………………………………………………………..63 Appendix-B……………………………………………………………………………...................66 List of Stakeholders for Transmission Line Routing………………………………………66 Federal Agencies…………………………………………………………………...............66 State and Local government authorities……………………………………………………67 Non-Governmental Organizations…………………………………………………………69 Appendix-C………………………………………………………………………………………74 Non-point Impact Calculations…………………………………………………………….75 Electric Field Calculations…………………………………………………………………75 Magnetic Field Calculations……………………………………………………………….76 Fair Weather Radio Noise Calculations……………………………………………………79 Audible Noise……………………………………………………………………...............80

viii

LIST OF TABLES Table Page 2.1 Landscape Features for GIS………………………………………………………….. 22 5.1 AVERAGE AMBIENT SOUND LEVELS………………………………………….. 43

ix

LIST OF FIGURES

Figure Page 2.1 North view of Saddle Mountains............................................................................................6

2.2 North view of Saddle Mountains with a simulated power transmission line…………..….. 7

3.1 Permitting categories by state……………………………………………………...............24 3.2 States with one agency authorization ………………………...............................................24 3.3 States in which Power transmission line are permitted by line voltages…………………..25

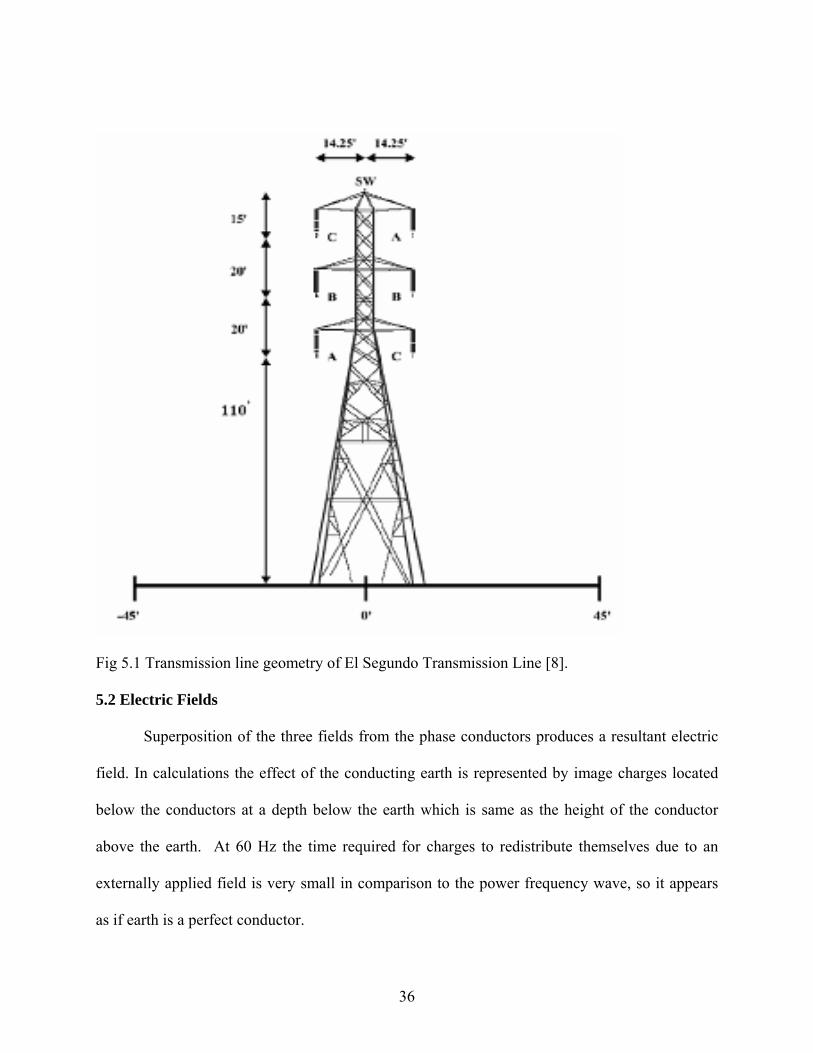
5.1 Transmission line geometry of El Segundo Transmission Line…………………...............36

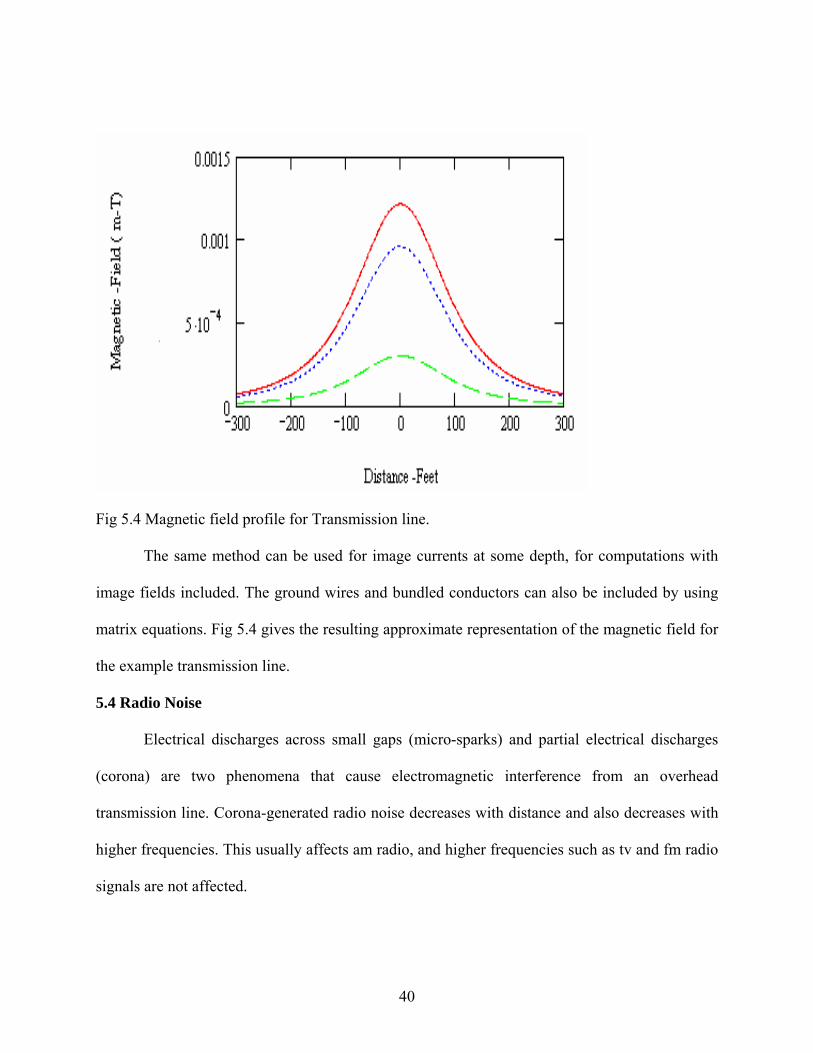
5.2 Single conductor profile………………………………………………………………...….37 5.3 Electric field profile for transmission line……………………………………………...….38 5.4 Magnetic field profile for Transmission line……………………………...……………….40 5.5 Radio noise profile for transmission line……………………………………………...…...41

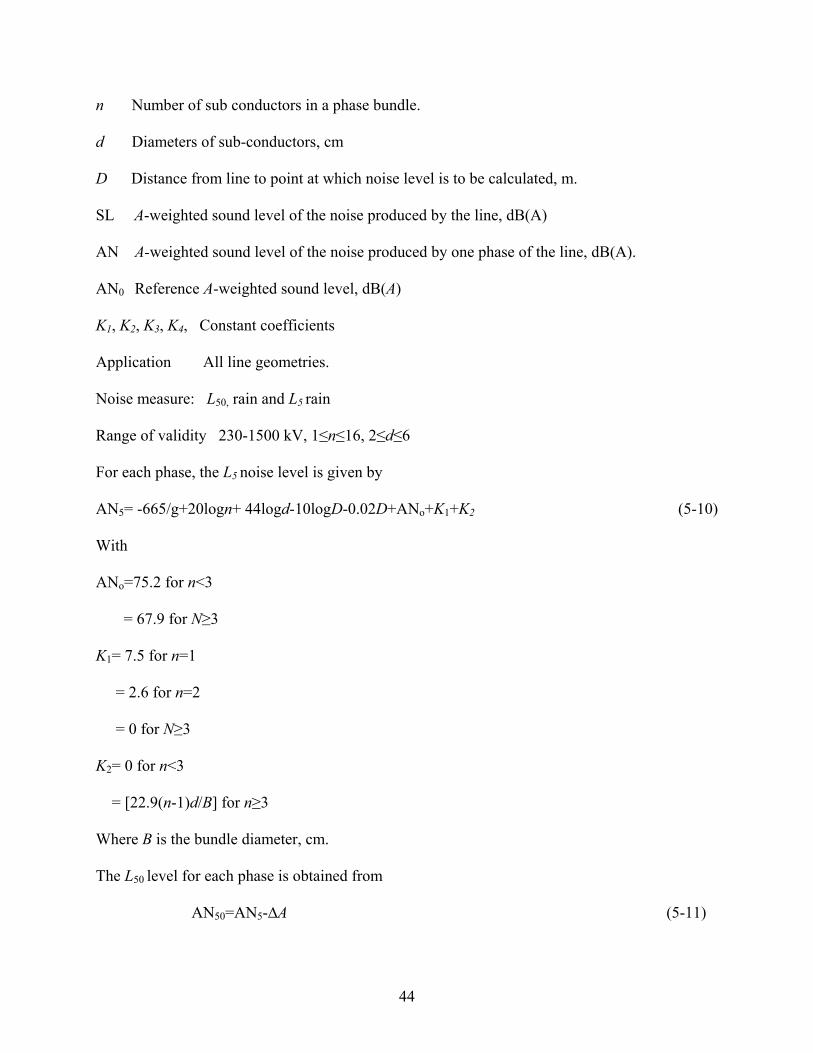
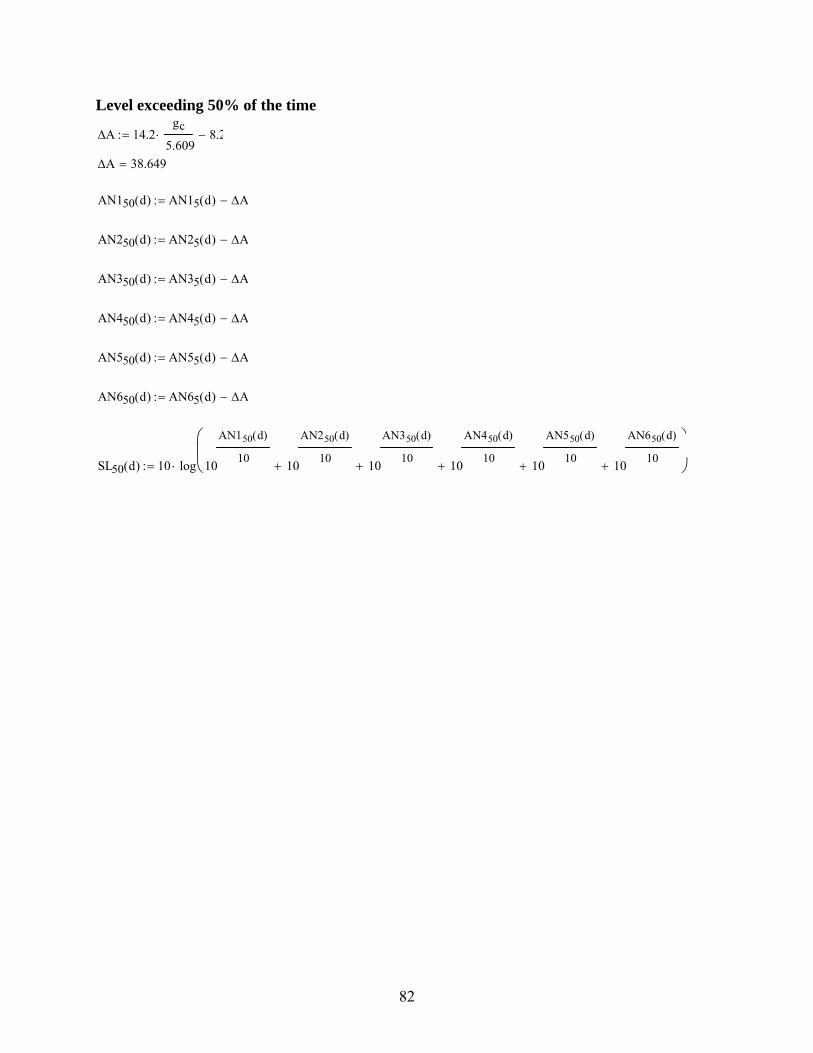
5.6 Audible noise profile for level exceeding 5% of time transmission line…….……….……45

5.7 Audible noise profile for level exceeding 50% of time transmission line………………....46

x

LIST OF ABBREVIATIONS / NOMENCLATURE GIS Geographic Information System AMIS Analytical Minimum Impedance Surface EMF Electro Magnetic Force NESC National Electric Safety Code

xi

LIST OF SYMBOLS ε Electric permittivity µ Magnetic permeability

1

Chapter-1

INTRODUCTION

1.1 Background

The US power transmission system is the one of largest electrical interconnected systems

in this world. Transmission lines delivers and processes bulk electrical power on its way from

generating stations to distribution, which completes the processing and delivers it to consumers.

Demand for electricity continuously also increases over time. In order to meet this demand new

generators are built. The power from these generators will overload existing lines, so new lines

are needed.

Electricity was a regulated industry but Federal Energy Regulatory Commission (FERC)

Order 888 [1] requires wholesale electric power trade in open markets. As a result of this

deregulation, electric power is sold to the highest bidder. This open market is intended to allow

utilities to sell and buy energy from other utilities irrespective of distance. The transmission grid

is expected to carry out such transactions within the utilities. These transactions are for financial

reasons, not for the traditional transmission function of reliability.

Load growth and open markets reduce the reliability and security of the power system.

Utility investment in new technologies like line upgrades, dynamic allocation and real time

monitoring is not enough to meet the required reliability standards. These technologies are not

sufficient to improve reliability in a deregulated environment. New transmission lines are

required to meet the reliability needs of the system.

In the US 10,126.8 line miles of transmission were planned for 1994 to 2004. These are

in different stages of planning and construction [1]. Many of these lines may be delayed or may

2

not be constructed at all. The main reason for this is that it is very difficult, uncertain and

expensive to route lines in US.

Transmission line routing is a complex process which involves local, state and federal

agencies. The route of the line is first approved by the state, usually a state commission, and then

it goes to federal agencies like the Department of Energy (DOE) and FERC for approval.

Depending upon the line route, approval may be required from several federal and state agencies.

The transmission line routing process is highly complex, as transmission lines are not

aesthetically pleasing, and people are concerned about health issues like EMF. This may creates

a high level of public opposition towards a line. Projects may face legal litigation from various

stakeholders involved in the project if their concerns are not properly addressed. Such legal

litigation further delays the project. This result in an increase in the budget of the project and a

stage may come at which the utility finds the project to be financially unfeasible.

This thesis is a part of a multidisciplinary National Science Foundation funded project to

modify and develop a geographic information system (GIS) based methodology for routing

highways [2]. The methodology, analytical minimum impedance surface (AMIS), was developed

by the Kentucky Transportation Research Center, and was successfully applied to highway

routing. AMIS is an analytical tool which facilitates the choice of route corridor. AMIS is built

by specifying multi-criteria priority model developed from the inputs of its participants and

weighting its factors and then integrating this data into the GIS to create the impedance surface.

Ideally, this tool is sufficiently well-designed that it would also be capable of improving

the corridor planning process generally.Highway and transmission line routing are similar

processes and this technique allows line planners to solicit, gather and document information

from stakeholders. This introduces transparency and satisfaction for both the public and planners.

3

GIS is already used in transmission line routing as a technical tool. This research applies

GIS to increase the public involvement in the routing process and which further results in

reductions in time involved in approval of the line. This technique reduces the public resistance

during the planning and design process and allows more people to participate in the complex

infrastructure planning and design problems.

1.2 Objective

The main objective of this thesis to develop a technique to simplify the complex routing

process in which concerns and issues of the stakeholders are addressed in a fair and transparent

manner. This research will apply a GIS based technique developed for routing highways, to the

transmission line routing problem. All the necessary work required to apply this technique to

transmission line routing is presented in this thesis.

1.3 Thesis Organization

This document is organized into six chapters. Chapter two provides the landscape

features for transmission line routing. Chapter three is about the judicial requirements for

transmission line routing. Chapter four highlights the main stakeholders involved in the routing

process. Chapter five presents non-point impact features for line routing. Chapter six presents

conclusions and future work.

4

CHAPTER-2

LANDSCAPE FEATURES FOR LINE ROUTING

2.1 Introduction to landscape Features

The most significant task of this research is to determine the landscape features for

transmission line routing. Landscape features for a transmission line are all those parameters that

can affect the route of a transmission line at any stage during the project. These parameters may

affect the route directly or indirectly and may be visible or not. For this research the landscape

features are used as parameters which will determine the route of the transmission line. The

landscape features are used in AMIS logic, which is a decision support methodology developed

for routing highways. The data collected from AMIS is further integrated into GIS software to

develop a route for a transmission line between the sending end substation and the receiving end

substation.

Many landscape features for routing highways are also landscape features for routing

transmission lines as the two routing processes are very similar to each other. In routing

transmission lines, landscape features are more related to engineering and safety requirements.

Another major difference is the height of the transmission line towers. The height of the tower

makes the transmission line more viewable from a distance than highways, and this result in

more concerns among the local community. The landscape features are explained and

categorized into socio-economic features, environmental features, health and safety features and

engineering features. All features listed in these categories must be considered during line

routing.

5

2.2 Socio-Economic Features

2.2.1 Visual Effect

The socio-economic effects of the power transmission line are the main reasons for the

reluctance of the general public towards a power transmission line project. As mentioned earlier

the height of the transmission line towers makes the line more viewable from a distance, and this

result in altering the scenery of an area. The visual impact of transmission line is an issue of

concern for the public. The criteria used in assessment of visual impacts categorize impacts into

high, moderate and low impact categories.

The impacts are considered high when a transmission line is the dominant feature in the

view, and most viewers see the line in foreground or middle-ground. When the line is within

0.25 to 0.5 miles of the viewer it is in foreground, and middle-ground starts from the foreground

to 5 miles from the viewer. The view is considered background when the line is more than 5

miles from the viewer [3]. The impacts are moderate when the line is clearly visible to the viewer

but not a focal point in its view, and most viewers see the line in the middle-ground. The impacts

are low when a line is visible but are not apparent to the viewer and to most viewers the line is

primarily seen in middle-ground and background.

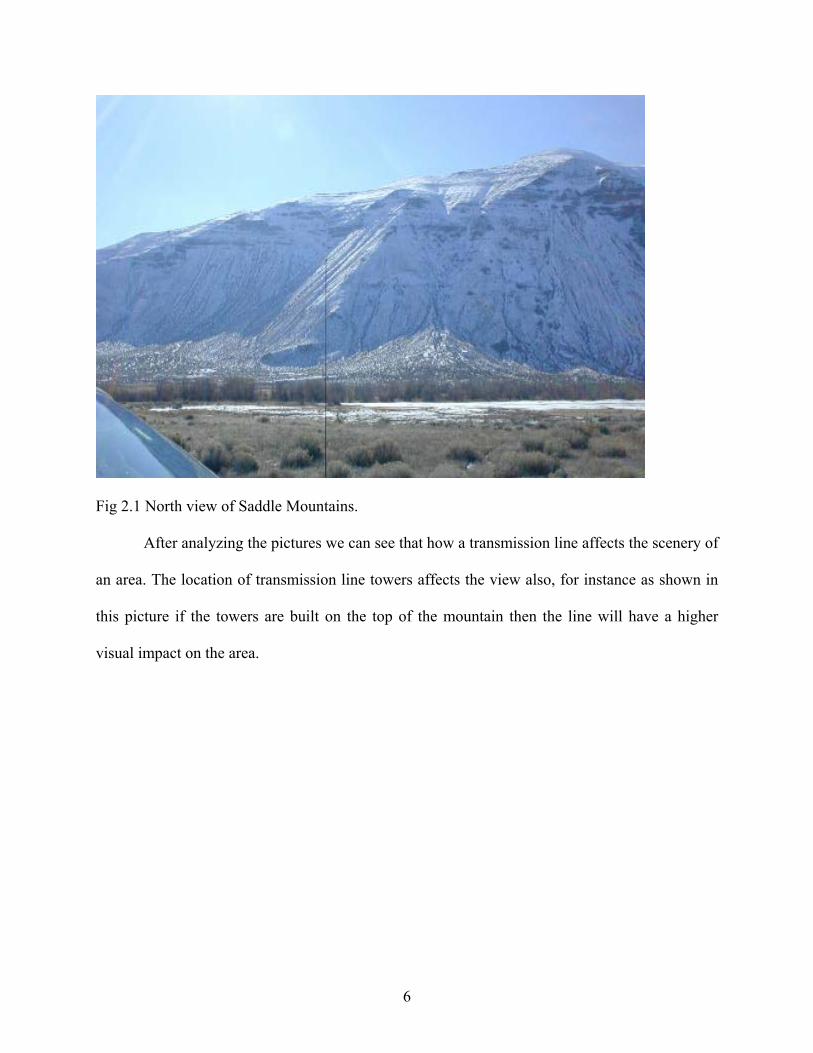
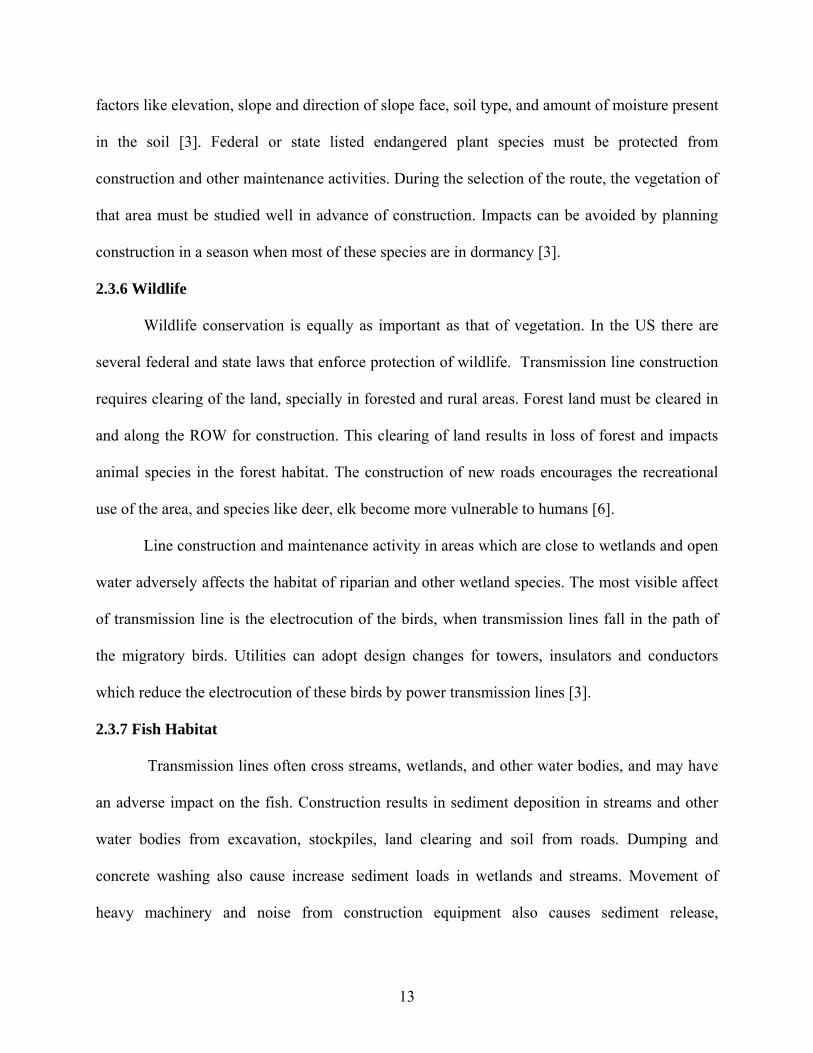
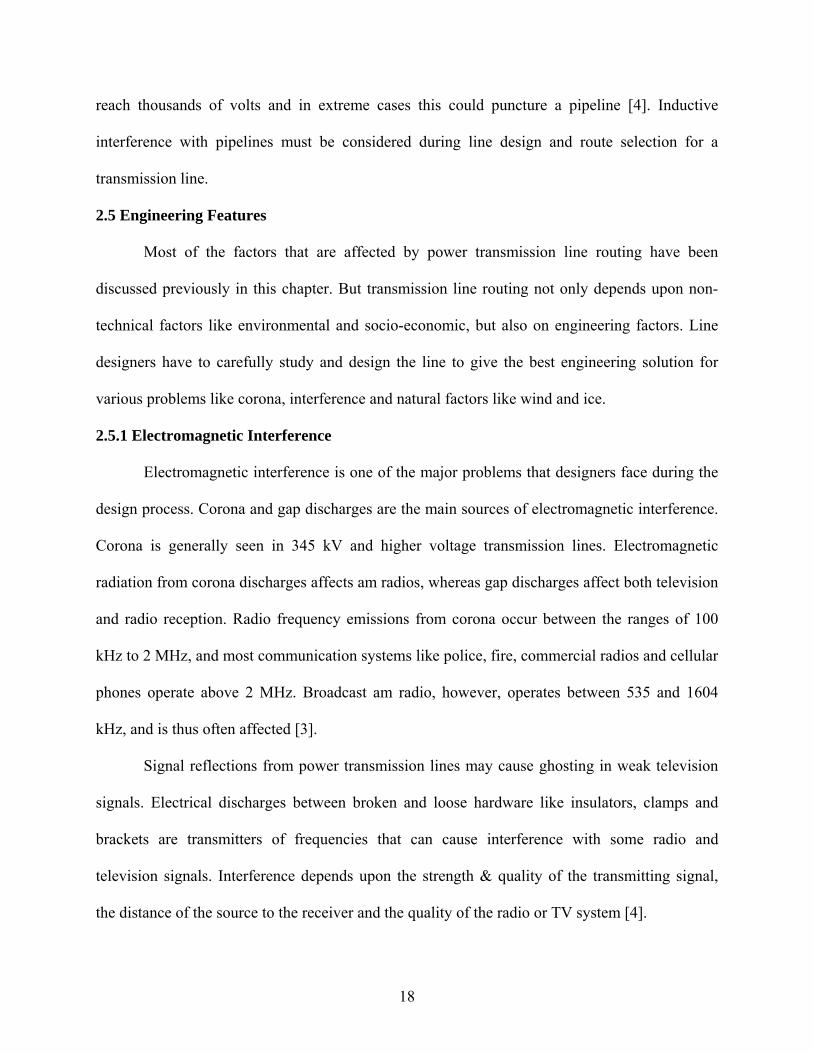
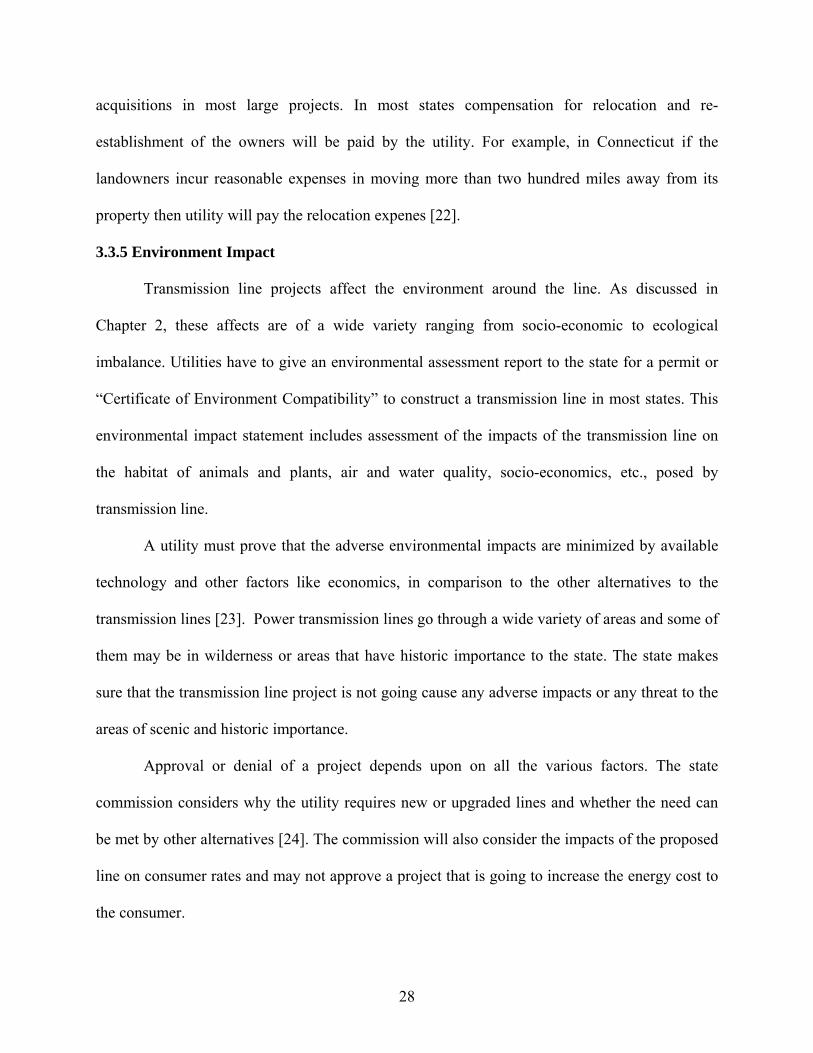
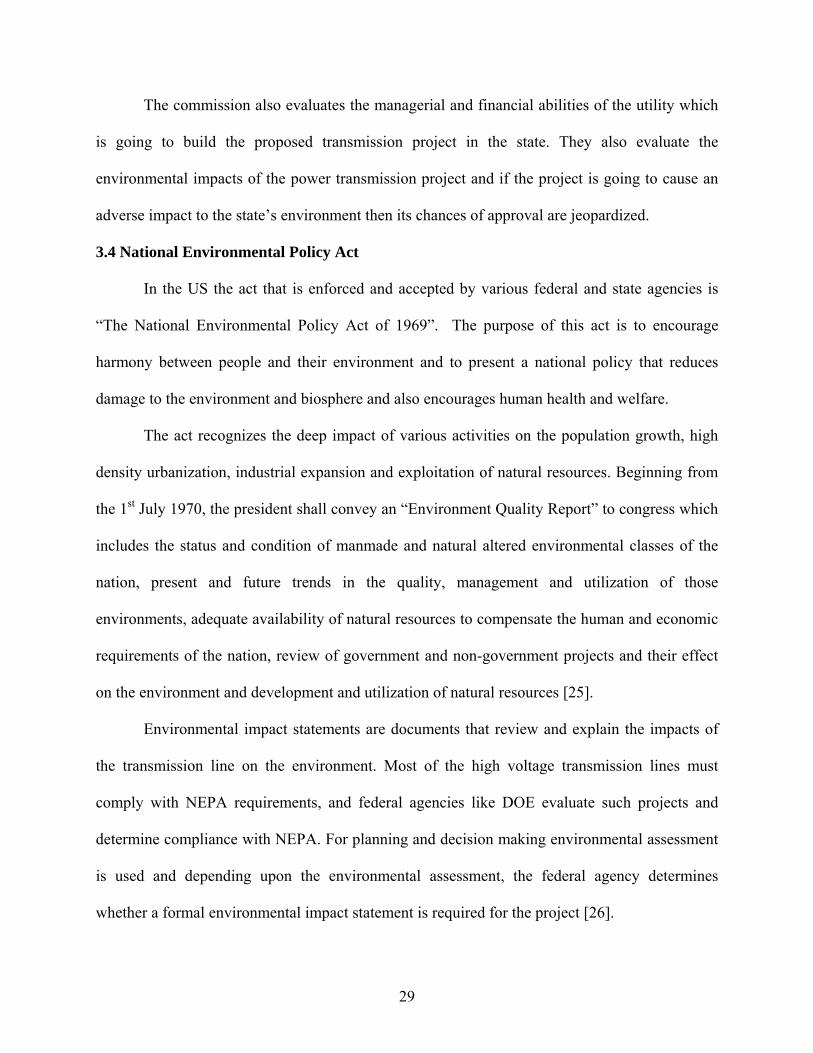
The visual effects of a line can be simulated using software. A simulated transmission

line in a scenic area shows its affect on the scenery of the area. These affects are more prominent

if the lines are in a wilderness area. Fig 2.1 shows a mountain range and Fig 2.2 shows the same

range with simulated transmission line towers.

6

Fig 2.1 North view of Saddle Mountains.

After analyzing the pictures we can see that how a transmission line affects the scenery of

an area. The location of transmission line towers affects the view also, for instance as shown in

this picture if the towers are built on the top of the mountain then the line will have a higher

visual impact on the area.

7

Fig 2.2 North view of Saddle Mountains with a simulated power transmission line.

2.2.2 Land Values

Construction of new buildings or structures has a direct or indirect impact on the land

value of an area. Buildings and infrastructure influence the land value of an area, for instance a

shopping mall in an area tends to increase the land value of that area whereas a chemical

manufacturing plant tends to reduce the land value of that area. Studies have shown that

transmission lines have a variable and erratic impact on property values [3]. Short term adverse

impacts may occur but lines do not usually cause any long-term adverse impacts on the property

adjacent to the right-of-way (ROW) of the transmission line.

2.2.3 Relocation

During the route selection for a transmission line a straight route with minimal curves is

desirable as it gives the best engineering and economic solution. In order to achieve this route the

8

line may have to pass through certain places which are already inhibited by people. Depending

upon the population density and other factors either the community is relocated or the route of

the transmission line is changed. In some cases it is necessary to relocate houses, farms, etc.,

from ROW to another site. For this relocation the company that owns the transmission line is

responsible for the relocation, settlement and income restoration of the affected families. It can

be concluded that such relocations along the route increase the cost of the transmission line.

2.2.4 Employment

Power transmission lines have both positive and negative impacts in a particular area.

During the construction phase the project requires skilled workers for construction of the line. If

the labor is available from the area then it reduces unemployment in that area, and then line has a

temporary positive impact. But in case of a labor shortage, if the project introduces large

numbers of new employees and requires higher salaries to be paid to those non-resident

employees, then line can have an adverse impact. Employment impacts are intermittent and they

are limited to construction phase only [4].

2.2.5 Native American land

In the US there are some areas that belong to Native American tribal communities and

their laws and regulations are different from usual state laws. Most of these areas have cultural,

religious or other sentimental importance to a particular community, and as far as possible such

areas should be avoided by transmission line routes. Any construction in such areas requires

permission from the Native American tribes which can further delay the process.

2.2.6 Linear Developments

Construction of a new gas pipeline, railroad, or power transmission line may create

barriers for other projects. For instance if there is a transmission line between two areas then it

9

affects linear developments such as construction of roads, subways, bridges, etc., between the

two areas. During the initial stages of route selection, the linear developments and other

proposed and approved projects should be considered. If such proposed projects are not

considered in an early stage then they could cause problems later. It may also be possible to route

a line along an existing route of a highway or other linear development.

2.2.7 Land Clearing

Most routes for transmission line go through rural and undeveloped areas, and it is often

required to clear the land in order to maintain proper clearances [5]. In erodible areas and areas

of critical wildlife habitat utilities have to carry out revegetation and land restoration programs.

Land clearing and restoration makes a project more expensive, so during selection of a route

these factors must be considered in determining the most economical route.

2.2.8 Industrial Development

The demand for energy is increased with industrial development of an area, and in order

to meet this demand the grid must have enough transmission capacity to supply the required

power. In areas where the economy is mostly industrial, transmission lines are a limiting factor

on the population. The population will not grow in an area where there is insufficient supply of

energy to support the local industry [6].

2.2.9 Population Density

In general, transmission lines are routed through rural and less populated areas. In high

population areas transmission line projects face higher reluctance due to aesthetic, health

hazards, and other reasons. High population density areas must be avoided. When there is no

alternative or alternatives are not technically feasible, then underground cable should be

10

considered. But underground cable use in transmission line is rare, as it is not economically

feasible.

2.3 Environmental features

2.3.1 Construction

The construction, operation and maintenance of a transmission line have both short term

and long term affects on the environment. Most of the environment impacts are results of

construction and maintenance activities. Poor construction practices in access roads, ROW

clearing, and site preparation have direct effects on the geology of an area.

The construction and maintenance activities alone or in combination with natural factors

could result in landslides. Improper construction activities like poor construction of roads,

improperly placed fills, poorly designed cut slopes; poor drainage and logging degrade the

environment. A deep-seated landslide has a great impact on the line alignment, but its occurrence

is rare [7]. But these activities disturb the soil surface and result in increases in soil erosion, run-

off and sedimentation of water bodies.

Soil erosion is a short term effect of the transmission line construction process. Along the

route some sections may require excavation for access roads, and tower footing requires blasting

of the hard rock. Blasting requires temporary displacement of residents and wildlife from the

area. These excavations in the soil create spoils and slopes which are more prone to soil erosion

than bedrock spoil and slopes [7]. Soil erosion is reduced once cuts and fills along the roads and

areas cleared for tower construction are revegetated.

Another problem is that if towers foundations are built improperly on settlement prone

soil then they settle differentially, and are not functioning as they are designed to function. This

11

result of improper construction requires additional maintenance work which could result in

indirect environmental impacts.

2.3.2 Seismology

The seismology of an area plays an important role in the selection of a route. Earthquake

prone areas must be avoided as far as possible, since an earthquake can force reconstruction of a

power transmission line and could significantly affect its operation if line towers foundations are

damaged. If the towers are constructed on soft ground then they have to withstand strong

amplified motions, which may result in damage to the structure [7]. An unidentified active fault

at a tower location causes tower damage if that fault ruptures. These factors must be considered

and studied in route selection and also during final tower location.

2.3.3 Water Quality

The Federal Clean Water Act requires states to preserve the water quality of the rivers,

streams, lakes and estuaries and develop programs to reduce pollution in water bodies that do not

meet required standards. Power transmission lines often cross streams, lakes and other water

bodies in their route, and construction and maintenance activities could affect water quality in

these bodies.

Line construction can directly affect flood plains by creating obstructions in the paths of

floodwater channels, which increases the potential for flooding. In general, controlled activities

of construction and operation and maintenance activities have no affect on ground water, but

uncontrolled activities like accidental spills of lubricant and fuels can result in contamination of

ground water [7].

12

2.3.4 Air Quality

Transmission line construction activities cause low or moderate impacts on the air quality

of an area. Vehicles and other heavy machinery used in the construction emit pollutants from

fuel ignition like carbon monoxide, carbon dioxide, sulphur oxide, nitrogen oxides, particulate

matter, volatile and semi-volatile compounds. Dust is also generated due to movement of

vehicles and land clearing activities. All these emission and pollutants have short terms effects

and they have low level or no impacts on the air quality.

The corona phenomenon of high voltage transmission lines, discussed in detail later in

this thesis, has a potential impact on air quality during operation of the transmission line.

Transmissions lines operating at 115 kV or above have high electric field strength which causes

the breakdown of the air on the surface of the conductor. This breakdown of the air results in the

production of ozone and oxides of nitrogen. This effect is more prominent in inclement weather

condition like a rainy day [6].

2.3.5 Vegetation

Construction of power transmission lines affects the vegetation of an area. Transmission

line routes are hundreds of miles in length and most parts of the route are in undeveloped areas,

which have various plant species along and within the ROW. Line construction activities have

short term impacts, whereas maintenance activities could result in long term impacts. Road,

tower construction and clearing land for the ROW results in removal of plants. In some cases the

topsoil and root systems of native plants species are completely destroyed or removed from the

area.

Soil distributed in a ROW, and a lack of competing species, can result in the growth of

noxious weeds due to construction and maintenance activities [6]. This depends upon number of

13

factors like elevation, slope and direction of slope face, soil type, and amount of moisture present

in the soil [3]. Federal or state listed endangered plant species must be protected from

construction and other maintenance activities. During the selection of the route, the vegetation of

that area must be studied well in advance of construction. Impacts can be avoided by planning

construction in a season when most of these species are in dormancy [3].

2.3.6 Wildlife

Wildlife conservation is equally as important as that of vegetation. In the US there are

several federal and state laws that enforce protection of wildlife. Transmission line construction

requires clearing of the land, specially in forested and rural areas. Forest land must be cleared in

and along the ROW for construction. This clearing of land results in loss of forest and impacts

animal species in the forest habitat. The construction of new roads encourages the recreational

use of the area, and species like deer, elk become more vulnerable to humans [6].

Line construction and maintenance activity in areas which are close to wetlands and open

water adversely affects the habitat of riparian and other wetland species. The most visible affect

of transmission line is the electrocution of the birds, when transmission lines fall in the path of

the migratory birds. Utilities can adopt design changes for towers, insulators and conductors

which reduce the electrocution of these birds by power transmission lines [3].

2.3.7 Fish Habitat

Transmission lines often cross streams, wetlands, and other water bodies, and may have

an adverse impact on the fish. Construction results in sediment deposition in streams and other

water bodies from excavation, stockpiles, land clearing and soil from roads. Dumping and

concrete washing also cause increase sediment loads in wetlands and streams. Movement of

heavy machinery and noise from construction equipment also causes sediment release,

14

mechanical disturbances, vibrations, and shocks, which can cause fish to move to other areas

from their native habitats. This movement results in loss of various fish species from an area.

Construction and maintenance require clearing, which results in removal or reduction of

shady areas and woods, which in turn reduces the buffer capacity, i.e. the ability of vegetation to

grow along the streams and protect them from sediment deposition [6]. Clearing of vegetation

leads to high flood flows, which in turn causes more deposition and sedimentation and affects the

fish habitat and can also cause gill abrasion to fish. In some cases low base temperatures result in

warmer water temperatures which may be lethal for fish [3].

During the planning stages of transmission line projects, when the route for the line is

selected, it is a good practice to contact fish conservation societies to identify fish habitats in the

region. All these affects must be considered when the route of a line is selected and it must be

ensured that construction and maintenance activities are not going to cause any adverse affects to

the fish habitat.

2.4 Health and Safety features

Transmission lines are designed to transfer large amount of energy at high voltages and

high currents, and such flow of high currents and voltages on these lines results in various health

and safety problems in and around the ROW.

2.4.1 Electric Fields

Economics dictates that transmission lines transmit power at high voltages. Electric fields

around lines are the result of the high voltage gradient on the surface of the conductor. Electric

fields are strongest at the surface of the conductor, and lose intensity away from the conductor.

Much of the route of a transmission line goes through rural and undeveloped areas where

there are more plants and animals than humans, so exposure of plants and animals to electric

15

fields must be considered. Animals are shielded from electric fields by vegetation, and exposure

is greatest when they are passing beneath transmission lines. Various studies have been done on

effects of electric fields on animal behavior, melatonin production and immune function, and

impacts found were low [7]. Similar results were found in studies on plants.

Electric field exposure is an issue of concern in urban areas, but electric fields are

shielded by conducting objects like fences, walls and trees. In buildings and houses around 90-

95% of electric field is shielded [8]. Electric field exposure depends upon the way transmission

lines are designed. Utilities can alter the electric field exposure by changing the vertical and

horizontal clearances and arrangement of conductors.

2.4.2 Magnetic fields

Magnetic fields around transmission lines are due to the flow of the current in the line.

Unlike electric fields, magnetic fields increase and decrease depending on the electric load on the

line. Intensity of the magnetic field is dependent upon the distance from the transmission line [8].

Electrical appliances like ovens or heaters produce magnetic fields of less than 2 mG and

in buildings or houses close to transmission lines the major source of magnetic fields is the

transmission line. Magnetic field exposure from a line is higher in comparison to the electric

field. Magnetic fields are not shielded by trees, fences, or structures, as in the case of electric

fields.

Both electric and magnetic fields induce currents, and certain unusual circumstances,

like contact of a grounded person with an ungrounded object under a high electric field, can

result in nuisance shock or spark discharge. Research on electric and magnetic fields shows no

evidence that supports a relation between electric or magnetic fields and adverse health affects

16

like cancer and other diseases. Statistical investigations are still going on between child leukemia

and magnetic field exposure [3].

2.4.3 Audible Noise

Construction activities like movement of heavy machinery, erection of towers and

conductors result in noise around the ROW. The noise levels may be objectionable if

construction is too close to a populated area.

Another source of noise from transmission lines is corona, for lines 345 kV and above.

This is more prominent in foul weather conditions and meteorological data shows that these

conditions exist 7% of the time in a year. For a new line after construction, grease or oil on the

surface of conductor are sources of corona. A new line has audible noise of 50 dBA around the

ROW in foul weather conditions [3].

Power transmission lines have substations at the start, end and in between. Audible noise

effects of substations depend upon the level of background noise existing around the substation.

Switching and protection equipment installed in substation produces noise in the form of low

frequency hum. This noise depends upon the operating mode of the equipment installed [5].

2.4.4 Hazardous Materials

Hazardous material use and disposal is always issue of a concern for any construction

project. In the case of a transmission line, use of hazardous materials is minimum.

Polychlorinated biphenyl (PCB) is prohibited for transformer and power circuit breakers.

Disposal of the concrete, paints and wood preservatives and petroleum products like fuels,

hydraulic fluids, etc., must follow strict disposal procedures. Accidental flow of such materials

could cause lethal damage to flora and fauna along the ROW [6]. Utilities must control disposal

of hazardous material during the construction and maintenance of a transmission line.

17

2.4.5 Fire

Fire hazard is another threat pose by transmission lines to crops, vegetation and other

combustible material. The accidental fall to the ground of a loaded transmission line creates an

arc sufficient to burn the combustible material and this could result in crop, grass, or forest fires

[4]. In routing transmission line through rural areas and forests, adequate clearance should be

maintained to reduce the chance of fires. In general, trees are not allowed to grow more than 20

feet high in ROW [6].

2.4.6 Induced Currents

Electromagnetic fields from transmission lines induce currents on objects in the

proximity of the line. Certain circumstances, like contact of a grounded person with an

ungrounded object under a high voltage line, can result in a nuisance shock or spark discharge.

The magnitude of the induced current depends upon the electric field strength, size of the object

and insulation between object and ground. Magnetic fields also induce currents when objects like

fences, pipelines and wires are in parallel with lines [4].

The National Electrical Safety Code requires that for voltages more than 98 kV ac to

ground the induced currents not be more than 5 mA [9]. Transmission line designers must design

with enough clearances throughout the route of the line so that line can meet these requirements.

If the line route is near pipelines, the line fields will induces currents in the pipeline, and

this can results in shocks to maintenance personnel working on those pipelines. The magnitude

of inductive interference depends upon the grounding resistance of line towers, distance between

pipeline and transmission line, and size of the structure grounding system, soil characteristics

along the pipeline and transmission line, and the pipeline coating resistance. Under faulted

conditions like single line to ground faults the induced potential on an unprotected pipeline could

18

reach thousands of volts and in extreme cases this could puncture a pipeline [4]. Inductive

interference with pipelines must be considered during line design and route selection for a

transmission line.

2.5 Engineering Features

Most of the factors that are affected by power transmission line routing have been

discussed previously in this chapter. But transmission line routing not only depends upon non-

technical factors like environmental and socio-economic, but also on engineering factors. Line

designers have to carefully study and design the line to give the best engineering solution for

various problems like corona, interference and natural factors like wind and ice.

2.5.1 Electromagnetic Interference

Electromagnetic interference is one of the major problems that designers face during the

design process. Corona and gap discharges are the main sources of electromagnetic interference.

Corona is generally seen in 345 kV and higher voltage transmission lines. Electromagnetic

radiation from corona discharges affects am radios, whereas gap discharges affect both television

and radio reception. Radio frequency emissions from corona occur between the ranges of 100

kHz to 2 MHz, and most communication systems like police, fire, commercial radios and cellular

phones operate above 2 MHz. Broadcast am radio, however, operates between 535 and 1604

kHz, and is thus often affected [3].

Signal reflections from power transmission lines may cause ghosting in weak television

signals. Electrical discharges between broken and loose hardware like insulators, clamps and

brackets are transmitters of frequencies that can cause interference with some radio and

television signals. Interference depends upon the strength & quality of the transmitting signal,

the distance of the source to the receiver and the quality of the radio or TV system [4].

19

Interference with railroad communication is another major issue of concern. In routing

transmission lines it must be considered that in extreme conditions, the transmission line may

cause disturbances to railroad communication. This interference must be reduced by increasing

the vertical and horizontal clearances of the power transmission line from the railroad.

2.5.2 Lightning

The operation and performance of a transmission line is affected by lightning strikes. The

route of a transmission line plays a vital role in the lighting performance of the line. Studies

shows that lines have more outages in severe weather conditions. An area which is more prone to

flashes will have more outages irrespective of soil characteristics. Exposure to lighting strikes is

much higher on a mountain top or ridge, which should be avoided as far as possible [10].

Soil resistivity and structure height are the two important factors that affect the lighting

performance of the line. The designer should reduce the structure height in open fields and as far

as possible try to share the ROW with another line. This practice helps in reduction of lighting

outages.

2.5.3 Wind

The environment around a line, including wind, affects various electrical properties of the

line. High velocity winds not only increase mechanical loading but also reduce the vertical and

horizontal clearances. Low velocity wind of a sufficient amplitude results in conductor fatigue by

Aeolian vibration. In regions where ice storms occur oscillations are produced near the

fundamental or at second or third harmonics, and this result in amplitudes as large as conductor

sag. These two phenomena are found in both bundled as well as single conductor lines.

Wake-induced oscillations are aerodynamic forces produced when a conductor moves in

and out of the wake of the upstream conductor. Such forces are found in bundled conductors

20

[11]. During planning stages line designers have to study the wind conditions of route that the

line is going to follow before selection of the final route. For lines with structures more than 60

feet above ground, NESC extreme wind loading conditions apply and wind pressure calculated in

this manner assumes no ice load [9]. Calculations must be adjusted accordingly if ice loading is

possible.

2.5.4 Ice Loading

Ice accumulation on conductors during winter affects the operation of the power

transmission line. In long-span lines with conductors in the same vertical plane, outages may

occur due to a sudden jump of the conductors when ice drops from the conductor. Ice jumps

occur when no wind is blowing, so all forces and reactions are in the vertical direction [11].

NESC has established ice loading districts which are used to estimate the expected thickness of

ice that will accumulate on conductors [9].

2.5.5 Forest Fire

Forest fires cause great damage to transmission lines. Most transmission line conductors

are aluminum (ACSR), and they lose their mechanical strength in the environment of high

temperature, humidity, smoke, dust and flames of a forest fire. Utilities must gather data on the

vegetation around the ROW and determine the risk of forest fires during selection of the route

[12].

Forest fires are not only a problem for conductors but for line insulators also. The

accumulation of soot and dust results in contamination of the insulators and reduces the

breakdown strength of the insulator. Line designers should avoid routes near agricultural fields

like sugarcane, since a fire in a sugarcane field reduces air insulation, which can reduce flashover

voltage to 0.5 kVrms/cm [13].

21

2.5.6 Compact Line

In the US, state and federal commissions and laws and regulations can make it extremely

difficult to get permits and acquisitions for ROWs for power transmission lines [14]. In such

cases utilities may select a compact line design as its best engineering solution to problems like

aesthetic impacts, economics and ROW restrictions.

These compact lines can sometimes be constructed along existing distribution and

transmission line ROWs. Compact line design offers various choices in configurations and it had

been found that ROW requirements and costs for these lines are low in comparison to

conventional designs.

2.6 GIS Features.

All the features explained above are crucial for transmission line routing, but not all can

be incorporated into GIS. Those that can be used in GIS are listed in Table 2.1. National Electric

Safety Code required clearances for some of the features are given in Appendix-A.

22

Table 2.1

Landscape Features for GIS

23

CHAPTER-3

JUDICIAL REQUIREMENTS FOR TRANSMISSION LINES

3.1 Introduction to routing laws

This section of the thesis is primarily aimed at regulations and requirements of local and

state authorities for a transmission line project. In most states in the US, transmission line

construction projects need approval from state agencies first, and then by federal agencies if

required. Most US states have laws or rules which are directly or indirectly related to

transmission line construction. These laws and rules must be followed for any construction of

new or upgraded transmission lines.

The involvement of the federal agencies like DOE and FERC makes sure that

transmission line projects are in compliance with the National Environmental Policy Act

(NEPA). NEPA makes sure that projects like construction of transmission lines and gas pipelines

etc., are environment friendly, and that construction of these projects is not going to cause any

adverse changes in the environment. Generally, the NEPA compliance requirement is applicable

to federal agencies and in areas under federal jurisdiction, but some state authorities has also

adopted environment impact assessment laws.

3.2 State Commission

State utility commissions play an important role in the approval of transmission line

projects, and in about 80 % of the states in the US, the state utility commission is the primary

authority for issuing permits for transmission line construction. In most of the cases the state

commission acts as a facilitator in resolving disputes among utilities, the public and various other

utilities and entities.

24

Fig 3.1 – Permitting categories by state [15].

Fig 3.2 - States with one agency authorization [15].

In recent times with the establishment of transmission independent service operators

(ISO) in various states, the state utility commission plays a vital role in power transmission

related issues. When it comes to reviewing transmission line projects the voltage of the

transmission line is important. Transmission line voltage is a critical component of the line

construction process, with increasing voltage resulting in increased clearance requirements from

the ground and from other objects. Magnetic coordination with other utilities also increases with

higher voltage. Transmission line rated voltage is a design constraint, because at higher voltages,

25

the adverse environmental impacts, like corona which produces ozone and audible noise, are

more prominent.

Another critical issue associated with line voltage is cost, which increases as voltage

increases. Larger conductors and towers are required, and more protective equipment is required

in substations. About thirty-three percent of the states require review of projects rated below 100

kV, and about twenty-four percent review only projects greater then 100 kV, and nineteen

percent of states review only when voltage is more than 200 kV. [15]

Fig 3.3- States in which Power transmission line are permitted by line voltages [15]

3.3 Certificate of Public Convenience & Necessity

Utilities or transmission companies in states which require state approval must notify in

writing the state commission or any other agency with authority over the review and approval of

power transmission line projects. The most common certificate or approval document in various

US states is a “Certificate of Public Convenience and Necessity”. As the name implies, the state

wants to know the necessity of a new line for state and how it is going to be beneficial for

residents of state. Utilities have to present the necessity of the new transmission line in a report

26

format to the commission, along with the initial application. In some states like Arizona the

utility must also obtain a certificate of environmental compatibility from the state [16].

3.3.1 Need for Transmission Line

In most of the states in the US utilities have to explain to the state why their project is a

necessity for the state. This necessity may be due to various reasons; it may, for example, be due

to outage studies conducted by the utility which show the line is needed to prevent blackouts or

load shedding. Such a line improves reliability of service in the state. Other reasons include

increased demand due to population increases, and market considerations that will result in

savings for state customers.

In most of states the commission or the other agencies that have authority over issuing

permits to transmission lines require detailed information about upcoming projects. The

application should explain where the proposed transmission line is going to be built.

Commissions also want to know about the proposed route, and they need maps that show the

proposed route [17].

The route explains where the actual line is going to be built, and describes the area,

community and people affected by the transmission line. The utility must notify all the

landowners in advance who are going to be affected by their proposed project. In order to build a

transmission line utilities purchase as easement from the landowners who fall in the ROW of the

line [18].

3.3.2 Interference

The construction and operation of the transmission line may cause interference with other

utilities, including railroad, telecommunications and other electric utilities. States require utilities

to notify railroad companies and other utilities about there project in advance.

27

Kansas statutes states that the utilities have to utilize the public and private roads in a

most efficient way, and when there is an inductive interference between the two utilities then

both utilities have to determine an efficient and economical solution. The solutions should be the

best engineering solution at least cost [19].

3.3.3 Project Cost

Cost is a critical component of line design and construction, not only to the utilities but

also to the state, because ultimately the utility is going to extract the cost of the transmission line

from its customers. In most states the commission requires the utility to give an estimated cost

for the transmission line project when filing the application for permit [20]. State commission’s

applications also require utilities to specify their methods of financing for the projects. Power

transmission line construction takes years, and sometimes the estimated cost at beginning of the

project is much less than the actual cost because of unforeseen legal delays. The state

commission needs assurance that the utility has the ability to finish the project within the

expected period, and that the projects will not be deferred during construction due to lack of

finances [21].

3.3.4 Land Easement

Transmission line projects require land on which to build structures or towers to support

transmission line conductors. In general, utilities do not purchase the land, but instead an

easement is secured from the landowner in which the landowner grants rights to construct and

operate the line. The state requires state approval of the project before any easements and

acquisitions by utilities [22].

The state will assure that landowners receive an appropriate market price for the land that

they are losing for a transmission line project. Relocation of some landowners is part of land

28

acquisitions in most large projects. In most states compensation for relocation and re-

establishment of the owners will be paid by the utility. For example, in Connecticut if the

landowners incur reasonable expenses in moving more than two hundred miles away from its

property then utility will pay the relocation expenes [22].

3.3.5 Environment Impact

Transmission line projects affect the environment around the line. As discussed in

Chapter 2, these affects are of a wide variety ranging from socio-economic to ecological

imbalance. Utilities have to give an environmental assessment report to the state for a permit or

“Certificate of Environment Compatibility” to construct a transmission line in most states. This

environmental impact statement includes assessment of the impacts of the transmission line on

the habitat of animals and plants, air and water quality, socio-economics, etc., posed by

transmission line.

A utility must prove that the adverse environmental impacts are minimized by available

technology and other factors like economics, in comparison to the other alternatives to the

transmission lines [23]. Power transmission lines go through a wide variety of areas and some of

them may be in wilderness or areas that have historic importance to the state. The state makes

sure that the transmission line project is not going cause any adverse impacts or any threat to the

areas of scenic and historic importance.

Approval or denial of a project depends upon on all the various factors. The state

commission considers why the utility requires new or upgraded lines and whether the need can

be met by other alternatives [24]. The commission will also consider the impacts of the proposed

line on consumer rates and may not approve a project that is going to increase the energy cost to

the consumer.

29

The commission also evaluates the managerial and financial abilities of the utility which

is going to build the proposed transmission project in the state. They also evaluate the

environmental impacts of the power transmission project and if the project is going to cause an

adverse impact to the state’s environment then its chances of approval are jeopardized.

3.4 National Environmental Policy Act

In the US the act that is enforced and accepted by various federal and state agencies is

“The National Environmental Policy Act of 1969”. The purpose of this act is to encourage

harmony between people and their environment and to present a national policy that reduces

damage to the environment and biosphere and also encourages human health and welfare.

The act recognizes the deep impact of various activities on the population growth, high

density urbanization, industrial expansion and exploitation of natural resources. Beginning from

the 1st July 1970, the president shall convey an “Environment Quality Report” to congress which

includes the status and condition of manmade and natural altered environmental classes of the

nation, present and future trends in the quality, management and utilization of those

environments, adequate availability of natural resources to compensate the human and economic

requirements of the nation, review of government and non-government projects and their effect

on the environment and development and utilization of natural resources [25].

Environmental impact statements are documents that review and explain the impacts of

the transmission line on the environment. Most of the high voltage transmission lines must

comply with NEPA requirements, and federal agencies like DOE evaluate such projects and

determine compliance with NEPA. For planning and decision making environmental assessment

is used and depending upon the environmental assessment, the federal agency determines

whether a formal environmental impact statement is required for the project [26].

30

CHAPTER 4

STAKEHOLDERS IN TRANSMISSION LINE ROUTING

4.1 Introduction

A large transmission line project is the one of the most complex engineering projects,

often taking years before actual structures are built. One of the reasons for delays is the

involvement of stakeholders in the process. In the US all major transmission line projects have

stakeholders involved. This may be at the state level with the state commission or at the federal

level with DOE or other federal agency. Rules and regulations in the US for transmission line

projects give equal rights to all stakeholders to express their concerns and views about the

project.

Stakeholder involvement is crucial, as it can delay a project, or in some cases stop it

altogether. The whole process is very complex due to clearances needed from various agencies,

each of whom is a stakeholder. Any delay in the project affects utilities involved in the project as

the cost for building the line keeps on increasing due to delays, and in the worst cases utilities

may completely lose interest in construction of transmission lines. The critical issue is to identify

the stakeholders who have an interest in the transmission line projects so they can be involved

from the start. The important stakeholders for a transmission line project are listed, and their

importance is explained in the following paragraphs. A detailed list of stakeholders is in

Appendix B.

4.2 Electric Utilities

A utility or a company which is going to build a transmission line must give notice in

advance to other electric utilities that are along the ROW or cross the ROW of the proposed

project. Utilities have to maintain proper clearance from other transmission or distribution lines

31

as required by the NESC and standards followed within the utility or specified in state

legislature. A line should not effect the operation and maintenance of other utilities’ transmission

or distribution lines.

4.3 Telecommunication Utilities

To avoid interference with telecommunications, a line must maintain proper clearances

from communication lines. The line owner must give notice in advance to all the telecom utilities

along the ROW or which cross the ROW.

4.4 Railroad Companies

In the US, railroad companies are often paralleled or crossed by overhead transmission

and distribution lines. Proper horizontal and vertical clearances must be maintained from the

transmission lines in accordance with the NESC. Communication signals used by the railroad

may be affected by electromagnetic fields produced by the transmission lines and as far as

possible this interference should be avoided.

4.5 Highway authorities

There are several manmade features that may cross or parallel the route of a line and one

of them is highways. Utilities have to maintain proper vertical and horizontal clearance from

highways so that the transmission lines do not pose an undue risk to the safety of the traffic

moving on the highways. Highway authorities must be notified before the final route for a

transmission line has been planned.

4.6 Radio and Television companies

A common problem that utilities face is interference with broadcast communication

signals and this problem is worse if the receiver or transmitter of the signal is in close proximity

to transmission line. Utilities have to make sure that magnetic interference from a line is not

32

going to cause excessive noise to radio or tv signals. During the selection of the route, such

interference its affects on the communication signal should be considered.

4.7 Landowners

The group most affected by the construction of a transmission line is nearby landowners.

Transmission lines or any other construction projects need land to build structures. In the US,

especially in rural areas where a ROW crosses a farm, farmers agricultural practices are affected

by the line and in most cases the utilities have to secure an easement for land with the landowner.

In urban areas transmission lines face even greater reluctance from landowners as they pose not

only intermittent problems like dust and noise during construction but permanent problems like

aesthetic impacts on the scenery of an area.

4.8 Native American tribes

In the US some lands are reserved for Native American tribes. These areas have their

own laws and regulations irrespective of the state laws in which they fall. Utilities have to obtain

permission from that particular tribe to pursue construction in the tribal region. It must insure

that construction, operation and maintenance activities of do not disturb any values and beliefs of

the tribe in which transmission line route falls.

4.9 Airport authorities

Tower height depends upon the clearance requirements of the line from ground, which in

turn depend upon the voltage level of the line. High towers near an airport or airfield have to

obtain permission from the airport or authorities before construction of transmission line towers.

In some cases construction and maintenance permits must also be obtained from airport

authorities before construction.

33

4.10 Chemical Industries

Production of chemicals and chemical products results in emissions of toxic pollutants in

the air. If a transmission line is in close proximity to a chemical industry then fumes or minute

dust particles accumulate over the insulators and form a conducting path over the surface,

causing line outages. In some cases utilities alter the route of a line, and in other cases chemical

industries have to install special equipment to reduce the chemical fumes to the surrounding air.

4.11 Archeological & historic conservation agencies

In the US there are sites that have importance in the history and culture of the country,

and notice must be provided of any action that could affect the site to the agency that has

authority over the conservation of that site. Transmission line construction and maintenance

practices can disturb the site to a great extent and cause some of the cultural importance of a site

to be lost.

4.12 Cultural & religious bodies

In the US there are sites where land is owned by religious and church bodies who are

working for the wellbeing of the people in the community. During the preliminary routing of the

line, especially in urban areas, where such groups are present utilities have to consider the

importance of such bodies to the community. They must satisfy the demands and needs of all

religious and cultural bodies along the route of the transmission line.

4.13 Military Installations

Military installations are secured and fortified and access is limited. Construction and

maintenance activities could cause a threat to the security of the installations. Military

installations have there own communication system to communicate with other military

installations and electromagnetic interference from a transmission line with communication

34

signal introduces a noise in the signal and results in poor communication. Such interference

could result in loss of valuable information, so utilities must notify any military installation

before construction of any transmission line within or near to the periphery of the installation.

35

CHAPTER-5

NON-POINT IMPACT FEATURES

5.1 Introduction to Non-point Impact features

The routing process is not only affected by topography-dependent landscape features but

also by features that are independent of the topography of the region. Such features are called

non-point impact features.

GIS is raster based software that incorporates information about a particular area, and

such information can be used to see potential barriers in the route of a line. All such information

is related to a particular location. For example, GIS can map the location of all rivers or wetlands

in a particular region. Even though non-point impacts do not have a specific location, they can

still be integrated into a GIS based platform.

Electric fields, magnetic fields, radio frequency interference, and audible noise are the

important non-point impact features for a transmission line. All these features affect the route of

the line irrespective of the topography of the land. One common factor among all these features

is distance decay; the effects decrease with distance from the line. For instance, magnetic field

intensity is very high within the ROW but as we move away from the line the field decreases.

Non-point impact features can create objections among the people who have property within or

near the ROW. This can affect the transmission line construction project at any stage so it is

helpful to calculate the level of these features and include them in the routing process.

In this section calculation procedure for electric fields, magnetic fields, audible noise and

radio frequency noise are explained. Equations to calculate these quantities are applied to

example data from the El Segundo transmission line project [8]. Conductor geometry and line

data for this project is shown in the Fig 5.1.

36

Fig 5.1 Transmission line geometry of El Segundo Transmission Line [8].

5.2 Electric Fields

Superposition of the three fields from the phase conductors produces a resultant electric

field. In calculations the effect of the conducting earth is represented by image charges located

below the conductors at a depth below the earth which is same as the height of the conductor

above the earth. At 60 Hz the time required for charges to redistribute themselves due to an

externally applied field is very small in comparison to the power frequency wave, so it appears

as if earth is a perfect conductor.

37

Fig 5.2 Single conductor profile [11].

For a single of conductor of radius r and a height h above the earth, shown in Fig. 5.2, the

ground level electric field can be calculated:

r2πε

lQE = (5-1)

Where distance from the conductor to the observer is

22 Lhr += (5-2)

Hence

22 Lh2 +

=πε

lQE (5-3)

Where Q must be [Q] =[C][V] and for a single conductor the equation reduces to

VVPQl ln(2h/r))2/1(11

πε== − (5-4)

E is radially directed from the line charge and its vertical component is

h

L

θ

h

Conductor

Earth

Observer Location

Image

38

222222 22cos

LhhQ

Lhh

Lh

QE ll

+=

++=

πεπεθ (5-5)

Thus, the total ground-level field is given by

22 LhhQ

E l

+=πε

(5-6)

And at ground level horizontal components of the conductor and its image cancel each other and

the resultant field is only vertical [11]. The above ground electric field is for a single conductor

and for a three phase line fields from all the three conductor fields are calculated separately and

added. If the transmission line has bundled conductors then, for a bundle diameter D of n

conductors of radius r, the GMR is given by

Dnr2

2DGMR = (5-7)

Replacing conductor radius with GMR gives an approximate representation of electric field as

shown in the Fig 5.3.

Fig 5.3 Electric field profile for transmission line.

39

5.3 Magnetic Fields

Magnetic fields are produced by transmission lines due to the flow of current in phase

conductors. Unlike electric fields, magnetic fields change with respect to the change in the flow

of current in the phase conductors. Magnetic fields also decay with distance, as distance from the

line increases the magnitude of the magnetic field decreases. Magnetic field coupling affects

objects parallel to the line, like fences and pipelines, and are generally negligible for vehicle or

building sized objects. Magnetic field coupling is modeled as a low voltage and low impedance

source with relatively high short-circuit currents.

Single grounds are ineffective in preventing magnetically coupled voltages; multiple low

resistance grounds are required. Images are also used for calculating magnetic fields [11], but the

assumption of a transmission line with no earth at all gives a closer approximation to the ground

level magnetic fields than assuming a perfectly conducting earth. This effect is frequently

modeled as an image of the conductor located at greater depth in the earth than conductors above

the earth.

Distances of several hundred meters are frequently used for this image depth, which is

given by fD /660 ρ= , where ρ is the soil resistivity in ohm-meters and f is the frequency. It

is usually adequate to consider conductor in free space images.

2222 Lh

IrIB

+==

π

µπµ (5-8)

The above equation, 5-8, is then separated into horizontal and vertical components by

multiplying by θsin and θcos . The horizontal and vertical components of B must be combined

individually as vectors. This results in different angles from combining horizontal and vertical

components and causes their resultant to trace an ellipse in time.

40

Fig 5.4 Magnetic field profile for Transmission line.

The same method can be used for image currents at some depth, for computations with

image fields included. The ground wires and bundled conductors can also be included by using

matrix equations. Fig 5.4 gives the resulting approximate representation of the magnetic field for

the example transmission line.

5.4 Radio Noise

Electrical discharges across small gaps (micro-sparks) and partial electrical discharges

(corona) are two phenomena that cause electromagnetic interference from an overhead

transmission line. Corona-generated radio noise decreases with distance and also decreases with

higher frequencies. This usually affects am radio, and higher frequencies such as tv and fm radio

signals are not affected.

41

Gap-type sources are found at insulators, line hardware and defective equipment. Gap-

type sources for radio interference are not a design problem; they occur during construction and

maintenance of transmission lines, and 90% of the noise complaints are removed and eliminated

by repairing the damaged equipment [11]. In the design phase, conductor and hardware corona is

considered. Properly designed conductors produce rare complaints except in weak signal fringe

areas. Lines constructed with reduced conductor spacing have resulting higher electric fields on

hardware, so “corona free” hardware is important to eliminating electromagnetic interference.

Radio and television noise for ac transmission lines are a function of weather. Fair

weather noise may be significant and varies with season, wind velocity and barometric pressure.

A comparison method for calculating radio noise is useful for conventional geometries and

designs.

RI=-150.4+120log g + 40 log d + 20 log (h/D2) + 10[1-(log 10f) 2] (5-9)

Where

g= average maximum surface gradient of conductor.

d= sub-conductor diameter, mm

D= radial distance to observer, m

h= height of phase, m

RI= fair-weather radio noise, dB

RI is calculated for each phase and the maximum value is used as the RI for the line. The

average foul-weather levels are 17 dB above fair weather and heavy-rain averages RI 24 dB

above fair weather. There are no acceptable RI limits in the US because of difficulties in setting

universal criteria for all land use and local conditions. To set criteria for evaluation of radio-

noise, two quantities are used: level of signal strength in the line vicinity, and signal/noise ratio.

42

The signal to noise ratio on the edge of the ROW averages 24 to 26 dB. Primary signal strengths

may be 54 dB above 1µV in rural areas and 88 dB or more in cities.

Due to limited number of cases of conductor corona-induced tv interference, prediction

of TV noise is not as advanced as that of radio noise. Most tv interference complaints result from

micro-sparks which can be eliminated as they occur, and these are not generally design

considerations. In a few cases corona-caused tv noise occurs in foul weather. Fig 5.5 shows an

approximate representation of radio interference for the example transmission line.

Fig 5.5 Radio noise profile for transmission line.

5.5 Audible Noise

Substation and transmission lines are sources of audible noise. Audible noise from a

transmission line during fair weather conditions is unnoticeable. During wet weather, rain

droplets collect on the conductor and cause a crackling or humming sound which can be heard

near the line. Audible noise decreases with distance from the line. Ambient or background noise

is a composite of sounds from many near and far sources. Average ambient daytime and

nighttime noise levels are listed in the Table 5.1. Outdoor average nighttime ambient noise level

is lower than daytime ambient levels by approximately 5 dB [8].

43

Audible noise from corona during foul weather is a critical design parameter for ac

transmission lines. Audible noise consists of a random component and low frequency hum, and

each is caused by a different physical mechanism. Only hum is closely related to corona loss,

while the most frequent cause of annoyance is random noise.

Table 5.1

AVERAGE AMBIENT SOUND LEVELS

A-Weighted Ambient Sound level

(dBA)

Type of Neighborhood

Day Night

Rural 35 35

Residential Suburban 40 35

Residential Urban 45 40

Commercial 50 45

Industrial 55 50

Consider A-weighted sound level, [dB(A)] during the rain.

L50 is the level exceeded 50% of the time during rain.

L5 is the level, exceeded 5% of the time during rain.

Average is the average level of noise expected during rain.

Heavy rain is the level of noise expected in heavy rain.

The formula developed for L50 and L5 values developed at Project UHV [11] is given by

g Average- maximum surface gradient of conductor or conductor bundle, kV/cm

44

n Number of sub conductors in a phase bundle.

d Diameters of sub-conductors, cm

D Distance from line to point at which noise level is to be calculated, m.

SL A-weighted sound level of the noise produced by the line, dB(A)

AN A-weighted sound level of the noise produced by one phase of the line, dB(A).

AN0 Reference A-weighted sound level, dB(A)

K1, K2, K3, K4, Constant coefficients

Application All line geometries.

Noise measure: L50, rain and L5 rain

Range of validity 230-1500 kV, 1≤n≤16, 2≤d≤6

For each phase, the L5 noise level is given by

AN5= -665/g+20logn+ 44logd-10logD-0.02D+ANo+K1+K2 (5-10)

With

ANo=75.2 for n<3

= 67.9 for N≥3

K1= 7.5 for n=1

= 2.6 for n=2

= 0 for N≥3

K2= 0 for n<3

= [22.9(n-1)d/B] for n≥3

Where B is the bundle diameter, cm.

The L50 level for each phase is obtained from

AN50=AN5-∆A (5-11)

45

Where ∆A =14.2 gc/g-8.2 for n<3

=[14.2 gc/g-10.4-8[(n-1) d/B] for n≥3

And gc =24.4(d-0.24) for n≤8

= 24.4(d-0.24) -0.25(n-8) for n>8

∑=

=P

i

i

1

10/AN1010logSL (5-12)

This method helps in analyzing the maximum expected noise levels as well as the effect of the

width of the ROW. Similarly, design variables such as conductor size, spacing and configuration;

height of conductors; weather variations, etc., can be considered. Most audible noise complaints

occur during wet-conductor conditions and low ambient noise occurs in conditions after rain or

fog. During heavy rain the rain noise covers the transmission line noise, and other factors such as

closed windows result in fewer complaints even though the noise is louder. Figs. 5.6 and 5.7

show the audible noise profile for the example transmission line for levels exceeding 5% and

50% of time during rain.

Fig 5.6 Audible noise profile for level exceeding 5% of time.

46

Fig 5.7 Audible noise profile for level exceeding 50% of time.

The detailed calculations for electric fields, magnetic fields, radio noise and audible noise to

obtain the curves of Figs. 5.3 to 5.7 are given in Appendix C.

47

CHAPTER-6

CONCLUSIONS & RECOMMENDATIONS

The transmission line routing process can be made simpler and less time consuming by using the

GIS based AMIS technique. Landscape features are incorporated into AMIS software, and then it

can be applied to any transmission routing project. This research shows that routing a

transmission line is not only an engineering problem but also includes socio-economic,

environmental and safety issues.

The utilities must know all the legal obligations required for a new transmission line well

ahead of construction. State rules and laws must be followed and implemented. The state

commission responsible for issuing permits must be consulted before filing an application for a

permit. Federal agencies are involved in projects in which a line is routed through federal

property, and also in extra high voltage and international transmission line projects.

Stakeholders are the most critical groups in the whole transmission line routing process.

When a project is in the planning stage all the stakeholders must be identified and their concerns

must be properly addressed. This avoids later litigation, and reduces unnecessary delays in a

project. The AMIS technique gives transparency, an analytical mechanism for comparing values,

rapid assessment and results, and above all, less opposition from stakeholders during polling in

meetings with stakeholders.

Objections to transmission lines mainly come from the electric fields, magnetic fields,

audible noise and radio noise produced by the line. All these features decay with distance, and as

we go away from the line, their effects decrease.

48

6.1 Future Work

The AMIS technique for routing highways can be applied to line routing to determine the least

cost route between two substations. But the objective is to find a route with minimum opposition;

the route developed by the above technique may or may not be the lowest cost solution. In the

future there may be rules and laws about the levels of electric and magnetic fields around

transmission line. The effects of electric fields, magnetic fields, radio noise and audible noise can

be integrated in GIS to see their effects in the area around a transmission line.

This research work can be further extended from the transmission level to distribution.

The AMIS technique can be applied and tested for routing overhead and underground

distribution. The routing technique can be integrated into commercial line design software like

PLS-Cad to route lines while considering the other engineering design requirements of a line.

49

LIST OF REFERENCES

50

REFERENCES

1. Upgrading Transmission Capacity for Wholesale Electric Power Trade,

http://www.eia.doe.gov/.

2. Collaborative Research: Investigation of Electric Transmission Line Routing Using a

Decision Landscape Methodology, National Science Foundation Award 0400988,

July 2004.

3. “Environmental Impact Statement for Schultz-Hanford Area Transmission Line

Project,” Bonneville Power Administration, U.S. Department of Energy, Portland,

Oregon, DOE/EIS-0325, Jan. 2003.

4. Final Environmental Impact Statement, “Sierra Pacific Power Company Alturas

Transmission Line Project”, DOE/EIS-0256, Nov.1995.

5. Final Corridor Selection & EIA Study Report, “The New Brunswick Power

Corporation 345 kV International Power Line Project”, AMEC Project: TE21002,

Apr. 2001.

6. “Final Impact Statement BPA and Lower Valley Transmission Project”,

Bonneville Power Administration, U.S. Department of Energy, Department of

Agriculture and Forest Service, Portland, Oregon, DOE/EIS-0267, Jun. 1998.

7. “Kangley-Echo Lake Transmission Line Project Final Environmental Impact

Statement” Bonneville Power Administration, U.S. Department of Energy,

Department of Agriculture and Forest Service Portland, Oregon, DOE/EIS-0317-S1,

Jun. 2003.

8. “Application for Certification El Segundo Power Redevelopment Project”, El

Segundo Power II LLC, Dec. 2000.

51

9. National Electric Safety Code, IEEE Accredited Standards Committee C2-2002, Jun

2001.

10. IEEE Guide for Improving the Lightning Performance of Transmission Lines, IEEE

Std 1243-1997.

11. Donald G. Fink, H. Wayne Beaty, Standard Handbook for electrical engineers, 12th

Edition, McGraw-Hill Book Company.

12. S.D. Kim and M.M. Morcos, “An Application of Solenoid Sensor for Inspecting

Deterioration of ACSR Conductors Due to Forest Fires”, IEEE Power Engineering

Review, October 2001

13. Effects of Agricultural fires on the performance of overhead lines”, IEEE

Transactions on Power Delivery, VOL.5, NO.2, April, 1990

14. “CORONA PERFORMANCE OF A COMPACT 230-KV LINE”, IEEE

Transactions on Power Delivery, Vol. 10, No. 1, January 1995

15. State level electric transmission line siting regulations directory by Edison electric

Institute.

16. “Arizona Power plant and transmission line siting committee” Arizona revised

Statutes sections 40-360 thru 460-360.13.

17. Connecticut general statutes 16-50g through 16-50aa.

18. “Negotiation of the Acquisition of a Land Right-of-Way Easement” Illinois

Administrative Code Title 83 chapter-1 section 300.30.

19. Kansas legislature KAR 82-12-4.

20. “Arizona power plant and transmission line siting committee”, Arizona Revised

Statutes sections 40-360.

52

21. “Extension of facilities” New jersey statutes 48-2-47.

22. Connecticut general statutes section 16-50aa.

23. Ohio revised code chapter 4906.

24. Texas Subchapter E- certification, licensing and registration 25.101 certification

Criteria.

25. The National Environmental Policy Act of 1969.

26. Certificate of environment quality regulation part 1501—NEPA and agency

Planning.

53

APPENDICES

54

APPENDIX-A

A.1 Vertical Clearances A.1.1 Vertical clearance above road For 161 kV line NESC vertical clearance =NESC basic vertical clearance + 0.4( kVL-G-22)/12

NVC 18.5 ft⋅ 0.4

161

322−⎛

⎜⎝

⎞⎠

12ft⋅+:=

NVC 20.865ft= RUS recommended clearance= NESC vertical clearance + RUS Adder RVC NVC 2.5 ft⋅+:= RVC 23.365ft= For 230 kV line NESC vertical clearance =NESC basic vertical clearance + 0.4( kVL-G-22)/12

NVC 18.5 ft⋅ 0.4

230

322−⎛

⎜⎝

⎞⎠

12ft⋅+:=

NVC 22.193ft= RUS recommended clearance= NESC vertical clearance + RUS Adder RVC NVC 2.5 ft⋅+:= RVC 24.693ft= For 345 kV line NESC vertical clearance =NESC basic vertical clearance + 0.4( kVL-G-22)/12

NVC 18.5 ft⋅ 0.4

345

322−⎛

⎜⎝

⎞⎠

12ft⋅+:=

55

NVC 24.406ft= RUS recommended clearance= NESC vertical clearance + RUS Adder RVC NVC 2.5 ft⋅+:= RVC 26.906ft= A.1.2 Vertical clearance above railroad For 161 kV line NESC vertical clearance =NESC basic vertical clearance + 0.4( kVL-G-22)/12

NVC 26.5 ft⋅ 0.4

161

322−⎛

⎜⎝

⎞⎠

12ft⋅+:=

NVC 28.865ft= RUS recommended clearance= NESC vertical clearance + RUS Adder RVC NVC 2.5 ft⋅+:= RVC 31.365ft= For 230 kV line NESC vertical clearance =NESC basic vertical clearance + 0.4( kVL-G-22)/12

NVC 26.5 ft⋅ 0.4

230

322−⎛

⎜⎝

⎞⎠

12ft⋅+:=

NVC 30.193ft= RUS recommended clearance= NESC vertical clearance + RUS Adder RVC NVC 2.5 ft⋅+:= RVC 32.693ft= For 345 kV line NESC vertical clearance =NESC basic vertical clearance + 0.4( kVL-G-22)/12

56

NVC 26.5 ft⋅ 0.4

345

322−⎛

⎜⎝

⎞⎠

12ft⋅+:=

NVC 32.406ft= RUS recommended clearance= NESC vertical clearance + RUS Adder RVC NVC 2.5 ft⋅+:= RVC 34.906ft= A.1.3 Vertical clearance above farmland For 161 kV line NESC vertical clearance =NESC basic vertical clearance + 0.4( kVL-G-22)/12

NVC 18.5 ft⋅ 0.4

161

322−⎛

⎜⎝

⎞⎠

12ft⋅+:=

NVC 20.865ft= RUS recommended clearance= NESC vertical clearance + RUS Adder RVC NVC 2.5 ft⋅+:= RVC 23.365ft= For 230 kV line NESC vertical clearance =NESC basic vertical clearance + 0.4( kVL-G-22)/12

NVC 18.5 ft⋅ 0.4

230

322−⎛

⎜⎝

⎞⎠

12ft⋅+:=

NVC 22.193ft= RUS recommended clearance= NESC vertical clearance + RUS Adder RVC NVC 2.5 ft⋅+:= RVC 24.693ft=

57

For 345 kV line NESC vertical clearance =NESC basic vertical clearance + 0.4( kVL-G-22)/12

NVC 18.5 ft⋅ 0.4

345

322−⎛

⎜⎝

⎞⎠

12ft⋅+:=

NVC 24.406ft= RUS recommended clearance= NESC vertical clearance + RUS Adder RVC NVC 2.5 ft⋅+:= RVC 26.906ft= A.1.4 Vertical clearance above rivers & streams For 161 kV line NESC vertical clearance =NESC basic vertical clearance + 0.4( kVL-G-22)/12

NVC 17 ft⋅ 0.4

161

322−⎛

⎜⎝

⎞⎠

12ft⋅+:=

NVC 19.365ft= RUS recommended clearance= NESC vertical clearance + RUS Adder RVC NVC 2.5 ft⋅+:= RVC 21.865ft= For 230 kV line NESC vertical clearance =NESC basic vertical clearance + 0.4( kVL-G-22)/12

NVC 17 ft⋅ 0.4

230

322−⎛

⎜⎝

⎞⎠

12ft⋅+:=

NVC 20.693ft=

58

RUS recommended clearance= NESC vertical clearance + RUS Adder RVC NVC 2.5 ft⋅+:= RVC 23.193ft= For 345 kV line NESC vertical clearance =NESC basic vertical clearance + 0.4( kVL-G-22)/12

NVC 17 ft⋅ 0.4

345

322−⎛

⎜⎝

⎞⎠

12ft⋅+:=

NVC 22.906ft= RUS recommended clearance= NESC vertical clearance + RUS Adder RVC NVC 2.5 ft⋅+:= RVC 25.406ft= A.1.5 Vertical clearance above lakes 200 -2000 acres For 161 kV line NESC vertical clearance =NESC basic vertical clearance + 0.4( kVL-G-22)/12

NVC 34.5 ft⋅ 0.4

161

322−⎛

⎜⎝

⎞⎠

12ft⋅+:=

NVC 36.865ft= RUS recommended clearance= NESC vertical clearance + RUS Adder RVC NVC 2.5 ft⋅+:= RVC 39.365ft= For 230 kV line NESC vertical clearance =NESC basic vertical clearance + 0.4( kVL-G-22)/12

59

NVC 34.5 ft⋅ 0.4

230

322−⎛

⎜⎝

⎞⎠

12ft⋅+:=

NVC 38.193ft= RUS recommended clearance= NESC vertical clearance + RUS Adder RVC NVC 2.5 ft⋅+:= RVC 40.693ft= For 345 kV line NESC vertical clearance =NESC basic vertical clearance + 0.4( kVL-G-22)/12

NVC 34.5 ft⋅ 0.4

345

322−⎛

⎜⎝

⎞⎠

12ft⋅+:=

NVC 40.406ft= RUS recommended clearance= NESC vertical clearance + RUS Adder RVC NVC 2.5 ft⋅+:= RVC 42.906ft= A.1.6 Vertical clearance above buildings. For 161 kV line NESC vertical clearance =NESC basic vertical clearance + 0.4( kVL-G-22)/12

NVC 12.5 ft⋅ 0.4

161

322−⎛

⎜⎝

⎞⎠

12ft⋅+:=

NVC 14.865ft= RUS recommended clearance= NESC vertical clearance + RUS Adder RVC NVC 2 ft⋅+:=

60

RVC 16.865ft= For 230 kV line NESC vertical clearance =NESC basic vertical clearance + 0.4( kVL-G-22)/12

NVC 12.5 ft⋅ 0.4

230

322−⎛

⎜⎝

⎞⎠

12ft⋅+:=

NVC 16.193ft= RUS recommended clearance= NESC vertical clearance + RUS Adder RVC NVC 2 ft⋅+:= RVC 18.193ft= For 345 kV line NESC vertical clearance =NESC basic vertical clearance + 0.4( kVL-G-22)/12

NVC 12.5 ft⋅ 0.4

345

322−⎛

⎜⎝

⎞⎠

12ft⋅+:=

NVC 18.406ft= RUS recommended clearance= NESC vertical clearance + RUS Adder RVC NVC 2 ft⋅+:= RVC 20.406ft= A.1.7 Vertical clearance above Distribution power line. For 161 kV line NESC vertical clearance =NESC basic vertical clearance + 0.4( kVL-G-22)/12

NVC 2 ft⋅ 0.4

161

322−⎛

⎜⎝

⎞⎠

12ft⋅+:=

61

NVC 4.365ft= RUS recommended clearance= NESC vertical clearance + RUS Adder RVC NVC 1.5 ft⋅+:= RVC 5.865ft= For 230 kV line NESC vertical clearance =NESC basic vertical clearance + 0.4( kVL-G-22)/12

NVC 2 ft⋅ 0.4

230

322−⎛

⎜⎝

⎞⎠

12ft⋅+:=

NVC 5.693ft= RUS recommended clearance= NESC vertical clearance + RUS Adder RVC NVC 1.5 ft⋅+:= RVC 7.193ft= For 345 kV line NESC vertical clearance =NESC basic vertical clearance + 0.4( kVL-G-22)/12

NVC 2 ft⋅ 0.4

345

322−⎛

⎜⎝

⎞⎠

12ft⋅+:=

NVC 7.906ft= RUS recommended clearance= NESC vertical clearance + RUS Adder RVC NVC 1.5 ft⋅+:= RVC 9.406ft= A.1.8 Vertical clearance above Communication line. For 161 kV line

62

NESC vertical clearance =NESC basic vertical clearance + 0.4( kVL-G-22)/12

NVC 5 ft⋅ 0.4

161

322−⎛

⎜⎝

⎞⎠

12ft⋅+:=

NVC 7.365ft= RUS recommended clearance= NESC vertical clearance + RUS Adder RVC NVC 1.5 ft⋅+:= RVC 8.865ft= For 230 kV line NESC vertical clearance =NESC basic vertical clearance + 0.4( kVL-G-22)/12

NVC 5 ft⋅ 0.4

230

322−⎛

⎜⎝

⎞⎠

12ft⋅+:=

NVC 8.693ft= RUS recommended clearance= NESC vertical clearance + RUS Adder RVC NVC 1.5 ft⋅+:= RVC 10.193ft= For 345 kV line NESC vertical clearance =NESC basic vertical clearance + 0.4( kVL-G-22)/12

NVC 5 ft⋅ 0.4

345

322−⎛

⎜⎝

⎞⎠

12ft⋅+:=

NVC 10.906ft= RUS recommended clearance= NESC vertical clearance + RUS Adder RVC NVC 1.5 ft⋅+:= RVC 12.406ft=

63

A.2 HORIZONTAL CLEARANCE A.2.1 Horizontal Clearance from buildings wind at rest For 161 kV line NESC vertical clearance =NESC basic vertical clearance + 0.4( kVL-G-22)/12

NVC 7.5 ft⋅ 0.4

161

322−⎛

⎜⎝

⎞⎠

12ft⋅+:=

NVC 9.865ft= RUS recommended clearance= NESC vertical clearance + RUS Adder RVC NVC 1.5 ft⋅+:= RVC 11.365ft= For 230 kV line NESC vertical clearance =NESC basic vertical clearance + 0.4( kVL-G-22)/12

NVC 7.5 ft⋅ 0.4

230

322−⎛

⎜⎝

⎞⎠

12ft⋅+:=

NVC 11.193ft= RUS recommended clearance= NESC vertical clearance + RUS Adder RVC NVC 1.5 ft⋅+:= RVC 12.693ft= For 345 kV line NESC vertical clearance =NESC basic vertical clearance + 0.4( kVL-G-22)/12

NVC 7.5 ft⋅ 0.4

345

322−⎛

⎜⎝

⎞⎠

12ft⋅+:=

64

NVC 13.406ft= RUS recommended clearance= NESC vertical clearance + RUS Adder RVC NVC 1.5 ft⋅+:= RVC 14.906ft= Horizontal Clearance from buildings wind when wind is blowing For 161 kV line NESC vertical clearance =NESC basic vertical clearance + 0.4( kVL-G-22)/12

NVC 4.5 ft⋅ 0.4

161

322−⎛

⎜⎝

⎞⎠

12ft⋅+:=

NVC 6.865ft= RUS recommended clearance= NESC vertical clearance + RUS Adder RVC NVC 1.5 ft⋅+:= RVC 8.365ft= For 230 kV line NESC vertical clearance =NESC basic vertical clearance + 0.4( kVL-G-22)/12

NVC 4.5 ft⋅ 0.4

230

322−⎛

⎜⎝

⎞⎠

12ft⋅+:=

NVC 8.193ft= RUS recommended clearance= NESC vertical clearance + RUS Adder RVC NVC 1.5 ft⋅+:= RVC 9.693ft= For 345 kV line

65

NESC vertical clearance =NESC basic vertical clearance + 0.4( kVL-G-22)/12

NVC 4.5 ft⋅ 0.4

345

322−⎛

⎜⎝

⎞⎠

12ft⋅+:=

NVC 10.406ft= RUS recommended clearance= NESC vertical clearance + RUS Adder RVC NVC 1.5 ft⋅+:= RVC 11.906ft=

66

APPENDIX-B

List of Stakeholders for Transmission Line Routing

Federal Agencies

Advisory Council on Historic Preservation

Agency for International Development

Appalachian Regional CommissionDefense Nuclear Facilities Safety Board

Delaware River Basin Commission

Denali Commission

Department of Agriculture

Department of Commerce

Department of Defense

Department of Energy Advisory Boards

Department of Health and Human Services

Department of Homeland Security

Department of Housing and Urban Development

Department of the Interior

Department of Justice

Department of Labor

Department of State

Department of Transportation

Department of the Treasury

Department of Veterans Affairs

Environmental Protection Agency

67

Federal Energy Regulatory Commission

Federal Maritime Commission

Federal Trade Commission

General Services Administration

International Boundary and Water Commission

International Trade Commission

Marine Mammal Commission

National Aeronautics and Space Administration

National Capital Planning Commission

National Science Foundation

Nuclear Regulatory Commission

Office of Science and Technology Policy

Overseas Private Investment Corporation

Small Business Administration

Susquehanna River Basin Commission

Tennessee Valley Authority

State and Local government authorities

National Association of Attorneys General

National Governors’ Association

Rocky Flats Coalition of Local Governments

Southern States Energy Board

Western Governors’ Association

Western Interstate Energy Board

68

Western Regional Air Partnership

American Indian Tribal Issues agencies

Civilian Radioactive Waste Management

Congressional and Intergovernmental Affairs

Economic Impact and Diversity

Energy Efficiency and Renewable Energy

Energy Information Administration

Environment, Safety and Health

Environmental Management

Fossil Energy

General Counsel

National Nuclear Security Administration/Defense Nuclear Nonproliferation

National Nuclear Security Administration/Defense Programs

Nuclear Energy

Policy and International Affairs

Science

Bonneville Power Administration

Carlsbad Field Office

Denver Regional Office

Golden Field Office

Idaho Operations Office

Lawrence Livermore National Laboratory/Diné College

Los Alamos National Laboratory

69

Los Alamos Site Office

National Energy Technology Laboratory

National Nuclear Security Administration Service Center

National Renewable Energy Laboratory

Naval Petroleum and Oil Shale Reserves in Colorado, Utah, Wyoming

Nevada Site Office

Oak Ridge Operations Office

Office of Repository Development

Richland Operations Office

Sandia National Laboratories

Sandia Site Office

Savannah River Operations Office

Southeastern Power Administration

Southwestern Power Administration

West Valley Demonstration Project

Western Area Power Administration

Non-Governmental Organizations

Academic Institutions, Communities and Agencies Network (ACA-Net)

Advocates for the Oak Ridge Reservation

AFL-CIO

Alliance for Nuclear Accountability

Alliance to Save Energy

70

American Association of Blacks in Energy

American Boiler Manufacturers Association

American Coal Ash Association

American Gas Association

American Petroleum Institute

American Public Power Association

American Recreation Coalition

Blue Ridge Environmental Defense League

Border Ecology Project

Carolina Peace Resource Center

Center for Applied Research

Center for Biological Diversity

Center for Community Action

Center for Health, Environment and Justice

Citizen Alert

Citizens for Alternatives to Radioactive Dumping (CARD)

Citizens for Environmental Justice

Clark Atlanta University

Clean Water Action

Coal Exporters Association of the US

Coalition for Health Concern

Coastal Conservation Association

Committee to Bridge the Gap

71

Concerned Citizens for Nuclear Safety

Deep South Center for Environmental Justice

Diné CARE (Citizens Against Ruining Our Environment)

Ducks Unlimited, Inc.

Economists Allied for Arms Reduction

Edison Electric Institute

Electric Power Research Institute

Electric Power Supply Association

Energy Communities Alliance

Environmental Defense

Environmental Defense Institute

Environmental Justice Resource Center

Environmental Poverty Law Program

Fernald Residents for Environmental Safety and Health (FRESH), Inc.

Friends of the Earth

Gas Technology Institute

Global Resource Action Center for the Environment

Government Accountability Project

Great Lakes United

Greenpeace International

Heart of America Northwest

Independent Terminal Operators Association

Indigenous Environmental Network

72

Institute for Energy and Environmental Research

Institute for Science and International Security

Interhemispheric Resource Center

Keep Yellowstone Nuclear Free

Legal Aid of North Carolina Pembroke Office

Los Alamos Study Group

Miamisburg Environmental Safety and Health, Inc. (MESH)

The Minnesota Project

National Audubon Society

National Coal Council

National Community Action Foundation

National Congress of American Indians

National Fish and Wildlife Foundation

National Hispanic Environmental Council

National Mining Association

National Parks Conservation Association

National Petrochemical and Refiners Association

National Petroleum Council

National Rural Electric Cooperative Association

National Tribal Environmental Council

National Trust for Historic Preservation

National Water Resources Association

National Wildlife Federation

73

Native Action

Natural Resources Defense Council

The Nature Conservancy

New England Wild Flower Society, Inc.

New York City Environmental Justice Alliance

Nuclear Control Institute

Nuclear Energy Institute

Nuclear Watch of New Mexico

Oak Ridge Environmental Peace Alliance

Panhandle Area Neighbors and Landowners (PANAL)

Peace Action Education Fund

Peace Farm

Physicians for Social Responsibility

Portsmouth/Piketon Residents for Environmental Safety and Security

Prairie Rivers Network

Responsible Environmental Action League (REAL)

Rocky Mountain Peace and Justice Center

Sierra Club

Snake River Alliance

Southern Organizing Committee for Economic and Social Justice

Southwest Network for Environmental and Economic Justice

Southwest Research and Information Center

STAND (Serious Texans Against Nuclear Dumping), Inc.

74

The Tennessee Conservation League

Tri-Valley CAREs (Communities Against a Radioactive Environment)

Trout Unlimited

U.S. Public Interest Research Group

UCC Commission for Racial Justice

Union of Concerned Scientists

US Energy Association

Western Resource Advocates

Western States Legal Foundation

The Wilderness Society

Women’s Action for New Directions

75

APPENDIX-C

Non-point Impact Calculations Electric Field Calculations V 230 V⋅:= GMR

x1.246

2

2 2 2⋅ 0.042⋅

1.246⋅ ft⋅:=

x 0.229ft= h 110 ft⋅:= h 33.528m=

E1 d t,( )2

ln 2110

0.229⋅⎛⎜

⎝⎞⎠

110 V⋅ cos 2 π⋅ 60⋅ t⋅( )⋅

1102 14.25 d−( )2+⎡⎣ ⎤⎦

⋅:=

h 130 ft⋅:= h 39.624m=

E2 d t,( )2

ln 2130

0.229⋅⎛⎜

⎝⎞⎠

130 V⋅ cos 2 π⋅ 60⋅ t⋅ 120 deg⋅+( )⋅

1302 14.25 d−( )2+⎡⎣ ⎤⎦

⋅:=

h 150 ft⋅:= h 45.72m=

E3 d t,( )2

ln 2150

0.229⋅⎛⎜

⎝⎞⎠

150 V⋅ cos 2 π⋅ 60⋅ t⋅ 240 deg⋅+( )⋅

1502 14.25 d−( )2+⎡⎣ ⎤⎦

⋅:=

EC1 d t,( ) E1 d t,( ) E2 d t,( )+ E3 d t,( )+:= h 110 ft⋅:= h 33.528m=

76

E4 d t,( )2

ln 2110

0.229⋅⎛⎜

⎝⎞⎠

110 V⋅ cos 2 π⋅ 60⋅ t⋅( )⋅

1102 14.25 d+( )2+⎡⎣ ⎤⎦

⋅:=

h 130 ft⋅:= h 39.624m=

E5 d t,( )2

ln 2130

0.229⋅⎛⎜

⎝⎞⎠

130 V⋅ cos 2 π⋅ 60⋅ t⋅ 120 deg⋅+( )⋅

1302 14.25 d+( )2+⎡⎣ ⎤⎦

⋅:=

h 150 ft⋅:= h 45.72m=

E6 d t,( )2

ln 2150

0.229⋅⎛⎜

⎝⎞⎠

150 V⋅ cos 2 π⋅ 60⋅ t⋅ 240 deg⋅+( )⋅

1502 14.25 d+( )2+⎡⎣ ⎤⎦

⋅:=

EC2 d t,( ) E4 d t,( ) E5 d t,( )+ E6 d t,( )+:= Magnetic Field Calculations A) For Proposed Load I 1620:= µ 4 π⋅ 10 7−

⋅:= For circuit-1

B1 d t,( )µ I⋅ cos 2 π⋅ t⋅( )⋅

2 π⋅ 1102 14.25 d−( )2+⋅

:=

B2 d t,( )µ I⋅ cos 2 π⋅ t⋅ 120 deg⋅+( )⋅

2 π⋅ 1302 14.25 d−( )2+⋅

:=

B3 d t,( )µ I⋅ cos 2 π⋅ t⋅ 240 deg⋅+( )⋅

2 π⋅ 1502 14.25 d−( )2+⋅

:=

BC1 d t,( ) B1 d t,( ) B2 d t,( )+ B3 d t,( )+:=

77

For circuit-2

B4 d t,( )µ I⋅ cos 2 π⋅ t⋅( )⋅

2 π⋅ 1102 14.25 d+( )2+⋅

:=

B5 d t,( )µ I⋅ cos 2 π⋅ t⋅ 120 deg⋅+( )⋅

2 π⋅ 1302 14.25 d+( )2+⋅

:=

B6 d t,( )µ I⋅ cos 2 π⋅ t⋅ 240 deg⋅+( )⋅

2 π⋅ 1502 14.25 d+( )2+⋅

:=

BC2 d t,( ) B4 d t,( ) B5 d t,( )+ B6 d t,( )+:= BCP d t,( ) BC1 d t,( ) BC2 d t,( )+( ) 103

⋅:= mT B) For Existing Load I 1280:= µ 4 π⋅ 10 7−

⋅:= For circuit-1

B1 d t,( )µ I⋅ cos 2 π⋅ t⋅( )⋅

2 π⋅ 1102 14.25 d−( )2+⋅

:=

B2 d t,( )µ I⋅ cos 2 π⋅ t⋅ 120 deg⋅+( )⋅

2 π⋅ 1302 14.25 d−( )2+⋅

:=

B3 d t,( )µ I⋅ cos 2 π⋅ t⋅ 240 deg⋅+( )⋅

2 π⋅ 1502 14.25 d−( )2+⋅

:=

BC1 d t,( ) B1 d t,( ) B2 d t,( )+ B3 d t,( )+:= For circuit-2

B4 d t,( )µ I⋅ cos 2 π⋅ t⋅( )⋅

2 π⋅ 1102 14.25 d+( )2+⋅

:=

B5 d t,( )µ I⋅ cos 2 π⋅ t⋅ 120 deg⋅+( )⋅

2 π⋅ 1302 14.25 d+( )2+⋅

:=

78

B6 d t,( )µ I⋅ cos 2 π⋅ t⋅ 240 deg⋅+( )⋅

2 π⋅ 1502 14.25 d+( )2+⋅

:=

BC2 d t,( ) B4 d t,( ) B5 d t,( )+ B6 d t,( )+:= BCE d t,( ) BC1 d t,( ) BC2 d t,( )+( ) 103

⋅:= mT C) For Measured Load I 402:= µ 4 π⋅ 10 7−

⋅:= For circuit-1

B1 d t,( )µ I⋅ cos 2 π⋅ t⋅( )⋅

2 π⋅ 1102 14.25 d−( )2+⋅

:=

B2 d t,( )µ I⋅ cos 2 π⋅ t⋅ 120 deg⋅+( )⋅

2 π⋅ 1302 14.25 d−( )2+⋅

:=

B3 d t,( )µ I⋅ cos 2 π⋅ t⋅ 240 deg⋅+( )⋅

2 π⋅ 1502 14.25 d−( )2+⋅

:=

BC1 d t,( ) B1 d t,( ) B2 d t,( )+ B3 d t,( )+:= For circuit-2

B4 d t,( )µ I⋅ cos 2 π⋅ t⋅( )⋅

2 π⋅ 1102 14.25 d+( )2+⋅

:=

B5 d t,( )µ I⋅ cos 2 π⋅ t⋅ 120 deg⋅+( )⋅

2 π⋅ 1302 14.25 d+( )2+⋅

:=

B6 d t,( )µ I⋅ cos 2 π⋅ t⋅ 240 deg⋅+( )⋅

2 π⋅ 1502 14.25 d+( )2+⋅

:=

BC2 d t,( ) B4 d t,( ) B5 d t,( )+ B6 d t,( )+:= BC d t,( ) BC1 d t,( ) BC2 d t,( )+( ) 103

⋅:= mT

79

Fair Weather Radio Noise Calculations

E230 3 1

2 1.582⋅

30.48+⎛⎜

⎝⎞⎠

2 3⋅ 1.582⋅ ln609.6

1.582 30.48⋅⎛⎜⎝

⎞⎠

:=

E 17.931= Conductor radius -1.582 cm, Bundle spacing-30.48 cm, GMD 609.6 cm, dd 1.246 in⋅:= dd 31.648mm= h 45.72 m⋅:= f 1:= h 110 ft⋅:= h 33.528m=

D1 d( ) 4.343 d−( )2 33.5282+:= RI1 d( ) 150.4− 120 log E( )⋅+ 40 log 31.648( )⋅+ 20 log

33.528

D1 d( )( )2⎡⎢⎣

⎤⎥⎦

⋅+ 10 1 log f( )( )2−⎡⎣ ⎤⎦⋅+:=

h 130 ft⋅:= h 39.624m=

D2 d( ) 4.343 d−( )2 39.6242+:= RI2 d( ) 150.4− 120 log E( )⋅+ 40 log 31.648( )⋅+ 20 log

39.624

D2 d( )( )2⎡⎢⎣

⎤⎥⎦

⋅+ 10 1 log f( )( )2−⎡⎣ ⎤⎦⋅+:=

h 150 ft⋅:= h 45.72m=

D3 d( ) 4.343 d−( )2 45.722+:= RI3 d( ) 150.4− 120 log E( )⋅+ 40 log 31.648( )⋅+ 20 log

45.72

D3 d( )( )2⎡⎢⎣

⎤⎥⎦

⋅+ 10 1 log f( )( )2−⎡⎣ ⎤⎦⋅+:=

h 110 ft⋅:=

80

h 33.528m=

D4 d( ) 4.343 d+( )2 33.5282+:= RI4 d( ) 150.4− 120 log E( )⋅+ 40 log 31.648( )⋅+ 20 log

33.528

D4 d( )( )2⎡⎢⎣

⎤⎥⎦

⋅+ 10 1 log f( )( )2−⎡⎣ ⎤⎦⋅+:=

h 130 ft⋅:= h 39.624m=

D5 d( ) 4.343 d+( )2 39.6242+:= RI5 d( ) 150.4− 120 log E( )⋅+ 40 log 31.648( )⋅+ 20 log

39.624

D5 d( )( )2⎡⎢⎣

⎤⎥⎦

⋅+ 10 1 log f( )( )2−⎡⎣ ⎤⎦⋅+:=

h 150 ft⋅:= h 45.72m=

D6 d( ) 4.343 d+( )2 45.722+:= RI6 d( ) 150.4− 120 log E( )⋅+ 40 log 31.648( )⋅+ 20 log

45.72

D6 d( )( )2⎡⎢⎣

⎤⎥⎦

⋅+ 10 1 log f( )( )2−⎡⎣ ⎤⎦⋅+:=

Audible Noise Calculations Level exceeding 5% of the time n 2:= AN0 75.2:= K1 2.6:= K2 0:=

gc 24.4 3.165 0.24−⋅:=

x 1 m⋅:=

E230 3 1

2 1.28⋅

30.48+⎛⎜

⎝⎞⎠

2 3⋅ 1.28⋅ ln609.6

1.28 30.48⋅⎛⎜⎝

⎞⎠

:=

E 21.26= x 3.281ft= h 110 ft⋅:=

81

h 33.528m= AN15 d( )

665−

E20 log 2( )⋅+ 44 log 3.165( )⋅+ 10 log 4.343 d−( )2 33.5282+⎡⎣ ⎤⎦⋅− 0.02 4.343 d−( )2 33.5282+⎡⎣ ⎤⎦⋅− AN0+ K1+ K2+:=

h 130 ft⋅:= h 39.624m= AN25 d( )

665−

E20 log 2( )⋅+ 44 log 3.165( )⋅+ 10 log 4.343 d−( )2 39.6242+⎡⎣ ⎤⎦⋅− 0.02 4.343 d−( )2 39.6242+⎡⎣ ⎤⎦⋅− AN0+ K1+ K2+:=

h 150 ft⋅:= h 45.72m= AN35 d( )

665−

E20 log 2( )⋅+ 44 log 3.165( )⋅+ 10 log 4.343 d−( )2 45.722+⎡⎣ ⎤⎦⋅− 0.02 4.343 d−( )2 45.722+⎡⎣ ⎤⎦⋅− AN0+ K1+ K2+:=

h 110 ft⋅:= h 33.528m= AN45 d( )

665−

E20 log 2( )⋅+ 44 log 3.165( )⋅+ 10 log 4.343 d+( )2 33.5282+⎡⎣ ⎤⎦⋅− 0.02 4.343 d+( )2 33.5282+⎡⎣ ⎤⎦⋅− AN0+ K1+ K2+:=

h 130 ft⋅:= h 39.624m= AN55 d( )

665−

E20 log 2( )⋅+ 44 log 3.165( )⋅+ 10 log 4.343 d+( )2 39.6242+⎡⎣ ⎤⎦⋅− 0.02 4.343 d+( )2 39.6242+⎡⎣ ⎤⎦⋅− AN0+ K1+ K2+:=

h 150 ft⋅:= h 45.72m= AN65 d( )

665−

E20 log 2( )⋅+ 44 log 3.165( )⋅+ 10 log 4.343 d+( )2 45.722+⎡⎣ ⎤⎦⋅− 0.02 4.343 d+( )2 45.722+⎡⎣ ⎤⎦⋅− AN0+ K1+ K2+:=

AN5 d( )AN15 d( ) AN25 d( )+ AN35 d( )+ AN45 d( )+ AN55 d( )+ AN65 d( )+

10:=

SL5 d( ) 10 log 10

AN15 d( )

10 10

AN25 d( )

10+ 10

AN35 d( )

10+ 10

AN45 d( )

10+ 10

AN55 d( )

10+ 10

AN65 d( )

10+

⎛⎜⎝

⎠⋅:=

82

Level exceeding 50% of the time

∆A 14.2gc

5.609⋅ 8.2−:=

∆A 38.649= AN150 d( ) AN15 d( ) ∆A−:= AN250 d( ) AN25 d( ) ∆A−:= AN350 d( ) AN35 d( ) ∆A−:= AN450 d( ) AN45 d( ) ∆A−:= AN550 d( ) AN55 d( ) ∆A−:= AN650 d( ) AN65 d( ) ∆A−:=

SL50 d( ) 10 log 10

AN150 d( )

10 10

AN250 d( )

10+ 10

AN350 d( )

10+ 10

AN450 d( )

10+ 10

AN550 d( )

10+ 10

AN650 d( )

10+

⎛⎜⎝

⎠⋅:=


Recommended