78
Electricity Markets, Reliability and the Evolving U.S. Power System Analysis Group Paul Hibbard Susan Tierney Katherine Franklin June 2017
Electricity Markets, Reliability and the Evolving U.S. Power System
Analysis Group
Paul Hibbard Susan Tierney Katherine Franklin June 2017
Markets, Reliability and the Evolving U.S. Power System
Analysis Group
Acknowledgments
This report reviews the causes of a changing electricity resource mix in the U.S., and the impact of those changes on electric power system reliability. It is important to view the evolving mix of technologies, market incentives and policy goals in the electric industry against the long-standing framework of federal, regional, state and utility requirements and procedures to ensure the maintenance of a reliable and secure power grid at all times.
This is an independent report by the authors at the Analysis Group, supported with funding from the Advanced Energy Economy Institute and the American Wind Energy Association. The authors wish to thank Ellery Berk, Benjamin Dalzell, Jacob Silver, and Grace Howland of Analysis Group for their assistance in the analysis and development of the report.
The report, however, reflects the judgment of the authors only.
About Analysis Group
Analysis Group provides economic, financial, and business strategy consulting to leading law firms, corporations, and government agencies. The firm has more than 700 professionals, with offices in Boston, Chicago, Dallas, Denver, Los Angeles, Menlo Park, New York, San Francisco, Washington, D.C., Montreal, and Beijing.
Analysis Group’s energy and environment practice area is distinguished by expertise in economics, finance, market modeling and analysis, regulatory issues, and public policy, as well as significant experience in environmental economics and energy infrastructure development. The practice has worked for a wide variety of clients including: energy producers, suppliers and consumers; utilities; regulatory commissions and other public agencies; tribal governments; power system operators; foundations; financial institutions; and start-up companies, among others.
Markets, Reliability and the Evolving U.S. Power System
Analysis Group
Table of Contents
I. Executive Summary 2
II. Introduction and Overview 6
III. The Economics of Electricity Supply and Demand, and the Role of Policy and Consumer Preferences 8
Power Plant Profitability: Industry Structure, Market Design and Competition 8
The Role of State and Federal Policies and Consumer Preferences in Shaping the Generation Mix 13
IV. How the Resource Mix Has Changed Over Time Due to Market and Policy Factors 20
The Drivers of Changes in the Resource Mix 23
The Impact on Wholesale Electricity Prices 38
V. Power System Reliability 40
Overview 40
Reliability Factors 42
VI. The Impact of Resource Mix Changes on Power System Reliability 48
VII. Observations and Conclusions 62
APPENDIX A: Reliability of the Bulk Power System 65
Overview 65
Reliability Entities 66
Planning for and Response to Disruptive Changes or Events 71
APPENDIX B: Recent Reliability Studies 76

Markets, Reliability and the Evolving U.S. Power System
Analysis Group 2
I. Executive Summary
It is a common occurrence for the issue of reliability to be raised when market, technology or policy changes are affecting the financial outlook of different segments of the electric industry. This phenomenon has occurred several times over the past two decades, as the prospect of new industry and market structures, technological advancement, air pollution controls and customer-driven changes stood to alter the operations and economics of various types of power plants on the electric system. Sometimes these warnings spring from genuine concerns, such as the need to address the localized reliability impacts of potential plant closures; other times they reflect a first line of defense by opponents of the changes underway in the industry.
Recently, some have raised concerns that current electric market conditions may be undermining the financial viability of certain conventional power plant technologies (like existing coal and nuclear units) and thus jeopardizing electric system reliability. In addition, some have suggested that federal and state policies supporting renewable energy are the primary cause of the decline in financial viability. The evidence does not support either hypothesis.
There is little doubt that the transition under way in the industry will lead to a power system resource mix and consumption patterns quite different from the ones to which the industry has grown accustomed in recent decades. The ongoing diversification of generation supply (See Figure 1) has lowered wholesale electricity costs in most parts of the U.S. and has contributed to recent declines in consumers’ overall cost of living.
Figure 1 Shares of Total U.S. Net Generation by Fuel: 2005 vs. 2016
Coal47%
Gas22%
Nuclear19%
Water7%
Oil1%
Wind0%
Solar0%
Other3%
Source: SNL Financial.
Coal31%
Gas33%
Nuclear21%
Water6%
Oil0%
Wind6%
Solar1%
Other2%
Source: SNL Financial.
Markets, Reliability and the Evolving U.S. Power System
Analysis Group 3
Yet the nature and pace of change have raised two fundamental questions in public debates among electric industry participants, regulators, stakeholders and practitioners:
First, what exactly are the primary drivers of the transition underway in the electric industry?
Second, are the changes impacting the mix of generating resources in a way that could undermine power system reliability?
In this Report we evaluate both questions. Based on our review, we arrive at the following observations and conclusions:
1. Market Forces are Driving the Change in the Generation Mix, to the Benefit of Consumers
Fundamental market forces -- the addition of highly efficient new gas-fired resources, low natural gas prices, and flat demand for electricity -- are primarily responsible for altering the profitability of many older merchant generating assets in the parts of the country with wholesale competitive markets administered by Regional Transmission Organizations (RTOs). As a result, some of these resources (mostly coal- and natural gas-fired generating units, but also many oil-fired power plants and a handful of nuclear power plants) have retired from the system or announced that they will do so at a future date.
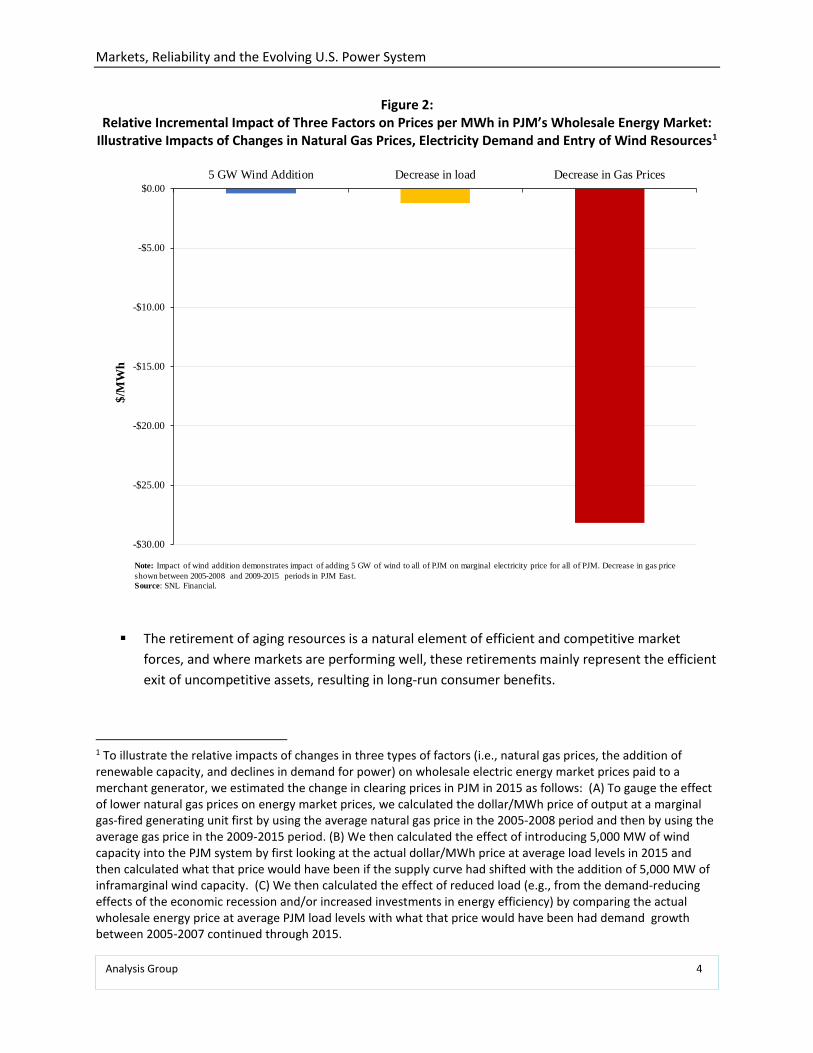
Other factors -- such as rapid growth in newer energy technologies (whose costs have declined significantly in recent years), and state policies and consumers’ actions that support such technologies -- also contribute to reducing the profitability of less economic assets. These are, however, a distant second to market fundamentals in causing financial pressure on merchant plants without long-term power contracts. In the PJM regional market, which accounts for a large share of the nation’s coal plant retirements, decreases in natural gas prices have had a much larger impact on the profitability of conventional generators than the growth of renewable energy, as illustrated in Figure 2.
Markets, Reliability and the Evolving U.S. Power System
Analysis Group 4
Figure 2: Relative Incremental Impact of Three Factors on Prices per MWh in PJM’s Wholesale Energy Market:
Illustrative Impacts of Changes in Natural Gas Prices, Electricity Demand and Entry of Wind Resources1
The retirement of aging resources is a natural element of efficient and competitive market forces, and where markets are performing well, these retirements mainly represent the efficient exit of uncompetitive assets, resulting in long-run consumer benefits.
1 To illustrate the relative impacts of changes in three types of factors (i.e., natural gas prices, the addition of renewable capacity, and declines in demand for power) on wholesale electric energy market prices paid to a merchant generator, we estimated the change in clearing prices in PJM in 2015 as follows: (A) To gauge the effect of lower natural gas prices on energy market prices, we calculated the dollar/MWh price of output at a marginal gas-fired generating unit first by using the average natural gas price in the 2005-2008 period and then by using the average gas price in the 2009-2015 period. (B) We then calculated the effect of introducing 5,000 MW of wind capacity into the PJM system by first looking at the actual dollar/MWh price at average load levels in 2015 and then calculated what that price would have been if the supply curve had shifted with the addition of 5,000 MW of inframarginal wind capacity. (C) We then calculated the effect of reduced load (e.g., from the demand-reducing effects of the economic recession and/or increased investments in energy efficiency) by comparing the actual wholesale energy price at average PJM load levels with what that price would have been had demand growth between 2005-2007 continued through 2015.
-$30.00
-$25.00
-$20.00
-$15.00
-$10.00
-$5.00
$0.005 GW Wind Addition Decrease in load Decrease in Gas Prices
$/M
Wh
Note: Impact of wind addition demonstrates impact of adding 5 GW of wind to all of PJM on marginal electricity price for all of PJM. Decrease in gas price shown between 2005-2008 and 2009-2015 periods in PJM East. Source: SNL Financial.
Markets, Reliability and the Evolving U.S. Power System
Analysis Group 5
2. The Transition Underway in the Electric Resource Mix is Not Harming Reliability
Although some commentators have raised concerns that the declining financial viability of certain conventional power plant technologies (like coal and nuclear power plants) that operate as merchant units in several wholesale electricity markets may be jeopardizing electric system reliability, there is no evidence supporting that conclusion. In fact, a recent reliability review by the National Electric Reliability Council (NERC) -- the nation’s designated reliability organization -- shows that the changes in regional wholesale markets are not leading to lower bulk-power-system reliability metrics.
Many advanced energy technologies can and do provide reliability benefits by increasing the diversity of the system. The addition of newer, more technologically advanced and more efficient natural gas and renewable technologies is rendering the power systems in this country more, rather than less, diverse. These newer generating resources are also contributing to the varied reliability services -- such frequency and voltage management, ramping and load-following capabilities, provision of contingency and replacement reserves, black start capability, and sufficient electricity output to meet demand at all times -- that electric grids require to provide electric service to consumers on an around-the-clock basis. As a result, increasing quantities of natural gas and renewable generation are increasing the diversity of the power system and supporting continued reliable operations.
Markets, Reliability and the Evolving U.S. Power System
Analysis Group 6
II. Introduction and Overview
A common occurrence in the electric industry is for observers to raise reliability concerns when policy changes -- combined with technology or market trends -- are affecting or may affect the financial outlook for different segments of the electric industry. This phenomenon has occurred several times over the past two decades. Such concerns about electric system reliability were voiced in the mid-1990s, for example, when changes in efficient co-generation technologies, combined with high rates in certain states, led large industrial customers to call for retail choice and many states to begin to restructure the industry. Such concerns were raised when the Environmental Protection Agency (EPA) and the states began to implement Title IV of the Clean Air Act, which controlled sulfur dioxide emissions from power plants. More recent examples include the debates over reliability impacts in the period leading up to EPA’s adoption of the Cross-State Air Pollution Rule, the Mercury and Air Toxics Standard (MATS) and the Clean Power Plan, all of which would have affected air emissions from various fossil-fuel power plants.
The maintenance of power system reliability is a fundamental necessity for the protection of public safety, health and welfare, as well as to support the nation's economy and standard of living. Expressions of concern over power system reliability are thus common whenever there is major change underway or anticipated in the industry. Sometimes the warnings spring from genuine concerns, such as the need to address localized reliability impacts of potential plant closures; other times they reflect a first line of defense by opponents of the changes underway in the industry, or those potentially adversely affected.
There are many sound reasons why policy and/or market changes rarely, if ever, actually end up adversely affecting electric system reliability. A vast network of entities and organizations, and a robust set of reliability laws, rules, practices, and procedures, ensures this outcome. Nevertheless, these discussions play an important role in focusing the attention of the industry on taking the steps necessary to continue to ensure reliable electric service to Americans.
Over the past decade, the electric industry has witnessed significant transitions. The changes result from a combination of forces: dramatic increases in the production of domestic natural gas and the resulting decreases in the price of natural gas; displacement of coal-fired generation with output at gas-fired power plants that had previously been underutilized; flat demand for electricity; continued improvements in the efficiency, capabilities, and costs of new gas-fired generating technologies and of both grid-connected and distributed solar and wind generation; widespread and growing adoption of small-scale, decentralized generating technologies on customers’ premises; requirements that coal plants without adequate controls on mercury and other toxic pollutants adopt modern equipment; and other forces. These changes have lowered wholesale electricity costs in most parts of the U.S., and have contributed to recent declines in consumers’ overall cost of living.
These changes challenge the economics of older fossil-fuel and nuclear power plants in many parts of the country and are driving a steady transition in the nation's resource mix towards more gas-

Markets, Reliability and the Evolving U.S. Power System
Analysis Group 7
fired and renewable resources. This raises two fundamental questions that have found their way into the discourse among electric industry participants, regulators, stakeholders, and practitioners:
First, what exactly are the primary drivers of the transition underway in the industry?
Second, are the changes impacting the mix of generating resources in a way that could undermine power system reliability?
This Report attempts to answer both questions. Regarding the first question, we review the fundamental economic and policy factors that affect the profitability of various types of generating sources competing in today's electricity markets. Further, we show how various factors -- changing fuel costs, demand for electricity and various policies -- have influenced the evolving resource mix in various regions. This analysis is presented in Sections III and IV.
Next, we review the evolving resource mix through the lens of power system reliability. This section evaluates the specific contributions of various technologies -- dispatchable and non-dispatchable power plants offering slow-ramping and quick-ramping capabilities, and so forth -- to providing the essential reliability services needed to keep the lights on. We evaluate whether the overall mix of resources resulting from economic and regulatory drivers may somehow degrade power system reliability. This review is presented in Sections V and VI.
Finally, in Section VII we present our observations based on the analysis.
Markets, Reliability and the Evolving U.S. Power System
Analysis Group 8
III. The Economics of Electricity Supply and Demand, and the Role of Policy and Consumer Preferences
Power Plant Profitability: Industry Structure, Market Design and Competition
Across the regions of the U.S., companies that own power plants face different market conditions. Notably, those in the organized wholesale markets compete for the opportunity to sell energy, capacity, and ancillary services provided by their power plants. Power plant owners incur costs for fuel, operations and maintenance; they make plant investments as needed to keep plants in service; and they may be able to earn profits through retail sales (when a utility’s power plants’ costs are covered directly in retail rates) or though wholesale sales under bilateral agreements and competitive market transactions.2
In fact, a key factor currently affecting a power plant's ability to earn profits in different states is whether the plant’s investment costs are included in a regulated utility’s “rate base,” covered in a long-term power purchase contract, or recovered through some combination of sales into energy, capacity and/or ancillary service products in organized wholesale markets administered by Regional Transmission Organizations (RTOs).3 Rate-based power plants -- whether they are coal-fired generators, nuclear units, gas-fired units, or renewable projects -- typically do not immediately face the same financial pressures affecting merchant power plants located in certain regions served by RTOs. Similarly, the profits of many power plants with long-term sales agreements may be covered -- or at least buffered to a significant degree -- by terms and conditions in those contracts.
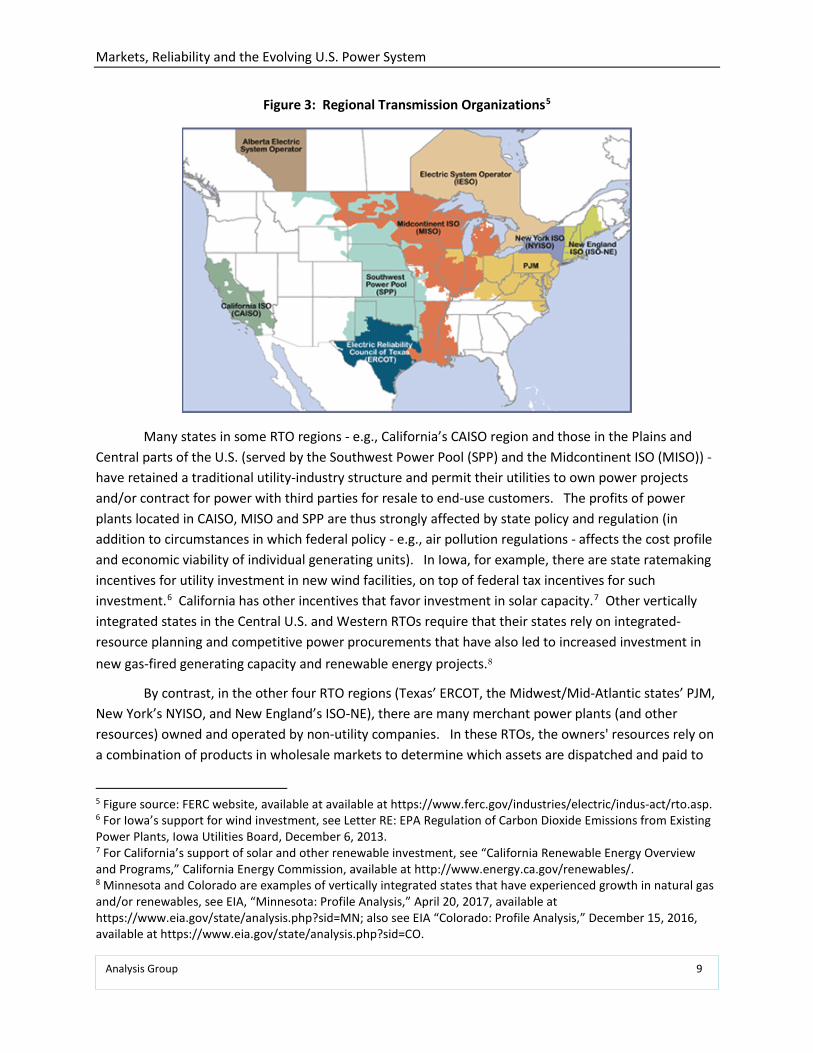
For power plants that are not included in a utility's rate base or under long-term power sales agreements, the owners’ profits are greatly affected by fundamental market conditions in those RTO markets and by their ability to provide services that have been valued in those RTOs’ market designs. Although roughly two thirds4 of the U.S. population resides in an area with an organized market RTO (see Figure 3), the market designs in these RTO regions vary, in part because of the underlying differences in electric industry structure and regulation in the states that participate in the RTOs.
2 Our discussion of market drivers evaluates the drivers of power plant profitability primarily through the lens of competitive wholesale market operations, in part because the nation's competitive markets tend to be the places where competition and changing economic factors are driving significant attrition of existing generating capacity. However, in some ways the discussion is analogous to vertically-integrated companies and regions, as decisions regarding investment, operation, and retirement of utility-owned generation or power purchase contracts are based on the same underlying drivers of fuel prices, operational costs, investment costs and risks, electricity demand, and regulatory policy. 3 Under the Federal Power Act, FERC has authority to regulate sales for resale and the terms and condition of sales in interstate commerce and as such, these RTOs (with one exception) fall under the jurisdiction of the Federal Energy Regulatory Commission (FERC). The one exception is the RTO (ERCOT) that serves most of Texas, because that portion of Texas is electrically isolated from the power systems in other states. 4 ISO/RTO Council, "IRC History," available at http://www.isorto.org/about/irchistory.
Markets, Reliability and the Evolving U.S. Power System
Analysis Group 9
Figure 3: Regional Transmission Organizations5
Many states in some RTO regions - e.g., California’s CAISO region and those in the Plains and Central parts of the U.S. (served by the Southwest Power Pool (SPP) and the Midcontinent ISO (MISO)) - have retained a traditional utility-industry structure and permit their utilities to own power projects and/or contract for power with third parties for resale to end-use customers. The profits of power plants located in CAISO, MISO and SPP are thus strongly affected by state policy and regulation (in addition to circumstances in which federal policy - e.g., air pollution regulations - affects the cost profile and economic viability of individual generating units). In Iowa, for example, there are state ratemaking incentives for utility investment in new wind facilities, on top of federal tax incentives for such investment.6 California has other incentives that favor investment in solar capacity.7 Other vertically integrated states in the Central U.S. and Western RTOs require that their states rely on integrated-resource planning and competitive power procurements that have also led to increased investment in new gas-fired generating capacity and renewable energy projects.8
By contrast, in the other four RTO regions (Texas’ ERCOT, the Midwest/Mid-Atlantic states’ PJM, New York’s NYISO, and New England’s ISO-NE), there are many merchant power plants (and other resources) owned and operated by non-utility companies. In these RTOs, the owners' resources rely on a combination of products in wholesale markets to determine which assets are dispatched and paid to
5 Figure source: FERC website, available at available at https://www.ferc.gov/industries/electric/indus-act/rto.asp. 6 For Iowa’s support for wind investment, see Letter RE: EPA Regulation of Carbon Dioxide Emissions from Existing Power Plants, Iowa Utilities Board, December 6, 2013. 7 For California’s support of solar and other renewable investment, see “California Renewable Energy Overview and Programs,” California Energy Commission, available at http://www.energy.ca.gov/renewables/. 8 Minnesota and Colorado are examples of vertically integrated states that have experienced growth in natural gas and/or renewables, see EIA, “Minnesota: Profile Analysis,” April 20, 2017, available at https://www.eia.gov/state/analysis.php?sid=MN; also see EIA “Colorado: Profile Analysis,” December 15, 2016, available at https://www.eia.gov/state/analysis.php?sid=CO.
Markets, Reliability and the Evolving U.S. Power System
Analysis Group 10
provide power in any hour or seasonally/annually (e.g., through energy- or capacity-market payments). These power markets provide the compensation mechanisms that in turn shape the profits of these power plant owners.
In the latter context, the economics of operating existing merchant power plants are continuously affected by the underlying forces of electricity supply, demand and wholesale prices in those regional markets.9 The level of revenues they earn is closely tied to the level of total electricity demand and the mix of competing generating resources over time. The level of electricity demand is strongly affected by the overall level of activity and growth in the general economy, and has also changed as a function of technological change in the industry.10 The reduction in demand due to economic and technological factors has affected the total revenues earned by existing power plants in the market.
Power plant profitability is also affected by the cost of inputs to power production that must be subtracted from revenues earned in the market – namely, the cost to procure and transport the fuel (e.g., coal, natural gas, uranium, oil, biomass) to generate electricity; variable costs associated with operating and maintaining the power plant; the fixed costs, such as salaries, property taxes, insurance, plant security, and other regular expenditures needed to maintain the plant in safe and good-working order each year; and the annualized cost associated with capital investments needed to keep the power plant running, upgrade its capability, or to comply with new safety or environmental laws and regulations. Even if a power plant’s revenues do not change from one year to the next, its underlying costs (and thus its overall profit levels) may vary.
Changes in these underlying costs affect revenues, in turn, by shaping the offer prices at which competitive power suppliers are willing to produce power. If a gas-fired power plant can obtain gas at a price today lower than the month or year before, that project’s offer price will be lower than it was at previous times. This could cause a plant to be selected for output in an RTO energy market today, whereas it was too expensive to be dispatched in a prior year. Conversely, a coal-fired power plant whose fuel costs may not have changed over that period of time could end up finding itself out of the dispatch at present - and without the receipt of revenues in the energy market. As a result of such changes, the lower gas prices would not only shift the sequence in which power plants are dispatched to produce power, but also lower wholesale market prices to all power plants in that energy market and render some power plants no longer economic to run very often (or at all).
Power plant owners continuously evaluate the current and future economics of power plant operations – that is, the revenue and cost factors described above, including the economic and regulatory risks that are inherent to the power generation sector as a normal course of doing business – 9 FERC, "Energy Primer: A Handbook of Energy Market Basics," November 2015, p. 35. 10 For example, the growth of more efficient end-use technologies – such as increased efficiency of light bulbs and home appliances – can significantly moderate the level of growth in total electricity demand. Similarly, dramatic cost reductions in distributed generation technologies, such as rooftop solar photovoltaics, combined with state regulatory incentives for the adoption of such projects, can lead to significant reductions in the demand for energy from central-station power plants.
Markets, Reliability and the Evolving U.S. Power System
Analysis Group 11
to make decisions regarding whether to invest in plant upgrades, invest in new generating technology, or even whether to continue operating plants beyond a particular point in time. Further, those that own multiple power plants may make such decisions across a fleet of investment options and determine where to invest limited capital among their portfolio of generating assets and even whether to remain in the business of generating electricity from merchant power plants. In some circumstances, owners of plants with low profitability may decide to retire them in order to remove the dampening effect of units on the company's stock price.11
Over time, the mix of power plants in a system reflects these various economic and financial pressures. As power plants age, they become more costly to operate and maintain, while technological change often leads to the development of replacement technologies that are more efficient, more reliable, lower emitting, and/or lower cost.
These market pressures are also affected by two factors that affect individual power plants’ potential (or actual) profitability. First, each wholesale RTO market has its own market design details which affect revenue potential for different types of power plants.12 Second, the provisions of state and federal public policies allow for compensating some technologies but not others (as explained further below). Together, market design and public policies end up compensating some power plant owners for some of the positive attributes of their assets (e.g., their electrical capacity and energy production, their renewable energy output, and/or their ability to ramp their power up or down relatively quickly), but fail to properly price certain negative attributes (e.g., air, water, and solid waste environmental externalities) or conversely, to compensate a power plant for its ability to produce electricity without externalities. These market-design conditions and public policies affect merchant plants differently because of variations in power plants’ vintage, technological attributes, their location on the system, and so forth.
Additionally, the organized market RTOs currently and increasingly incorporate specific technology-neutral reliability services and reliability needs into their market design constructs. Examples include various RTOs’ performance obligations in capacity markets; their purchase of greater quantities of reserves at market-based prices, particularly during periods of reliability constraints; and payments or incentives for operational controls that perform various reliability services (e.g., the ability of generation and supply-side resources to provide ramping, automatic generation control, and other
11 See, for example: UBS Utilities, "ETR: Amidst Regulatory Wait (Sell; $70 PT)," April 27, 2017; "NRG Energy Inc. Moving to the Next Stage: Upgrading to Buy," UBS Global Research, May 31, 2017; "US Electric Utilities & IPPs: PJM Results Take 2: Just Who Cleared What," UBS Global Research, May 26, 2017; "US Electric Utilities & IPPs: The Capacity Crash, Just What Happened?" UBS Global Research, May 24, 2017; "US IPP and Utility Weekly Power Points: The Core Debates of our Day," UBS Global Research, May 12, 2017; and "Dynegy, Inc.: Sticking to the Plan," UBS Global Research, May 9, 2017. 12 For example, wholesale electricity markets in ERCOT, PJM, NYISO, and ISO-NE are designed to compensate generation resources and demand-side suppliers for the services they supply to the system through a combination of energy, ancillary services, and capacity markets. PJM and ISO-NE have forward (3 years ahead) capacity markets, while NYISO operates a seasonal capacity market. ERCOT does not have a capacity market, but allows for higher pricing in the energy market to increase investment incentives. Finally, all four RTOs operate ancillary service markets that differ in size, supplier obligations, procurement mechanisms, and compensation.
Markets, Reliability and the Evolving U.S. Power System
Analysis Group 12
reliability services). Importantly, all RTOs also enforce procedures and obligations as a condition of market participation for power plants, designed to assure that their facilities respond to operator instructions, operate safely, and perform as expected in the context of a tightly interconnected system. With increasing diversity of technologies on the electric system, many more types of power plants (such as gas-fired power plants, nuclear power plants, coal-fired power plants, solar and wind projects and other power plants) have ended up supplying valuable electric reliability and energy services to the bulk power electric system, in light of these incentives and performance obligations.
Notably, organized wholesale electric markets are designed to obtain services to reliably and efficiently meet customer needs without regard to preferred fuels or technologies. A necessary component of meeting this goal is to provide the appropriate financial incentives for both efficient dispatch as well as efficient market entry and exit. For many years and in many of these markets a significant continuous portion of electricity demand - that is, the quantity of demand that exists around the clock (often referred to as "baseload" requirements) - has been met by large generating resources such as older coal-fired and nuclear generating stations.13 However, as discussed in more detail below, several key factors have begun to change this landscape.
First, improvements in the efficiency, costs and emissions profile of natural gas combined-cycle (CC) and combustion-turbine (CT) technologies has led to their being the technology of choice for new fossil-fueled generation investment in most regions. These gas-fired plants are also capable of serving load on either a continuous or cycling basis, and thus can provide key reliability services to the grid operator. Second, changing fuel prices for power generation -- in particular the lower gas prices due to the emergence of shale gas -- have made it economical to operate this new capacity and to dispatch existing gas-fired capacity that was previously underutilized; this, in turn, has lowered electric energy prices and reduced the revenues for all other existing power plants (including coal, nuclear and even relatively inefficient gas-fired power plants). Third, flat electricity demand across most regions -- due to lower economic growth, increased energy efficiency, and the growth of distributed solar PV systems -- has reduced the sales and profit opportunities for all resources in the market. And fourth, the rapid decline in the installed cost per megawatt of solar and wind generation has led to such resources capturing significant market share at very low variable costs. Finally, many older and less efficient coal plants without controls on mercury faced additional cost factors in the context of the MATS rule. Together these factors have led many of the older and smaller coal-fired and some nuclear units to retire (see Figure 9, below), consistent with market-based principles in these wholesale RTO markets.
13 Recently, much attention has focused on the economic pressures facing these power plants and technologies that have historically operated around the clock, and that are sometimes referred as "baseload" power plants - namely, older coal-fired units and nuclear units. However, they are neither the only power-generation technologies facing economic stress due to market factors, nor are they the only types of technologies capable of providing around-the-clock power supply and other functions necessary for reliable electric system operations. Consequently, we do not use the term "baseload" to refer to any particular generating asset type or fuel source, as many power plants can operate either around the clock or in cycling mode, and provide the same or more essential reliability services that are provided by such resources. See the discussion below in Section V.
Markets, Reliability and the Evolving U.S. Power System
Analysis Group 13
The Role of State and Federal Policies and Consumer Preferences in Shaping the Generation Mix
In addition to economic factors, federal and state energy and environmental policies have historically affected the costs and revenues of all types of generating sources and have contributed to shaping the composition of the generation mix in all regions over time.
Prior examples of such federal policies include support for various types of power generation technologies still in operation today: federal investment in large-scale hydroelectric facilities (e.g., the Tennessee Valley Authority’s facilities that were built for rural electrification and flood control14); federal insurance to underwrite the risk of accidents at nuclear plants;15 the availability of production tax credits (PTCs) and investment tax credits (ITCs) for new nuclear plants and new renewable energy projects;16 the availability of loan guarantees for new nuclear plants;17 and federal research and development support for advanced coal-fired, renewable and nuclear technologies.18 Over time, at the federal level, support for the development and operation of fossil energy and nuclear power has dominated cumulative federal energy incentives.19 State policies that favor certain types of power-generation resources include: many states’ requirements that utilities invest in energy efficiency;20 renewable portfolio standards (RPS) in 29 states and in the District of Columbia;21 ratemaking provisions for certain new technology investments (e.g., such as the ability to recover construction work in progress for nuclear plants in Georgia,22 or pre-approval of ratemaking treatment for wind projects in
14 Tennessee Valley Authority Act of 1993, Pub. L. No. 108-447, 118 Stat. 2966. 15 Price Anderson Act of 1957, 42 U.S.C. § 2210. 16 The PTC is a ten-year tax credit on a per-kWh basis for electricity generated by qualifying resources, has been important in facilitating the commercialization, and driving down the costs over time, of renewable resources. The value of the 2016 PTC was $0.023/kWh. See Energy.gov, "Renewable Electricity Production Tax Credit (PTC)," available at https://energy.gov/savings/renewable-electricity-production-tax-credit-ptc. The PTC is also available to certain new nuclear facilities. While it is currently phasing out, the PTC contributed to the addition of large quantities of wind capacity across the U.S. over the last 10-15 years. AWEA, "Production Tax Credit," available at http://www.awea.org/production-tax-credit. The PTC and ITC have also supported investment in the new nuclear units now under construction at the Vogtle Nuclear Station. E&E News, "House panel OKs lifeline for at-risk reactors," June 15, 2017, available at www.eenews.net/greenwire/2017/06/15/stories/1060056109. 17 Energy Policy Act of 2005, P. L. No. 109-58, 119 Stat. 594. 18 A recent study estimates that the Federal government has spent over $1 trillion supporting various energy technologies since 1950. 65 percent of these subsidies have supported fossil fuel development, and only 16 percent of these subsidies have gone toward the advancement of renewables (with remaining subsidies supporting nuclear, hydro, and geothermal energy sources). See Management Information Systems, “Two Thirds of a Century and $1 Trillion+ U.S. Energy Incentives,” May 2017. See also Department of Energy, "Budget and Performance," available at https://energy.gov/budget-performance. 19 Molly F. Sherlock, Congressional Research Service, Energy Tax Policy: Historical Perspectives on and Current Status of Energy Tax Expenditures, May 7, 2010, pp. 28-29. 20 See Database of State Incentives for Renewables and Efficiency, available at http://www.dsireusa.org/. 21 Lawrence Berkeley National Laboratory, "U.S. Renewables Portfolio Standards: 2016 Annual Status Report," April 2016, p. 5. See also DSIRE for detailed state RPS descriptions, available at http://www.dsireusa.org/ 22 See Georgia Power's Electric Service Tariff "Nuclear Construction Cost Recovery Schedule: 'NCCR'," Georgia Power, January 2016, which specifies that " The Nuclear Construction Cost Recovery Schedule (NCCR) will recover the cost of financing associated with the construction of a nuclear generating plant which has been certified by the
Markets, Reliability and the Evolving U.S. Power System
Analysis Group 14
Iowa;23 net-energy metering for rooftop solar in 41 states24); laws requiring replacement of coal plants with natural gas facilities for public health reasons (as in Colorado’s Clean Air Clean Jobs law25); state tax benefits and/or other incentives related to fossil fuel exploration and production; and many other state policies.26
As an example of specific policies promoting the development of renewable resources, state RPS requirements have been in place for many years and have been adopted by state legislatures for a variety of fuel-diversity, local economic development,27 environmental, and other objectives. RPS policies require that a certain percentage of generation in a state be procured from qualifying sources, which most typically include wind, solar, and biomass.28 Most RPS policies escalate the percentage targets every year up until the goal year, and monitor the progress annually. To meet RPS requirements, utilities can procure energy from qualifying resources, or in some states utilities can buy Renewable Energy Credits (RECs)29 that go towards their total requirement. If entities are unable to meet standards,
Commission in accordance with O.C.G.A. § 46-2-25(c.1) and the Commission’s Certification Order in Docket No. 27800. This schedule is applicable to and becomes a part of each retail rate schedule in which reference is made to the NCCR." 23 http://home.engineering.iastate.edu/~jdm/wesep594/Tipton.pdf. 24 See Database of State Incentives for Renewables and Efficiency, available at http://www.dsireusa.org/. See also NCSL, “State Net Metering Policies,” November 3, 2016. 25http://www.leg.state.co.us/clics/clics2010a/csl.nsf/fsbillcont/0CA296732C8CEF4D872576E400641B74?Open&file=1365_ren.pdf 26 For examples of state policies that subsidize fossil fuels see Doug Koplow and Cynthia Lin, “Review of Fossil Fuel Subsidies in Colorado, Kentucky, Louisiana, Oklahoma, and Wyoming,” Earth Track, December 2012. 27 The United States Energy and Employment Report indicates that 374,000 individuals work at least in part for solar firms and 102,000 individuals work for wind farms across the country (2017 U.S. Energy and Employment Report, January 2017, accessible at https://www.energy.gov/downloads/2017-us-energy-and-employment-report); and the Union of Concerned Scientists corroborates the strong employment effect of the renewable industry ("How Renewable Electricity Standards Deliver Economic Benefits," Union of Concerned Scientists, May 2013, accessible at http://awea.files.cms-plus.com/FileDownloads/pdfs/UCS%20Renewable-Electricity-Standards-Deliver-Economic-Benefits.pdf). The 2016 Massachusetts Clean Energy Report (available at http://www.masscec.com/2016-massachusetts-clean-energy-industry-report-0) found that the clean energy sector has created more than 105,000 jobs and contributes $11.8 billion to the Massachusetts economy. Similar employment opportunities have been created in Florida, Vermont, California, Rhode Island, and Texas and have been detailed in reports that can be accessed here: http://info.aee.net/clean-energy-jobs-reports. 28 Different states will have somewhat different rules about resources that qualify to meet RPS requirements. For a full list of states and qualifying resources, see NREL, "Renewable Portfolio Standards," available at http://www.nrel.gov/tech_deployment/state_local_governments/basics_portfolio_standards.html. 29 RECs are tradable commodities worth 1 MWh of electricity. States have markets for RECs such that utilities who are short on qualifying renewable energy procurement can buy RECs and utilities that have a surplus of qualifying resources can sell RECs. See the EPA REC website, available at https://www.epa.gov/greenpower/renewable-energy-certificates-recs. Prices of RECs will vary regionally. For example, the RECs in Texas, which has a massive surplus of wind, trade at <$1/MWh, versus in New England, where there are tighter supplies, RECs trade at almost $55/MWh. See Lawrence Berkeley National Laboratory, "U.S. Renewables Portfolio Standards: 2016 Annual Status Report," April 2016, p. 28.
Markets, Reliability and the Evolving U.S. Power System
Analysis Group 15
most states require that a penalty be paid, often called an Alternative Compliance Payment (ACP).30
Other policies and pricing mechanisms at the state level also shape the attributes of the projects that participate in certain markets. For example, nine Northeast states participate in the Regional Greenhouse Gas Initiative (RGGI), which is a mandatory market-based program to reduce greenhouse gas emissions, and that improves the market position of lower-emitting resources (e.g., solar, wind, hydro, nuclear, and efficient gas-fired generators) relative to higher-emitting resources.31 Separately, New York and Illinois both have introduced zero-emission carbon (ZEC) programs, whereby nuclear generators receive one ZEC per megawatt-hour (MWh) generated at a price tied to the federal government's estimate of the social cost of carbon and wholesale capacity prices.32 And some states require utilities to procure or enter into long-term contracts for the purchase of specific resource types (such as energy storage, fuel cells, or renewables).33
Each of these federal and state policy levers can have the effect of creating incentives for certain technologies to enter or remain in the market and in so doing introduce interactions with other assets on the grid. For example, energy efficiency policies have affected overall demand for power, thus reducing the need to call upon certain existing power plants and keeping electricity prices lower than those electricity prices would otherwise be.34 The entry of wind resources in Iowa, for example, has led to lower output of other power plants on the system but has also led to local investment and local jobs.35 And older resources (e.g., fossil and nuclear generators) have remained in the market in part due to the various state and federal incentives that have encouraged development and continued operation over many years.
Wholesale electricity markets allow energy prices to go negative, as can occur occasionally in certain localized areas and at certain times where there is a combination of low loads, offer prices from generators that reflect production incentives like the PTC, fuel supply contracts, and/or the limited ability of other generators to ramp their output down or turn off overnight.36 Some have argued that
30 Lawrence Berkeley National Laboratory, "U.S. Renewables Portfolio Standards: 2016 Annual Status Report," April 2016, p. 4. 31 Emissions allowances are sold through auctions and the proceeds are invested in energy efficiency, renewable energy, and other programs. See the RGGI website, https://www.rggi.org/. 32 See e.g. Illinois State Power Project, available at https://statepowerproject.org/illinois/. 33 For example, in California Investor Owned Utilities are mandated to procure storage and in 2016 Massachusetts passed a law mandating utilities purchase renewables with a 1,600 MW carve out for offshore wind. See CPUC Decision in "Order Instituting Rulemaking Pursuant to Assembly Bill 2514 to Consider the Adoption of Procurement Targets for Viable and Cost-Effective Energy Storage Systems," Rulemaking 10-12-007, filed December 16, 2010 and Massachusetts House Bill 4568, An Act to Promote Energy Diversity. 34 See: "The Economic Impacts of the Regional Greenhouse Gas Initiative on Nine Northeast and Mid-Atlantic States," Hibbard et al., July 14, 2015 and "The Economic Impacts of the Regional Greenhouse Initiative on Ten Northeast and Mid-Atlantic States," Hibbard et al., November 15, 2011. 35 See "Estimated Economic Impacts of Utility Scale Wind Power in Iowa," NREL, November 2013. 36 See Congressional Research Service, "U.S. Renewable Electricity: How Does Wind Generation Impact Competitive Power Markets?" November 7, 2012, p. 8. See also, ERCOT Investment Incentives and Resource Adequacy," The Brattle Group, June 2012, page 20.
Markets, Reliability and the Evolving U.S. Power System
Analysis Group 16
the PTC is driving significant negative pricing, but the reality is that negative prices from wind generation, which qualifies for the PTC, do not occur frequently in the U.S. RTOs because wind units are typically not often on the margin (and thus not eligible to set locational prices). For example, in a recent PJM study, wind set the price about 0.1 percent of the time in a calendar year.37 This low rate is true in many regions in the U.S. that do not have high renewable penetration rates. Even in regions with a high penetration of renewables, such as Texas, negative pricing occurs relatively infrequently, generally during already low-load, low-price market conditions, and in Texas almost always in remote parts of the grid where few if any conventional generators are affected.38 Some view negative pricing as a distortion of wholesale market price signals, while others argue that public policy incentives that contribute to negative pricing correct a market distortion by appropriately crediting resources with otherwise-unpriced positive attributes (e.g., the avoidance of a market externality, such as damages and risks associated with pollutant emissions).39 In any event, from a practical perspective, as demonstrated below, the existence of state or federal policies or incentives is far less significant than the fundamental market factors (primarily the addition of new natural gas capacity since 2000 and much lower natural gas prices) in affecting the profitability of certain existing, older and merchant power-generation technologies (such as existing coal and nuclear facilities) in certain RTO markets.40
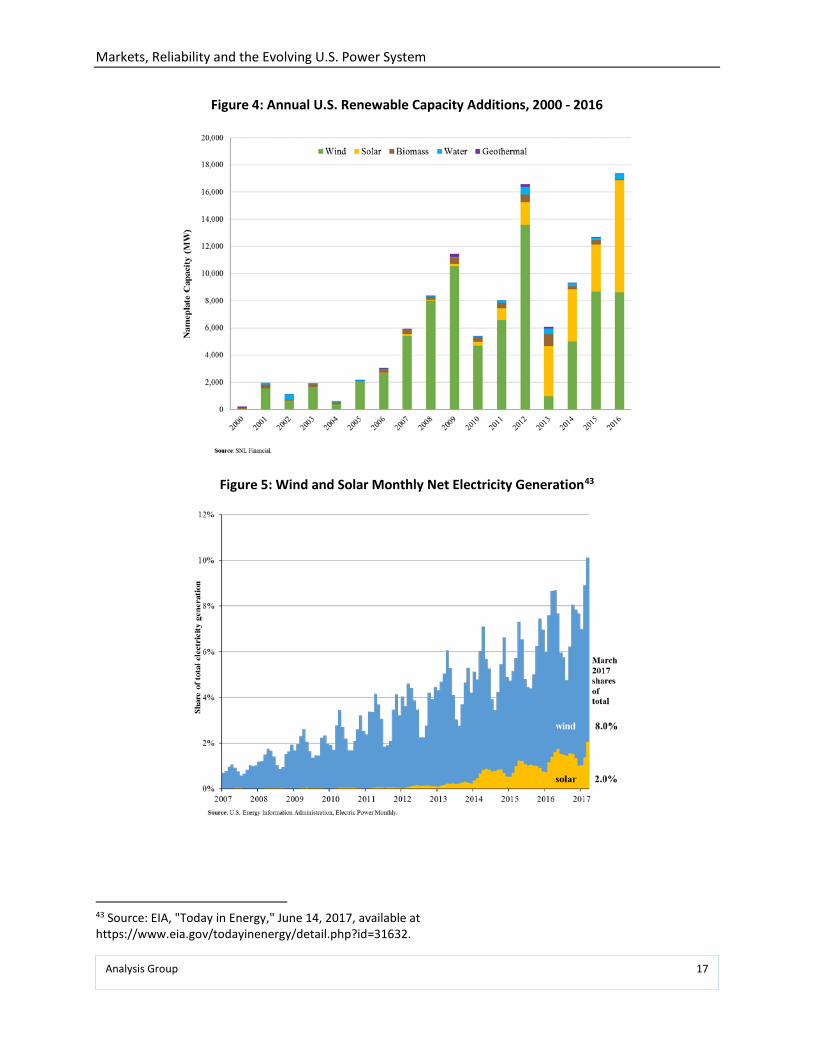
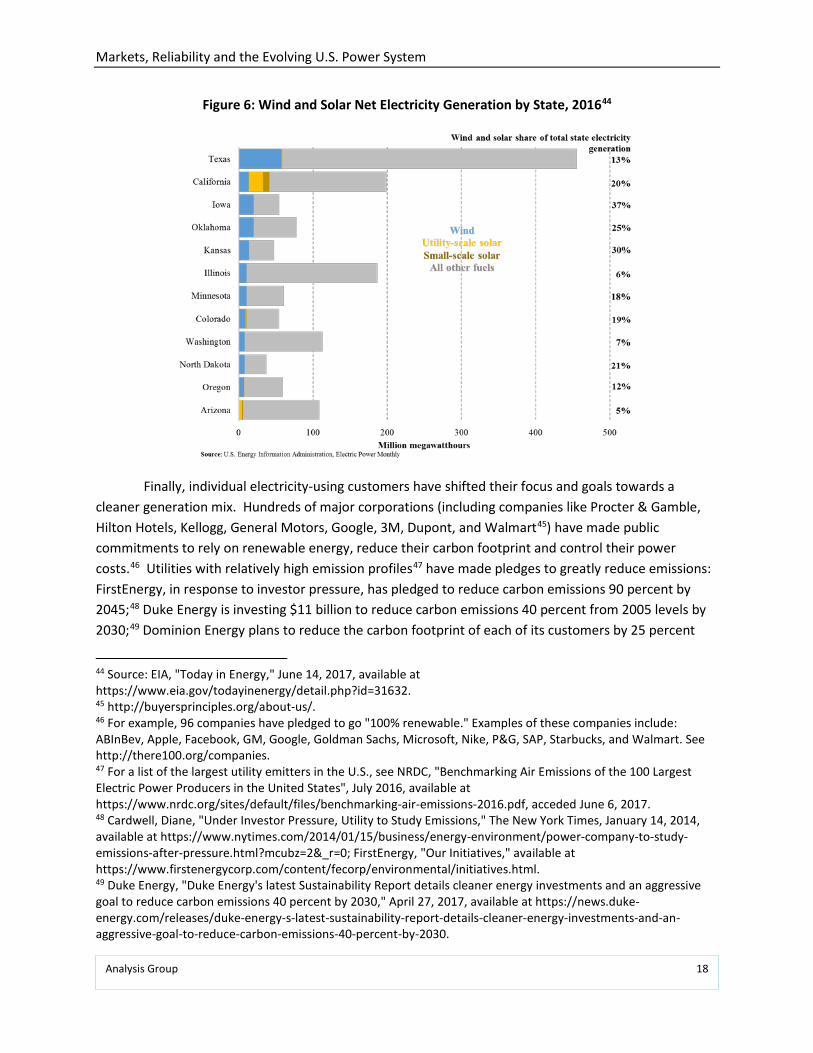
The declining costs and increased competitiveness of new investment in solar and wind resources, in combination with early funding and policies to promote commercialization, have led to the development and installation of significant quantities over the last twenty years.41 Figure 4 shows the annual renewable capacity additions from 2000 to 2016. As shown, wind used to dominate the renewable capacity additions, but in recent years solar has accounted for a large share of incremental additions. Over this time period, wind accounts for 72 percent of the cumulative renewable capacity additions, while solar makes up 20 percent.42 Notably, and as a result of this ongoing investment climate, renewable resources for the first time comprised ten percent of total net electricity generation in the U.S. in March 2017 as shown in Figure 5. Moreover, this generation flowed from a diverse set of states with significantly different market and regulatory constructs, such as California, Colorado, Iowa, Kansas, Minnesota, North Dakota, Oklahoma, and Texas, (as well as several others). See Figure 6.
37 PJM, State of the Market Report for PJM, March 2017. 38 In Q1 2016 in California, negative prices were experienced about four to seven percent of the time. Throughout all of 2015, Texas experienced negative prices less than one percent of the time. CAISO, Q1 2016 Report on Market Issues and Performance, June 2016; ERCOT, 2015 State of the Market Report for the ERCOT Wholesale Market, June 2016, see p. 9. 39 Congressional Research Service, U.S. Renewable Electricity: How Does Wind Generation Impact Competitive Power Markets? November 7, 2012. 40 One exception is the large Quad Cities nuclear station in Illinois, which is one of the few nuclear plants significantly exposed to negative pricing (from wind generation in neighboring regions) at certain low-load periods. 41 See "Levelized Cost of Energy Analysis - Version 10.0," Lazard, December 2016, page 10. 42 Source: SNL Financial.
Markets, Reliability and the Evolving U.S. Power System
Analysis Group 17
Figure 4: Annual U.S. Renewable Capacity Additions, 2000 - 2016
Figure 5: Wind and Solar Monthly Net Electricity Generation43
43 Source: EIA, "Today in Energy," June 14, 2017, available at https://www.eia.gov/todayinenergy/detail.php?id=31632.
Markets, Reliability and the Evolving U.S. Power System
Analysis Group 18
Figure 6: Wind and Solar Net Electricity Generation by State, 201644
Finally, individual electricity-using customers have shifted their focus and goals towards a cleaner generation mix. Hundreds of major corporations (including companies like Procter & Gamble, Hilton Hotels, Kellogg, General Motors, Google, 3M, Dupont, and Walmart45) have made public commitments to rely on renewable energy, reduce their carbon footprint and control their power costs.46 Utilities with relatively high emission profiles47 have made pledges to greatly reduce emissions: FirstEnergy, in response to investor pressure, has pledged to reduce carbon emissions 90 percent by 2045;48 Duke Energy is investing $11 billion to reduce carbon emissions 40 percent from 2005 levels by 2030;49 Dominion Energy plans to reduce the carbon footprint of each of its customers by 25 percent
44 Source: EIA, "Today in Energy," June 14, 2017, available at https://www.eia.gov/todayinenergy/detail.php?id=31632. 45 http://buyersprinciples.org/about-us/. 46 For example, 96 companies have pledged to go "100% renewable." Examples of these companies include: ABInBev, Apple, Facebook, GM, Google, Goldman Sachs, Microsoft, Nike, P&G, SAP, Starbucks, and Walmart. See http://there100.org/companies. 47 For a list of the largest utility emitters in the U.S., see NRDC, "Benchmarking Air Emissions of the 100 Largest Electric Power Producers in the United States", July 2016, available at https://www.nrdc.org/sites/default/files/benchmarking-air-emissions-2016.pdf, acceded June 6, 2017. 48 Cardwell, Diane, "Under Investor Pressure, Utility to Study Emissions," The New York Times, January 14, 2014, available at https://www.nytimes.com/2014/01/15/business/energy-environment/power-company-to-study-emissions-after-pressure.html?mcubz=2&_r=0; FirstEnergy, "Our Initiatives," available at https://www.firstenergycorp.com/content/fecorp/environmental/initiatives.html. 49 Duke Energy, "Duke Energy's latest Sustainability Report details cleaner energy investments and an aggressive goal to reduce carbon emissions 40 percent by 2030," April 27, 2017, available at https://news.duke-energy.com/releases/duke-energy-s-latest-sustainability-report-details-cleaner-energy-investments-and-an-aggressive-goal-to-reduce-carbon-emissions-40-percent-by-2030.
Markets, Reliability and the Evolving U.S. Power System
Analysis Group 19
over the next 8 years;50 DTE Energy announced a plan to reduce carbon emissions by 80 percent by 2050; 51 AEP plans to invest $1.5 billion in renewables in the 2017 through 2019 period;52 and MidAmerican Energy has committed to a 100 percent renewable energy vision.53
The combination of economics, state and federal policies, and consumer and company purchase or investment preferences, has thus led to a shift in the generation resource mix in the United States. Importantly, as discussed further in Section VI, this has not come at the expense of reliability, and significant additional quantities of renewable integration are possible. Not only have there been no serious reliability effects to date, but also numerous studies on renewable integration and coal retirements have concluded that regions within the U.S. can continue to add larger percentages of generation coming from natural gas and renewable resources without anticipated reliability concerns.54 In fact, in regions and/or at times when natural gas supply is constrained, renewable generation plays a significant positive reliability role by reducing the amount of gas needed to meet demand, making additional gas supplies available. Further, there is little evidence that the loss of aging conventional resources due to new, low-cost generation coming on line introduces new or unique reliability challenges. This is perhaps most evident in New England, which had less than 2 percent of its total system generation come from coal power in 2016. Commenting on the potential reliability impact of this condition, ISO-NE President and CEO, Gordon van Welie, recently stated "…coal is now largely irrelevant in New England…and everyone else says we need coal to maintain resilience? That just doesn't compute for me."55 Further, ISO-NE sees no concern of additional renewables affecting reliability: "The current market design should ensure adequate resources to meet the reliability standards that the resulting resource mix appropriately complements the operational capabilities and variability of renewable resources."56
50 Dominion Energy, "Dominion Virginia Power Plan Sees More Clean Energy," May 1, 2017, available at https://www.dominionenergy.com/news/news-releases/137244. 51 DTE Energy Newsroom, "DTE Energy announces plan to reduce carbon emissions by 80 percent," May 16, 2017, available at http://newsroom.dteenergy.com/2017-05-16-DTE-Energy-announces-plan-to-reduce-carbon-emissions-by-80-percent#sthash.jyjxm4QO.dpuf. 52 AEP, "2017 Corporate Accountability Report," May 2017. 53 MidAmerican Energy, "Our 100% Renewable Vision," available at https://www.midamericanenergy.com/our-renewable-energy-vision.aspx. 54 Studies or statements have been made on this topic about the following regions: ERCOT, CAISO, NYISO, NEISO, WECC, and PJM. See, for example, The Brattle Group, "Reliability Risks due to Coal Retirement in ERCOT," December 7, 2016; "PJM's Evolving Resource Mix and System Reliability," PJM Interconnection, March 30, 2017. NREL, Western Wind and Solar Integration Study, available at https://www.nrel.gov/grid/wwsis.html; CAISO, NREL, "Using Renewables to Operate a Low-Carbon Grid: Demonstration of Advanced Reliability Services from a Utility-Scale Solar PV Plant," 2017; NYISO, "Growing Wind: Final Report of the NYISO Wind Generation Study," March 20, 2012. 55 E&E News, "Pruitt says coal losses make the grid vulnerable. Not really," June 7, 2017, https://www.eenews.net/climatewire/2017/06/07/stories/1060055661. 56 Robert Ethier, ISO NE, "Can Wholesale Markets Satisfy Both Electric Reliability and Public Policy Goals?" Presentation before the US DOE Electricity Advisory Committee, March 18, 2016.
Markets, Reliability and the Evolving U.S. Power System
Analysis Group 20
IV. How the Resource Mix Has Changed Over Time Due to Market and Policy Factors
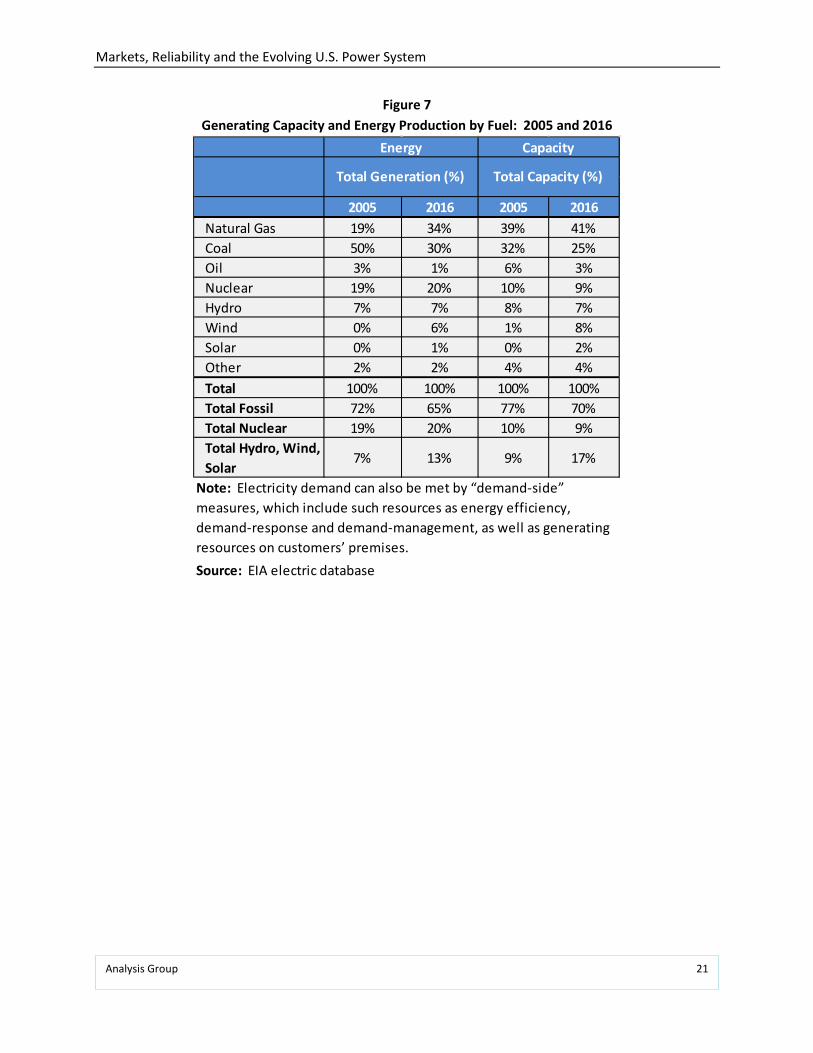
Overall, electricity generation has been modernizing, with the average mix of generating capacity becoming younger, more efficient, more varied in size and technology, more dispersed, and more flexible since the mid-1990s. In short, the mix of resources has gotten more - not less - diverse in recent years. Fossil fuels as a whole are still the dominant fuel source for power generation today, providing two-thirds of energy generation and 70 percent of capacity. Technology and operational advancements - such as increased ramping speeds for natural gas power plants; an increase in the number of plants with dual-fuel capability; more dispersed siting of generation sources; improved availability, ride-through capability, voltage, reactive and real power control, and inverter technologies of renewables; and improved operator forecasting of weather conditions57 - create additional diversity within the generation mix that enhances reliability to the grid.
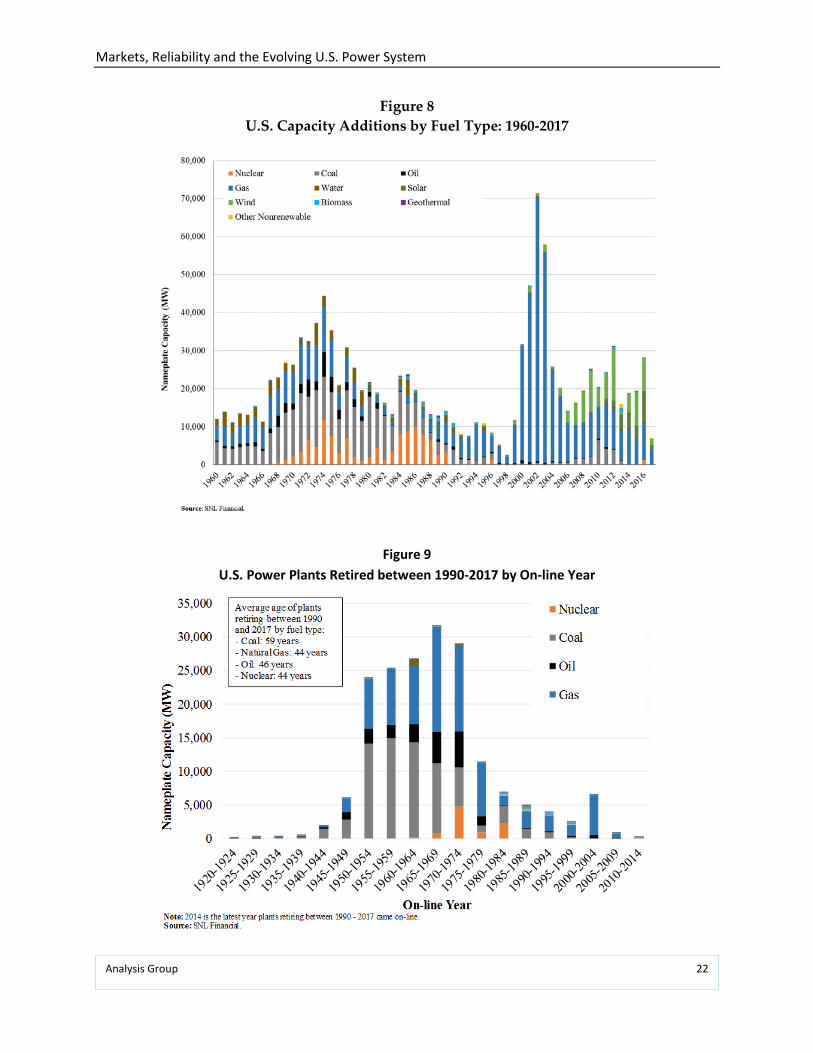
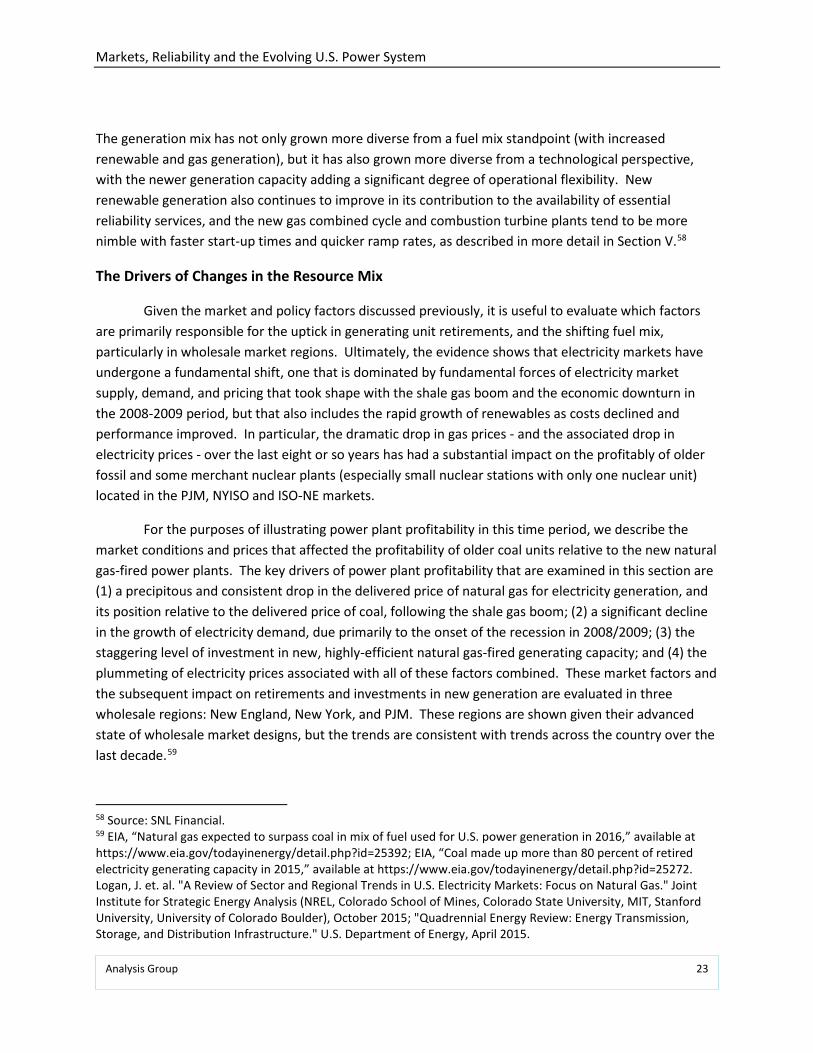
Figure 7 highlights and Figures 8 and 9 show, the various changes in generation and capacity from 2005 to 2016. Of note, the shares of nuclear and hydro generation have remained relatively stable in terms of generation and capacity, but coal and oil decrease across both dimensions, and renewables increase considerably across both. Natural gas increased in capacity (17 percent), particularly in recent years, but has seen an even greater increase in generation (81 percent). This can in part be explained by the capacity addition chart (Figure 8), which shows large amounts of new, efficient natural gas capacity coming online in the 2000s. Figure 9 shows retirements that have occurred between 1990 and 2017, sorted by the age (or online date) of the retired unit as of the time of the power plant's retirement. As shown in the figure, there are large quantities of both coal and natural gas capacity that have retired in the last twenty years, with most of the retirements associated with older units (the average retirement age of the coal plants at 59 years and the average age of retired natural gas plants at 44 years).
57 The California Independent System Operator Corporation (California ISO) reports a 20 percent improvement in forecasting wind generation based on the results of a yearlong forecasting competition," "New Release: California ISO Wind Forecasting Improves 20 Percent," CAISO, January 26, 2010; and "The forecasting tool has already resulted in fewer orders to wind plants to curtail their output under certain circumstances. With more efficient dispatch of the system, the amount of Minimum Generation (Min Gen) events (when the amount of generation is close to exceeding the demand for electricity) is reduced, resulting in fewer wind curtailments," See "New Wind Power Forecast Integrated into ISO-NE Processes and Control Room Operations," ISO New England, April 1, 2014. See also, "Fast Cycling and Rapid Start-up: New Generation of Plants Achieves Impressive Results," Siemens, January 2011; "Power Trends 2016: The Changing Energy Landscape," NYISO, 2016; "Changing Resources: How New England has Responded to Challenged Associated with the Expanded Role of Natural Gas," ISO New England, May 2016; and "Variable Renewable Generation Can Provide Balancing Control to the Electric System," NREL, September 2013.
Markets, Reliability and the Evolving U.S. Power System
Analysis Group 21
Figure 7 Generating Capacity and Energy Production by Fuel: 2005 and 2016
2005 2016 2005 2016Natural Gas 19% 34% 39% 41%Coal 50% 30% 32% 25%Oil 3% 1% 6% 3%Nuclear 19% 20% 10% 9%Hydro 7% 7% 8% 7%Wind 0% 6% 1% 8%Solar 0% 1% 0% 2%Other 2% 2% 4% 4%Total 100% 100% 100% 100%Total Fossil 72% 65% 77% 70%Total Nuclear 19% 20% 10% 9%Total Hydro, Wind, Solar
7% 13% 9% 17%
Source: EIA electric database
Total Capacity (%)
Energy Capacity
Total Generation (%)
Note: Electricity demand can also be met by “demand-side” measures, which include such resources as energy efficiency, demand-response and demand-management, as well as generating resources on customers’ premises.
Markets, Reliability and the Evolving U.S. Power System
Analysis Group 22
Figure 8 U.S. Capacity Additions by Fuel Type: 1960-2017
Figure 9 U.S. Power Plants Retired between 1990-2017 by On-line Year
Markets, Reliability and the Evolving U.S. Power System
Analysis Group 23
The generation mix has not only grown more diverse from a fuel mix standpoint (with increased renewable and gas generation), but it has also grown more diverse from a technological perspective, with the newer generation capacity adding a significant degree of operational flexibility. New renewable generation also continues to improve in its contribution to the availability of essential reliability services, and the new gas combined cycle and combustion turbine plants tend to be more nimble with faster start-up times and quicker ramp rates, as described in more detail in Section V.58
The Drivers of Changes in the Resource Mix
Given the market and policy factors discussed previously, it is useful to evaluate which factors are primarily responsible for the uptick in generating unit retirements, and the shifting fuel mix, particularly in wholesale market regions. Ultimately, the evidence shows that electricity markets have undergone a fundamental shift, one that is dominated by fundamental forces of electricity market supply, demand, and pricing that took shape with the shale gas boom and the economic downturn in the 2008-2009 period, but that also includes the rapid growth of renewables as costs declined and performance improved. In particular, the dramatic drop in gas prices - and the associated drop in electricity prices - over the last eight or so years has had a substantial impact on the profitably of older fossil and some merchant nuclear plants (especially small nuclear stations with only one nuclear unit) located in the PJM, NYISO and ISO-NE markets.
For the purposes of illustrating power plant profitability in this time period, we describe the market conditions and prices that affected the profitability of older coal units relative to the new natural gas-fired power plants. The key drivers of power plant profitability that are examined in this section are (1) a precipitous and consistent drop in the delivered price of natural gas for electricity generation, and its position relative to the delivered price of coal, following the shale gas boom; (2) a significant decline in the growth of electricity demand, due primarily to the onset of the recession in 2008/2009; (3) the staggering level of investment in new, highly-efficient natural gas-fired generating capacity; and (4) the plummeting of electricity prices associated with all of these factors combined. These market factors and the subsequent impact on retirements and investments in new generation are evaluated in three wholesale regions: New England, New York, and PJM. These regions are shown given their advanced state of wholesale market designs, but the trends are consistent with trends across the country over the last decade.59
58 Source: SNL Financial. 59 EIA, “Natural gas expected to surpass coal in mix of fuel used for U.S. power generation in 2016,” available at https://www.eia.gov/todayinenergy/detail.php?id=25392; EIA, “Coal made up more than 80 percent of retired electricity generating capacity in 2015,” available at https://www.eia.gov/todayinenergy/detail.php?id=25272. Logan, J. et. al. "A Review of Sector and Regional Trends in U.S. Electricity Markets: Focus on Natural Gas." Joint Institute for Strategic Energy Analysis (NREL, Colorado School of Mines, Colorado State University, MIT, Stanford University, University of Colorado Boulder), October 2015; "Quadrennial Energy Review: Energy Transmission, Storage, and Distribution Infrastructure." U.S. Department of Energy, April 2015.
Markets, Reliability and the Evolving U.S. Power System
Analysis Group 24
The most important take away from the analysis is that these fundamental market factors have rendered uneconomic the generation of electricity from older, less efficient power plants - in particular smaller coal-fired power plants. With the drop in natural gas prices and the drop in demand growth, there is no market in which this category of power plants could operate profitably and remain in service. Certainly, a portion of the market has been captured by significant growth in grid-connected and distributed solar and wind generation, due to rapidly declining costs, technological advancements, and supportive energy policies; however, the impact of increased renewable generation is at most a distant second to the primary market factors of low gas prices and demand growth in terms of older generation capacity.
Shale Gas Revolution
The most significant impact on generating plant profitability was the emergence of shale gas as a plentiful and low-cost fuel for electricity generation. In 2009, the scale, proximity and lower cost of shale gas began to fundamentally alter the economics of fossil fuel generation.60 Specifically, while prevailing prices for delivered coal to wholesale regions held relatively constant, the delivered price for natural gas dropped well below historical or expected prices for natural gas, and well below the delivered price of coal in many regions.
To understand what happened to natural gas prices and coal prices following the shale gas boom and economic downturn, we reviewed historic prices of delivered coal and natural gas for New England, New York and PJM.61 Figures 10 and 11 show the recent history of coal and natural gas prices leading up to the shale gas boom and economic downtown, as well as what happened to coal and natural gas prices after the mid-2008 to early-2009 time period. Leading up to 2009, gas prices were consistently $15/MWh to $25/MWh above coal prices across these four wholesale regions, such that the cost to generate electricity with coal at an older coal plant (in dollars per megawatt hour generated
60 Natural gas production in the United States grew only 7 percent from 2000 to 2009, but has grown nearly 31 percent from 2009 to 2016. EIA, U.S. Natural Gas Marketed Production, available at https://www.eia.gov/dnav/ng/hist/n9050us2a.htm. 61 Natural gas and coal price series for each region were chosen by looking at gas and coal prices referenced in regional State of the Market reports. For New York, Transco Zone 6 gas prices are used; see 2015 State of the Market Report for the New York ISO Markets." Market Monitoring Unit for the New York ISO. May 2016. Page A-10, Figure A-6; For PJM, "Eastern natural gas consists of the average of Texas M3 (TETCO M3), Transco Zone 6 non-NY, Transco Zone 6 NY and Transco Zone 5 daily fuel price indices. Western natural gas prices are the average of Dominion North Point, Columbia Appalachia and Chicago Citygate daily fuel price indices. Coal prices are the average of daily fuel prices for Central Appalachian coal, Northern Appalachian coal, and Powder River Basin coal. All fuel prices are from Platts." Note, Colombia Appalachia gas prices were not available through SNL, so they are not included in the PJM gas prices. See "State of the Market Report for PJM: Volume 2: Detailed Analysis." Monitoring Analytics, LLC - Independent Market Monitor for PJM. March 9, 2017. Page 158, FN 71. For New England, the Algonquin Citygate price is referenced. See "2015 Assessment of the ISO New England Electricity Markets." Potomac Economics - External Market Monitor for ISO-NE. June 2016. Page 14, FN 18.

Markets, Reliability and the Evolving U.S. Power System
Analysis Group 25
($/MWh)) in general remained significantly lower than the cost to generate electricity with natural gas at a new, efficient natural gas plant.62
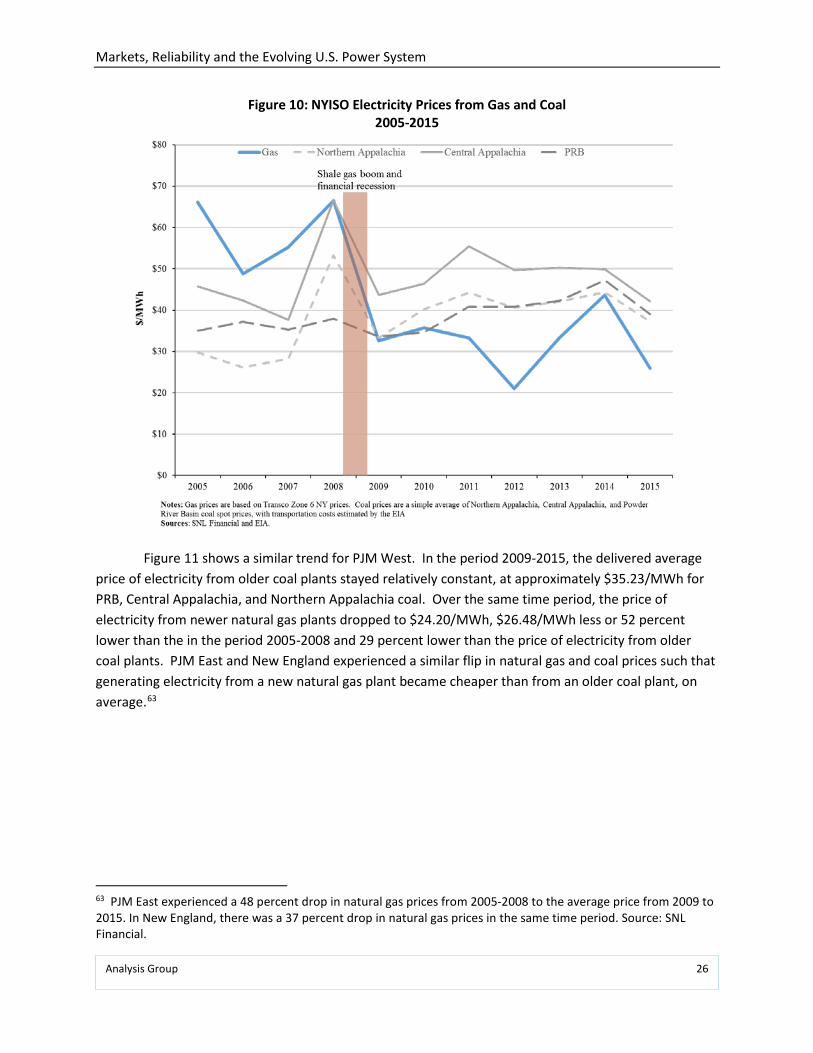
However, the impact of dropping natural gas prices on the relative cost to generate electricity at coal and gas-fired plants represented a transformative shift in the economics of older units. Figures 10 and 11 show this effect starting in 2009. In Figure 10 for New York, in the period 2009-2015, the average price to generate electricity from coal stayed relatively constant, at approximately $42.76/MWh for Powder River Basin (PRB), Central Appalachia, and Northern Appalachia coal. Over the same time period, the price to generate electricity from natural gas dropped to $32.25/MWh, $29.92/MWh less or 45 percent lower than the price in the period 2005-2008 and 19 percent less than the average price of coal-based electricity in the period.
62 Prices are expressed in $/MWh and are converted from $/mmbtu to reflect the implied price to generate electricity from the fuel given an assumed plant efficiency (for the purpose of this illustration, other variable O&M costs are ignored). Gas prices are converted from $/mmbtu to $/MWh assuming a heat rate of 6,600 btu/kWh, which is representative of the full-load heat rate of the most recently developed natural gas combined cycle power plants. See "Siemens Combined Cycle Power Plants," Siemens, 2008; and Haga, Niklas, "Combined engine power plants," Wartsila, 2011. Coal prices are based on SNL Financial's Physical Market Survey Prompt Quarter prices, expressed in $/ton. These prices are converted to $/mmbtu using the heat content specific to each individual spot price and are then averaged by region (i.e., Northern Appalachia, Central Appalachia, Powder River Basin). Delivered coal prices are the sum of these regional prices plus EIA coal transportation costs by rail. Delivered coal prices in $/mmbtu are converted to $/MWh assuming a 12,528 btu/kWh heat rate, which is the average heat rate for the 10 most recently retired coal plants in the PJM, NYISO, and ISO-NE regions with available heat rate data. The cost per unit of heat content ($/MMBtu) translates directly to the cost to generate a unit of electricity when combined with the heat rate of a power plant (heat rate is the amount of heat content required to generate a unit of electrical output for a given power plant, measured in MMBtu/MWh).
Markets, Reliability and the Evolving U.S. Power System
Analysis Group 26
Figure 10: NYISO Electricity Prices from Gas and Coal 2005-2015
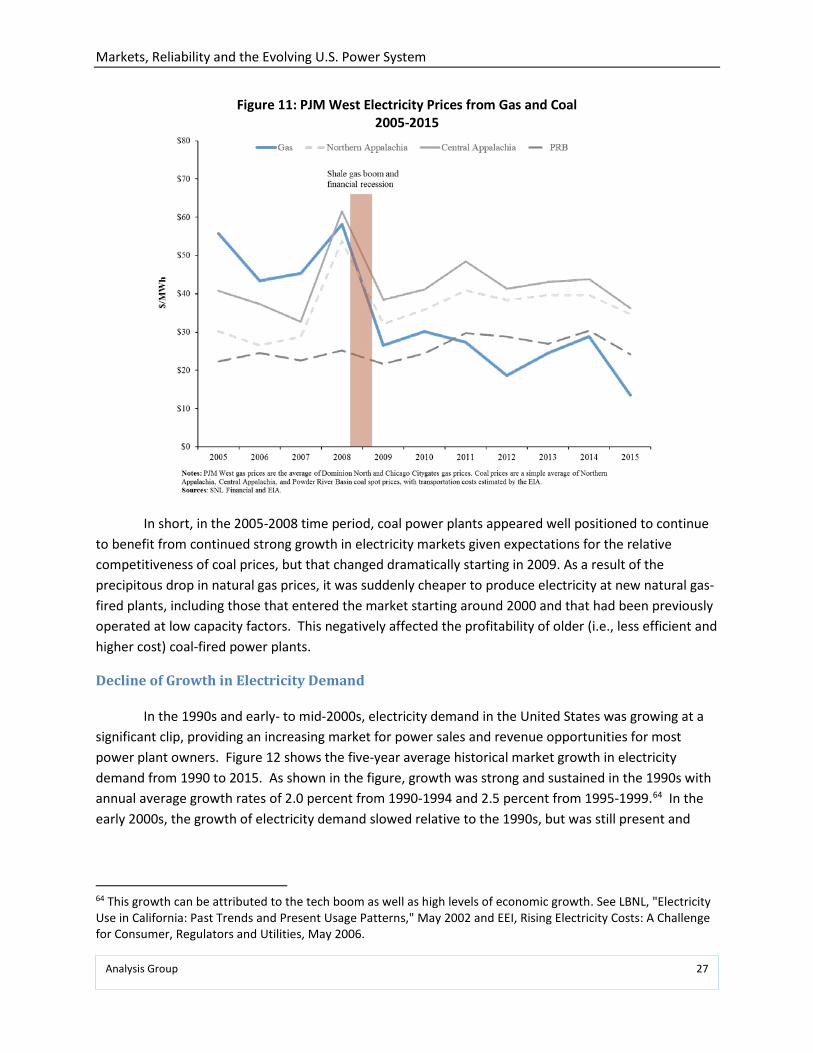
Figure 11 shows a similar trend for PJM West. In the period 2009-2015, the delivered average price of electricity from older coal plants stayed relatively constant, at approximately $35.23/MWh for PRB, Central Appalachia, and Northern Appalachia coal. Over the same time period, the price of electricity from newer natural gas plants dropped to $24.20/MWh, $26.48/MWh less or 52 percent lower than the in the period 2005-2008 and 29 percent lower than the price of electricity from older coal plants. PJM East and New England experienced a similar flip in natural gas and coal prices such that generating electricity from a new natural gas plant became cheaper than from an older coal plant, on average.63
63 PJM East experienced a 48 percent drop in natural gas prices from 2005-2008 to the average price from 2009 to 2015. In New England, there was a 37 percent drop in natural gas prices in the same time period. Source: SNL Financial.
Markets, Reliability and the Evolving U.S. Power System
Analysis Group 27
Figure 11: PJM West Electricity Prices from Gas and Coal 2005-2015
In short, in the 2005-2008 time period, coal power plants appeared well positioned to continue to benefit from continued strong growth in electricity markets given expectations for the relative competitiveness of coal prices, but that changed dramatically starting in 2009. As a result of the precipitous drop in natural gas prices, it was suddenly cheaper to produce electricity at new natural gas-fired plants, including those that entered the market starting around 2000 and that had been previously operated at low capacity factors. This negatively affected the profitability of older (i.e., less efficient and higher cost) coal-fired power plants.
Decline of Growth in Electricity Demand
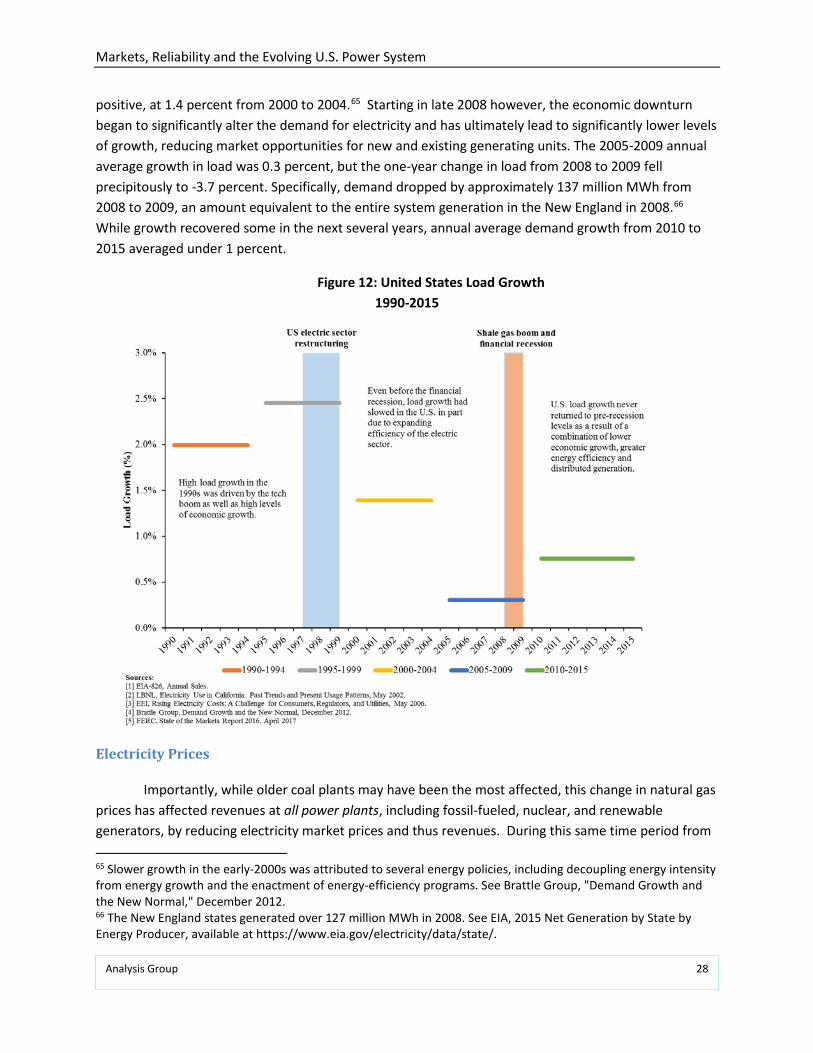
In the 1990s and early- to mid-2000s, electricity demand in the United States was growing at a significant clip, providing an increasing market for power sales and revenue opportunities for most power plant owners. Figure 12 shows the five-year average historical market growth in electricity demand from 1990 to 2015. As shown in the figure, growth was strong and sustained in the 1990s with annual average growth rates of 2.0 percent from 1990-1994 and 2.5 percent from 1995-1999.64 In the early 2000s, the growth of electricity demand slowed relative to the 1990s, but was still present and
64 This growth can be attributed to the tech boom as well as high levels of economic growth. See LBNL, "Electricity Use in California: Past Trends and Present Usage Patterns," May 2002 and EEI, Rising Electricity Costs: A Challenge for Consumer, Regulators and Utilities, May 2006.
Markets, Reliability and the Evolving U.S. Power System
Analysis Group 28
positive, at 1.4 percent from 2000 to 2004.65 Starting in late 2008 however, the economic downturn began to significantly alter the demand for electricity and has ultimately lead to significantly lower levels of growth, reducing market opportunities for new and existing generating units. The 2005-2009 annual average growth in load was 0.3 percent, but the one-year change in load from 2008 to 2009 fell precipitously to -3.7 percent. Specifically, demand dropped by approximately 137 million MWh from 2008 to 2009, an amount equivalent to the entire system generation in the New England in 2008.66 While growth recovered some in the next several years, annual average demand growth from 2010 to 2015 averaged under 1 percent.
Figure 12: United States Load Growth 1990-2015
Electricity Prices
Importantly, while older coal plants may have been the most affected, this change in natural gas prices has affected revenues at all power plants, including fossil-fueled, nuclear, and renewable generators, by reducing electricity market prices and thus revenues. During this same time period from 65 Slower growth in the early-2000s was attributed to several energy policies, including decoupling energy intensity from energy growth and the enactment of energy-efficiency programs. See Brattle Group, "Demand Growth and the New Normal," December 2012. 66 The New England states generated over 127 million MWh in 2008. See EIA, 2015 Net Generation by State by Energy Producer, available at https://www.eia.gov/electricity/data/state/.
Markets, Reliability and the Evolving U.S. Power System
Analysis Group 29
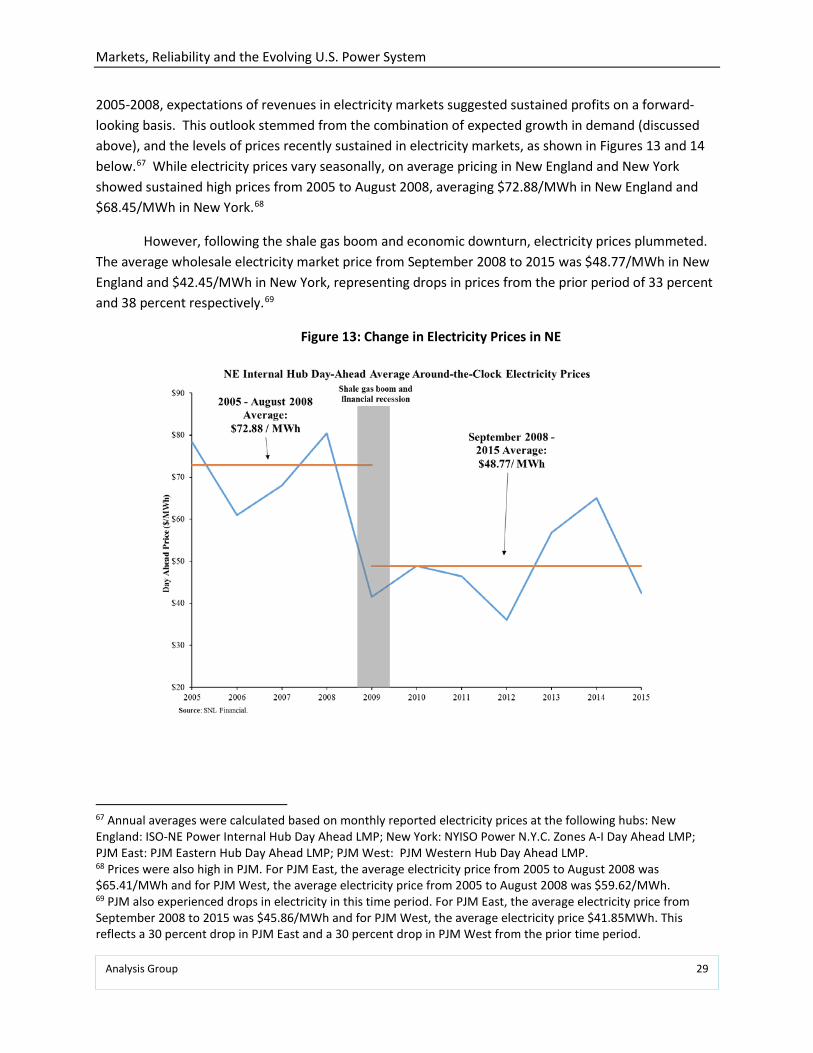
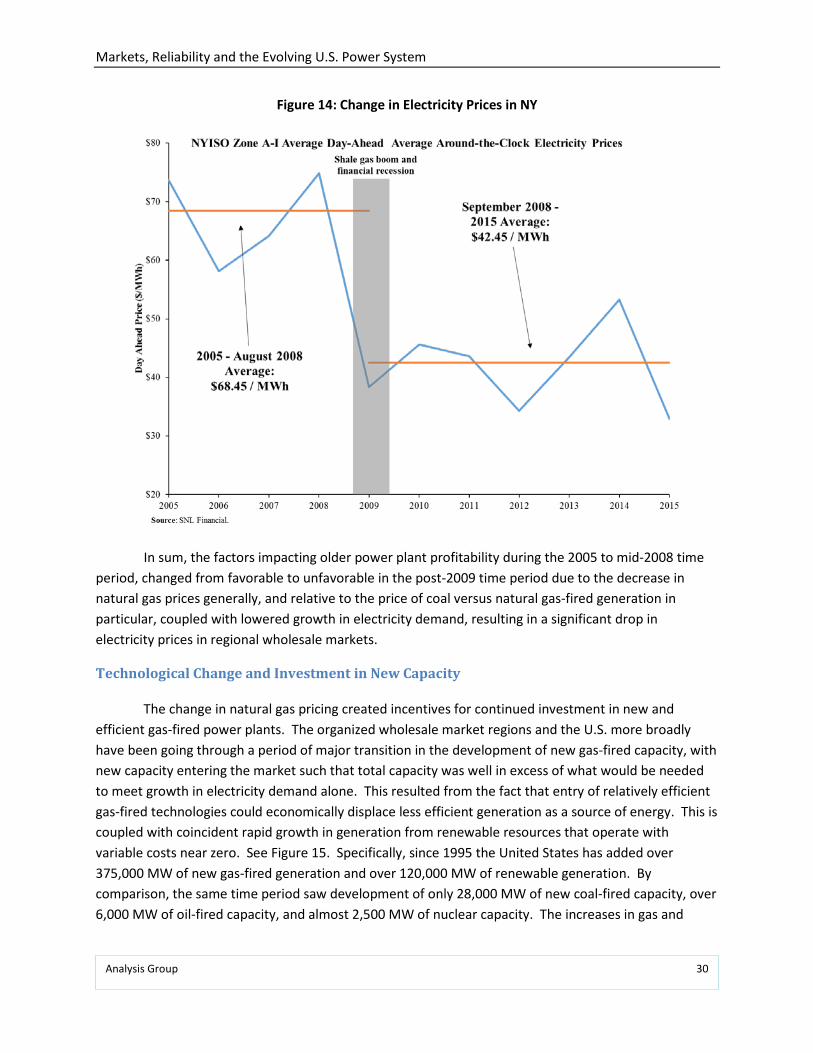
2005-2008, expectations of revenues in electricity markets suggested sustained profits on a forward-looking basis. This outlook stemmed from the combination of expected growth in demand (discussed above), and the levels of prices recently sustained in electricity markets, as shown in Figures 13 and 14 below.67 While electricity prices vary seasonally, on average pricing in New England and New York showed sustained high prices from 2005 to August 2008, averaging $72.88/MWh in New England and $68.45/MWh in New York.68
However, following the shale gas boom and economic downturn, electricity prices plummeted. The average wholesale electricity market price from September 2008 to 2015 was $48.77/MWh in New England and $42.45/MWh in New York, representing drops in prices from the prior period of 33 percent and 38 percent respectively.69
Figure 13: Change in Electricity Prices in NE
67 Annual averages were calculated based on monthly reported electricity prices at the following hubs: New England: ISO-NE Power Internal Hub Day Ahead LMP; New York: NYISO Power N.Y.C. Zones A-I Day Ahead LMP; PJM East: PJM Eastern Hub Day Ahead LMP; PJM West: PJM Western Hub Day Ahead LMP. 68 Prices were also high in PJM. For PJM East, the average electricity price from 2005 to August 2008 was $65.41/MWh and for PJM West, the average electricity price from 2005 to August 2008 was $59.62/MWh. 69 PJM also experienced drops in electricity in this time period. For PJM East, the average electricity price from September 2008 to 2015 was $45.86/MWh and for PJM West, the average electricity price $41.85MWh. This reflects a 30 percent drop in PJM East and a 30 percent drop in PJM West from the prior time period.
Markets, Reliability and the Evolving U.S. Power System
Analysis Group 30
Figure 14: Change in Electricity Prices in NY
In sum, the factors impacting older power plant profitability during the 2005 to mid-2008 time period, changed from favorable to unfavorable in the post-2009 time period due to the decrease in natural gas prices generally, and relative to the price of coal versus natural gas-fired generation in particular, coupled with lowered growth in electricity demand, resulting in a significant drop in electricity prices in regional wholesale markets.
Technological Change and Investment in New Capacity
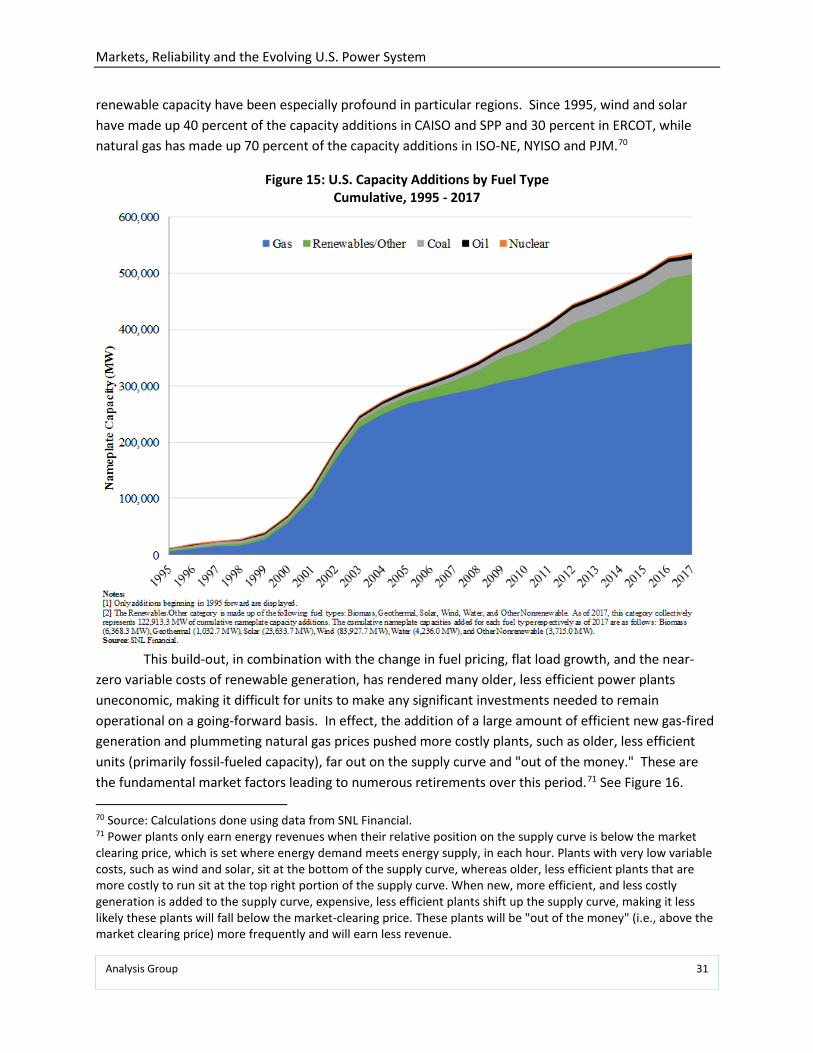
The change in natural gas pricing created incentives for continued investment in new and efficient gas-fired power plants. The organized wholesale market regions and the U.S. more broadly have been going through a period of major transition in the development of new gas-fired capacity, with new capacity entering the market such that total capacity was well in excess of what would be needed to meet growth in electricity demand alone. This resulted from the fact that entry of relatively efficient gas-fired technologies could economically displace less efficient generation as a source of energy. This is coupled with coincident rapid growth in generation from renewable resources that operate with variable costs near zero. See Figure 15. Specifically, since 1995 the United States has added over 375,000 MW of new gas-fired generation and over 120,000 MW of renewable generation. By comparison, the same time period saw development of only 28,000 MW of new coal-fired capacity, over 6,000 MW of oil-fired capacity, and almost 2,500 MW of nuclear capacity. The increases in gas and
Markets, Reliability and the Evolving U.S. Power System
Analysis Group 31
renewable capacity have been especially profound in particular regions. Since 1995, wind and solar have made up 40 percent of the capacity additions in CAISO and SPP and 30 percent in ERCOT, while natural gas has made up 70 percent of the capacity additions in ISO-NE, NYISO and PJM.70
Figure 15: U.S. Capacity Additions by Fuel Type Cumulative, 1995 - 2017
This build-out, in combination with the change in fuel pricing, flat load growth, and the near-
zero variable costs of renewable generation, has rendered many older, less efficient power plants uneconomic, making it difficult for units to make any significant investments needed to remain operational on a going-forward basis. In effect, the addition of a large amount of efficient new gas-fired generation and plummeting natural gas prices pushed more costly plants, such as older, less efficient units (primarily fossil-fueled capacity), far out on the supply curve and "out of the money." These are the fundamental market factors leading to numerous retirements over this period.71 See Figure 16. 70 Source: Calculations done using data from SNL Financial. 71 Power plants only earn energy revenues when their relative position on the supply curve is below the market clearing price, which is set where energy demand meets energy supply, in each hour. Plants with very low variable costs, such as wind and solar, sit at the bottom of the supply curve, whereas older, less efficient plants that are more costly to run sit at the top right portion of the supply curve. When new, more efficient, and less costly generation is added to the supply curve, expensive, less efficient plants shift up the supply curve, making it less likely these plants will fall below the market-clearing price. These plants will be "out of the money" (i.e., above the market clearing price) more frequently and will earn less revenue.
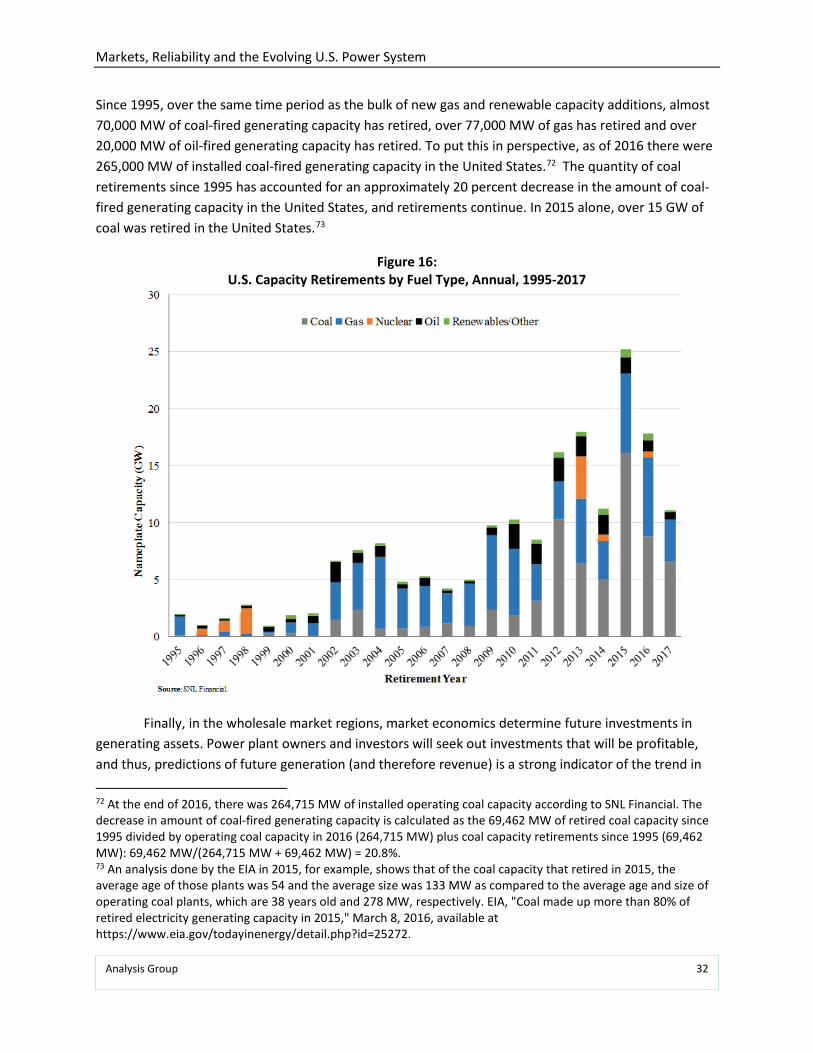
Markets, Reliability and the Evolving U.S. Power System
Analysis Group 32
Since 1995, over the same time period as the bulk of new gas and renewable capacity additions, almost 70,000 MW of coal-fired generating capacity has retired, over 77,000 MW of gas has retired and over 20,000 MW of oil-fired generating capacity has retired. To put this in perspective, as of 2016 there were 265,000 MW of installed coal-fired generating capacity in the United States.72 The quantity of coal retirements since 1995 has accounted for an approximately 20 percent decrease in the amount of coal-fired generating capacity in the United States, and retirements continue. In 2015 alone, over 15 GW of coal was retired in the United States.73
Figure 16: U.S. Capacity Retirements by Fuel Type, Annual, 1995-2017
Finally, in the wholesale market regions, market economics determine future investments in generating assets. Power plant owners and investors will seek out investments that will be profitable, and thus, predictions of future generation (and therefore revenue) is a strong indicator of the trend in 72 At the end of 2016, there was 264,715 MW of installed operating coal capacity according to SNL Financial. The decrease in amount of coal-fired generating capacity is calculated as the 69,462 MW of retired coal capacity since 1995 divided by operating coal capacity in 2016 (264,715 MW) plus coal capacity retirements since 1995 (69,462 MW): 69,462 MW/(264,715 MW + 69,462 MW) = 20.8%. 73 An analysis done by the EIA in 2015, for example, shows that of the coal capacity that retired in 2015, the average age of those plants was 54 and the average size was 133 MW as compared to the average age and size of operating coal plants, which are 38 years old and 278 MW, respectively. EIA, "Coal made up more than 80% of retired electricity generating capacity in 2015," March 8, 2016, available at https://www.eia.gov/todayinenergy/detail.php?id=25272.
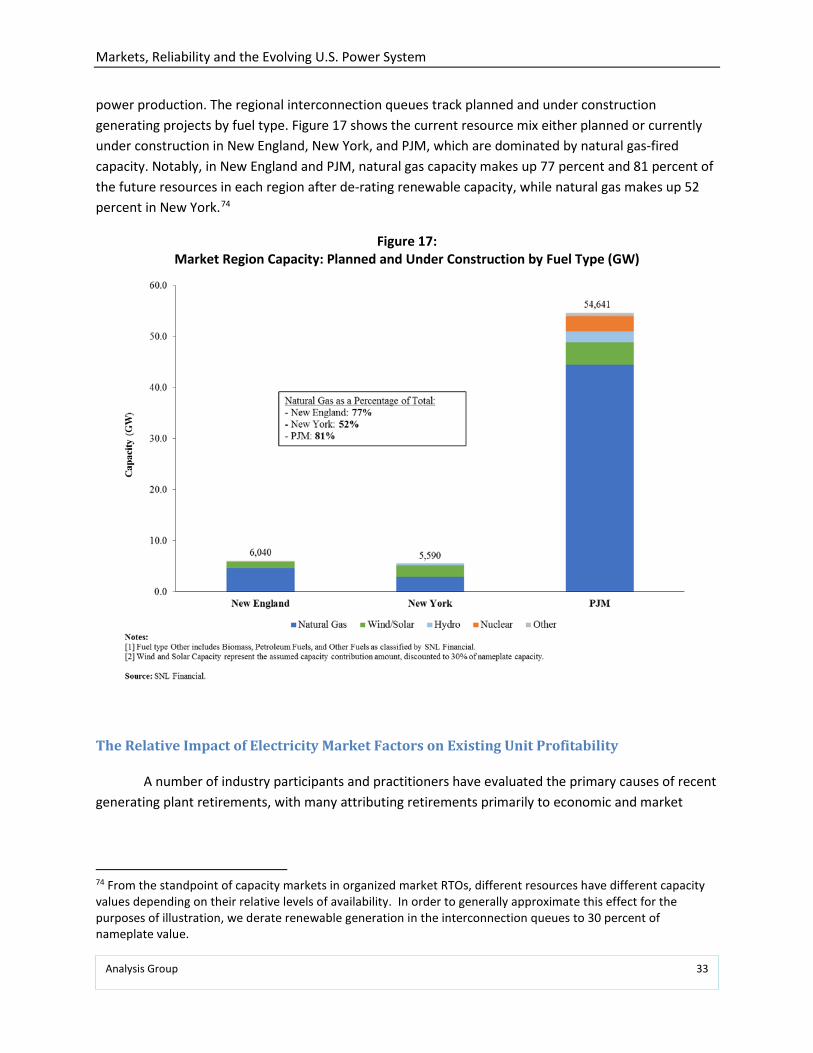
Markets, Reliability and the Evolving U.S. Power System
Analysis Group 33
power production. The regional interconnection queues track planned and under construction generating projects by fuel type. Figure 17 shows the current resource mix either planned or currently under construction in New England, New York, and PJM, which are dominated by natural gas-fired capacity. Notably, in New England and PJM, natural gas capacity makes up 77 percent and 81 percent of the future resources in each region after de-rating renewable capacity, while natural gas makes up 52 percent in New York.74
Figure 17: Market Region Capacity: Planned and Under Construction by Fuel Type (GW)
The Relative Impact of Electricity Market Factors on Existing Unit Profitability
A number of industry participants and practitioners have evaluated the primary causes of recent generating plant retirements, with many attributing retirements primarily to economic and market
74 From the standpoint of capacity markets in organized market RTOs, different resources have different capacity values depending on their relative levels of availability. In order to generally approximate this effect for the purposes of illustration, we derate renewable generation in the interconnection queues to 30 percent of nameplate value.
Markets, Reliability and the Evolving U.S. Power System
Analysis Group 34
forces driven by the recession and the new abundance of cheap natural gas.75 Recent environmental regulations have also played a role in retirements, as has the growth in renewable generation, but these factors have been viewed as a distant second to the primary economic and fuel price drivers.76 A recent study of the economics of coal and oil plant retirements in the Northeast cited rising costs of older coal and oil plants, cheap wholesale prices due to low natural gas prices, and long ramp times as the primary drivers of retirement.77 Additionally, CEOs and senior executives from a number of prominent utilities and energy organizations around the country have publically pointed to economic factors as driving coal retirements around the country and not recent environmental regulations.78 Numerous other sources have identified market-driven economics as the reason for the increase in coal retirements.79
75 See the recent press release of the retirement of Brayton Power Station coal plant in New England, which stated that, "Trump’s election didn’t affect Brayton Point’s outlook because the 2013 decision to shut it was irreversible. He also said that low electricity prices and the high cost to maintain aging facilities were the main reasons for the closure." O’Brien, Matt and Jennifer McDermott, “New England’s last big coal-burning power plant switches off,” Boston.com, May 31, 2017, available at https://www.boston.com/news/local-news/2017/05/31/new-englands-last-big-coal-burning-power-plant-switches-off; “The decision by the utility owners of [Navajo Generating Station] is based on the rapidly changing economics of the energy industry, which has seen natural gas prices sink to record lows and become a viable long-term and economical alternative to coal power.” Scott Harelson, Salt River Project, on the decision to close the 2,250 MW coal Navajo Generating Station in Arizona in 2019; See also the press release for the retirement of two PSEG coal plants in New Jersey: “The sustained low prices of natural gas have put economic pressure on these plants for some time. In that context, we could not justify the significant investment required to upgrade these plants to meet the new reliability standards,” said Bill Levis, president and chief operating officer PSEG Power. “The plants have been infrequently called on to run and neither plant cleared the last two PJM capacity auctions. The plants’ capacity payments have been critical to their profitability and PSEG’s ability to continue to invest in modernizing them,” PSEG, “PSEG to Retire Two New Jersey Coal Plants on 2017,” available at https://www.pseg.com/info/media/newsreleases/2016/20161005.jsp#.WTHRAWjytaQ. 76 “Awful energy margins suggest to us that owners should be reevaluating their coal fleets due to pure energy economics before even taking on the burden of a capex for environmental control equipment.” Growth from Subtraction – Impact of EPA Rules on Power Markets,” Credit Suisse Investor Presentation, September 23, 2010, p. 8; “Market fundamentals—namely declines in demand and costs for natural-gas generation—are the principle causes of coal and nuclear retirements. In particular, highly efficient natural-gas plants utilizing historically inexpensive gas are the driving force of baseload retirements. Since these new gas generators have complete baseload functionality, new baseload-capable plants have primarily replaced baseload-capable retirements." See Hartman, Devin, “Embracing Baseload Power Requirements,” May 2017, R Street, available at http://www.rstreet.org/wp-content/uploads/2017/05/97.pdf. See also EIA, "Natural gas expected to surpass coal in mix of fuel used for U.S. power generation in 2016," March 16, 2016, available at https://www.eia.gov/todayinenergy/detail.php?id=25392. 77 ISO-NE, "Retirements of Non-Gas-Fired Power Plants," ISO New England Regional Electricity Outlook. 78 “To suggest that plants are retiring because of the EPA’s regulations fails to recognize that lower power prices and depressed demand are the primary drivers. The units retiring are generally small, old and inefficient. These retirements are long overdue.” Statement by: Peter Darbee, chairman, president and CEO PG&E Corp; Jack Fusco, president and CEO, Capline Corp; Lewis Hay, chairman and CEO, NextEra Energy, Inc.; John Rowe, chairman and CEO, Exelon Corp; Mayo Shattuck, chairman, president and CEO, Constellation Energy Group; Larry Weis, general manager, Austin Energy, See “We’re OK with the EPA’s New Air-Quality Regulations,” WSJ, December 8, 2010. 79 The Associated Press, “White House Advisor Differs With Coal-Loving President,” The New York Times, May 26, 2017, available at https://www.nytimes.com/aponline/2017/05/26/us/politics/ap-us-trump-adviser-coal.html?mcubz=2&_r=1; McMahon. Jeff, “4 Reasons Coal Declines Even As Natural Gas Prices Rise: EIA,” Forbes, April 23, 2013; Saha, D. and Liu, S. "Coal plant retirements will continue despite Trump's EPA pick," Brookings
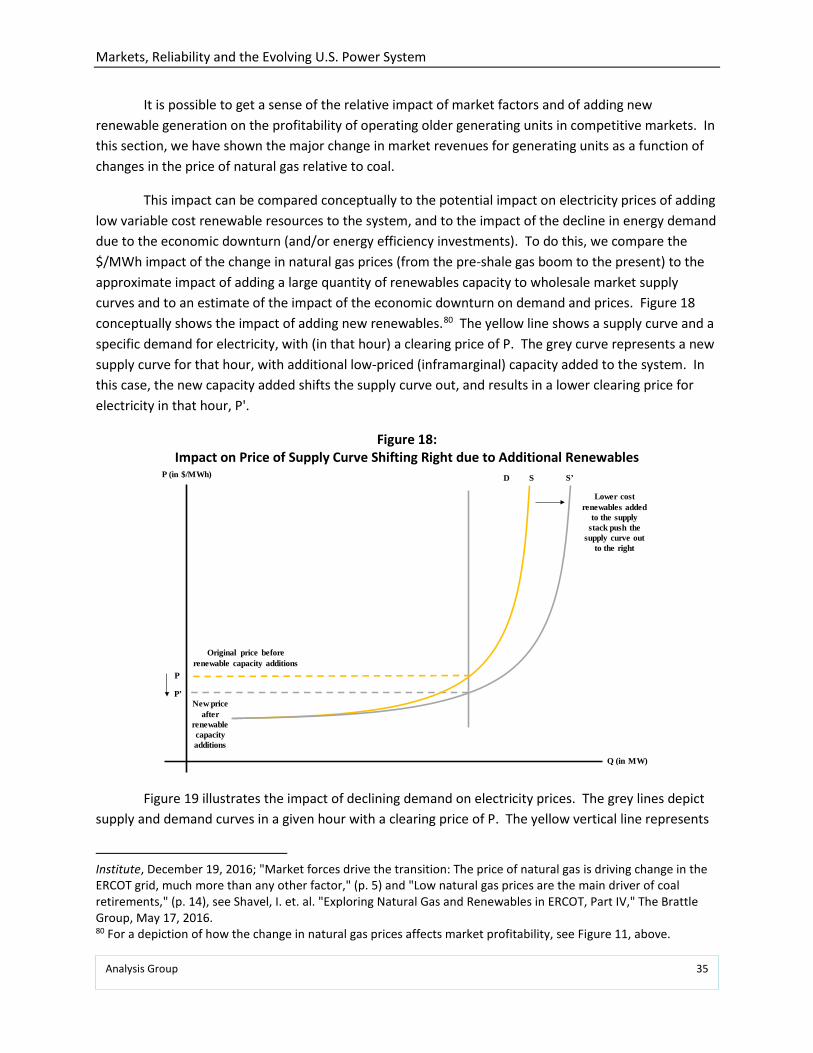
Markets, Reliability and the Evolving U.S. Power System
Analysis Group 35
It is possible to get a sense of the relative impact of market factors and of adding new renewable generation on the profitability of operating older generating units in competitive markets. In this section, we have shown the major change in market revenues for generating units as a function of changes in the price of natural gas relative to coal.
This impact can be compared conceptually to the potential impact on electricity prices of adding low variable cost renewable resources to the system, and to the impact of the decline in energy demand due to the economic downturn (and/or energy efficiency investments). To do this, we compare the $/MWh impact of the change in natural gas prices (from the pre-shale gas boom to the present) to the approximate impact of adding a large quantity of renewables capacity to wholesale market supply curves and to an estimate of the impact of the economic downturn on demand and prices. Figure 18 conceptually shows the impact of adding new renewables.80 The yellow line shows a supply curve and a specific demand for electricity, with (in that hour) a clearing price of P. The grey curve represents a new supply curve for that hour, with additional low-priced (inframarginal) capacity added to the system. In this case, the new capacity added shifts the supply curve out, and results in a lower clearing price for electricity in that hour, P'.
Figure 18: Impact on Price of Supply Curve Shifting Right due to Additional Renewables
Figure 19 illustrates the impact of declining demand on electricity prices. The grey lines depict supply and demand curves in a given hour with a clearing price of P. The yellow vertical line represents
Institute, December 19, 2016; "Market forces drive the transition: The price of natural gas is driving change in the ERCOT grid, much more than any other factor," (p. 5) and "Low natural gas prices are the main driver of coal retirements," (p. 14), see Shavel, I. et. al. "Exploring Natural Gas and Renewables in ERCOT, Part IV," The Brattle Group, May 17, 2016. 80 For a depiction of how the change in natural gas prices affects market profitability, see Figure 11, above.
New price after
renewable capacity additions
Original price before renewable capacity additions
P (in $/MWh)
Q (in MW)
S’SD
P
P’
Lower cost renewables added
to the supply stack push the
supply curve out to the right
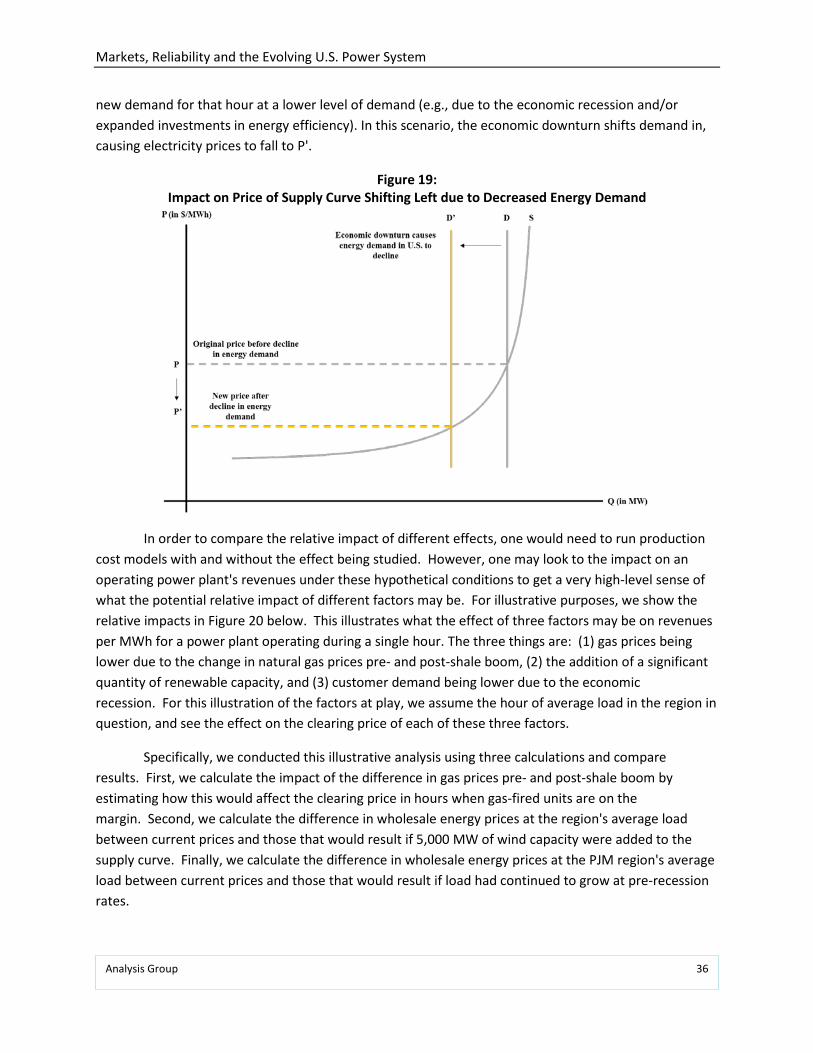
Markets, Reliability and the Evolving U.S. Power System
Analysis Group 36
new demand for that hour at a lower level of demand (e.g., due to the economic recession and/or expanded investments in energy efficiency). In this scenario, the economic downturn shifts demand in, causing electricity prices to fall to P'.
Figure 19: Impact on Price of Supply Curve Shifting Left due to Decreased Energy Demand
In order to compare the relative impact of different effects, one would need to run production cost models with and without the effect being studied. However, one may look to the impact on an operating power plant's revenues under these hypothetical conditions to get a very high-level sense of what the potential relative impact of different factors may be. For illustrative purposes, we show the relative impacts in Figure 20 below. This illustrates what the effect of three factors may be on revenues per MWh for a power plant operating during a single hour. The three things are: (1) gas prices being lower due to the change in natural gas prices pre- and post-shale boom, (2) the addition of a significant quantity of renewable capacity, and (3) customer demand being lower due to the economic recession. For this illustration of the factors at play, we assume the hour of average load in the region in question, and see the effect on the clearing price of each of these three factors.
Specifically, we conducted this illustrative analysis using three calculations and compare results. First, we calculate the impact of the difference in gas prices pre- and post-shale boom by estimating how this would affect the clearing price in hours when gas-fired units are on the margin. Second, we calculate the difference in wholesale energy prices at the region's average load between current prices and those that would result if 5,000 MW of wind capacity were added to the supply curve. Finally, we calculate the difference in wholesale energy prices at the PJM region's average load between current prices and those that would result if load had continued to grow at pre-recession rates.
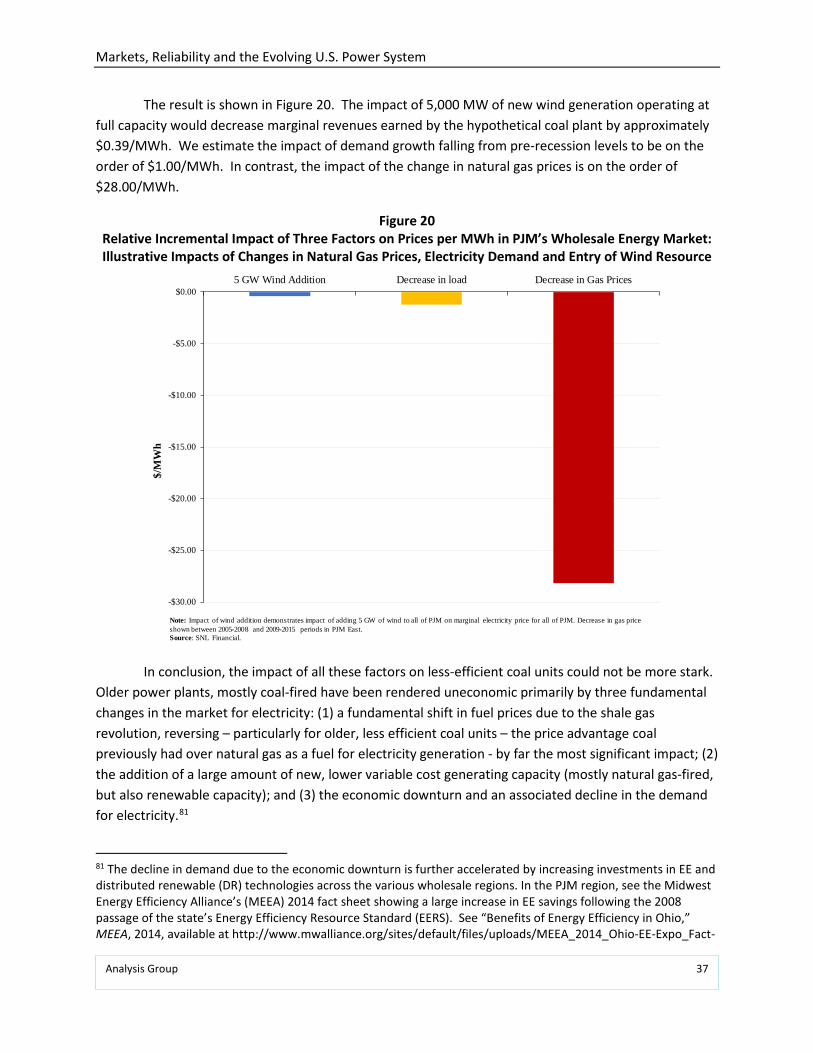
Markets, Reliability and the Evolving U.S. Power System
Analysis Group 37
The result is shown in Figure 20. The impact of 5,000 MW of new wind generation operating at full capacity would decrease marginal revenues earned by the hypothetical coal plant by approximately $0.39/MWh. We estimate the impact of demand growth falling from pre-recession levels to be on the order of $1.00/MWh. In contrast, the impact of the change in natural gas prices is on the order of $28.00/MWh.
Figure 20 Relative Incremental Impact of Three Factors on Prices per MWh in PJM’s Wholesale Energy Market: Illustrative Impacts of Changes in Natural Gas Prices, Electricity Demand and Entry of Wind Resource
In conclusion, the impact of all these factors on less-efficient coal units could not be more stark. Older power plants, mostly coal-fired have been rendered uneconomic primarily by three fundamental changes in the market for electricity: (1) a fundamental shift in fuel prices due to the shale gas revolution, reversing – particularly for older, less efficient coal units – the price advantage coal previously had over natural gas as a fuel for electricity generation - by far the most significant impact; (2) the addition of a large amount of new, lower variable cost generating capacity (mostly natural gas-fired, but also renewable capacity); and (3) the economic downturn and an associated decline in the demand for electricity.81
81 The decline in demand due to the economic downturn is further accelerated by increasing investments in EE and distributed renewable (DR) technologies across the various wholesale regions. In the PJM region, see the Midwest Energy Efficiency Alliance’s (MEEA) 2014 fact sheet showing a large increase in EE savings following the 2008 passage of the state’s Energy Efficiency Resource Standard (EERS). See “Benefits of Energy Efficiency in Ohio,” MEEA, 2014, available at http://www.mwalliance.org/sites/default/files/uploads/MEEA_2014_Ohio-EE-Expo_Fact-
-$30.00
-$25.00
-$20.00
-$15.00
-$10.00
-$5.00
$0.005 GW Wind Addition Decrease in load Decrease in Gas Prices
$/M
Wh
Note: Impact of wind addition demonstrates impact of adding 5 GW of wind to all of PJM on marginal electricity price for all of PJM. Decrease in gas price shown between 2005-2008 and 2009-2015 periods in PJM East. Source: SNL Financial.
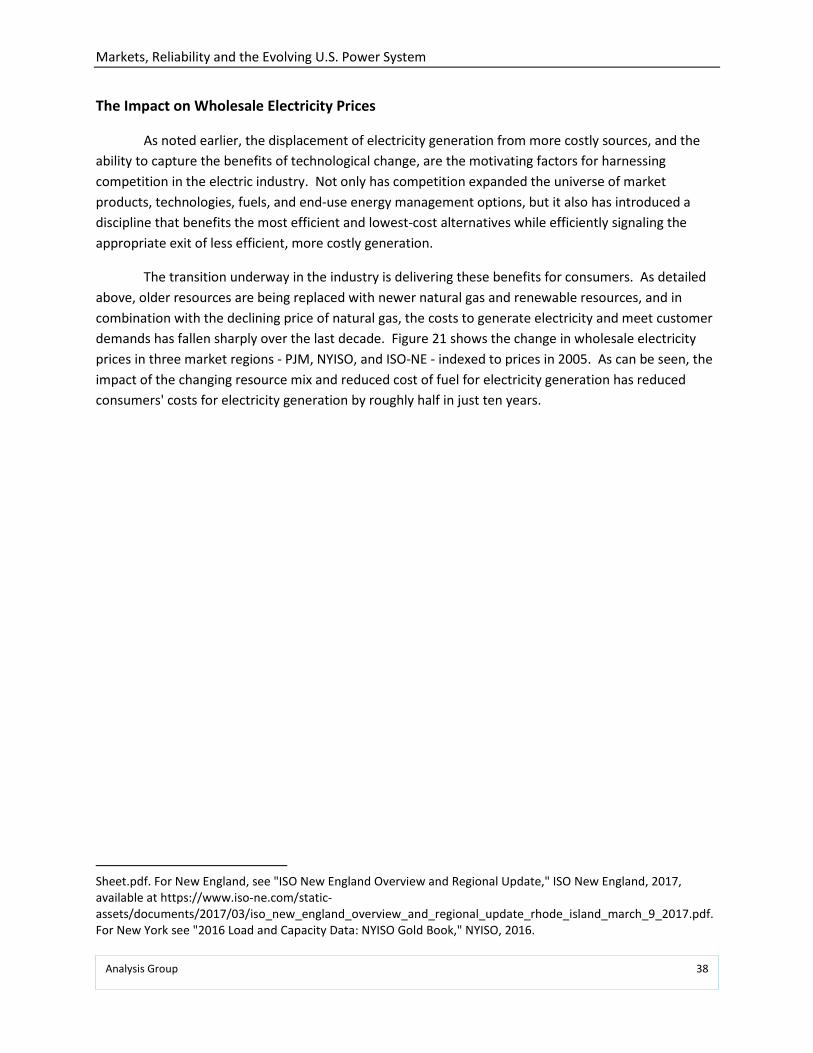
Markets, Reliability and the Evolving U.S. Power System
Analysis Group 38
The Impact on Wholesale Electricity Prices
As noted earlier, the displacement of electricity generation from more costly sources, and the ability to capture the benefits of technological change, are the motivating factors for harnessing competition in the electric industry. Not only has competition expanded the universe of market products, technologies, fuels, and end-use energy management options, but it also has introduced a discipline that benefits the most efficient and lowest-cost alternatives while efficiently signaling the appropriate exit of less efficient, more costly generation.
The transition underway in the industry is delivering these benefits for consumers. As detailed above, older resources are being replaced with newer natural gas and renewable resources, and in combination with the declining price of natural gas, the costs to generate electricity and meet customer demands has fallen sharply over the last decade. Figure 21 shows the change in wholesale electricity prices in three market regions - PJM, NYISO, and ISO-NE - indexed to prices in 2005. As can be seen, the impact of the changing resource mix and reduced cost of fuel for electricity generation has reduced consumers' costs for electricity generation by roughly half in just ten years.
Sheet.pdf. For New England, see "ISO New England Overview and Regional Update," ISO New England, 2017, available at https://www.iso-ne.com/static-assets/documents/2017/03/iso_new_england_overview_and_regional_update_rhode_island_march_9_2017.pdf. For New York see "2016 Load and Capacity Data: NYISO Gold Book," NYISO, 2016.
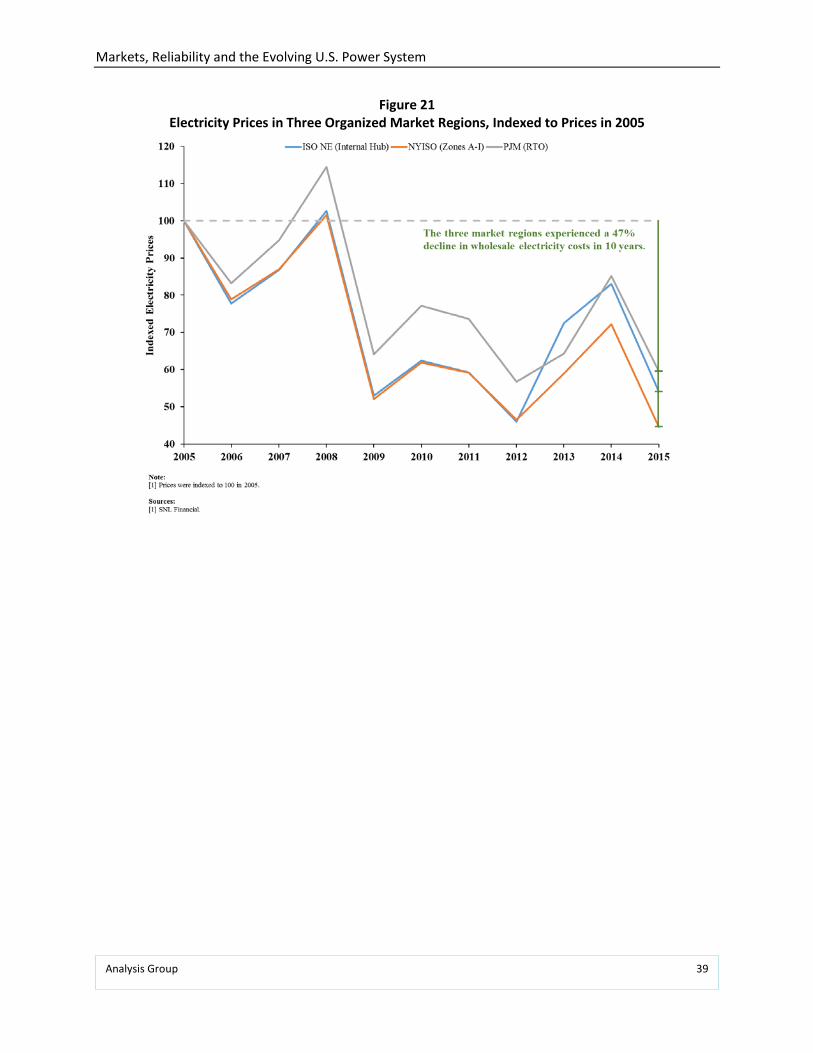
Markets, Reliability and the Evolving U.S. Power System
Analysis Group 39
Figure 21 Electricity Prices in Three Organized Market Regions, Indexed to Prices in 2005
Markets, Reliability and the Evolving U.S. Power System
Analysis Group 40
V. Power System Reliability
Overview
The maintenance of power system reliability is a fundamental necessity for the protection of public safety, health and welfare, as well as to support the nation's economy. Consequently, the critical importance of maintaining reliability is reflected and supported through a comprehensive network of federal and state laws and regulations, and an extensive set of obligations, rules, and procedures designed to ensure reliability through continuous planning, best-practice system operations, and constant review and collaboration. The reliability mandate is achieved with the full compliance and cooperation of national and regional authorities, state agencies, regional transmission operators/independent system operators (RTOs/ISOs), regional reliability organizations, utilities, cooperatives, municipalities and federal power authorities, and merchant transmission and power plant owners and operators. Finally, reliability obligations are federally enforceable, and are monitored and executed through, in part, a system of stringent compliance reporting obligations, verification activities, and penalties.
It is not surprising that as the power industry changes due to economic and/or regulatory factors, many in the industry almost reflexively turn their attention to reliability. We have seen such reliability evaluations exercised regularly over decades in the face of any major industry changes.82 In every case, the prospect of change has led to reliability assessments and the waving of cautionary flags to call attention to the new challenges ahead. In all cases these challenges have been met and power system reliability has been maintained.
The Federal Power Act (FPA) sets the legal framework for establishing and maintaining power system reliability. Specifically, the FPA defines reliability and the associated obligations and responsibilities of all power system users and operators, and gives the Federal Energy Regulatory Commission (FERC) the statutory authority to require, oversee and enforce power system reliability. This is accomplished in large part through FERC certification of an "electric reliability organization" (currently the North American Electric Reliability Corporation (NERC)) to (1) establish and continuously evolve reliability standards to be followed by all power system users, owners and operators, (2) continuously monitor and conduct assessments of reliability, (3) support the education, training and enforcement of industry personnel, and (4) facilitate the evolution and enforcement of reliability rules, standards, and practices across all system operators in the US and parts of Canada and Mexico.83
The focus of FERC, NERC, and system operators or "regional reliability organizations" (RRO)84 is on the reliability of the "bulk power system" (BPS) - that is, the interconnected electric transmission
82 The numerous examples are provided in detail in Appendix B. 83 Federal Power Act, Section 215, 16 U.S.C 824o; “NERC Standards and Compliance 101,” NERC, 2014 available at http://www.nerc.com/pa/Stand/WebinarLibrary/1_HugginsMineo_Standards_and_Compliance_101_MH_EC_ssw.pdf. 84 In 1968, NERC was founded by the electric industry as an organization to promote coordination between the nation’s regional reliability organizations. In 2006, with the passage of the Energy Policy Act of 2005 and the
Markets, Reliability and the Evolving U.S. Power System
Analysis Group 41
network, including all transmission lines, power plants, and control systems connected above the voltage of local distribution systems. It is useful to distinguish this from local distribution systems (the lower voltage substations, control systems and power lines typically connected directly to homes and businesses). This is because most users of electricity view reliability through the lens of power outages in their homes, that typically happen due to storms knocking out local distribution system power lines or other very local events affecting the distribution system (such as a car hitting a pole).85
While important to electricity users, local distribution system outages are not the main concern of regional entities or the focus of FERC's authority and the obligations of BPS operators, because outages due to BPS failures differ from local outages in fundamental ways: in how they can arise; in the geographic scope of power interruptions (e.g., spanning states as opposed to neighborhoods); in their ability to affect multiple utility systems rather than just one; in the process and timing of power restoration; in the magnitude of adverse consequences; and in terms of the parties responsible to fix the problems. The sheer scale of potential human health, safety, and economic impacts separates BPS reliability from local distribution system reliability, and dictates a high degree of vigilance on the part of regulators and the industry, and a network of common procedures and coordinated operations, to avoid BPS reliability failures.
Given the critical importance of BPS reliability to the population and economy, multiple entities (see discussion of "reliability entities" in Appendix A) are involved in a continuous review of current BPS conditions to ensure a very high degree of reliability in power supply and system operations, and regular evaluations of expected or emerging changes in the BPS, such as infrastructure additions and retirements, changing demand conditions, and evolving technologies. The latter point is important - the bulk power systems in the US are far from static networks; BPS reliability is and has always been maintained throughout numerous fundamental changes in the structure and infrastructure of the electric industry driven by costs, technological change, policies, or events, whether those changes were sudden, rapid, or occurred in more measured fashion
System planners and operators, reliability organizations, power companies and regulators thus pay attention not only to how to maintain system reliability on a second-by-second, day-by-day basis, they look many years ahead, to analyze changing conditions and flag issues on the horizon that need attention. As a regular matter, from one season to the next, and one year to the next, they review whether there will be enough resources to meet seasonal peak demands, and enough transmission system infrastructure to meet such demands under adverse system conditions. These forward-looking reviews consider both the adequacy of resources and the impact of the expected mix of system
approval of FERC, NERC became the designated electric reliability organization (ERO) of the United States. As the ERO, NERC has the authority to set mandatory, legally enforceable reliability standards for the U.S. BPS. NERC is divided into eight Regional Entities, which help with the enforcement of its standards. NERC standards must be met by all industry participants and the electric grid is designed to meet its standards. FERC, “Energy Primer,” November 2015, pp. 37, 47. 85 For general description of FERC, NERC, and system operators role in overseeing the operation of the BPS see FERC, “Reliability Primer,” 2016, pp. 5-7. For description of the BPS as distinct from local distribution see FERC, “Reliability Primer,” 2016, p. 38.
Markets, Reliability and the Evolving U.S. Power System
Analysis Group 42
resources, infrastructure, and operating procedures on the ability to provide all essential reliability services across all timescales and localities (see discussion of "reliability factors," below). Thus, across very different time frames, many actors in the industry work to ensure that the system performs with a near-perfect level of reliability.
In this section, we discuss power system reliability, and the contributions to reliability of various generating technologies and operator actions and procedures. For a more detailed description of reliability actors, factors, technologies, and procedures, see Appendix A.
Reliability Factors
The changes underway in the industry have altered current perceptions of what the BPS will look like in ten to twenty years. The combination of lower-cost renewables, continued improvements in both new gas-fired power plant technologies and shale gas extraction, and the retirement of older, uneconomic generating assets means that the evolution of the various BPS systems throughout the U.S. is likely to trend towards higher generation from variable renewable resources and a greater percentage of gas-fired technologies. Depending on the pace of growth in storage and other advanced energy technologies, the future mix may diversify even further than currently anticipated. This raises questions related to how industry changes will affect the suite of services needed to maintain BPS reliability. Will plants retire and, if so, which ones and when? Which new ones will be added, over what time period, and where? Will natural gas pipelines and other fuel-delivery infrastructure be sufficient to reliably fuel a power system that depends more upon natural gas? Will the electric transmission system be capable of moving power generated in new locations relative to customer demand?
NERC defines two major reliability concepts in the following way: First, resource adequacy is "[t]he ability of the electric system to supply the aggregate electrical demand and energy requirements of the end-use customers at all times, taking into account scheduled and reasonably expected unscheduled outages of system elements.” Second, system security, or “reliable operation” requires “[o]perating the elements of the [Bulk-Power System] within equipment and electric system thermal, voltage, and stability limits so that instability, uncontrolled separation, or cascading failures of such system will not occur as a result of a sudden disturbance, including a cybersecurity incident, or unanticipated failure of system elements.”86
According to NERC, an electric system, “exhibits an adequate level of reliability when it possesses these six characteristics: 1. The System is controlled to stay within acceptable limits during normal conditions; 2. The System performs acceptably after credible contingencies; 3. The System limits the impact and scope of instability and cascading outages when they occur; 4. The System’s Facilities are protected from unacceptable damage by operating them within Facility Ratings; 5. The System’s integrity can be restored promptly if it is lost; and 6. The System has the ability to supply the aggregate
86 See NERC's Glossary of Terms, available at http://www.nerc.com/files/glossary_of_terms.pdf.
Markets, Reliability and the Evolving U.S. Power System
Analysis Group 43
electric power and energy requirements of the electricity consumers at all times, taking into account scheduled and reasonably expected unscheduled outages of system components.”87
More generally, insights and answers to the various questions regarding future system reliability can be viewed in through the two basic categories of resource adequacy and system security, differentiated by time scales. One focuses on long-term planning considerations (resource adequacy) - will there be enough (adequate) resources in place when system operators need to manage the system to meet demand in the future? The other focuses on short-term operations (system security/reliable operations) - will system operators be able to run the system in real time in a secure way to keep the system in balance, with all that that entails technically?88
Resource Adequacy
Ensuring resource adequacy is generally accomplished through two steps. First, the expected system peak demand and energy requirements over a long-term period (e.g., ten years) are established through a comprehensive forecasting effort, by the regional system operator and/or utilities. This step occurs in both wholesale energy markets and through integrated resource planning conducted by electric utilities in other states.
Second, to the extent that identified long-term needs exceed resources expected to be on the system (due, for example, to growth in demand over time, and/or the retirement of existing resources), the deficit is met through the addition of new infrastructure (power plants or transmission lines) and/or demand resources (such as energy efficiency or demand-response measures). The ways in which new resources are added varies around the country, depending on the structure of the electric industry and the regulatory approach in place in a given state, along with other aspects of the market (including FERC-regulated RTOs in many regions). In wholesale market regions, identified needs are met through market structures designed to provide financial incentives for investment in new capacity. In other regions (like most of the West), vertically integrated utilities, cooperatives and municipal electric companies add needed capacity by proposing and building their own project and/or through soliciting offers from other competitive suppliers. In all of these processes, attention is paid not only to resource capacities but to the system investments needed to reliably operate the selected resource without degrading reliability.
87 "Definition of "Adequate Level of Reliability," NERC, December 2007, available at http://www.nerc.com/docs/pc/Definition-of-ALR-approved-at-Dec-07-OC-PC-mtgs.pdf. 88 In addition to the various resources cited, the discussion in this section draws from prior Analysis Group reports related to power system reliability, including Susan Tierney, “Greenhouse Gas Emission Reductions From Existing Power Plants: Options to Ensure Electric System Reliability,” May 2012; Susan Tierney, Paul Hibbard, and Craig Aubuchon, “Electric System Reliability and EPA’s Clean Power Plan,” February 2015; Susan Tierney, “The Value of ‘DER’ to ‘D’: The Role of Distributed Energy Resources in Supporting Local Electric Distribution System Reliability,” March 31, 2016.
Markets, Reliability and the Evolving U.S. Power System
Analysis Group 44
Reliable Operations/System Security
Even assuming that these resource adequacy processes end up ensuring there are enough megawatts of capacity in place when needed to meet aggregate load requirements, operational reliability also depends on making sure that the system operates in real time with high technical integrity.
System operations are affected in real time by several things:
• The mix of attributes of the resources on the system – their location, their fuel source, and the operating characteristics of the supply and demand resources;
• The continuous variations in system conditions (e.g., variations in load as consumption changes; the sudden loss of a power plant or transmission line; changes in ambient conditions or sudden power outages due, e.g., to a storm); and
• The system operator’s practices and procedures for managing the changing conditions on the system at all times and in all places under that operator’s responsibility, to assure that the system stays in balance.
System security describes the ability of the system to meet ever changing system conditions, and to do so with enough redundancy in operational capabilities to manage and recover from a variety of potential system events – or “contingencies” – such as sudden and unexpected loss of generation, transmission, or load.89 System planners and operators must ensure that the technical capabilities of the mix of resources on the power system are capable of responding in real time to normal load changes and contingency events. This is needed to avoid the catastrophic wide-area failure of the bulk power system - such as a cascading outage covering one or more regions - that can come from unacceptable variations in system voltage and frequency. Blackouts can damage electrical equipment on the grid and on customers’ premises, and create wide-ranging safety and health impacts.
To assure system security, the system as a whole must have certain attributes allowing it to provide “essential reliability services” described in various NERC documents, and summarized in Figure 22. While different system operators use different ways to describe operational reliability services, they can be represented as two functional categories:
• Voltage support, meaning the ability of system resources to maintain real power across the transmission grid, through the use of reactive power sources such as generators connected to the system, capacitors, reactors, etc. Voltage on the system must be maintained within an acceptable voltage bandwidth in normal operations and following a contingency on the system.90
89 NERC describes certain features of the bulk power system needed to meet system security requirements – e.g., voltage control, frequency control – as Essential Reliability Services (ERS) or Reliable Operations. NERC Essential Reliability Services Report. 90 Voltage support is local in nature, can change rapidly, and depends in part on the type and location of generators connected to the transmission system. Typically, voltage control is maintained by system planners and
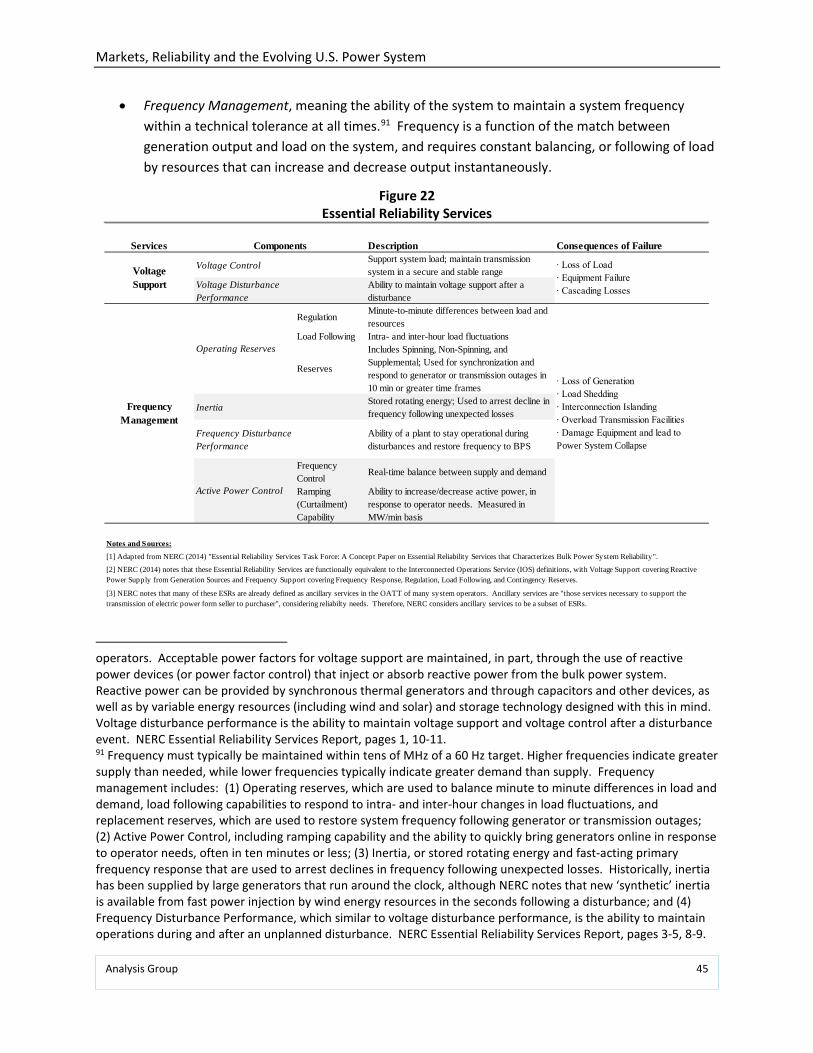
Markets, Reliability and the Evolving U.S. Power System
Analysis Group 45
• Frequency Management, meaning the ability of the system to maintain a system frequency within a technical tolerance at all times.91 Frequency is a function of the match between generation output and load on the system, and requires constant balancing, or following of load by resources that can increase and decrease output instantaneously.
Figure 22 Essential Reliability Services
operators. Acceptable power factors for voltage support are maintained, in part, through the use of reactive power devices (or power factor control) that inject or absorb reactive power from the bulk power system. Reactive power can be provided by synchronous thermal generators and through capacitors and other devices, as well as by variable energy resources (including wind and solar) and storage technology designed with this in mind. Voltage disturbance performance is the ability to maintain voltage support and voltage control after a disturbance event. NERC Essential Reliability Services Report, pages 1, 10-11. 91 Frequency must typically be maintained within tens of MHz of a 60 Hz target. Higher frequencies indicate greater supply than needed, while lower frequencies typically indicate greater demand than supply. Frequency management includes: (1) Operating reserves, which are used to balance minute to minute differences in load and demand, load following capabilities to respond to intra- and inter-hour changes in load fluctuations, and replacement reserves, which are used to restore system frequency following generator or transmission outages; (2) Active Power Control, including ramping capability and the ability to quickly bring generators online in response to operator needs, often in ten minutes or less; (3) Inertia, or stored rotating energy and fast-acting primary frequency response that are used to arrest declines in frequency following unexpected losses. Historically, inertia has been supplied by large generators that run around the clock, although NERC notes that new ‘synthetic’ inertia is available from fast power injection by wind energy resources in the seconds following a disturbance; and (4) Frequency Disturbance Performance, which similar to voltage disturbance performance, is the ability to maintain operations during and after an unplanned disturbance. NERC Essential Reliability Services Report, pages 3-5, 8-9.
Services Description Consequences of Failure
Voltage ControlSupport system load; maintain transmission system in a secure and stable range
Voltage Disturbance Performance
Ability to maintain voltage support after a disturbance
RegulationMinute-to-minute differences between load and resources
Load Following Intra- and inter-hour load fluctuations
Reserves
Includes Spinning, Non-Spinning, and Supplemental; Used for synchronization and respond to generator or transmission outages in 10 min or greater time frames
InertiaStored rotating energy; Used to arrest decline in frequency following unexpected losses
Frequency Disturbance Performance
Ability of a plant to stay operational during disturbances and restore frequency to BPS
Frequency Control
Real-time balance between supply and demand
Ramping (Curtailment) Capability
Ability to increase/decrease active power, in response to operator needs. Measured in MW/min basis
Notes and Sources:
[3] NERC notes that many of these ESRs are already defined as ancillary services in the OATT of many system operators. Ancillary services are "those services necessary to support the transmission of electric power form seller to purchaser", considering reliabilty needs. Therefore, NERC considers ancillary services to be a subset of ESRs.
[2] NERC (2014) notes that these Essential Reliability Services are functionally equivalent to the Interconnected Operations Service (IOS) definitions, with Voltage Support covering Reactive Power Supply from Generation Sources and Frequency Support covering Frequency Response, Regulation, Load Following, and Contingency Reserves.
Voltage Support
Frequency Management
Operating Reserves
Active Power Control
Components
∙ Loss of Load∙ Equipment Failure∙ Cascading Losses
∙ Loss of Generation∙ Load Shedding∙ Interconnection Islanding∙ Overload Transmission Facilities∙ Damage Equipment and lead to Power System Collapse
[1] Adapted from NERC (2014) "Essential Reliability Services Task Force: A Concept Paper on Essential Reliability Services that Characterizes Bulk Power System Reliability".
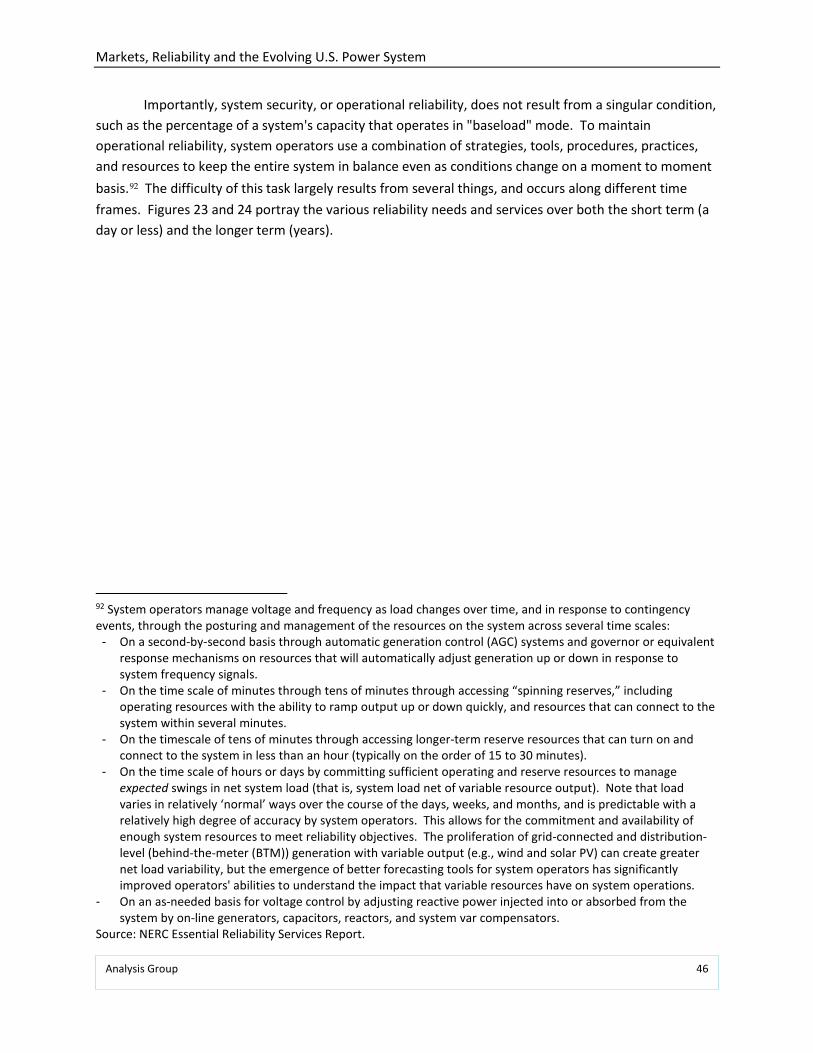
Markets, Reliability and the Evolving U.S. Power System
Analysis Group 46
Importantly, system security, or operational reliability, does not result from a singular condition, such as the percentage of a system's capacity that operates in "baseload" mode. To maintain operational reliability, system operators use a combination of strategies, tools, procedures, practices, and resources to keep the entire system in balance even as conditions change on a moment to moment basis.92 The difficulty of this task largely results from several things, and occurs along different time frames. Figures 23 and 24 portray the various reliability needs and services over both the short term (a day or less) and the longer term (years).
92 System operators manage voltage and frequency as load changes over time, and in response to contingency events, through the posturing and management of the resources on the system across several time scales:
- On a second-by-second basis through automatic generation control (AGC) systems and governor or equivalent response mechanisms on resources that will automatically adjust generation up or down in response to system frequency signals.
- On the time scale of minutes through tens of minutes through accessing “spinning reserves,” including operating resources with the ability to ramp output up or down quickly, and resources that can connect to the system within several minutes.
- On the timescale of tens of minutes through accessing longer-term reserve resources that can turn on and connect to the system in less than an hour (typically on the order of 15 to 30 minutes).
- On the time scale of hours or days by committing sufficient operating and reserve resources to manage expected swings in net system load (that is, system load net of variable resource output). Note that load varies in relatively ‘normal’ ways over the course of the days, weeks, and months, and is predictable with a relatively high degree of accuracy by system operators. This allows for the commitment and availability of enough system resources to meet reliability objectives. The proliferation of grid-connected and distribution-level (behind-the-meter (BTM)) generation with variable output (e.g., wind and solar PV) can create greater net load variability, but the emergence of better forecasting tools for system operators has significantly improved operators' abilities to understand the impact that variable resources have on system operations.
- On an as-needed basis for voltage control by adjusting reactive power injected into or absorbed from the system by on-line generators, capacitors, reactors, and system var compensators.
Source: NERC Essential Reliability Services Report.
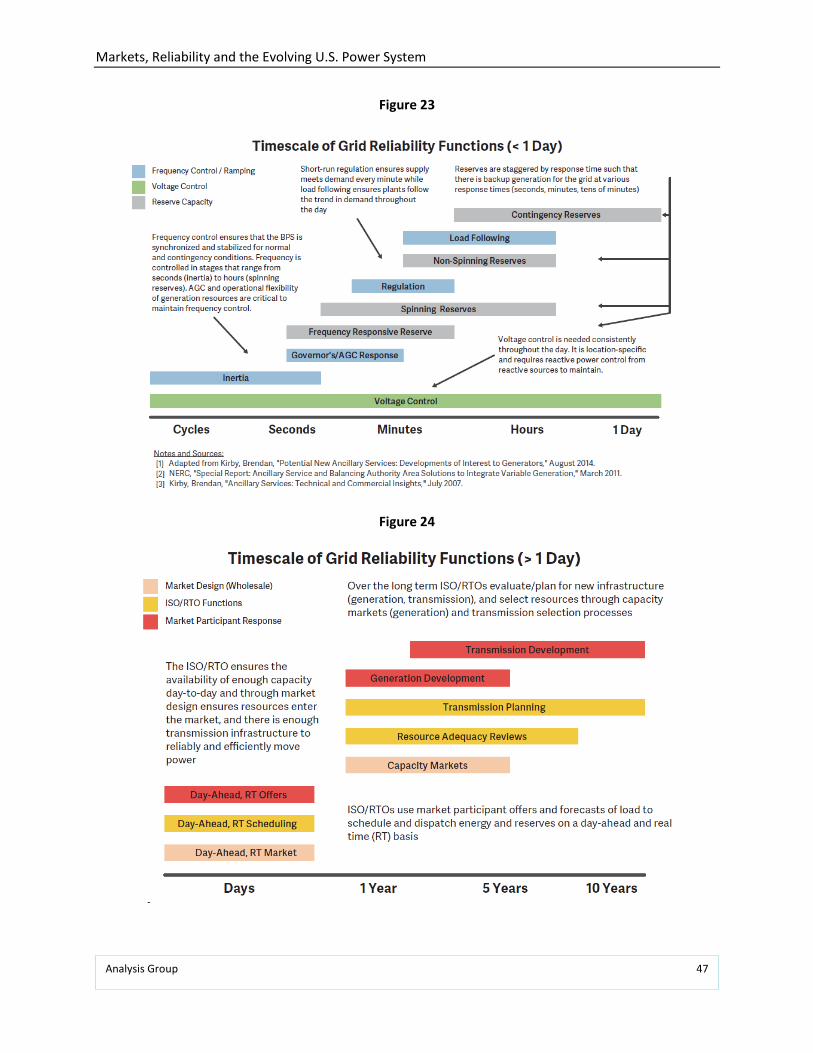
Markets, Reliability and the Evolving U.S. Power System
Analysis Group 47
Figure 23
Figure 24
Markets, Reliability and the Evolving U.S. Power System
Analysis Group 48
VI. The Impact of Resource Mix Changes on Power System Reliability
As described in Section III, a major transition in resource mix has been underway over at least the past decade, as underlying market factors render some generating assets uneconomic, and technological advancements promote new resource developments. The power systems that serve the bulk of the U.S. population have seen significant retirements of aging fossil fuel units, and the rapid addition of new gas-fired and renewable generation technology. On top of this, investments in energy efficiency and demand response have expanded, as has growth in the deployment of distribution generation (primarily solar PV) in behind the meter applications. The scale of change begs the question: how has BPS reliability been affected to-date by the transition underway in the industry?
Reliability is a technology-neutral concept. As noted in the NERC reviews of reliability, what is required to maintain a reliable system is a set of resources in sufficient quantity in total MW (for resource adequacy needs) that in aggregate can meet the system's operational needs for voltage support, frequency control, ramping/load following, etc. While not all of a system’s resources are equal when it comes to the attributes they provide to system operators to manage operational reliability, what is important is that the mix of resources available to system operators can in aggregate, and in combination with system operator actions, provide the essential reliability services needed to maintain operational reliability. In other words, various simplifications used historically to describe the way resources were being used - e.g., "baseload," "intermediate," and "peaking" - were used for convenience and simplicity, not to describe essential reliability services, or what was required to maintain reliability.
The power system primarily needs the combination of energy, capacity, and flexibility to maintain reliability. Reliability has always been most economically achieved through a division of labor among diverse resources, which has historically included (1) traditional thermal steam units (e.g., coal, nuclear, oil plants, natural gas and combined heat and power units); these are generally the resources often referred to as "baseload resources," in that they have operated in most hours as a function of cost; and (2) more flexible technologies capable of quick (seconds) or slightly longer-term (minutes to hours) changes in output (e.g., hydro units, combined cycle plants operating on natural gas, quick-start units such as combustion turbine and diesel-fired engines, and even from flexibility in customers' loads). Historically, power systems’ needs for voltage support, inertia, reactive power, frequency control, and contingency-response capability have been met through operator actions in conjunction with their commitment of the different types of technologies on the system.
Much attention has focused recently on the economic pressures facing the power plants and technologies that, as noted above, are sometimes referred to as "baseload" power plants - namely, older coal-fired units and nuclear units. However, they are neither the only power-generation technologies facing economic stress due to market factors, nor are they the only types of technologies capable of providing the functions that they provide to support reliable electric system operations.
Markets, Reliability and the Evolving U.S. Power System
Analysis Group 49
Consequently, we do not use the term "baseload" to refer to any particular generating asset type or fuel source, as many power plants can operate either around the clock or in cycling mode, and provide the same or more essential reliability services that are provided by coal and nuclear resources. In short, "baseload" does not in a practical sense describe any unique reliability service or attribute.
Notably, system planners across the country are dealing constantly and successfully with the integration of changing technology mixes. For example, the CAISO and California electric utilities have identified the need for greater ramping to handle an increased variability in intra-day electricity supply and demand balance introduced from increasing amounts of variable energy resources necessary to meet increasingly higher renewable portfolio standards.93 In general, load following is typically accomplished through the dispatch of fast-ramping combustion turbines and natural gas combined cycle (NGCC), although load following can increasingly be met through well-designed and cost-effective storage, optimized energy efficiency programs, demand response, and wind and solar plants.
NERC regularly tracks BPS reliability in all power systems, with assessments that cover a wide range of factors that report on systems' abilities to meet reserve margin requirements, prevent loss of load, react properly to system events or contingencies, maintain voltage and frequency within tolerances and avoid cascading system failures, and restore system operations to normal levels in a timely fashion following events, contingencies, or system failures. In order to conduct this assessment, NERC collects data from power regions using specific metrics that measure risk and reliability impacts.94 Together, the metrics evaluate whether the risks and impacts to bulk power system reliability from power system events are increasing or decreasing.
In its most recent reliability assessment (2016), NERC finds a need to continue to evaluate and study the potential impact on BPS reliability of the changing operational characteristics of the BPS associated with the integration of distributed and variable resources. Nevertheless, NERC concludes that the risk and impact to the BPS from violations appear to be decreasing and are better controlled, and an adequate level of reliability is being maintained.95 Specifically, among other findings, NERC notes the following:
• Instances of protection system misoperations have decreased from 2014 to 2015; • BPS resilience to severe weather improved;
93 California is on track to meet its renewables portfolio standard target, such that by 2020, 33 percent of its total energy comes from renewable resources. The state is considering whether to adopt a 50-percent goal by 2030. Behind-the-meter solar and wind supplies are projected to significantly decrease net load during the middle of the day, while leaving significant shoulder peaks in the morning and evening, resulting in what is commonly called the “duck curve.” A recent analysis found that this will require a significant increase in fast ramping, flexible dispatchable generation resources (along with other technologies, including storage). See Energy+Environmental Economics, “Investigating a Higher Renewables Portfolio Standard in California,” January 2014. 94 North American Electric Reliability Corporation, State of Reliability 2016, May 2016 (hereafter "NERC Reliability Report"), pages iv-v. 95 Id.
Markets, Reliability and the Evolving U.S. Power System
Analysis Group 50
• In terms of avoided generation outages and as suggested by better BPS performance, winter reliability and resilience improved;
• Transmission line outages caused by human error were significantly reduced in 2015 relative to 2014 and 2013;
• Across most categories of events, reliability performance improved; • Frequency and voltage remained stable, with the BPS demonstrating "generally stable
frequency response performance from 2012–2015;" and • Improved understanding of the grid is moving the industry toward more accurate
simulations, including better potential to assess blackout risk.96
The NERC Reliability Report summarizes trends in BPS reliability with respect to a set of reliability indicators that are tied to NERC reliability performance objectives. For each metric, performance is assessed from a trending perspective, over different periods of time. Notably, despite continuous growth in the installation of renewable resources, integration of distributed solar resources and demand response, and a shift to relying more on natural gas plants and grid-connected and distributed resources, NERC finds that all reliability indicators (or metrics) are improving, remaining the same, or are inconclusive. In other words, to date there is no indication that the changing resource mix of the BPS is leading to any degradation in the reliability of the BPS. See Figure 25, which is reproduced from Table 4.1 of the 2016 NERC Reliability Report.97 Figure 26 (Figure 4.3 in NERC's Report) demonstrates the trending assessment for one of the metrics - M2, transmission-related events resulting in loss of load - showing consistent performance in this category since 2003, and noticeable sustained decrease from 2012-2015.98
96 Id. 97 NERC Reliability Report, pages 22-23. 98 NERC Reliability Report, page 25.
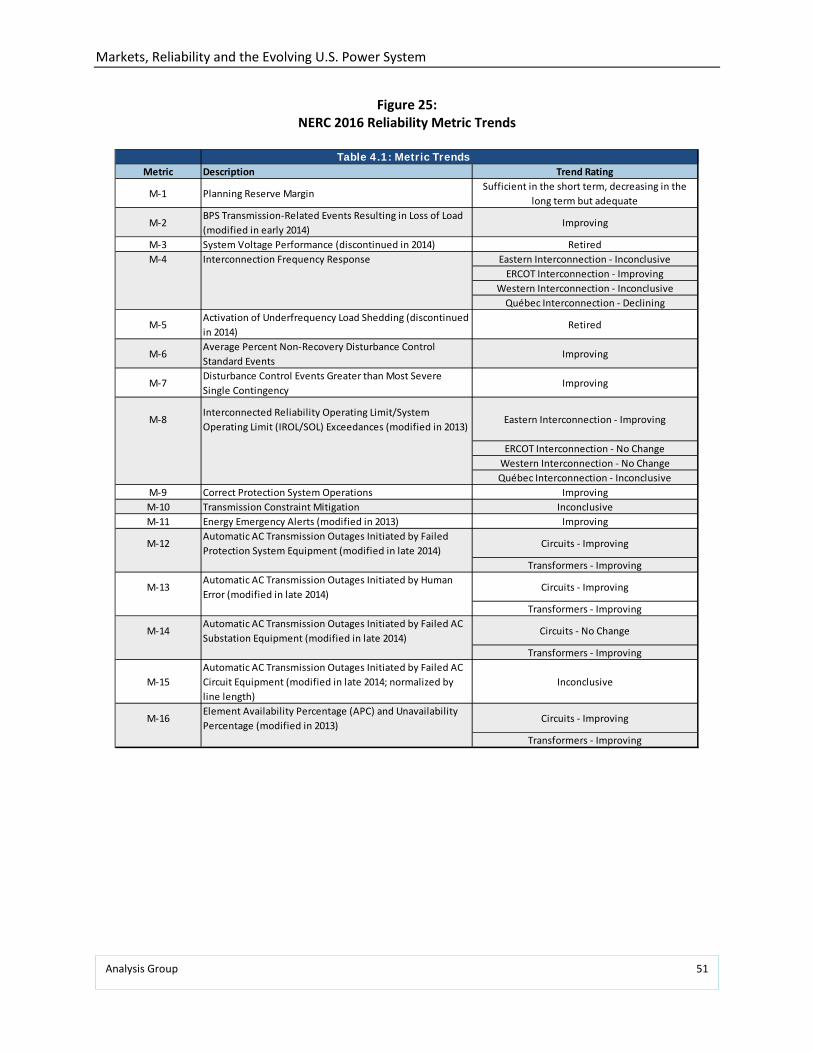
Markets, Reliability and the Evolving U.S. Power System
Analysis Group 51
Figure 25: NERC 2016 Reliability Metric Trends
Table 4.1: Metric TrendsMetric Description Trend Rating
M-1 Planning Reserve MarginSufficient in the short term, decreasing in the
long term but adequate
M-2BPS Transmission-Related Events Resulting in Loss of Load (modified in early 2014)
Improving
M-3 System Voltage Performance (discontinued in 2014) RetiredM-4 Interconnection Frequency Response Eastern Interconnection - Inconclusive
ERCOT Interconnection - ImprovingWestern Interconnection - Inconclusive
Québec Interconnection - Declining
M-5Activation of Underfrequency Load Shedding (discontinued in 2014)
Retired
M-6Average Percent Non-Recovery Disturbance Control Standard Events
Improving
M-7Disturbance Control Events Greater than Most Severe Single Contingency
Improving
M-8Interconnected Reliability Operating Limit/System Operating Limit (IROL/SOL) Exceedances (modified in 2013)
Eastern Interconnection - Improving
ERCOT Interconnection - No ChangeWestern Interconnection - No ChangeQuébec Interconnection - Inconclusive
M-9 Correct Protection System Operations ImprovingM-10 Transmission Constraint Mitigation InconclusiveM-11 Energy Emergency Alerts (modified in 2013) Improving
M-12Automatic AC Transmission Outages Initiated by Failed Protection System Equipment (modified in late 2014)
Circuits - Improving
Transformers - Improving
M-13Automatic AC Transmission Outages Initiated by Human Error (modified in late 2014)
Circuits - Improving
Transformers - Improving
M-14Automatic AC Transmission Outages Initiated by Failed AC Substation Equipment (modified in late 2014)
Circuits - No Change
Transformers - Improving
M-15Automatic AC Transmission Outages Initiated by Failed AC Circuit Equipment (modified in late 2014; normalized by line length)
Inconclusive
M-16Element Availability Percentage (APC) and Unavailability Percentage (modified in 2013)
Circuits - Improving
Transformers - Improving
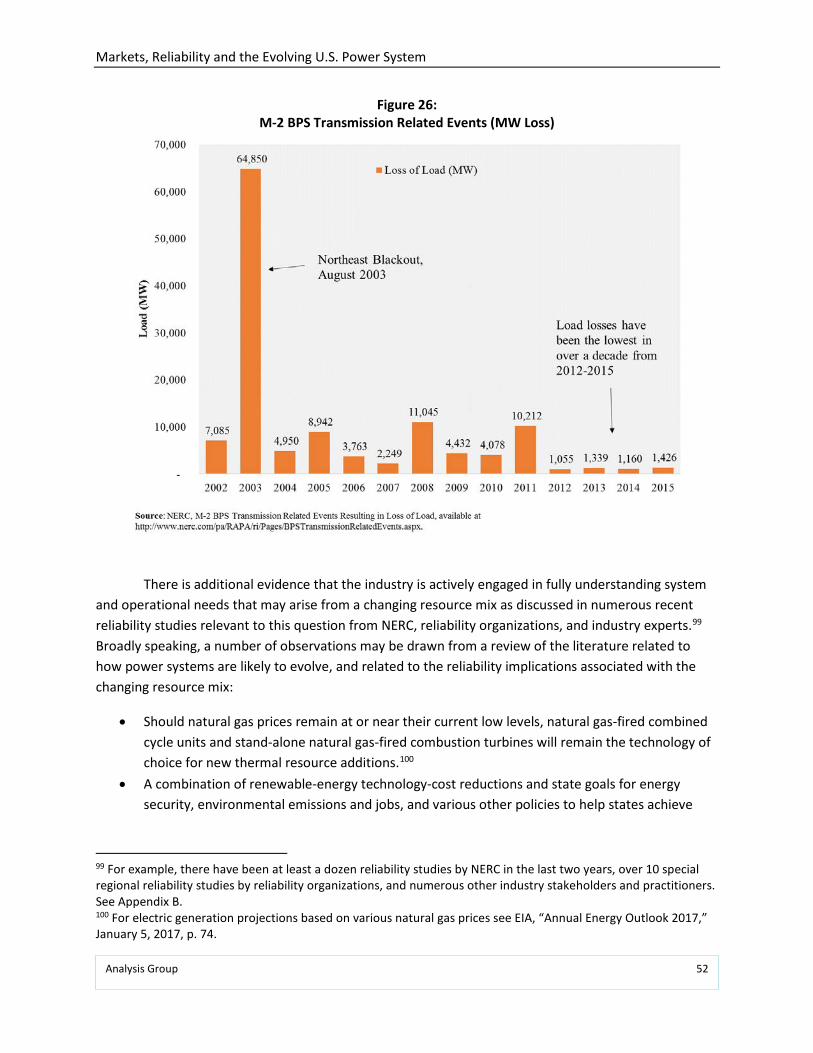
Markets, Reliability and the Evolving U.S. Power System
Analysis Group 52
Figure 26: M-2 BPS Transmission Related Events (MW Loss)
There is additional evidence that the industry is actively engaged in fully understanding system and operational needs that may arise from a changing resource mix as discussed in numerous recent reliability studies relevant to this question from NERC, reliability organizations, and industry experts.99 Broadly speaking, a number of observations may be drawn from a review of the literature related to how power systems are likely to evolve, and related to the reliability implications associated with the changing resource mix:
• Should natural gas prices remain at or near their current low levels, natural gas-fired combined cycle units and stand-alone natural gas-fired combustion turbines will remain the technology of choice for new thermal resource additions.100
• A combination of renewable-energy technology-cost reductions and state goals for energy security, environmental emissions and jobs, and various other policies to help states achieve
99 For example, there have been at least a dozen reliability studies by NERC in the last two years, over 10 special regional reliability studies by reliability organizations, and numerous other industry stakeholders and practitioners. See Appendix B. 100 For electric generation projections based on various natural gas prices see EIA, “Annual Energy Outlook 2017,” January 5, 2017, p. 74.
Markets, Reliability and the Evolving U.S. Power System
Analysis Group 53
those goals will increase, over time, the quantity of variable renewable resources (primarily wind and solar) throughout the United States.101
• Older, less efficient thermal resources (coal, oil, and natural gas-fired) will continue to be challenged under current market conditions, leading to a continued attrition of such resources (generally replaced by new gas-fired and renewable resources). In the absence of policies to address power-sector carbon emissions in those states, existing merchant nuclear capacity in many RTO markets (notably ERCOT, PJM, NYISO and ISO-NE) will be similarly challenged.102
• Utility planning/procurement and market designs (in wholesale market regions) are sufficient to ensure that enough resources are added to the system - whether to meet load growth, to replace retiring capacity, or both - to meet resource adequacy requirements. Markets are also designed to facilitate efficient exit of more costly resources (see Section III, above).103
• Rapid growth in variable renewable resources requires increased ramping and load-following relative to lower penetration of such resources; this capability can be (and has been) managed with the various resources on systems that have this capability (e.g., existing and new thermal resources such as natural gas combined cycle and combustion turbine units, dispatchable hydro, and steam turbines), as well as (going forward) emerging technologies and approaches such as demand response and battery storage.104
• The retirement of aging or uneconomic resources has not led, in any region, to an observed reduction in BPS reliability from either resource adequacy or system security perspectives.
• Studies reviewing potential limits to reliable integration of greater amounts of variable resources (1) generally find that variable resources can be integrated in quantities vastly exceeding current levels, and (2) have shown that the expected potential for successful integration of variable resources has increased over time as renewable technologies change, market designs and interconnection requirements evolve, forecasting tools improve, other technologies (e.g., storage, demand response) are deployed, and system operational techniques evolve.105
• Emerging technologies are increasing the ability of variable renewable resources to contribute to the provision of reliability services valuable for meeting system reliability needs.106
101 For renewables projections and discussion of the impacts of economics and state policies on the growth of renewables see EIA, “Annual Energy Outlook 2017,” January 5, 2017, pp. 74, 78. 102 For projected retirement of older, less efficient fossil fuel units and nuclear units see EIA, “Annual Energy Outlook,” January 5, 2017, pp. 72, 82. 103 For description of wholesale electricity market design see R Street, “Types of Organized Electricity Markets,” August 2016. 104 For discussion of how flexible generating sources can accommodate variable renewable sources see NREL, “Integrating Variable Renewable Energy: Challenges and Solutions,” September 2013, pp. 8-9. 105 See for example: SPP, “2016 Wind Integration Study,” January 5, 2016; NE-ISO, “New England Wind Integration Study,” November 2010; PJM, “Renewable Integration Study,” March 31, 2014. 106 For discussion of increasing ability of variable energy resources to contribute to reliability see IEEE, “Alternatives No More,” October 20, 2015, p. 78. See also CAISO, First-Solar, and NREL, “Using Renewables to Operate a Low-Carbon Grid,” 2016; NREL, “Active Power Controls from Wind Power: Bridging the Gaps,” January 2014.
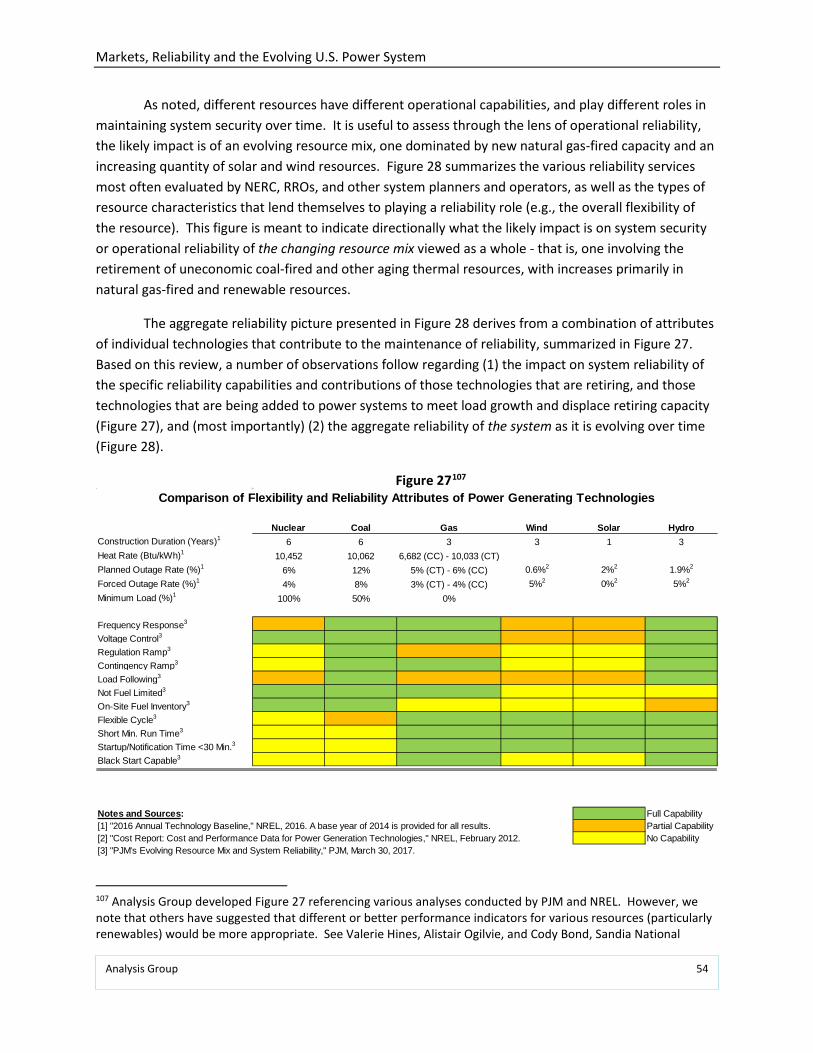
Markets, Reliability and the Evolving U.S. Power System
Analysis Group 54
As noted, different resources have different operational capabilities, and play different roles in maintaining system security over time. It is useful to assess through the lens of operational reliability, the likely impact is of an evolving resource mix, one dominated by new natural gas-fired capacity and an increasing quantity of solar and wind resources. Figure 28 summarizes the various reliability services most often evaluated by NERC, RROs, and other system planners and operators, as well as the types of resource characteristics that lend themselves to playing a reliability role (e.g., the overall flexibility of the resource). This figure is meant to indicate directionally what the likely impact is on system security or operational reliability of the changing resource mix viewed as a whole - that is, one involving the retirement of uneconomic coal-fired and other aging thermal resources, with increases primarily in natural gas-fired and renewable resources.
The aggregate reliability picture presented in Figure 28 derives from a combination of attributes of individual technologies that contribute to the maintenance of reliability, summarized in Figure 27. Based on this review, a number of observations follow regarding (1) the impact on system reliability of the specific reliability capabilities and contributions of those technologies that are retiring, and those technologies that are being added to power systems to meet load growth and displace retiring capacity (Figure 27), and (most importantly) (2) the aggregate reliability of the system as it is evolving over time (Figure 28).
Figure 27107
107 Analysis Group developed Figure 27 referencing various analyses conducted by PJM and NREL. However, we note that others have suggested that different or better performance indicators for various resources (particularly renewables) would be more appropriate. See Valerie Hines, Alistair Ogilvie, and Cody Bond, Sandia National
Comparison of Flexibility and Reliability Attributes of Power Generating Technologies
Nuclear Coal Gas Wind Solar HydroConstruction Duration (Years)1 6 6 3 3 1 3Heat Rate (Btu/kWh)1 10,452 10,062 6,682 (CC) - 10,033 (CT)Planned Outage Rate (%)1 6% 12% 5% (CT) - 6% (CC) 0.6%2 2%2 1.9%2
Forced Outage Rate (%)1 4% 8% 3% (CT) - 4% (CC) 5%2 0%2 5%2
Minimum Load (%)1 100% 50% 0%
Frequency Response3
Voltage Control3
Regulation Ramp3
Contingency Ramp3
Load Following3
Not Fuel Limited3
On-Site Fuel Inventory3
Flexible Cycle3
Short Min. Run Time3
Startup/Notification Time <30 Min.3
Black Start Capable3
Notes and Sources: Full Capability[1] "2016 Annual Technology Baseline," NREL, 2016. A base year of 2014 is provided for all results. Partial Capability[2] "Cost Report: Cost and Performance Data for Power Generation Technologies," NREL, February 2012. No Capability[3] "PJM's Evolving Resource Mix and System Reliability," PJM, March 30, 2017.
Markets, Reliability and the Evolving U.S. Power System
Analysis Group 55
First, the addition of new natural gas-fired combined cycle (CC) and combustion turbine (CT) capacity provides a number of reliability benefits, as they tend to be both more nimble and more reliable than the retiring aging thermal units on the system.108,109 Specifically, gas-fired capacity can operate at high capacity factors and be available as an around-the-clock resource to help meet minimum continuous loads, but also can ramp output and cycle on and off as need or economics dictates. Overall, this provides more flexibility for system operators to meet load variations, particularly as the level of net load variability increases with the addition of solar and wind resources.
Second, as can be seen in Figure 27, the technologies being added to the system have, in combination, most if not all of the reliability attributes provided by resources exiting the system. The newer gas-fired technologies coming online tend to have lower forced and planned outage rates than the older coal-fired units,110 leading to a system that requires fewer resources to meet specific resource adequacy levels and that operates with a greater level of assurance that resources called on to meet demand will be available when needed. Third, the newer gas technologies tend to have faster startup times, shorter minimum run times, greater cycling capability, and black start capability,111 supporting system capability to follow changes in load and restore service after an outage. Renewable resources, in turn, can increasingly help support frequency response and voltage control, can contribute to load-following needs if online and needed, can respond quickly to operator instructions when available, and can provide energy generation during times of natural gas transportation constraints or other power generator fuel and operational issues, helping to alleviate any reliability challenges that arise under those conditions. In short, in many ways, the evolution of a resource mix away from the older coal, oil and gas capacity to newer gas-fired capacity more efficiently and more reliably facilitates the integration of variable renewable resources, and allows for integrated renewables to contribute to reliability services when available. Finally, the new gas-fired resources being added can provide a number of reliability services at least as well, if not more efficiently and at lower cost, than retiring resources.112
Thus an evolving resource mix that includes retirement of aging capacity and the addition of new gas-fired units and renewable capacity can increase system reliability from a number of perspectives. Figure 28 summarizes the relative impact on bulk power system reliability - on an aggregate basis - of the resource mix transition under way in many power regions. However, there are
Laboratories, Wind Plant Reliability Benchmark September 2013; and Michael Goggin, PJM study quantifies wind’s value for building a reliable, resilient power system, (http://www.aweablog.org/pjm-study-quantifies-winds-value-building-reliable-resilient-power-system/), April 4, 2017. 108 See NREL, "2016 Annual Technology Baseline," 2016 and "Power Plant Cycling Costs," NREL, April 2012. 109 Concerns have been raised regarding the potential drawbacks of increased reliance on natural gas, particularly with respect to the fact that the fuel for power operations needs to be delivered in real time. This issue is discussed below. 110 For example, new Natural Gas Combined Cycles units have planned outage rates of 6 percent compared to existing Coal Plants 12 percent. The same Natural Gas Combine Cycle units have forced outage rates of 4 percent compared to existing Coal Plants 8 percent. See, "2016 Annual Technology Baseline," NREL, 2016. 111 See NREL, "2016 Annual Technology Baseline," 2016, "PJM's Evolving Resource Mix and System Reliability," PJM Interconnection, March 30, 2017, and "Power Plant Cycling Costs," NREL, April 2012. 112 See "Power Plant Cycling Costs," NREL, April 2012.

Markets, Reliability and the Evolving U.S. Power System
Analysis Group 56
two facets of this type of changing resource mix that have been and should continue to be a focus of FERC, NERC, system operators, and stakeholders.
The first relates to the management (from a systems operation perspective) of increased net load variability that comes with greater amounts of variable resources on the system. A number of studies have highlighted the challenges with and approaches to managing increased variability, in part by evaluating actual experience in states like California, Colorado, and Texas that have faced significant renewable growth in a short period of time, and by considering various market and operational changes to best maintain operational reliability. Key observations that flow from these studies include the following:
• Stability and frequency response can be maintained system-wide with high levels of renewable energy penetration.113
• An increased mix in fuel technologies can be used to supplement and support each other.114 • Increased renewables integration also requires upgrades and improvements in transmission
capabilities.115 • The integration of renewables is cost effective, for both operators and consumers.116 • Operators have successfully achieved high levels of renewables integration on track to meet the
EPA's proposed Clean Power Plan.117
113 See NREL, Western Wind Integration Study Phase 3 - Frequency Response and Transient Stability, December 2014, available at http://www.nrel.gov/docs/fy15osti/62906.pdf. See also: The Brattle Group, "Integrating Renewable Energy into the Electricity Grid: Case Studies Showing How System Operators are Maintaining Reliability," June 2015, available at http://info.aee.net/hubfs/EPA/AEEI-Renewables-Grid-Integration-Case-Studies.pdf?t=1440089933677. 114 See The Brattle Group, "Integrating Renewable Energy into the Electricity Grid: Case Studies Showing How System Operators are Maintaining Reliability," June 2015, available at http://info.aee.net/hubfs/EPA/AEEI-Renewables-Grid-Integration-Case-Studies.pdf?t=1440089933677. See also: NREL, Western Wind Integration Study Phase 3 - Frequency Response and Transient Stability, December 2014, available at http://www.nrel.gov/docs/fy15osti/62906.pdf. 115 See NREL, Eastern Wind Integration and Transmission Study, Revised February 2011, available at http://www.nrel.gov/docs/fy11osti/47078.pdf. 116 See: PJM, Renewable Integration Study, March 31, 2014, available at https://www.pjm.com/~/media/committees-groups/subcommittees/irs/postings/pris-executive-summary.ashx 117 See The Brattle Group, EPA's Clean Power Plan and Reliability: Assessing NERC's Initial Reliability Review, February 2015, available at http://www.brattle.com/system/publications/pdfs/000/005/121/original/EPAs_Clean_Power_Plan_and_Reliability_-_Assessing_NERC's_Initial_Reliability_Review.pdf?1427375637. See also: The Brattle Group, "Integrating Renewable Energy into the Electricity Grid: Case Studies Showing How System Operators are Maintaining Reliability," June 2015, available at http://info.aee.net/hubfs/EPA/AEEI-Renewables-Grid-Integration-Case-Studies.pdf?t=1440089933677.
Markets, Reliability and the Evolving U.S. Power System
Analysis Group 57
The second concern relates to the risks associated with an increase in reliance on natural gas pipeline transportation to maintain power supply reliability. As the portion of electricity generated with natural gas increases, so too does the exposure to disruptions in fuel supply that could arise, for example, with the loss of a major interstate pipeline, or with combined heating, process, and electricity generation demand outstripping available natural gas transportation capacity in a region during a particularly cold day or week. While many regions have fully adequate and redundant pipeline transportation capacity, other regions (particularly in the Northeast) have a less comfortable balance between power supply needs and available peak gas transportation capacity.
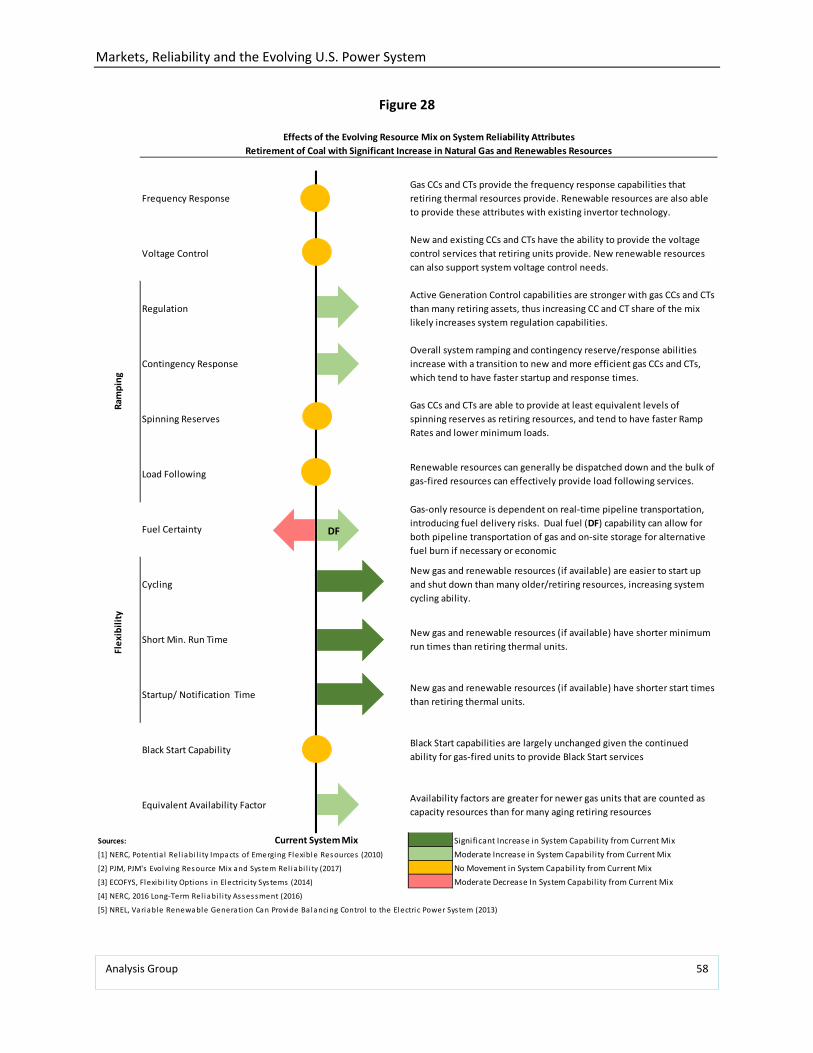
Markets, Reliability and the Evolving U.S. Power System
Analysis Group 58
Figure 28
Effects of the Evolving Resource Mix on System Reliability AttributesRetirement of Coal with Significant Increase in Natural Gas and Renewables Resources
Sources: Significant Increase in System Capability from Current Mix[1] NERC, Potentia l Rel iabi l i ty Impacts of Emerging Flexible Resources (2010) Moderate Increase in System Capability from Current Mix[2] PJM, PJM's Evolving Resource Mix and System Rel iabi l i ty (2017) No Movement in System Capability from Current Mix[3] ECOFYS, Flexibi l i ty Options in Electrici ty Systems (2014) Moderate Decrease In System Capability from Current Mix[4] NERC, 2016 Long-Term Rel iabi l i ty Assessment (2016)
[5] NREL, Variable Renewable Generation Can Provide Ba lancing Control to the Electric Power System (2013)
Cycling
Short Min. Run Time
Startup/ Notification Time
Gas CCs and CTs provide the frequency response capabilities that retiring thermal resources provide. Renewable resources are also able to provide these attributes with existing invertor technology.
New and existing CCs and CTs have the ability to provide the voltage control services that retiring units provide. New renewable resources can also support system voltage control needs.
Frequency Response
Voltage Control
Regulation
Contingency Response
Spinning Reserves
Black Start Capability
Equivalent Availability Factor
Ram
ping
Flex
ibili
ty
New gas and renewable resources (if available) have shorter minimum run times than retiring thermal units.
New gas and renewable resources (if available) have shorter start times than retiring thermal units.
Black Start capabilities are largely unchanged given the continued ability for gas-fired units to provide Black Start services
Availability factors are greater for newer gas units that are counted as capacity resources than for many aging retiring resources
Load Following
Active Generation Control capabilities are stronger with gas CCs and CTs than many retiring assets, thus increasing CC and CT share of the mix likely increases system regulation capabilities.
Overall system ramping and contingency reserve/response abilities increase with a transition to new and more efficient gas CCs and CTs, which tend to have faster startup and response times.
Gas CCs and CTs are able to provide at least equivalent levels of spinning reserves as retiring resources, and tend to have faster Ramp Rates and lower minimum loads.
Renewable resources can generally be dispatched down and the bulk of gas-fired resources can effectively provide load following services.
Gas-only resource is dependent on real-time pipeline transportation, introducing fuel delivery risks. Dual fuel (DF) capability can allow for both pipeline transportation of gas and on-site storage for alternative fuel burn if necessary or economic
New gas and renewable resources (if available) are easier to start up and shut down than many older/retiring resources, increasing system cycling ability.
Fuel Certainty
Current System Mix
DF
Markets, Reliability and the Evolving U.S. Power System
Analysis Group 59
In this context, there are a number of factors to note at the outset. First, the importance of natural gas pipeline transportation for electricity generation has been evaluated extensively by FERC, NERC, certain market regions, and others, and there is an extremely high degree of coordination between power system operators, generation asset owners, and the owners/operators of the interstate and intrastate pipeline systems that deliver fuel.118 This degree of cooperation is facilitated, and to a certain extent, mandated by FERC, who has jurisdictional authority over all actors involved.
Second, natural gas is not the only fuel where there are risks and potential reliability issues associated with the delivery and use of the fuel. Each of the major fossil fueled generation technologies relies on the commercial fuel supply markets and infrastructure developed to provide fuel delivery. That is, while some oil and coal may be stored on site at generating facilities, the amount that is stored on site is generally limited by space, economic, and environmental considerations, particularly at generators located in cities (i.e., close to load). Delivery and fuel stock replenishment relies on various networks of barge, rail, truck, and pipeline delivery, which can face challenges under severe weather conditions or other factors (e.g., the freezing of water supply routes or the freezing of coal piles on site).
Third, the concern over natural gas delivery for power system reliability is one that mostly arises in locations where there is a lack of fuel delivery redundancy (e.g., multiple interstate pipelines connected in a network, with delivery available from multiple directions), a high need for gas for power generation coincident with demand for natural gas for heating or process needs, and market factors or economics that dictate alternative approaches to ensuring reliability under these conditions (as opposed to overbuilding the pipeline delivery network). Thus, from a practical perspective there are not many regions of the country that face these factors.
New England is perhaps the best test case for this reliability concern. The majority of the region's electricity generation comes from natural gas, and there is significant reliance on natural gas for residential and commercial heating, exacerbating fuel supply concerns during peak winter periods when much of the region's gas-fired generating capacity is needed to keep the lights on.119 Further, while New England has access to liquefied natural gas (LNG) storage and delivery from the East, virtually all of the pipeline delivery capacity is from the West or North, with New England at the end of the pipeline delivery systems.
New England has taken a number of steps to ensure that the region maintains power system reliability despite a significant dependence on gas-fired generation. First, ISO-NE maintains constant coordination with the region's pipeline operators generally (e.g., to coordinate generator and pipeline maintenance schedules) and in particular during cold winter conditions. Second, ISO-NE developed and uses its own gas pipeline capacity forecasting tool, to ensure there will be sufficient gas to operate the generation dispatch curve resulting from energy market offers. Third, ISO-NE has implemented
118 Changing Resources: How New England Has Responded to Challenges Associated with the Expanded Role of Natural Gas," ISO New England, May 18, 2016, p. 21. 119 "Changing Resources: How New England Has Responded to Challenges Associated with the Expanded Role of Natural Gas," ISO New England, May 18, 2016.
Markets, Reliability and the Evolving U.S. Power System
Analysis Group 60
numerous market design changes to provide financial incentives for generators to be available when needed, to provide market incentives for fuel assurance (i.e., increases in reserve pricing and quantity, and performance incentives in the capacity market), and to provide offer and pricing flexibility to support generators' flexible and efficient procurement of natural gas transportation (e.g., allowing generators to alter pricing and the timing of energy market offers to better match the natural gas markets). Finally, ISO-NE has implemented market designs to encourage the development of dual fuel capability at gas-fired units,120 which involves storage of oil on site for availability during winter peak conditions and contracting for guaranteed LNG storage for the same purpose.
In short, increasing dependence on natural gas raises questions about fuel supply and delivery certainty that have been and continue to be carefully evaluated by the stakeholders involved, and that have solutions rooted in operator actions, industry coordination, and appropriate market design mechanisms. In the region most susceptible to such risks, the power system operator has implemented appropriate market design changes that provide the necessary market signals for generators to be certain they are available to operate, and to switch to alternative fuels when gas market prices exceed economic levels (see Figure 29, showing that on cold winter days gas-fired generators often switch to burning oil, as high demand on the interstate pipeline system drives up the price of delivered gas).
120 The number of plants with dual-fuel capability has been increasing. Dual-fuel plants are recognized for allowing more operational flexibility for individual generators due to the option to switch from burning natural gas to oil, the latter of which is often stored onsite at the plant. This fuel flexibility means that these facilities are less bound by supply or deliverability issues and have a second option of oil as a primary fuel source if there is volatility in natural gas prices. Given these capabilities, dual-fuel plants are particularly advantageous in regions that are the most reliant on natural gas, such as New York and New England. As of January 2016, New England had added approximately 7,000 MW of dual-fuel generating capacity across 46 plants, and had three large dual-fuel plants, accounting for 1,300 MW of capacity, clear in the February 2016 capacity auction. ISO-NE also has added near-term incentives for plant developers to phase in dual-fuel capabilities through their Winter Reliability Program, which specifically provides incentives for: oil and dual fuel generators to increase oil inventories, LNG to supplement natural-gas-fired generators’ pipeline gas, and demand response. See NYISO, "Fuel Diversity in the New York Electricity Market," October 2008, available at http://www.nyiso.com/public/webdocs/media_room/publications_presentations/White_Papers/White_Papers/fuel_diversity_11202008.pdf, pp. 4-2. See also NYISO, "NYISO Draft ICAP Demand Curve Recommendations for Capability Years 2017/2018-2020/2021," August 2016, available at http://www.nyiso.com/public/webdocs/markets_operations/committees/bic_icapwg/meeting_materials/2016-08-19/NYISO%20Draft%20Recommendations%2008192016%20ICAPWG.pdf, p. 5; See also FERC, 2015 - 16 Winter Energy Market Assessment, October 15, 2015, available at https://www.ferc.gov/market-oversight/reports-analyses/mkt-views/2015/10-15-15-A-3.pdf, p. 12. See also Energyzt Advisors, "Natural Gas Storage in New England and the Impact of LNG on Winter Prices," January 6, 2016, available at http://aeenewengland.org/images/downloads/Past_Meeting_Presentations/tanya_bodell___energyzt___ng_storage_in_ne_and_impact_of_lng_on_winter_prices.pdf, p. 24. See also ISO-NE, "ISO-NE Capacity Auction Secures Sufficient Power System Resources, At a Lower Price, for Grid Reliability in 2019-2020," February 11, 2016, available at https://www.iso-ne.com/static-assets/documents/2016/02/20160211_fca10_initialresults_final.pdf.
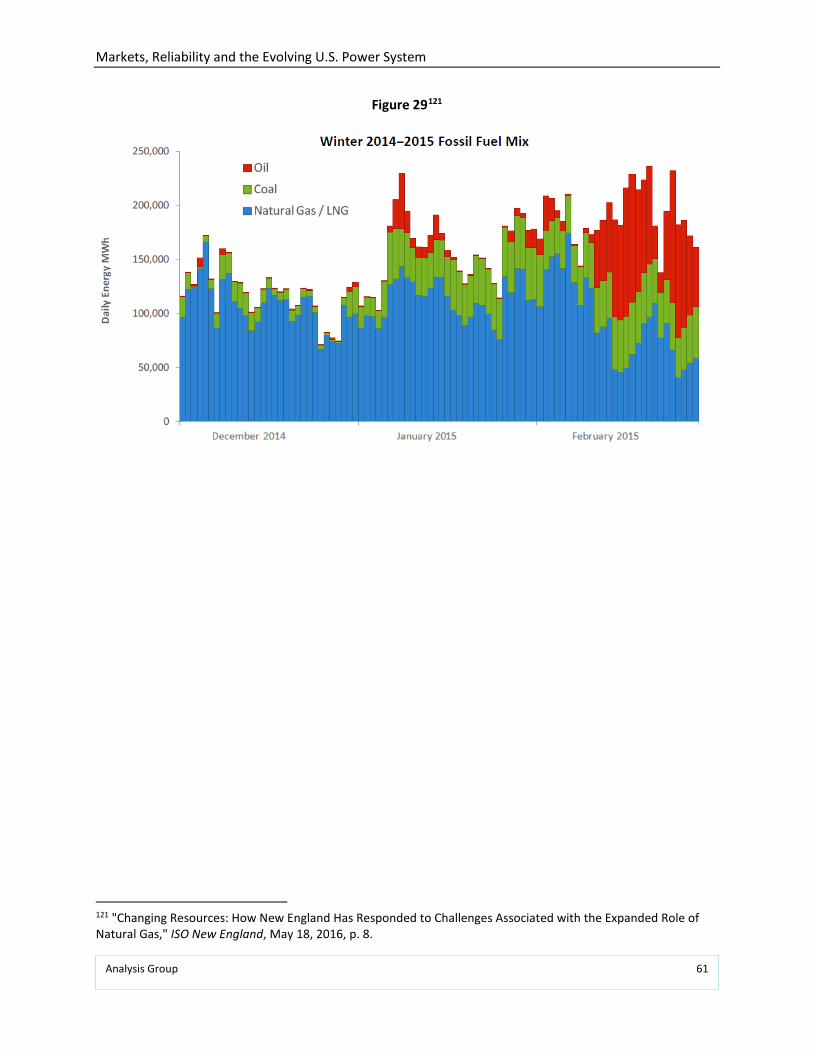
Markets, Reliability and the Evolving U.S. Power System
Analysis Group 61
Figure 29121
121 "Changing Resources: How New England Has Responded to Challenges Associated with the Expanded Role of Natural Gas," ISO New England, May 18, 2016, p. 8.

Markets, Reliability and the Evolving U.S. Power System
Analysis Group 62
VII. Observations and Conclusions
While the nation's mix of electric generating resources has always changed over time, it is increasingly evident that the U.S. electric power system is now going through a major transition. The current changes have been driven by several things: fundamental shifts in the prices of fuels for power generation (in particular, natural gas); improvements in traditional and renewable generating technology cost and performance; the rapid emergence of distributed resources including energy efficiency; and state and federal policies promoting the development and commercialization of advanced energy technologies.
These changes take place in the context of some important continuities: the electric industry’s successful maintenance of power system reliability. Even so, a common occurrence in the industry is for observers to raise reliability concerns whenever technology, market or policy trends or events are affecting or may affect the balance of resources on the system. Such reliability concerns have been raised regularly over decades in the face of industry changes. It is a particularly powerful tool in public discussions, because reliability simply cannot be jeopardized. Sometimes the warnings spring from genuine concerns, such as the need to address localized reliability impacts of potential plant closures; other times they reflect a first line of defense by opponents of the changes underway in the industry, or those potentially adversely affected. Yet in every case, the prospect of change has led to reliability assessments, careful evaluations of new and upcoming challenges, and steps taken to avoid reliability problems from actually coming to fruition.
There are many sound reasons why policy and/or market changes rarely if ever actually end up adversely affecting electric system reliability. A vast network of entities and organizations, combined with a complex set of reliability laws, rules, practices, and procedures, ensures this outcome. Nevertheless, these discussions play an important role in focusing the attention of the industry on taking the steps necessary to continue to ensure reliable electric service to Americans.
There is little doubt that the transition under way in the industry will lead us to a power system resource mix and consumption patterns quite different from what the industry has grown accustomed to in recent decades. The recent changes result from a combination of forces, have lowered wholesale electricity costs in most parts of the U.S., and have contributed to recent declines in consumers’ overall cost of living. Yet the nature and pace of change have raised two fundamental questions in public debates among electric industry participants, regulators, stakeholders and practitioners:
First, what exactly are the primary drivers of the transition underway in the electric industry?
Second, are the changes impacting the mix of generating resources in a way that could undermine power system reliability?
In this Report we have evaluated both questions. Based on our review, we arrive at the following observations and conclusions:
Markets, Reliability and the Evolving U.S. Power System
Analysis Group 63
Fundamental market forces -- flat demand for electricity, low natural gas prices and the addition of highly efficient new gas-fired resources -- are primarily responsible for altering the profitability of many older, merchant generating assets in the parts of the country with wholesale competitive markets administered by RTOs. As a result, many such resources (mostly coal- and natural gas-fired generating units, but also many oil-fired power plants and a handful of nuclear power plants as well) have retired from the system or announced that they will do so at a future date.
Other factors -- such as rapid growth in advanced energy technologies and state policies supporting such technologies -- also contribute to reducing the profitability of less economic assets, but such factors are secondary to market fundamentals in causing financial pressure on merchant plants without long-term power contracts.
The retirement of aging resources is a natural element of efficient and competitive market forces, and where markets are performing well, these retirements mainly represent the efficient exit of uncompetitive assets, and will lead to lower electricity prices for consumers over time.
Recently, some observers have raised concerns that the transition prompted by market and policy factors may be undermining the financial viability of certain existing generating units that use conventional power plant technologies (like coal and nuclear power plants) that provide ‘baseload’ power supply, and in so doing, may be jeopardizing electric system reliability. There is no evidence supporting that conclusion. In fact many advanced energy technologies can and do provide reliability benefits by increasing the diversity of the system and by providing important reliability services to the grid. The addition of newer, technologically advanced, and more efficient natural gas and renewable technologies is rendering the power systems in this country more, rather than less, diverse. The evolving power system is tending to increase fuel diversity, technology diversity, size diversity, and geographic diversity of power supply. NERC's own analysis suggests that the trend in reliability performance is increasing rather than decreasing in all regions. Further, newer generating resources are contributing diverse reliability services, too: frequency and voltage management, ramping and load following capabilities, provision of contingency and replacement reserves, and black start capability. Given the many attributes associated with a reliable electric system, the term "baseload resources" is an outdated term in today’s electric system which sees gas-fired resources and renewable capacity together capable of providing both around-the-clock power and the flexibility to cycle and ramp as needed to meet and sustain bulk power system reliability objectives.
The electric system will inevitably continue to change in the future as it has in the past, as new technologies and investments come about through innovation, market forces, consumer preferences, and policy signals and directives from states and the federal government. As this occurs, it will be important to continuously evaluate the reliability implications of a power system that is transforming in truly fundamental ways. Fortunately, existing FERC, NERC,

Markets, Reliability and the Evolving U.S. Power System
Analysis Group 64
ISO/RTO, state, and utility planning and regulatory functions ensure that evaluation will occur and that reliability will be maintained.
Markets, Reliability and the Evolving U.S. Power System
Analysis Group 65
APPENDIX A: Reliability of the Bulk Power System
Overview
Given the critical importance of BPS reliability to the population and economy, multiple entities (see discussion of "reliability entities," below) are involved in a continuous review of current BPS conditions to ensure a very high degree of reliability in power supply and system operations, and regular evaluations of expected or emerging changes in the BPS, such as infrastructure additions and retirements, changing demand conditions, and evolving technologies. The latter point is important - the bulk power systems in the US are far from static networks; BPS reliability is and has always been maintained throughout numerous fundamental changes in the structure and infrastructure of the electric industry driven by costs, technological change, policies, or events, whether those changes were sudden, rapid, or occurred in more measured fashion, including by way of example:
• Large switches in the generating capacity and fuel of choice, from coal-fired generation in the middle of the last century, to nuclear generation in the 1970s and 1980s, to gas-fired generation at the turn of the century (see Figure 30);
• The growth of independent/merchant generation ownership starting with passage of the Public Utilities Regulatory Policy Act (PURPA), the creation of open transmission access in the 1990s, and more recently the emergence of merchant transmission ownership and operation;
• Nearly continuous significant changes in state and federal regulations and policies (1) reducing or addressing the impacts of power plant operation on the socio-economic and security risks of climate change, air and water quality, and solid waste production and disposal; and (2) establishing market-based policies to promote the development of emerging renewable resources and other advanced energy technologies (e.g., energy efficiency, demand response, and energy storage);
• The restructuring of the electric industry and companies, including functional separation of utility functions (i.e., breaking generation and grid operation apart from utility transmission and distribution functions), the sale/transfer of ownership of a large number of utility-owned generating plants to merchant power companies, and the switch in power system oversight and operation to independent power system operators, all across a geography covering a majority of the U.S. and Canada;
• The creation and ongoing evolution of wholesale markets for capacity, energy and ancillary services governing investment in and operation of a significant portion of the generation and transmission infrastructure in U.S. interconnected power systems;
• The incidence of, and in some cases recovery from, major electrical outages and/or disruptions in fuel supply (e.g., Hurricanes Katrina, Rita, Sandy, and the Polar Vortex (see discussion below)); and
• Incessant additions and retirements of power plant generating capacity and changing transmission network topology at local, state, regional and national levels.
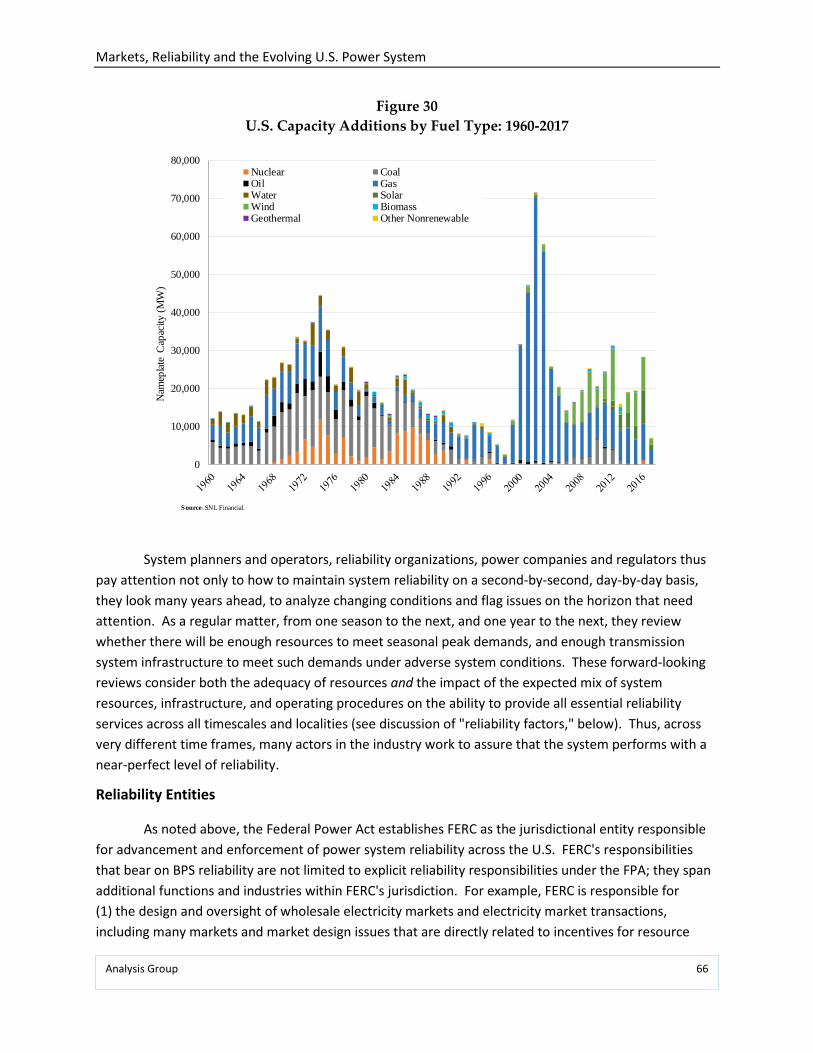
Markets, Reliability and the Evolving U.S. Power System
Analysis Group 66
Figure 30 U.S. Capacity Additions by Fuel Type: 1960-2017
System planners and operators, reliability organizations, power companies and regulators thus pay attention not only to how to maintain system reliability on a second-by-second, day-by-day basis, they look many years ahead, to analyze changing conditions and flag issues on the horizon that need attention. As a regular matter, from one season to the next, and one year to the next, they review whether there will be enough resources to meet seasonal peak demands, and enough transmission system infrastructure to meet such demands under adverse system conditions. These forward-looking reviews consider both the adequacy of resources and the impact of the expected mix of system resources, infrastructure, and operating procedures on the ability to provide all essential reliability services across all timescales and localities (see discussion of "reliability factors," below). Thus, across very different time frames, many actors in the industry work to assure that the system performs with a near-perfect level of reliability.
Reliability Entities
As noted above, the Federal Power Act establishes FERC as the jurisdictional entity responsible for advancement and enforcement of power system reliability across the U.S. FERC's responsibilities that bear on BPS reliability are not limited to explicit reliability responsibilities under the FPA; they span additional functions and industries within FERC's jurisdiction. For example, FERC is responsible for (1) the design and oversight of wholesale electricity markets and electricity market transactions, including many markets and market design issues that are directly related to incentives for resource
0
10,000
20,000
30,000
40,000
50,000
60,000
70,000
80,000N
amep
late
Cap
acity
(MW
)Nuclear CoalOil GasWater SolarWind BiomassGeothermal Other Nonrenewable
Source: SNL Financial.
Markets, Reliability and the Evolving U.S. Power System
Analysis Group 67
capabilities required to maintain reliability; (2) the planning for, cost allocation and tariff designs for, and fair and open access to the nation's transmission system that is the backbone of a reliable network; and (3) natural gas markets, development/siting and tariffs for interstate pipelines, and determination of the demonstration of need for new pipeline capacity, increasingly tied to the production of electricity. Each of these responsibilities entails decisions that affect power system reliability, and FERC always keeps reliability as a central focus in its deliberations of any decisions related to energy infrastructure development, siting, and/or cost allocation and recover.
Figure 31 describes and summarizes the reliability-related responsibilities of various entities with a role in evaluating and maintaining power system reliability. Specifically, the various regulators and policymakers, regulated utilities, system operators (at all levels) and electricity and natural gas market participants and stakeholders with a role in reliability include:
• FERC, with explicit and implicit responsibilities for ensuring power system reliability, requiring the development of reliability entities, rules, and procedures, and enforcement powers covering any and all entities whose interconnection or operations could affect power system reliability;
• A wide range of state and federal government agencies and regulators that evaluate and act to ensure reliability at the BPS and distribution system level;
• NERC, designated by FERC to be the nation's Electric Reliability Organization under the Federal Power Act, with FERC conferring by such designation the planning and operational aspects and day-to-day responsibilities with respect to ensuring power system reliability;
• Regional Reliability Organizations - such as regional reliability groups (e.g., the Northeast Power Coordinating Council (NPCC)), system operators such as the ISOs and RTOs, and balancing authorities that tend to be local, state, and regional utilities or groups of utilities that are the operators of portions of the bulk power system - who closely coordinate the operation of respective power systems to prevent cascading system failures and promote interregional reliability;
• Utilities, cooperatives, municipal electric light companies, and federal power authorities who tend to straddle the jurisdictional line between federally-regulated BPS operations and more local, state-regulated, distribution system reliability responsibilities;
• Entities - such as RTOs and ISOs - design and administer wholesale markets to provide financial incentives for developers and market participants to invest in and operate infrastructure that meets regions' reliability needs;
• Wholesale market participants and others that develop, invest in, own, and operate BPS infrastructure in a manner consistent with good utility practice, and subject to various contractual and legal requirements and obligations with respect to reliability planning and operations.
This network of entities ensures that reliability is continuously assessed and potential and actual reliability conditions or events are given the highest level of attention possible from entities whose responsibilities and expertise span multiple industries (gas and electric), multiple jurisdictions (state,

Markets, Reliability and the Evolving U.S. Power System
Analysis Group 68
regional, federal, and international), multiple responsibilities (generation, transmission, distribution, and production and transportation of gas as well as other fuels), and multiple market participant and stakeholder viewpoints.
These entities monitor system reliability using time-tested, well-developed industry analytic tools. For longer-term assessments, the standard methods take into consideration a vast array of potential future infrastructure scenarios and system operational contingencies (e.g., sudden loss of generation, transmission or load). Annually and seasonally, system operators and reliability planners conduct reliability assessments to evaluate system changes, flag areas of concern that need to be addressed within different time frames, and identify plans to address any reliability concerns that may arise over the planning period. In addition, special assessments are periodically carried out in response to any industry or policy changes that have the potential to affect system reliability.
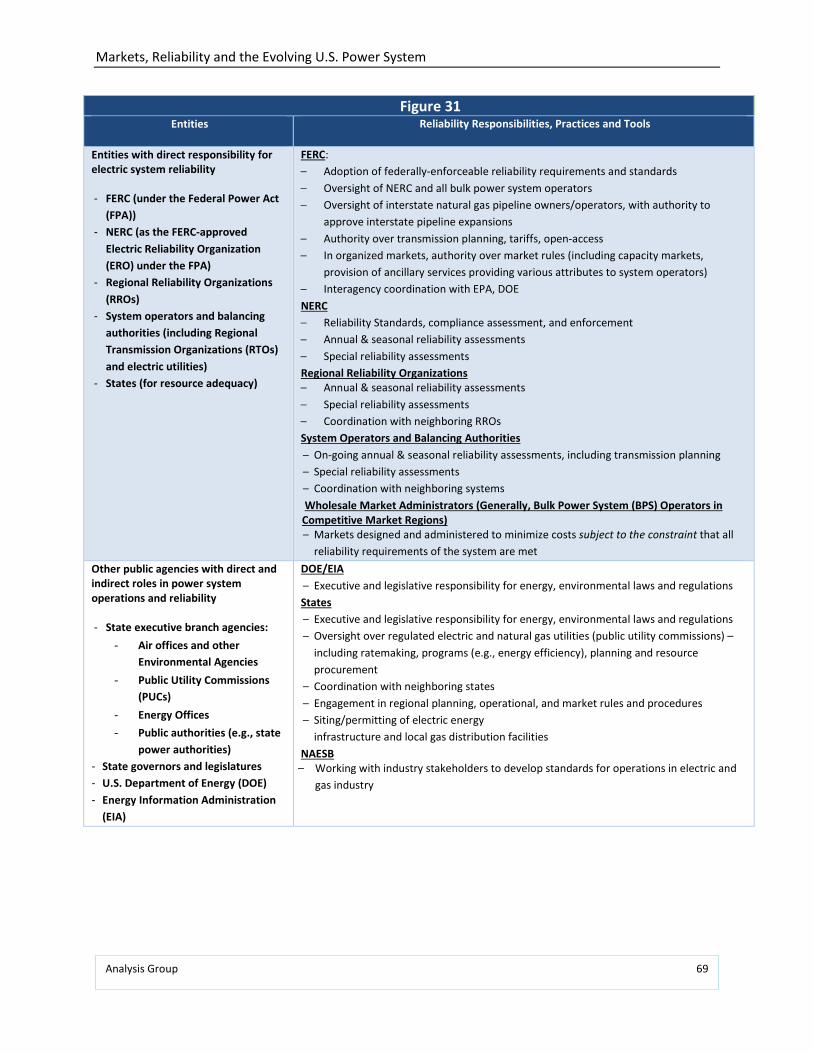
Markets, Reliability and the Evolving U.S. Power System
Analysis Group 69
Figure 31 Entities Reliability Responsibilities, Practices and Tools
Entities with direct responsibility for electric system reliability - FERC (under the Federal Power Act
(FPA)) - NERC (as the FERC-approved
Electric Reliability Organization (ERO) under the FPA)
- Regional Reliability Organizations (RROs)
- System operators and balancing authorities (including Regional Transmission Organizations (RTOs) and electric utilities)
- States (for resource adequacy)
FERC: − Adoption of federally-enforceable reliability requirements and standards − Oversight of NERC and all bulk power system operators − Oversight of interstate natural gas pipeline owners/operators, with authority to
approve interstate pipeline expansions − Authority over transmission planning, tariffs, open-access − In organized markets, authority over market rules (including capacity markets,
provision of ancillary services providing various attributes to system operators) − Interagency coordination with EPA, DOE NERC − Reliability Standards, compliance assessment, and enforcement − Annual & seasonal reliability assessments − Special reliability assessments Regional Reliability Organizations − Annual & seasonal reliability assessments − Special reliability assessments − Coordination with neighboring RROs System Operators and Balancing Authorities − On-going annual & seasonal reliability assessments, including transmission planning − Special reliability assessments − Coordination with neighboring systems Wholesale Market Administrators (Generally, Bulk Power System (BPS) Operators in Competitive Market Regions) − Markets designed and administered to minimize costs subject to the constraint that all
reliability requirements of the system are met Other public agencies with direct and indirect roles in power system operations and reliability
- State executive branch agencies:
- Air offices and other Environmental Agencies
- Public Utility Commissions (PUCs)
- Energy Offices - Public authorities (e.g., state
power authorities) - State governors and legislatures - U.S. Department of Energy (DOE) - Energy Information Administration
(EIA)
DOE/EIA − Executive and legislative responsibility for energy, environmental laws and regulations States − Executive and legislative responsibility for energy, environmental laws and regulations − Oversight over regulated electric and natural gas utilities (public utility commissions) –
including ratemaking, programs (e.g., energy efficiency), planning and resource procurement
− Coordination with neighboring states − Engagement in regional planning, operational, and market rules and procedures − Siting/permitting of electric energy
infrastructure and local gas distribution facilities NAESB − Working with industry stakeholders to develop standards for operations in electric and
gas industry
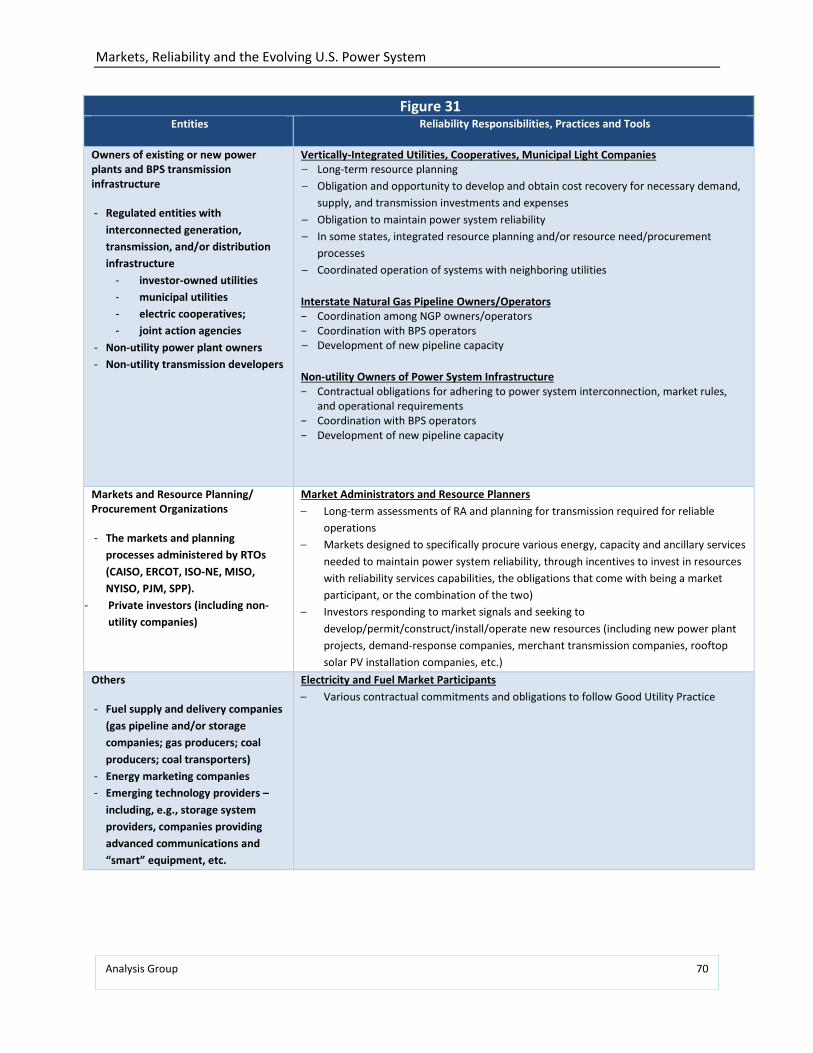
Markets, Reliability and the Evolving U.S. Power System
Analysis Group 70
Figure 31 Entities Reliability Responsibilities, Practices and Tools
Owners of existing or new power plants and BPS transmission infrastructure - Regulated entities with
interconnected generation, transmission, and/or distribution infrastructure
- investor-owned utilities - municipal utilities - electric cooperatives; - joint action agencies
- Non-utility power plant owners - Non-utility transmission developers
Vertically-Integrated Utilities, Cooperatives, Municipal Light Companies − Long-term resource planning − Obligation and opportunity to develop and obtain cost recovery for necessary demand,
supply, and transmission investments and expenses − Obligation to maintain power system reliability − In some states, integrated resource planning and/or resource need/procurement
processes − Coordinated operation of systems with neighboring utilities Interstate Natural Gas Pipeline Owners/Operators − Coordination among NGP owners/operators − Coordination with BPS operators − Development of new pipeline capacity Non-utility Owners of Power System Infrastructure − Contractual obligations for adhering to power system interconnection, market rules,
and operational requirements − Coordination with BPS operators − Development of new pipeline capacity
Markets and Resource Planning/ Procurement Organizations
- The markets and planning
processes administered by RTOs (CAISO, ERCOT, ISO-NE, MISO, NYISO, PJM, SPP).
- Private investors (including non-utility companies)
Market Administrators and Resource Planners − Long-term assessments of RA and planning for transmission required for reliable
operations − Markets designed to specifically procure various energy, capacity and ancillary services
needed to maintain power system reliability, through incentives to invest in resources with reliability services capabilities, the obligations that come with being a market participant, or the combination of the two)
− Investors responding to market signals and seeking to develop/permit/construct/install/operate new resources (including new power plant projects, demand-response companies, merchant transmission companies, rooftop solar PV installation companies, etc.)
Others - Fuel supply and delivery companies
(gas pipeline and/or storage companies; gas producers; coal producers; coal transporters)
- Energy marketing companies - Emerging technology providers –
including, e.g., storage system providers, companies providing advanced communications and “smart” equipment, etc.
Electricity and Fuel Market Participants − Various contractual commitments and obligations to follow Good Utility Practice
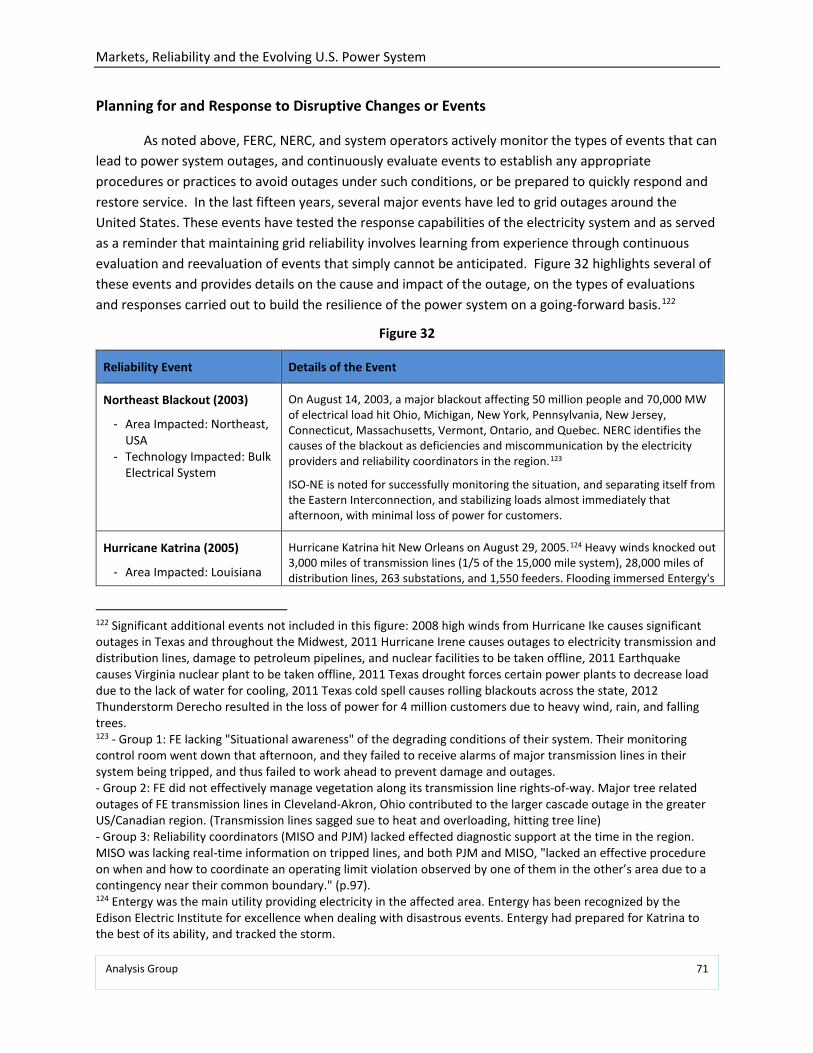
Markets, Reliability and the Evolving U.S. Power System
Analysis Group 71
Planning for and Response to Disruptive Changes or Events
As noted above, FERC, NERC, and system operators actively monitor the types of events that can lead to power system outages, and continuously evaluate events to establish any appropriate procedures or practices to avoid outages under such conditions, or be prepared to quickly respond and restore service. In the last fifteen years, several major events have led to grid outages around the United States. These events have tested the response capabilities of the electricity system and as served as a reminder that maintaining grid reliability involves learning from experience through continuous evaluation and reevaluation of events that simply cannot be anticipated. Figure 32 highlights several of these events and provides details on the cause and impact of the outage, on the types of evaluations and responses carried out to build the resilience of the power system on a going-forward basis.122
Figure 32
Reliability Event Details of the Event
Northeast Blackout (2003)
- Area Impacted: Northeast, USA
- Technology Impacted: Bulk Electrical System
On August 14, 2003, a major blackout affecting 50 million people and 70,000 MW of electrical load hit Ohio, Michigan, New York, Pennsylvania, New Jersey, Connecticut, Massachusetts, Vermont, Ontario, and Quebec. NERC identifies the causes of the blackout as deficiencies and miscommunication by the electricity providers and reliability coordinators in the region.123
ISO-NE is noted for successfully monitoring the situation, and separating itself from the Eastern Interconnection, and stabilizing loads almost immediately that afternoon, with minimal loss of power for customers.
Hurricane Katrina (2005)
- Area Impacted: Louisiana
Hurricane Katrina hit New Orleans on August 29, 2005.124 Heavy winds knocked out 3,000 miles of transmission lines (1/5 of the 15,000 mile system), 28,000 miles of distribution lines, 263 substations, and 1,550 feeders. Flooding immersed Entergy's
122 Significant additional events not included in this figure: 2008 high winds from Hurricane Ike causes significant outages in Texas and throughout the Midwest, 2011 Hurricane Irene causes outages to electricity transmission and distribution lines, damage to petroleum pipelines, and nuclear facilities to be taken offline, 2011 Earthquake causes Virginia nuclear plant to be taken offline, 2011 Texas drought forces certain power plants to decrease load due to the lack of water for cooling, 2011 Texas cold spell causes rolling blackouts across the state, 2012 Thunderstorm Derecho resulted in the loss of power for 4 million customers due to heavy wind, rain, and falling trees. 123 - Group 1: FE lacking "Situational awareness" of the degrading conditions of their system. Their monitoring control room went down that afternoon, and they failed to receive alarms of major transmission lines in their system being tripped, and thus failed to work ahead to prevent damage and outages. - Group 2: FE did not effectively manage vegetation along its transmission line rights-of-way. Major tree related outages of FE transmission lines in Cleveland-Akron, Ohio contributed to the larger cascade outage in the greater US/Canadian region. (Transmission lines sagged sue to heat and overloading, hitting tree line) - Group 3: Reliability coordinators (MISO and PJM) lacked effected diagnostic support at the time in the region. MISO was lacking real-time information on tripped lines, and both PJM and MISO, "lacked an effective procedure on when and how to coordinate an operating limit violation observed by one of them in the other’s area due to a contingency near their common boundary." (p.97). 124 Entergy was the main utility providing electricity in the affected area. Entergy has been recognized by the Edison Electric Institute for excellence when dealing with disastrous events. Entergy had prepared for Katrina to the best of its ability, and tracked the storm.
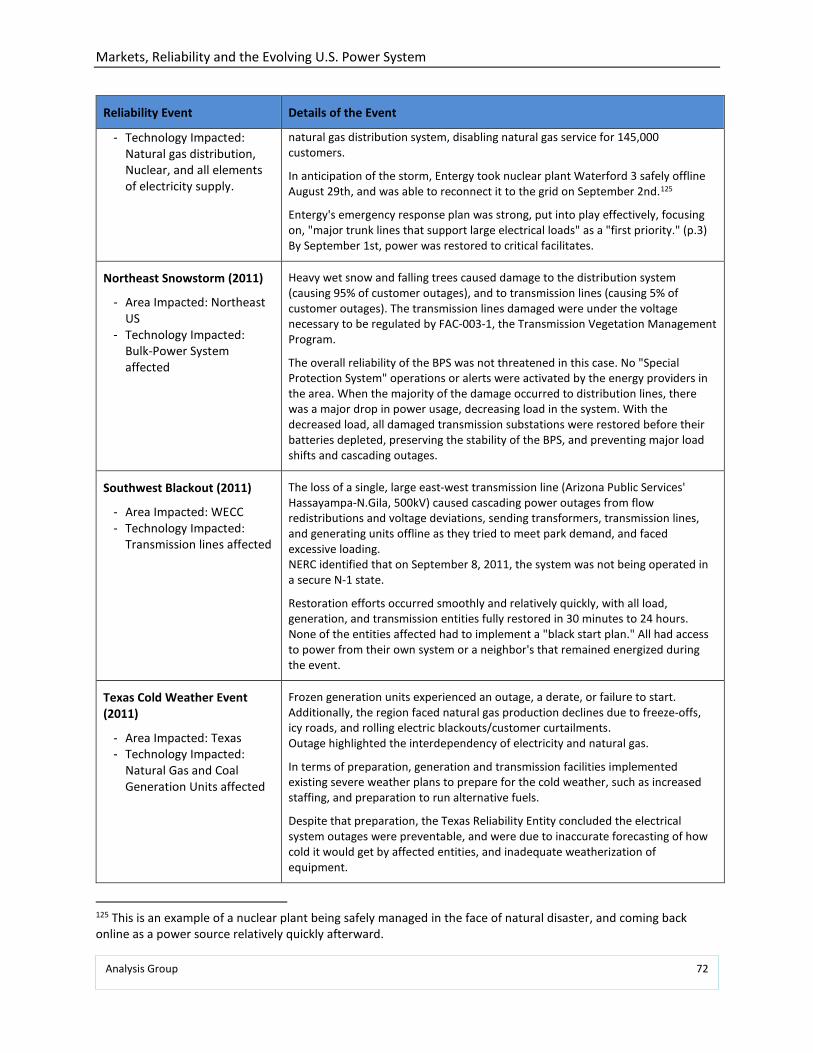
Markets, Reliability and the Evolving U.S. Power System
Analysis Group 72
Reliability Event Details of the Event
- Technology Impacted: Natural gas distribution, Nuclear, and all elements of electricity supply.
natural gas distribution system, disabling natural gas service for 145,000 customers.
In anticipation of the storm, Entergy took nuclear plant Waterford 3 safely offline August 29th, and was able to reconnect it to the grid on September 2nd.125
Entergy's emergency response plan was strong, put into play effectively, focusing on, "major trunk lines that support large electrical loads" as a "first priority." (p.3) By September 1st, power was restored to critical facilitates.
Northeast Snowstorm (2011)
- Area Impacted: Northeast US
- Technology Impacted: Bulk-Power System affected
Heavy wet snow and falling trees caused damage to the distribution system (causing 95% of customer outages), and to transmission lines (causing 5% of customer outages). The transmission lines damaged were under the voltage necessary to be regulated by FAC-003-1, the Transmission Vegetation Management Program.
The overall reliability of the BPS was not threatened in this case. No "Special Protection System" operations or alerts were activated by the energy providers in the area. When the majority of the damage occurred to distribution lines, there was a major drop in power usage, decreasing load in the system. With the decreased load, all damaged transmission substations were restored before their batteries depleted, preserving the stability of the BPS, and preventing major load shifts and cascading outages.
Southwest Blackout (2011)
- Area Impacted: WECC - Technology Impacted:
Transmission lines affected
The loss of a single, large east-west transmission line (Arizona Public Services' Hassayampa-N.Gila, 500kV) caused cascading power outages from flow redistributions and voltage deviations, sending transformers, transmission lines, and generating units offline as they tried to meet park demand, and faced excessive loading. NERC identified that on September 8, 2011, the system was not being operated in a secure N-1 state.
Restoration efforts occurred smoothly and relatively quickly, with all load, generation, and transmission entities fully restored in 30 minutes to 24 hours. None of the entities affected had to implement a "black start plan." All had access to power from their own system or a neighbor's that remained energized during the event.
Texas Cold Weather Event (2011)
- Area Impacted: Texas - Technology Impacted:
Natural Gas and Coal Generation Units affected
Frozen generation units experienced an outage, a derate, or failure to start. Additionally, the region faced natural gas production declines due to freeze-offs, icy roads, and rolling electric blackouts/customer curtailments. Outage highlighted the interdependency of electricity and natural gas.
In terms of preparation, generation and transmission facilities implemented existing severe weather plans to prepare for the cold weather, such as increased staffing, and preparation to run alternative fuels.
Despite that preparation, the Texas Reliability Entity concluded the electrical system outages were preventable, and were due to inaccurate forecasting of how cold it would get by affected entities, and inadequate weatherization of equipment.
125 This is an example of a nuclear plant being safely managed in the face of natural disaster, and coming back online as a power source relatively quickly afterward.
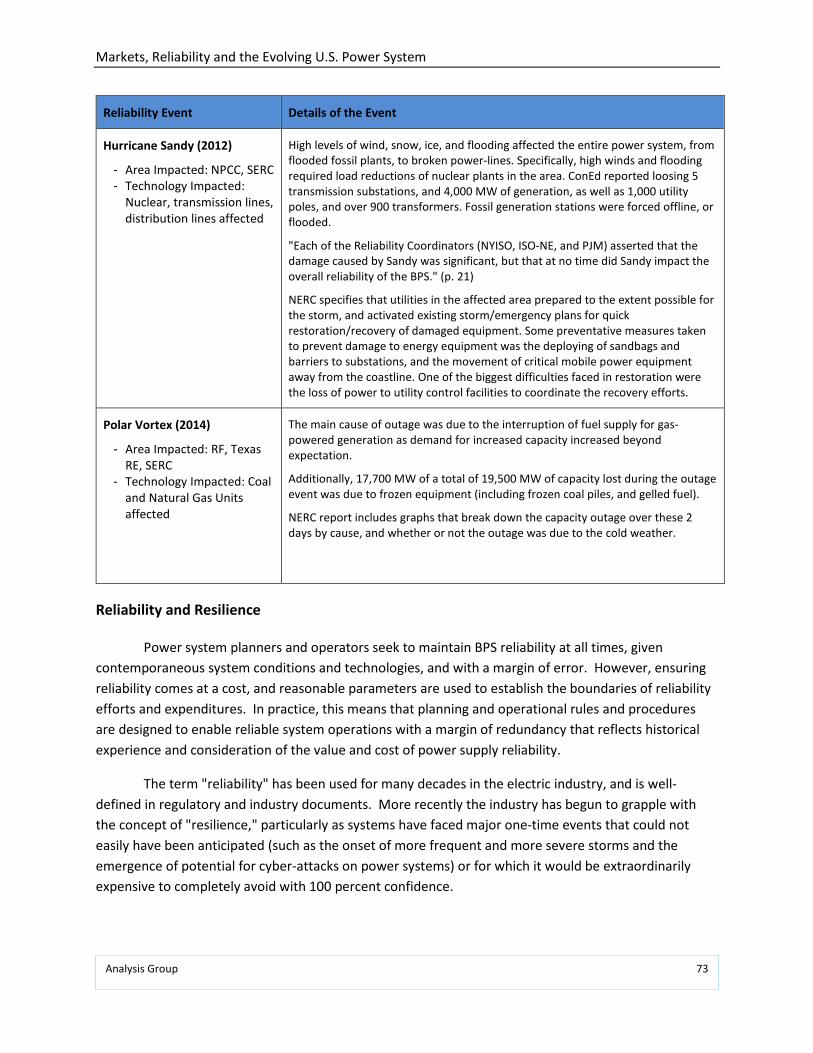
Markets, Reliability and the Evolving U.S. Power System
Analysis Group 73
Reliability Event Details of the Event
Hurricane Sandy (2012)
- Area Impacted: NPCC, SERC - Technology Impacted:
Nuclear, transmission lines, distribution lines affected
High levels of wind, snow, ice, and flooding affected the entire power system, from flooded fossil plants, to broken power-lines. Specifically, high winds and flooding required load reductions of nuclear plants in the area. ConEd reported loosing 5 transmission substations, and 4,000 MW of generation, as well as 1,000 utility poles, and over 900 transformers. Fossil generation stations were forced offline, or flooded.
"Each of the Reliability Coordinators (NYISO, ISO-NE, and PJM) asserted that the damage caused by Sandy was significant, but that at no time did Sandy impact the overall reliability of the BPS." (p. 21)
NERC specifies that utilities in the affected area prepared to the extent possible for the storm, and activated existing storm/emergency plans for quick restoration/recovery of damaged equipment. Some preventative measures taken to prevent damage to energy equipment was the deploying of sandbags and barriers to substations, and the movement of critical mobile power equipment away from the coastline. One of the biggest difficulties faced in restoration were the loss of power to utility control facilities to coordinate the recovery efforts.
Polar Vortex (2014)
- Area Impacted: RF, Texas RE, SERC
- Technology Impacted: Coal and Natural Gas Units affected
The main cause of outage was due to the interruption of fuel supply for gas-powered generation as demand for increased capacity increased beyond expectation.
Additionally, 17,700 MW of a total of 19,500 MW of capacity lost during the outage event was due to frozen equipment (including frozen coal piles, and gelled fuel).
NERC report includes graphs that break down the capacity outage over these 2 days by cause, and whether or not the outage was due to the cold weather.
Reliability and Resilience
Power system planners and operators seek to maintain BPS reliability at all times, given contemporaneous system conditions and technologies, and with a margin of error. However, ensuring reliability comes at a cost, and reasonable parameters are used to establish the boundaries of reliability efforts and expenditures. In practice, this means that planning and operational rules and procedures are designed to enable reliable system operations with a margin of redundancy that reflects historical experience and consideration of the value and cost of power supply reliability.
The term "reliability" has been used for many decades in the electric industry, and is well-defined in regulatory and industry documents. More recently the industry has begun to grapple with the concept of "resilience," particularly as systems have faced major one-time events that could not easily have been anticipated (such as the onset of more frequent and more severe storms and the emergence of potential for cyber-attacks on power systems) or for which it would be extraordinarily expensive to completely avoid with 100 percent confidence.
Markets, Reliability and the Evolving U.S. Power System
Analysis Group 74
There are a number of similarities between "reliable" and "resilient" in the BPS context. The National Infrastructure Advisory Council (NIAC) has defined resilience in the context of “Resilience Infrastructure” in the following way: “…resilience is the ability to reduce the magnitude and/or duration of disruptive events. The effectiveness of a resilient infrastructure or enterprise depends upon its ability to anticipate, absorb, adapt to, and/or rapidly recover from a potentially disruptive event.” Thus, while a reliable power system is one that maintains service on a continuous basis with a sufficient margin to manage anticipated contingencies, the concept of "resilience" is more focused on the ability of the system to absorb and/or quickly recover from major one-time events beyond what may be typically planned for in BPS reliability planning and operations.
NIAC amplifies its definition of resilience with four elements that together make up a resilient system:
(1) Robustness—The ability to keep operating or to stay standing in the face of disaster. In some cases, it translates into designing structures or systems to be strong enough to take a foreseeable punch. In others, robustness requires devising substitute or redundant systems that can be brought to bear should something important break or stop working. Robustness also entails investing in and maintaining elements of critical infrastructure so that they can withstand low-probability but high-consequence events.
(2) Resourcefulness—The ability to skillfully manage a disaster as it unfolds. It includes identifying options, prioritizing what should be done both to control damage and to begin mitigating it, and communicating decisions to the people who will implement them. Resourcefulness depends primarily on people, not technology.
(3) Rapid recovery—The capacity to get things back to normal as quickly as possible after a disaster. Carefully drafted contingency plans, competent emergency operations, and the means to get the right people and resources to the right places are crucial.
(4) Adaptability—The means to absorb new lessons that can be drawn from a catastrophe. It involves revising plans, modifying procedures, and introducing new tools and technologies needed to improve robustness, resourcefulness, and recovery capabilities before the next crisis.126
As noted above, NERC has identified six characteristics of a reliable electric system that incorporate many of the concepts that NIAC has built into its description of resilience (including, e.g., performance after contingencies, containment of outages, prompt restoration, and anticipating unscheduled outages). A reliable power system, however, may or may not possess all of the capabilities needed to also be deemed resilient. For example, the degree of robustness established through BPS planning and operations is generally well defined and not necessarily focused on the one-time, extreme events that are the focus of resilience; instead, they are based on probabilistic modeling of expected
126 National Infrastructure Advisory Council, A Framework for Establishing Critical Infrastructure Resilience Goals: Final Report and Recommendations by the Council, October 19, 2010. https://www.dhs.gov/xlibrary/assets/niac/niac-a-framework-for-establishing-critical-infrastructure-resilience-goals-2010-10-19.pdf.

Markets, Reliability and the Evolving U.S. Power System
Analysis Group 75
loads and unit outage rates, and specific contingencies involving the sudden loss of the largest one to two generating units.
Nevertheless, BPS reliability objectives are in line with many of the elements of resilience - power system operators are resourceful in the sense that the individuals planning for and operating BPS are highly skilled, and operations and procedures under stressed or emergency system conditions are not only required, but are comprehensive, documented, and well understood.127 Further, operating procedures contain specific, detailed and documented procedures for rapid recovery of electricity service under adverse conditions, or following a major loss event. Finally, adaptability is a specific focus of BPS reliability operations, planning and coordination. As described below, FERC, NERC, states, regional reliability organizations and utilities all continuously evaluate emerging trends and technologies for reliability implications, comprehensively study the root causes of major reliability events, seek and incorporate technological and/or operational solutions to reliability challenges, and ensure that best-practice reliability operations or experience in one region are quickly disseminated for learning and adoption in other regions.
Given the critical importance of reliability for public health, safety and economic growth, and given the many-decades worth of experience in achieving and maintaining power system reliability under adverse conditions and major events, "resilience" is already to a large degree an implicit if not explicit objective of BPS planning and operations. The potential difference is in the degree to which reliability standards and practices sufficiently protect against or prepare for severe climatic events, and cyber security or other intentional threats to the power system.
127 NERC requires all RROs to have emergency procedures in place (see NERC Emergency Preparedness and Operations (EOP) Standards). In order to comply with NERC standards ISO-NE, for example, has documented procedures for different emergency situations including Operating Procedure No. 4 - Operation During A Capacity Deficiency and Operating Procedure No. 7 - Action in an Emergency.
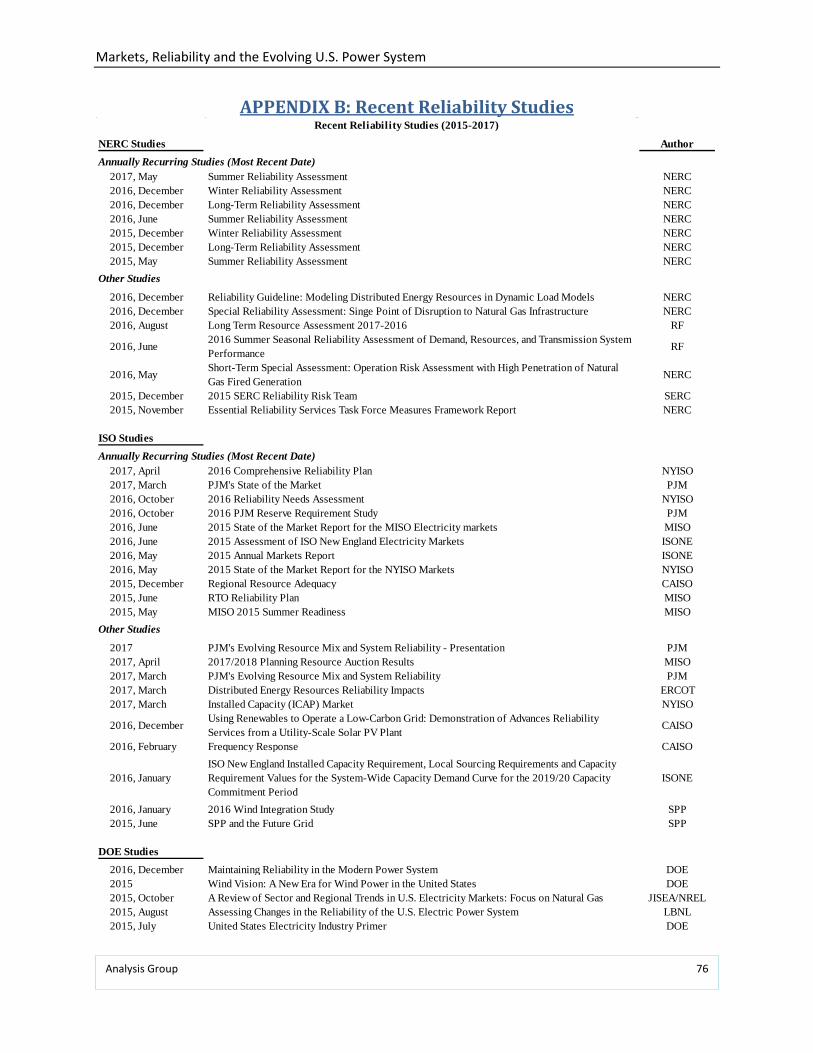
Markets, Reliability and the Evolving U.S. Power System
Analysis Group 76
APPENDIX B: Recent Reliability Studies
NERC Studies AuthorAnnually Recurring Studies (Most Recent Date)
2017, May Summer Reliability Assessment NERC2016, December Winter Reliability Assessment NERC2016, December Long-Term Reliability Assessment NERC2016, June Summer Reliability Assessment NERC2015, December Winter Reliability Assessment NERC2015, December Long-Term Reliability Assessment NERC2015, May Summer Reliability Assessment NERC
Other Studies
2016, December Reliability Guideline: Modeling Distributed Energy Resources in Dynamic Load Models NERC2016, December Special Reliability Assessment: Singe Point of Disruption to Natural Gas Infrastructure NERC2016, August Long Term Resource Assessment 2017-2016 RF
2016, June 2016 Summer Seasonal Reliability Assessment of Demand, Resources, and Transmission System Performance RF
2016, May Short-Term Special Assessment: Operation Risk Assessment with High Penetration of Natural Gas Fired Generation NERC
2015, December 2015 SERC Reliability Risk Team SERC2015, November Essential Reliability Services Task Force Measures Framework Report NERC
ISO StudiesAnnually Recurring Studies (Most Recent Date)
2017, April 2016 Comprehensive Reliability Plan NYISO2017, March PJM's State of the Market PJM2016, October 2016 Reliability Needs Assessment NYISO2016, October 2016 PJM Reserve Requirement Study PJM2016, June 2015 State of the Market Report for the MISO Electricity markets MISO2016, June 2015 Assessment of ISO New England Electricity Markets ISONE2016, May 2015 Annual Markets Report ISONE2016, May 2015 State of the Market Report for the NYISO Markets NYISO2015, December Regional Resource Adequacy CAISO2015, June RTO Reliability Plan MISO2015, May MISO 2015 Summer Readiness MISO
Other Studies
2017 PJM's Evolving Resource Mix and System Reliability - Presentation PJM2017, April 2017/2018 Planning Resource Auction Results MISO2017, March PJM's Evolving Resource Mix and System Reliability PJM2017, March Distributed Energy Resources Reliability Impacts ERCOT2017, March Installed Capacity (ICAP) Market NYISO
2016, December Using Renewables to Operate a Low-Carbon Grid: Demonstration of Advances Reliability Services from a Utility-Scale Solar PV Plant CAISO
2016, February Frequency Response CAISO
2016, JanuaryISO New England Installed Capacity Requirement, Local Sourcing Requirements and Capacity Requirement Values for the System-Wide Capacity Demand Curve for the 2019/20 Capacity Commitment Period
ISONE
2016, January 2016 Wind Integration Study SPP2015, June SPP and the Future Grid SPP
DOE Studies2016, December Maintaining Reliability in the Modern Power System DOE2015 Wind Vision: A New Era for Wind Power in the United States DOE2015, October A Review of Sector and Regional Trends in U.S. Electricity Markets: Focus on Natural Gas JISEA/NREL2015, August Assessing Changes in the Reliability of the U.S. Electric Power System LBNL2015, July United States Electricity Industry Primer DOE
Recent Reliability Studies (2015-2017)


