LBNL-47043 Reliability of the U.S. Electricity System: Recent Trends and Current Issues Prepared for the Assistant Secretary for Energy Efficiency and Renewable Energy U.S. Department of Energy Principal Authors Julie Osborn and Cornelia Kawann Energy Analysis Department Environmental Energy Technologies Division Ernest Orlando Lawrence Berkeley National Laboratory University of California Berkeley CA 94720 http://eetd.lbl.gov/EA/EMP/emppubs.html August 2001 The work described in this paper was funded by the Deputy Assistant Secretary of Energy Efficiency and Renewable Energy, Office of Building Technology, State and Community Programs, Office of Building Research and Standards, of the U. S. Department of Energy under Contract No. DE-AC03-76SF00098.
Transcript
LBNL-47043
Reliability of the U.S. Electricity System: Recent Trends and Current Issues
Prepared for the Assistant Secretary for Energy Efficiency and Renewable Energy
U.S. Department of Energy
Principal Authors
Julie Osborn and Cornelia Kawann
Energy Analysis Department Environmental Energy Technologies Division
Ernest Orlando Lawrence Berkeley National Laboratory University of California
Berkeley CA 94720
http://eetd.lbl.gov/EA/EMP/emppubs.html
August 2001
The work described in this paper was funded by the Deputy Assistant Secretary of Energy Efficiency and Renewable Energy, Office of Building Technology, State and Community Programs, Office of Building Research and Standards, of the U. S. Department of Energy under Contract No. DE-AC03-76SF00098.
Reliability of the U.S. Electricity System: Recent Trends and Current Issues
ii
Reliability of the U.S. Electricity System: Recent Trends and Current Issues
iii
Preface The work conducted for this report was made possible through DOE funding of the E.O. Lawrence Berkeley National Laboratory (LBNL). We are grateful to Joe Eto, Jon Koomey, Chris Marnay, and Greg Rosenquist for their thoughtful comments and discussions about this report. This work was supported by the Assistant Secretary of Energy Efficiency and Renewable Energy, Office of Buildings Research and Standards of the U.S. Department of Energy under Contract No. DE-AC04-94AL85000.
Reliability of the U.S. Electricity System: Recent Trends and Current Issues
iv
Reliability of the U.S. Electricity System: Recent Trends and Current Issues
2.1.1 Reliability................................................................................................................ 2 2.1.2 Disturbances and Outages ....................................................................................... 2 2.1.3 Disturbance Terms .................................................................................................. 3 2.1.4 Relationship Between Reliability and Power Quality............................................. 3
2.2 Reliability Indices ........................................................................................................... 5 2.3 Bulk-Power System Components.................................................................................... 7
3.2 Deregulation and Competitive Electricity Markets....................................................... 16 3.2.1 Lack of Investment in Upgrades and Maintenance............................................... 17 3.2.2 Exercise of Market Power by Generators ............................................................. 20 3.2.3 Volatile Prices ....................................................................................................... 21 3.2.4 Congestion............................................................................................................. 22
3.3 Disturbance History....................................................................................................... 23 3.3.1 NERC's Disturbance Analysis Working Group .................................................... 23 3.3.2 Distribution System Outages................................................................................. 26
Appendix A: Ancillary Services and Imbalance Energy ............................................................. 43
Appendix B: Flexible AC Transmission Systems........................................................................ 44
Reliability of the U.S. Electricity System: Recent Trends and Current Issues
vii
List of Figures and Tables Figure 1. Map of NERC Regional Reliability Councils (NERC 2001a) ........................................ 9 Figure 2. U.S. Annual Utility Electricity Consumption, 1984 to 1999 (EIA 1999) ..................... 12 Figure 3. U.S. Annual Utility Electricity Generation, 1984 to 1998 (EIA 1999) ......................... 12 Figure 4. Difference Between Annual U.S. Utility Electricity Generation and Consumption, 1984
to 1998 (EIA 1999).......................................................................................................... 13 Figure 5. Planned Net Internal Demand for the Years 2000 to 2009 (EIA 1999) ...................... 15 Figure 6. Planned Capacity Resources for the Years 2000 to 2009 (EIA 1999).......................... 15 Figure 7. Difference Between Net Internal Demand and Planned Capacity Resources for the
Years (EIA 1999)............................................................................................................. 16 Figure 8. Annual Transmission Investments by Investor-Owned Utilities from 1975 through
1998 (Hirst 2000)............................................................................................................. 17 Figure 9. Total U.S. Transmission Capacity Normalized by Summer Peak Demand for Each of
the 10 Regional Reliability Councils (Hirst 2000) .......................................................... 18 Figure 10. Existing and Planned Network Expansion for the Years 2000 to 2008 for Lines Rated
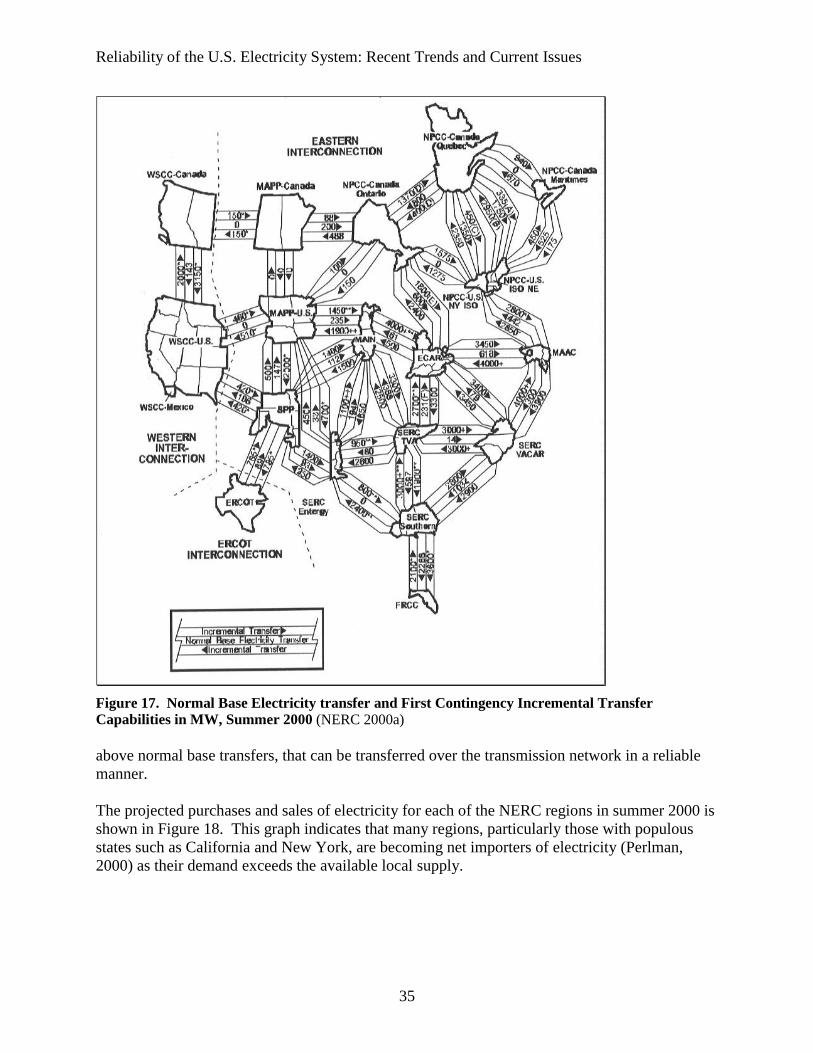
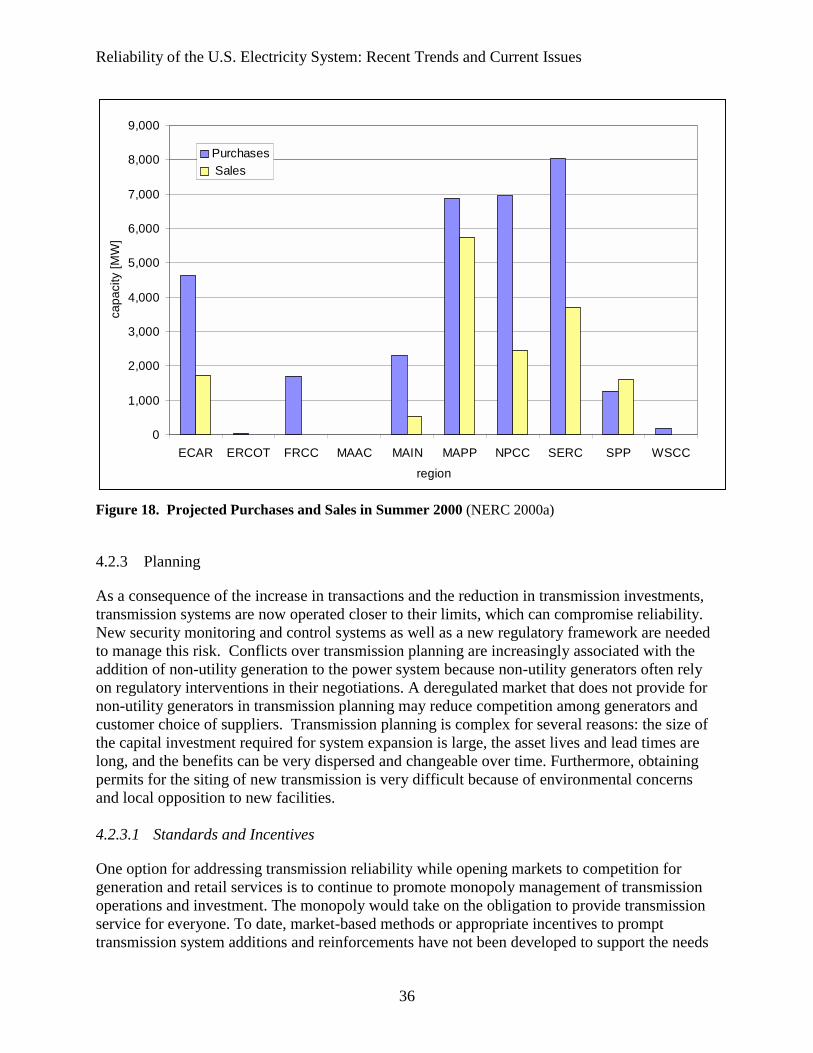
230 kV and above (NERC 2000a) ................................................................................... 18 Figure 11. Capacity Margin, Summer 2000. (NERC 2000a)........................................................ 19 Figure 12. Summer Peak Demand Versus Operable Capacity, Summer 2000 (NERC 2000a).... 20 Figure 13. CAISO PX Day-Ahead Unconstrained Market Price. (April 1998 – July 2000) ....... 21 Figure 14. Frequency of U.S. Transmission Disturbances, 1984 to 1999 (DAWG 2000) ........... 25 Figure 15. Frequency of U.S. Transmission Interruptions, 1984 to 1999 (DAWG 2000)............ 25 Figure 16. Interruptible Demand, Summer 2000 (NERC 2000a) ................................................. 31 Figure 17. Normal Base Electricity transfer and First Contingency Incremental Transfer
Capabilities in MW, Summer 2000 (NERC 2000a) ........................................................ 35 Figure 18. Projected Purchases and Sales in Summer 2000 (NERC 2000a) ................................ 36 Table 1. Reserve Capacity Margins Projected by NEMS, 2000 to 2020 (NEMS 1999) ............. 14 Table 2. Causes of Transmission System Disturbance Events……………………….……….….24 Table 3. Percentage of Customer Outage Hours (SAIDI) and Events (SAIFI) that Have Resulted
from PG&E Transmission Losses 1990 to 1999 ............................................................. 26 Table 4. Ways to Improve Electricity System Reliability............................................................ 27
Reliability of the U.S. Electricity System: Recent Trends and Current Issues
viii
Reliability of the U.S. Electricity System: Recent Trends and Current Issues
ix
List of Acronyms
AC Alternating Current A/C Air Conditioning AS Ancillary Services ASCC Alaska Systems Coordinating Council ATC Available Transmission Capacity CAIDI Customer Average Interruption Duration Index CAIFI Customer Average Interruption Frequency Index CAISO California Independent System Operator CPUC California Public Utility Commission DAWG Disturbance Analysis Working Group DC Direct Current DG Distributed Generation DOE Department of Energy DSM Demand-Side Management EIA Energy Information Administration ECAR East Central Area Reliability EMF Electro Magnetic Field ERCOT Electric Reliability Council of Texas FACTS Flexible Alternating Current Transmission System FCITC First Contingency Incremental Transfer Capability FERC Federal Energy Regulatory Commission FRCC Florida Reliability Coordinating Council G&T Generation and Transmission HV High Voltage IEEE Institute of Electrical and Electronics Engineers LOLE Loss of Load Expectation MAAC Mid-Atlantic Area Council MAIN Mid-America Interconnected MAPP Mid-Continent Area Power Pool NAERO North American Electric Reliability Organization NEMS National Energy Modeling System NERC North American Electric Reliability Council NGC National Grid Company NPCC Northeast Power Coordinating Council NVE Norwegian Water Resources and Energy Directorate OASIS Open Access Same-time Information System PBR Performance-Based Rate making PG&E Pacific Gas and Electric POST Power Outage Study Team PTO Participating Transmission Operator PV Photovoltaic PX Power Exchange RTO Regional Transmission Organizations RUS Rural Utility Service
Reliability of the U.S. Electricity System: Recent Trends and Current Issues
x
SAIDI System Average Interruption Duration Index SAIFI System Average Interruption Frequency Index SC Scheduling Coordinator SCADA Supervisory Control and Data Acquisition SERC Southeastern Electric Reliability Council SPP Southwest Power Pool TO Transmission Operator UPS Uninterruptible Power Supply VAR Volt-Amperes-Reactive WSCC Western Systems Coordinating Council
Reliability of the U.S. Electricity System: Recent Trends and Current Issues
xi
Executive Summary
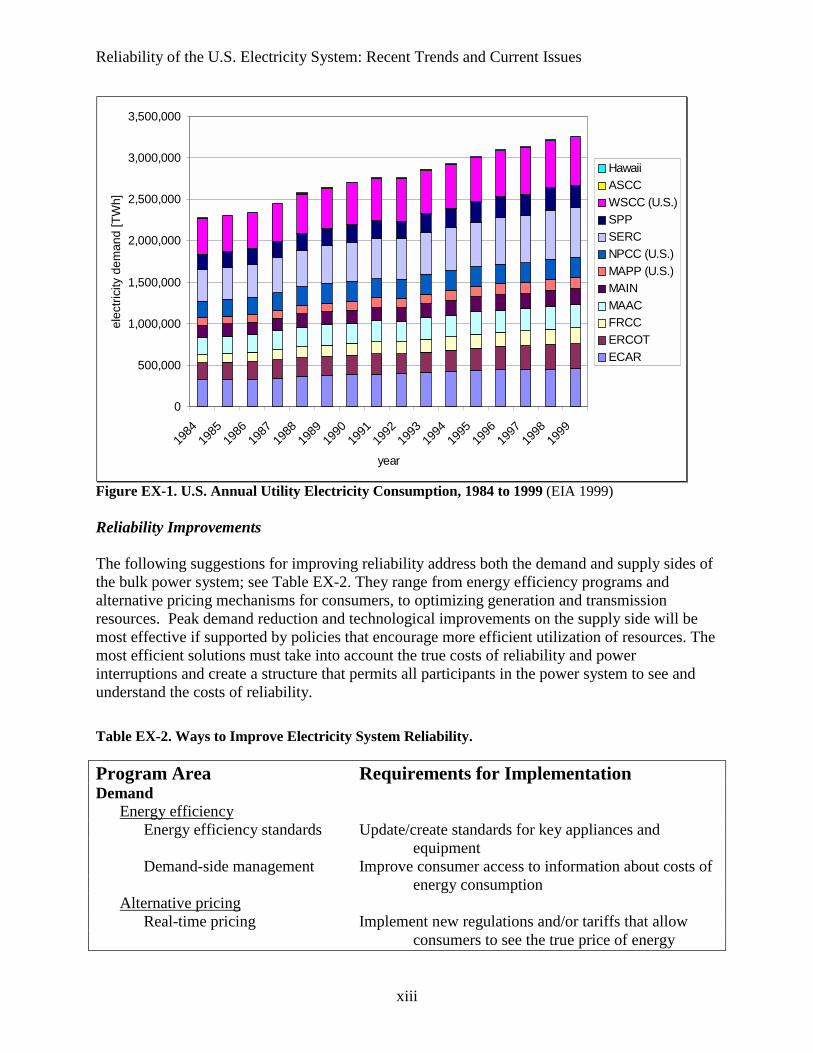
During the past several years, demand for electric power has been increasing at the same time that electricity supply margins have been decreasing, and generators, operators, and consumers have faced new and uncertain regulatory and market structures for the bulk power system. As the recent situation in California has underscored, proactive measures must be taken to ensure appropriate system reliability. This work is an introduction to reliability issues for analysts in the energy efficiency area with a focus on the role of electricity demand and means for modifying demand to improve reliability. It starts with background material on the fundamentals of electricity reliability, and it then discusses factors that affect reliability, and also offers possible means to improve reliability. This study was funded by the Office of Building Research and Standards and, therefore, its focus tends to be on the role of efficiency standards in reliability. Fundamentals of Reliability Reliability can be defined as the ability of the power system components to deliver electricity to all points of consumption, in the quantity and with the quality demanded by the customer. Reliability is often measured by outage indices defined by the Institute of Electrical and Electronics Engineers (IEEE) Standard 1366. These indices relate to customer satisfaction, and are based on both the total length of each service interruption and the frequency of interruptions. All components of the bulk power system, including generation, transmission, and distribution, contribute to reliability. The North American Electric Reliability Council (NERC), which currently monitors reliability, is comprised of 12 geographic subgroups of electric utilities and offers voluntary reliability standards for the North American transmission system. With the continued growth of electricity competition and the structural changes taking place in the industry, a new organization, called the North American Electric Reliability Organization (NAERO), is expected to develop, promote, and potentially enforce standards for reliability. Affects on Reliability Demand growth, coupled with a shrinking reserve margin, is at the heart of reliability concerns. The National Energy Modeling System (NEMS), the forecasting tool used by the U.S. Department of Energy to produce its Annual Energy Outlook, projects that reserve margins will decrease in most NERC regions over the next 20 years. The NEMS projection is shown in Table EX-1. Consumption, on the other hand, has been increasing steadily over time, at an average of 2.4 percent/a since 1984, as shown in Figure EX-1. During the past three years, demand growth has actually slowed to 1.8 percent/a despite the significant economic growth experienced during the same time period. This means that energy consumption per dollar of gross domestic product has actually been decreasing. Although the economy may be becoming more energy efficient, further economic and population growth will continue to drive power demand and may compromise power system reliability unless appropriate measures are taken. The slow trend towards deregulation and competition in electricity markets will also affect reliability because of a number of factors, among which are the recent lack of investment in transmission upgrades and maintenance, exercise of market power by generators, volatility in electricity prices, and transmission congestion.
Reliability of the U.S. Electricity System: Recent Trends and Current Issues
xii
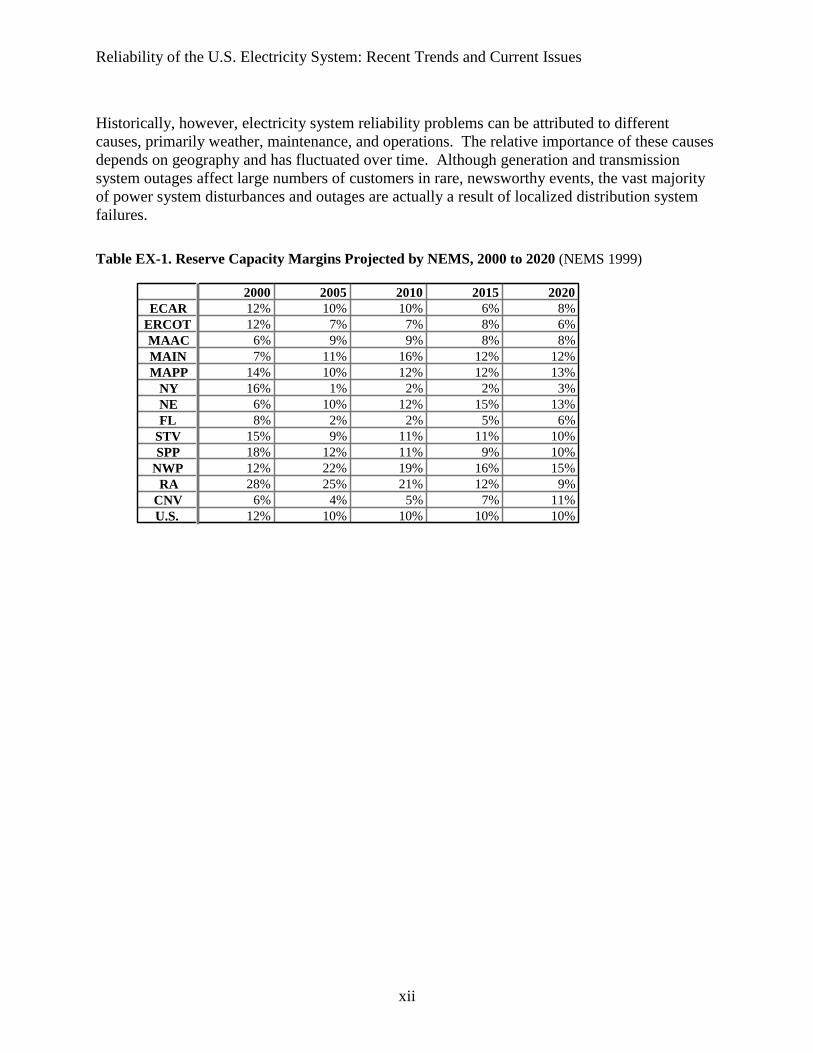
Historically, however, electricity system reliability problems can be attributed to different causes, primarily weather, maintenance, and operations. The relative importance of these causes depends on geography and has fluctuated over time. Although generation and transmission system outages affect large numbers of customers in rare, newsworthy events, the vast majority of power system disturbances and outages are actually a result of localized distribution system failures. Table EX-1. Reserve Capacity Margins Projected by NEMS, 2000 to 2020 (NEMS 1999)
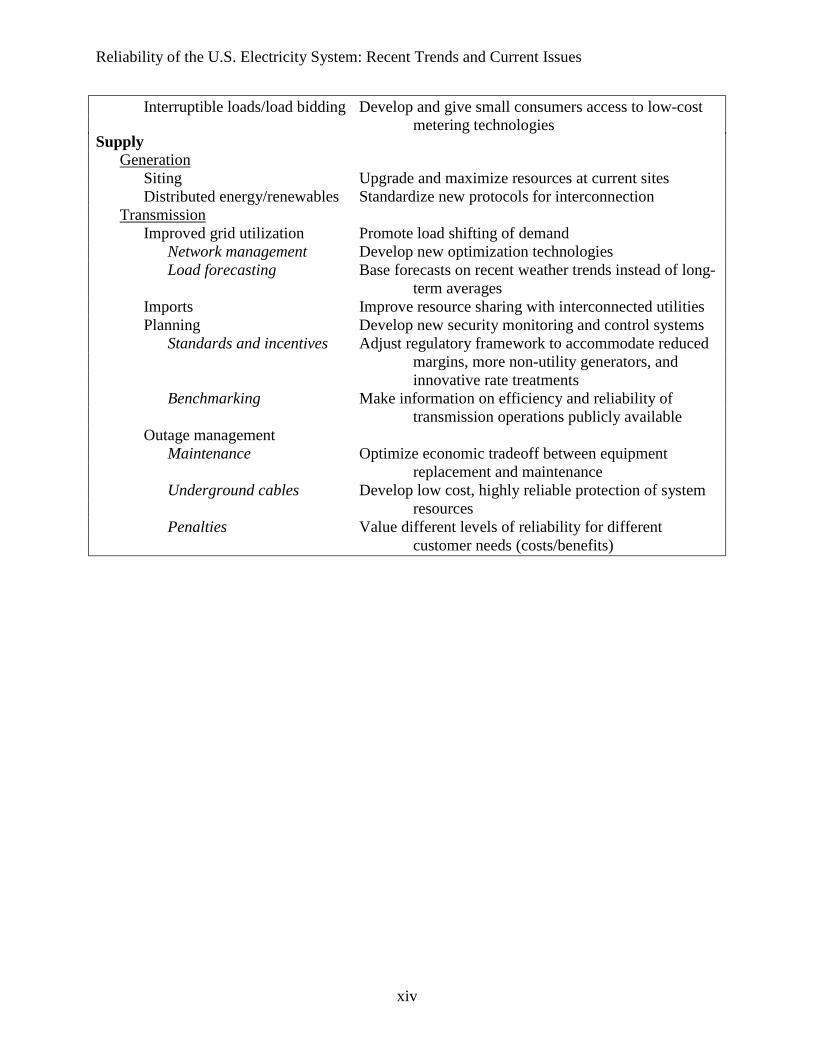
Figure EX-1. U.S. Annual Utility Electricity Consumption, 1984 to 1999 (EIA 1999) Reliability Improvements The following suggestions for improving reliability address both the demand and supply sides of the bulk power system; see Table EX-2. They range from energy efficiency programs and alternative pricing mechanisms for consumers, to optimizing generation and transmission resources. Peak demand reduction and technological improvements on the supply side will be most effective if supported by policies that encourage more efficient utilization of resources. The most efficient solutions must take into account the true costs of reliability and power interruptions and create a structure that permits all participants in the power system to see and understand the costs of reliability. Table EX-2. Ways to Improve Electricity System Reliability.
Program Area Requirements for Implementation Demand Energy efficiency Energy efficiency standards Update/create standards for key appliances and
equipment Demand-side management Improve consumer access to information about costs of
energy consumption Alternative pricing Real-time pricing Implement new regulations and/or tariffs that allow
consumers to see the true price of energy
Reliability of the U.S. Electricity System: Recent Trends and Current Issues
xiv
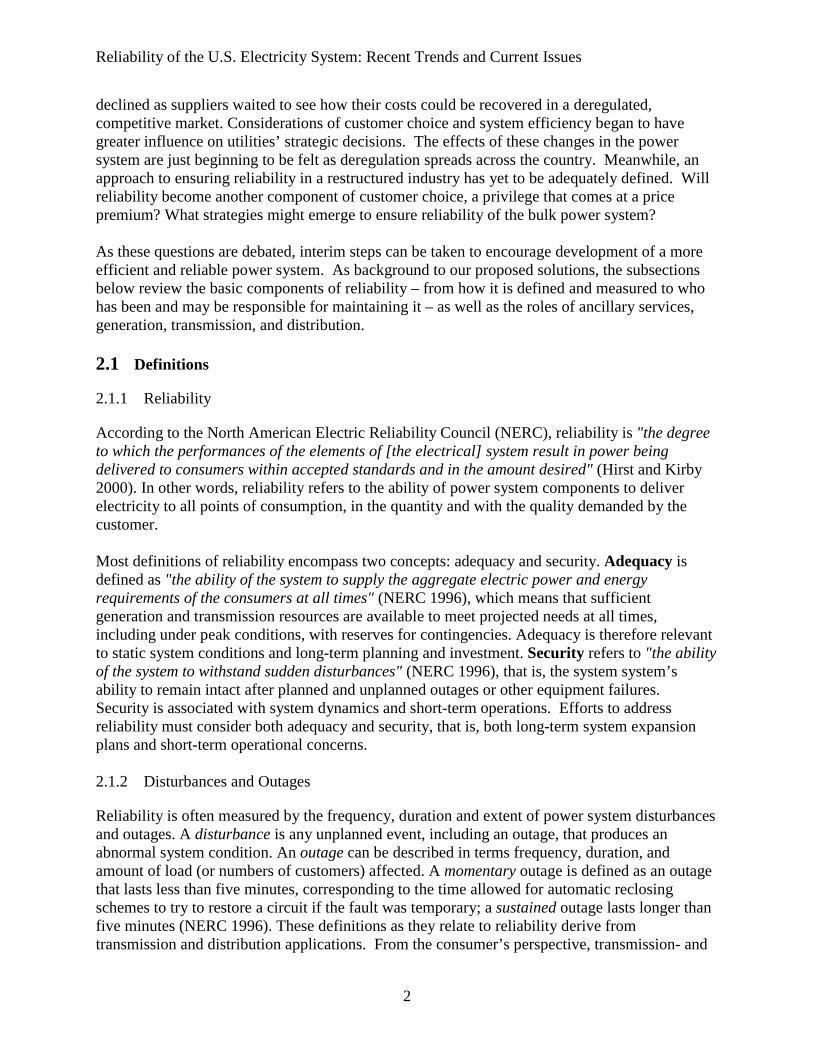
Interruptible loads/load bidding Develop and give small consumers access to low-cost metering technologies
Supply Generation Siting Upgrade and maximize resources at current sites Distributed energy/renewables Standardize new protocols for interconnection Transmission Improved grid utilization Promote load shifting of demand Network management Develop new optimization technologies Load forecasting Base forecasts on recent weather trends instead of long-
term averages Imports Improve resource sharing with interconnected utilities Planning Develop new security monitoring and control systems Standards and incentives Adjust regulatory framework to accommodate reduced
margins, more non-utility generators, and innovative rate treatments
Benchmarking Make information on efficiency and reliability of transmission operations publicly available
Outage management Maintenance Optimize economic tradeoff between equipment
replacement and maintenance Underground cables Develop low cost, highly reliable protection of system
resources Penalties Value different levels of reliability for different
customer needs (costs/benefits)
Reliability of the U.S. Electricity System: Recent Trends and Current Issues
1
1. Introduction
Recent chaos in the electricity market in California has fed concerns of government regulators and legislators, businesses, and the general public regarding the reliability of their electricity supply. Electricity plays an essential role in modern society, and the importance of high-quality and reliable electric services has increased with the advent of the internet-based economy. Our increased dependence on electricity means increased demand on the power system, which puts pressure on the system’s reliability. In addition, the characteristics of much of the new electricity load mean that current reliability needs are different from those of the past. Heightened reliance on peaking loads (such as air conditioning) and non-resistive loads (such as induction motors, variable speed drives, fluorescent lighting, and electronic devices) changes the demands placed on the power system, which can only be accommodated with new technologies and infrastructure. These changes in the electrical characteristics of end uses combine with deregulation, increasing consumption, and difficulties in siting new power plants to challenge the reliability of the power grid. What have, in the past, been occasional interruptions in electricity supply from extreme weather conditions, equipment failures, human error, and system inadequacy may become more frequent unless proactive measures are taken now to insure system reliability and power quality. In this study, we explain the fundamentals of electricity reliability, evaluate factors that affect reliability, discuss key elements of historic system performance, and explore possible means to address reliability in a deregulated energy market. This report is intended to provide an introduction to reliability issues for efficiency analysis. It is not intended as a comprehensive treatment of technical reliability issues for power systems professionals. 2. Background
The U.S. power system developed as a regulated, vertically integrated industry that has fostered high customer expectations for reliable power delivery. Every facet of the power system -- generation, transmission, and distribution -- was, until recently, controlled by a geographically defined, franchised monopoly. Customers were assigned a supplier according to their location and had little choice about electricity supply. Engineers were primarily responsible for ensuring reliability, and cost was only one part of their considerations. Economies of scale functioned, at least through the 1970s, to offset some of the costs of bringing reliable electricity service to every home. A complex power network evolved whose reliability was based on redundancy, which guarded against the effects of equipment failures. For transmission and distribution companies, maintenance and tree-trimming programs were the primary means to prevent system disturbances. The operational requirement of relatively large (7 percent) generating capacity reserve margins was also a major component of the strategy for insuring system reliability. Economic drivers were of relatively small importance because utilities were guaranteed reasonable profits based on operating expenses. When deregulation discussions began in the early 1990s, electric utilities’ planning and operations strategies began to shift; investments in capacity expansion and equipment upgrades
Reliability of the U.S. Electricity System: Recent Trends and Current Issues
2
declined as suppliers waited to see how their costs could be recovered in a deregulated, competitive market. Considerations of customer choice and system efficiency began to have greater influence on utilities’ strategic decisions. The effects of these changes in the power system are just beginning to be felt as deregulation spreads across the country. Meanwhile, an approach to ensuring reliability in a restructured industry has yet to be adequately defined. Will reliability become another component of customer choice, a privilege that comes at a price premium? What strategies might emerge to ensure reliability of the bulk power system? As these questions are debated, interim steps can be taken to encourage development of a more efficient and reliable power system. As background to our proposed solutions, the subsections below review the basic components of reliability – from how it is defined and measured to who has been and may be responsible for maintaining it – as well as the roles of ancillary services, generation, transmission, and distribution. 2.1 Definitions
2.1.1 Reliability
According to the North American Electric Reliability Council (NERC), reliability is "the degree to which the performances of the elements of [the electrical] system result in power being delivered to consumers within accepted standards and in the amount desired" (Hirst and Kirby 2000). In other words, reliability refers to the ability of power system components to deliver electricity to all points of consumption, in the quantity and with the quality demanded by the customer. Most definitions of reliability encompass two concepts: adequacy and security. Adequacy is defined as "the ability of the system to supply the aggregate electric power and energy requirements of the consumers at all times" (NERC 1996), which means that sufficient generation and transmission resources are available to meet projected needs at all times, including under peak conditions, with reserves for contingencies. Adequacy is therefore relevant to static system conditions and long-term planning and investment. Security refers to "the ability of the system to withstand sudden disturbances" (NERC 1996), that is, the system system’s ability to remain intact after planned and unplanned outages or other equipment failures. Security is associated with system dynamics and short-term operations. Efforts to address reliability must consider both adequacy and security, that is, both long-term system expansion plans and short-term operational concerns. 2.1.2 Disturbances and Outages
Reliability is often measured by the frequency, duration and extent of power system disturbances and outages. A disturbance is any unplanned event, including an outage, that produces an abnormal system condition. An outage can be described in terms frequency, duration, and amount of load (or numbers of customers) affected. A momentary outage is defined as an outage that lasts less than five minutes, corresponding to the time allowed for automatic reclosing schemes to try to restore a circuit if the fault was temporary; a sustained outage lasts longer than five minutes (NERC 1996). These definitions as they relate to reliability derive from transmission and distribution applications. From the consumer’s perspective, transmission- and
Reliability of the U.S. Electricity System: Recent Trends and Current Issues
3
distribution-related outages are most important to real-time reliability (system security). Generation and other system component outages are typically most significant to system planners, because they tend to affect the adequacy of the electricity system as a whole. With appropriate planning, consumers will generally be buffered from the effects of these outages. An outage or disturbance of a system component may or may not cause an interruption of service to customers, depending on the system’s configuration, and may affect power quality even if service is not interrupted. Of much greater importance although much more difficult to quantify are the economic consequences of interruptions or disturbances in electricity service (SEAB 1998). The power system must incorporate redundancy to guard against disturbances and outages. 2.1.3 Disturbance Terms
Reduced reliability affects the adequacy, security, and/or quality of the power supply. Voltage disturbances can take the form of either under- or overvoltages; an undervoltage is a decrease of more than 10 percent in the supply voltage, and an overvoltage is an increase of more than 10 percent. A voltage sag is a sudden, unintended, short-term reduction of the normal supply that can be caused by short circuits on the power system or by the start-up of a large load, such as a motor. Motors can cause problems because of their large start-up currents, which are usually three to 10 times higher than the nominal current. In networks with high short-circuit power (depending on the rating of the connected power plants and the size of the system), these kinds of start-ups have less impact on network conditions than on networks with small amounts of short-circuit power. Longer duration voltage regulation problems typically occur when the power system is not strong enough to supply load properly, causing an extended undervoltage. A brownout occurs when a power supplier intentionally reduces electrical voltage more than 10 percent below normal for a sustained period, to force equipment to use less power. Lights dim slightly, and a brownout can last anywhere from few seconds to a few hours. Blackouts are long periods of completely interrupted service. Load interruptions can be either automatic or the result of operator action as long as the specific actions, including the magnitude of load interrupted, are identified by planning criteria, and corresponding operating procedures are in place when a disturbance occurs. 2.1.4 Relationship Between Reliability and Power Quality
Although reliability and power quality are related, they are separate issues. The simplest definition for reliability is that electricity is available when it is needed; power quality describes the characteristics, in terms of continuity and voltage, of the supplied electricity as delivered to customers at supply terminals under normal operating conditions (Renner and Fickert 1999). Insufficient power quality can be caused by (1) failures and switching operations in the network, which result in voltage dips, interruptions, and transients;1 and (2) network disturbances from loads that result in flicker, harmonics, and phase imbalance. The nature of these disturbances is
1 A transient is a surge, glitch, sag, spike or impulse that occurs very quickly; the entire elapsed time can be less than two or three microseconds.
Reliability of the U.S. Electricity System: Recent Trends and Current Issues
4
related to the short-circuit capacity in the network, which depends on the network's configuration (e.g., length of the lines, short-circuit capacity of generators and transformers, etc.). To protect the system from degradation in power quality, it is important for network operators to guarantee a specified minimum short-circuit capacity (Renner and Fickert 1999). Use of computers places a premium on high power quality because fluctuations in voltage and other components of power quality can easily damage microprocessor equipment; thus, as the use of computers has increased, power quality has become an increasingly important element of reliability. Any variation from the pure waveform is considered a degradation of power quality. Such variations include (1) voltage out of the specified acceptable range; (2) frequency variations; (3) harmonics, i.e., frequencies other than 60 Hz; and (4) transients resulting from spikes, switching, or other disturbances. These anomalies can cause varying degrees of problems for customers. Some technologies exist, however, that enable customers to solve power quality problems. Customers can, for a price, control the quality of their power by installing regulating devices at their point of connection. This is a key difference between power quality and reliability problems. A customer's options for influencing power reliability are more limited. The choices are to invest in uninterruptible power supply (UPS) devices or distributed generation, both of which are costly. Another important influence on voltage control and system stability is reactive power. Reactive power is the power that is returned to the source by the reactive components of the circuit. This type of power is measured in Volt-Amperes-Reactive (VAR). Summer peak demands together with heavy reactive power transfers degrade reliability. Reactive power injections to the transmission system are therefore needed to maintain adequate voltage and prevent voltage instability. In particular, inductive loads, such as air conditioners (which are the main reason for summer peak demands), tend to draw significant amounts of reactive power from the electricity system (NERC 2000). Reactive power needs are growing ever more important as the collective use of the transmission system increases. Because reactive power transfer reduces some of the transmission capability of networks, it should be generated where it is needed rather than transported over long distances. Back-up reactive power supplies are also needed to replace the reactive power lost when key generating units are forced out of service. Potential solutions to solve voltage problems include (1) increasing the size of transformers, reducing line length, adding series capacitors, or increasing the size of line conductors (to reduce system impedance); (2) adding shunt capacitors or static VAR compensators; (3) upgrading lines to the next voltage level (to reduce the line current); and (4) increasing the reactive power factor of generators. Any power system, no matter how well balanced, always has a voltage imbalance of 1.0 to 1.5 percent of nominal voltage even when in steady-state mode. This is caused mainly by asymmetry in the geometry of overhead lines as well as by load imbalance (e.g., various single-phase loads connected to the distribution system). Utilities generally try to regulate the voltage supplied to customers within ± five percent. Inside these limits, it is the responsibility of customers to protect sensitive loads that require better voltage regulation to operate properly.
Reliability of the U.S. Electricity System: Recent Trends and Current Issues
5
New types of loads, including variable-speed drives and microprocessor-based controls, are both more sensitive to voltage variations than less sophisticated equipment and can also produce "electric pollution" on the supply network. Examples of electric pollution caused by these types of non-linear end uses include voltage disturbances and harmonics. When load current is not proportional to instantaneous voltage (i.e., voltage and current waveforms are not sinusoidal), the current is considered non-linear (AFC Cable Systems 2000). This distorted waveform results from current being drawn abruptly from the system and may interfere with other loads in the same network. Harmonics are sinusoidal current and voltage frequencies that are integral multiples of the normal (or fundamental) 60-Hz power system frequency. Distorted waveforms can be decomposed into a sum of the fundamental frequency and the harmonics. Harmonics are caused by devices or loads that have non-linear voltage-current characteristics, such as variable-speed drives, electronic rectifiers, power supplies, arc furnaces, etc. The level of harmonic current flowing into the system impedance (which varies with frequency) determines the harmonic voltage distortion level. Harmonic current distortion greater than five percent will contribute to heating of a power transformer, so transformers must be derated for harmonics. 2.2 Reliability Indices
The use of uniform definitions and measurements for reliability-related information allows quantifiable and comparable assessment of system performance. Each component of the power system has a specific reliability index, and failure of one can directly impact the others. A transmission system's reliability index is normally expressed as percent of system average availability and is typically greater than 99 percent (Cibulka 2000). The following outage indices are included in the Institute of Electrical and Electronics Engineers (IEEE) Standard 1366. These indices capture the effects of the number of outages, both momentary and sustained, as well as the duration of each outage, and are usually computed from the past year's or several years' utility data (IEEE 1997). These indices ultimately relate to customer satisfaction, which is based not only on the total length of interruptions but also on the frequency of interruptions.
1. SAIFI (System Average Interruption Frequency Index) is the average number of
interruptions per customer during the year and is designed to give information about the average frequency of sustained interruptions (those lasting more than five minutes) per customer in a predefined area. It is calculated by dividing the total annual number of customer interruptions by the total number of customers served during the year.
SAIFI =Ni∑
NT
(1)
where, Ni is the number of interruptions to customers
NT is the total number of customers served 2. SAIDI (System Average Interruption Duration Index) is the average duration of interruptions
for customers who experience an interruption during the year. It is determined by dividing the sum of all durations of service interruptions to customers by the total number of
Reliability of the U.S. Electricity System: Recent Trends and Current Issues
6
customers. This index is commonly referred to as Customer Minutes of Interruption or Customer Hours and is designed to give information about the average time during which customers’ power supply is interrupted. It is calculated as:
SAIDI =riNi∑
NT
(2)
where, ri is the duration of each interruption
3. CAIFI (Customer Average Interruption Frequency Index) is the average number of
interruptions for customers who experience interruptions during the year. It is calculated by dividing the total annual number of interruptions of power to customers by the total number of customers affected by interruptions during the year. This index gives the average frequency of sustained interruptions for customers who experience sustained interruptions. For this calculation, a customer is counted once regardless of the number of times interrupted.
CAIFI =Ni∑
CN
(3)
where,
CN is the total number of customers whose power is interrupted 4. CAIDI (Customer Average Interruption Duration Index) represents the average time required
to restore service to the average customer per sustained interruption.
CAIDI =riNi∑
∑ Ni=
SAIDISAIFI
(4)
5. LOLE (Loss of Load Expectation), also referred to as Loss of Load Probability, forecasts the
expected number of days in the year when the daily peak demand will exceed the available generating capacity. This number is obtained by calculating the probability of daily peak demand exceeding the available capacity for each day and adding these probabilities for all the days in the year. The index is referred to as Hourly Loss-of-Load-Expectation if hourly demands are used in the calculations instead of daily peak demands.
6. RUS (Rural Utility Service) is used to determine the average outage hours for customers in
rural areas. These customers may experience longer recovery periods from disturbances than other customers do because of the lower density of loads along rural feeders. For outages longer than five minutes, the following equation is used:
RUS =ri∑
CN
(5)
Reliability of the U.S. Electricity System: Recent Trends and Current Issues
7
2.3 Bulk-Power System Components
2.3.1 Configuration
Generation and transmission (G&T) are equally important components of the bulk-power system. Generators are responsible for producing electric power, and transmission connects generators to loads. Electricity reliability must address both the adequacy of G&T resources and security of the entire system after outages, whether planned or unplanned. Distribution serves a transportation function similar to transmission but is more localized. As a result, the system reliability effects resulting from distribution and transmission disturbances vary. Transmission disturbances often affect distribution systems, but distribution disturbances do not typically affect transmission reliability. Transmission and distribution also differ in that transmission systems represent meshed networks maintained and operated with significant redundancy to avoid congestion problems, but distribution systems are mostly radial with little overlap. The redundancy of transmission networks is critical because the effects of transmission disturbances can be much more widespread than the effects of distribution disturbances. Here we focus on transmission over distribution because distribution systems are more dispersed and their governance less centralized. Transmission only accounts for six percent of the total retail cost of electricity (Hirst 2000c) but is nonetheless a critical element of reliable electricity service. Furthermore, an extensive transmission network can enhance competition in generation markets by enabling consumers to access distant generation sources. Increasing competition by giving consumers access to distant generation sources can reduce generators' market power and/or allow consumers access to electricity at lower costs than those offered by local generators. Conversely, congestion in the grid can present generators with opportunities to exercise market power, to the detriment of consumers. In the U.S., lines are typically rated at 115 kV, 235 kV, 500 kV, or 765 kV. Maximum flows through transmission systems are governed by thermal, stability, and voltage limits. A thermal limit is defined as the maximum current carried on a line limited by temperature; a stability limit refers to the maximum power flow possible through a point in a power system without the system losing its capacity to reach a steady-state operating point after a small disturbance. Transmission congestion means that it is not possible to complete all the proposed transactions to move power from one location to another on the grid. The point at which congestion occurs is governed by these flow limits. Congestion is generally not related to the actual flows on lines; instead, it occurs most frequently because of contingency analysis rather than current line flows. Dispatch of generation is modified because a line will overload as the result of a specific contingency (e.g., a line, generator, or transformer failure). The need to be ready for the next contingency dominates the design and operation of transmission networks. Therefore, it is usually not the present flow through a line or transformer that limits allowable power transfers but rather the flow that would occur if another element failed, called the (n-1) criteria. 2.3.2 Operation
The limits described above are the physical limits on the system, but economic factors also govern transmission system operation. The computerized Open Access Same-time Information
Reliability of the U.S. Electricity System: Recent Trends and Current Issues
8
System (OASIS) allows energy transmission providers to post available wholesale transmission capacity to their wholesale customers, so consumers can have open access to non-discriminatory transmission service (OASIS 1996). Sellers post their Available Transmission Capacity (ATC) for review by potential buyers, and buyers post requests for ATC for review by potential sellers. Transmission services may be viewed and subsequently bought or sold on an hourly, daily, weekly, monthly, or annual basis. After determining a point of delivery where capacity and/or energy transmitted by the provider will be made available to the receiving party, a path and direction of flow on that path is defined. Transmission lines are typically described as being on a path, corridor, or an interconnection in some regions, or as crossing an interface or cut plane in other regions. A unique path name is assigned to a single transmission line or the set of one or more parallel transmission lines whose power transfer capabilities are strongly interrelated and must be determined in aggregate. There is no controversy regarding the critical importance of open transmission access as a necessary condition for a competitive electricity market. Defining, in the usual sense of interfaces and paths, the available physical capacity on one part of the network over an extended period of time is impossible for theoretical reasons. For this reason, ATC represents only an economic, not a physical, definition of available transmission capacity. The actual physical capacity on any particular transmission interface depends on the flows through all interconnected interfaces. There is no way to determine what this capacity will be at any given time in the future without specifying all of the flows on the system. Because of loop flow effects and other network interactions, only the system operator can know which trades will be feasible, except for trades that involve no reconfiguration of reservations. 2.4 Responsibility for Reliability
2.4.1 Structure of the Bulk-Power System
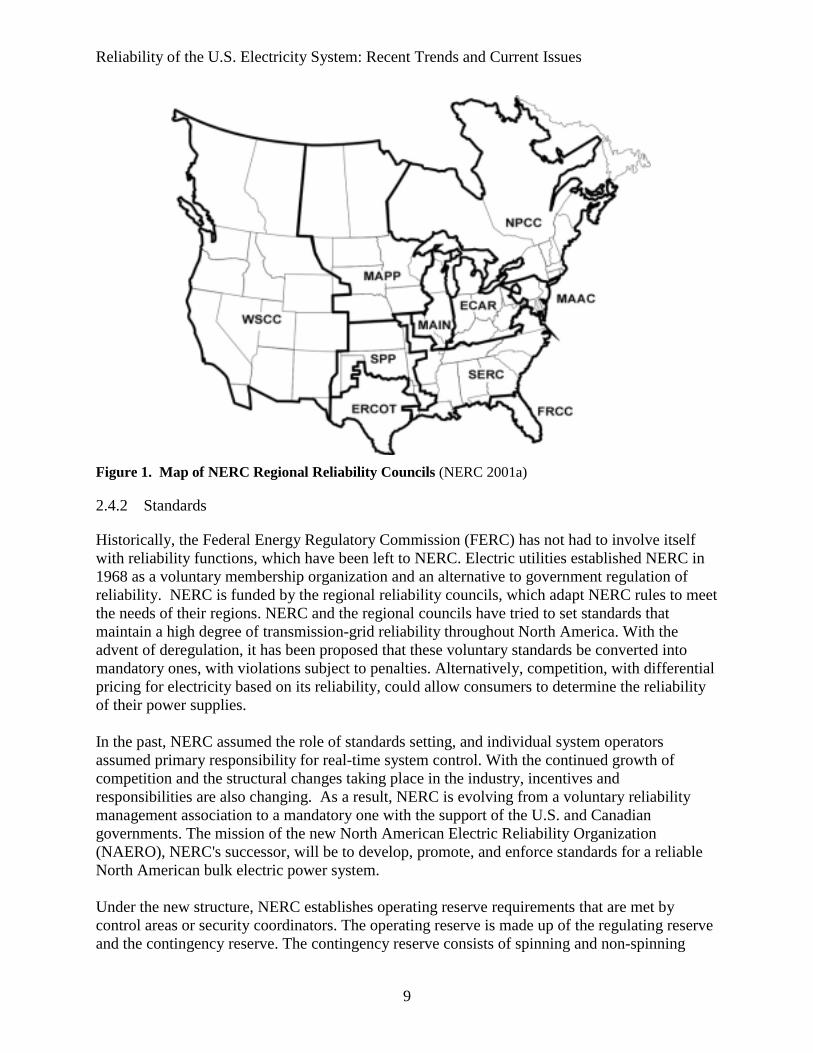
Analysts usually divide the North American electricity system into three Interconnections: Eastern, Western, and the Electric Reliability Council of Texas (ERCOT). Within each Interconnection, all the generators operate at the same frequency as essentially one machine connected to one other and to loads, primarily by AC lines. The Interconnections are joined to one another by a few DC links. Because these DC connections are limited, the flows of electricity and markets are much greater within each Interconnection than between Interconnections. Deregulation may cause an increase in the demand for transfer of power between Interconnections, which means that the mechanisms that protected electric system reliability in the past need to be changed to be consistent with ongoing market developments. Reliability is monitored by the NERC, which is made up of 12 geographic subgroups of electric utilities, many of which are electric cooperatives operating in rural areas. Nearly all of the electric power generated in North America is from NERC members. A map of the 10 regional reliability councils in the contiguous U.S. is shown in Figure 1. Not mapped are Alaska (ASCC) and Hawaii, which each make up their own regional council. The WSCC corresponds to the Western Interconnection and the Eastern Interconnection encompasses the eight other electricity supply groups excluding ERCOT.
Reliability of the U.S. Electricity System: Recent Trends and Current Issues
9
Figure 1. Map of NERC Regional Reliability Councils (NERC 2001a)
2.4.2 Standards
Historically, the Federal Energy Regulatory Commission (FERC) has not had to involve itself with reliability functions, which have been left to NERC. Electric utilities established NERC in 1968 as a voluntary membership organization and an alternative to government regulation of reliability. NERC is funded by the regional reliability councils, which adapt NERC rules to meet the needs of their regions. NERC and the regional councils have tried to set standards that maintain a high degree of transmission-grid reliability throughout North America. With the advent of deregulation, it has been proposed that these voluntary standards be converted into mandatory ones, with violations subject to penalties. Alternatively, competition, with differential pricing for electricity based on its reliability, could allow consumers to determine the reliability of their power supplies. In the past, NERC assumed the role of standards setting, and individual system operators assumed primary responsibility for real-time system control. With the continued growth of competition and the structural changes taking place in the industry, incentives and responsibilities are also changing. As a result, NERC is evolving from a voluntary reliability management association to a mandatory one with the support of the U.S. and Canadian governments. The mission of the new North American Electric Reliability Organization (NAERO), NERC's successor, will be to develop, promote, and enforce standards for a reliable North American bulk electric power system. Under the new structure, NERC establishes operating reserve requirements that are met by control areas or security coordinators. The operating reserve is made up of the regulating reserve and the contingency reserve. The contingency reserve consists of spinning and non-spinning
Reliability of the U.S. Electricity System: Recent Trends and Current Issues
10
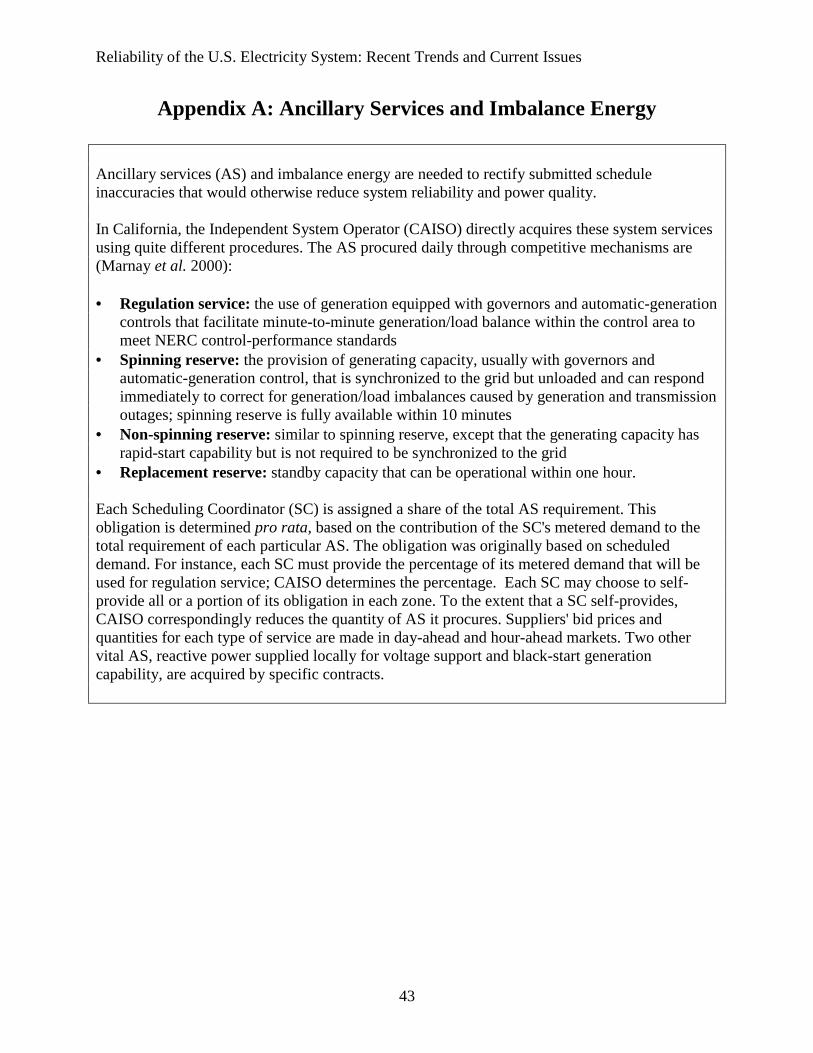
reserves.2 The NERC Disturbance Control Standard requires control areas to restore their systems to generation/load balance within 10 minutes after a major generation or transmission outage. This performance standard defines how much generating capacity each control area must carry as contingency reserve. Typically, the regions specify minimum amounts of contingency reserves on the basis of the single largest contingency facing that utility or its projected daily peak demand (Hirst 2000b). Ancillary services (AS) and imbalance energy are used to rectify submitted schedule inaccuracies that would reduce both system reliability and power quality. Please see Appendix A for a description of AS and scheduling as they function in California. 2.4.3 Real-Time Operation
Although the NAERO structure has been proposed, a system to determine who is responsible and accountable for ensuring that customers continue to be served under deregulation as effectively as they have been in the past is still being developed. In December 1999, FERC issued Order 2000 on regional transmission organizations (RTOs). RTOs include all types of transmission organizational structures, including Independent System Operators (ISOs), companies that own and operate transmission lines (Transcos), and companies that own and operate both transmission and distribution lines (Gridcos). FERC's stated objective is to encourage all entities that own transmission to place their transmission facilities under the control of an RTO but has stopped short of mandating participation in RTOs, specifying regional boundaries, or requiring a specific type of RTO. FERC has proposed minimum requirements for RTOs and set December 15, 2001 as the date for RTOs to become operational (Ridley & Associates 1999). In Order 2000, FERC identified four fundamental characteristics and eight key functions of an RTO. The four characteristics are: (1) independence, (2) scope and regional configuration, (3) operational authority, and (4) short-term reliability. With regard to reliability, the RTOs are responsible for: (1) ancillary services, (2) grid planning and expansion, and (3) interregional coordination. In February 2000, FERC issued Order 2000-A to reaffirm its basic determinations in Order 2000 and to clarify certain terms (FERC 2000). However, FERC has jurisdiction over only the two-thirds of the U.S. transmission grid owned by investor-owned utilities (NERC 2001). On a daily time scale, reliable delivery of power is the responsibility of system operators. Power system operators commonly monitor a number of real and reactive power flows, voltage levels and network topology, tie-line flows, external transactions, and internal bus loads. These quantities are monitored to ensure that they stay within acceptable bounds (as determined by predefined standards) for the existing network or any of a set of possible degraded networks following a contingency. A more explicit and direct quantification of transmission capacity is, therefore, the network’s margin of security. The security margin is the additional capacity that is on line in excess of projected demand to ensure that potential shortfalls in projections and fluctuations in load can be accommodated and will not compromise the system’s ability to deliver electricity. Security margin is a multifaceted property and is the reason that operators monitor numerous variables. 2 Appendix A defines these reserves and other ancillary services.
Reliability of the U.S. Electricity System: Recent Trends and Current Issues
11
3. Factors Influencing Reliability
The widespread heat-wave related outage events across the U.S. during the summer of 1999, the catastrophic California system failures of 1996, and the California electricity shortfalls in 2000-2001 have underscored the vulnerability of modern economies to power failures and have raised national concern about the ability of the power system to meet electricity demand. This section addresses reasons for potential decreases in reliability and describes the historical reliability of the U.S. electric power system. 3.1 Increasing Consumption
3.1.1 Demand Growth
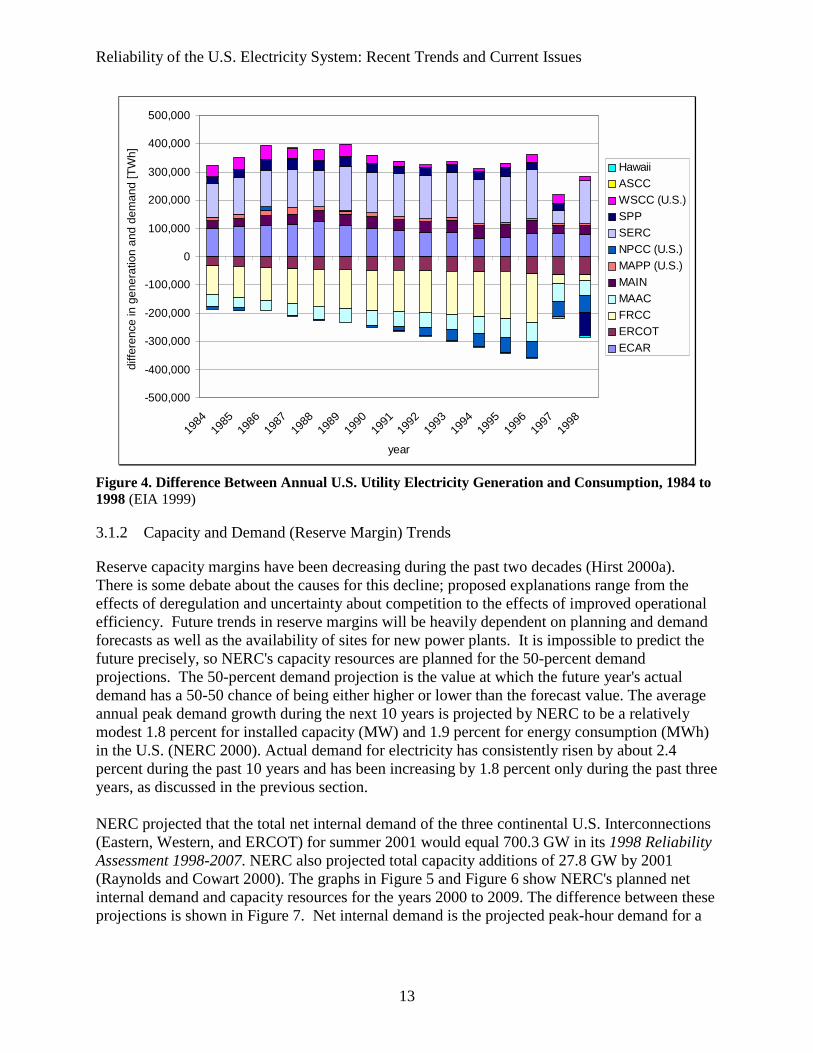
Electricity demand is driven by a number of factors, including economic activity, weather, and population dynamics. Domestic electricity demand has been increasing at an average of 2.4 percent/a since 1984, as shown in Figure 2. The average growth in consumption during the past three years was 1.8 percent. The highest average demand increase by percentage is for SERC, ASCC, FRCC, and ERCOT, but it should be noted that, for FRCC and ERCOT, consumption actually decreased from 1998 to 1999. Such short-term fluctuations in demand are likely the results of annual climate and economic variations. Over the longer term, a strong economy and population growth in North America will continue to drive demand and cause energy consumption to grow rapidly. Although the economy is becoming more efficient per capita and per dollar of gross domestic product, consumption is still increasing, and this increasing demand, if not met, will compromise power system reliability. All data and graphs for historic consumption and generation in this section of this report are based on published data from the DOE Energy Information Administration (EIA) Electric Power Annual and include only investor-owned electric utilities. These utilities account for about 75 percent of all U.S. electric generation capability, generation, sales, and revenue; their fraction of the market that has been decreasing over time. Municipalities, cogenerators, independent power producers (IPPs), and other non-utility generators (NUGs) are not included in this data set. Demand has been growing rapidly in recent years; continued growth may not be matched by new supply capacity, which will result in system inadequacy. Figure 3 shows the increase in the annual U.S. electric utility generation. Note the absence of a steady increase during the early to mid 1990s; from 1991 to 1992, generation even decreased slightly. Figure 4 shows the difference between annual electricity generation by utilities and consumption. Utilities have changed status from being net exporters of electricity (during the period 1984 -1993) to being net importers (during the period 1994 - 1998). This graph clearly indicates that demand is no longer being met by utility generating resources. The figure also shows that utilities in some areas (e.g., ERCOT, FRCC, MAAC, NPCC, and Hawaii) have always relied more heavily on imported NUG electricity whereas SPP and ASCC were, until recently (1997, 1998), energy exporters.3
3 Figures 2, 3 and 4 include only power from investor-owned utilities, not NUGs.
Reliability of the U.S. Electricity System: Recent Trends and Current Issues
Figure 4. Difference Between Annual U.S. Utility Electricity Generation and Consumption, 1984 to 1998 (EIA 1999)
3.1.2 Capacity and Demand (Reserve Margin) Trends
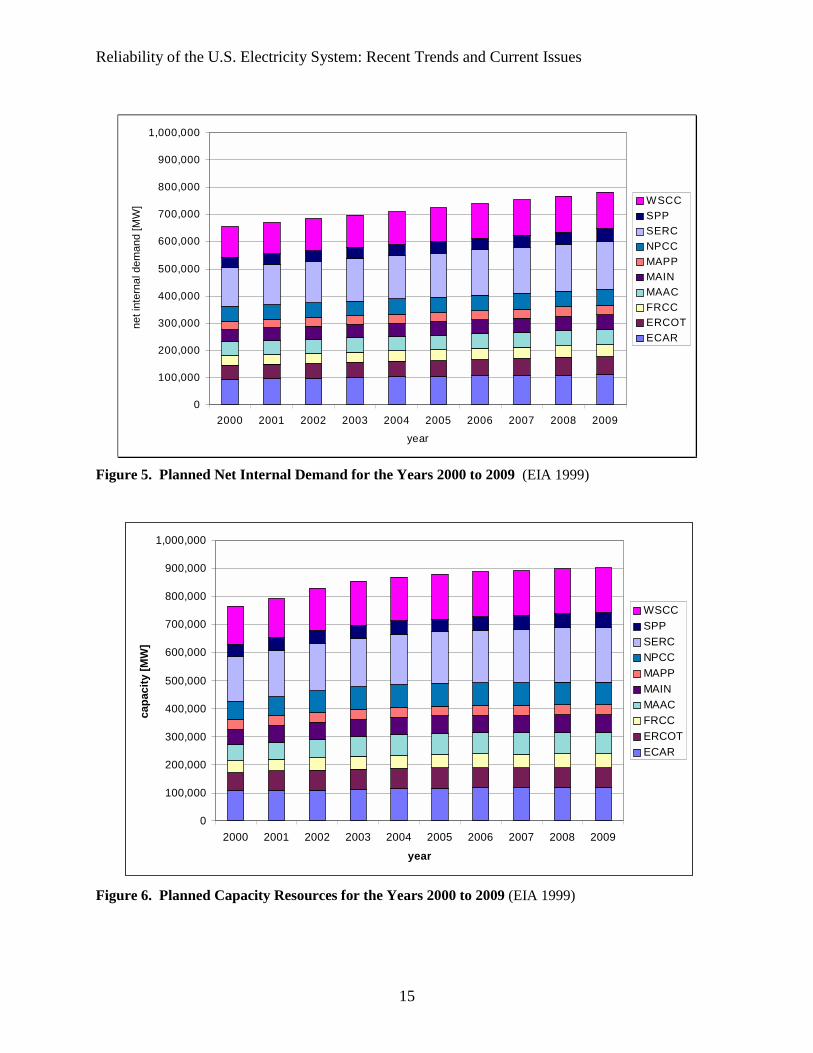
Reserve capacity margins have been decreasing during the past two decades (Hirst 2000a). There is some debate about the causes for this decline; proposed explanations range from the effects of deregulation and uncertainty about competition to the effects of improved operational efficiency. Future trends in reserve margins will be heavily dependent on planning and demand forecasts as well as the availability of sites for new power plants. It is impossible to predict the future precisely, so NERC's capacity resources are planned for the 50-percent demand projections. The 50-percent demand projection is the value at which the future year's actual demand has a 50-50 chance of being either higher or lower than the forecast value. The average annual peak demand growth during the next 10 years is projected by NERC to be a relatively modest 1.8 percent for installed capacity (MW) and 1.9 percent for energy consumption (MWh) in the U.S. (NERC 2000). Actual demand for electricity has consistently risen by about 2.4 percent during the past 10 years and has been increasing by 1.8 percent only during the past three years, as discussed in the previous section. NERC projected that the total net internal demand of the three continental U.S. Interconnections (Eastern, Western, and ERCOT) for summer 2001 would equal 700.3 GW in its 1998 Reliability Assessment 1998-2007. NERC also projected total capacity additions of 27.8 GW by 2001 (Raynolds and Cowart 2000). The graphs in Figure 5 and Figure 6 show NERC's planned net internal demand and capacity resources for the years 2000 to 2009. The difference between these projections is shown in Figure 7. Net internal demand is the projected peak-hour demand for a
Reliability of the U.S. Electricity System: Recent Trends and Current Issues
14
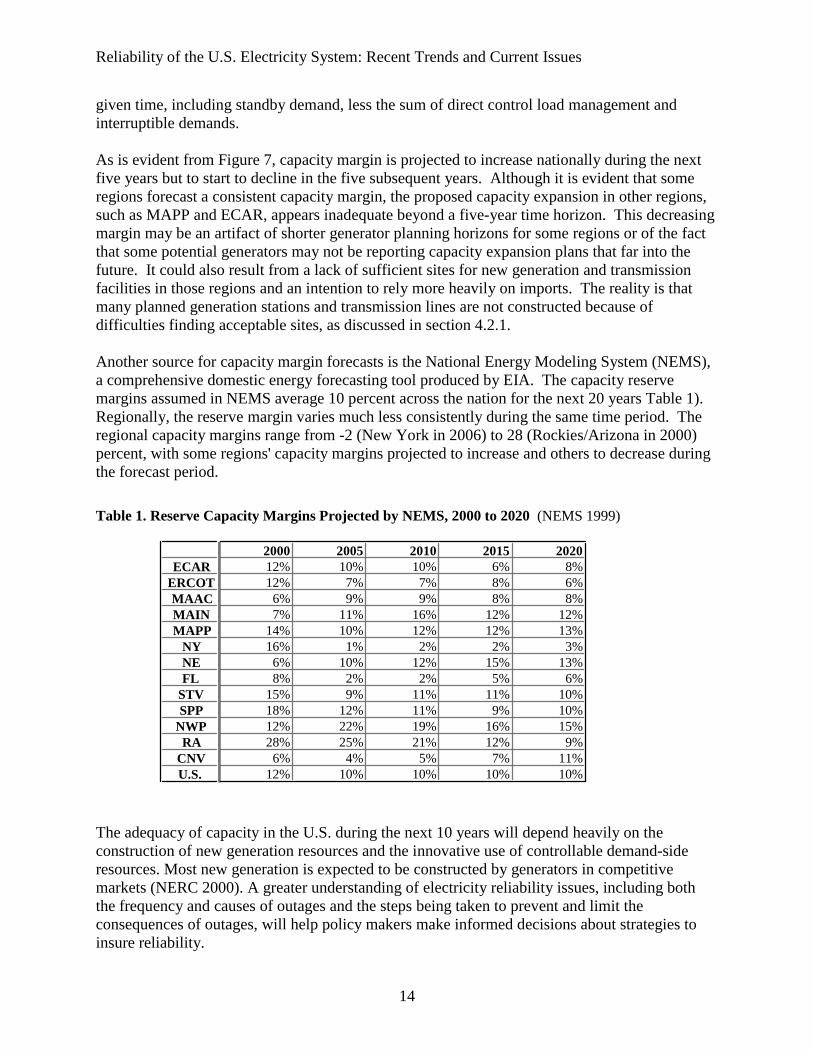
given time, including standby demand, less the sum of direct control load management and interruptible demands. As is evident from Figure 7, capacity margin is projected to increase nationally during the next five years but to start to decline in the five subsequent years. Although it is evident that some regions forecast a consistent capacity margin, the proposed capacity expansion in other regions, such as MAPP and ECAR, appears inadequate beyond a five-year time horizon. This decreasing margin may be an artifact of shorter generator planning horizons for some regions or of the fact that some potential generators may not be reporting capacity expansion plans that far into the future. It could also result from a lack of sufficient sites for new generation and transmission facilities in those regions and an intention to rely more heavily on imports. The reality is that many planned generation stations and transmission lines are not constructed because of difficulties finding acceptable sites, as discussed in section 4.2.1. Another source for capacity margin forecasts is the National Energy Modeling System (NEMS), a comprehensive domestic energy forecasting tool produced by EIA. The capacity reserve margins assumed in NEMS average 10 percent across the nation for the next 20 years Table 1). Regionally, the reserve margin varies much less consistently during the same time period. The regional capacity margins range from -2 (New York in 2006) to 28 (Rockies/Arizona in 2000) percent, with some regions' capacity margins projected to increase and others to decrease during the forecast period. Table 1. Reserve Capacity Margins Projected by NEMS, 2000 to 2020 (NEMS 1999)
The adequacy of capacity in the U.S. during the next 10 years will depend heavily on the construction of new generation resources and the innovative use of controllable demand-side resources. Most new generation is expected to be constructed by generators in competitive markets (NERC 2000). A greater understanding of electricity reliability issues, including both the frequency and causes of outages and the steps being taken to prevent and limit the consequences of outages, will help policy makers make informed decisions about strategies to insure reliability.
Figure 7. Difference Between Net Internal Demand and Planned Capacity Resources for the Years (EIA 1999)
3.1.3 Population Migration
Although much of the growth in electricity demand may come from end uses such as electronics that have flat loads, movement of population toward hotter parts of the country and increasing penetration of air conditioning (A/C) into cooler regions would result in a load profile with weather-related peaks. 3.1.4 Climate Change Effects
Global climate change may also affect electricity demand patterns. If average summertime temperatures rise, system loads resulting from air-conditioning demand will increase (IPCC 2001). The extreme weather episodes that are predicted to result from climate change could also exacerbate summer load peaks as the hottest days of the season become even hotter than the current average. If a system is imposed to limit carbon emissions and thus the quantity of greenhouse gases released into the atmosphere, the construction of new thermal generation could become even more difficult than it is today, causing supply growth to further lag behind demand. 3.2 Deregulation and Competitive Electricity Markets
The emergence of competitive electricity markets has changed and will continue to change the nature of the electricity industry in fundamental ways that could lead to a less reliable system. Although not all reliability issues are directly attributable to deregulation, the trend toward
Reliability of the U.S. Electricity System: Recent Trends and Current Issues
17
competition in retail electricity markets has influenced all facets of the power system and may shift the relative importance of different causes of outages.
3.2.1 Lack of Investment in Upgrades and Maintenance
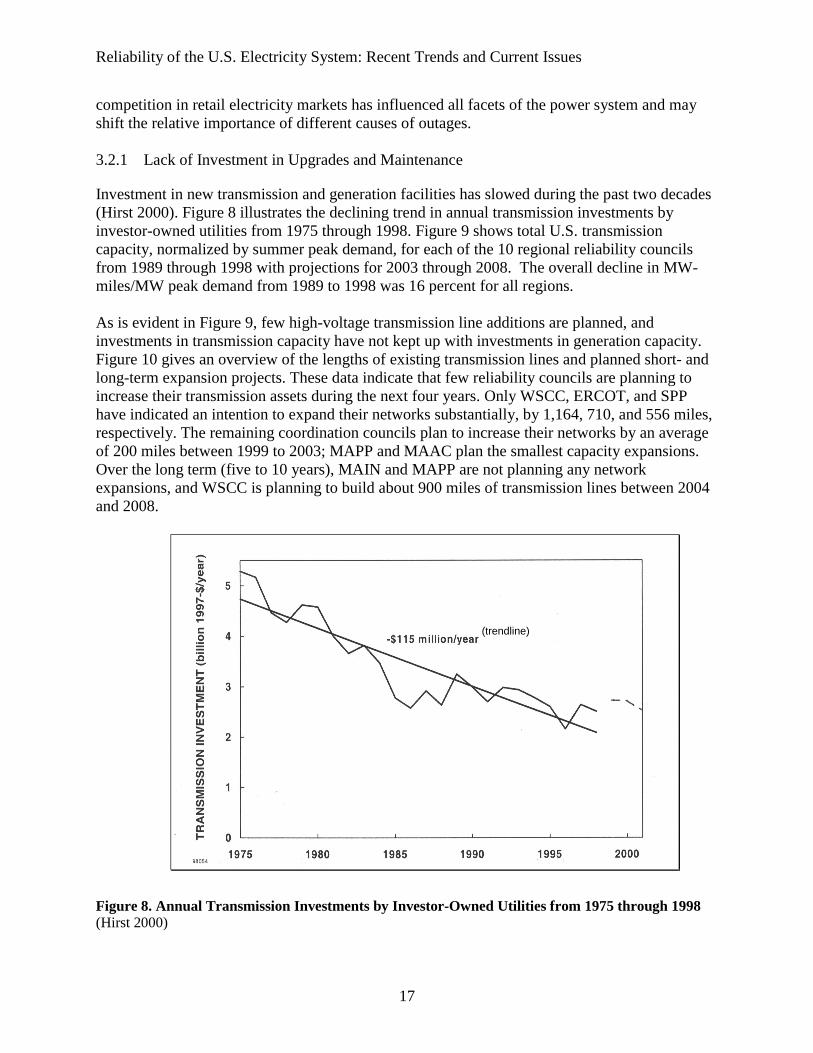
Investment in new transmission and generation facilities has slowed during the past two decades (Hirst 2000). Figure 8 illustrates the declining trend in annual transmission investments by investor-owned utilities from 1975 through 1998. Figure 9 shows total U.S. transmission capacity, normalized by summer peak demand, for each of the 10 regional reliability councils from 1989 through 1998 with projections for 2003 through 2008. The overall decline in MW-miles/MW peak demand from 1989 to 1998 was 16 percent for all regions. As is evident in Figure 9, few high-voltage transmission line additions are planned, and investments in transmission capacity have not kept up with investments in generation capacity. Figure 10 gives an overview of the lengths of existing transmission lines and planned short- and long-term expansion projects. These data indicate that few reliability councils are planning to increase their transmission assets during the next four years. Only WSCC, ERCOT, and SPP have indicated an intention to expand their networks substantially, by 1,164, 710, and 556 miles, respectively. The remaining coordination councils plan to increase their networks by an average of 200 miles between 1999 to 2003; MAPP and MAAC plan the smallest capacity expansions. Over the long term (five to 10 years), MAIN and MAPP are not planning any network expansions, and WSCC is planning to build about 900 miles of transmission lines between 2004 and 2008.
Figure 8. Annual Transmission Investments by Investor-Owned Utilities from 1975 through 1998 (Hirst 2000)
(trendline)
Reliability of the U.S. Electricity System: Recent Trends and Current Issues
18
Figure 9. Total U.S. Transmission Capacity Normalized by Summer Peak Demand for Each of the 10 Regional Reliability Councils (Hirst 2000)
0
10,000
20,000
30,000
40,000
50,000
60,000
70,000
ECAR ERCOT FRCC MAAC MAIN MAPP NPCC SERC SPP WSCCRegion
leng
th [m
iles]
2004-20081999-20031999
Figure 10. Existing and Planned Network Expansion for the Years 2000 to 2008 for Lines Rated 230 kV and above (NERC 2000a)
Reliability of the U.S. Electricity System: Recent Trends and Current Issues
19
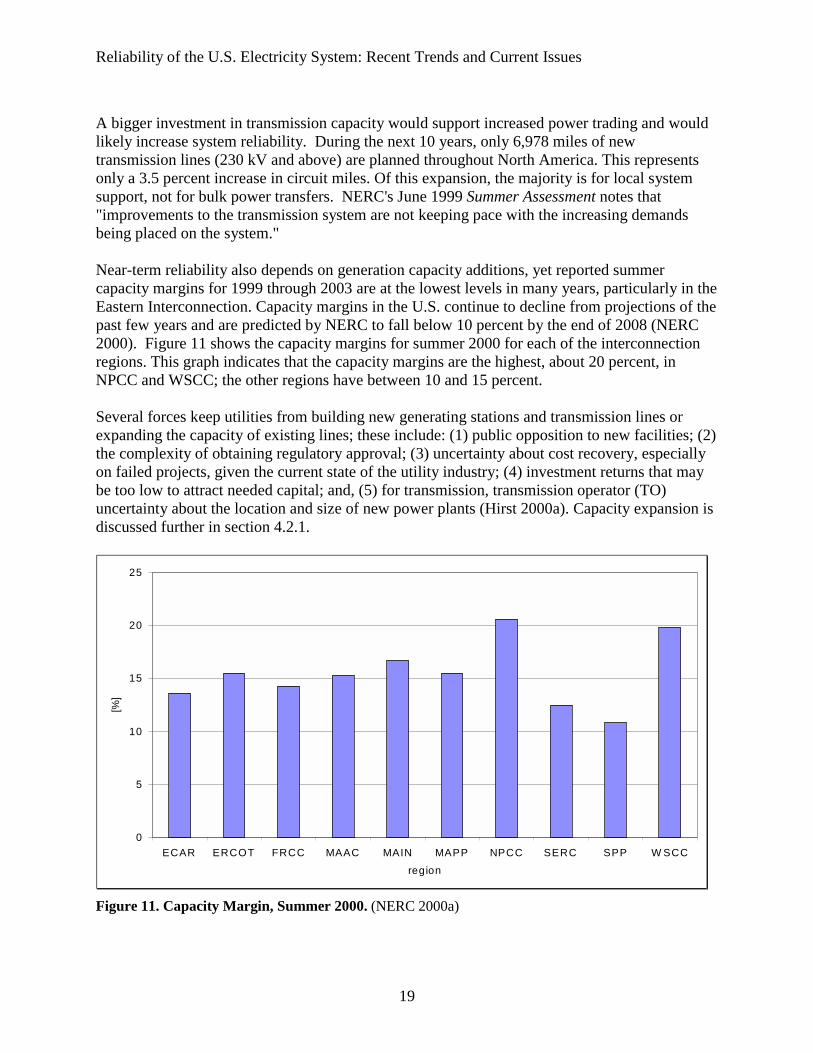
A bigger investment in transmission capacity would support increased power trading and would likely increase system reliability. During the next 10 years, only 6,978 miles of new transmission lines (230 kV and above) are planned throughout North America. This represents only a 3.5 percent increase in circuit miles. Of this expansion, the majority is for local system support, not for bulk power transfers. NERC's June 1999 Summer Assessment notes that "improvements to the transmission system are not keeping pace with the increasing demands being placed on the system." Near-term reliability also depends on generation capacity additions, yet reported summer capacity margins for 1999 through 2003 are at the lowest levels in many years, particularly in the Eastern Interconnection. Capacity margins in the U.S. continue to decline from projections of the past few years and are predicted by NERC to fall below 10 percent by the end of 2008 (NERC 2000). Figure 11 shows the capacity margins for summer 2000 for each of the interconnection regions. This graph indicates that the capacity margins are the highest, about 20 percent, in NPCC and WSCC; the other regions have between 10 and 15 percent. Several forces keep utilities from building new generating stations and transmission lines or expanding the capacity of existing lines; these include: (1) public opposition to new facilities; (2) the complexity of obtaining regulatory approval; (3) uncertainty about cost recovery, especially on failed projects, given the current state of the utility industry; (4) investment returns that may be too low to attract needed capital; and, (5) for transmission, transmission operator (TO) uncertainty about the location and size of new power plants (Hirst 2000a). Capacity expansion is discussed further in section 4.2.1.
0
5
10
15
20
25
ECAR ERCOT FRCC MAAC MAIN MAPP NPCC SERC SPP W SCCregion
Reliability of the U.S. Electricity System: Recent Trends and Current Issues
20
3.2.2 Exercise of Market Power by Generators
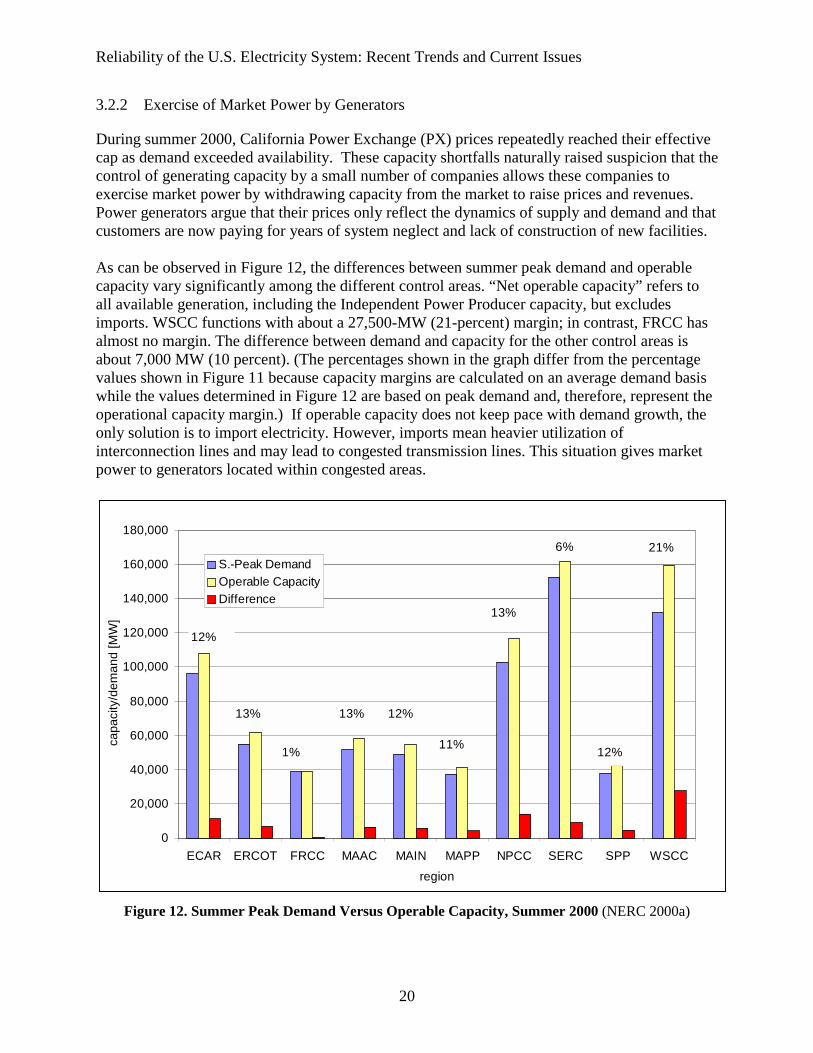
During summer 2000, California Power Exchange (PX) prices repeatedly reached their effective cap as demand exceeded availability. These capacity shortfalls naturally raised suspicion that the control of generating capacity by a small number of companies allows these companies to exercise market power by withdrawing capacity from the market to raise prices and revenues. Power generators argue that their prices only reflect the dynamics of supply and demand and that customers are now paying for years of system neglect and lack of construction of new facilities. As can be observed in Figure 12, the differences between summer peak demand and operable capacity vary significantly among the different control areas. “Net operable capacity” refers to all available generation, including the Independent Power Producer capacity, but excludes imports. WSCC functions with about a 27,500-MW (21-percent) margin; in contrast, FRCC has almost no margin. The difference between demand and capacity for the other control areas is about 7,000 MW (10 percent). (The percentages shown in the graph differ from the percentage values shown in Figure 11 because capacity margins are calculated on an average demand basis while the values determined in Figure 12 are based on peak demand and, therefore, represent the operational capacity margin.) If operable capacity does not keep pace with demand growth, the only solution is to import electricity. However, imports mean heavier utilization of interconnection lines and may lead to congested transmission lines. This situation gives market power to generators located within congested areas.
ECAR ERCOT FRCC MAAC MAIN MAPP NPCC SERC SPP WSCCregion
capa
city
/dem
and
[MW
]
S.-Peak DemandOperable CapacityDifference
12%
13%
1%
13% 12%
11%
13%
6%
12%
21%
Reliability of the U.S. Electricity System: Recent Trends and Current Issues
21
3.2.3 Volatile Prices
The day-ahead market of the California PX has experienced market price volatility. Figure 13 shows hourly, day-ahead prices from the market's inception in April 1998 to July 2000. During that period, prices repeatedly spiked by more than two orders of magnitude to the effective price caps of $250, $500, and $750 per MW. The effective cap was established by the price imposed in the California Independent System Operator (CAISO) imbalance energy market because no buyer will pay more in the imbalance market than needed to purchase from the CAISO as procurer of last resort. The price cap was established in 1998 after summer prices exceeded $10,000/MW. In July 2000, the California PX adopted an explicit price cap of $350/MWh.
Price spikes have various causes and are usually associated with high demand. One explanation is that less efficient generating resources are utilized during demand peaks. Some power plants only operate when prices are high enough to compensate for their start-up costs, high heat rates, and high fuel costs. However, these factors are not sufficient to explain the volatility seen in competitive markets. Another key contributor to volatility is that, in times of supply shortfall, rarely used generators must offer electricity above their marginal operating costs in order to recover their investment costs. High electricity prices signal to investors that building new power plants will likely be profitable; power prices may, in turn, drop if supply increases. The inconsistency between volatile power exchange prices and properly functioning markets is that most consumers are still charged a single per-kWh fee on their electricity bills rather than a time-of-use rate, which is an important
Reliability of the U.S. Electricity System: Recent Trends and Current Issues
22
issue that has so far not been addressed in the restructuring process. Prices can only be driven to such high spikes because demand does not moderate when prices rise; i.e., demand is inelastic. In restructured U.S. electricity markets, this inelasticity is extreme because so few consumers pay real-time prices. Until metering capacity, tariff structures, and contracts are in place to allow a significant number of customers to reduce power use when prices rise, extreme price spikes are likely to continue.
3.2.4 Congestion
In a changing industry, system inputs such as generation and demand may have significantly different patterns than in a regulated industry. If the transmission network is not congested, power is a commodity. When market incentives fully take hold, however, patterns of network use may change rapidly and turn what has been an apparently uncongested and unconstrained system to one in which congestion is an immediate, significant issue. Congestion may occur for several reasons: (1) outages of generators, consumers, or transmission facilities; (2) major changes in load flow because of increasing exports, imports, and transits; or (3) loop flows. These constraints on the transmission network’s capacity are the key to achieving most of the economic benefits promised by restructuring and profoundly affect competition in electricity generation. 3.2.4.1 Operation
Transmission systems are more frequently congested today than in the past. Historically, vertically integrated utilities accounted for transmission constraints when making daily operating plans. Vertical integration enabled them to use generating resources in ways that would not overload the network. Costs were increased by the need to dispatch higher-priced generation to meet customer loads. Thus, the economic loss from use of high-priced generation was a function of the duration of the use and the location and price of the more expensive generation resource. To the extent that reliability and economics affected each other, effects were internalized within the former vertically integrated utilities. The costs and benefits of actions taken to insure reliability were felt by the same parties – the utility and its retail customers.
Because of regulatory changes, transmission grids are used today in ways that were not envisioned when they were designed. These systems were originally planned and built to connect a utility's generating stations to its load centers and were later expanded to interconnect with neighboring grids. Because of the increasingly open energy market, these systems are now used to transport power over long distances, mostly for commercial rather than technical reasons. This increase in electricity trade will mean that the bulk power grid is more heavily utilized and operated closer to its physical limits than was the case in the past. Furthermore, power flows were much more predictable when utilities were regulated because the same generators were used to supply the same loads every day. Today's independent power producers do not know beforehand the likely condition of the transmission system and the operation of other generators on the grid. Therefore, they can easily exacerbate congestion.
Reliability of the U.S. Electricity System: Recent Trends and Current Issues
23
3.2.4.2 Expansion Planning and Pricing
With over-capacity in the electricity transmission network, trading of generation would tend to extend to wider geographic regions. Less transmission expansion will lead to more grid constraints and increased congestion. Traditionally, transmission upgrade decisions were dominated by local need, and pricing for wholesale transmission services was a secondary concern. In an increasingly deregulated market, third-party uses of the transmission system will come to predominate. In competitive markets, the transmitting utility is required to provide wholesale transmission services based on rates, charges, terms, and conditions that permit the recovery of all costs incurred in connection with transmission and necessary associated services. These include any benefits to the transmission system of providing the transmission service and the costs of any expansion of transmission facilities (Kawann 2000). Because reliability and markets are tightly coupled, construction of new transmission lines and suitably located (distributed) generation could reduce congestion in the long run. In addition, for markets to function well, the correct price signals must be delivered to generators, consumers, and investors. When congestion occurs in today's deregulated markets, the costs are paid only by the market participants responsible for the congestion and are no longer shared among all transmission users. 3.3 Disturbance History
Electricity system reliability problems are highly temporal and geographically distinct. They can be fleeting, occurring during only a small number of hours and days per year. They are typically measured by the length and frequency of outages experienced by customers. In general, reliability is assessed in several areas, including generation, transmission, and distribution. The majority of G&T disturbances can be attributed to a handful of causes, primarily weather, maintenance, and operations. Most significant are extreme weather and storm events, equipment failures, human error during maintenance or operations, tree falls/interference, interference by birds and other wildlife, excess load, and inaccurate demand forecasts/nameplate ratings. The relative importance of these depends on geography and fluctuates over time.
3.3.1 NERC's Disturbance Analysis Working Group
According to Section 311 of the Federal Power Act, every major electric utility system emergency must be reported to DOE's Emergency Operation Center (EOC). A major event is defined as (1) loss of firm system loads,4 (2) voltage reductions or public appeals to reduce consumption,5 (3) vulnerabilities that could affect bulk electric power system adequacy or reliability,6 (4) reports of other emergency conditions or abnormal events, or (5) fuel supply
4 These losses must be (1) more than 100 MW of the bulk power supply, (2) more than 15 minutes for equipment failures, or (3) more than three hours, 50,000 customers, or 50 percent of the system, whichever is less, for other events. 5 Any anticipated or actual reduction of three percent or greater or any public appeal to reduce the use of electricity for purposes of maintaining the continuity of the bulk electricity system. 6 Specifically sabotage (not vandalism).
Reliability of the U.S. Electricity System: Recent Trends and Current Issues
24
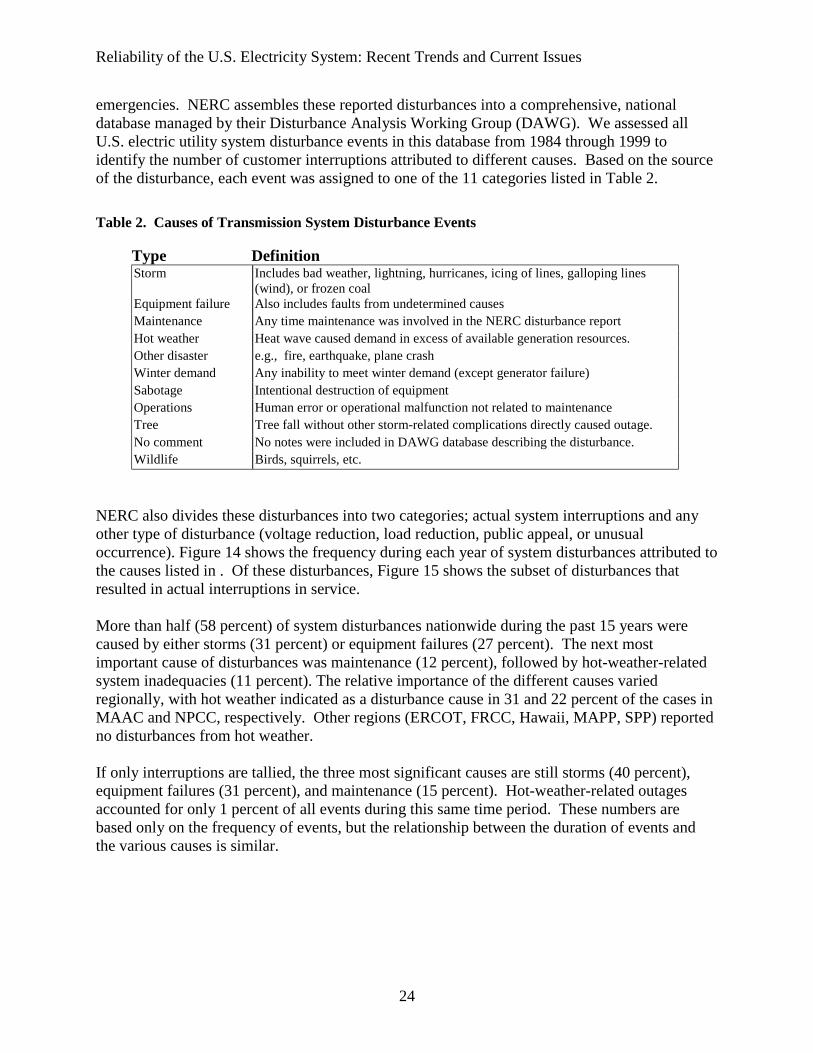
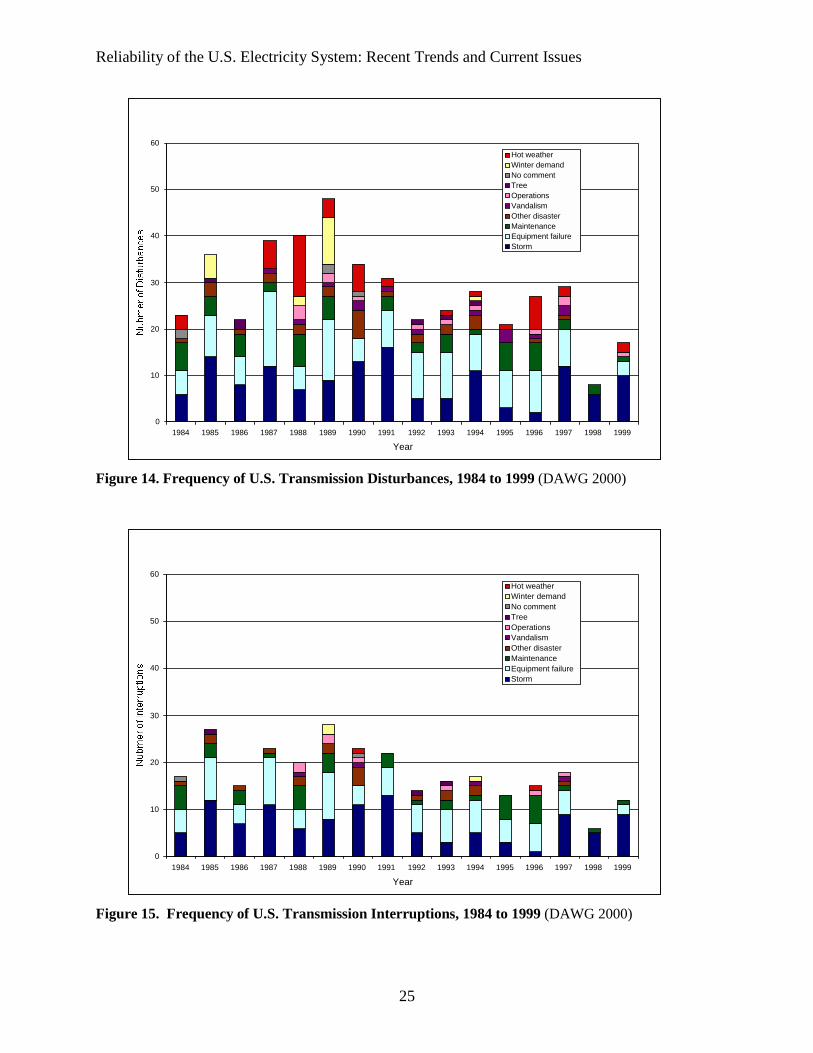
emergencies. NERC assembles these reported disturbances into a comprehensive, national database managed by their Disturbance Analysis Working Group (DAWG). We assessed all U.S. electric utility system disturbance events in this database from 1984 through 1999 to identify the number of customer interruptions attributed to different causes. Based on the source of the disturbance, each event was assigned to one of the 11 categories listed in Table 2. Table 2. Causes of Transmission System Disturbance Events
Type Definition Storm Includes bad weather, lightning, hurricanes, icing of lines, galloping lines
(wind), or frozen coal Equipment failure Also includes faults from undetermined causes Maintenance Any time maintenance was involved in the NERC disturbance report Hot weather Heat wave caused demand in excess of available generation resources. Other disaster e.g., fire, earthquake, plane crash Winter demand Any inability to meet winter demand (except generator failure) Sabotage Intentional destruction of equipment Operations Human error or operational malfunction not related to maintenance Tree Tree fall without other storm-related complications directly caused outage. No comment No notes were included in DAWG database describing the disturbance. Wildlife Birds, squirrels, etc.
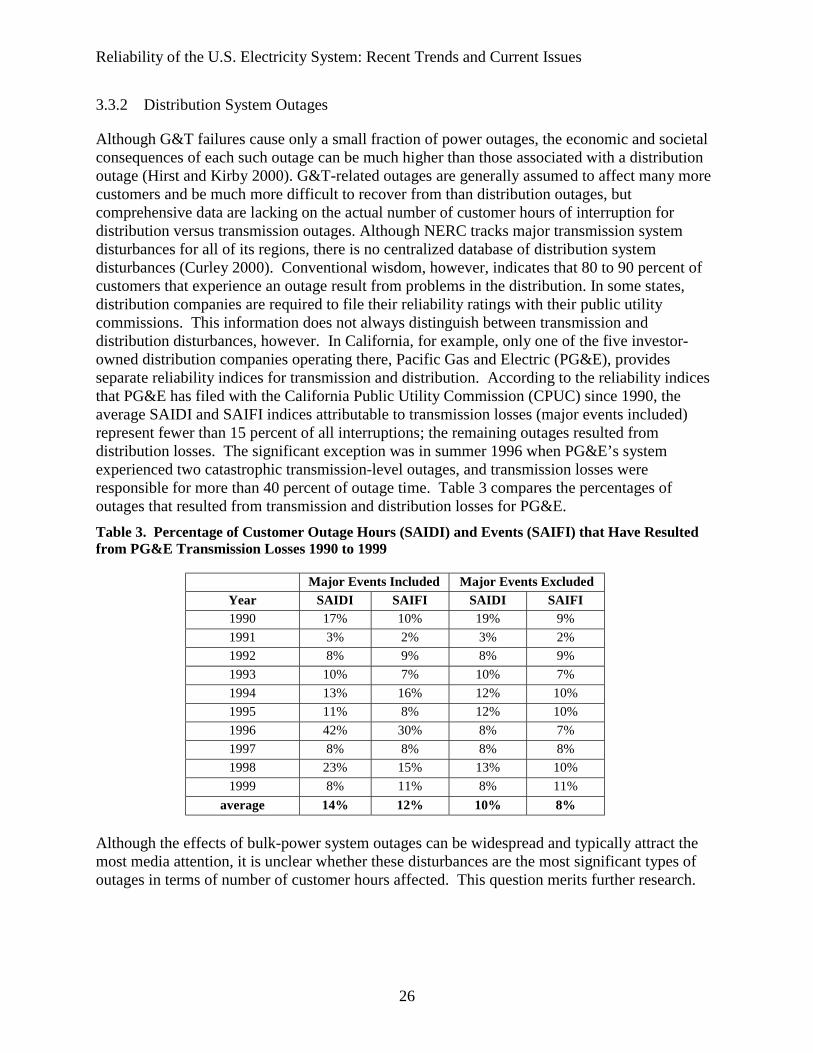
NERC also divides these disturbances into two categories; actual system interruptions and any other type of disturbance (voltage reduction, load reduction, public appeal, or unusual occurrence). Figure 14 shows the frequency during each year of system disturbances attributed to the causes listed in . Of these disturbances, Figure 15 shows the subset of disturbances that resulted in actual interruptions in service. More than half (58 percent) of system disturbances nationwide during the past 15 years were caused by either storms (31 percent) or equipment failures (27 percent). The next most important cause of disturbances was maintenance (12 percent), followed by hot-weather-related system inadequacies (11 percent). The relative importance of the different causes varied regionally, with hot weather indicated as a disturbance cause in 31 and 22 percent of the cases in MAAC and NPCC, respectively. Other regions (ERCOT, FRCC, Hawaii, MAPP, SPP) reported no disturbances from hot weather. If only interruptions are tallied, the three most significant causes are still storms (40 percent), equipment failures (31 percent), and maintenance (15 percent). Hot-weather-related outages accounted for only 1 percent of all events during this same time period. These numbers are based only on the frequency of events, but the relationship between the duration of events and the various causes is similar.
Reliability of the U.S. Electricity System: Recent Trends and Current Issues
25
Figure 14. Frequency of U.S. Transmission Disturbances, 1984 to 1999 (DAWG 2000)
Figure 15. Frequency of U.S. Transmission Interruptions, 1984 to 1999 (DAWG 2000)
Hot weatherWinter demandNo commentTreeOperationsVandalismOther disasterMaintenanceEquipment failureStorm
Reliability of the U.S. Electricity System: Recent Trends and Current Issues
26
3.3.2 Distribution System Outages
Although G&T failures cause only a small fraction of power outages, the economic and societal consequences of each such outage can be much higher than those associated with a distribution outage (Hirst and Kirby 2000). G&T-related outages are generally assumed to affect many more customers and be much more difficult to recover from than distribution outages, but comprehensive data are lacking on the actual number of customer hours of interruption for distribution versus transmission outages. Although NERC tracks major transmission system disturbances for all of its regions, there is no centralized database of distribution system disturbances (Curley 2000). Conventional wisdom, however, indicates that 80 to 90 percent of customers that experience an outage result from problems in the distribution. In some states, distribution companies are required to file their reliability ratings with their public utility commissions. This information does not always distinguish between transmission and distribution disturbances, however. In California, for example, only one of the five investor-owned distribution companies operating there, Pacific Gas and Electric (PG&E), provides separate reliability indices for transmission and distribution. According to the reliability indices that PG&E has filed with the California Public Utility Commission (CPUC) since 1990, the average SAIDI and SAIFI indices attributable to transmission losses (major events included) represent fewer than 15 percent of all interruptions; the remaining outages resulted from distribution losses. The significant exception was in summer 1996 when PG&E’s system experienced two catastrophic transmission-level outages, and transmission losses were responsible for more than 40 percent of outage time. Table 3 compares the percentages of outages that resulted from transmission and distribution losses for PG&E. Table 3. Percentage of Customer Outage Hours (SAIDI) and Events (SAIFI) that Have Resulted from PG&E Transmission Losses 1990 to 1999
average 14% 12% 10% 8% Although the effects of bulk-power system outages can be widespread and typically attract the most media attention, it is unclear whether these disturbances are the most significant types of outages in terms of number of customer hours affected. This question merits further research.
Reliability of the U.S. Electricity System: Recent Trends and Current Issues
27
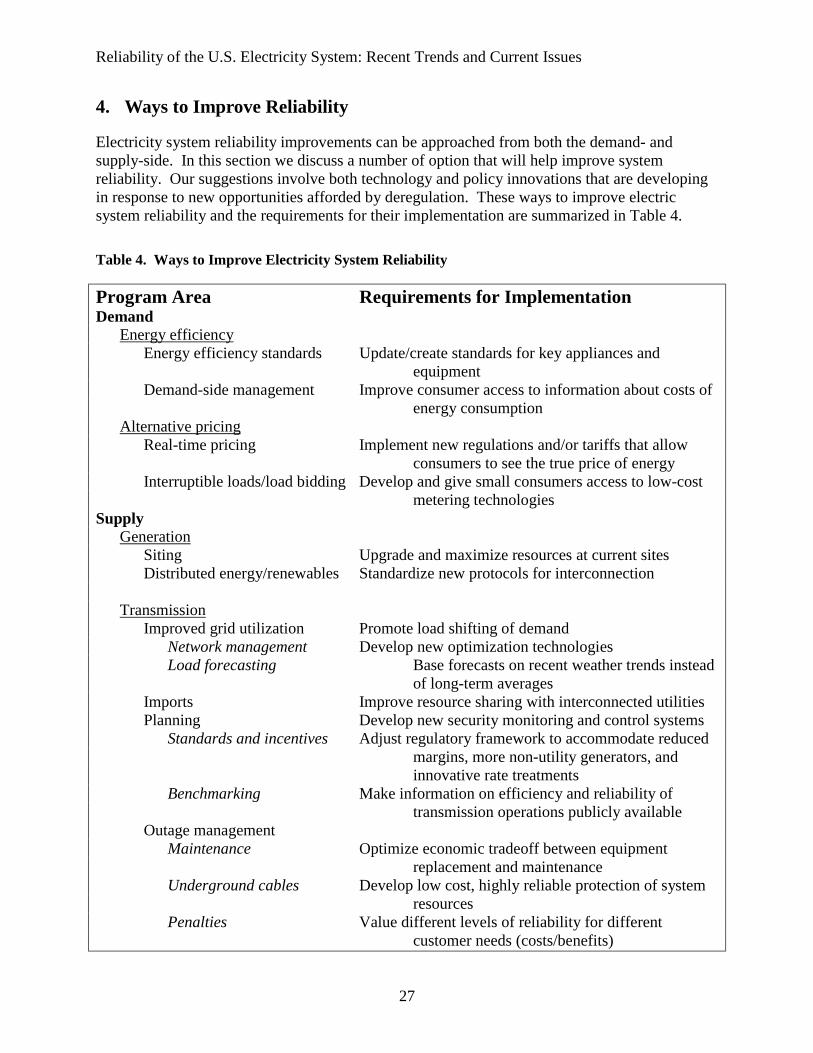
4. Ways to Improve Reliability
Electricity system reliability improvements can be approached from both the demand- and supply-side. In this section we discuss a number of option that will help improve system reliability. Our suggestions involve both technology and policy innovations that are developing in response to new opportunities afforded by deregulation. These ways to improve electric system reliability and the requirements for their implementation are summarized in Table 4. Table 4. Ways to Improve Electricity System Reliability
Program Area Requirements for Implementation Demand Energy efficiency Energy efficiency standards Update/create standards for key appliances and
equipment Demand-side management Improve consumer access to information about costs of
energy consumption Alternative pricing Real-time pricing Implement new regulations and/or tariffs that allow
consumers to see the true price of energy Interruptible loads/load bidding Develop and give small consumers access to low-cost
metering technologies Supply Generation Siting Upgrade and maximize resources at current sites Distributed energy/renewables Standardize new protocols for interconnection Transmission Improved grid utilization Promote load shifting of demand Network management Develop new optimization technologies Load forecasting Base forecasts on recent weather trends instead
of long-term averages Imports Improve resource sharing with interconnected utilities Planning Develop new security monitoring and control systems Standards and incentives Adjust regulatory framework to accommodate reduced
margins, more non-utility generators, and innovative rate treatments
Benchmarking Make information on efficiency and reliability of transmission operations publicly available
Outage management Maintenance Optimize economic tradeoff between equipment
replacement and maintenance Underground cables Develop low cost, highly reliable protection of system
resources Penalties Value different levels of reliability for different
customer needs (costs/benefits)
Reliability of the U.S. Electricity System: Recent Trends and Current Issues
28
4.1 Peak-Demand Reduction
An important, cost-effective, and environmentally conscious option for mitigating potential electricity system resource deficiencies is to reduce or flatten system load. Load can be reduced by increasing customer access to energy-efficiency programs, time-of-use pricing, interruptible contracts, and load bidding. The competitive environment fostered by deregulation could empower informed consumers and allow the market to drive innovative solutions that will produce a more efficient power system. Not only can efficiency efforts enhance reliability, but they can also reduce energy costs and yield environmental benefits (e.g., reduced carbon emissions, decreased air pollution) by reducing energy production and transport. As some regions of the U.S. are becoming net electricity importers, demand reduction can also contribute to regional security by alleviating dependence on external resources.
4.1.1 Energy Efficiency
The U.S. uses, on average, twice as much energy per capita as countries with similar standards of living, including many European nations (IEA 1999). Because the U.S.’s energy consumption is relatively inefficient, significant energy-efficiency improvements are possible. Energy efficiency first appeared as a U.S. policy objective during the 1970s when rising electricity demand, prices, and capital costs stimulated awareness of the need for conservation efforts. Lower energy costs in the mid-80s and 1990s, and the uncertainty surrounding deregulation in the late 1990s served to dampen conservation efforts in the U.S. since their earlier emergence. Continued technological advancements in energy conservation measures and dramatically rising energy costs have opened new opportunities for further conservation impacts. Raynolds and Cowart (2000) contend that end-use energy efficiency programs can make a very cost-effective contribution to electricity system reliability during the next decade. Many conservation programs, such as efficiency standards, are most effective in reducing long-term demand growth and addressing concerns about supply adequacy. Some efficiency programs can also be useful near-term solutions because they can be more rapidly implemented than, for example, the siting and construction of new generation. Energy efficiency will not entirely obviate the need for new generation or transmission capacity, but conservation can significantly reduce both the need for and cost of new capacity. For demand to be effectively reduced, efficiency efforts must be coupled with energy conservation objectives. 4.1.1.1 Energy Efficiency Standards
Efficiency standards for major appliances and equipment are one essential approach to long-term demand reduction. These programs, if focused on energy conservation as well as efficiency, have been shown to significantly reduce demand growth, especially if they target end uses that contribute heavily to peak demand. Immediate, customer-side efficiency upgrades, such as those supported by the CPUC's energy-efficiency assistance funds, can also be employed to address shorter-term demand reduction needs although such programs are typically much smaller in scale and impact than widespread efficiency standards. The contribution of energy-efficiency measures to reducing base or peak load depends on the technologies targeted: programs focused on lighting and refrigeration efficiency, for example, reduce base load; in contrast, air-conditioner efficiency gains would help reduce summertime
Reliability of the U.S. Electricity System: Recent Trends and Current Issues
29
peak load. (Any reduction in base load also reduces the "height" of the peak load but may actually enhance the peak effect.) Recent trends in reduced electricity surplus and higher summertime system peak (Perlman 2000) are good reasons for particular attention to be given to peak load appliances. 4.1.1.2 Demand-Side Management
Least-cost planning principles for energy service providers assert that it is often more cost effective to assist customers in reducing energy demand through more efficient technologies than to build new power plants. Increasing the adoption of energy-efficiency measures can enhance electricity system reliability by reducing peak demand growth in areas experiencing electricity generation shortages or transmission or distribution constraints. In other words, programs to stimulate adoption of energy-efficient technologies and practices can provide rapid load relief in areas with fast-growing demand. In this respect, technologies and practices that reduce loads during times of peak demand, such as high-efficiency air-conditioning and lighting equipment, are especially valuable (Nadel et al. 2000). Demand-side management (DSM) strategies are generally pursued by utilities only when these strategies cost less per unit of energy than new facilities (ACEEE 2000). These programs were more common in the 1980s and early 1990s and often offered state-sponsored incentives to encourage their adoption. In the mid-1990s, as electric industry restructuring began, many utilities cut back DSM spending to accelerate depreciation on high-cost assets and reduce short-term rates (ACEEE 2000). Deregulated electricity markets are creating opportunities to increase the efficiency of the system by returning to past successful DSM strategies and enabling utilities to employ additional mechanisms, such as time-of-use pricing, to give customers more information about the real costs of their energy consumption decisions. 4.1.2 Alternative Pricing Arrangements
4.1.2.1 Real-Time Pricing
In principle, one way to improve reliability in restructured markets would be through the widespread exposure of retail customers to time-of-use or real-time prices. Most consumers today pay rates that do not vary with time or load. Real-time pricing would help customers determine how much electricity to consume and when. If customers are exposed to high price spikes in times of peak demand, many will likely reduce demand or adjust the timing of their consumption (load shifting) to reduce the magnitude of these price spikes, thus reducing demand on the system when it is most taxed. Even if only a small fraction of retail load was billed with real-time pricing, price spikes would likely be less frequent and dramatic, and the need for additional generating capacity would be reduced. Not all retail customers would have to buy electricity according to real-time rates, but all consumers should have the option to do so. If customers were given information on the real-time costs of their electricity consumption, some customers would change electricity use in real-time in ways that would improve bulk-power reliability and lower electricity costs for all consumers. An off-peak rate discount, for example, would encourage shifting of non-essential
Reliability of the U.S. Electricity System: Recent Trends and Current Issues
30
consumption to times when system resources are plentiful (King 1999). Such behavior modifications would likely be a rapid consequence of time-of-use pricing. If real-time pricing is to be a widespread option, substantial advances will be necessary in communication and metering technology and infrastructure. For example, widespread installation of affordably priced real-time or time-of-use meters will be necessary for participating customers. Automated data acquisition devices (e.g., SCADA) will be necessary to track individual load profiles. System controls that can monitor numerous local control hubs will be necessary as real-time pricing dramatically increases the information management burden for the system operator. Policy mechanisms that encourage price responsiveness would enable at least some customers (especially large or aggregate users) to benefit from real-time pricing. Granting customer access to more time-sensitive energy price information is fundamental. Distinguishing prices on a coarse level, such as on- and off-peak, is a way to initiate a transition to more a refined system real-time pricing. Such a distinction could encourage load shifting during peak times and be more cost effective given the currently available metering technology and infrastructure. Market electricity prices vary with loads, and loads are very weather- (especially temperature-) sensitive. As a consequence, demand-side measures related to heating and air conditioning are very effective in combination with time-variable electricity prices. Overall efficiency of the system and end uses could be greatly enhanced if consumers had access to both demand-side conservation measures and time-of-use pricing. Another strategy in developing market-based mechanisms for promoting electricity reliability could be to allow customers to participate in energy and ancillary service markets. They could agree to interruptible loads, which are discussed in the next section. 4.1.2.2 Interruptible Loads and Load Bidding
Interruptible loads (mostly) belong to large industrial customers who pay a reduced rate in exchange for agreeing to have their electricity supply shut off in times of high demand and low capacity. This rate design provides these customers an incentive to shift their loads. Interruptible service is a voluntary program that results in lower overall electricity rates. Some utilities and system operators are experimenting with real-time and price-sensitive interruptible tariffs. However, these opportunities are now primarily available to only the largest customers because the costs of participation are high compared to the savings. For example, PG&E requires residential customers to pay up to $1,500 to install a real-time meter and requires them to supply a dedicated phone line for it. Advances in communication and metering technologies could increase the opportunities for smaller customers to participate. Customers accustomed to very few interruptions in service might not find this option acceptable, however.
One way to give small-end-use customers the chance to participate in the interruptible load market would be a program offering lower tariffs if these customers agree to shed some of their electricity load during peak conditions (King 1999). For this option to be available, new real-
Reliability of the U.S. Electricity System: Recent Trends and Current Issues
31
time metering technologies must be developed and installed to enable transmission of information between the utility and the consumer.
Figure 16 gives an overview of summer 2000 interruptible demand in the different NERC regions. It shows that SERC had the highest share of interruptible demand, roughly 8,000 MW; the amount in the other regions varied between 1,200 and 4,700 MW. These amounts of interruptible demand represent from one to six percent of the regions’ peak demand. The roles of interruptible loads and direct-control load management in maintaining the balance between resources and demand may be changing as the industry moves to a competitive market. If interruptions can be rapid, i.e., within 10 minutes, interruptible load could be included as an Ancillary Service (AS) in the non-spinning reserve. This possibility could give quickly interruptible loads the chance to bid and participate in the AS market. If loads could participate in the AS market, it would create a competitive market for demand responsiveness in addition to the one that exists for supply-side generation. This competition is an exciting opportunity to create economic incentives for demand reduction, increase demand responsiveness, and improve the overall efficiency of the market. If the right financial incentives and signals are established, contractually interruptible loads could become as important to the resource and demand balance as the addition of new generation.
ECAR ERCOT FRCC MAAC MAIN MAPP NPCC SERC SPP WSCCregion
inte
rrupt
ible
dem
and
[MW
]
Reliability of the U.S. Electricity System: Recent Trends and Current Issues
32
4.2 Supply-Side Improvements
Power system planners are faced with the difficult task of maintaining system reliability while minimizing the costs of upgrades and interruptions. System adequacy can be significantly increased by maintaining a higher reserve level, and the associated increase in installation costs can be offset by reduced supply interruption costs. The selection of an optimum adequacy level is, therefore, an important engineering decision, which should take into account the costs of providing specified reliability levels and the corresponding benefits that accrue to society (Goel and Billinton 1993).
4.2.1 Generation
4.2.1.1 Siting
A major concern about the prospects for system adequacy is the growing difficulty of siting new generating stations and transmission lines. Many existing sites, although valuable and profitable, are not near growing loads. In addition, many nuclear stations are nearing the ends of their active lives. Decisions must be made about how to balance the need for additional G&T investments against local opposition to the construction of G&T facilities. In San Diego, for example, where record-high electricity bills have resulted from congestion, generation inadequacy, and competitive markets, air quality restrictions on NOx emissions severely limit the possibilities for siting new fossil fuel power plants (Perlman 2000). Obtaining approval to site and build new capacity is becoming more difficult because of environmental concerns, concerns about the potential health effects of air pollution and electromagnetic fields (EMFs), special interest groups' objections, and the concern that property values will decline along transmission routes. Land acquisition costs and considerations of fuel availability also impact construction and siting decisions. The continued demand for more and more power is increasingly difficult to accommodate, especially in densely populated areas, as a result of these siting issues. In addition, there are economic forces driving the siting of new power plants, which are being built primarily where power markets look most profitable. However, these locations do not necessarily have the greatest need for new power because an elaborate system of price caps and other market constraints may suppress the rising prices that should be a signal of scarcity. The economic drivers for siting new capacity are also clouded by economies of scale. G&T construction involves large economies of scale, which means that building more capacity than is needed in the near term is less expensive than building just what is needed at the time. However, the construction of new, large-scale capacity is often opposed by local residents and landowners and is, therefore, politically difficult. Building new transmission facilities to eliminate congestion without building new generation is often not feasible because congestion depends on the locations of generation and load, not just their magnitude. However, any additional capacity increases reliability and improves efficiency to some degree by reducing losses and increasing operating flexibility.
Reliability of the U.S. Electricity System: Recent Trends and Current Issues
33
Because of the problems associated with constructing new transmission lines, it is important to examine options for increasing transmission capability at present sites and making maximum use of existing transmission systems through upgrades. When feasible, upgrades are attractive because the costs are lower and lead times are shorter than those for constructing new lines. 4.2.1.2 Distributed Energy Resources and Renewable Energy
Distributed generation (DG) is defined as electricity generation close to the point of consumption. Great interest is expected in DG technologies to help utilities respond rapidly to an increase demand for electricity in areas where demand is already high (Marnay et al. 2000). Developing DG includes supporting development of interconnection standards for distributed energy sources. Distributed, non-polluting renewable energy sources can be effective in offsetting peak loads if the availability of the resources is well matched to times of peak demand. Perez et al. (1997) argue that solar photovoltaic (PV) output is well correlated to heat-wave-driven loads (i.e., air-conditioning-dominated loads) because the same sunny conditions that go with heat waves supply large amounts of solar energy. During the August 1996 outages in California, for example, PV availability was at a maximum. Such well-matched supply and demand load profiles could provide relief to both individual consumers and the system during heat-wave-induced peaks. Large customers may invest in their own DG capacity for business reasons. For Oracle Corporation, for example, the promise of lower electricity prices with deregulation was not worth potentially decreased reliability. After the huge power failure in August 1996, the software company spent more than $6 million to build its own substation and generators capable of supplying the Oracle headquarters in Redwood Shores, California (Perlman 2000). Other companies may follow suit as large commercial developments place added pressure on already over-extended generation resources. Air quality concerns and other siting issues will still have to be addressed for projects like Oracle’s, depending on the distributed technology employed. Much of the debate about DG has to do with technical issues related to the connection of DG to the power grid. At this point, no nationally recognized standards for interconnection exist (Blazewicz et al. 2000). Many of the processes that are employed today were developed for large qualifying facilities rather than DG resources. Another problem is the difficulty in standardizing protective equipment that is needed to ensure safe interconnection. Utilities have developed individual technical interconnection requirements to maintain their grid performance and minimize negative operational impacts of DG. However, as small generators proliferate, such individualized attention will not be practical. Thus, standards are needed for a cost-effective interconnection solution that does not jeopardize the safety and reliability of the electric power system. Currently, the IEEE is working on such standards, but they will take some time to apply. Connection rules are not the only issue. The emerging needs of DG for dispatch, metering, communication, and control standards must also be addressed. One key is to develop a national process that is transparent and efficient and does not burden distributed generators or distribution companies.
Reliability of the U.S. Electricity System: Recent Trends and Current Issues
34
4.2.2 Transmission
4.2.2.1 Improved Grid Utilization and Forecasting
Improved utilization of existing grid resources is another way to improve reliability while accommodating a lower reserve margin than in the past. As already discussed, utilization of existing resources can be maximized by reducing growth in overall and peak demand through investments in energy efficiency and programs to shift load from peak periods. Advancements in network management technologies, such as Flexible AC Transmission Systems (FACTS), can also help optimize system efficiency.7 Improved analytic models for load forecasts, power systems simulations, and contingency assessments (Marnay et al. 2000) would also contribute to reliability and could reduce the size of the required reserve margin. Accurate load forecasts should be based on recent weather trends instead of long-term averages. CAISO (1999) suggests that, for the design of regional transmission facilities, a one-in -five-year extreme weather load level should be assumed. For studies addressing local-load-serving concerns, a one-in-10-year extreme weather load level should be assumed. Using a higher standard for local areas will help minimize the potential for interruption of customer loads. To optimize available network capacity, the National Grid Company (NGC) in England has integrated its demand forecasts with day-ahead weather forecasts. This information is used to calculate enhanced ratings on certain critical lines, enabling them to carry as much power as possible. The software takes account of wind speed, ambient temperature, and solar radiation. NGC also considers the individual demand forecasts of suppliers, network operators, directly connected customers, and, in certain cases, generators. It refers to information sources such as weather forecasts, because, for example, peak winter demand can increase by up to 400MW with a 1º C fall in temperature. The results of using this software have been impressive: NGC achieved up to 21 percent increases in transmission line capacity ratings, which, on some circuits, can significantly ease power flow restrictions. Given the critical nature of demand forecasts in ensuring continued adequacy of resources, the methods by which demand forecasts are developed and reported must undergo major revisions to keep pace with the changes in the competitive electricity market (NERC 2000b). 4.2.2.2 Imports
Interconnection with neighboring utilities permits sharing of resources, which reduces the amount of extra generating capacity each utility has to maintain for reliability purposes. Resource-sharing can also lead to a dependence on out-of-state (or -country) resources. The non-simultaneous transfer capabilities shown in Figure 17 represent the transmission network’s capability to transfer electricity from one area to another. Different patterns of demand and generation cause variations in transfer capabilities on a day-to-day basis. First Contingency Incremental Transfer Capability (FCITC) is the amount of electricity, measured incrementally
7 See Appendix B for a description of FACTS
Reliability of the U.S. Electricity System: Recent Trends and Current Issues
35
Figure 17. Normal Base Electricity transfer and First Contingency Incremental Transfer Capabilities in MW, Summer 2000 (NERC 2000a) above normal base transfers, that can be transferred over the transmission network in a reliable manner. The projected purchases and sales of electricity for each of the NERC regions in summer 2000 is shown in Figure 18. This graph indicates that many regions, particularly those with populous states such as California and New York, are becoming net importers of electricity (Perlman, 2000) as their demand exceeds the available local supply.
Reliability of the U.S. Electricity System: Recent Trends and Current Issues
36
Figure 18. Projected Purchases and Sales in Summer 2000 (NERC 2000a)
4.2.3 Planning
As a consequence of the increase in transactions and the reduction in transmission investments, transmission systems are now operated closer to their limits, which can compromise reliability. New security monitoring and control systems as well as a new regulatory framework are needed to manage this risk. Conflicts over transmission planning are increasingly associated with the addition of non-utility generation to the power system because non-utility generators often rely on regulatory interventions in their negotiations. A deregulated market that does not provide for non-utility generators in transmission planning may reduce competition among generators and customer choice of suppliers. Transmission planning is complex for several reasons: the size of the capital investment required for system expansion is large, the asset lives and lead times are long, and the benefits can be very dispersed and changeable over time. Furthermore, obtaining permits for the siting of new transmission is very difficult because of environmental concerns and local opposition to new facilities. 4.2.3.1 Standards and Incentives
One option for addressing transmission reliability while opening markets to competition for generation and retail services is to continue to promote monopoly management of transmission operations and investment. The monopoly would take on the obligation to provide transmission service for everyone. To date, market-based methods or appropriate incentives to prompt transmission system additions and reinforcements have not been developed to support the needs
0
1,000
2,000
3,000
4,000
5,000
6,000
7,000
8,000
9,000
ECAR ERCOT FRCC MAAC MAIN MAPP NPCC SERC SPP WSCCregion
capa
city
[MW
]
Purchases Sales
Reliability of the U.S. Electricity System: Recent Trends and Current Issues
37
of a competitive energy market. Because explicit links between congestion pricing and transmission investment have not yet been made (Hirst and Kirby 2000), reliability of the transmission system in the newly deregulated market is uncertain. A new organization, likely to be similar to NERC, will be responsible for developing, implementing, and enforcing mandatory reliability standards nationwide with FERC oversight. Currently, compliance with NERC standards is voluntary, subject only to peer pressure (Hirst 2000a). To encourage utilities to join RTOs and to ensure appropriate expansion of transmission grids, FERC will consider innovative transmission rate treatments. Such innovations might include rate caps, risk-adjusted rates of return on transmission investments, shorter depreciation schedules, and performance-based transmission rates. Applications for innovative rates should be required to show that the rates benefit consumers, not just transmission owners (Hirst and Kirby 2000). 4.2.3.2 Benchmarking
Benchmarking is an analytical method of comparing indicators of one company with those of comparable or better companies. By developing key indicators for an industry, benchmarking provides individual companies with an understanding of their own cost structures, including what creates costs and where the company might improve. Benchmarking offers utility management, boards, and owners an opportunity to compare their companies with other utilities. If effectively designed, benchmarking can be used for any company; its output is objective, allowing comparison across an entire sector; and its feedback is specific, making it an important, concrete indicator of performance. An important contribution to promoting increased efficiency in the energy supply is the implementation of efficiency factors for transmission. These factors are based on the annual collection of accounting data from all companies involved in the transmission of power and provide significant information about each company’s performance. When this information is public, utilities can “benchmark” their performances in relation to those of their domestic and international peers. Deregulation will demand continuous efficiency improvements from market participants. Companies not attempting to reduce the costs of their network activities will likely begin to produce diminishing profits. Consequently, the owners’ freedom of action will be reduced. Through comparisons, companies can learn from each other and explore better ways of running their businesses. Benchmarking allows a company to identify potential for improvement more quickly than do internal productivity studies.
4.2.4 Outage Management
4.2.4.1 Maintenance
Equipment maintenance and tree-trimming programs have been a critical focus of traditional utility reliability programs and have contributed substantially to system reliability. Nearly 30 percent of all transmission system disturbances since 1984 can be attributed to equipment failure
Reliability of the U.S. Electricity System: Recent Trends and Current Issues
38
of some sort.8 Continued emphasis on equipment maintenance should be strongly supported to reduce these types of outages. Some improvements that involve upgrading transmission equipment will decrease ongoing maintenance costs as newer systems require less maintenance; other improvements, such as increasing remote control and automated switch gear, will increase costs because the equipment is more expensive. Reliability improvements from enhanced maintenance procedures can be expressed as a function of costs (Energy Australia 1998): the trade off between the associated equipment and maintenance costs and the savings that result from these improvements. Coordination of maintenance schedules with demand forecasts is important for insuring adequate generation. If too many plants are taken off line simultaneously in a given area, the system may be vulnerable to local capacity shortages or transmission support problems. Some outage coordination through an RTO may be appropriate to guard against creation of inadvertent operational problems. 4.2.4.2 Underground Cables
Many of the most common system disturbances (e.g., trees growing into mains, wildlife and transient contact from light objects or branches damaging lines) have been significantly mitigated through the covering of bare conductors. However, covered conductors are still susceptible to storm damage, icing, tree falls, heavy branches, lightning, motor vehicle collisions, and other uncontrollable events. Undergrounding of existing overhead lines would be a very effective way to mitigate the majority of outages and would provide many secondary benefits that customers value, such as improved visual aesthetics; however, undergrounding is extremely expensive. 4.2.4.3 Penalties
Today's reliability rules are based primarily on the judgment and experience of electrical engineers and system operators and on deterministic analyses. Tomorrow's reliability rules should explicitly recognize the economics, not just the engineering, of reliability by examining the societal costs and benefits of different reliability levels or requirements. In addition, these rules should better reflect the probabilistic nature of outages and equipment failures (Hirst 2000). All market participants must play by the same reliability rules and share equitably in the costs of reliability. Penalties imposed for outages may be a way to incorporate the costs of outages to users into operators’ planning decisions. 5. Conclusions
Deregulation has profoundly changed network and generation operation and affected capacity expansion. As a result of deregulation in combination with other forces, transmission and generation margins have been steadily decreasing during the past two decades, and reliability will continue to be a concern until new policy mechanisms and technological advances address this shift in the power market. Steps to address reliability must reflect its cost, including the cost 8 See Disturbance Analysis Working Group analysis, section 3.3.1.
Reliability of the U.S. Electricity System: Recent Trends and Current Issues
39
of interruptions, and take into account both supply- and demand-side influences on system stability. Policy options for demand reduction include energy-efficiency and DSM programs, time-of-use and real-time pricing, interruptible load contracts, and load bidding. Time-varying electricity prices are likely to play a major role in maintaining reliability and lowering electricity costs for all consumers. Customers will pay for the desired amounts of reliability only when prices accurately reflect costs and value. Electricity system reliability has a price, and this price must be visible if customers are to make reasoned, economically efficient decisions about their electricity service. In order for this shift in demand responsiveness to occur, technology and cost barriers in real time metering and communication infrastructure must be overcome and policy mechanisms valuing load as a resource must be implemented. In the meantime, proven technology and policies, such as energy efficiency standards for peaking and key base load en uses, should be actively pursued. On the supply side, improvements to increase reliability include policy and technology developments that address siting, distributed energy resources, improved grid utilization, imports, planning, and outage management. Reliability need not decline in competitive electricity industry. Reliance on competitive markets to acquire reliability resources should permit the electricity industry to be more flexible to the consumer's perspective and reliability requirements. New systems and policies will enable traditional (or higher) levels of reliability to be maintained for those that require it and for other benefits to be realized by those who do not.
Reliability of the U.S. Electricity System: Recent Trends and Current Issues
40
References
ACEEE. 2000. Electric system reliability and the critical role of energy efficiency. American Council for an Energy-Efficient Economy. July. AFC Cable Systems. 2000. How to avoid harm in harmonics. http://www.afcweb.com/harmonics/harm6.htm. Cibulka, Lloyd. 2000. “Defining and managing power quality and reliability.” www.utility-automation.com. (April): 17-21. Blazewicz, Steve, Steve Walker, and A. Little. 2000. “Distributed generation: what will it take to deliver grid reliability.” Power Value. (July/August). CAISO. 1999. ISO grid planning criteria. California Independent System Operator, January. Curley, Michael. 2000. Manager, GADS Services, North American Electric Reliability Council. personal communication. August. Disturbance Analysis Working Group (DAWG). 2000. DAWG database: Disturbances, load reductions, and unusual occurrences. http://www.nerc.com/dawg/database.html Energy Australia. 1998. Reliability costs. November. FERC. 2000. Order No. 2000-A: Regional transmission organizations. Federal Energy Regulatory Committee. February. Goel, L. and R. Billinton. 1993. "Utilization of interrupted energy assessment rates to evaluate reliability worth in the electric power system." IEEE Transactions of Power Systems. 8(3). Hingorani, Narain G. and Lazlo Gyugyi. 2000. Understanding FACTS: Concepts and Technology of Flexible AC Transmission Systems Power Electronics. IEEE Press and John Wiley & Sons, Inc. Hirst, Eric. 2000a. Economics key to good reliability rules. http://www.esper.com/hirst/. March. Hirst, Eric. 2000b. Electric reliability: potential problems and possible solutions. http://www.esper.com/hirst. April. Hirst, Eric. 2000c. Expanding U.S. transmission capacity (draft). http://www.esper.com/hirst/. May. Hirst, Eric and Brendon Kirby. 2000. Bulk-power basics: reliability and commerce. http://www.esper.com/hirst/. March 23. IEA. 1999. Key world energy statistics from the IEA. Paris: International Energy Agency.
Reliability of the U.S. Electricity System: Recent Trends and Current Issues
41
IEEE. 1997. Trial use guide for electric power distribution reliability indices, P1366/D19. http://www.pti-us.com/pti/ieee/p1366d~3.htm, Institute of Electrical and Electronics Engineers. Intergovernmental Panel on Climate Change (IPCC). 2001. IPCC Special Report on the Regional Impacts of Climate Change: An Assessment of Vulnerability. http://www.grida.no/climate/ipcc/regional/index.htm Kawann, Cornelia. 2000. Analysis of load flow-based transmission pricing in the Austrian electricity market. Doctoral thesis, Graz University of Technology, Graz, Austria. King, Chris. 1999. "It's regulation, dummy!" San Francisco Chronicle. San Francisco, California. July. Nadel, Steven, Fred Gordon, and Chris Neme. 2000. Using targeted energy efficiency programs to reduce peak electrical demad and address electric system reliability problems. ACEEE. November. Marnay, Chris, Afzal Siddiqui, and Mark Khavkin. 2000. Competitive ancillary service procurement in California. Berkeley, California: Lawrence Berkeley National Laboratory. March. National Energy Modeling System (NEMS). 1999. Electricity market module. NERC. 1996. Glossary of Terms. North American Electric Reliability Council. August. NERC. 2000a. 2000 summer assessment: Reliability of the bulk electricity supply in North America. North American Electric Reliability Council. May. NERC. 2000b. Reliability assessment 1999-2008: The reliability of bulk electric systems in North America. North American Electric Reliability Council. May. NERC, 2001a. NERC Regional Map. http://www.nerc.com/regional/nercmapbw.jpg NERC. 2001b. Reliability Legislation and FERC's New RTO Orders. http://www.nerc.com/naero/reliabilityrto.html. OASIS. 1996. OASIS User's Guide. TradeWave Corporation. Perlman, M. 2000. Electricity shortage. http://csf.colorado.edu/pen-I/2000II/msg01464.html. May. POST. 2000. Findings and recommendations to enhance reliability from the summer of 1999. U.S. Department of Energy, Power Outage Study Team. March.
Reliability of the U.S. Electricity System: Recent Trends and Current Issues
42
Raynolds, N. and R. Cowart. 2000. The contribution of energy efficiency to the reliability of electric systems. Washington, D.C.: The Alliance to Save Energy. August. Renner, H. and L. Fickert. 1999. Costs and responsibility of power quality in the deregulated electricity market. Graz, Austria: University of Technology, Department of Electrical Power Systems. June. Ridley & Associates, Inc. 1999. Nebraska's electric utility industry: final report to Nebraska legislature. http://www.nol.org/home/NEO/LR455Final/chapt5.htm. SEAB. 1998. Maintaining Reliability in a Competitive U.S. Electricity Industry: Final Report of the Task Force on Electric System Reliability. Secretary of Energy Advisory Board. December 16. U.S. Department of Energy, Energy Information Administration (EIA). 1999. Electric Power Annual, volume2. DOE/EIA-0348(99)/2. December.
Reliability of the U.S. Electricity System: Recent Trends and Current Issues
43
Appendix A: Ancillary Services and Imbalance Energy
Ancillary services (AS) and imbalance energy are needed to rectify submitted schedule inaccuracies that would otherwise reduce system reliability and power quality. In California, the Independent System Operator (CAISO) directly acquires these system services using quite different procedures. The AS procured daily through competitive mechanisms are (Marnay et al. 2000): • Regulation service: the use of generation equipped with governors and automatic-generation
controls that facilitate minute-to-minute generation/load balance within the control area to meet NERC control-performance standards
• Spinning reserve: the provision of generating capacity, usually with governors and automatic-generation control, that is synchronized to the grid but unloaded and can respond immediately to correct for generation/load imbalances caused by generation and transmission outages; spinning reserve is fully available within 10 minutes
• Non-spinning reserve: similar to spinning reserve, except that the generating capacity has rapid-start capability but is not required to be synchronized to the grid
• Replacement reserve: standby capacity that can be operational within one hour. Each Scheduling Coordinator (SC) is assigned a share of the total AS requirement. This obligation is determined pro rata, based on the contribution of the SC's metered demand to the total requirement of each particular AS. The obligation was originally based on scheduled demand. For instance, each SC must provide the percentage of its metered demand that will be used for regulation service; CAISO determines the percentage. Each SC may choose to self-provide all or a portion of its obligation in each zone. To the extent that a SC self-provides, CAISO correspondingly reduces the quantity of AS it procures. Suppliers' bid prices and quantities for each type of service are made in day-ahead and hour-ahead markets. Two other vital AS, reactive power supplied locally for voltage support and black-start generation capability, are acquired by specific contracts.
Reliability of the U.S. Electricity System: Recent Trends and Current Issues
44
Appendix B: Flexible AC Transmission Systems
A new class of technology referred to as Flexible AC Transmission Systems (FACTS) can mitigate transmission system congestion by allowing the system to operate closer to its voltage-constrained real power transfer capacity. Management of transmission-level power transfer capacity is currently accomplished with passive devices that are capable only of redistributing power. FACTS are active devices that are capable of directly regulating line flows to improve efficiency. Strategically placing suitable FACTS and coordinating the designs of FACTS’ high-level control functions creates a line of defense against unscheduled disturbances and enables optimal utilization of system assets. This equipment enables steady-state optimization of system resources in order to alleviate overloads, reduce losses, and achieve optimal generation dispatch. Reconfiguration of the transmission network, management of loads, and/or adjustments in the settings of FACTS might also improve system efficiency by improving the ability of operators to dispatch the least-cost available generators, especially during transmission congestion. However, for FACTS to be effective, advanced control strategies are needed to optimize the efficiency of the overall integrated power system while maintaining its security (Hingorani and Gyugyi 2000). It is difficult to analyze the functionality of FACTS because they incorporate both continuous-time system dynamics and discrete events associated with the switching of the compensating devices (Hingorani and Gyugyi 2000). For FACTS to become an option to improve reliability, more fundamental work is needed in this area.