iRIIS90S1 rM LIBRARY aT REMOVE FRu.', DO N . . ..... , Bureau of Mines Report of Investigations/1984 Electrochemical Determination of Thermodynamic Properties of Bismuth Sesquioxide and Stannic Oxide By Seth C. Schaefer UNITED STATES DEPARTMENT OF THE INTERIOR
Transcript
iRIIS90S1 rM LIBRARY aT REMOVE FRu.',
PI~EASE DO N . . ..... ,
Bureau of Mines Report of Investigations/1984
Electrochemical Determination of Thermodynamic Properties of Bismuth Sesquioxide and Stannic Oxide
By Seth C. Schaefer
UNITED STATES DEPARTMENT OF THE INTERIOR
1 II
il !'
Report of Investigations 8906
Electrochemical Determination of Thermodynamic Properties of Bismuth Sesquioxide and Stannic Oxide
By Seth C. Schaefer
UNITED STATES DEPARTMENT OF THE INTERIOR William P. Clark. Secretary
BUREAU OF MINES Robert C. Horton, Director
II
il
II Ii
Library of Congress Cataloging in Publication Data:
Schaefer, Seth C Electrochemical determination of thermodynamic properties of bis
muth sesquioxide and stannic oxide.
(Report of investigations / United States Department of the Interior, Bureau of Mines; 8906)
Supt. pf Docs. no.: I 28.23:8906.
Bibliography: p. 14-15.
1. Bismuth trioxide-lnermaI properties. 2. Stannic oxide-Thermal properties. 3. Electrochemistry. I. Title. II. Series: Report of Investigations (United States. Bure'llI of Mines) ; 8906.
1. High-temperature galvanic cell........................................... l. 2. Emf (E) versus temperature for 2Bi(~) + 3CuZO(c) = BiZ03(c) + 6Cu(e)..... 5 3. Equilibrium diagram for Bi-BiZ03-02 system............................... 7 4. Emf (E) vers'us temperature for Sn(~) + 2Cu20(e) = Sn02 (c) + 4Cu(e)....... 11 5. Equilibrium diagram for 8n-8n02-02 system................................ 11
TABLES
1. Impurities detected in reagents...... ....................... .•••••••••••.. 4 2. Emf (E) of cells W, Bi(~), Bi203(a,o)//Zr02//Cu20, Cu, Pt................ 6 3. Thermodynamic data for 2Bi(~) + 1.5 02(g) = Bi203(a,o,~)................. 7 4. Standard Gibbs energy change (-6GO) for 2Bi(~) + 1.5 02(g) = Bi203(a,&,~) 7 5. X-ray diffraction analyses of samples for Bi203 cell..................... 8 6. Emf (E) of cells Pt, Sn02 (junction), Sn(~), Sn02//Zr02//Cu20, Cu, Pt.... 10 7. Thermodynamic data for Sn(~) + 02(g) = Sn02(c)........................... 12 8. Standard Gibbs energy change (-6GO) for Sn(~) + 02(g) = Sn02(c).......... 12 9. X-ray diffraction analyses of samples for Sn02 cell...................... 12
UNIT OF MEASURE ABBREVIATIONS USED IN THIS REPORT
A angstrom K kelvin
atm atmosphere kcal/mol kilocalorie per mol
at. pct atomic percent min minute
cal calorie mm millimeter
cal/mV calorie per millivolt mV millivolt
cm3/min cubic centimeter per minute Pa pascal
h hour wt pet weight percent
i .1
!. i: "
~ I
I
t
ELECTROCHEMICAL DETERMINATION OF THERMODYNAMIC PROPERTIES OF BISMUTH SESQUIOXIDE AND STANNIC OXIDE
By Seth C. Schaefer 1
ABSTRACT
The Bureau of Mines investigated the thermodynamic properties of Bi203 (bismuth sesquioxide) and Sn02 (stannic oxide). Standard Gibbs energies of formation (~GfO) of these compounds were determined with high-temperature electromotive force (emf) cells using stabilized Zr02 (zirconia) as the electrolyte. Potential measurements were obtained from the cell
Equilibrium oxygen pressures for the Bi-Bi203-02 system were measured and are expressed as
\
log p02 = -20,267/T + 10.20 (740.2-975.7 K)
and log p02 = -18,534/T + 8.42 (1,017.4-1,080.5 K),
where pressure (p02) is in atmospheres and temperature (T) is in kelvins. Similarly, equilibrium oxygen pressures for the Sn-Sn02-02 system are expressed as
log p02 = -30,258/T + 10.99 (814.6-1,236.6 K).
IMetallurgist, Albany Research Center, Bureau of Mines, Albany, OR.
2
Standard Gibbs energies of formation of Bi203 and Sn02 were derived from these measurements and auxiliary data from the literature. The results are expressed as follows:
6GfO(Bi203'O) = (-127.210 + 57.78 x 10⁻³T)±0.606 kcal/mol (1,017.4-1,080.5 K),
and
6GfO(Sn02) = (-138.450 + 50.28 x 10⁻³T)±0.415 kcal/mol (814.6-1,236.6 K).
The standard enthalpies of formation of Bi20g , and Sn02' derived by the third-law method, are
and
6Hf29S(Bi203,a) = -135.697±0.603 kcal/mol
6Hf29S(Sn02) = -137.462±O.450 kcal/mol.
INTRODUCTION
Thermodynamic properties of Bi203 and Sn02 were investigated by the Bureau of Mines as a part of its program to expand the base of scientific information needed to devise innovative technologies. Bismuthite (Bi20 g ) and bismuthinite (Bi2Sg ) are the most common bismuth minerals; they are generally associated with lead and copper minerals. Bismuth is recovered as a byproduct during the extraction and refining of lead and copper. Bismuth is used in pharmaceutical products, as catalysts for plastic manufacture, in ferrous and aluminum industries to improve machinability, as an aid to casting iron, and in production of low-melting-point fusible alloys for fireextinguishing systems.
The only mineral of commercial importance as a source of tin is cassiterite (Sn02) (D.2 Cassiterite is usually found in placer and eluvial deposits. In placer deposits, cassiterite is relatively free of impurities because it has greater resistance to weathering than do the minerals originally associated with it. Tin is used in coatings for steel cans, in solders for joining pipes or electrical conductors, and in alloys for widely diversified applications. Although some of the demand for tin in the United States 1's satisfied by secondary scrap metal, most of the tin requirements are met by imports from Malaysia, Thailand, Boliva, and Indonesia.
Results of numerous investigations of the Bi-Bi203-D2 system (~-14) have been reported in the literature; however, inspection of these data shows considerable disagreement in the thermodynamic properties of Bi203 at high temperatures. Comparisons of the enthalpies of the phase transition (a-o) and fusion (o-.q show large disparities, even in data by different authors using essentially the same technique. Variations in the results are probably related to experimental difficulties that are caused by the corrosive nature (2) of the high-temperature (0) phase and molten Bi203 , in addition to the hysteresis effects that are prevalent in the (a to 0) phase transition during heating and cooling cycles. Consequently, accurate measurements of thermodynamic properties are difficult to obtain at high temperatures.
2Underlined numbers in parentheses refer to items in the list of references at the end of this report.
3
Thermodynamic properties of the Sn-Sn02-G2 system have previously been investigated by calorimetry (15-16), gas equilibration (17), and emf (18-21) techniques. Results from combustion calorimetry are subject to error because incomplete oxidation of Sn to Sn02 complicates analyses of the mixed reaction products. Difficulties in achieving equilibrium gas composition at the reaction site lead to erroneous results from gas equilibration techniques that fix the oxygen pressure in a flow system. Emf measurements are complicated by corrosion of the Zr02 electrolyte and also at the junction of the liquid Sn + Sn02 electrode. Selection of an inert junction is required to obtain accurate open-circuit potentials for the cell reaction. The emf method used by the Bureau was designed to obtain accurate equilibrium dissociation pressures of metal-metal oxide systems. This method permits direct determination of the thermodynamic stability of these systems and Gibbs energies of formation of oxides from the elements at high temperatures.
Application of stabilized Zr02 as a selective solid-anion electrolyte has been demonstrated in determining Gibbs energies for cell reactions involving metal-metal oxide systems at elevated temperatures (22). Within the limitation of the ionic domain of stabilized Zr02, any equilibrium involving oxygen may be investigated by this technique (23). The method is based on the measurement of the difference in chemical potentiaJLbetween the known oxygen potential of the reference electrode and the oxygen potential of the electrode to be determined. In this investigation, the difference was measured between the oxygen potential of a reference electrode consisting of a 1:1 molar mixture of Cu + CU20 and the oxygen potential of an electrode consisting of a 1: 1 molar mixture of Bi + Bi203 or Sn + Sn02' The standard states are the saturated coexisting phases. The transference number of oxygen is essentially unity in the range of oxygen potential of this investigation (23). The relationship between the open-circuit potential of the cell and the GibbS-energy change for the actual cell reaction is
~G(reaction) = -nFE, (1)
where ~G is the change in Gibbs energy for the cell reaction, n is the number of electrochemical equivalents in the reaction, F is the Faraday constant (23.061 call mV equivalent), and E is the emf in millivolts.
EXPERIMENTAL WORK
Materials
High-purity reagents were obtained from commercial sources and used without further purification. Analyses of these reagents were confirmed and are presented in table 1. Ultra-high-purity argon was passed through Mg( CI04 )2 (magnesium perchlorate) and purified of residual. oxygen by passing over hot titanium-zirconium chips to provide an inert atmos,phere in the ce11 for the electrodes.
Apparatus and Procedure
Internal arrangement of the cell components is illustrated in figure 1. The apparatus, potentiometer, and standardized thermocouple have been described in previous publications (24). The reference electrode was a 1:1 molar mixture of Cu plus CU20 and the electrode of unknown oxygen potential consisted of a 1: 1 molar mixture of Bi and Bi20 3 for the Bi203 determination or a 1: 1 molar mixture of Sn and Sn02 for the Sn02 determination. The cell was purged with argon and then evacuated before being backfilled with argon. Flow rate of the argon was approximately 15 cm3 Imin, and a positive pressure of approximately 30 Pa was maintained throughout
4
TABLE 1. - Impurities detected in reagents
Reagent and impurity elementsl ~ Sn:
Ca •••••••• CII.......... 0.05 Cu •••• "" •• ',." ........ . Fe ............. " ............. . Mg ....................... . Pb ......................... .. Zn ..... , .................... .
Ca •••••• '" ............. , , • Fe •...••..••••••..•.. Pb ................ " ...... III
B. .. • .. • .... • • ... .... ...... • • <.003 Fe ••••••••••••••••••• <.01 Ni ••••••••••••••••••• <.03
lImpurities not detected by spectrochemical analyses, except as noted in the table, were Ag, AI, As, B, Ba, Be, Bi, Ca, Cb, Cd, Co, Cr, Cu, Fe, Hf, li, Mg, Mn, Mo, Na, Ni, P, Pb, 5b, 5i, 5n, Ta, Ii, V, W, Zn, and Zr.
the entire experiment. The emf measurements were made with a Keithley3 model 642 high-input impedance digital electrometer. The ce11s were heated to approximately 1,000 K and permitted to stabilize for 12 h. Reversibility of the ce11 reactions was checked by approaching equilibrium from temperatures above and below a specified temperature. Cell response to temperature change was rapid, and potentials stabilized within 1 h after steady-state temperature was obtained. Measurements were obtained over a period of 2 days and repeated two or three times before the cell was dismantled and the electrodes were removed for X-ray analyses. Reproducibility was checked by obtaining measurements from several cells for each determination. Preliminary tests established that tungsten was a satisfactory material to contact the Bi(,R,) + Bi203 electrode at temperatures up to 1,080 K, but it became embrittled after prolonged exposure at higher temperatures. Other materials tested, including Pt, Fe, Mo, Ta, Re, and Nichrome, were either dissolved or severely corroded by liquid bismuth. No stable or reproducible potentials could be obtained. Consequently, investigation of Bi203 was lim-ited to the a- and O-phases in the temperature range 740.2 to 1,080.5 K, and no measurements were obtained for the liquid Bi203 phase. Measurements were made to determine the platinum-tungsten thermo-
AI20, tube
Electrode leads
Stabilized Zr02, T couple effect, and appropriate corrections wt-pet Coo elec-
trolyte tube
Argon
were applied to all emf measurements for the Bi203 determination. Corrosion problems at the junction of Sn(,R,) + 8n02 were resolved by using 8n02 that was compacted into a cylinder 10 mm long and 4 mm in diameter. These compacts were sintered at 1,200 K, and a platinum extension wire was attached to the top of the 8n02 compact.
Cu-Cu.O (reference electrode)
Metal-metol oxide electrode
FIGURE 1.· High-temperature galvanic cell.
3Reference to specific trade names does not imply indorsement by the Bureau of Mines.
5
Only the Sn02 was immersed in the Sn(Jt) + Sn02 electrode. Sn02 is an electronic conductor under the conditions of this investigation (25). Resistance of this junction decreases with increasing temperature and decreasing oxygen pressure. Measurements were made to determine the Pt-Sn02-Pt junction potential, and these corrections were applied to all emf measurements for the Sn02 determination.
RESULTS AND DISCUSSION
The equilibrium oxygen pressure for the Bi-Bi203-D2 system and the standard Gibbs energy of formation of Bi203 were determined by measuring the potentials of the reversible galvanic cell
W, Bi(Jt), Bi203(a,o)//Zr021ICu20, Cu, Pt,
with the overall cell reaction
2Bi(Jt) + 3Cu20(c) = Bi203(a,o) + 6Cu(c). (2)
Potential measurements from three cells that were used for the Bi203 determination are given in table 2. These results may be expressed as a function of temperature by the least squares equation and standard error of estimate as follows:
E (135.326 - 0.132234T)±0.46 (740.2-975.7 K) (3)
(4) and E = (49.396 - 0.044001T)±0.61 (1,017.4-1,080.5 K),
where E is emf expressed in millivolts. Smooth emf data derived from equations 3 and 4 are given in columns 4 and 8 of table 2. Representative emf-versus-temperature data are Hlustrated in figure 2.
The equilibrium oxygen pressure, p02' over Bi(Jt) + Bi203 is determined from the potential measurements for cell react ton 2 and may be expressed as
02(g, over Cu + CU20) = 02(g, over Bi(Jt) + Bi203)' (5)
The corresponding standard energy change, D.Go, for reaction
D.GO(reaction 5) = -nFE
Gibbs 5 is
= RT Jtn p02 - RT Jtn p02' (6)
where n is 4, F is the Faraday constant, E is the emf from equatiol). 3 or 4, and p02 is the oxygen pressure over the reference electrode (Cu + CU20). Pressures are expressed in atmospheres. In the temperature range 800 to 1,200 K, the standard Gibbs energy of CU20 derived from a critical analysis of all published data (26) is expressed as
~GfO(CU20) = (-40.125 + 17.23 x 10⁻³T)±0.200 kcal/mol, (7)
40 I I I
35
30
- 0\ -
,..... 0\
-> E 25 -
\yla-Si20 3 (stable phase) -
....... !:Y LL ~ w
20 -
15 -
10 I-
5 r-
o 700
0\ -
° ~ -' \ \ -
Phase tronsformatlon~o (974 Kl /0 -
8-S1 203 (stobie phase) Cbb ....
I I I ° 800 900 1,000 1,100
TEMPERATURE, K FIGURE 2.· Emf (E) versus temperature for
~ (±I -Average of 2 measurements ( 0.005 mY) taken at 20 mIn Intervals and corrected for cell calIbratIon and W-pt thermocouple potential.
2Calculated from equations E = (135.326 - O.132234T)±0.46 (740.2-975.7 K)
and E = (49.396 - 0.044001T)±0.61 (1,017.4-1,080.5 K).
and the dissociation pressure of oxygen, p02' over eu + CU20 in equation 5 may be expressed as
log p02 = -17,539/T + 7.53121. (8)
Rearranging equation 6 and substituting values of p02 from equation 8 and E from equation 3 or 4 yields
and
log p02 = -20,267/T + 10.20 (740.2-975.7 K)
log pOz = -18,534/T + 8.42 (1,017.4-1,080.5 K).
(9)
(10)
Figure 3 illustrates the thermodynamic stability of the Bi-Bi203-02 system in the temperature range 740.2 to 1,080.5 K. A phase transition (a-&) of Biz 03 was detected at 974 K. Reaction 5 and equation 6 are independent relationships that are applicable to any equilibrium involving oxygen. These values of pOz at the reaction site are the key for computing the standard Gibbs energy change for the reaction
TEMPERATURE, K where Kll is the equilibrium constant for reac tion 11 , and the condensed phases are assumed to have unit activity. Linear equations expressing the oxygen pressures and the corresponding standard Gibbs energy change for reaction 11 are given in table 3. Results at specified temperatures from this investigation together with those of previous investigators are given in table 4. Agreement is favorable in the temperature range 800 to 900 K for a-Bi20S; however, variation in the results becomes more I
evident at higher temperatures and is probably attributable to the side reactions of the high-temperature (&) and liquid Bi203 phases with the containers or cell components.
TABLE 4. - Standard Gibbs energy change (..AGO) for 2Bi(II.) + 1.5 02(g) = Bi2 0,(a,6,1I.), kcel/mo1812 0,
Tempera- This tura, K Phase1 Mahrotra<.!V Chatterji<'~) Rao(Q..) Hahn'..!) Cahen(~) Siderov(.1!) Pankratz(26 ) work
740.2 a NO NO NO NO NO NO 88.693 87.293 800 a NO 83.146 86.528 NO NO NO 84.483 83.108 900 a 75.834 76.803 78.534 NO NO NO 77.574 76.109
1,000 6 68.400 70.460 NO NO 70.700 73.971 70.714 69.430 1,100 II. 61.985 NO NO 65.200 NO 67.930 64.671 NO 1,200 .. 56.780 NO NO 62.100 NO 62.369 59.108 NO NO Not determ~ned. lPhase transition (a to 6) detected at 974 K; llH transition = 11.890 kcel/mol.
I, ,"
n
!! i I:, Ii: I ,
! !
8
TABLE 5. - X-ray diffraction analyses of samples for BizOs cell
Phase Parametric measurements! identi- a b c f)
Car~ SAmnle fied Crvstal structure 0 0 0
Reagents: Cu .............. Cu ......... Cubic .•.•..•••.•• 3.615 NAp NAp NAp 4-836 Cu2 0 •••••••• CUz 0 •••• .. •• do .................. 4.2696 NAp NAp NAp 5-667 Bi .............. Bi ........ Hexagonal •••.•••• 4.546 NAp 11.860 NAp 5-0519 Bi2 0, ••••••• BizOa ••• Monoclinic ••••••• 5.848 8.166 7.510 113 27-53
Electrodes: Cathode ••••• Cu ...... Cubic ............ 010 ...... 3.613 ±0.001 NAp NAp NAp 4-836
CUzO •••• • .. .. do." ............. 4.26B ± .001 NAp NAP NAp,5-661 Anode ••.•••. Bi ........ Hexagonal •••••••• 4. 545S± .0009 NAp 11.861±0.002 NAp I' 5-0519
BizOa •• • Monoclinic ••••••• 5.854 ± .003 8.187±0.005 7.518i:: .004 112.86±0.001 27-53 NAp Not applIcable. 0
Iparametric measurements--a , b , and c expressed in angstroms (A) and B expressed in degree (0) __ a 0 0
for reagents were obtained from the literature. zNumbers refer to data file cards of Joint Committee of Powder Diffraction Standards, International
Centre of Diffraction Data, Swarthmore, PA.
results showed no major change in lattice parameters between the reagents and the components in the equilibrated electrode mixtures. The lattice parameter of a soli4 solution generally changes with the composition up to the saturation limit and then remains con stan t beyond that po in t. Solubilities of oxygen in copper have been reported as 0.0018 and 0.0136 at. pct at 1,073 and 1,250 K, respectively (27). Maximum solubilities of oxygen in liquid bismuth have been reported as 0.0151 and 0.0341 at. pct at 1,073 and 1,223 K (28). Consequently, the interso1ubility is negligible, and the assumption of unit activity for the reactants and products does not introduce any appreciable error in the Gibbs energy of formation of Bi2 03 in the temperature range of this investigation. The standard Gibbs energy of formation of Bi203 may also be determined from the cell potentials of reaction 2 and the relationship
(13)
In equation 13, n is equal to 6. Rearranging equation 13 and substituting the value of E from equation 3 or 4, and the standard Gibbs energy of formation of CU20 as given in equation 7) yields
Equations 14 and 15 are identical to the results derived from equation 12 and given in columns 4 and 5 of table 3. This is to be expected because the standard Gibbs energy of formation of CU20 is involved in both methods for resolution of the Gibbs energy of formation of Bi203' A phase transformation (a - &) in Bi2 03 occurs at 974 K. An enthalpy of approximately 11.890 kcal/mol Bi2 03 is associated with this transition. These results compare with enthalpies for this transition of 7.06 (8), 9.9 (2.), 10.35 (~») 13.6 (.!l), and 27.9 <.~) kcal/mol, and transition temperatures of
9
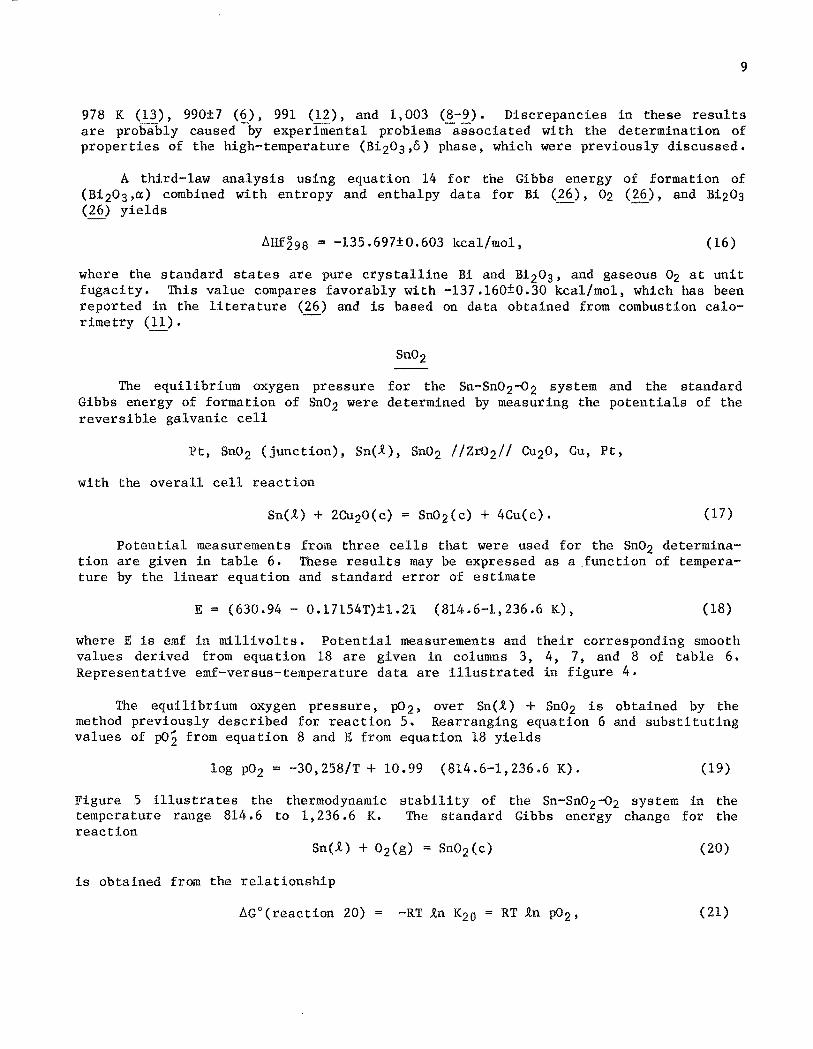
978 K (13), 990±7 (6), 991 (12), and 1,003 (8-9). Discrepancies in these results are probably caused -by experimental problems -associated with the determination of properties of the high-temperature (Bi203,o) phase, which were previously discussed.
A third-law analysis using equation 14 for the Gibbs energy of formation of (Bi203,cx) combined with entropy and enthalpy data for Bi (26), 02 (~), and Bi203 (26) yields
~Hf298 = -13S.697±0.603 kcal/mol, (16)
where the standard states are pure crystalline Bi and Bi203, and gaseous 02 at unit fugacity. This value compares favorably with -137.160±0.30 kca1/mol, which has been reported in the literature (26) and is based on data obtained from combustion calo-r ime try (ll)' -
The equilibrium oxygen pressure for the Sn-Sn02-D2 system and the standard Gibbs energy of formation of Sn02 were determined by measuring the potentials of the reversible galvanic cell
Potential measurements from three cells that were used for the Sn02 determination are given in table 6. These results may be expressed as a function of temperature by the linear equation and standard error of estimate
E = (630.94 - 0.17154T)±1.21 (814.6-1,236.6 K), (18)
where E is emf in millivolts. Potential measurements and their corresponding smooth values derived from equation 18 are given in columns 3, 4, 7, and 8 of table 6. Representative emf-versus-temperature data are illustrated in figure 4.
The equilibrium oxygen pressure, p02, over Sn(~) + Sn02 is obtained by the method previously described for reaction 5. Rearranging equation 6 and substituting values of p02 from equation 8 and E from equation 18 yields
Figure 5 illustrates the thermodynamic stability of the Sn-Sn02-D2 system in the temperature range 814.6 to 1,236.6 K. The standard Gibbs energy change for the reaction
J. (,. -Average of 2 measurements (-0.05 mY) taken at 20 mIn intervals and corrected for cell and JunctIon calibration.
2Calculated from linear equation E = (630.94 - O.17154T)±1.21.
where K20 is the equilibrium constant for reaction 20, and the condensed phases are assumed to have unit activity. Linear equations, expressing the standard Gibbs energy change for reaction 20, obtained from this study and those derived by previous investigators are given in columns 4 and 5 of table 7. Results at specified temperatures are presented in table 8. Agreement of the results is good considering the experimental difficulties such as the corrosion problems at the junction of the Sn(~) + Sn02 electrode that were encountered in the emf investigations (18-21), the incomplete oxidation of Sn to Sn02 by the combustion calorimetry method (15-16), and the uncertainty in achieving equilibrium by the gas-phase equilibrium technique (17) • Slight discrepancies in the results are probably caused by side reactions wi th the containers, impurities, in the reagents, and errors in analyses of the combustion products.
r I I
i X-ray diffraction analyses of electrode products are reported in table 9. The results showed no major change in lattice parameters between the reagents and the components in the equilibrated electrode mixtures. Further evidence concern- ~ ing the limited intersolubility of the condensed components in the Sn(.t) + Sn02 ~ electrode is given in the literature (18, ~ 28-29). Consequently, the assumption of lJ.. unit activity for the condensed phases in ~ reaction 17 does not introduce any appre- W ciable error in the Gibbs energy of formation of Sn02 in the temperature range of this investigation. The standard Gibbs energy of formation may also be derived from the cell potential measurements for reaction 17 and the relationship
In reaction 17, n is equal to 4, F is the Faraday constant, E is from equation 18, and AGe (Cu20) is from equation 7 (26). Rearranging equation 22 and solving for AGfO(Sn02) yields
TEMPERATURE, K FIGURE 4.· Emf (E) versus temperature for
Sn(.e) +2CU 20(C)= $n02(c) + 4Cu(c).
TEMPERATURE, K 12 800 1,000 1,200
14
16 ;d
18 5 of table 7. Both procedures for resolu- E tion of the standard Gibbs energy of Sn02 0 involve the standard Gibbs energy of formation of CU20 as given by equation 7. ~ 20
SOO. (stable) I /.n (I, stable)
A third-law analysis of the above Gibbs energy of formation of Sn02, combined with entropy and enthalpy data for Sn (26), 02 (26), and Sn02 (26), yields a standard enthalpy of formation-of Sn02
AHf 298 = -137.462±0.450 kcal/mol, (24)
where the standard states are pure crystalline Sn(~) and Sn021 and gaseous 02 at unit fugacity. Close agreement exists with the values -138.82±0.08 (15) and -138.057 ±0.038 (16) kcal/mol, which were the only direct measurements for the standard enthalpy of formation of Sn02 by combustion calorimetry.
0.
24
26 /
o
1.2 1.1 1.0 0.9 0.8 103
/ T, K- r
FIGURE 5. - Equilibrium diagram for $n-Sn02-02 system.
12
TABLE 7. - Thermodynamic data for Sn(J!.) + O2 (g) :: Sn02 (c)
lparametric measurements--expressed in angstroms (A)--for reagents were obtained from the literature.
2Numbers refer to data file cards of Joint Committee of Powder Diffraction Standards, International Centre of Diffraction Data, Swarthmore, PA.
1
13
SUMMARY AND CONCLUSIONS
Equilibrium O"xygen pressures of the Bi-Bi203-o 2 and Sn-Sn02-o2 systems were measured by a high-temperature emf method using a solid electrolyte tube of stabilized Zr02' The emf measurements yielded standard Gibbs energies of formation of Bi203 and Sn02 from the elements. The enthalpy and temperature for the ex to 0 phase transformation of Bi203 were determined. These data for Bi 203 and Sn02 were compared with previously reported measurements, and discrepancies were discussed. Standard enthalpies of formation of Bi203 and Sn02 were derived by combining results from this investigation with auxiliary data from the literature.
14
REFERENCES
1. Harris, K. L. Tin. Ch. in Mineral Facts and Prob1ems J Bicentennial Edition. BuMines B 667, 1975, pp. 1127-1141.
2. Anderson, C. T. The Heat Capacities of Bismuth and Bismuth Trioxide at Low Temperatures. J. Am. Chem. Soc., v. 52, 1930, pp. 2720-2723.
3. Cahen, H. T., M. J. Verkerk, and G. H. J. Broers. Gibbs Free Energy of Formation of Bi203 From EMF Cells With o-Bi203 Solid Electrolyte. Electrochim. Acta, v. 23, 1978, pp. 885-889.
4. Chatterji, D., and J. V. Smith. Free Energy of Formation of Bi203, Sb203, and Te02 From EMF Measurements. J. Electrochem. Soc., v. 120,1973, pp. 889-893.
5. Cubicciotti, D., and H. Eding. K for BiBr3' Bi203, Tl203, and T102' J. 551.
Enthalpy and Entropy Increments Above 290 0
Chem. and Eng. Data, v. 12, 1967, pp. 548-
6. Gattow, V. G., and H. Schroder. Die Krista1lstructure der Hochtemperaturmodification Wismut (lII)-oxide (0-Bi 203) (The Crystal Structure of the HighTemperature-Modification of 6-Bi203). z. Anorg. und Allg. Chem., v. 298, 1962, pp. 176-187.
7. Hahn, S. K., and D. A. Stevenson. Thermodynamic Investigation of Antimony + Oxygen and Bismuth + Oxygen Using Solid-State Electrochemical Techniques. J. Chem. Thermodyn., v. 11, 1979, pp. 627-637.
8. Harwig, H. A., and A. G. Gerards. The Polymorphism of Bismuth Sesquioxide. Thermochim. Acta, v. 28, 1979, pp. 121-131.
9. Levin, E. M., and C. L. McDaniel. Heats of Transformations in Bismuth Oxide by Differential Thermal Analysis. J. Res. NBS, Sect. A, v. 69A, 1965, pp. 237-243.
10. Levin, E. M., and R. L. Roth. Polymorphism of Bismuth Sesquioxide. 1. Pure Bi20 3 , J. Res. NBS, Sect. A, v. 68A, 1964, pp. 189-195.
11. Mah, A. D. Heats of Formation of Cerium Sesquioxide and Bismuth Sesquioxide by Combustion Calorimetry. BuMines RI 5676, 1961, 7 pp.
12. Mehrotra, G. M., M. G. Frohberg, and M. L. Kapoor. Standard Free Energy of Formation of Bi20 3 , Phys. Chem. Neue Fo1ge, v. 99, 1976, pp. 304-307.
13. Rao, A. V. R., and V. B. Tare. Free Energy of Formation of Bi203' Scr. Metall., v. 5, 1971, pp. 807-812.
14. Siderov, L. N., I. I. Minayeva, E. Z. Zasorin, I. D. Sorokin, and A. Ya. Borshevskiy. Mass Spectrometric Investigation of Gas-Phase Equilibria Over Bismuth Trioxide. High Temp. Sci., v. 12, 1980, pp. 175-196.
15. Humphrey, G. L., and C. J. O'Brien. Stannous Oxides From Combustion Calorimetry. 2805-2807.
Heats of Formation of Stannic an.d J. Am. Chem. Soc., v. 75,1953, pp.
r ! 15
16. Lavut, E. G., B. I. Timofeyev, V. M. Yuldasheva, E. A. Lavut, and G. L. Galchenko. Entha1pies of Formation of Tin (IV) and Tin (II) Oxides From Combustion Calorimetry. J. Chem. Thermodyn., v. 13, 1981, 635-646.
17. Platteeuv, J. C., and G. Meyer. The System Tin + Oxygen. Trans. Faraday Soc., v. 52, 1956, pp. 1066-1073.
18. Bedford, T. N., and C. B. Alcock. Thermodynamics and Solubility of Oxygen in Liquid Metals From EMF Measurements Involving Solid Electrolytes. Trans. Faraday Soc., v. 61, 1965, pp. 443-453.
19. Petot-Ervas, G., R. Farhi, and C. PetoL Standard Gibbs Free Energy of Formation of Sn02 From High-Temperature E.M.F. Measurements. J. Chem. Thermodyn *, v. 7, 1975, pp. 1131-1136.
20. Ramanarayanan, T. A., and A. K. Bar. Electrochemical Determination of the Free Energy of Formation of Sn02* Metall. Trans. B, v. 9B, 1978, pp. 485-486.
21. Seetharaman, S., and L. 1. Steffanssen. On the Standard Gibbs Energy of Formation of 8n02' Scand. J. Metall. v. 6, 1977, pp. 143-144.
22. Kiukkola, K., and C. Wagner. Measuremen ts on Galvanic Cells lnvol ving Solid Electrolytes. J. Electrochem. Soc., v. 104, 1957, pp. 379-387.
23. Steel, B. C. H. ,and C. B. Alcock. Factors Influencing the Performance of Solid Oxide Electrolytes in High-Temperature Thermodynamic Measurements. Trans. Me tall. Soc. AIME, v. 233) 1965, pp. 1359-1367.
24. Schaefer, S. C. Electrochemical Determination of the Gibbs Energy of Formation of Sphalerite (ZnS). BuMines RI 8301, 1978, 16 pp.
25. Kofstad, P. Nonstoichiometry, Diffusion, and Electrical Conductivity in lHnary Oxides. Wiley-Interscience, 1972, p. 355.
26. Pankratz, L. B. Thermodynamic Properties of Elements and Oxides. BuMines B 672, 1982, 509 pp.
27. Pastorek, R. L., and R. A. Rapp. The Solubility and Diffusivity of Oxygen in Solid Copper From Electrochemical Measurements. Trans. Metall. Soc. AIME, v. 245, 1969, pp. 1711-1720.
28. Das, S. K., and A. Ghosh. Thermodynamic Measurements in Molten Pb-Sn Alloys. Metall. Trans., v. 3, 1972, pp. 803-806.
29. Ramanarayanan, T. A., and R. A. Rapp. The Diffusivity and Solubility of Oxygen in Liquid Tin and Solid Silver and the Diffusivity of Oxygen in Solid Nickel. Metal!. Trans., v. 3, 1972, pp. 3239-3246.