4 ~ A I NASA TECHNICAL NOTE NASA TN D-2906 I THERMODYNAMIC PROPERTIES OF CESIUM UP TO 1500' K by Sheldon Heimel Lewis Research Center Cleveland, Ohio I NATIONAL AERONAUTICS AND SPACE ADMINISTRATION WASHINGTON, D. C. JULY 1965 i https://ntrs.nasa.gov/search.jsp?R=19650017055 2018-06-16T03:05:28+00:00Z
Transcript
4
~ A
I NASA TECHNICAL NOTE N A S A TN D-2906
I
THERMODYNAMIC PROPERTIES OF CESIUM UP TO 1500' K
by Sheldon Heimel Lewis Research Center Cleveland, Ohio
I
N A T I O N A L A E R O N A U T I C S A N D SPACE ADMINISTRATION WASHINGTON, D. C. J U L Y 1965 i
Consistent tables of thermodynamic properties of elemental cesium were compiled for both the pure species and the equilibrium vapor on the saturation line using selected values of 10 500 calories per mole for the heat of dissociation of dimer and -18 920 cal- ories per mole for the heat of condensation of monomer. The equilibrium vapor prop- erties and properties of condensed cesium (Cs) are given to 1500' K, while properties of gaseous monomer and dimer a r e given to 2500' K.
The table of mixture properties on the saturation line gives the following thermo- dynamic functions: temperature T, total vapor pressure P, weight fraction of dimer in vapor x2, molecular weight Mg, specific volume v, density p, enthalpy of condensed phase b, enthalpy of vaporization A$ap, enthalpy of vapor hg, entropy of condensed phase sc, entropy of vaporization Asvap, entropy of vapor sg, and heat capacities (equilibrium and frozen) (cp)
of the crystal at 298.15' K, which is taken to be zero. The tables of properties for the pure species give the following thermodynamic functions for the standard state: heat capacity at constant pressure Co sensible enthalpy H; - H& entropy S;, sensible
free energy FT - H;, the sum of sensible enthalpy at To K and chemical energy at 0' K H;, and values of enthalpy changes and logarithms of the equilibrium constants. The latter two functions are given for the reactions of formation of Cs(c), Cs,(g), and Cs,(g) from the assigned reference state Cs(c) ((AH;) and loglo %) and from Cs,(g)
(AH; and loglo K).
data, whereas the functions of the condensed phase were based on selected experimental data that were smoothed and made self-consistent.
and ( c ~ ) ~ ~ . Assigned enthalpies a r e relative to enthalpy eq
P' 0
f
Thermodynamic functions for the gases were generated from atomic and molecular
INTRODU CTlON
Current work at the Lewis Research Center indicates the need for reliable vapor pressure data as well as other thermodynamic properties for cesium in the following areas;
(1) Rankine cycle engine. The thermodynamic properties of cesium a r e needed in order to make an analysis of a Rankine cycle system and its components.
(2) Thermionic plasma diode. Improved performance requires knowledge of the con- centration of cesium in the gas phase and the rate of evaporation from a liquid surface. Such data can be derived with the help of an equation for pressure as a function of satura- tion temperature.
Accordingly, to meet these needs, the following tables have been generated: (1) Boiling points corresponding to pressures of from (2) Properties on the saturation line from 100' to 1500' K temperature T,
to 10 atmospheres
total vapor pressure P, atmospheres; partial pressure of monomer pl, atmospheres; partial pressure of dimer p2, atmospheres; weight fraction of dimer x2, gram per gram mixture; molecular weight of vapor M mole; specific volume of vapor v, cubic centimeter per gram; density of vapor p , gram per 1000 cubic centimeters; enthalpy of condensed phase hc, calories per gram; enthalpy of vaporization A$ calories per gram; en- thalpy of vapor h calories per gram; entropy of condensed phase sc, cal- ories per gram per OK; entropy of vaporization AS,,^, calories per gram per OK; entropy of vapor s,, calories per gram per OK; equilibrium heat capacity
0 K;
gram per g'
aP' g'
of vapor (c ) , P ea
(c,) , calorieis Cn
6 calories per gram per OK; and frozen heat capacity of vapor
per gram per OK
capacity at constant pressure Co calories per mole per OK; sensible enthalpy P'
H! - H& calories per mole; entropy St, calories per mole per OK; sensible free energy F$ - H& calories per mole; sum of sensible enthalpy at To K and chemical energy at 0' K H;, calories per mole; and values of enthalpy changes and logarithms of the equilibrium constants. The latter two functions are each given for two different reactions of formation. One set of functions, (A#T), and loglo Kf is for the reaction of formation of Cs,(g) and Cs,(g)
~ LI
(3) Thermodynamic functions for each pure species: temperature T, OK; heat
1
from the assigned reference state Cs(c). The other set of functions, AH; and loglo K, is for the formation of Cs(c) and Cs2(g) from Csl(g). The sym- bols g and c re fer to the gas and condensed phases (crystal and liquid), respectively. The thermodynamic functions for the gases were generated from atomic and molecular data, whereas the functions of the condensed phase were
2
based on selected experimental data that were smoothed and made self- consistent. The functions for the condensed phase are given up to 1500' K; those for the monomeric and dimeric gases a r e given up to 2500' K.
When vapor pressure data a r e available, they may be combined with sensible free energy data by use of the third law of thermodynamics to calculate an implied value of (A%) (heat of condensation of monomer at 0' K) for each available vapor pressure
point. If the vapor pressure data are completely consistent with the thermodynamic data, the calculated values of (A%) will be constant. The usual result, however, is
that there is variation in the calculated values of (AI$,) . Depending on the extent and
nature of this variation, some average (A%)
(AH:)
pressures. These calculated vapor pressures and the experimental vapor pressures will, of course, not agree. At this point either the experimental vapor pressures must be abandoned or the theoretical free energies must be modified.
In this report a similar procedure to that just outlined will be followed. There are several differences in the analysis, namely,
(1) The experimental vapor pressures a r e first smoothed. (2) The gas is assumed to be a mixture of monomer and dimer. Therefore, the
(3) The procedure for selecting a value of (AH:) is to find that value of (AH:)
C
C
C may be selected. This selected value of
C together with the sensible f ree energy data may now be used to calculate vapor
C
intermediate step of calculating equilibrium compositions is required.
C C which gives a minimum deviation of calculated and smoothed experimental vapor pres- sures over the entire range.
(4) The selected (A%) and thermodynamic data are used to calculate a recom- C
mended set of vapor pressures for the crystal and the liquid.
PRESENTATION OF TABLES
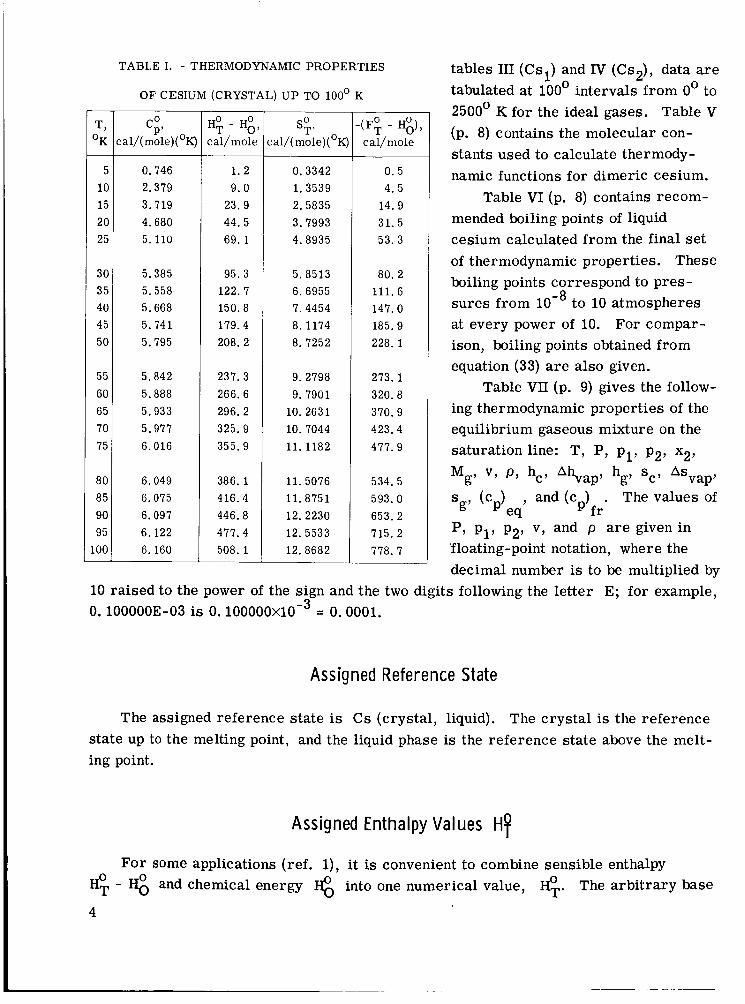
Table I contains the smoothed values of Co for crystalline cesium up to 100' K P together with consistent values of H; - H:, S;, and -(F; - %). Generation of these data will be discussed in SELECTION OF INITIAL DATA.
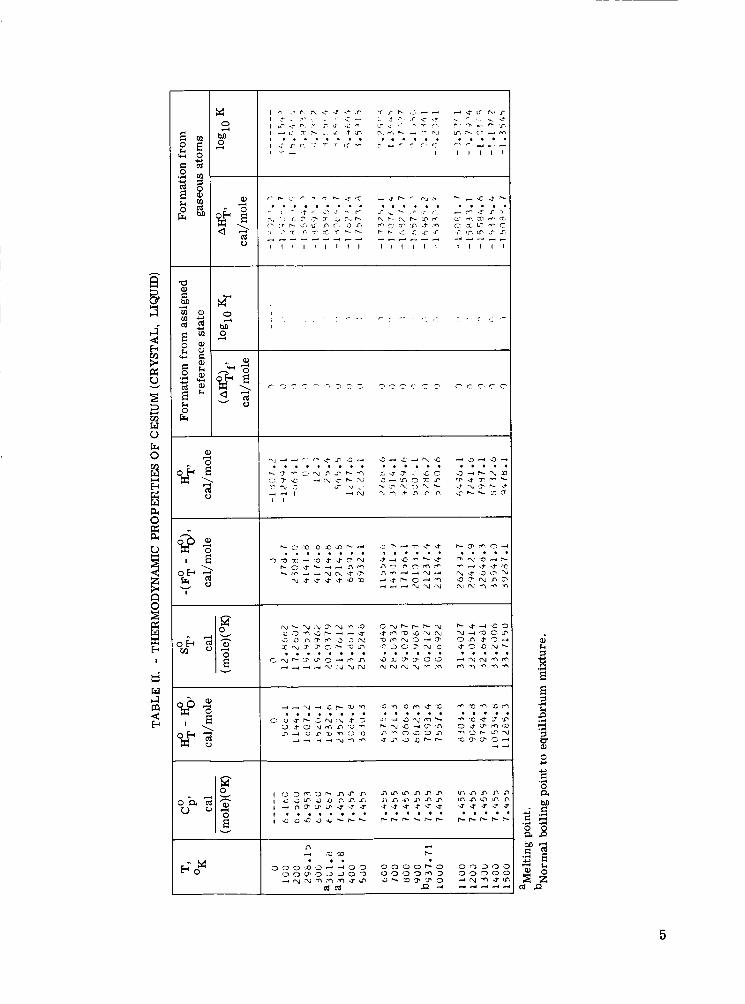
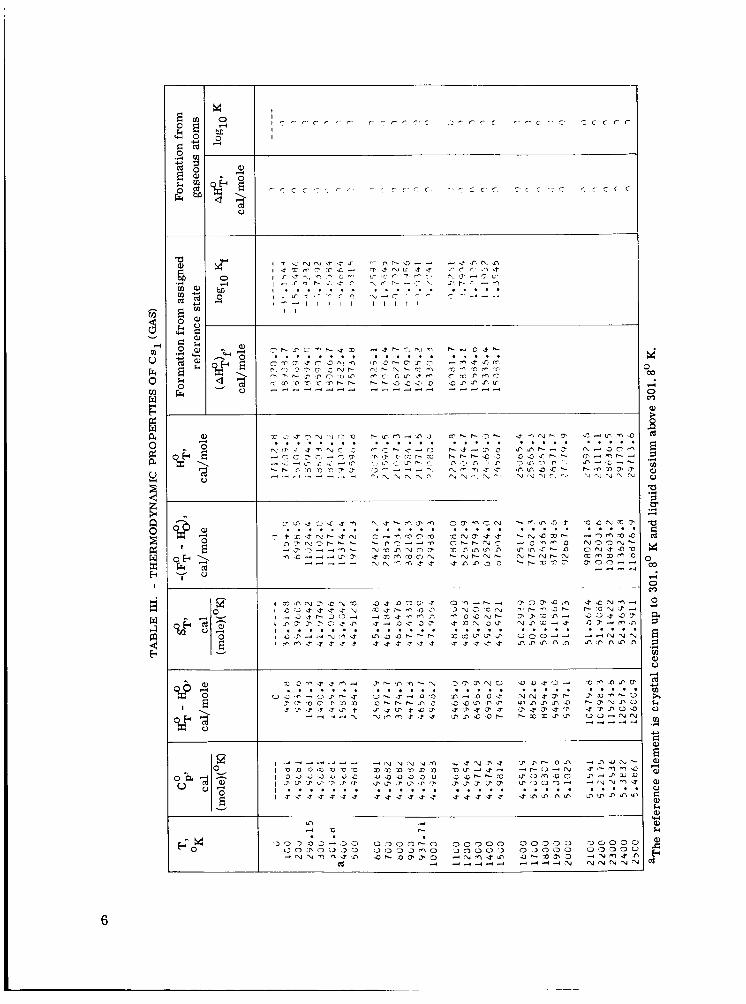
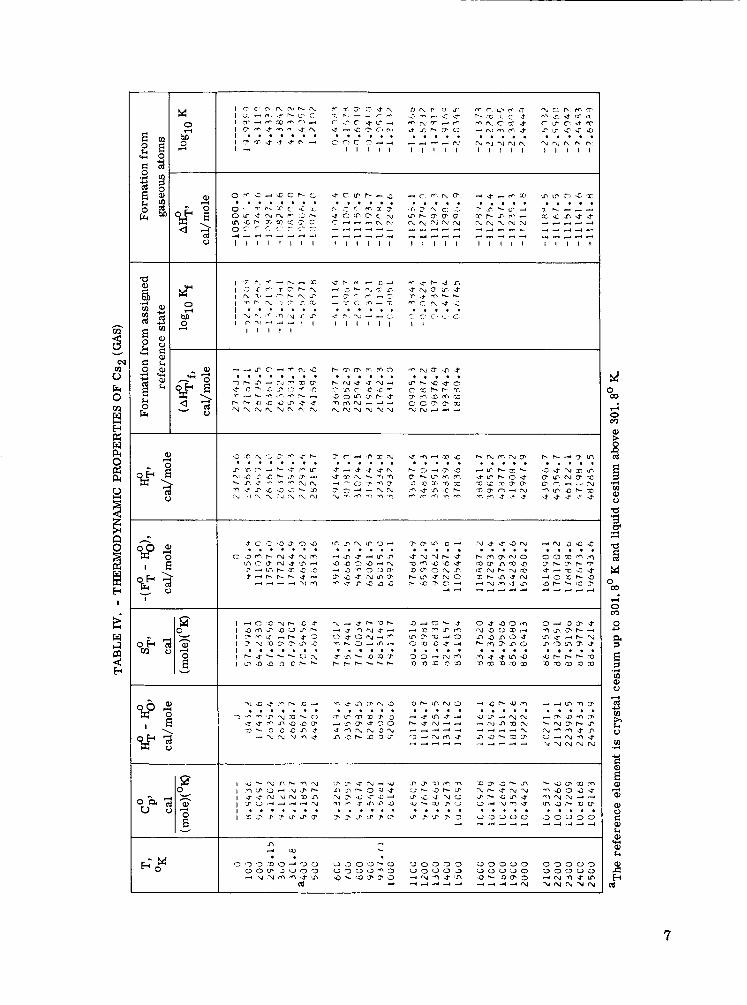
Tables 11 to IV (pp. 5-7) give the thermodynamic properties of Cs (crystal, liquid)
and loglo K. In table 11, data for the crystal extend up to the meltinipoint, 301.8' K. Data for the liquid a r e tabulated at 100' intervals from the melting point to 1500' K. In
3
-
T, OK -
5 10 15 20 25
30 35 40 45 50
55 60 65 70 75
80 85 90 95
LOO -
TABLE I. - THERMODYNAMIC PROPERTIES
OF CESIUM (CRYSTAL) U P TO 100' K
c;, :al/(rnole)(OK)
0.746 2.379 3.719 4.680 5.110
5.385 5.558 5.668 5.741 5.795
5.842 5.888 5.933 5.977 6.016
6.049 6.075 6.097 6.122 6.160
H; - Hg cal/mole
1. 2 9.0
23. 9 44.5 69. 1
95.3 122.7 150.8 179.4 208. 2
237.3 266.6 296.2 325.9 355.9
386. 1 416.4 446.8 477.4 508.1
s;, :al/( mole)(OK:
0.3342 1.3539 2.5835 3.7993 4.8935
5.8513 6.6955 7.4454 8.1174 8.7252
9. 2798 9. 7901
10.2631 10. 7044 11.1182
11.5076 11.8751 12. 2230 12.5533 12.8682
-(F$ - Hg) , cal/mole
0.5 4.5
14. 9 31. 5 53.3
80. 2 111.6 147.0 185.9 228. 1
273.1 320.8 370.9 423.4 477.9
534.5 593.0 653.2 715. 2 778. 7
~
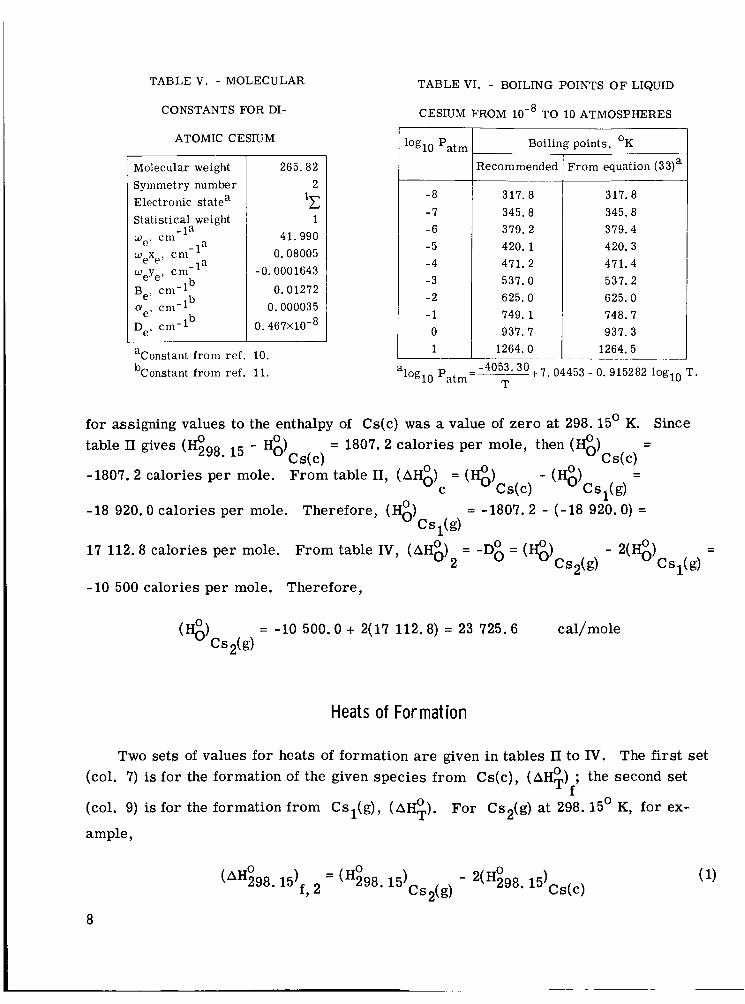
tables I11 (Cs,) and IV (Cs,), data a r e tabulated at 100' intervals from 0' to 2500' K for the ideal gases. Table V (p. 8) contains the molecular con- stants used to calculate thermody- namic functions for dimeric cesium.
Table VI (p. 8) contains recom- mended boiling points of liquid cesium calculated from the final set of thermodynamic properties. These boiling points correspond to pres- sures from to 10 atmospheres at every power of 10. For compar- ison, boiling points obtained from equation (33) a r e also given.
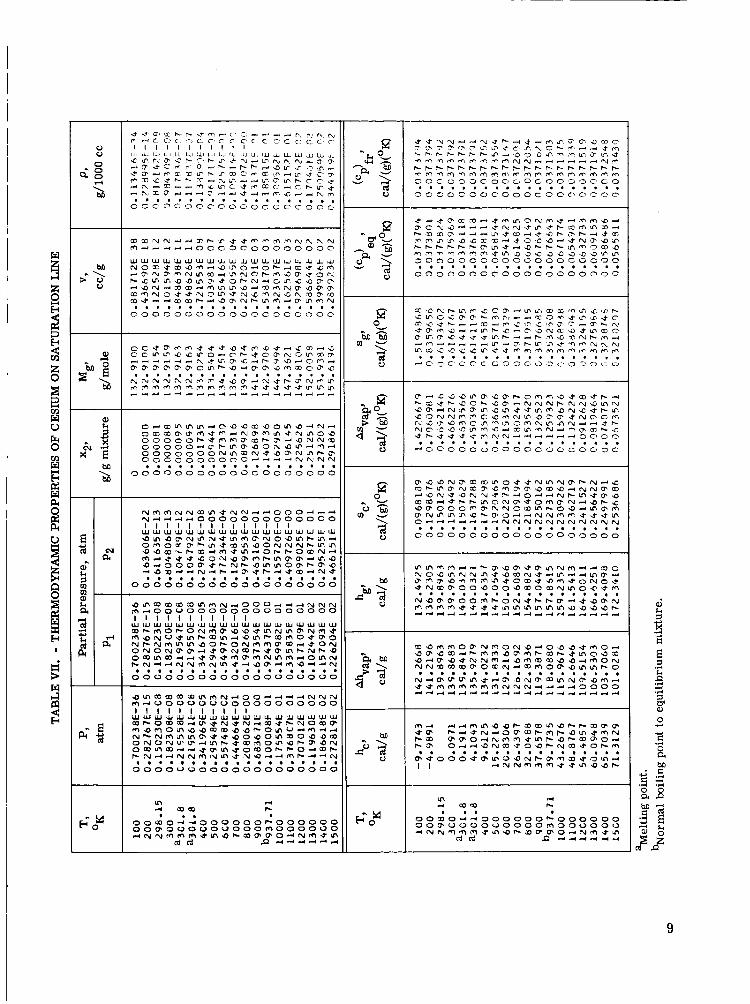
ing thermodynamic properties of the equilibrium gaseous mixture on the saturation line: T, P, pl, p,, x,,
Table VI1 (p. 9) gives the follow-
s (c,) , and (c ) . The values of g' eq P fr
P, pl, p,, v, and p are given in 'floating-point notation, where the decimal number is to be multiplied by
10 raised to the power of the sign and the two digits following the letter E; for example, 0.100000E-03 is 0. ~ O O O O O X ~ O - ~ = 0.0001.
Assigned Reference State
The assigned reference state is Cs (crystal, liquid). The crystal is the reference state up to the melting point, and the liquid phase is the reference state above the melt- ing point.
Assigned Enthalpy Values Hf
For some applications (ref. l), it is convenient to combine sensible enthalpy 4 - Hg and chemical energy
4
into one numerical value, H;. The arbi t rary base
1264.5 a -4053' 30+ 7.04453 - 0. 915282 loglo T . l o g l O P a t m =
for assigning values to the enthalpy of Cs(c) was a value of zero at 298.15' K. Since - - table II gives ($98. 15 - H:)cs(c) = 1807. 2 calories per mole, then (I-$,)
CS(C) - - -1807. 2 calories per mole. From table 11, (AH:) = (Hg) - (Q
C C4C) CS,k) -18 920.0 calories per mole. Therefore, (I-$,) = -1807.2 - (-18 920.0) =
Cs,(g) - 17 112.8 calories per mole. From table IV, (AH:) = -D$ = (I-@ - 2 ( Q -
2 Cs,(g) Cs,(g) -10 500 calories per mole. Therefore,
Two sets of values for heats of formation a re given in tables I1 to IV. The first set (col. 7) is for the formation of the given species f rom Cs(c), (AH;) ; the second set
(col. 9) is for the formation from Cs,(g), (AH;). For Cs2(g) at 298. 15' K, for ex-
ample,
f
8
0 0 0 q %l
. . . . . . . . . . . . . . . . . . . O 0 C O C O C C O O C C 3 0 C ~ f C c ,
M . . . . . . . . . . . . . . . . . . o o o o o o o o o o o o o o o o c 0 o
si- .. "=: m"
3
bn b' = 2
. . . . . . . . . . . . . . . . . . O O O O O O O O O O a O O O O O O O O
4 0
w 0) 0 d r- d 9
o
* N N 000
W U J W h l m u * P O * O N N h 9 O V I N d 4 N
000 . . .
E PI-
in d d m m h ln
d m m . . . d r- . . I .
0 0 9 0 d ~ ~ 0 0 0 0 0 r - 0 0 0 0 0 0 O O P v v v O V O o O O m O O o O O v ~ N N m * m * . n 9 h W m O O d N m * V I
dcd P d d d d d d
9
Eq u i I i br i u m Constants
Two sets of logarithms of the equilibrium constants for the two formation reactions discussed previously are also listed in tables I1 to IV. The equilibrium constant Kf for formation from the assigned reference element (col. 8) is obtained from the standard free energy change (AF;) by means of the equation
f
The equilibrium constant K for formation from the atomic gas is obtained from a sim- ilar equation
A F ~ loglo K = -
2.3025851 RT
Atomic weights, the universal gas constant and the constants used in the evaluation of the entropy constant were the same as those used in reference 1.
SELECTION OF INITIAL DATA
Crystal
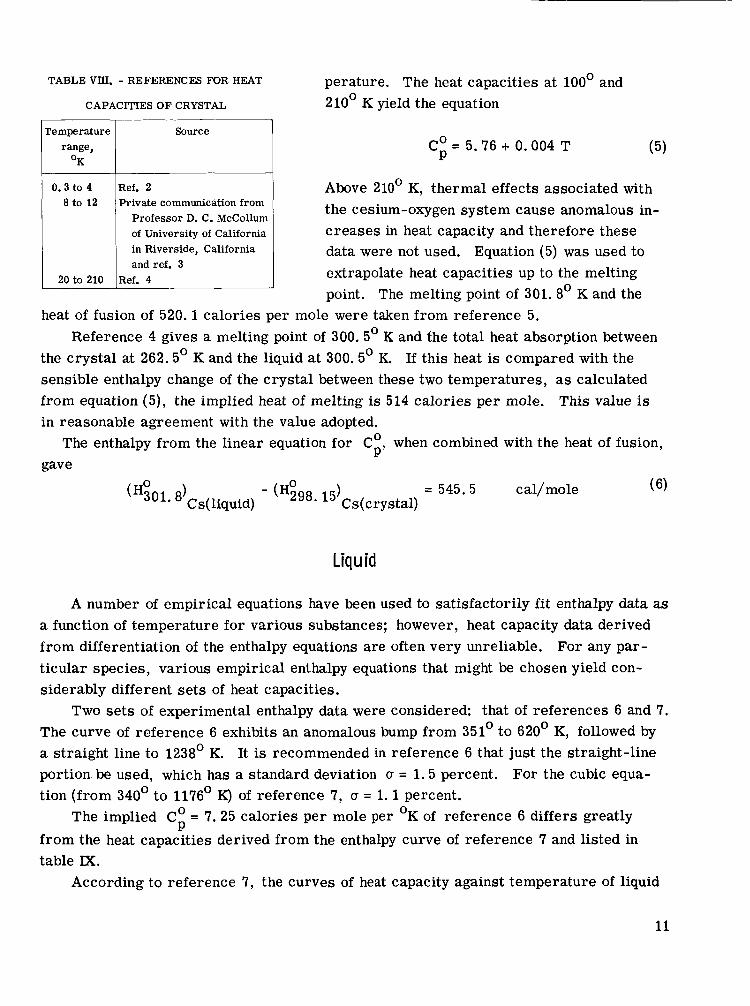
Heat capacities of the crystal (table I, p. 4) were derived by smoothing the experi-
The following procedure was used to obtain smooth data from 0' to 100' K. A mental data from the sources given in table VIII.
least-squares fit of the data of reference 2 was used in the temperature range from 0' t o 4' K. Data from 4' to 20' K were obtained from a curve drawn through the data of ref- erence 2 at 4' K and through the data of references 3 and 4 at 20' K. Data f rom 20' to 100' K were obtained from a least-squares fit of the data of reference 4 in that tempera- ture range.
Between 100' and 210' K, the data of reference 4 are approximately linear in tem-
10
TABLE Vm. - REFERENCES FOR HEAT perature. The heat capacities at 100' and 210' K yield the equation CAPACITIES OF CRYSTAL
0.3 to 4 8 to 12
I I Temperature I Source
Ref. 2 Private communication from
Professor D. C. McCollum of University of California
L I I
20 to 210 and ref. 3
extrapolate heat capacities up to the melting Ref. 4
Co = 5 . 7 6 + 0 .004 T (5) P
Above 210' K, thermal effects associated with the cesium-oxygen system cause anomalous in- c reases in heat capacity and therefore these
I data were not used. Equation (5) was used to 1 in Riverside, California 1
heat of fusion of 520 .1 calories per mole were taken from reference 5.
the crystal at 262.5' K and the liquid at 300.5' K. If this heat is compared with the sensible enthalpy change of the crystal between these two temperatures, as calculated from equation (5), the implied heat of melting is 514 calories per mole. This value is in reasonable agreement with the value adopted.
gave
Reference 4 gives a melting point of 300. 5' K and the total heat absorption between
The enthalpy from the linear equation for Co when combined with the heat of fusion, P'
A number of empirical equations have been used to satisfactorily f i t enthalpy data as a function of temperature for various substances; however, heat capacity data derived from differentiation of the enthalpy equations are often very unreliable. For any par- ticular species, various empirical enthalpy equations that might be chosen yield con- siderably different sets of heat capacities.
The curve of reference 6 exhibits an anomalous bump from 351' to 620' K, followed by a straight line to 1238' K. It is recommended in reference 6 that just the straight-line portion be used, which has a standard deviation cr = 1 . 5 percent. For the cubic equa- tion (from 340' t o 1176' K) of reference 7, (3 = l. l percent.
f rom the heat capacities derived from the enthalpy curve of reference 7 and listed in table IX.
Two sets of experimental enthalpy data were considered that of references 6 and 7.
The implied Co = 7. 25 calories per mole per O K of reference 6 differs greatly P
According to reference 7, the curves of heat capacity against temperature of liquid
11
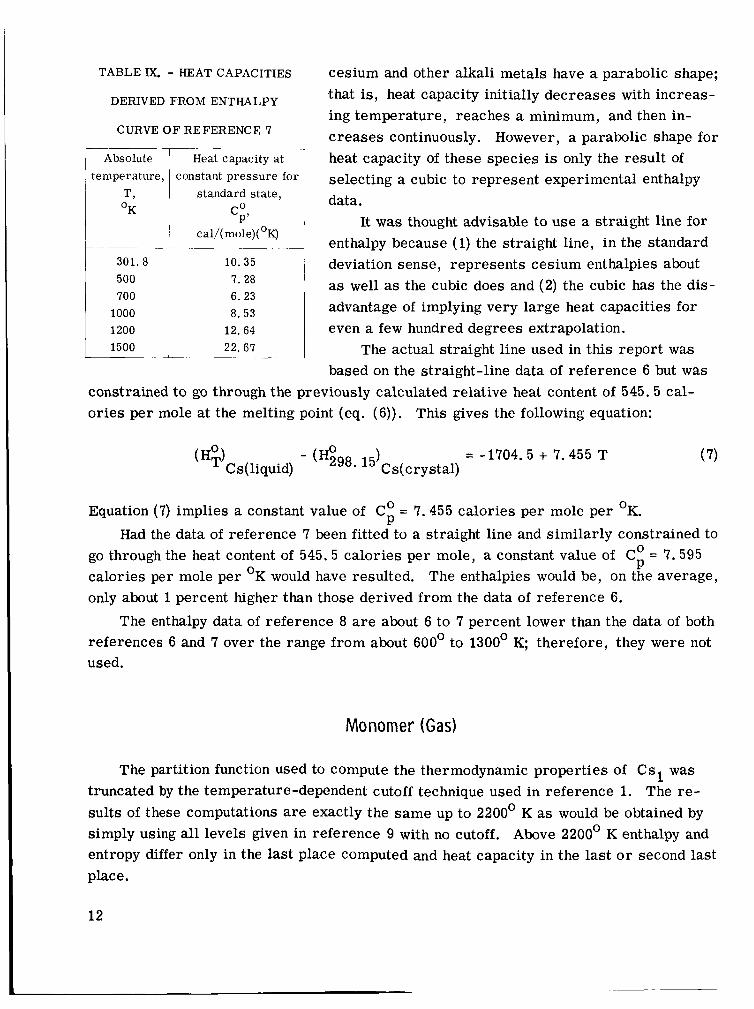
TABLE IX. - HEAT CAPACITIES
DERIVED FROM ENTHALPY
CURVE O F REFERENCE 7
Absolute Heat capacity a t temperature, constant p re s su re for
T , standard s ta te ,
tal/( r n o l e ) ( O ~ )
OK c;,
+ --- 301.8 10.35
6. 23 1000 8.53 1200 12.64 1500 22.67
cesium and other alkali metals have a parabolic shape; that is, heat capacity initially decreases with increas- ing temperature, reaches a minimum, and then in- c reases continuously. However, a parabolic shape for heat capacity of these species is only the result of selecting a cubic to represent experimental enthalpy data.
It was thought advisable to use a straight line for enthalpy because (1) the straight line, in the standard deviation sense, represents cesium enthalpies about as well as the cubic does and (2) the cubic has the dis- advantage of implying very large heat capacities for even a few hundred degrees extrapolation.
The actual straight line used in this report was based on the straight-line data of reference 6 but was
constrained to go through the previously calculated relative heat content of 545.5 cal- ories per mole at the melting point (eq. (6)). This gives the following equation:
Equation (7) implies a constant value of Co = 7.455 calories per mole per OK. P Had the data of reference 7 been fitted to a straight line and similarly constrained to
go through the heat content of 545.5 calories per mole, a constant value of Co = 7.595 calories per mole per OK would have resulted. The enthalpies would be, on the average, only about 1 percent higher than those derived from the data of reference 6.
The enthalpy data of reference 8 are about 6 to 7 percent lower than the data of both references 6 and 7 over the range from about 600' to 1300' K therefore, they were not used.
P
Monomer (Gas)
The partition function used to compute the thermodynamic properties of C s l was truncated by the temperature-dependent cutoff technique used in reference 1. The re- sults of these computations are exactly the same up to 2200' K as would be obtained by simply using all levels given in reference 9 with no cutoff. Above 2200' K enthalpy and entropy differ only i n the last place computed and heat capacity in the last o r second last place.
12
Dimer (Gas)
The method used to compute the thermodynamic properties of Cs2 is the method for diatomic molecules described in reference 1. The constants for the dimer are shown in table V (p. 8). They were taken from references 10 and 11.
Vapor Pressures
During the period 1913 to 1937, the investigations reported in references 12 to 18 obtained vapor pressure data for cesium in the temperature range from 238' to 670' K. This early work was evaluated in reference 19 where it was concluded that, except for the results of references 17 and 18, the early work is not too reliable.
to generate a vapor pressure equation. Inasmuch as the data of reference 17 are only relative pressure data (obtained by the magneto-optical method) and are converted to absolute pressure data by relating them to the unreliable data of reference 13, it seems prudent to disregard the data of reference 17.
Recently, the first experimental measurements in the temperature range that in- cluded the boiling point (742' to 1199' K) were reported in reference 20. These data check reasonably well with the later data of reference 6 (727' to 1334' K).
the liquid range), 20, and 6 were combined and fitted by the least-squares technique. All the data were given the same weight. The results of several empirical equations were compared. The following equation, which is in the form of the Kirchhoff equation, was accepted because i t gave as satisfactory results as the other forms considered:
The vapor pressures in the 455' to 589' K range (ref. 17) were used in reference 19
In view of the previous observations, the data of references 18 (vapor pressures in
loglo P = - 3920. 38 + 5.71342 - 0.519781 loglo T (8) T
If only vapor pressures were considered in this report, then the smoothed experi- mental vapor pressures obtained from equation (8) would be accepted. As pointed out in the INTRODUCTION, however, these smoothed data, when combined with other thermo- dynamic data, lead to inconsistencies in the heat of condensation of the monomer at 0' K (A%) . Therefore, the data from equation (8) are used only for preliminary analysis,
whereas the final recommended vapor pressures are calculated as explained in detail in the section Pressures and Weight Fractions of Gaseous Species.
C
13
Heat of Dissociation at Oo K
An upper bound (4020 cm-l) for the heat of dissociation at 0' K(Dg) is estimated in reference 21 by analytical extrapolation of the ground state vibrational intervals. A lower bound (3318 cm-') is estimated in reference 2 1 by making certain assumptions as to the final states of the excited atoms produced. The average of these two values, which is equivalent to 10 500*1000 calories per mole of dimer, is recommended in this reference.
The estimate of 0.453 eV or 10 450 calories per mole from the correlation of force constants, equilibrium internuclear distances, and heats of dissociation of the alkali metals is obtained in reference 22. A technique for deducing a value of D g where D: was not well known is suggested in reference 23. This technique gave an optimum Dg = 10 000 calories per mole which is in fairly close agreement with the spectroscopic value of 10 500 calories per mole.
on the value of D;. While no value of Dg that was tr ied gave a constant value of (AH:)
about 10 000 to 11 500 calories per mole gave the most nearly constant value of (A%) . Based on this analysis, the conclusion was that the spectroscopic value was ap-
proximately correct, and the value Do = 10 500 calories per mole was selected.
The calculation of (A%) , which is discussed in the next section, depends in par t C
over the entire temperature range of 301.8' to 1500' K, values of D g from C
C
0
Heat of Condensation of Monomer at Oo K
The values of (A%)
follows: -19 048 (ref. 24), -18 790 (ref. 19), -19 050 (ref. 25), and -19 035 (ref. 26). The aforementioned values of (A%) a r e based on the pre-1962 vapor pressures.
in calories per mole a r e given in a number of publications as C
C Therefore, this report will recommend a "best" (AI-@ of -18 920 on the basis of the newer vapor pressures , as discussed in the following section.
THERMODYNAMIC ANALYSIS
As discussed in the INTRODUCTION, the procedure for the selection of a value for (A%) is to find that (A%) for which the difference between the calculated and
C C smoothed experimental vapor pressures is a minimum. As a first step, it is necessary to compute (A%) for each temperature in the range of interest.
C
14
Derivation of AH^) C
The zero-degree heat of condensation of monomer was computed by means of the relation
where
and
Part ia l Pressure of Monomer
The partial pressure of monomer p1 in atmospheres is obtained from the simul- taneous solution of Dalton's Law and the equilibrium-constant equation for the dimeriza- tion reaction
2 CSl = cs2
The equations are
and
p = P I + P2
where P is the total pressure, p2 is the partial pressure of dimer, and K2 is the equilibrium constant of dimerization. Values of K2 are obtained from table IV (p. 7). The solution of equations (12) and (13) is
15
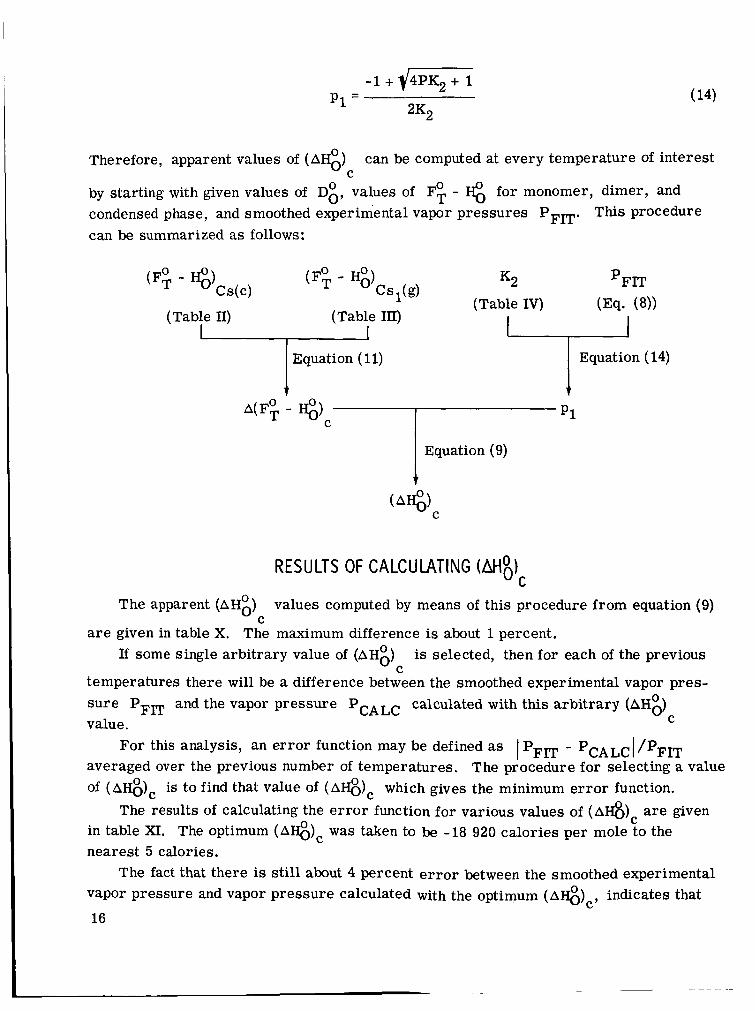
Therefore, apparent values of (AH:)
by starting with given values of Dg, values of F; - condensed phase, and smoothed experimental vapor pressures PFIT. This procedure can be summarized as follows:
can be computed at every temperature of interest C
for monomer, dimer, and
(F; - H:) K2 PFIT (Table IV) (Eq. (8))
CS(C)
Equation (14)
(Table 11) (Table 111)
Equation ( 11)
I I
Equation (9)
A(F; - Q
RESULTS OF CALCULATING (Alii) C
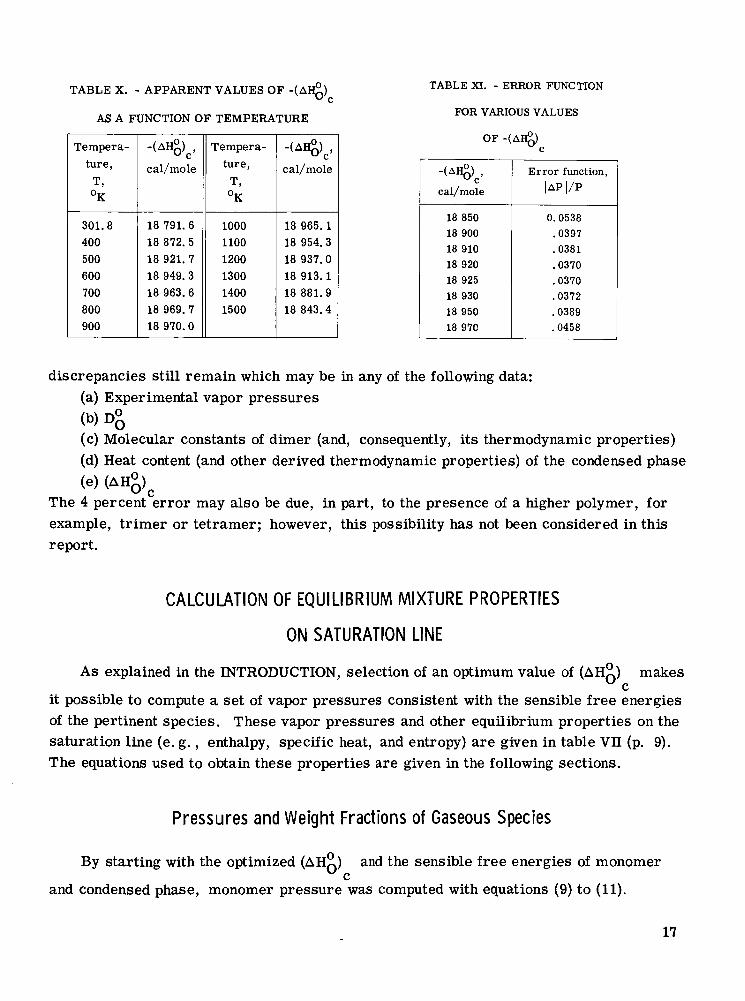
l..e apparent (AH:)
If some single arbitrary value of (AH:)
values computed by means of this procehdre AA'om equation (9) C
a r e given in table X. The maximum difference is about 1 percent. is selected, then for each of the previous
C temperatures there will be a difference between the smoothed experimental vapor pres- su re PFm and the vapor pressure PCALC calculated with this arbi t rary (AH:) value.
averaged over the previous number of temperatures. The procedure for selecting a value of ( A€&c is to find that value of ( A€@c which gives the minimum e r r o r function.
in table XI. The optimum (AH&)c was taken to be -18 920 calories per mole to the nearest 5 calories.
vapor pressure and vapor pressure calculated with the optimum (A@)
16
C
For this analysis, an e r ro r function may be defined as I PFm - PcALc I /PFIT
The results of calculating the e r r o r function fo r various values of (A&), are given
The fact that there is still about 4 percent e r r o r between the smoothed experimental indicates that
discrepancies still remain which may be in any of the following data: (a) Experimental vapor pressures
(c) Molecular constants of dimer (and, consequently, its thermodynamic properties) (d) Heat content (and other derived thermodynamic properties) of the condensed phase
(b) D;
(e) (AH& The 4 percent e r ro r may also be due, in part, to the presence of a higher polymer, for example, t r imer or tetramer; however, this possibility has not been considered in this report.
CALCULATION OF EQUILIBRIUM MIXTURE PROPERTIES
ON SATURATION LINE
As explained in the INTRODUCTION, selection of an optimum value of (AH:) makes
it possible to compute a set of vapor pressures consistent with the sensible free energies of the pertinent species. These vapor pressures and other equilibrium properties on the saturation line (e. g. , enthalpy, specific heat, and entropy) are given in table VII (p. 9). The equations used to obtain these properties a re given in the following sections.
C
Pressures and Weight Fractions of Gaseous Species
By starting with the optimized (AH:) and the sensible f ree energies of monomer C
and condensed phase, monomer pressure was computed with equations (9) to (11).
17
Dimer pressure was computed from equation (13). The total pressure PCALC was obtained from the sum of p1 and pa.
monomer N1; thus, The weight fraction of monomer x1 was obtained from the mole fraction of
P1 N1 = - P
N1 x1 = - 2 - N1
The weight fraction of the dimer x2 was obtained from the defining equation
x1 + x2 = 1
Enthalpy of Vaporization and Entropy of Vaporization
The heat of vaporization in calories per gram from the condensed state to the equilibrium mixture on the saturation line was obtained from
where M2 is the molecular weight of dimer (265. 82 g/mole). The heats of formation a r e obtained from tables I11 and IV (pp. 6 and 7).
The entropy of vaporization in calories per gram is obtained from equation (18) by means of
Enthalpy, Specific Heat, and Entropy of Cesium Vapor
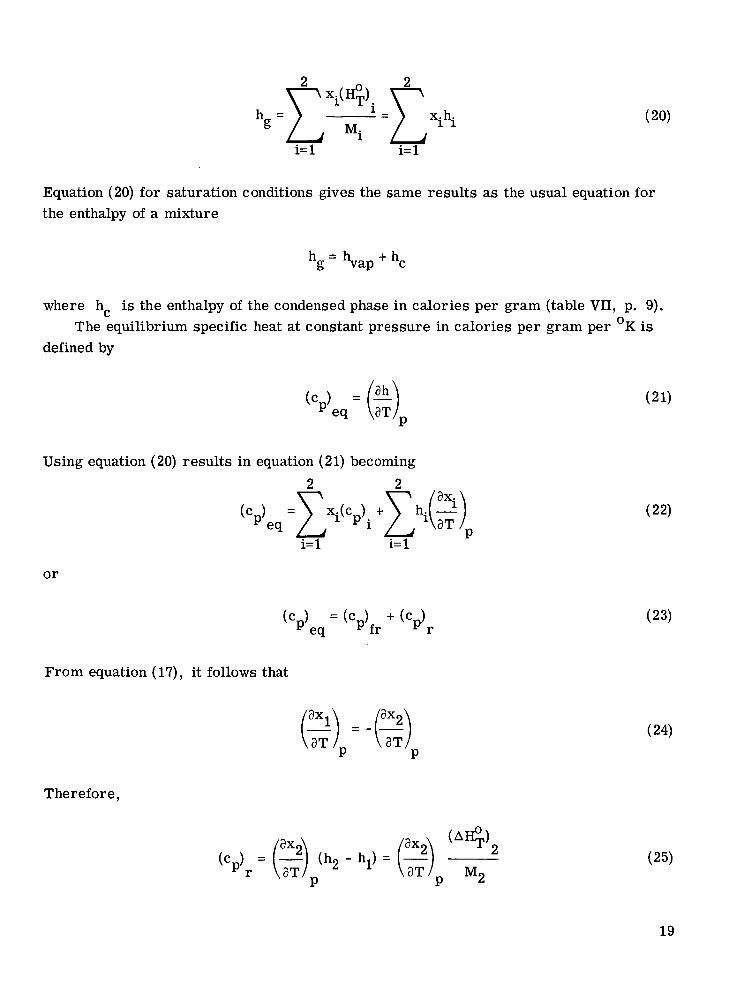
The enthalpy h in calories per gram of an equilibrium mixture can be defined by g
18
h = g /, Mi
i= 1
=E i= 1
x. h. 1 1
Equation (20) for saturation conditions gives the same results as the usual equation for the enthalpy of a mixture
where hc is the enthalpy of the condensed phase in calories per gram (table VII, p. 9).
defined by The equilibrium specific heat at constant pressure in calories per gram per OK is
Using equation (20) results in equation (21) becoming 2 2
(cp) eq = E i ( c P l i txhi(;)p
i= 1 i= 1
or
From equation (17), it follows that
(2) =-(!!?) P P
Therefore,
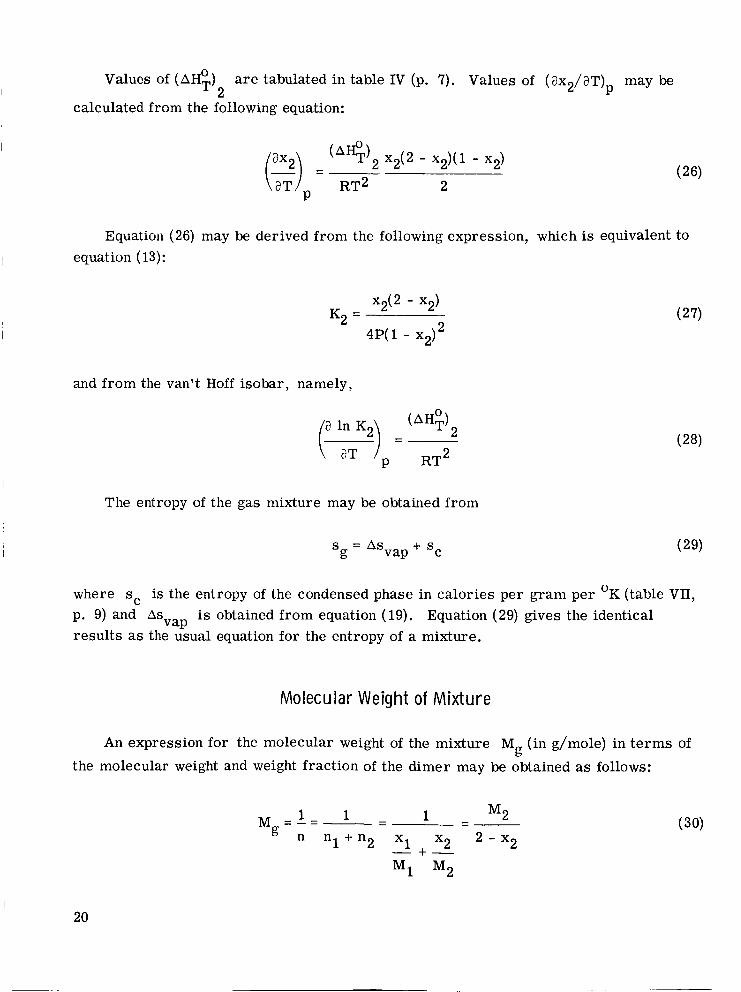
Values of (AH;) are tabulated in table IV (p. 7). Values of (ax2/aT) may be I 2 P
calculated from the following equation:
Equation (26) may be derived from the following expression, which is equivalent to I equation (13):
2 4P(1 - ~ 2 )
and from the van't Hoff isobar, namely,
The entropy of the gas mixture may be obtained from
s g = A s v a p + sc (29)
where sc is the entropy of the condensed phase in calories per gram per OK (table VII, p. 9) and A s is obtained from equation (19). Equation (29) gives the identical results as the usual equation for the entropy of a mixture.
VaP
Molecular Weight of Mixture
I An expression for the molecular weight of the mixture M (in g/mole) in te rms of g the molecular weight and weight fraction of the dimer may be obtained as follows:
I
20
where n, nl, and n2 are the number of moles of mixture, monomer, and dimer per gram of mixture, respectively.
Specific Volume and Density of M i x t u r e
The specific volume v in cubic centimeters per gram may be obtained from the ideal gas law
RT - 82.05971 T v=- -
PMg PMg
The density p in grams per 1000 cubic centimeters is,
p=- 1000 V
(31)
therefore,
DISCUSSION OF VAPOR PRESSURES
Vapor Pressures Above Liquid
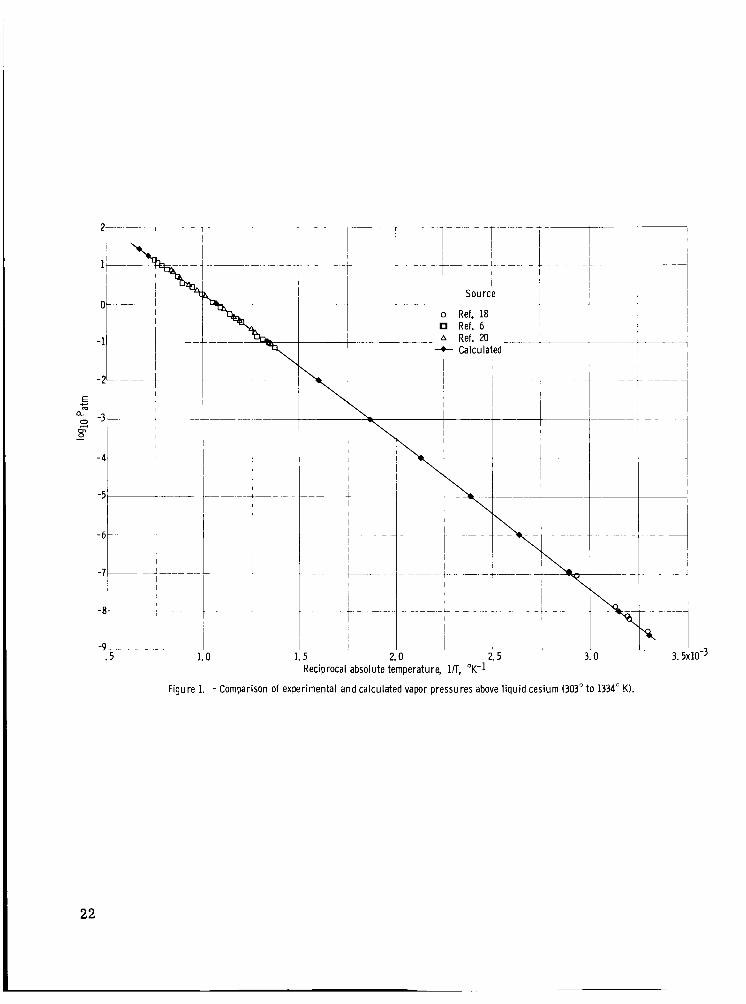
Table VI contains boiling points of liquid cesium at saturation pressures from to 10 atmospheres at every power of 10. These data were calculated in two ways:
(1) From the recommended thermodynamic data, as explained in the section THERMODYNAMIC ANALYSIS
(2) By a least-squares equation fitted to the recommended PCALC values with a standard deviation of 0.5 percent
On the average the two se ts of boiling points differ by about 0.2' K. It should be emphasized that the vapor pressure equation (eq. (33)) is recommended rather than equation (8).
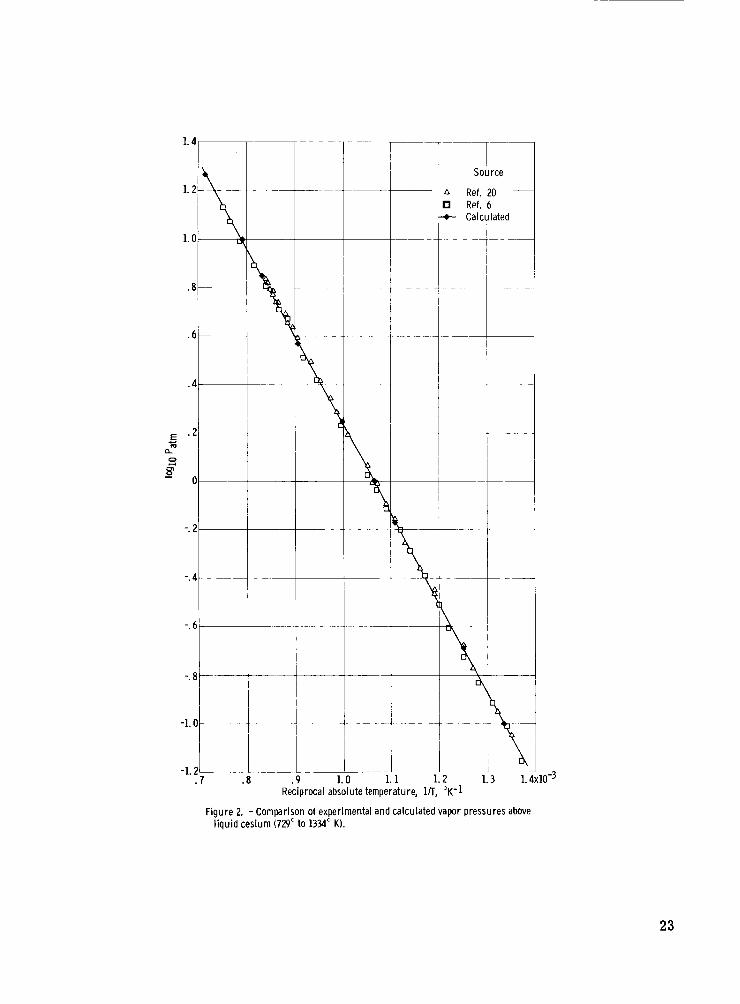
Figures 1 and 2 compare the experimental vapor pressures of liquid cesium with a curve drawn through the recommended vapor pressures. The agreement of the two sets is seen to be very good. Figure 1 covers the temperature range from 303' to 1334' K. Figure 2 covers only the range from 729' to 1334' K to facilitate detailed comparison.
21
E m c a 2 -3- - g
-41
-51 -6 c -81
-9 1 .5
- i
i
I
- I 1.- o
\ o Ref. 18
Ref. 6 I
___ A Ref. 20 [ + Calculated I
I ~
I I
1 i I
I i
i I I
I I t
1
I 1 3. SXIO-~
Reciprocal absolute temperature, In, "K-1
Figure 1. - Comparison of experimental and calculated vapor pressures above l i q u i d cesium (303" to 1334" K).
22
1.0
-r -1.2 ! -1.01-
. 7 1
Source
A Ref. 20 Ref. 6
-e Calc
Reciprocal absolute temperature, l/T, OK-1
Figure 2. - Comparison of experimental and calculated vapor pressures above l iqu id cesium (729" to 1334" K).
23
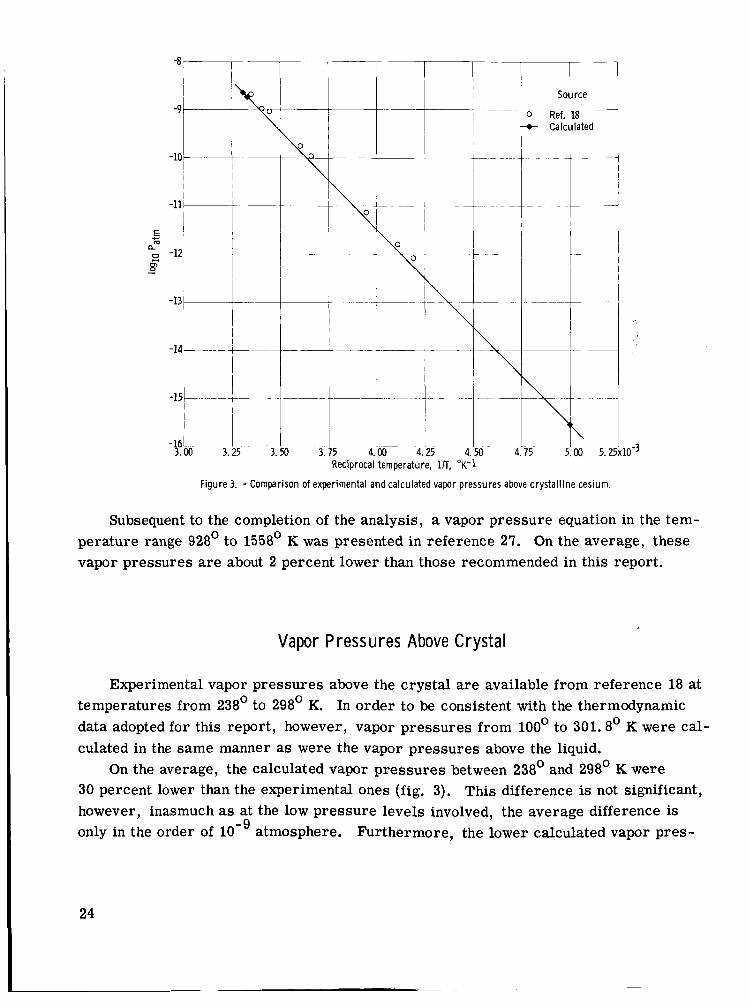
Figure 3. - Comparison of experimental and calculated vapor pressures above crysta l l ine cesium.
Subsequent to the completion of the analysis, a vapor pressure equation in the tem- perature range 928' to 1558' K was presented in reference 27. On the average, these vapor pressures are about 2 percent lower than those recommended in this report.
Vapor P ressu res Above Crysta l
Experimental vapor pressures above the crystal are available from reference 18 at temperatures from 238' to 298' K. In order to be consistent with the thermodynamic data adopted for this report, however, vapor pressures from 100' to 301.8' K were cal- culated in the same manner as were the vapor pressures above the liquid.
30 percent lower than the experimental ones (fig. 3). This difference is not significant, however, inasmuch as at the low pressure levels involved, the average difference is only in the order of lo-' atmosphere. Furthermore, the lower calculated vapor pres-
On the average, the calculated vapor pressures between 238' and 298' K were
24
sures a r e consistent with the assumption of reference 26 that the experimental vapor pressures a r e too high.
Lewis Research Center, National Aeronautics and Space Administration,
Cleveland, Ohio, April 26, 1965.
25
APPENDIX - SYMBOLS
rotational constant, cm- l
heat capacity at constant pressure for standard st ate , tal/( mole) (OK)
equilibrium specific heat at constant pressure of mix- ture, cal/g
frozen specific heat at con- stant pressure of mixture, c a l k
reactive specific heat at con- stant pressure of mixture, c a l k
spectroscopic constant for rotational stretching, cm-'
dissociation energy at 0' K, cal/mole
Gibbs free energy for stand- ard state, cal/mole
sensible f ree energy for standard state, cal/mole
sum of sensible enthalpy at To K and chemical energy at 0' K for standard state, c a 1/ mo le
sensible enthalpy for stand- ard state, cal/mole
enthalpy change for forma- tion of substance from ele- ment in atomic gas state, cal/mole
% h
'Bap
K
5
M
Ni
n
P
Pi
R
s;
enthalpy change for formation of substance from assigned reference element, cal/mole
chemical energy at 0' K for standard state, cal/mole
enthalpy, cal/g
heat of vaporization to 1 gram of equilibrium vapor
equilibrium constant for re - action of formation from element in atomic gas state
equilibrium constant for re- action of formation from assigned reference element
molecular weight based on chemical scale of natural oxygen, g/mole
mole fraction of ith species, moles of ith species per mole of mixture
number of moles per gram of equilibrium mixture
total vapor pressure, atm
partial pressure of i t h
species, atm
universal gas constant, 1.98726 cal/(mole)(OK) or 82.05971 (cc)(atm)/ ( moW0K)
tal/( mole) (OK)
entropy for standard state,
26
S
A s VaP
T
V
X. 1
CY e
P
U
entropy, tal/( g)(OK)
entropy of vaporization to
absolute temperature, OK
specific volume of vapor, cc/g
weight fraction of ith species, g of ith species per g of mixture
1 gram of equilibrium vapor
vibration- rot ation interaction constant for diatomic mole- cule, cm -1
density of vapor, g/lOOO cc
standard deviation
zero-order vibrational fre- Oe quency for diatomic molecule, c m - l
wexe, ueye anharmonicity constants for diatomic molecule, c m - l
Subscripts:
C condensed phase property
f formation from assigned reference element
g property of equilibrium vapor mixture
1 monomer property
2 dimer property
27
REFERENCES
1. McBride, Bonnie J. ; Heimel, Sheldon; Ehlers, Janet G. ; and Gordon, Sanford: Thermodynamic Properties to 6000' K for 210 Substances Involving the First 18 Elements. NASA SP-3001, 1963.
2. Lien, William H. ; and Phillips, Norman E. : Low-Temperature Heat Capacities of Potassium, Rubidium, and Cesium. Phys. Rev. , vol. 133, no. 5A, Mar. 2, 1964, pp. A 1 3 70 -A 13 77.
3. McColluni, D. C. , Jr. ; and Silsbee, Henry B. : Specific Heats of Rubidium and Cesium Between 1 .3 and 12' K. Phys. Rev. , vol. 127, no. 1, July 1, 1962, pp. 119-120.
4. Dauphinee, T. M. ; Martin, D. L. ; and Preston-Thomas, H. : The Specific Heats of Potassium, Rubidium, and Cesium at Temperatures Below 330' K. Proc. Roy. SOC. (London), ser. A, vol. 233, no. 1193, Dec. 20, 1955, pp. 214-222.
5. Clusius, K. ; und Stern, H. : Ergebnisse Der Tieftemperatur-Forschung. XI. Schmelzwarme Des Casiums. (Results of Investigation at Low Temperature. XI. The Heal of Fusion of Cesium.) Z. Angew. Phys. , bd. 6, no. 5, 1954, pp. 195-196.
6. Tepper, F. ; Murchison, A. ; Zelenak, J. ; and Roelich, F. : Thermophysical Properties of Rubidium and Cesium. Preprint No. 41c, A. I. Ch. E. , 1963.
7. Achener, P. Y. : The Determination of the Latent Heat of Vaporization, Vapor Pressure, Enthalpy, Specific Heat, and Density of Liquid Rubidium and Cesium up to 1800' F. Rept. No. AGN-8090, Aerojet-General Nucleonics, Jan. 1964.
8. Lemmon, A. W. , Jr.; Deem, H. W.; Eldridge, E. A.; Hall, E. H.; Matolich, J. , Jr. ; and Walling, J. F. : The Specific Heat, Thermal Conductivity and Viscosity of Liquid Cesium. NASA CR-54018, 1964.
9. Moore, Charlotte E. : Atomic Energy Levels as Derived from the Analyses of Optical Spectra. Cir. 467, Vol. 111, NBS, May 1, 1958.
10. Herzberg, Gerhard: Molecular Spectra and Molecular Structure. Vol. I. D. Van Nostrand Co., Inc. , 1950.
11. Evans, William H. ; Jacobson, Rosemary; Munson, Thomas R. ; and Wagman, Donald D. : Thermodynamic Properties of the Alkali Metals. J. Res. Nat. Bur. Standards, vol. 55, no. 2, Aug. 1955, pp. 83-96.
12. Hackspill, L. : Recherches s u r les Metaux Alcalins. Ch. 111 - Densite et Tension de Vapeur Saturante. (Research on Alkali Metals. Ch. I11 - Density and Pressure of Saturated Vapor.) Ann. Chim. Phys., t. 28, ser. 8, 1913, pp. 657-680.
28
~~
13. Kroner, A. : Uber die Dampfdrucke der Alkali-Metalle. (Vapor Pressures of the Alkali Metals.) Ann. Physik, bd. 40, no. 3, Mar. 20, 1913, pp. 438-452.
linien samt Beispiel ffir die Bestimmung von Dampfdrucken durch Absorptions messungen. (Regularities in the Absorption of Cesium Lines, and an Example of the Determination of Vapor Pressures by Absorption Measurements. ) Z. Physik, bd. 4, no. 3, 1921, pp. 337-342.
15. Scott, D. H. : A Determination of the Vapour Pressures of Caesium and Rubidium,
14. f ichtbauer , C. ; und Bartels, H. : Gesetzmassigkeit bei der Absorption von Casium
and a Calculation of Their Chemical Constants. Phil. Mag., vol. 47, no. 277, Jan. 1924, pp. 32-50.
16. Langmuir, I. ; and Kingdon, K. H. : Thermionic Effects Caused by Vapours of Alkali Metals. Proc. Roy. SOC. (London), se r . A, vol. 107, Jan. 1, 1925, pp. 61-79.
17. Minkowski, R. ; und Mzhlenbruch, W. : Die Ubergangswahrscheinlichkeiten in Den Beiden Ersten Dubletts Der Hauptserie Des Casiums. (Transition Probabilities in the First Two Doublets of the Principal Series of Caesium. ) Z. Physik, bd. 63, no. 3-4, 1930, pp. 198-209.
18. Taylor, John Bradshaw; and Langmuir, Irving: Vapor Pressure of Caesium by the Positive Ion Method. Phys. Rev., vol. 51, no. 9, May 1, 1937, pp. 753-60.
19. Nesmeyanov, A. N. : Vapour Pressure of the Element. Academic Press, 1963.
20. Bonilla, C. F. ; Sawhney, D. L. ; and Makansi, M. M. : Vapor Pressure of Alkali Metals. Rubidium, Cesium, and Sodium-Potassium Alloy (NaK) up to 100 PSI. Trans. ASM, vol. 55, no. 3, Sept. 1962, pp. 877-890; 1114-1119.
21. Loomis, F. W.; and Kusch, P.: The Band Spectrum of Caesium. Phys. Rev., ser . 2, vol. 46, no. 4, Aug. 15, 1934, pp. 292-301.
22. Somayajulu, G. R. : Dissociation Energies of Diatomic Molecules. J. Chem. Phys., vol. 33, no. 5, Nov. 1960, pp. 1541-1553.
23. Makansi, M. ; Selke, W. A. ; and Bonilla, C. F. : Thermodynamic Properties of Sodium. J. Chem. and Eng. Data, vol. 5, no. 4, Oct. 1960, pp. 441-52.
24. Stull, D. R. ; and Sinke, G. C. : Thermodynamic Properties of the Elements. Am. Chem. SOC., 1956.
25. Hultgren, R. R.; Orr, R. L.; Anderson, P. D.; and Kelley, K. K.: Selected Values of Thermodynamic Properties of Metals and Alloys. John Wiley & Sons, Inc., 1963.
29
26. Agapova, N. I . ; Paskar, B. L. ; and Fokin, L. R.: Calculation of the Thermo- dynamic Properties of Cesium Vapor up to 1500' K and a Pressure of 22 Bars. Soviet Atomic Energy, vol. 15, no. 4, Oct. 1963, pp. 1007-1017.
Properties of Sodium, Potassium, and Cesium. Thirteenth Prog. Rep. NRL Rep. 6213, U. S. NRL, Jan. 15, 1965.
27. Stone, J. P.; Ewing, C. T.; Spann, J. R.; and Miller, R. R.: High Temperature