Electronic identification of goats: comparison of different types of radio-frequency and visual devices Sergi Carné i Fructuoso (2010) Identificació electrònica de bestiar cabrum: comparació de diferents tipus de dispositius visuals i de radiofreqüència Identificación electrónica de ganado caprino: comparación de diferentes dispositivos visuales y de radiofrecuencia Electronic identification of goats Doctoral Thesis Sergi Carné (2010) Doctoral Thesis Carné, S. 2010. Electronic identification of goats: comparison of different types of radio-frequency and visual devices. Ph.D. Thesis. Universitat Autònoma de Barcelona, Bellaterra, Spain. 140 pp. Departament de Ciència Animal i dels Aliments IDentification constitutes the unavoidable primary step to successfully implementing traceability systems of livestock and their products. The use of passive radio-frequency technology for the electronic identification (e-ID) of livestock has become a key issue in recent years, especially in the European Union, where compulsory double ID (visual and e-ID) and registration of small ruminants is legislated (EC 21/2004; EC 933/2008). European regulations allow each member state to choose between different e-ID devices (ear tags, marks on the pastern, and rumen boluses), in addition to visual ear tags, for the e-ID before 6 mo of age and when leaving the farm of origin. In the case of goats, very few reports are available on the performance of visual and e-ID devices for the accurate long-term identification during the goat lifespan. Moreover, a remarkable variability of performances has been observed between devices. Regarding rumen boluses, unlike in sheep and cattle, inadequate retention rates have been observed in Spanish goat breeds, and further research is necessary on the features of devices for the efficient identification of goats. Thus, the aim of this Ph.D. thesis is to compare different available methods for the identification of goats. Visual and electronic ear tags, different types of rumen boluses, as well as marks on the pastern (injectable transponders and leg bands with attached transponders) were tested. The influence of age at tagging, breed and management system (i.e. feeding) were also investigated. According to obtained results, e-ID devices performed better than most visual ear tags. Injection of glass encapsulated transponders in the metacarpus was not recommended. Leg bands with button transponders were also not recommended if applied before 6 mo of age, although they were an adequate method for adult does. Despite differences according to types, adequately designed button-button e-ID ear tags showed the best readability rates in goats. Important differences in age at administration and retention rate between types of rumen boluses were found. Obtained values allowed a regression model to be constructed where high specific gravity (i.e. greater than in sheep) was recognized as the key aspect for their efficient retention in the reticulorumen of goats. As a result, the dimensions of new boluses for goats were defined. Universitat Autònoma de Barcelona
Transcript
Electronic identification of goats: comparison of different types of radio-frequency and visual
devices
Sergi Carné i Fructuoso (2010)
Identificació electrònica de bestiar cabrum: comparació de diferents tipus de dispositius visuals i de
radiofreqüència
Identificación electrónica de ganado caprino: comparación de diferentes dispositivos visuales y de
radiofrecuencia
Electronic iden
tification of goats D
octoral Thesis Sergi C
arné
(201
0)
Doctoral Thesis
Carné, S. 2010. Electronic identification of goats: comparison of different types of radio-frequency and visual devices. Ph.D. Thesis. Universitat Autònoma de Barcelona, Bellaterra, Spain. 140 pp.
Departament de Ciència Animal i dels AlimentsIDentification constitutes the unavoidable primary step to successfully implementing traceability systems of livestock and their products. The use of passive radio-frequency technology for the electronic identification (e-ID) of livestock has become a key issue in recent years, especially in the European Union, where compulsory double ID (visual and e-ID) and registration of small ruminants is legislated (EC 21/2004; EC 933/2008). European regulations allow each member state to choose between different e-ID devices (ear tags, marks on the pastern, and rumen boluses), in addition to visual ear tags, for the e-ID before 6 mo of age and when leaving the farm of origin. In the case of goats, very few reports are available on the performance of visual and e-ID devices for the accurate long-term identification during the goat lifespan. Moreover, a remarkable variability of performances has been observed between devices. Regarding rumen boluses, unlike in sheep and cattle, inadequate retention rates have been observed in Spanish goat breeds, and further research is necessary on the features of devices for the efficient identification of goats.Thus, the aim of this Ph.D. thesis is to compare different available methods for the identification of goats. Visual and electronic ear tags, different types of rumen boluses, as well as marks on the pastern (injectable transponders and leg bands with attached transponders) were tested. The influence of age at tagging, breed and management system (i.e. feeding) were also investigated.According to obtained results, e-ID devices performed better than most visual ear tags. Injection of glass encapsulated transponders in the metacarpus was not recommended. Leg bands with button transponders were also not recommended if applied before 6 mo of age, although they were an adequate method for adult does. Despite differences according to types, adequately designed button-button e-ID ear tags showed the best readability rates in goats. Important differences in age at administration and retention rate between types of rumen boluses were found. Obtained values allowed a regression model to be constructed where high specific gravity (i.e. greater than in sheep) was recognized as the key aspect for their efficient retention in the reticulorumen of goats. As a result, the dimensions of new boluses for goats were defined.
Universitat Autònoma de Barcelona
Departament de Ciència Animal i dels Aliments
Electronic identification of goats: comparison of different types of radio-frequency and visual devices
Identificació electrònica en cabrum: comparació de diferents tipus de dispositius visuals i de radiofreqüència
Identificación electrónica del ganado caprino: comparación de
diferentes dispositivos visuales y de radiofrecuencia
DOCTORAL THESIS
Sergi Carné i Fructuoso
Bellaterra (Barcelona)
2010
Electronic identification of goats: comparison of different types of
radio-frequency and visual devices
Identificació electrònica en cabrum: comparació de diferents tipus de dispositius visuals i de radiofreqüència
Identificación electrónica del ganado caprino: comparación de
diferentes tipos de dispositivos visuales y de radiofrecuencia
Tesis presentada per Sergi Carné i Fructuoso, dirigida pel Dr. Gerardo Caja López del Departament de Ciència Animal i dels Aliments de la Universitat Autònoma de Barcelona, per obtenir el títol de Doctor.
Bellaterra, 9 d’abril de 2010 Vo Bo Dr. Gerardo Caja López
AGRAÏMENTS
ACKNOWLEDGMENTS
El primer agraïment va dirigit al meu director de tesi, el Dr. Gerardo Caja, per haver
cregut en mi quan vaig presentar-me al seu despatx per demanar-li de treballar amb ell i per
donar-me la oportunitat d’incorporar-me al Grup de Recerca en Remugants. També voldria
expressar-li el meu agraïment pel suport rebut durant tot aquest temps, per les moltíssimes
coses que n’he après, pels bons consells, i per les bones estones passades durant la
realització d’aquesta tesi... aunque sigue sin convencerme que ‘progresa quien se estresa’.
Vull també agrair les moltíssimes hores compartides a tots els que, en algun moment
al llarg d’aquests anys, han passat pel nostre despatx de becaris (‘la pecera’). Espero no
deixar-me a ningú: Ahmed Salama, Juan Ghirardi, Cristobal Flores, Alejandra Rojas,
Vanesa Castillo, Ali Zidi, Adel Ait Saidi, Manel Ben Khadim, Andrés Schlageter, Soufiane
Hamzaoui, Jean-Hubert Mocket, Marta Hernández, Youssef Moussaoui i Antonio
Santibáñez. Vull fer extensiu l’agraïment als professors Elena Albanell, Xavier Such i
Ramon Casals, als tècnics de laboratori Blas Sànchez i Carmen Martínez, així com a tot el
personal de la secretaria del Departament de Ciència Animal i dels Aliments.
Un agraïment molt especial va dirigit al Ramon Costa i la resta del personal del
Servei de Granges i Camps Experimentals de la UAB: Alfredo Vega, Josep Vidal, Ramon
Comorera, José Luis de la Torre, Cristobal Flores, Sònia Andrés i Sergi Graboleda. A tots
ells, per la inestimable paciència... i pel cafè dels matins.
A tots els ramaders i pastors que m’han permès emprar els seus ramats per a portar a
terme bona part dels treballs de camp: Salvador Miralles, Pepito Miralles, Llorenç i Martí
Huguet, José Luis Casanueva, Lluís Mauri i Gerard Porta.
A la Maristela Rovai per haver fet possible que una de les experiències d’aquesta tesi
es realitzés a l’American Institute for Goat Research, i molt especialment per acollir-me
amb els braços oberts durant la meva estància a Oklahoma.
To Dr. Terry A. Gipson and Dr. Roger C. Merkel from the American Institute for
Goat Research, as well as to Erick Loetz, Jerry Hayes and the farm crew of this institute,
for their valuable contribution to carrying out one of the experiments included in this thesis.
A l’empresa Rumitag pel decidit suport mostrat durant la realització d’aquest treball.
i
ii
L’agraïment més important és per a la família, i en especial pels meus pares Gabriel i
Rosa Maria, per ajudar-me i aguantar-me sempre que han pogut; perquè sempre hi són. A
la Sílvia, el Jordi i l’Uri ‘lousky’, per ajudar-me cada dia, encara que molts cops no se
n’adonin. I com no, al Sergi, el Biel i el Marc, el trident màgic de la nova generació.
A tothom qui ha participat d’una o altra manera d’aquesta etapa de la meva vida,
gràcies.
Abril de 2010
Rubí, Barcelona
Sergi Carné i Fructuoso
SCIENTIFIC DISSEMINATION
Publications in international peer-reviewed journals Carné, S., G. Caja, J. J. Ghirardi, and A. A. K. Salama. 2009. Long-term performance of
visual and electronic identification devices in dairy goats. J. Dairy Sci. 92:1500-1511.
Carné, S., T. A. Gipson, M. Rovai, R. C. Merkel, and G. Caja. 2009. Extended field test on the use of visual ear tags and rumen boluses for the identification of different goat breeds in the United States. J. Anim. Sci. 87:2419-2427.
Carné, S., G. Caja, M. A. Rojas-Olivares, and A. A. K. Salama. 2010. Readability of visual and electronic leg tags versus rumen boluses and electronic ear tags for the permanent identification of dairy goats. J. Dairy Sci. (accepted).
Carné, S., G. Caja, J. J. Ghirardi, and A. A. K. Salama. 2010. Modeling the retention of rumen boluses for the electronic identification of goats. J. Dairy Sci. (accepted).
Publications in national journals
Capote, J., D. Martín, N. Castro, E. Muñoz, J. Lozano, S. Carné, J. J. Ghirardi, y G. Caja. 2005. Retención de bolos ruminales para identificación electrónica en distintas razas de cabras españolas. Feagas, 27:32-34.
Carné, S., G. Caja, M. A. Rojas-Olivares, y A. A. K. Salama. 2010. Comparación de pulseras y bolos ruminales para la identificación electrónica de ganado caprino lechero. Tierras de Castilla y León. 165:36-38.
International conference symposia
Carné, S., G. Caja, J. J. Ghirardi, and A. A. K. Salama. 2007. A model for predicting the retention of electronic ruminal boluses according to their physical features in goats. 58th EAAP Annual Meeting, Dublin, Ireland. Book of abstracts No. 13, p. 253.
Carné, S., G. Caja, J. J. Ghirardi, and A. A. K. Salama. 2007. Effects of age and rearing method on long-term retention of different electronic identification devices in goat. J. Anim. Sci. 85 (Suppl. 1):93 (Abstr.).
Carné, S., G. Caja, J. J. Ghirardi, and A. A. K. Salama. 2007. Predicting the retention of ruminal boluses for the electronic identification of goats. J. Anim. Sci. 85 (Suppl. 1):93 (Abstr.).
Carné, S., T. A. Gipson, M. Rovai, R. C. Merkel, and G. Caja. 2008. Medium-term performance of electronic rumen boluses for the identification of different goat breeds in the US. 59th EAAP Annual Meeting, Vilnius, Lithuania. Book of abstracts No. 14, p. 244.
Carné, S., T. A. Gipson, M. Rovai, R. C. Merkel, and G. Caja. 2008. Use of electronic rumen boluses for the identification of different goat breeds in the US. J. Anim. Sci. 86 (Suppl. 2):338 (Abstr.).
iii
iv
Carné, S., G. Caja, M. A. Rojas-Olivares, and A. A. K. Salama. 2009. Leg bands and rumen boluses for the long-term electronic identification of goats. J. Dairy Sci. 92 (Suppl. 1):310 (Abstr.).
Carné, S., G. Caja, J. J. Ghirardi, and A. A. K. Salama. 2009. Bolus features for the electronic identification of goats. 60th EAAP Annual Meeting, Barcelona, Spain. Book of abstracts No. 15, p. 494.
Carné, S., G. Caja, M. A. Rojas-Olivares, and A. A. K. Salama. 2009. Comparison of leg bands and rumen boluses for the electronic identification of dairy goats. 60th EAAP Annual Meeting, Barcelona, Spain. Book of abstracts No. 15, p. 489.
National conference symposia
Capote, J., D. Martín, N. Castro, E. Muñoz, J. Lozano, S. Carné, J. J. Ghirardi, y G. Caja. 2005. Retención de bolos ruminales para identificación electrónica en distintas razas de cabras españolas. ITEA Prod. Animal, 26 (volumen extra):297-299.
Carné, S., G. Caja, y J. J. Ghirardi. 2005. El mantenimiento del reflejo de la gotera esofágica y sus efectos a corto plazo (5 meses) en la identificación electrónica de cabritos de raza Murciano-Granadina. ITEA Prod. Animal, 26 (volumen extra):300-302.
Carné, S., G. Caja, J. J. Ghirardi, y A. A. K. Salama. 2007. Relación entre las características físicas y la retención de bolos ruminales utilizados en la identificación electrónica de caprino. ITEA Prod. Animal, 28 (volumen extra):306-308.
Carné, S., G. Caja, M. A. Rojas-Olivares, y A. A. K. Salama. 2009. Comparación de pulseras y bolos ruminales para la identificación electrónica de ganado caprino lechero. ITEA Prod. Animal, 30 (volumen extra):463-465.
LIST OF ABBREVIATIONS
BW Body weight CP Crude protein d Day DRE Dynamic reading efficiency e-ID Electronic identification Exp. Experiment FDX-B Full duplex g Gram h Hour ha Hectare HDX Half duplex ICAR International Committee for Animal Recording ID Identification ISO International Organization for Standardization kHz Kilohertz MAPA Spanish Ministry of Agriculture (Currently
MARM) Mcal Megacalorie min Minute mm Millimeter mo Month n Sample size NEL Net energy for lactation No. Number L Liter o.d. Outside diameter P Probability R2 Multiple coefficient of determination R/O Read only RR Retention rate RFID Radio frequency identification s Second s.c. Subcutaneous SG Specific gravity SAS Statistical Analysis Software SEM Standard error of the mean SRE Static reading efficiency USDA United States Department of Agriculture V Volume W Weight wk Week yr Year
v
ABSTRACT
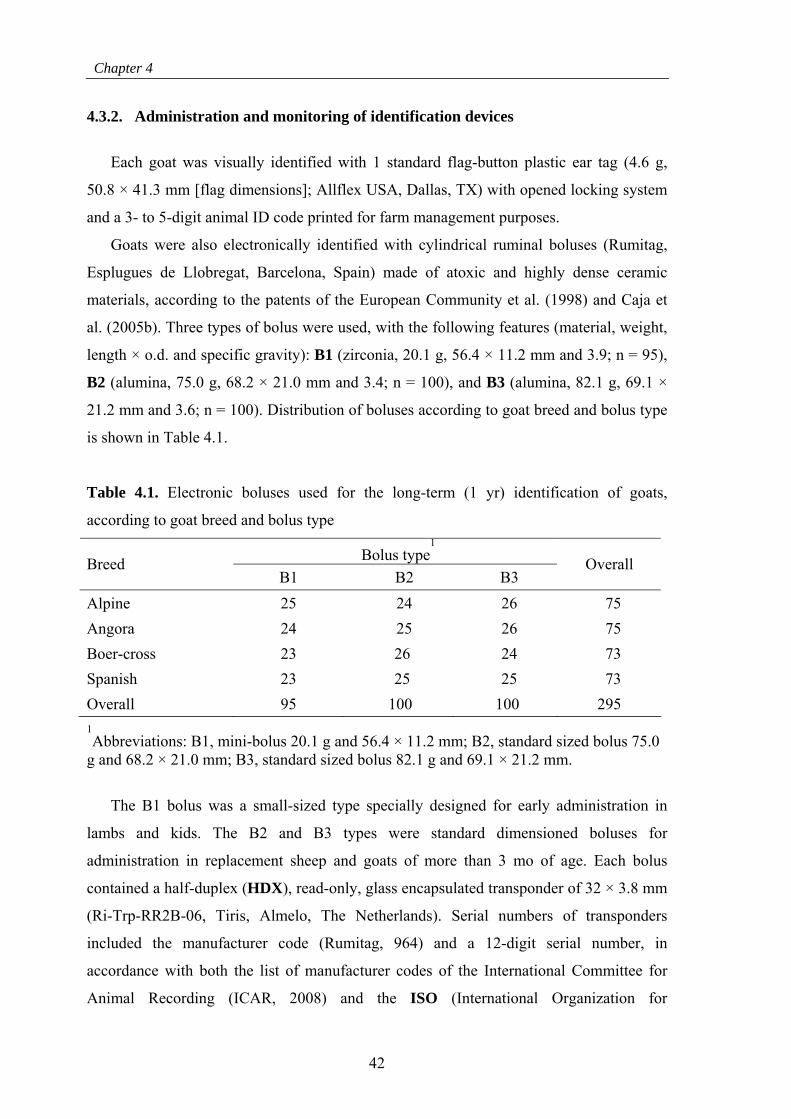
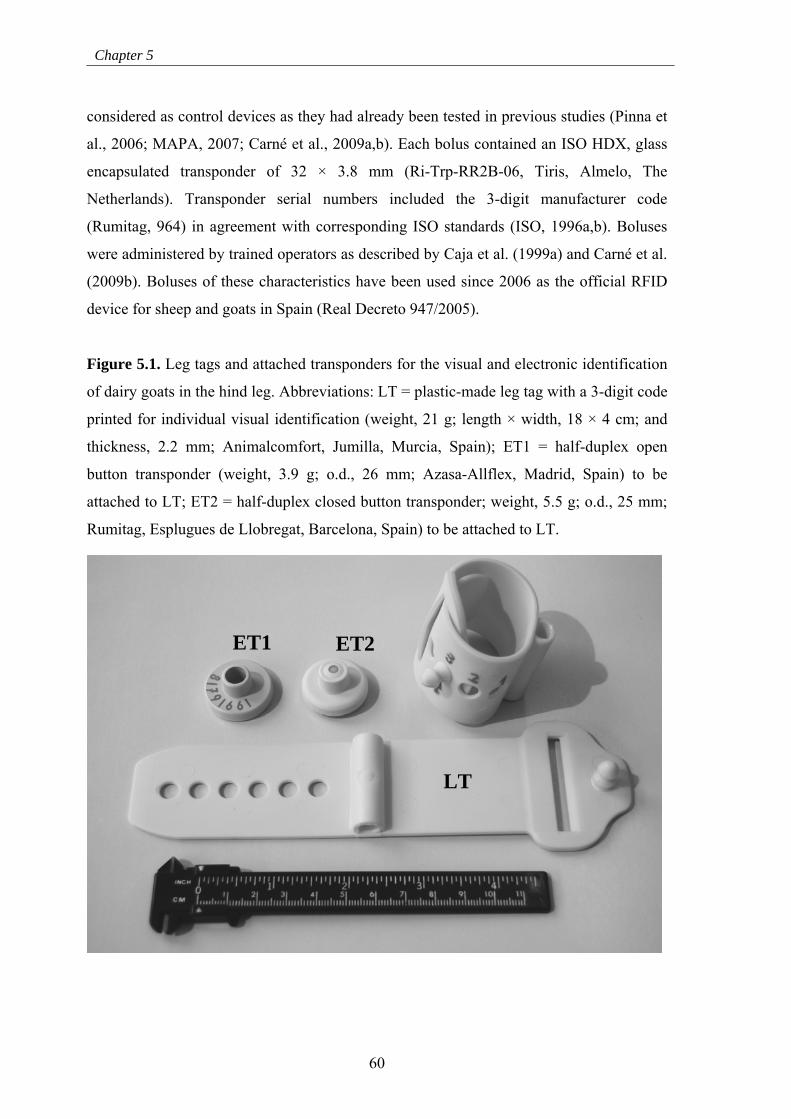
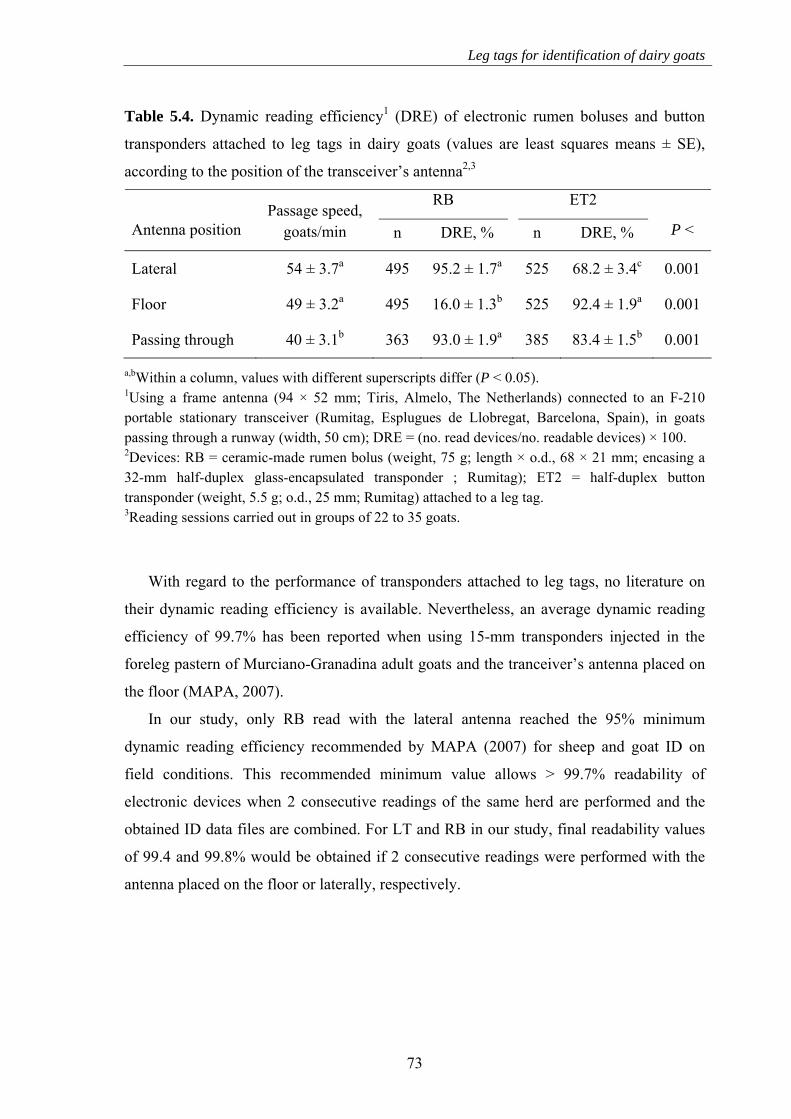
This thesis aimed to evaluate different visual and radio frequency identification (RFID) devices for goats. As current European regulations lay down the official use of visual and RFID ear tags, rumen boluses, and marks on the pastern (injectable transponders and RFID leg bands), these devices were tested in 4 experiments. In Exp. 1, application and long-term readability of visual ear tags (V1: tip-tag; V2: official), mini-boluses (B1: 13.8 g; and B2: 20.0 g), RFID ear tags (E1: flag-button; E2: double button), and injects on the fore-hind pastern (T1: 15 mm; T2: 12 mm) in replacement Murciano-Granadina dairy goat kids (n = 97) were tested; standard-sized boluses (B3: 75 g) were evaluated as control devices in their mothers (n = 29). At 1 yr of age, readability of B3, E1 and E2 was 100%. Lower readabilities corresponded to B1 (71.4%), V1 (82.9%), B2 (84.6%), and T1 (92%). At 3 yr of age, only E1 was 100% readable; readability of the rest of devices ranged from 69.6 to 96.4%. In conclusion, button RFID ear tags offered the best results for ID of dairy goats at early age. In Exp. 2, a total of 295 adult and yearling goats from Alpine, Angora, Boer, and Spanish breeds, and managed under semi-extensive conditions, were used. Influence of management system and breed effects on the retention of 3 bolus types (B1: 20 g, n = 95; B2: 75 g, n = 100; and B3: 82 g, n = 100) and 1 visual ear tag were investigated. Effect of feeding management on early losses (mo 1) was evaluated by measuring ruminal pH. No early losses occurred, although ruminal pH varied by goat breed and feeding management (6.32 to 6.73). At 1 yr, bolus retention (98.1%) was greater than ear tag (91.7%). Lowest bolus retention was for B1 (96.3%), whereas it was 97.8% for B3, and 100% for B2. Ear tag retention varied between breeds (82.9 to 98.6%). In conclusion, standard-sized boluses offered suitable long-term retention for goats under semi-extensive conditions. In Exp. 3, adult Murciano-Granadina goats (n = 220) were identified with visual ear tags (VE), rumen boluses (RB: 75 g), RFID ear tags (EE, n = 47), and leg tags (LT) with 2 types of button transponders (ET1, n = 90; ET2, n = 130). Long-term readability was evaluated. According to shank circumference, LT for kid ID was discarded and only adult does were used. At 1 yr, no losses of LT occurred, although 1.5% were removed due to limping; readability of RB, EE, VE, ET1, and ET2 was 96.5, 95.7, 97, 93.9, and 98.3%, respectively. Greater dynamic reading efficiency DRE for RB (95.2%) and LT (92.4%) were obtained with the antenna to the left and on the floor, respectively. In conclusion, adequately designed leg tags are a valid ID method for adult dairy goats. In Exp. 4, 2,482 RFID rumen boluses from 19 bolus types were used to construct a regression model of bolus retention in goats. Bolus features varied in length (37 to 84 mm), o.d. (9 to 22 mm), weight (W, 5 to 111 g), volume (V, 2.5 to 26 mL), and specific gravity (SG, 1 to 5.5). Bolus retention varied (0 to 100%) according to bolus features. A logit regression model with W and V as covariates was constructed (R2 = 0.98). Estimated W and SG to produce mini- (5 mL), medium- (15 mL) and standard-sized (22 mL) boluses for a retention rate of 99.95% were 42.9, 73.0, and 94.1 g, and 8.58, 4.87, and 4.28, respectively. Increasing bolus W and SG allowed V to be reduced. Suitable medium-sized RFID boluses for goats can be produced with radio translucent materials currently available. In conclusion, under our conditions, visual ear tags and injects in the pastern were not recommended for official ID. Button electronic ear tags showed variable results according to type, and electronic leg tags were a valid method only for adult goats. As a result of the bolus retention model obtained, medium-sized boluses may be effectively produced for goat ID, but mini boluses are not recommended.
vii
RESUM
L’objectiu d’aquesta tesi ha estat l’avaluació de diferents dispositius de identificació del bestiar cabrum, recentment contemplades a la legislació europea. S’han portat a terme 4 experiments per tal d’avaluar els següents dispositius: cròtals plàstics i de ràdio freqüència (RFID), bols ruminals, i identificadors a les extremitats (injectables i braçalets). A l’Exp. 1 es van emprar 97 cabrits de raça Murciano-Granadina per estudiar l’aplicació i capacitat de lectura (CL) de cròtals visuals (V1: tip-tag; V2: oficial), cròtals de RFID (E1: bandera-botó; E2: doble botó), mini-bols (B1: 13,8 g; B2: 20 g), i injectables a l’extremitat anterior (T1: 15 mm; T2: 12 mm); les mares (n = 29) es van identificar amb bols de mida estàndard (B3: 75 g). Al cap d’un any, la CL de B3, E1 i E2 va ser del 100%. Les CL més baixes es van donar amb el B1 (71,4%), V1 (82,9%), B2 (84,6%) i T1 (92%). Als 3 anys, només l’E1 va mostrar una CL del 100%; en la resta de dispositius la CL va variar entre 69,9 i 96,4%. En conclusió, només un dels cròtals de RFID de tipus botó va permetre la adequada ID de cabrides de reposició de raça lletera. A l’Exp. 2, es van emprar 295 cabres adultes i segalles de les races Alpina, Angora, Boer i Spanish, i explotades en condicions semi-extensives. Es va testar la retenció de 3 tipus de bols (B1: 20 g, n = 95; B2: 75 g, n = 100; B3: 82 g, n = 100) i 1 cròtal visual de tipus bandera-botó. Per tal de comprovar la relació entre el maneig alimentari i les pèrdues en el primer mes, es van prendre mesures de pH ruminal. No es van produir pèrdues de bols durant el mes 1, tot i que el pH diferí d’acord amb la raça i maneig (6,32- 6,73). Al ca de l’any, la retenció de bols (98,1%) va ser superior a la de cròtals (91,7%). La menor retenció es va obtenir amb el B1 (96,3%), mentre que va ser de 97,8% per al B3 i de 100% per al B2. La retenció dels cròtals varià en funció de la raça (82,9-98,6%). En conclusió, els bols de mida estàndard van oferir una retenció adequada a llarg termini per a la ID de cabrum en condicions semi-extensives. A l’Exp. 3, 220 cabres de raça Murciano-Granadina es van identificar amb cròtals visuals (VE) i de RFID (EE, n = 47), bols ruminals (RB: 75 g), i identificadors a l’extremitat (LT) amb 2 tipus de transponedors tipus botó (ET1, n = 90; ET2, n = 130). Es va avaluar la CL durant 12 mesos. D’acord amb el perímetre de canya, es descartà l’ús de LT en cabrides i només s’utilitzà en cabres adultes. Al cap d’1 any, no es van produir pèrdues de LT però l’1,5% van ésser retirats per causar coixeses. Les CL de RB, EE, VE, ET1 i ET2 van ser de 96.5, 95.7, 97, 93.9 i 98.3%, respectivament. Les eficiències de lectura dinàmica més elevades per a RB (95,2%) i LT (92,4%) s’obtingueren amb l’antena posicionada a l’esquerra i a terra, respectivament. En conclusió, els braçalets resultaren un mètode vàlid per a la ID de cabrum d’edat adulta. A l’Exp. 4, 2.482 bols ruminals pertanyents a 19 tipus diferents es van utilitzar per establir un model de regressió de la retenció de bols en cabrum. Els bols variaren en longitud (37-84 mm), diàmetre (9-22 mm), pes (W, 5-111 g), volum (V, 2,5-26 mL) i gravetat específica (SG, 1-5,5). La retenció dels bols varià (0-100%) segons les seves característiques. Es va poder establir un model logístic de retenció de bols (R2 = 0,98), prenent W i V com a covariables. Els W i SG estimats per a bols mini (5 mL), mitjans (15 mL) i estàndards (22 mL) per a una retenció del 99,95% van ser de 42.9, 73.0, i 94.1 g, i de 8.58, 4.87, and 4.28, respectivament. L’augment de W i SG permetria reduir el V. Els materials ràdio-translúcids actuals permetrien obtenir RFID bols de mida mitjana adequats per a l’ús en cabrum. En conclusió, en les nostres condicions, els cròtals visuals i els injectables en pota no s’aconsellen per ID oficial. Els cròtals electrònics de botó mostraren resultats variables segons el tipus, i els braçalets són un mètode vàlid tan sols en cabres adultes. D’acord amb el model de retenció de bols ruminals, es poden produir bols adequats de mida mitjana per a cabrum, mentre que els bols mini estan desaconsellats.
viii
ix
RESUMEN
El objetivo de esta tesis fue evaluar diferentes dispositivos de identificación en ganado caprino, recientemente contempladas en la legislación europea. Se realizaron 4 experimentos a fin de comparar los siguientes dispositivos: crotales plásticos y de radio frecuencia (RFID), bolos ruminales, e identificadores en pata (inyectables y pulseras). En el Exp. 1 se utilizaron 97 cabritos Murciano-Granadinos para estudiar la aplicación y capacidad de lectura (CL) de crotales visuales (V1: tip-tag; V2: oficial), crotales RFID (E1: bandera-botón; E2: doble botón), mini-bolos (B1: 13,8 g; B2: 20,0 g), e inyectables en el metacarpo (T1: 15 mm; T2: 12 mm); las madres (n = 29) se identificaron con bolos estándar (B3: 75 g). Al año, la CL fue de 100% en B3, E1 y E2. Las CL más bajas se fueron las de B1 (71,4%), V1 (82,9%), B2 (84,6%) y T1 (92%). A los 3 años, sólo E1 presentó una CL del 100%, variando en el resto entre 69,9 y 96,4%. En conclusión, sólo los crotales RFID de botón resultaron adecuados para la ID de caprino lechero a edades tempranas. En el Exp. 2, se utilizaron 295 cabras adultas i de reposición de las razas Alpina, Angora, Boer y Spanish, explotadas en condiciones semi-extensivas. Se ensayaron 3 tipos de bolos ruminales (B1: 20 g, n = 95; B2: 75 g, n = 100; B3: 82 g, n = 100) y 1 crotal visual. Para comprobar la relación entre manejo alimentario y la pérdidas de bolos tempranas (mes 1), se realizaron medidas de pH ruminal. No se produjeron pérdidas durante el mes 1, aunque el pH ruminal varió según raza y manejo (6,32 a 6,73). A 1 año, la retención de bolos (98,1%) fue superior a la de crotales (91,7%). La menor retención se observó en B1 (96,3%), mientras que fue de 97,8% en B3 y de 100% en B2. La retención de crotales varió según la raza (82,9 a 98,6%). En conclusión, los bolos ruminales de tamaño estándar mostraron una adecuada retención a largo plazo para la ID de caprino en condiciones semi-extensivas americanas. En la Exp. 3, 220 cabras de raza Murciano-Granadina se identificaron con crotales visuales (VE), bolos ruminales (RB: 75 g), crotales de RFID (EE, n = 47), y pulseras en metatarso (LT) con 2 tipos de transpondedores tipo botón (ET1, n = 90; ET2, n = 130). Se evaluó la CL a 1 año. De acuerdo con el perímetro de caña, las LT se descartaron en cabritos de 5 meses y sólo se utilizaron en cabras adultas. Al año no se observaron pérdidas de LT, pero el 1,5% fueron retiradas por producir cojeras. Las CL de RB, EE, VE, ET1 y ET2 fueron de 96,5, 95,7, 97,0, 93,9 y 98,3%, respectivamente. Los valores más elevados de eficiencia de lectura dinámica para RB (95,2%) y LT (92.4%) se obtuvieron con la antena colocada a la izquierda y en el suelo, respectivamente. En conclusión, las pulseras resultaron un método válido para la ID de caprino adulto. En la Exp. 4, 2.482 bolos ruminales pertenecientes a 19 tipos distintos se utilizaron para establecer un modelo de regresión de la retención de bolos en caprino. Los bolos variaron en longitud (37 a 84 mm), diámetro (9 a 22 mm), peso (W: 5 a 111 g), volumen (V: 2,5 a 26 mL) y gravedad específica (SG: 1-5,5). La retención de bolos varió (0 a 100%) en función de sus características. Se pudo establecer un modelo logístico de retención (R2 = 0,98), tomando W y V como covariables. Los valores estimados de W y SG estimados para conseguir una retención del 99,95% en bolos mini (5 mL), medianos (15 mL) y estándar (22 mL), fueron de 42,9, 73,0 y 94,1 g, y de 8,58, 4,87 y 4,28, respectivamente; aumentar la W y SG mediante materiales radio-translúcidos actuales permitiría reducir el V y obtener bolos medianos adecuados para caprino. En conclusión, en nuestras condiciones, no se aconsejan los crotales visuales y los inyectables en pata para la ID oficial. Los crotales electrónicos de botón mostraron resultados variables según el tipo, y las pulseras fueron un método adecuado sólo en cabras adultas. A partir del modelo de retención de bolos obtenido se pueden producir bolos medianos adecuados para caprino, pero se desaconsejan los mini bolos.
1.1. Traceability and animal identification……....……………………………………... 1 1.2. Traditional techniques for permanent animal identification…………..…………… 3 1.3. Biometrics in animal identification……….………………….…………………….. 5 1.4. Radio frequency devices for animal identification….……........…………...……… 5 1.5. Antecedents on the use of conventional and radio frequency devices for goat
identification…………………………..…………………………………………. 8
1.6. European legislation on goat identification..…...……………………...…………... 10 1.6.1. Background………………….………....………………………………………. 10 1.6.2. Current legislation…………………...….……………………………………… 11
3.4.2. Effect of kid rearing on readability of identification devices……....………...... 30 3.4.3. First year readability……..………..………………………………..………….. 31 3.4.4. Long-term readability……...…………...……………………….…..…………. 32
Chapter 4: Experiment 2. Extended field test on the use of visual ear tags and electronic boluses for the identification of different goat breeds in the United States………..……………………………………………..……………………..……....
4.3. Materials and methods………………………..…………..………………………... 40
4.3.1. Animals and management…………...…………………………………………. 40
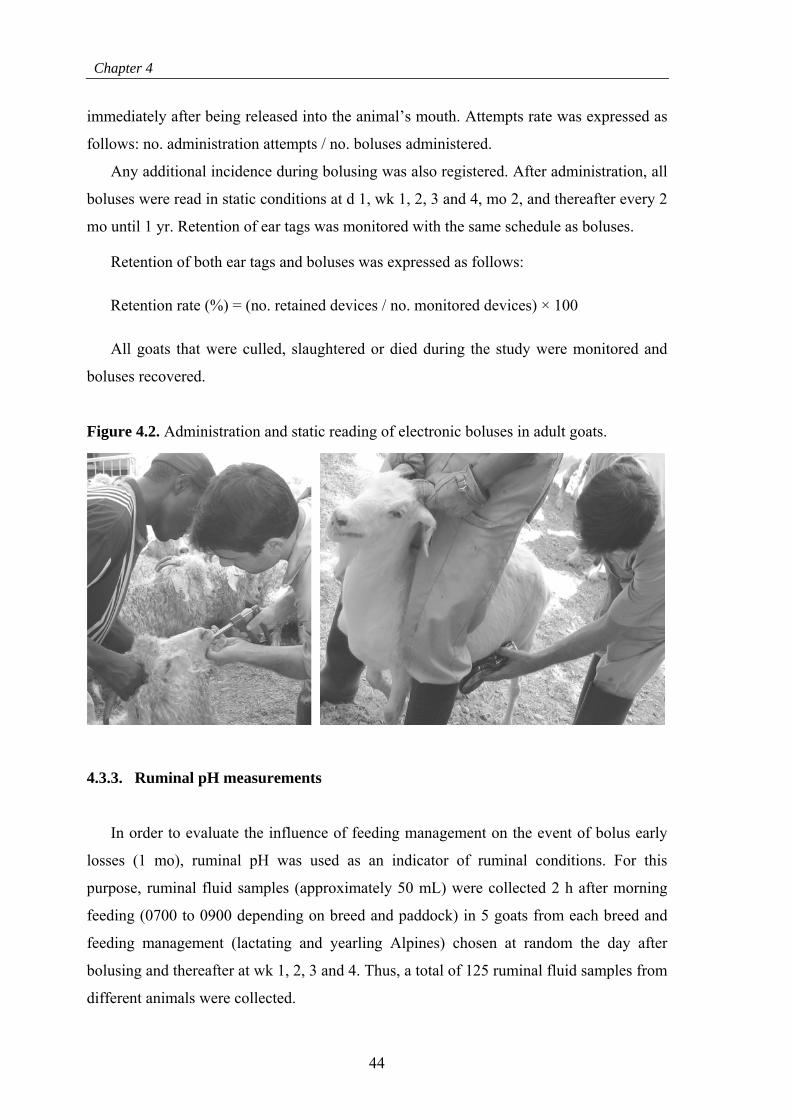
4.3.2. Administration and monitoring of identification devices………..……………..... 41 4.3.3. Ruminal pH measurements……………..………………………………………… 44 4.3.4. Statistical analyses……..………………………….………………………………. 45
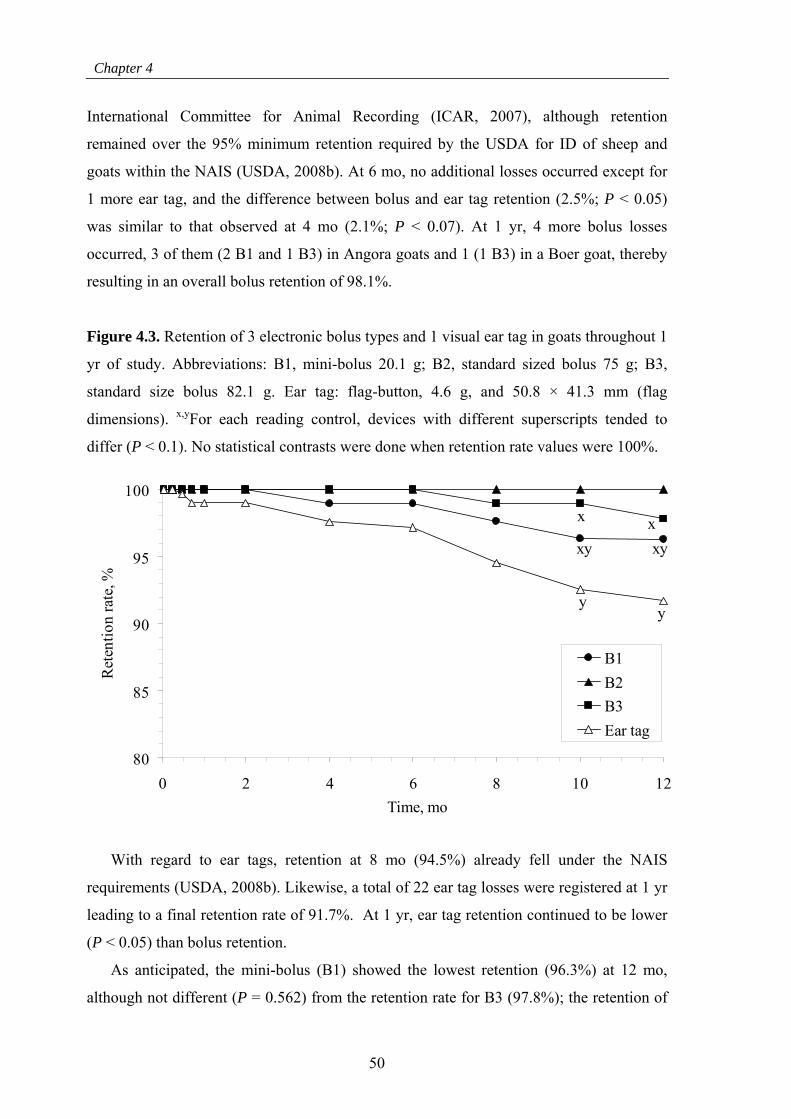
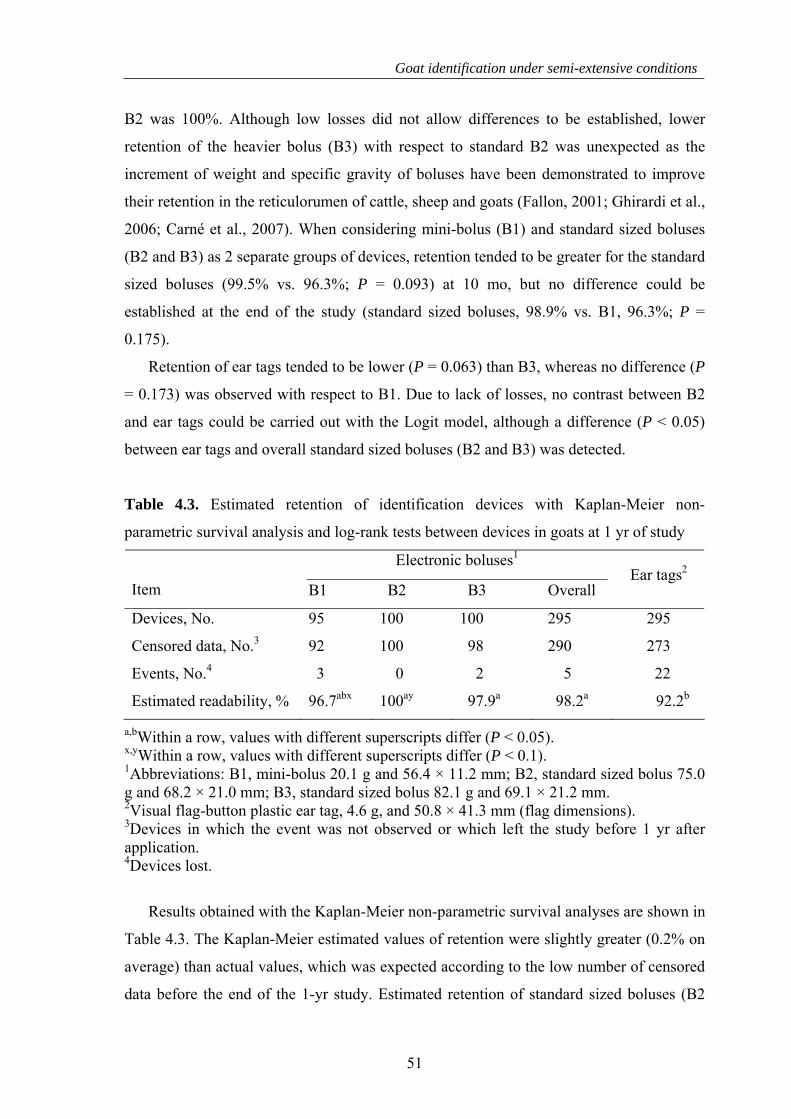
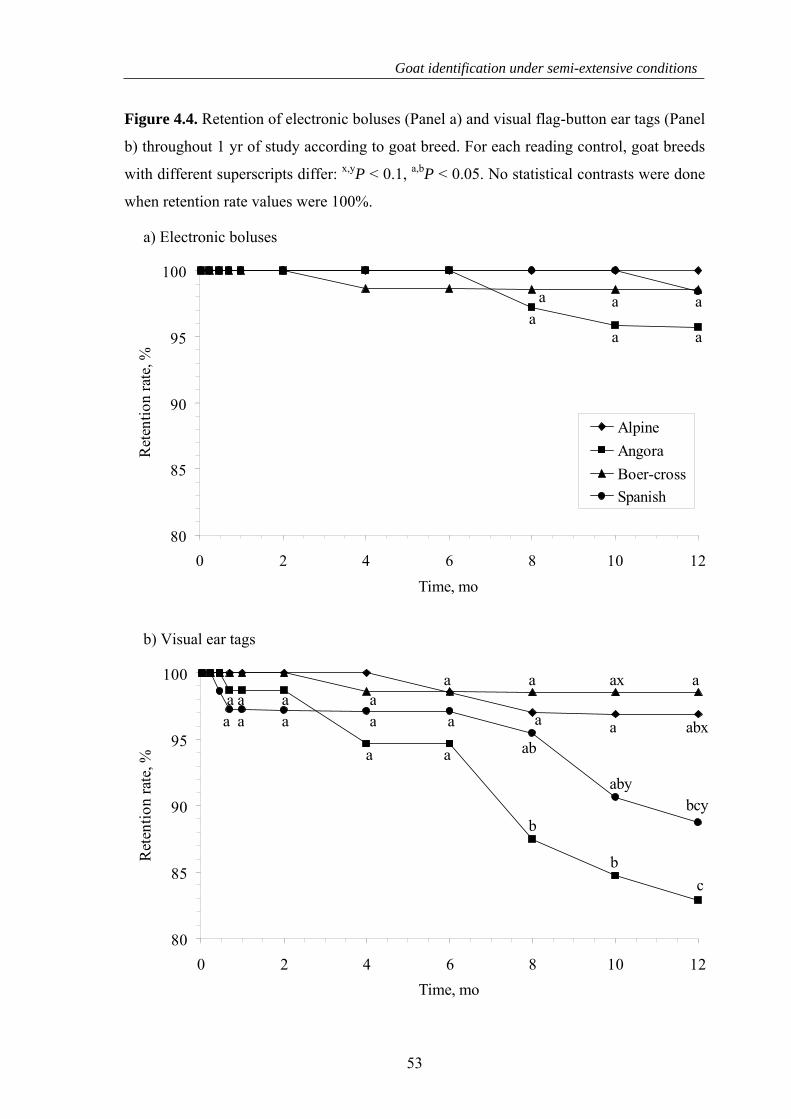
4.4. Results and Discussion…….………………………..………………………………… 46 4.4.1. Bolus administration and animal data recording…………………..……………… 46 4.4.2. Ruminal pH and short-term retention of identification devices…..………………. 48 4.4.3. Long-term retention of identification devices………..…………………………... 49
Chapter 5: Experiment 3. Readability of visual and electronic leg tags versus rumen boluses and electronic ear tags for the permanent identification of dairy goats ………
5.3.1. Animals, management, and identification devices………..……………………… 59 5.3.2. Measurements and readings of identification devices…..……………………...... 61 5.3.3. Statistical analyses…..…………………………………………………………… 63
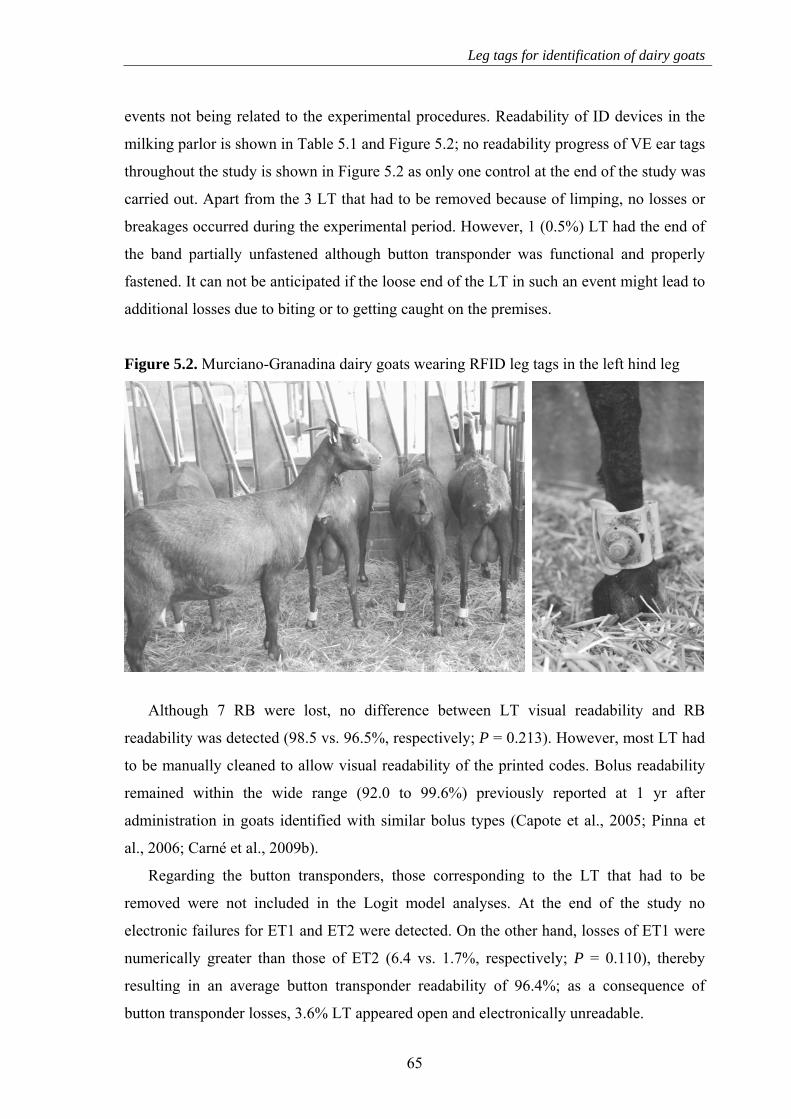
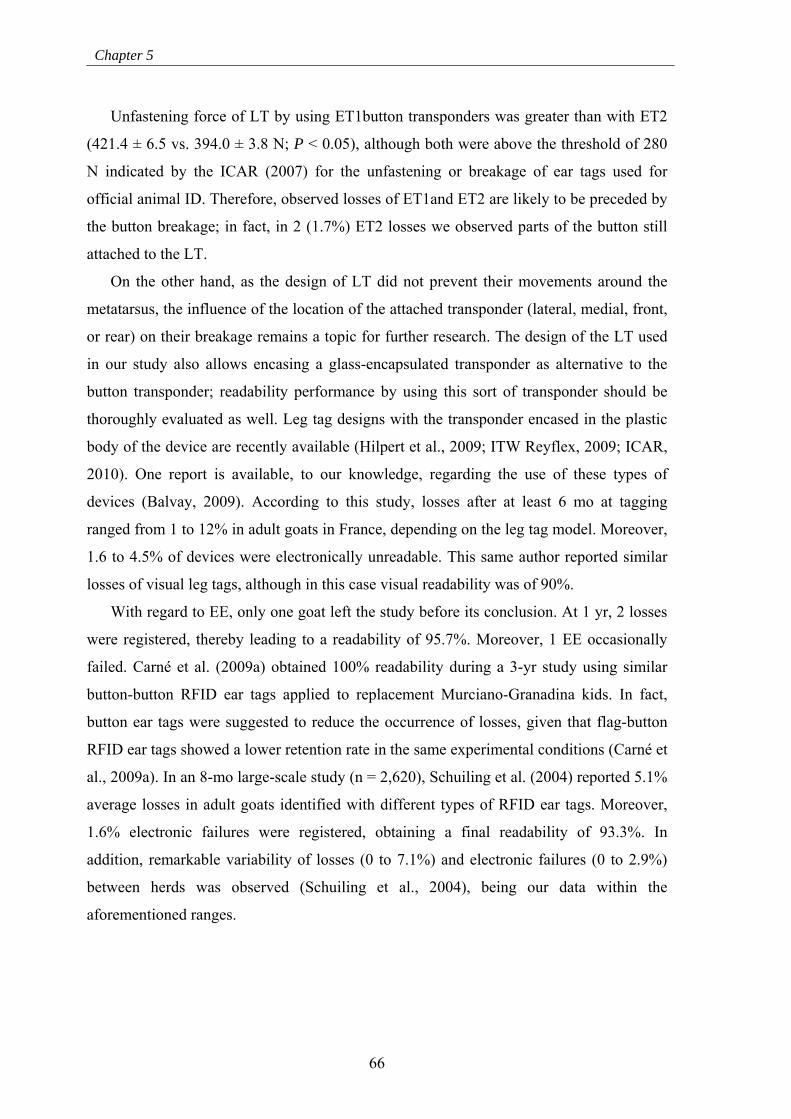
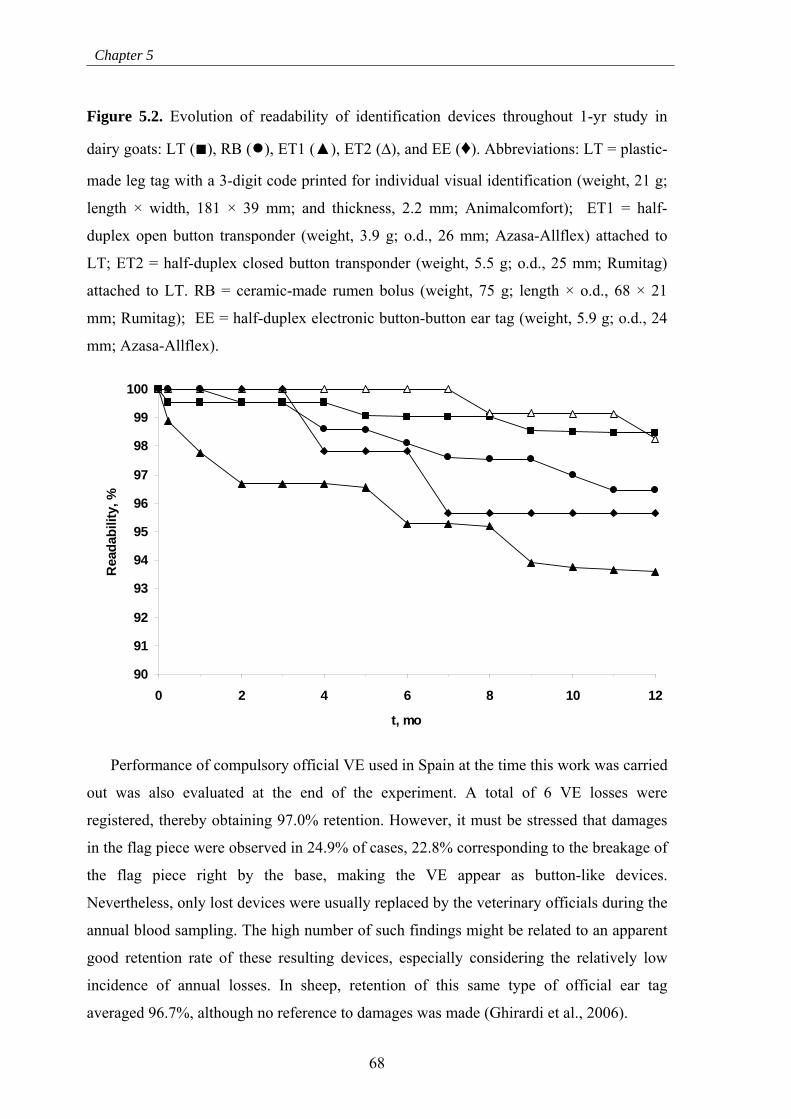
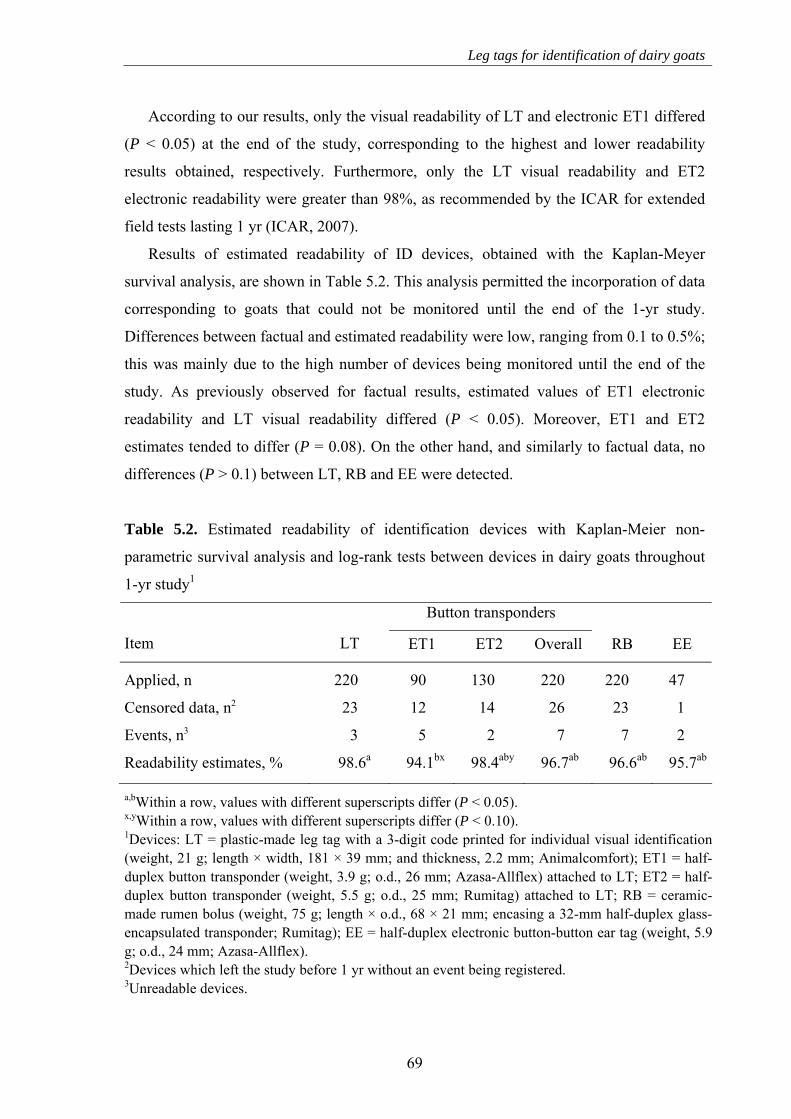
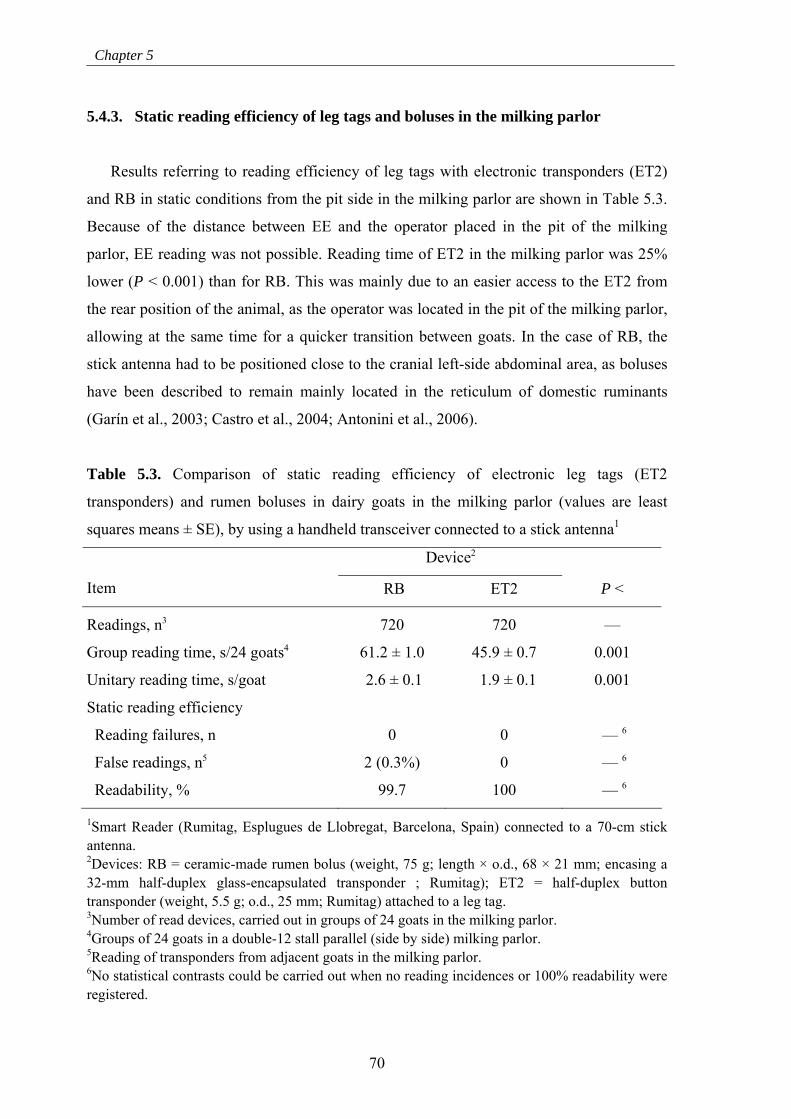
5.4. Results and discussion…………….…………………………………...……………… 63 5.4.1. Application performance of leg tags…………..…………………………………. 63 5.4.2. Long-term readability of identification devices…..……………………………… 64 5.4.3. Static reading efficiency of leg tags and boluses in the milking parlor.……..…... 70 5.4.4. Dynamic reading efficiency of leg tags and boluses…………………………….. 72
Chapter 6: Experiment 4. Modeling the retention of rumen boluses for the electronic identification of goats………………………………………………………........................
6.3.1. Animals and management……………………..…………………………………. 77 6.3.2. Visual ear tags……………..……………………………………………………... 77 6.3.3. Rumen boluses and administration procedures……………………………...…… 78 6.3.4. Monitoring of identification devices…………...………………………………… 80 6.3.5. Statistical analyses………..……………………………………………………… 81
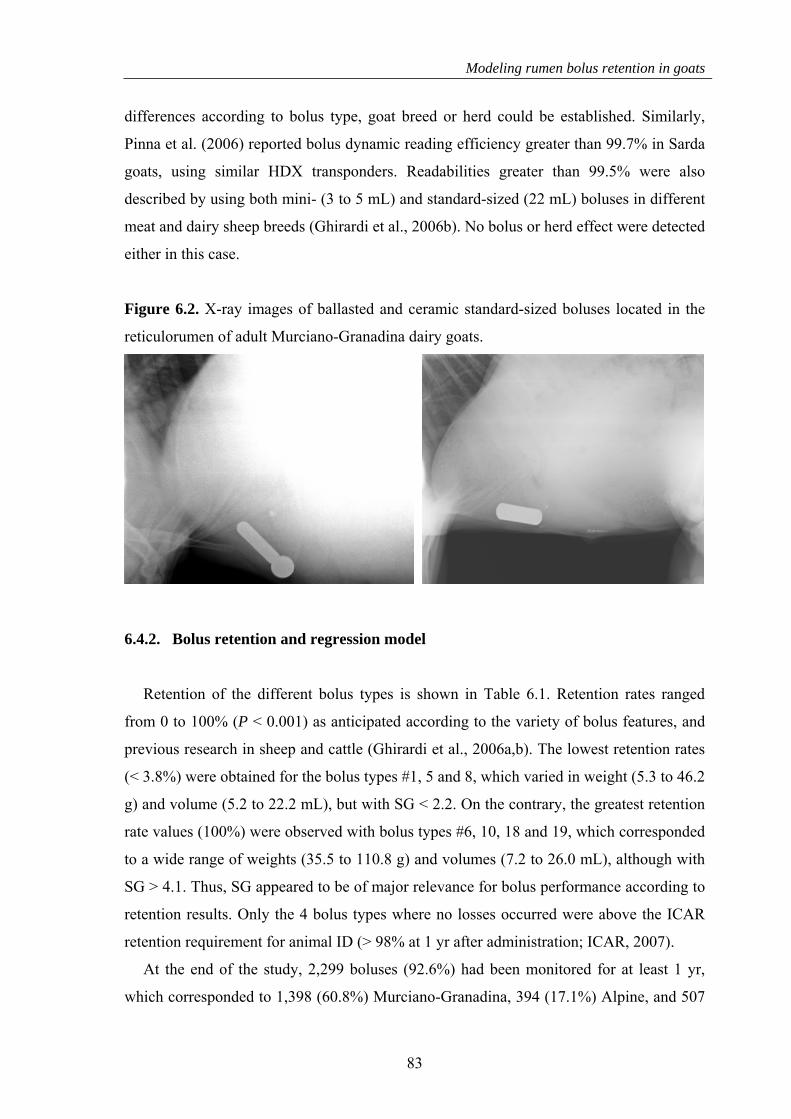
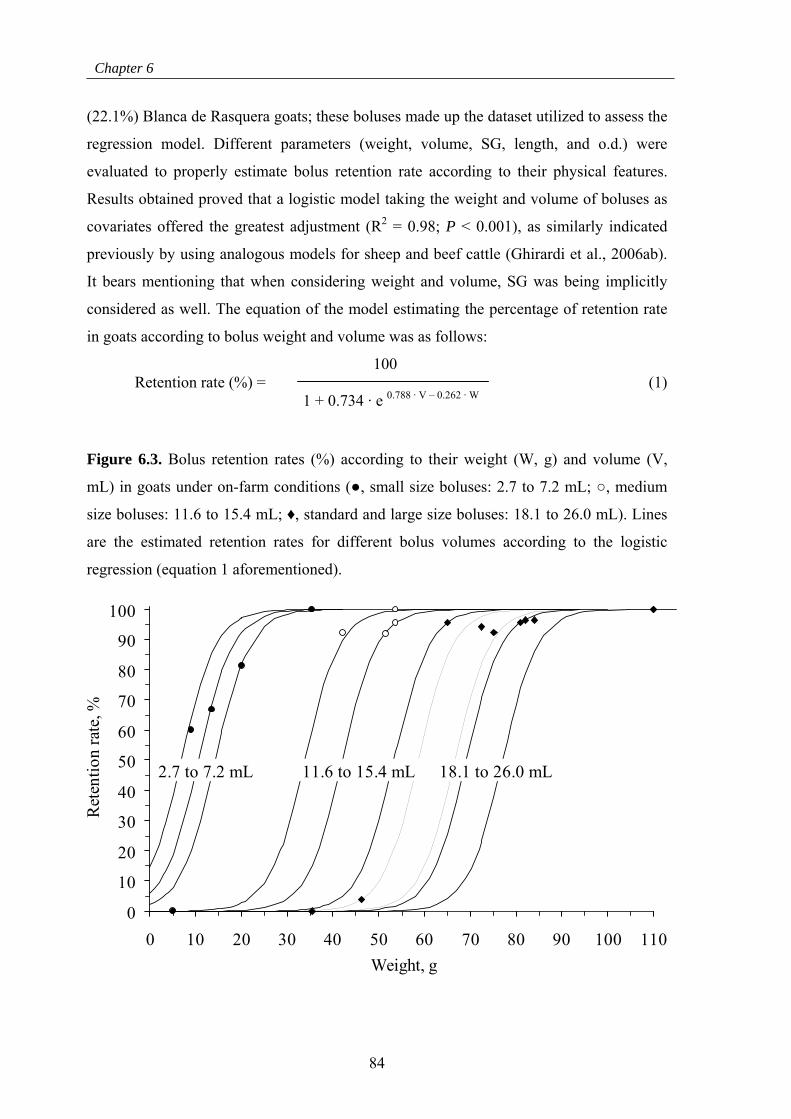
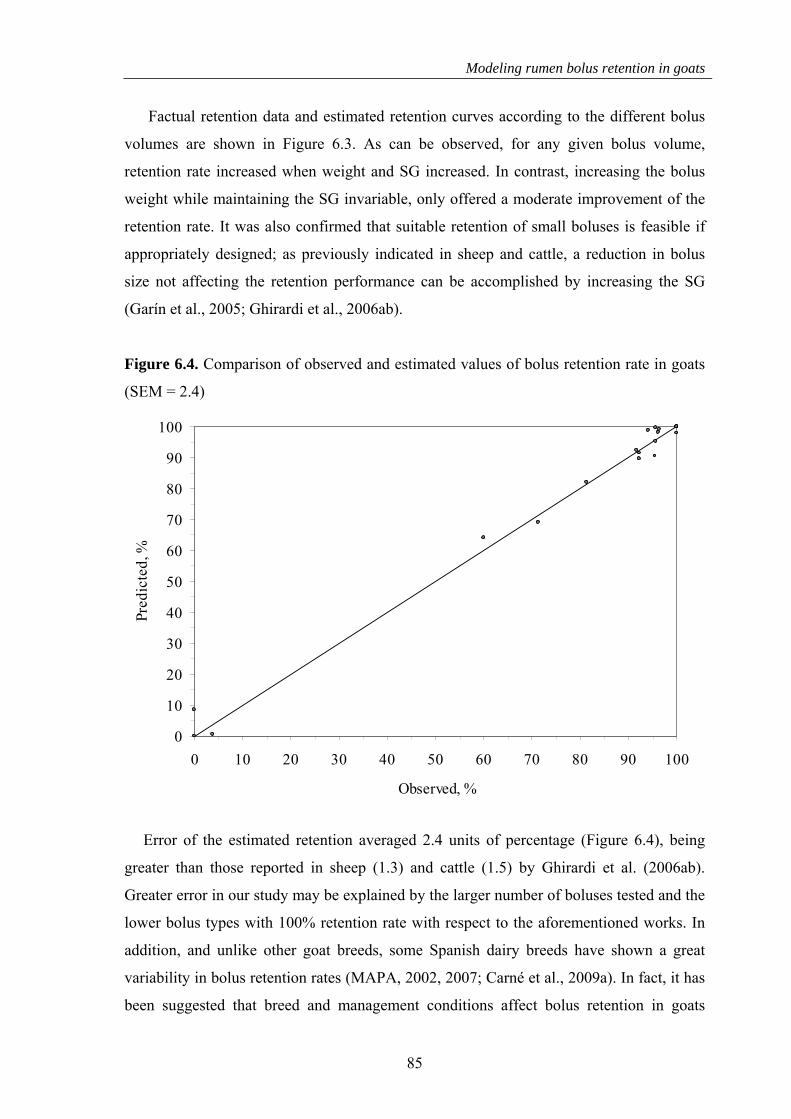
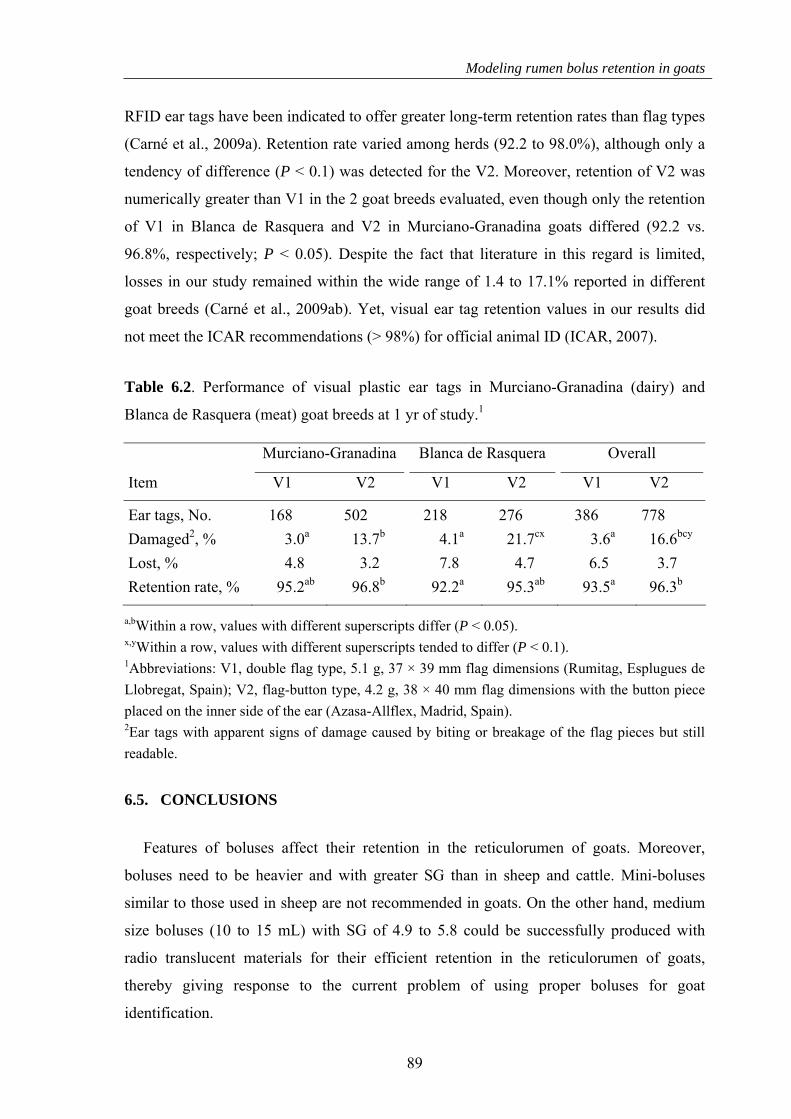
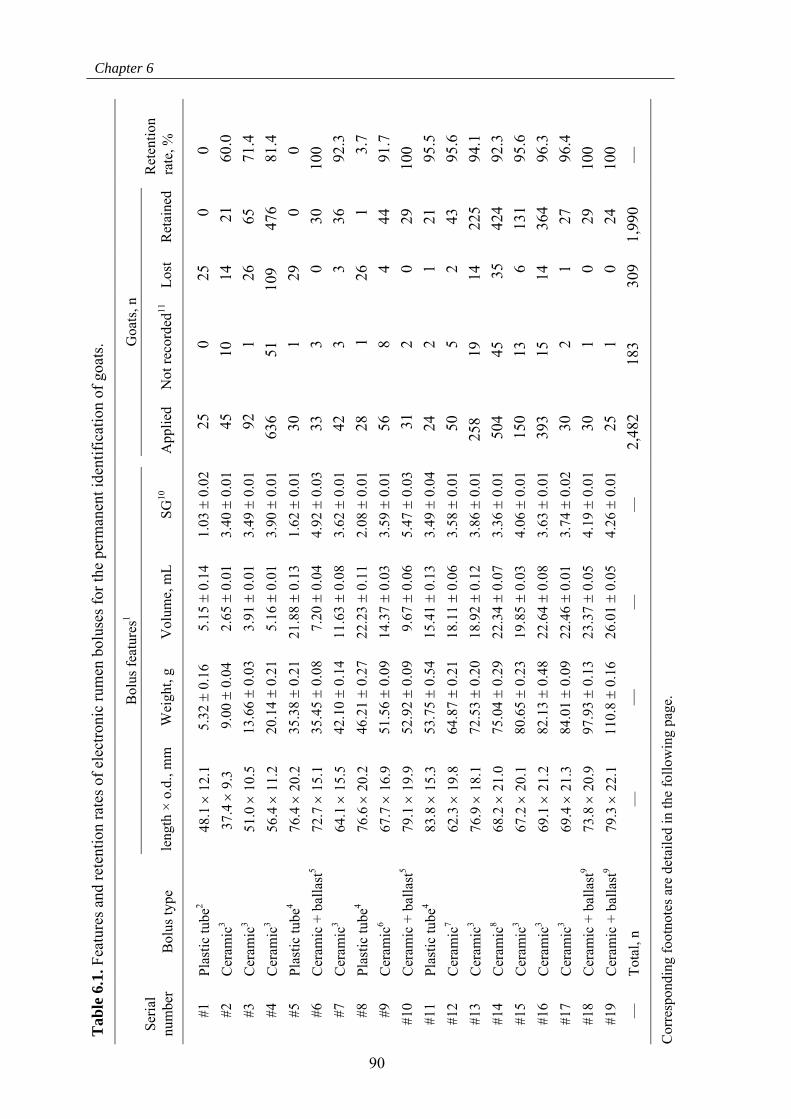
6.4. Results and discussion………………...……………………......................................... 81 6.4.1. Features of boluses, and administration and reading performances…………....... 81 6.4.2. Bolus retention and regression model………………..…………………………... 83 6.4.3. Ear tag retention………………..………………………….……………………... 88
6.5. Conclusions…………………………………………………………………………… 89
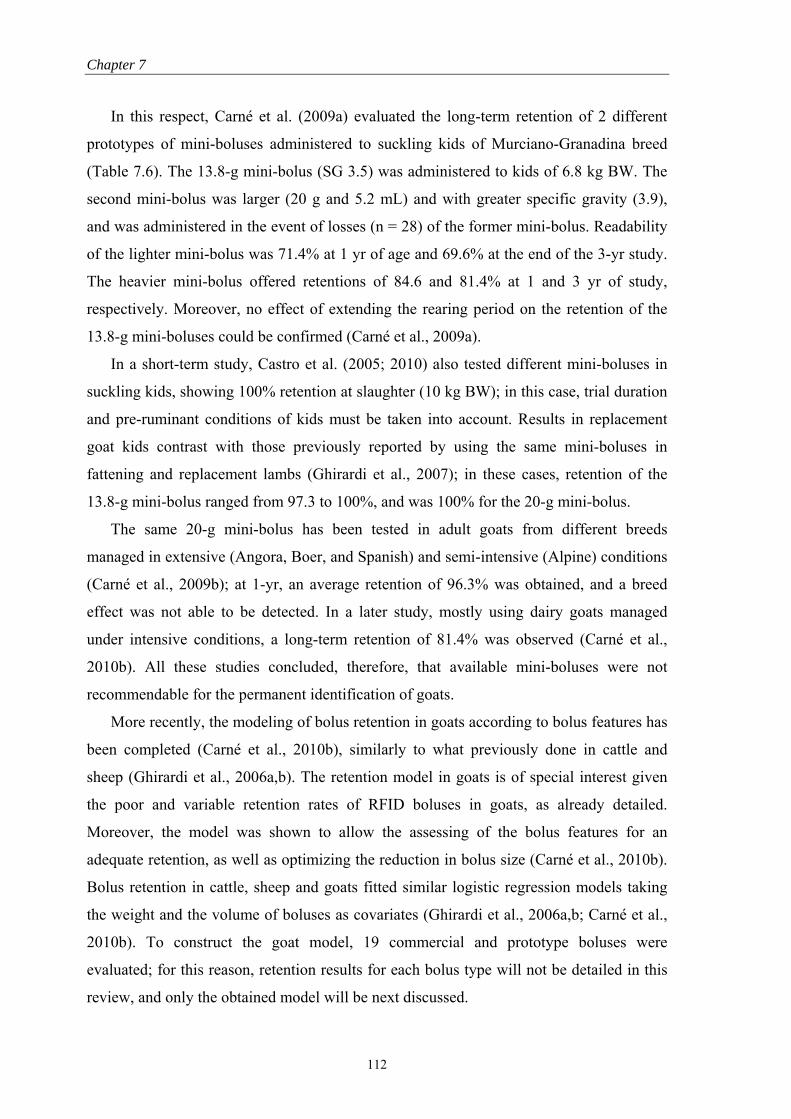
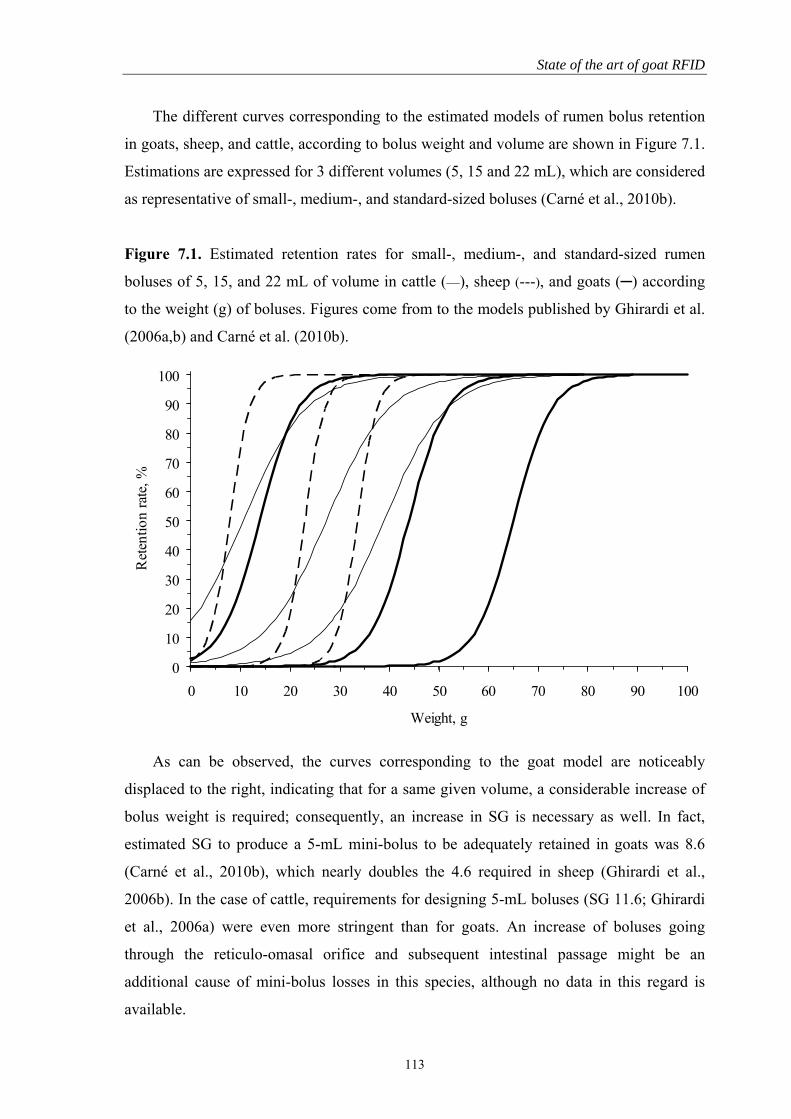
Chapter 7: Electronic identification of goats by using radio-frequency devices: State of the art………………………………………………….…...………………………...…...
and Gabriilidis, 1997; Halachmi et al., 1998; Pinelli et al., 2002; Ait-Saidi et al., 2007;
Trevarthen and Michael, 2008; Voulodimos et al., 2009; Bocquier et al., 2009).
1.5. Antecedents on the use of conventional and radio frequency devices for goat
identification
At the time of carrying out the experiments corresponding to the present thesis,
available data on the performance of ID devices in goats were very limited in comparison
with other livestock species. Information referring to goats corresponded to the evaluation
of plastic ear tags (Caja et al., 1999a,b), electronic ear tags (Schuiling et al., 2004),
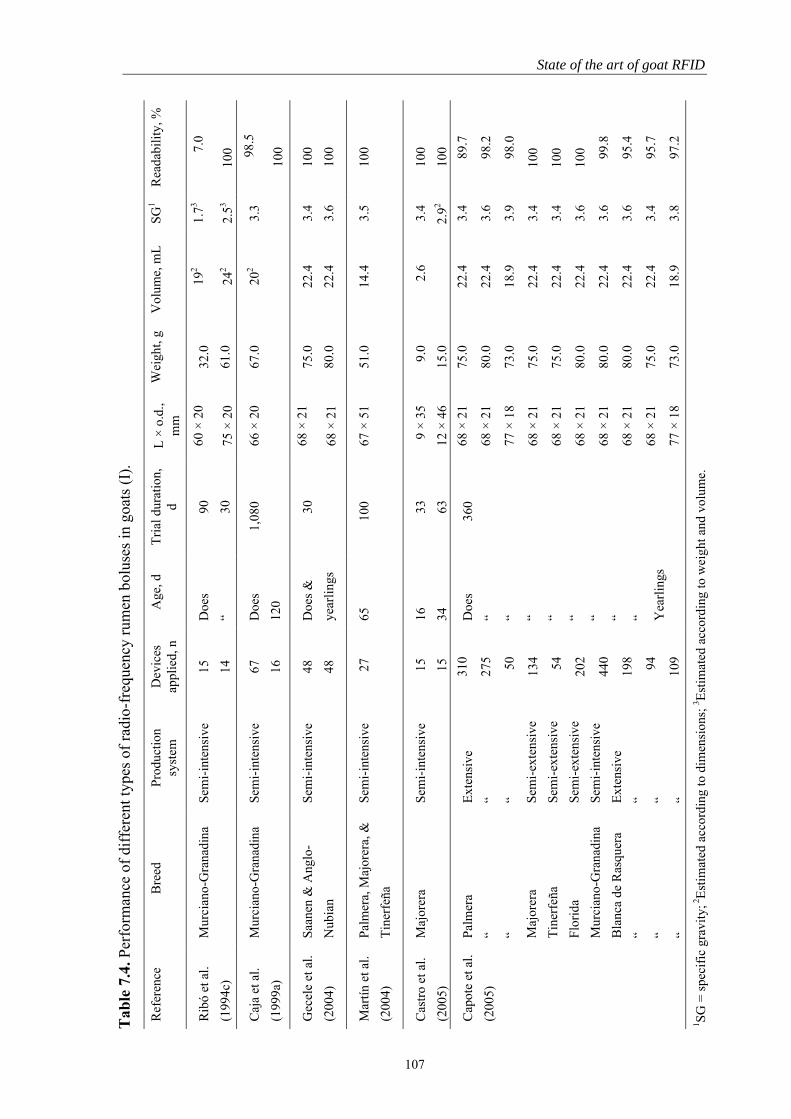
electronic rumen boluses (Ribó et al., 1994; JRC, 2003; Capote et al., 2005; MAPA, 2002,
2007; Pinna et al., 2006), injectable transponders (Fonseca et al., 1994; Ribó et al., 1994;
Caja et al., 1999b), and leg tags (Abecia and Torras, 2009).
To our knowledge, only 2 references in the literature show values regarding the
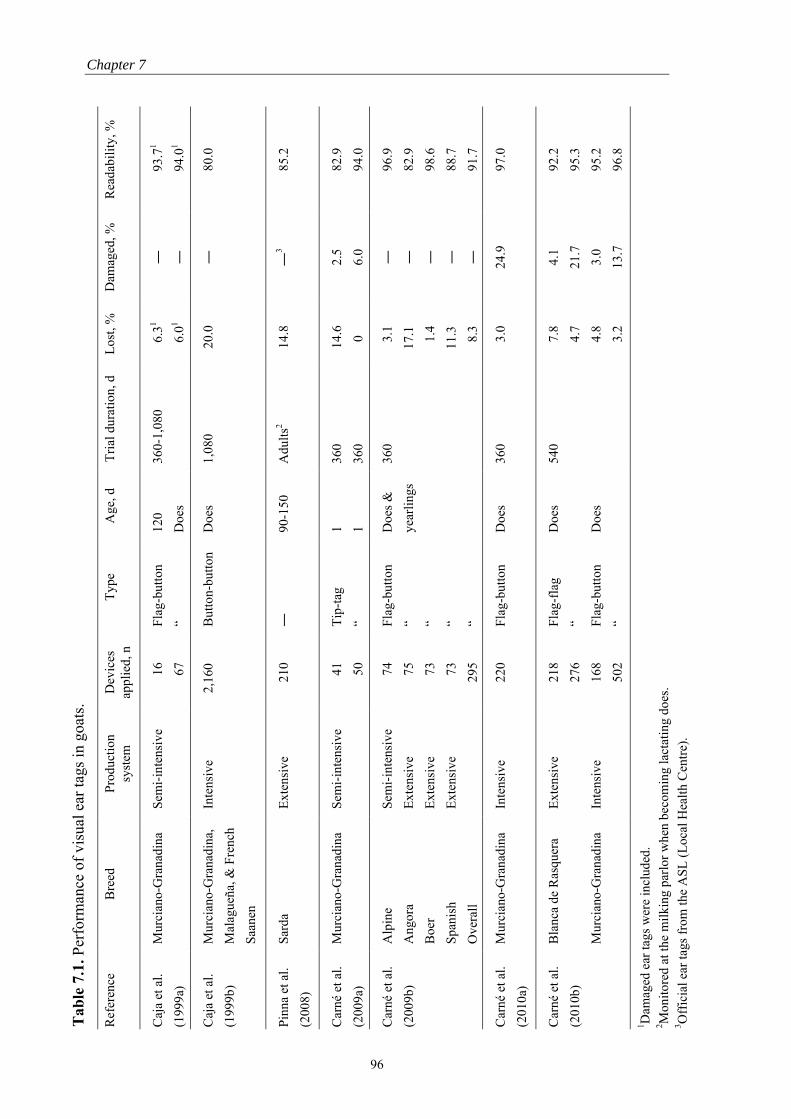
performance of visual ear tags in goats (Caja et al., 1999a,b). According to these studies,
and using ear tags for official ID, readability rates ranging from 80 to 94% were observed
in Murciano-Granadina dairy goats. Although poor performance has also been reported in
sheep, cattle, and swine (Caja et al., 1999a; Conill et al., 2000; Schembri et al. 2007),
further evaluation of their performance in goats was warranted.
8
Chapter 1
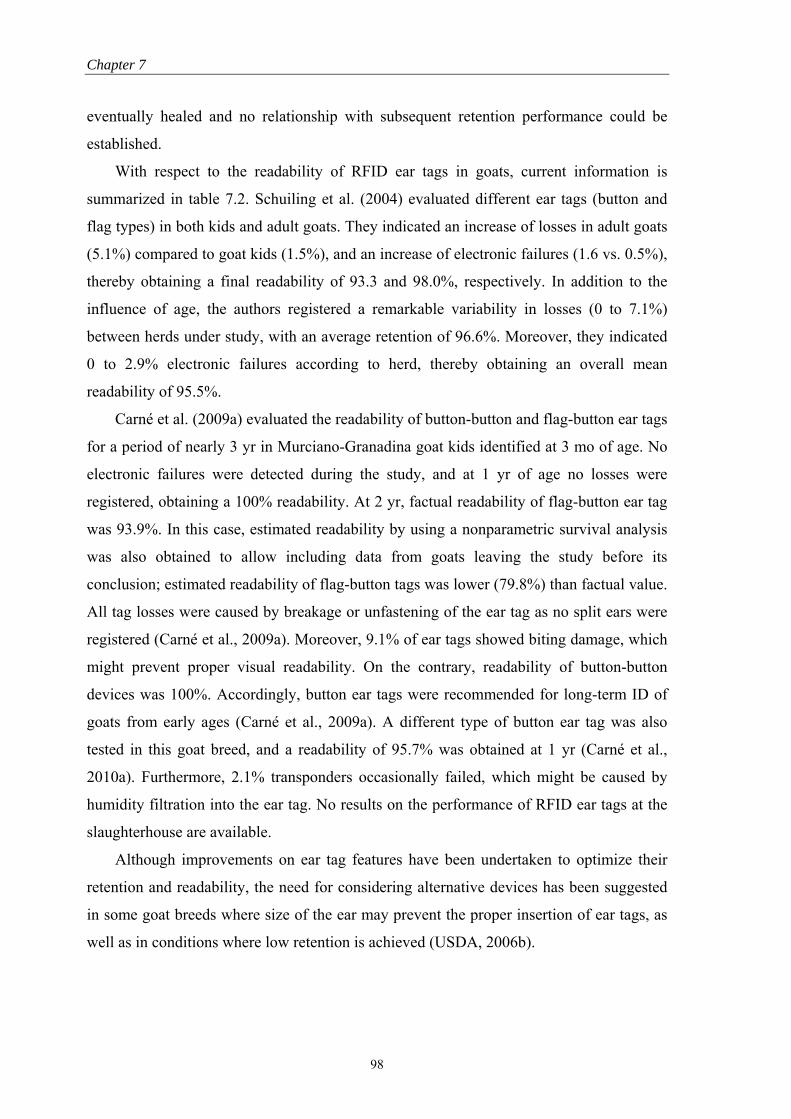
With respect to electronic ear tags, Schuiling et al. (2004) tested different tag types in
goats, obtaining readabilities ranging from 93.3 to 98.0% and greatly varying between tag
types and between herds under study; ear tag losses varied between adult goats and kids
(5.1% vs. 1.5%), and so did the electronic failures (1.6% vs. 0.5%). Moreover, a high
incidence of ear damage (8.5%) was still apparent at 4 mo after tagging, as well as wounds
caused by the tag pressing inflamed ears (6.3%). According to results, authors concluded
that improvements on ear tags features were still required before their use in practice could
be recommended.
Injectable transponders were firstly tested in goats within the frame of the FEOGA
European project (Caja et al., 1994), where readability of 32-mm transponders injected in
different body sites (armpit, ear base, tail base, and groin) was evaluated in short- to
medium-term experiments. Readability rates obtained ranged from 89.1 to 100% (Fonseca
et al., 1994a), with most unreadable transponders being lost. Moreover, remarkable
variations in subcutaneous migration was also reported, with the lower (26 mm) and
greater (47 mm) values observed in the tail and armpit, respectively (Ribó et al., 1994a).
According to results, the armpit was the body site recommended for injection in goats
(Fonseca et al., 1994; Ribó et al., 1994a).
Results were confirmed in a long-term study (3-yr), where 2,160 Murciano-Granadina
goats were injected in the armpit to automate milk recordings by using hand-held readers
(Caja et al., 1999b); a readability of 98% was registered at the end of the project. On the
other hand, although no references were found in goats, the retrieval of injects at slaughter
in other livestock species has been shown to be undoubtedly deficient (Lambooij et al.,
1999; Conill et al., 2002; Caja et al., 2005a). This is a major shortcoming, as it constitutes
a public health issue.
In the case of rumen boluses, a relatively large amount of data was already available
when starting this thesis, as initial experiments had been carried out in the framework of
the FEOGA (Ribó et al., 1994) and IDEA (JRC, 2003) European projects on the on-field
implementation of livestock RFID. In the FEOGA project, a lower retention of rumen
boluses in goats than in sheep was suggested for the first time.
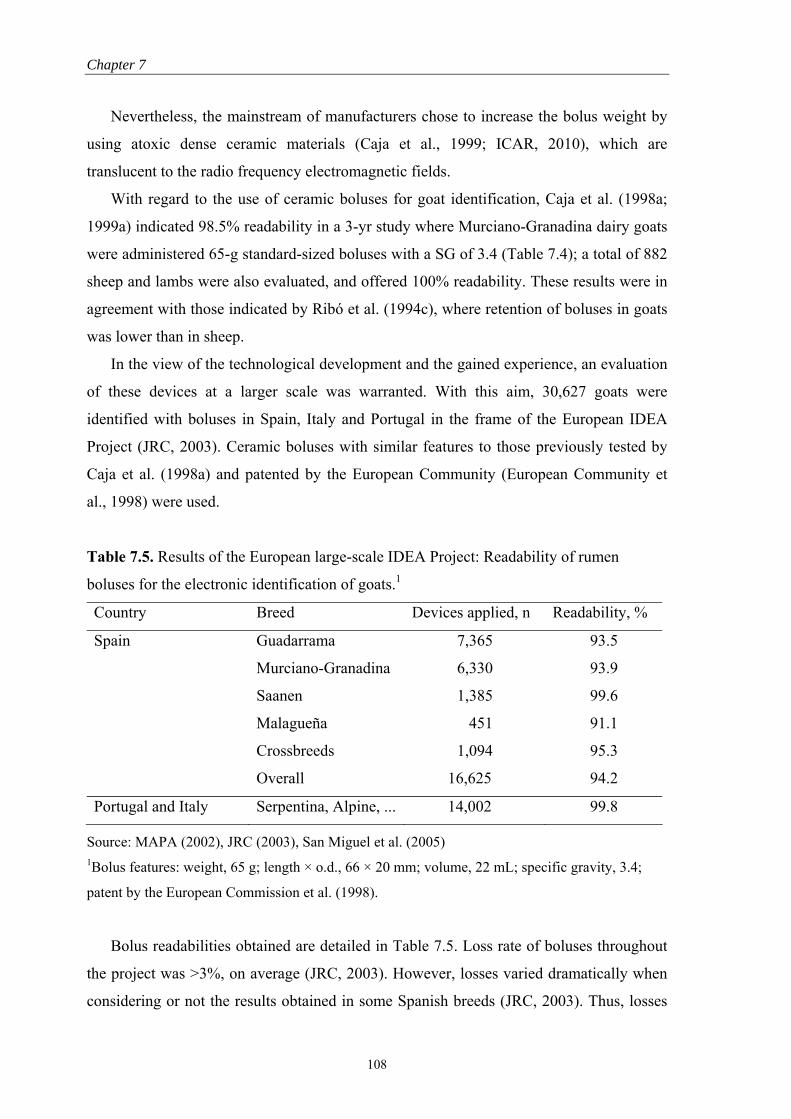
Subsequently, more than 30,600 goats were identified in the IDEA Project (JRC,
2003), with approximately 45% of them being located in Spain. Results confirmed the
poorer retention in goats (<97%) with respect to sheep (>99.7%). Deficient bolus retention
in goats was explained by average retention obtained in Spain (94.2%), as retention rates
>99.6% were reported in other breeds in Italy and Portugal (JRC, 2003; Pinna et al.,
9
Introduction
2006). Subsequent studies in several Spanish autochthonous breeds showed a remarkable
variability in the retention of boluses between breeds and even herds (89.7 to 100%;
MAPA, 2002; San Miguel et al., 2005; Capote et al., 2005). Moreover, in many occasions
the retention rate did not reach the 98% value recommended by the International
Committee for Animal Recording (ICAR, 2007).
In addition to ear tags, injects, and rumen boluses, the use of leg bands placed on the
pastern of the hind-leg is frequently used for the nonofficial ID of dairy goats in the
milking parlor (Balvay, 2007). To our knowledge, only one study has been carried out so
far to evaluate the long-term performance of visual and electronic leg tags for dairy goat
ID. In this study, the retention of electronic leg tags at >6 mo after tagging ranged from 88
to 99%, and electronic failures ranged from 1.6 to 4.5%, depending on the model (Balvay,
2009). A visual leg band was also tested for goat ID at early ages, and a 99% retention rate
was observed, although visual readability was 90% (Balvay, 2009). Abecia and Torras
(2009) studied the suitable minimum age and body weight of Murciano-Granadina dairy
goats for the permanent and tamper-free ID with electronic leg tags. The authors
concluded that goat kids could be appropriately identified before 6 mo of age, as the shank
circumference at 5 mo had already reached the 86.7% of the circumference in adult does.
1.6. European legislation on goat identification
1.6.1. Background
In order to successfully implement a system for the identification and registration
(ID&R) of livestock, four main objectives or stages shall be covered:
1) Registration of premises where animals are held.
2) Permanent individual animal ID at early ages and in any case before leaving the
holding of origin.
3) Registration of animal movements from one holding to another or to a
slaughterhouse.
4) Computerized networked databases for quick and easy access and management of
available data.
The ID&R systems that are being currently tackled in different countries round the
world are already based on these goals. The order of objectives showed above can be
10
Chapter 1
considered as the most appropriate for a reasonable deployment of the whole system, but
the system can not be fully operative until all the stages are wholly implemented.
In the case of the EU, the scope of current legislation is based on compulsory
statements. This particularity of the European framework contrasts with other cases, like
the National Animal Identification System (NAIS) in the United States, whose
implementation is voluntary.
European Council Directive 92/102/EEC of 27 November 1992 was the first
regulation purposely aimed at establishing an animal ID&R system on a European basis,
and was focused on bovine, ovine, caprine and porcine livestock. This directive intended
to give a response to the need for a reliable animal ID, a suitable recording of animal
movements, as well as the registration of all premises where these animals were raised.
With regard to the means of identification, visual plastic ear tags were the devices chosen
to be used. In the case of goats and sheep, at least one ear tag should be applied, and only
allotting ID was required.
The bovine spongiform encephalopathy (BSE) crisis, which caused a profound impact
in the market on beef and beef products, showed the need for further improvement of the
measures stated in Directive 92/102/EEC. In the case of sheep and goats, particularly the
foot-and-mouth disease crisis and the possible relationship or confusion between scrapie
and BSE also showed the need for more stringent rules to achieve a really efficient ID&R
system.
1.6.2. Current legislation
Council Directive 92/102/EEC of 1992 was replaced in 2004 by Regulation EC
21/2004, establishing a system for the identification and registration of sheep and goats.
This regulation has subsequently been amended by regulations EC 933/2008 and EC
759/2009. Regulation EC 21/2004 was officially deployable since its publication, although
its mandatory implementation has been postponed and only sheep and goats born after
2009 are to be identified (EC 1560/2007). Each goat shall be identified with 1 visual and 1
RFID device. However, there is no such obligation for European Member States in which
the total number of ovine and caprine animals is 600,000 or less, as well as for Member
States with up to 160,000 caprine animals.
11
Introduction
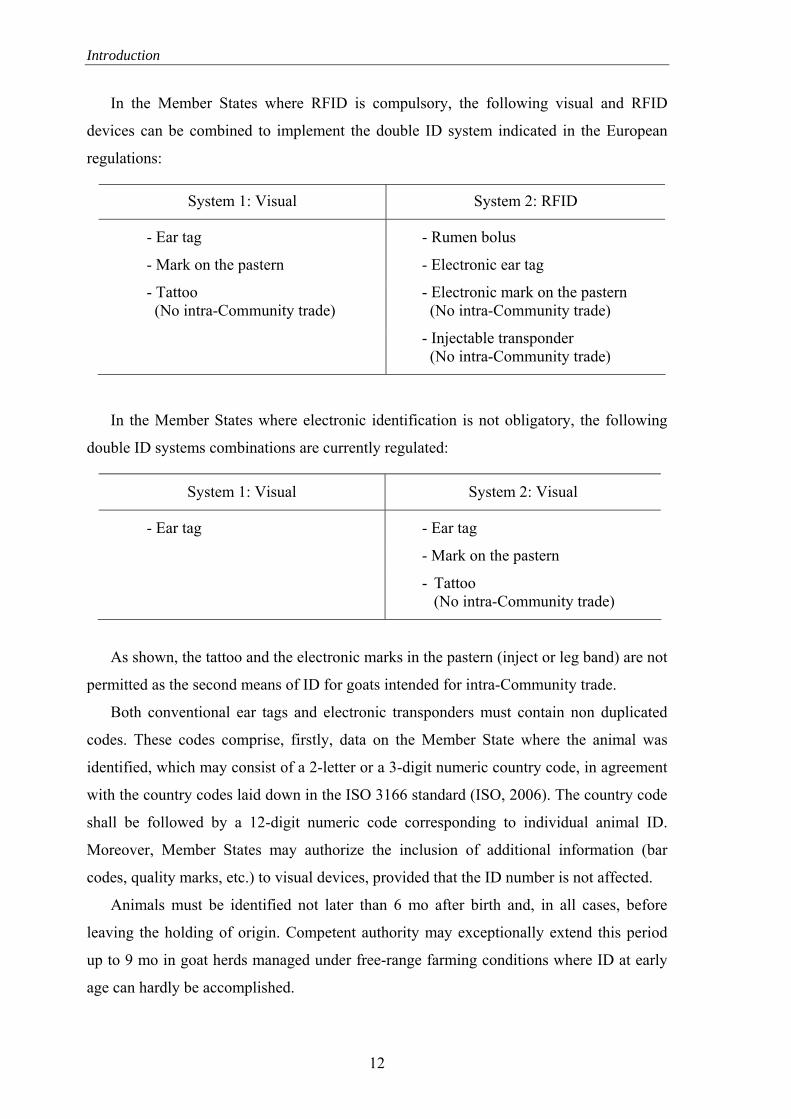
In the Member States where RFID is compulsory, the following visual and RFID
devices can be combined to implement the double ID system indicated in the European
regulations:
System 1: Visual System 2: RFID
- Ear tag - Rumen bolus
- Mark on the pastern - Electronic ear tag
- Tattoo (No intra-Community trade)
- Electronic mark on the pastern (No intra-Community trade)
- Injectable transponder (No intra-Community trade)
In the Member States where electronic identification is not obligatory, the following
double ID systems combinations are currently regulated:
System 1: Visual System 2: Visual
- Ear tag - Ear tag
- Mark on the pastern
- Tattoo (No intra-Community trade)
As shown, the tattoo and the electronic marks in the pastern (inject or leg band) are not
permitted as the second means of ID for goats intended for intra-Community trade.
Both conventional ear tags and electronic transponders must contain non duplicated
codes. These codes comprise, firstly, data on the Member State where the animal was
identified, which may consist of a 2-letter or a 3-digit numeric country code, in agreement
with the country codes laid down in the ISO 3166 standard (ISO, 2006). The country code
shall be followed by a 12-digit numeric code corresponding to individual animal ID.
Moreover, Member States may authorize the inclusion of additional information (bar
codes, quality marks, etc.) to visual devices, provided that the ID number is not affected.
Animals must be identified not later than 6 mo after birth and, in all cases, before
leaving the holding of origin. Competent authority may exceptionally extend this period
up to 9 mo in goat herds managed under free-range farming conditions where ID at early
age can hardly be accomplished.
12
Chapter 1
13
Additionally, competent authority may authorize that animals intended for slaughter
before 12 mo of age within a Member State, are identified with an ear tag bearing the
country code and the code identifying the holding of birth. In that event, only lot or batch
traceability of animals and their products is achievable.
Goats imported from third countries must be reidentified by the Member State of
reception pursuant to current European regulations. In this case, the link between prior and
new ID number will be registered. Only the animals whose first destiny in the EU is a
slaughterhouse are exempt from being reidentified. Where a means of ID becomes
illegible or gets lost, a replacement device with the same ID number must be applied as
soon as possible; the ID number must also inform of the times a device has been replaced
(retagging counter).
In response to current European regulations, Spanish legislation has been modified by
introducing the Real Decreto 947/2004. According to the Spanish regulations, mandatory
ID of goats is in place since 2006. In this regard, electronic rumen boluses were initially
chosen by the Spanish competent authority as the electronic devices to be used.
Nevertheless, as already mentioned, long-term retention rates of rumen boluses in some
Spanish goat breeds do not reach the 98% value required by the ICAR (2007). For this
reason, Spanish legislation also regards the alternative use, under approval of the
competent authority, of button electronic ear tags and electronic marks (injects or leg
bands) on the pastern of the hind-leg (Real Decreto 1486/2009). In the Spanish
framework, animals aimed at intra-Community trade or exportation can be identified,
exceptionally and under authorization, by a double visual ear tag.
In summary, permanent and tamper-proof ID of goats with devices that are safely
recovered at slaughter remains an unsolved issue, especially when contrasting the
inconsistent performance of rumen boluses with respect to sheep. Moreover, little
information on the feasibility of the different systems currently available for visual and
electronic goat ID is available if compared to other species. This is of major relevance
considering the important changes which are being undertaken in recent years in the
framework of European legislation on sheep and goat ID. This has been, therefore, the
motivation for carrying out the present thesis.
CHAPTER 2
Objectives
Objectives
CHAPTER 2
OBJECTIVES
The main objective of this thesis was to evaluate the suitability of different visual and
RFID devices to optimize the permanent identification of goats while complying with the
statements laid down in the current European regulations (EC 21/2004; EC 933/2008) on
sheep and goat identification and registration.
The following specific objectives were developed:
1. Identification of dairy goats under intensive management conditions:
Study of small- and standard-sized boluses, injectable transponders in the fore-leg, and
visual and RFID ear tags applied at early ages.
Easiness of application.
Effect of extending the rearing period on the losses of mini-boluses.
Comparison of the long-term retention and readability.
2. Identification of goats under semi-extensive management conditions:
Evaluation of small- and standard-sized boluses, and visual ear tags.
Easiness of application.
Effect of feeding management on early losses of rumen boluses.
Comparison of the long-term retention and readability according to device type
and goat breed.
3. Leg tags for the identification of dairy goats in the milking parlor:
Use of leg tags as an alternative to previous visual and RFID devices, in agreement
with late modifications of European regulations (EC 933/2008).
Easiness and suitability of application in replacement and adult goats.
Long-term retention and readability.
Static reading efficiency in the milking parlor by using hand-held readers.
Dynamic reading efficiency by testing a frame antenna located in different
positions in a runway, and under collision challenging conditions.
15
Chapter 2
16
4. Modeling the retention of rumen boluses in goats:
Regression model of the retention of rumen boluses according to their physical
features.
Assessment of bolus features to design bolus prototypes with optimum retention
rate (>99%) irrespective of goat breed and production system.
This thesis was partially developed in the frame of the research project ‘Use of
electronic identification by passive transponders for registration and traceability of sheep
and goats’ (‘Aplicación de la identificación electrónica mediante transpondedores pasivos
para el registro y trazabilidad de ovinos y caprinos’; Plan Nacional I+D+i; Project AGL-
2007-64541), funded by the Spanish Ministry of Education.
CHAPTER 3
Experiment 1: Visual and electronic identification of
dairy goats at early ages
Visual and electronic identification in dairy goats
CHAPTER 3
Experiment 1: Long-term performance of visual and electronic identification devices
in dairy goats
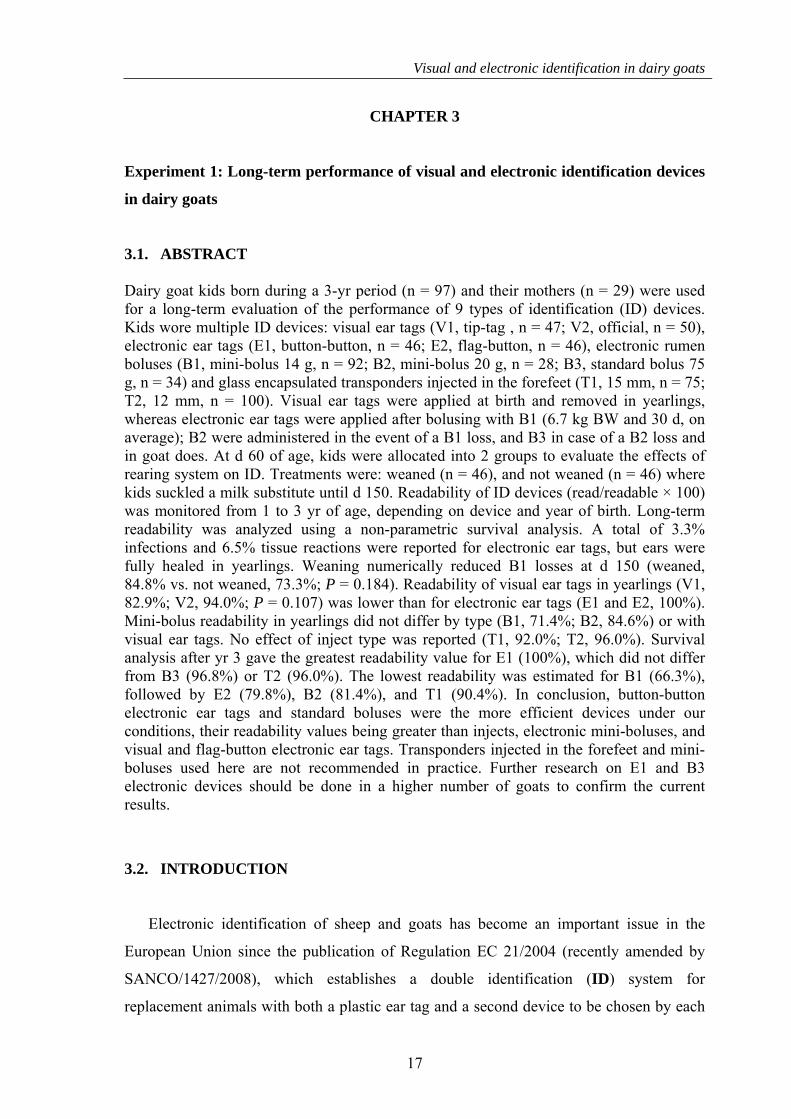
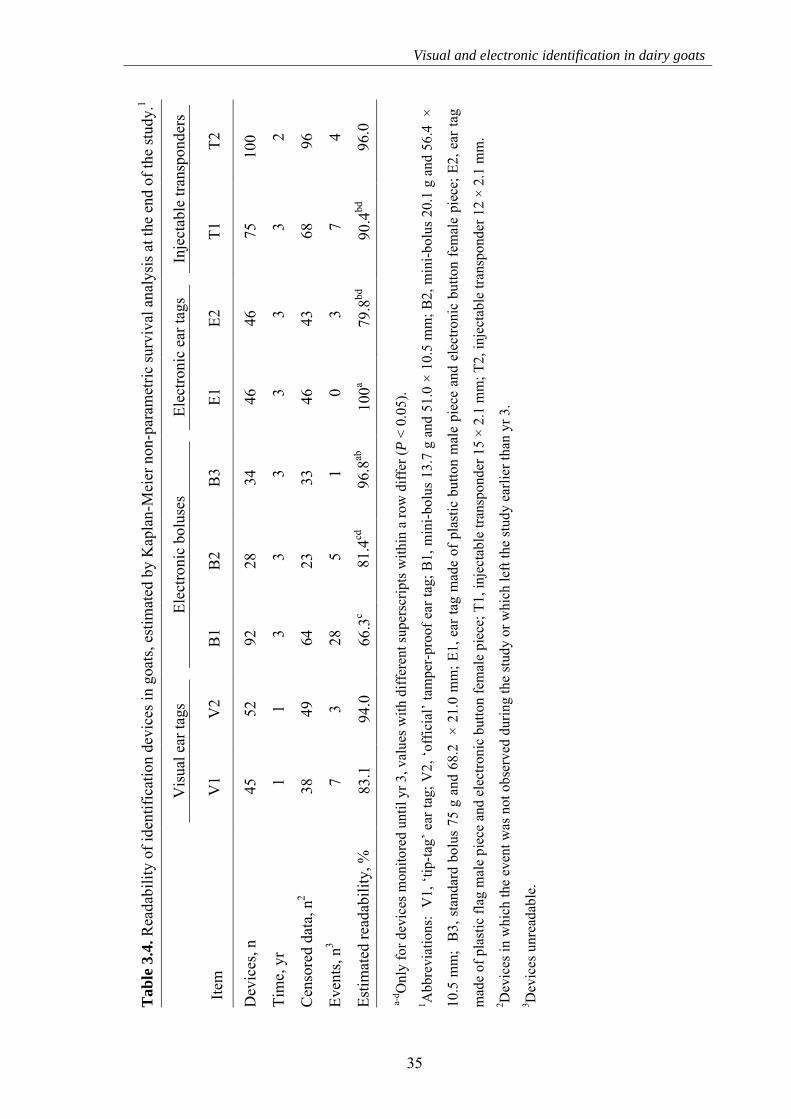
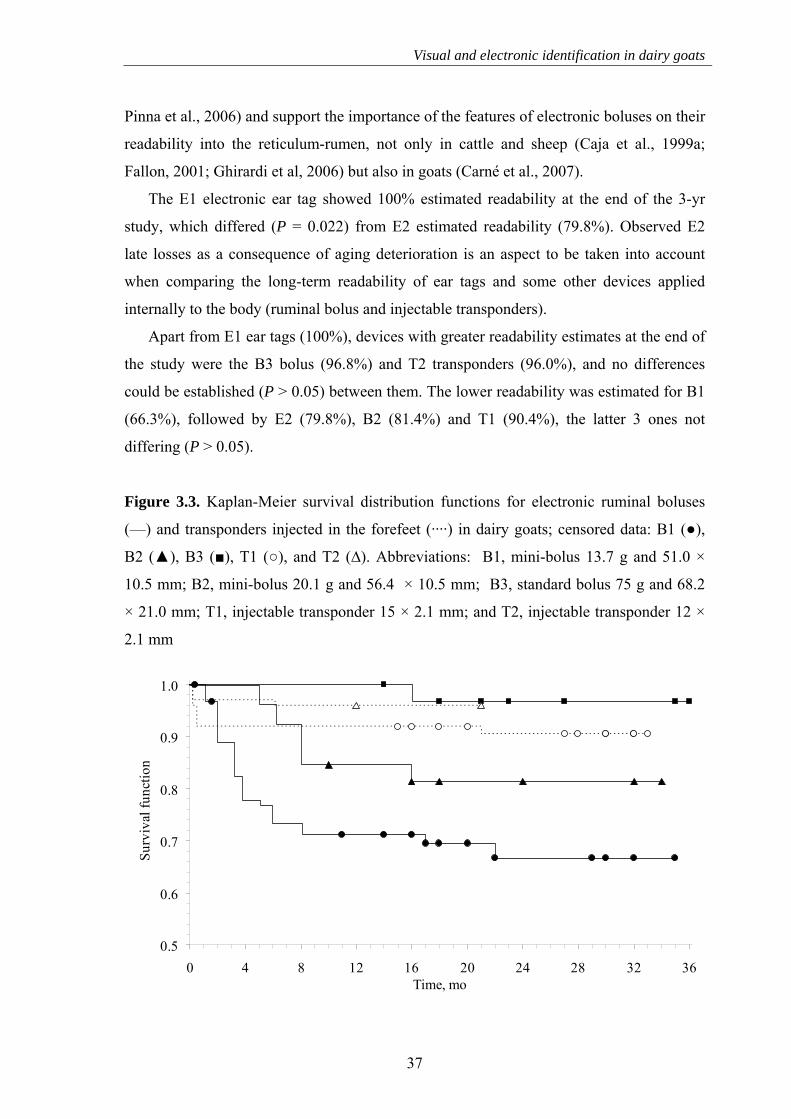
3.1. ABSTRACT Dairy goat kids born during a 3-yr period (n = 97) and their mothers (n = 29) were used for a long-term evaluation of the performance of 9 types of identification (ID) devices. Kids wore multiple ID devices: visual ear tags (V1, tip-tag , n = 47; V2, official, n = 50), electronic ear tags (E1, button-button, n = 46; E2, flag-button, n = 46), electronic rumen boluses (B1, mini-bolus 14 g, n = 92; B2, mini-bolus 20 g, n = 28; B3, standard bolus 75 g, n = 34) and glass encapsulated transponders injected in the forefeet (T1, 15 mm, n = 75; T2, 12 mm, n = 100). Visual ear tags were applied at birth and removed in yearlings, whereas electronic ear tags were applied after bolusing with B1 (6.7 kg BW and 30 d, on average); B2 were administered in the event of a B1 loss, and B3 in case of a B2 loss and in goat does. At d 60 of age, kids were allocated into 2 groups to evaluate the effects of rearing system on ID. Treatments were: weaned (n = 46), and not weaned (n = 46) where kids suckled a milk substitute until d 150. Readability of ID devices (read/readable × 100) was monitored from 1 to 3 yr of age, depending on device and year of birth. Long-term readability was analyzed using a non-parametric survival analysis. A total of 3.3% infections and 6.5% tissue reactions were reported for electronic ear tags, but ears were fully healed in yearlings. Weaning numerically reduced B1 losses at d 150 (weaned, 84.8% vs. not weaned, 73.3%; P = 0.184). Readability of visual ear tags in yearlings (V1, 82.9%; V2, 94.0%; P = 0.107) was lower than for electronic ear tags (E1 and E2, 100%). Mini-bolus readability in yearlings did not differ by type (B1, 71.4%; B2, 84.6%) or with visual ear tags. No effect of inject type was reported (T1, 92.0%; T2, 96.0%). Survival analysis after yr 3 gave the greatest readability value for E1 (100%), which did not differ from B3 (96.8%) or T2 (96.0%). The lowest readability was estimated for B1 (66.3%), followed by E2 (79.8%), B2 (81.4%), and T1 (90.4%). In conclusion, button-button electronic ear tags and standard boluses were the more efficient devices under our conditions, their readability values being greater than injects, electronic mini-boluses, and visual and flag-button electronic ear tags. Transponders injected in the forefeet and mini-boluses used here are not recommended in practice. Further research on E1 and B3 electronic devices should be done in a higher number of goats to confirm the current results.
3.2. INTRODUCTION
Electronic identification of sheep and goats has become an important issue in the
European Union since the publication of Regulation EC 21/2004 (recently amended by
SANCO/1427/2008), which establishes a double identification (ID) system for
replacement animals with both a plastic ear tag and a second device to be chosen by each
17
Chapter 3
Member State. When the sheep and goat population within a Member State is greater than
600,000 animals, the second means of ID must be a passive radio-frequency device.
Double ID was expected to be mandatory in 2008 but has been put off until 2010,
although it has been officially deployable since July 2005. In Spain, the electronic bolus
has been used as the second means of ID since January 2006 (Real Decreto 947/2005).
Optimum retention of boluses in sheep and cattle has been achieved by optimizing
their physical features (Caja et al., 1999a; Fallon, 2001; Ghirardi et al., 2006). However,
bolus retention in the case of goats has shown remarkable variability in practice, ranging
from 89.7 to 99.6% (JRC, 2003; Capote et al., 2005; Pinna et al., 2006). That is why
current Spanish legislation (Real Decreto 947/2005) permits the use (under authorization)
of transponders injected in the metacarpus (forefoot) in goats. Although injection to this
body site may prevent carcass contamination, animals can not be used for consumption.
Little information is available on the comparison of injectable transponders, electronic ear
tags and boluses in goats. In contrast to goats, over 99% retention has been achieved in
lambs by using small size boluses (Garín et al., 2005; Ghirardi et al., 2007). No
information is available on the use of electronic ID devices in replacement goat kids.
The aim of this study was to investigate the long-term performance of visual and
electronic ID devices applied in kids and dairy goats, as well as to evaluate the influence
of rearing management conditions on the variability of the retention rate of small size
electronic boluses.
3.3. MATERIALS AND METHODS
The experimental procedures and animal care conditions were approved by the Ethical
Committee on Animal and Human Experimentation (Reference CEEAH 606/06) of the
Universitat Autònoma de Barcelona.
A total of 29 goat does and 97 goat kids of Murciano-Granadina dairy breed from the
Experimental Farm of the S1GCE (Servei de Granges i Camps Experimentals),
Universitat Autònoma de Barcelona, were used. Goat does were bred for an annual
kidding season in the autumn and kidded during fall of 2004 (n = 27), 2005 (n = 18) and
2006 (n = 18), giving birth to 45, 26 and 26 kids, respectively. Kids were under study for
3, 2 and 1 yr depending on the year of birth.
18
Visual and electronic identification in dairy goats
3.3.1. Visual identification
Each kid was identified at birth with 1 visual ear tag applied on the left ear. Two types
of rectangular visual ear tags made of plastic (Figure 3.1) from the same manufacturer
(Azasa-Allflex, Madrid, Spain) were used; ear tags features (weight, flag dimensions and
pin dimensions) were: V1 “tip-tag” ear tag (1.4 g, 35.5 × 9.3 mm, 15.5 ×3.9 mm; opened
female piece; n = 47) commonly used by the farmers for their low cost; and, V2 “official”
tamperproof ear tag (2.8 g, 40 × 14.5 mm, 22 × 5 mm; closed female piece; n = 50) made
to fulfill the new requirements of the European Union Regulation EC 21/2004. Both V1
and V2 ear tags were considered as temporary ID and were removed at 12 mo of age when
yearling kids joined the breeding herd. All ear tags had printed both a serial animal
number (7 digits), and the holding number (14 digits) as required by Regulation EC
21/2004.
Goat does wore 2 flag plastic ear tags of large size (48 × 38 mm, yellow color; Azasa-
Allflex) in the left ear. These large ear tags were manually marked with individual codes
of 3 digits (27 × 10 mm each) with black plastic ink (Allflex Tag Pen, Dallas, TX) and
were used for milk recording (Ait-Saidi et al., 2008).
3.3.2. Rearing treatments and management
Kids were separated from their mothers in the first 8 h after birth, moved to straw
bedded pens (0.5 m2/kid) and fed colostrum 3 times a day until d 3. Afterwards, kids were
of the locking system of these devices was measured by suspending a ballast and applying
progressive weights (0.1 kg) until achieving 40 kg.
3.3.5. Statistical analyses
Least squares means of age and BW at administration of devices were obtained with
the GLM procedure of SAS (v. 9.1, SAS Inst. Inc., Cary, NC). Factors considered were
type of ID device, year of birth and the interaction type of ID device × year of birth. Non-
significant (P > 0.20) effects were removed from the model. Data on physical features and
resistance of the locking system of electronic ear tags were analyzed with the GLM
procedure of SAS.
25
Chapter 3
Losses, electronic failures and readability of ID devices were analyzed with the
CATMOD procedure of SAS on the basis of the categorical nature of these variables. A
Logit model with an estimation method of maximum likelihood (Cox, 1970) was used,
evaluating the effects of type of ID device, year of birth, and the interaction type of ID
device × year of birth. For the B1 and B2 bolus, effect of rearing treatment (W vs. NW)
was also included. Significance was declared at P 0.05 and interactions that were not
significant (P > 0.20) were removed from the final models. Statistical analyses did not
allow for comparisons with ID devices with no registered losses (100% readability).
For the analysis of readability at the end of yr 3, the Kaplan-Meier non-parametric
survival analysis was considered preferable to the logit model to avoid the possible bias
produced by the low number of animals monitored. A log-rank test of equality across
strata (ID devices) was a performed with the LIFETEST procedure of SAS. This analysis
permitted to compare the longitudinal readability of ID devices throughout the entire
period of study without excluding right censored data (data from animals that left the
study before a device failed), according to Cantor (2003) and Kleinbaum and Klein
(2005), as well as the Kaplan-Meier estimates of readability for each type of device used.
Survival monitoring started at device administration and, as continuous goat monitoring
was not possible, time of device loss was registered as interval-censored data. In addition
to Kaplan-Meier’s readability estimates, survival curves for each ID device were also
produced.
3.4. RESULTS AND DISCUSSION
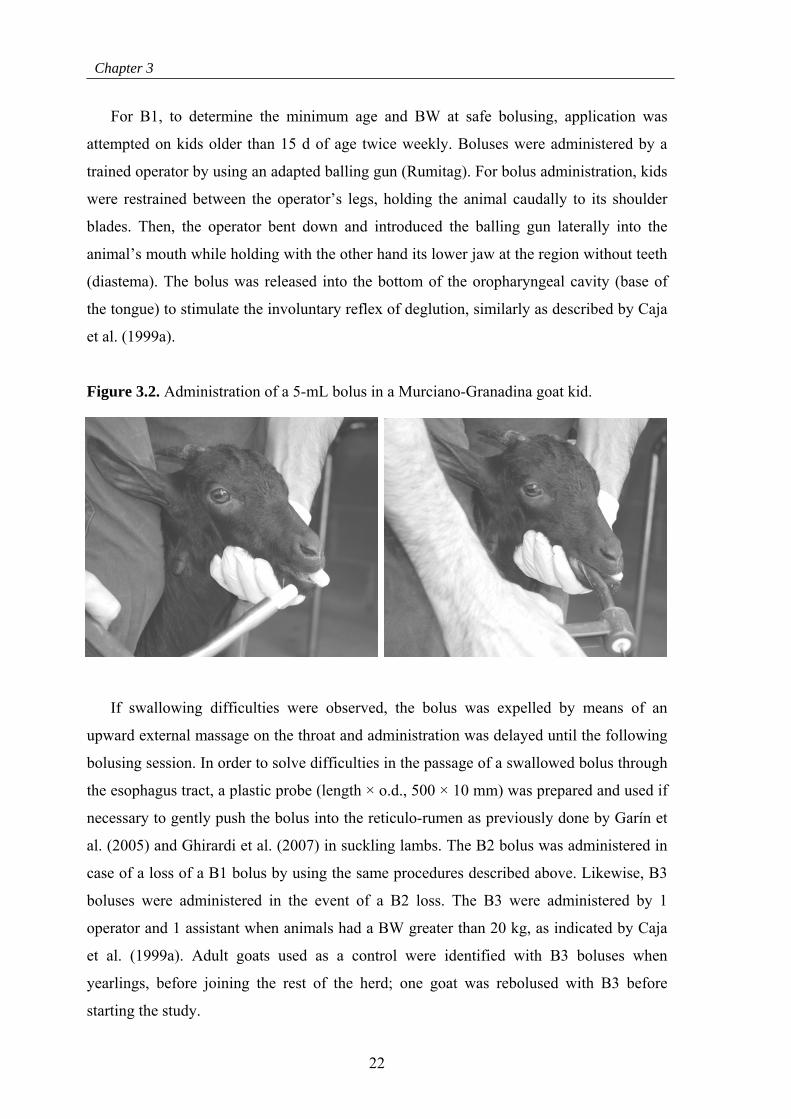
3.4.1. Administration of identification devices
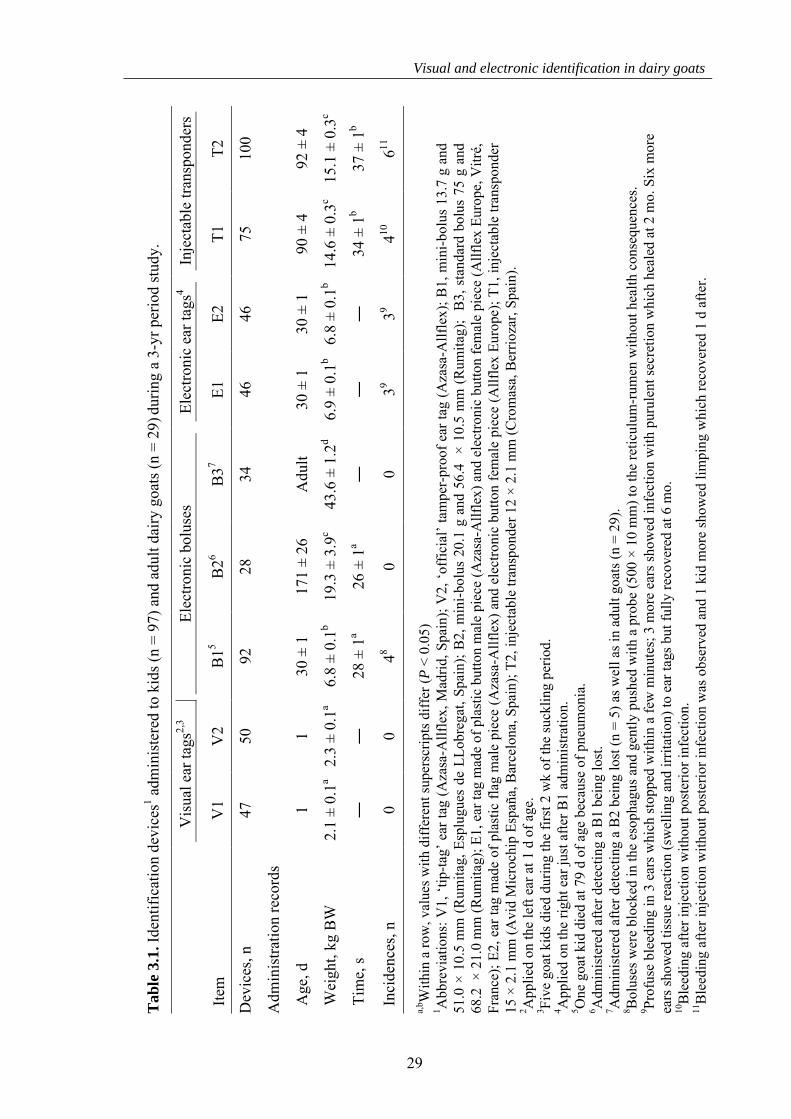
Total number of ID devices and administration records are shown in Table 3.1. Both
V1 and V2 visual ear tags were inserted in kids of 1 d of age without incidences. Five kids
(5.2%) died during the first 2 wk of suckling before being assigned to the extended rearing
treatments and 5 more kids (5.2%) died during yr 1 of the long-term study. Overall
yearling mortality was 10.3% which was lower than the average values reported under
similar management conditions (Daza, 2004; 15 to 20%). No relationship was established
between kid casualties and the ID system used despite the long term presence of boluses in
the forestomachs and of injects in the pastern. The data from kids that died (n = 5) before
26
Visual and electronic identification in dairy goats
being identified with e-ID devices were eliminated from the study and only 92 kids were
used.
3.4.1.1. Rumen boluses
Four cases (4.3%) of bolus blockage into the esophagus occurred during
administration of B1 in 1 mo of age suckling kids (Table 3.1). Within a few minutes of
bolusing these kids showed profuse foamy sialorrhea along with nasal discharge, dyspnea
and apathy. Similar findings have also been reported when studying the minimum age and
BW at mini-bolus administration in fattening lambs (Ghirardi et al., 2007). External
palpation and directional caudo-cranial readings with a handheld reader were carried out
to confirm the bolus blockage. The esophageal probe was used to gently push the bolus
into the reticulum-rumen as indicated by Garín et al. (2005) and Ghirardi et al. (2007).
Affected kids fully recovered and no further incidences or secondary effects were
reported. Safe bolus administration at early ages mainly depends on the anatomical
development of the pharynx and esophagus and on the dimensions (length and o.d.) of
boluses used. With regard to kid anatomical development, BW seems to be more accurate
than age in order to assess the threshold for the safe administration of boluses. The BW
and age at which B1 administration was possible were 6.8 kg and 30 d on average (Table
3.1). Using the same bolus type, Ghirardi et al. (2007) reported a BW at administration of
8.6 and 9.6 kg in lambs of local and dairy breeds, respectively. Using standard boluses of
66 × 20 mm (65 g), Caja et al. (1999a) recommended a BW greater than 20 and 25 kg for
goats and sheep, respectively. Our results confirmed that boluses can be administered at
earlier age and lower BW in goats than in sheep.
A total of 19 B1 were lost until 5 mo of age (readability 79.1%; Table 3.3) and were
replaced by B2 which were administered at 14.9 0.3 kg BW and 105 7 d on average.
No administration incidences were observed at this time. In addition, another 7 and 2 B1
were lost and replaced by B2 until yr 1 and 3 of the experiment, respectively, with a total
of 28 B2 boluses administered (Table 3.1 and 3.3). Time needed for bolus administration,
reading and recording of ID data into the reader did not differ between B1 and B2 boluses
(Table 3.1; P = 0.505) and was lower than that reported by Ghirardi et al. (2007) for mini-
bolus administration in lambs; however, these authors included restraining time in the
application time.
27
Chapter 3
After 1 yr of age, yearling kids having lost B2 (n = 4) were administered B3 and no
incidences were reported. Time for B3 administration was not recorded.
3.4.1.2. Electronic ear tags
Three cases (3.3%) of profuse bleeding that stopped within a few minutes were
observed after ear tag insertion. Whereas 90.2% of ears were completely healed at 2 mo
after tagging, 3 (3.3%) ears showed infection with purulent secretion and 6 (6.5%) more
ears showed a marked tissue reaction to the attached ear tags. Tissue reaction appeared as
perceptible swelling of the ear and noticeable irritation under the ear tag but without
bleeding or apparent signs of infection. Edwards et al. (2001) tested both plastic and metal
ear tags in sheep and only reported the presence of tissue reaction to the metal tags. In our
study, these findings remained apparent until 4 mo and then progressively decreased until
eventually disappearing at 6 mo post-application. Length of healing period did not affect
the size of the hole made at ear tagging, although some cases of increased ear thickness
and hair loss around the tagging hole were observed. Ear tag readability was not affected
by the healing process.
3.4.1.3. Injectable transponders
Size of injectable transponders was a relevant shortcoming for the injection in the rear
metacarpal area of kids. Experiments carried out so far in this body site have evaluated the
use of injectable transponders varying in length (12 to 15 mm) and o.d. (2.1 to 3 mm) in
lambs and in adult sheep and goats (Abecia et al., 2004; MAPA, 2007). In our study,
transponders of 15 × 3 mm were anticipated to be too large to be used in kids and only 2.1
mm o.d. were used. Age and BW at which T1 and T2 were injected are shown in Table
3.1. Four (5.3%) and 6 (6%) cases of bleeding after injection were observed for T1 and
T2, respectively. Only 1 case (1%) of limping was observed after injecting a T2
transponder which disappeared at the following day with no treatment. No inflammation
or signs of infection were observed and injection wounds totally healed within the
following 2 wk. Time required for injection, reading and animal data recording (Table 3.1)
did not differ between T1 and T2 (P = 0.122) and averaged 36 ± 1 s. Abecia et al. (2004)
reported values of injection time also ranging from 30 to 40 s in lambs and adult sheep,
including restraining time but without taking into account time for reading and storing ID
data.
28
Visual and electronic identification in dairy goats
29
T2
100
92 ±
4
15.1
± 0
.3c
37 ±
1b
611
Inje
ctab
le tr
ansp
onde
rs
T1 75
90 ±
4
14.6
± 0
.3c
34 ±
1b
410
E2 46
30 ±
1
6.8
± 0.
1b
―
39
Ele
ctro
nic
ear
tags
4
E1
46
30 ±
1
6.9
± 0.
1b
―
39
B37
34
Adu
lt
43.6
± 1
.2d
―
0
B26
28
171
± 26
19.3
± 3
.9c
26 ±
1a
0
Ele
ctro
nic
bolu
ses
B15
92
30 ±
1
6.8
± 0.
1b
28 ±
1a
48
V2
50 1
2.3
± 0.
1a
―
0
Vis
ual e
ar ta
gs2,
3
V1
47 1
2.1
± 0.
1a
―
0
Tab
le 3
.1. I
dent
ific
atio
n de
vice
s1 adm
inis
tere
d to
kid
s (n
= 9
7) a
nd a
dult
dai
ry g
oats
(n
= 2
9) du
ring
a 3
-yr
peri
od s
tudy
.
Item
Dev
ices
, n
Adm
inis
trat
ion
reco
rds
Age
, d
Wei
ght,
kg B
W
Tim
e, s
Inci
denc
es, n
a,b W
ithi
n a
row
, val
ues
wit
h di
ffer
ent s
uper
scri
pts
diff
er (
P <
0.0
5)
1 Abb
revi
atio
ns:
V1,
‘ti
p-ta
g’ e
ar t
ag (
Aza
sa-A
llfl
ex, M
adri
d, S
pain
); V
2, ‘
offi
cial
’ ta
mpe
r-pr
oof
ear
tag
(Aza
sa-A
llfl
ex);
B1,
min
i-bo
lus
13.7
g a
nd
51.0
× 1
0.5
mm
(R
umit
ag,
Esp
lugu
es d
e L
Lob
rega
t, S
pain
); B
2, m
ini-
bolu
s 20
.1 g
and
56.
4 ×
10.
5 m
m (
Rum
itag
);
B3,
sta
ndar
d bo
lus
75 g
and
68
.2 ×
21.
0 m
m (
Rum
itag
); E
1, e
ar ta
g m
ade
of p
last
ic b
utto
n m
ale
piec
e (A
zasa
-All
flex
) an
d el
ectr
onic
but
ton
fem
ale
piec
e (A
llfle
x E
urop
e, V
itré
, F
ranc
e); E
2, e
ar ta
g m
ade
of p
last
ic f
lag
mal
e pi
ece
(Aza
sa-A
llfl
ex)
and
elec
tron
ic b
utto
n fe
mal
e pi
ece
(All
flex
Eur
ope)
; T1,
inje
ctab
le tr
ansp
onde
r 15
× 2
.1 m
m (
Avi
d M
icro
chip
Esp
aña,
Bar
celo
na, S
pain
); T
2, in
ject
able
tran
spon
der
12 ×
2.1
mm
(C
rom
asa,
Ber
rioz
ar, S
pain
).
2 App
lied
on
the
left
ear
at 1
d o
f ag
e.
3 Fiv
e go
at k
ids
died
dur
ing
the
firs
t 2 w
k of
the
suck
ling
peri
od.
4 App
lied
on
the
righ
t ear
just
aft
er B
1 ad
min
istr
atio
n.
5 One
goa
t kid
die
d at
79
d of
age
bec
ause
of
pneu
mon
ia.
6 Adm
inis
tere
d af
ter
dete
ctin
g a
B1
bein
g lo
st.
7 Adm
inis
tere
d af
ter
dete
ctin
g a
B2
bein
g lo
st (
n =
5)
as w
ell a
s in
adu
lt g
oats
(n
= 2
9).
8 Bol
uses
wer
e bl
ocke
d in
the
esop
hagu
s an
d ge
ntly
pus
hed
wit
h a
prob
e (5
00 ×
10
mm
) to
the
reti
culu
m-r
umen
wit
hout
hea
lth
cons
eque
nces
. 9 P
rofu
se b
leed
ing
in 3
ear
s w
hich
sto
pped
wit
hin
a fe
w m
inut
es; 3
mor
e ea
rs s
how
ed in
fect
ion
wit
h pu
rule
nt s
ecre
tion
whi
ch h
eale
d at
2 m
o. S
ix m
ore
ea
rs s
how
ed ti
ssue
rea
ctio
n (s
wel
ling
and
irri
tati
on)
to e
ar ta
gs b
ut f
ully
rec
over
ed a
t 6 m
o.
10B
leed
ing
afte
r in
ject
ion
wit
hout
pos
teri
or in
fect
ion.
11
Ble
edin
g af
ter
inje
ctio
n w
itho
ut p
oste
rior
infe
ctio
n w
as o
bser
ved
and
1 ki
d m
ore
show
ed li
mpi
ng w
hich
rec
over
ed 1
d a
fter
.
Chapter 3
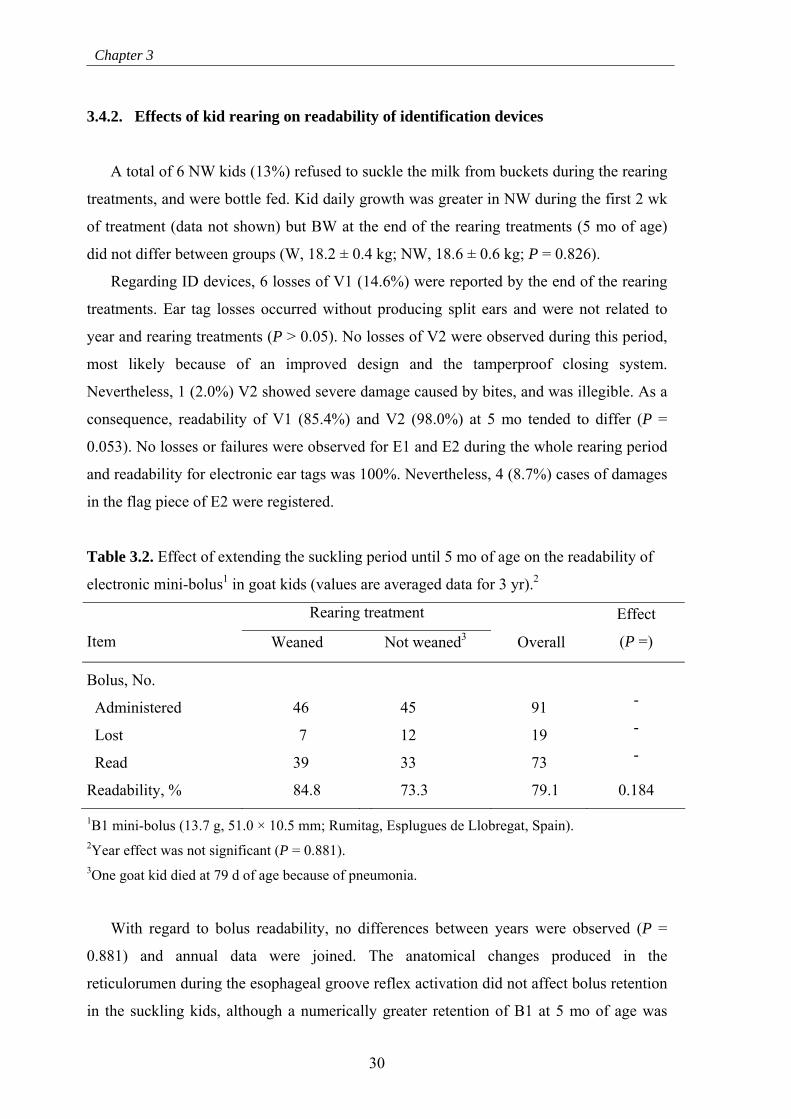
3.4.2. Effects of kid rearing on readability of identification devices
A total of 6 NW kids (13%) refused to suckle the milk from buckets during the rearing
treatments, and were bottle fed. Kid daily growth was greater in NW during the first 2 wk
of treatment (data not shown) but BW at the end of the rearing treatments (5 mo of age)
did not differ between groups (W, 18.2 ± 0.4 kg; NW, 18.6 ± 0.6 kg; P = 0.826).
Regarding ID devices, 6 losses of V1 (14.6%) were reported by the end of the rearing
treatments. Ear tag losses occurred without producing split ears and were not related to
year and rearing treatments (P > 0.05). No losses of V2 were observed during this period,
most likely because of an improved design and the tamperproof closing system.
Nevertheless, 1 (2.0%) V2 showed severe damage caused by bites, and was illegible. As a
consequence, readability of V1 (85.4%) and V2 (98.0%) at 5 mo tended to differ (P =
0.053). No losses or failures were observed for E1 and E2 during the whole rearing period
and readability for electronic ear tags was 100%. Nevertheless, 4 (8.7%) cases of damages
in the flag piece of E2 were registered.
Table 3.2. Effect of extending the suckling period until 5 mo of age on the readability of
electronic mini-bolus1 in goat kids (values are averaged data for 3 yr).2
Rearing treatment
Item
Weaned Not weaned3 Overall
Effect
(P =)
Bolus, No.
Administered
Lost
Read
Readability, %
46
7
39
84.8
45
12
33
73.3
91
19
73
79.1
-
-
-
0.184
1B1 mini-bolus (13.7 g, 51.0 × 10.5 mm; Rumitag, Esplugues de Llobregat, Spain). 2Year effect was not significant (P = 0.881). 3One goat kid died at 79 d of age because of pneumonia.
With regard to bolus readability, no differences between years were observed (P =
0.881) and annual data were joined. The anatomical changes produced in the
reticulorumen during the esophageal groove reflex activation did not affect bolus retention
in the suckling kids, although a numerically greater retention of B1 at 5 mo of age was
30
Visual and electronic identification in dairy goats
observed in W vs. NW kids (Table 3.2). Ghirardi et al. (2007) reported 99.4% retention of
B1 boluses in weaned and fattened lambs. Although no losses could be observed in situ in
our study, bolus losses by regurgitation have been already observed in calves being fed
milk from buckets (J. J. Ghirardi, unpublished data).
Regurgitation is recognized to be the main mechanism of bolus losses (Riner et al.,
1982; Caja et al., 1999a; Garín et al., 2005), although intestinal passage after going
through the critical barrier of the reticulo-omasal orifice can not be discarded, especially
when dealing with mini-boluses (Garín et al., 2005; Ghirardi et al., 2007). Studies on
slaughtered animals indicate that, at the same BW (24 kg), diameter of the reticulo-omasal
orifice is approximately twice greater in kids (Martín et al., 2004; 24.0 mm) than in lambs
(Ghirardi et al., 2007; 14.2 mm) and than the outer diameter of the B1 mini-boluses used
(10 mm o.d.). Losses by intestinal passage could be exacerbated in goats if less selective
passage through the reticulo-omasal orifice occurs (Katoh et al., 1988; Clauss and
Lechner-Doll, 2001). Regarding feeding management, an abrupt diet change may also
increase bolus losses (AMLC, 1995; Ghirardi et al., 2007). Garín et al. (2005) found no
effect on losses of small size boluses when applied in lambs 1 wk before and after
weaning. In our results, no effect on bolus retention could be established with the 2
weaning systems used (60 and 150 d of age) and after the kids started grazing (4 mo of
age).
Losses of B1 bolus started at 2 mo of age (1 mo after administration) whereas the first
loss of B2 was registered at 7 mo of age (5 mo after administration) which agrees with
their features, the B1 being smaller and lighter than B2.
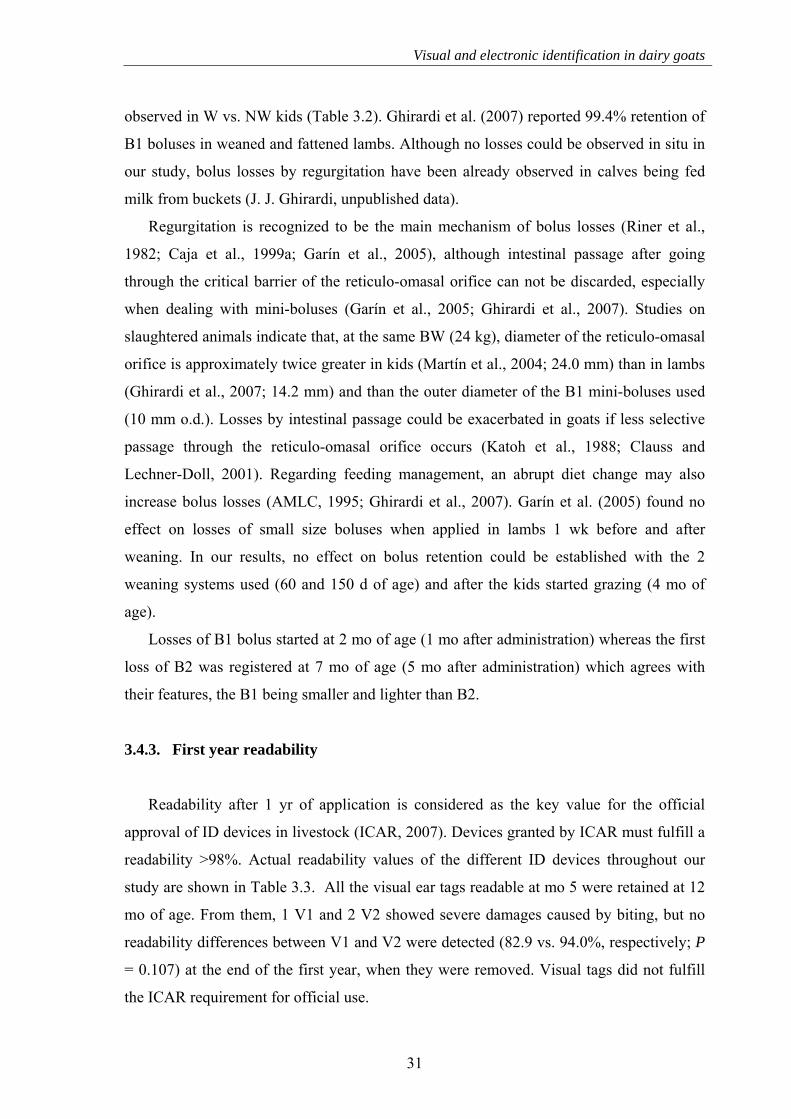
3.4.3. First year readability
Readability after 1 yr of application is considered as the key value for the official
approval of ID devices in livestock (ICAR, 2007). Devices granted by ICAR must fulfill a
readability >98%. Actual readability values of the different ID devices throughout our
study are shown in Table 3.3. All the visual ear tags readable at mo 5 were retained at 12
mo of age. From them, 1 V1 and 2 V2 showed severe damages caused by biting, but no
readability differences between V1 and V2 were detected (82.9 vs. 94.0%, respectively; P
= 0.107) at the end of the first year, when they were removed. Visual tags did not fulfill
the ICAR requirement for official use.
31
Chapter 3
Losses of B1 and B2 mainly occurred during the first year, resulting in a readability
numerically greater in B2 than B1 (84.6% vs. 71.4%, respectively; P = 0.182), which was
unsatisfactory for official use according to ICAR requirements; no more administrations
of B1 and B2 were performed after being lost. By contrast, standard-sized B3 bolus used
as control device in adult goats were fully readable (100%) at the end of yr 1 and are
suitable for official use.
No electronic failures or losses were observed for electronic ear tags during the first
year of the study, showing 100% readability and fulfilling the ICAR requirements.
With regard to transponders injected in the distal area of the forefeet, no difference in
readability during the first year was detected between T1 and T2 (92.0 vs. 96.0%; P =
0.268), but their values were under the 98% required for ICAR approval. No breakages or
electronic failures were registered at the end of the first year. Most losses of T1 and T2
(90.9%) occurred during the first 2 wk after injection, similarly to results indicated in
lambs identified in the same body site with 12-mm transponders (Abecia et al., 2004).
These early losses were mainly due to the backward movement of transponders through
the channel of injection before the injection wound was totally healed, as observed in
other species (Conill et al., 2000; Caja et al., 2005a). Furthermore, 98.4% of T1 and 100%
of T2 losses were registered before 6 mo of injection.
3.4.4. Long-term readability of identification devices
Actual readability values of the different ID devices after the first year are shown in
Table 3.3. Bolus losses decreased after the first year and steadied during yr 2 and 3. No
difference between B2 and B3 was detected during the study, although B1 readability was
less than that of B3 (P < 0.05). No difference between B2 and B3 was detected during the
study, although B1 readability was lower than B3 (P < 0.05). As a consequence, only B3
fulfilled the requested ICAR value for official use.
With regard to ear tags, a total of 3 losses of E2 ear tags were registered after the first
year; 2 of them during yr 2 and 1 during yr 3. One loss of E2 at yr 3 was directly observed
in the head-locker of the milking parlor during milking, when the male-female mechanism
of the ear tag unlocked. No electronic failures were observed for E1 and E2 during the
entire study.
32
Visual and electronic identification in dairy goats
33
T2
100
97
9
7.0bd
10
0
0
96
9
6.0c
50
0
4
8
96.
0b,y
―
―
―
―
Inje
ctab
le tr
ansp
onde
rs
T1
75
69
92.0
cd
75
0
69
92.0
ac
66
0
60
90.9
b
42
0
39
92.9
b
E24
45
45
10
0
45
0
4
5 10
0
33
0
3
1 9
3.9b
13
0
1
2 9
2.3ab
Ele
ctro
nic
ear
tags
3
E1
46
46
100
46
0
4
6 10
0
33
0
3
3 10
0
10
0
1
0 10
0
B36
―
―
―
29
4
3
3 10
0 3
2
1
32
97.
0b 2
8
0
27
96
.4b
B25
19
19
100
19
7
2
2 8
4.6ab
2
2
2
20
8
3.3ab
,x
8
0
7
87
.5ab
E
lect
roni
c bo
luse
s
B14
91
72
79.1
a 91
0
65
71
.4b
66
0
44
66.7
a 23
0
16
69
.6a
V2
50
49
98.0
bc,y
50
0
47
94.0
ac
―
―
―
―
―
―
―
―
V
isua
l ear
tags
2
V1
41
35
85.4
ac,x
41
0
34
82
.9ab
―
―
―
―
―
―
―
―
Tab
le 3
.3. L
ong-
term
per
form
ance
of
iden
tifi
cati
on d
evic
es1 in
kid
s (n
= 9
7) a
nd a
dult
dai
ry g
oats
(n
= 2
9) d
urin
g a
3-yr
per
iod
stud
y.
Item
Bir
th to
5 m
o of
age
Adm
inis
tere
d, n
Rea
dabl
e, n
Rea
dabi
lity
, %7
6 to
12
mo
of a
ge
P
revi
ous,
n
A
dmin
iste
red,
n
R
eada
ble,
n
R
eada
bili
ty, %
7 1
to 2
yr
of a
ge
P
revi
ous,
n
A
dmin
iste
red,
n
R
eada
ble,
n
R
eada
bili
ty, %
7
2 to
3 y
r of
age
Pre
viou
s, n
Adm
inis
tere
d, n
Rea
dabl
e, n
R
eada
bili
ty, %
7
a-
d With
in a
row
, val
ues
with
dif
fere
nt s
uper
scri
pts
diff
er (
P <
0.0
5). x,
y Wit
hin
a ro
w, v
alue
s w
ith
diff
eren
t sup
ersc
ript
s di
ffer
(P
< 0
.10)
. 1 A
bbre
viat
ions
: V
1, ‘
tip-t
ag’
ear
tag;
V2,
‘of
fici
al’
tam
per-
proo
f ea
r ta
g; B
1, m
ini-
bolu
s 13
.7 g
and
51.
0 ×
10.
5 m
m (
Rum
itag,
Esp
lugu
es d
e L
Lob
rega
t, Sp
ain)
; B2,
m
ini-
bolu
s 20
.1 g
and
56.
4 ×
10.
5 m
m;
B3,
sta
ndar
d bo
lus
75 g
and
68.
2 ×
21.
0 m
m;
E1,
ear
tag
mad
e of
pla
stic
but
ton
mal
e pi
ece
and
elec
tron
ic b
utto
n fe
mal
e pi
ece;
E2,
ear
tag
mad
e of
pla
stic
fla
g m
ale
piec
e an
d el
ectr
onic
but
ton
fem
ale
piec
e; T
1, i
njec
tabl
e tr
ansp
onde
r 15
× 2
.1 m
m;
T2,
inj
ecta
ble
tran
spon
der
12 ×
2.1
m
m. 2 A
pplie
d on
the
left
ear
at 1
d o
f ag
e, a
nd r
emov
ed in
yea
rlin
gs. 3 A
pplie
d on
the
righ
t ear
just
aft
er B
1 ad
min
istr
atio
n. 4 O
ne g
oat k
id d
ied
at 7
9 d
of a
ge b
ecau
se
of p
neum
onia
. 5 A
dmin
iste
red
afte
r de
tect
ing
a B
1 be
ing
lost
(n
= 2
8).
6 Adm
inis
tere
d af
ter
dete
ctin
g a
B2
bein
g lo
st (
n =
5)
as w
ell
as i
n ad
ult
goat
s (n
= 2
9).
7 Rea
dabi
lity
of e
ar ta
gs in
clud
ed r
eten
tion
and
read
ing
(vis
ual o
r el
ectr
onic
).
Chapter 3
During the measurement of the external features of the F button pieces of E1 and E2,
which were supposed to be all the same, small differences in the internal surface of the
coupling orifice were observed between devices. Measurement results showed 2 types of
button F pieces: 34% with beveled orifices of 6.7 ± 0.1 mm, and 64% of straight orifices
of 6.4 ± 0.0 mm (P < 0.001). The beveled ear tags were able to be manually unlocked by
pulling out the male piece (strength required for opening, 9.9 ± 1.0 kg) but not in the
straight ones (male pin broke at 30.2 ± 0.7 kg), the difference being significant (P <
0.001). According to ICAR (2007), ear tags unfastening force should be greater than 280 ±
20 N (approximately 28.5 ± 2 kg). In addition, a slight difference in the outside diameter
of the pin tip of the male piece was also observed in our study, E2 (flag) being greater than
E1 (button) (7.6 ± 0.01 vs. 7.5 ± 0.01 mm, respectively; P < 0.001). A negative
relationship was established between opening strength of ear tags and the diameter of the
orifice of F piece (r = – 0.73; P < 0.001).
Because no split ears were observed for E2 losses, we concluded that losses occurred
by unlocking the E2 ear tags. Moreover, 3 E2 flag pieces (9.1%) showed biting damage.
Similar damage was also found in 2 E2 eventually lost. The use of E1 (button-button) ear
tags prevented losses and nibbling.
Only 1 more loss of T1 was registered after the first year, the injectable transponders
showing a readability in the range of 90.9 to 96.0% (Table 3.3). No differences were
detected between T1 and T2, both values being inadequate for official use according to the
ICAR requirement.
Apart from losses, the main limitation observed for injection in the metacarpal area
was the lack of room for larger transponders; the use of small transponders results in
smaller reading distances which compromises the efficiency of the recording and
monitoring practices. Suitably designed transponders should permit implementation of
farm automation; for example, high throughput inventorying, sorting for group or
According to our results, electronic ear tags (E1 and E2) and the standard bolus (B3)
were the only ID devices which had readabilities greater than 98% at 12 mo after
application, as recommended by the International Committee for Animal Recording
(ICAR, 2007) and the Spanish Committee for Animal Electronic Identification (MAPA,
2007). The use of injectable transponders in the metacarpal area is not recommended in
practice due to losses. Physical features of electronic ruminal boluses dramatically affect
their retention, and therefore their readability. No differences in bolus retention were
detected according to rearing management and feeding. Improvement of electronic bolus
retention in goats needs to be achieved before generalizing its use. In contrast to the rest of
devices tested, button-button electronic ear tags of appropriate design and technology have
proved to be efficient devices for goat identification, although because of the small
number of animals and devices used in this experiment, we recommend the confirmation
of the results on a larger scale.
CHAPTER 4
Experiment 2: Visual ear tags and rumen boluses for
goat identification under semi-extensive conditions
Goat identification under semi-extensive conditions
CHAPTER 4
Experiment 2: Extended field test on the use of visual ear tags and electronic boluses
for the identification of different goat breeds under semi-extensive conditions in the
United States
4.1. ABSTRACT
A total of 295 goats from 4 breeds (Alpine, n = 74; Angora, n = 75; Boer-cross, n = 73; Spanish, n = 73) were used to assess the retention of 3 types of electronic ruminal boluses (B1, 20 g, n = 95; B2, 75 g, n = 100; and B3, 82 g, n = 100) according to breed and feeding conditions. Boluses were administered with adapted balling guns. Time for bolus administration, reading with a handheld reader, and animal data recording (goat ID, breed, and bolus type) were registered. Each goat was also identified with 1 flag-button plastic ear tag (4.6 g, 51 × 41 mm). Retention of boluses and ear tags was regularly monitored for 1 yr. Ruminal fluid in 5 goats from each breed and management group was obtained with an oro-ruminal probe at 2 h after feeding. Ruminal pH was measured at 24 h, and at wk 1, 2, 3 and 4, and used as an indicator of feeding conditions on rumen environment. Time for bolus administration differed by bolus type (B1, 14 ± 2 s; B2, 24 ± 2 s; B3, 27 ± 2 s; P < 0.05) and goat breed (Alpine, 34 ± 3 s; Angora, 17 ± 2 s; Boer-cross, 16 ± 1 s; Spanish, 19 ± 2 s; P < 0.05), although differences were due to greater times for B2 and B3 in Alpine goats. Time for bolus administration averaged 22 ± 1 s, and overall time for �lousing, reading, and data typing was 49 ± 1 s on average. Ruminal pH differed according to breed and feeding management (lactating Alpine, 6.50 ± 0.07; yearling Alpine, 6.73 ± 0.07; Angora, 6.34 ± 0.06; Boer-cross, 6.62 ± 0.04; Spanish, 6.32 ± 0.08; P < 0.05) but no early bolus losses occurred; rumen pH did not differ according to bolus type (B1, 6.45 ± 0.05; B2, 6.39 ± 0.07; B3, 6.49 ± 0.05; P > 0.05). At 6 mo, electronic boluses showed greater retention than ear tags (99.7% vs. 97.2%; P < 0.05). At 12 mo, bolus retention was 96.3, 100 and 97.8% for B1, B2 and B3, respectively, not differing between B1 and B3 (P = 0.562). No effect of breed and bolus type on bolus retention was detected. No goat losing at the same time both bolus and ear tag was observed. Ear tag retention (91.7%) was lower (P < 0.05) than all types of bolus (98.1%) on average. Ear tag retention in Boer-cross (98.6%) and Alpine (96.9%) goats was greater (P < 0.05) than in Spanish (88.7%) and Angora (82.9%), and tended to differ (P = 0.095) between Spanish and Alpine. In conclusion, unlike flag-button visual ear tags and mini-boluses used here, properly designed boluses (e.g. standard bolus) met ICAR and NAIS retention requirements for goat identification under US conditions, and are recommended in practice.
4.2. INTRODUCTION
Permanent and reliable animal identification (ID) is a primary goal for the
implementation of animal traceability systems. Electronic identification (e-ID) by using
39
Chapter 4
radio frequency (RFID) passive transponders improves traceability due to faster
monitoring of livestock and easier management of databases for inventory and movements
between premises.
Different e-ID devices have been tested in domestic ruminants, including injected
transponders, electronic ear tags and rumen boluses (Conill et al., 2000; Carné et al., 2009;
JRC, 2003). Properly designed boluses have shown a retention rate greater than 99% in
sheep and cattle (Caja et al., 1999a; Ghirardi et al., 2006). In fact, boluses have been used
for sheep and goat ID in Spain since January 2006 (Real Decreto 947/2005), in accordance
with the current European regulations (EC 21/2004; EC 1560/2007). However, available
boluses have shown a wide retention range in goats (88.7 to 99.6%) (JRC, 2003; Pinna et
al., 2006; MAPA, 2007), which might be influenced by breed and feeding management
(MAPA, 2002; Capote et al., 2005).
In the United States, goat ID is widely implemented under the National Scrapie
Eradication Program, with a variety of ID methods in use (CFR, 2008). To harmonize the
ID methodology, visual ear tags have been chosen as the de facto standard devices for the
current deployment of the National Animal Identification System (NAIS); the use of
electronic ear tags is optional (USDA, 2008a). Conversely, injected transponders are the
recommended devices for Camelid ID (USDA, 2008c) and are also being suggested for
goats where poor performance of ear tags occurs (USDA, 2006b). Little information is
available on the use of boluses for the e-ID of goats in the United States.
The objective of this work was aimed at assessing the long-term performance of 3
types of ruminal bolus compared to a visual ear tag in different goat breeds under US
conditions; the effect of breed and feeding management on early losses were also
investigated.
4.3. MATERIALS AND METHODS
4.3.1. Animals and management
The experimental procedures and animal care conditions were approved by the
Langston University Animal Care Committee. A total of 295 goats from 4 breeds (Alpine,
dairy purpose, n = 74; Angora, fiber purpose, n = 75; Boer-cross, meat purpose, n = 73;
40
Goat identification under semi-extensive conditions
and Spanish, meat purpose, n = 73) belonging to the Research Farm of the E. (kika) de la
Garza American Institute for Goat Research of Langston University, Langston (OK) were
used. All the animals were adult goats, except for the Alpines, where 2 balanced groups of
lactating does (n = 38) and yearlings (n = 36) were established to evaluate the different
feeding conditions dependent on physiological stage. Boer-cross goats were 1/4 cross-bred
with Spanish breed.
The Angora, Boer-cross and Spanish goats remained allocated to different outdoor
paddocks according to breed, and rotationally grazed on Oklahoma native grass and
Bermuda (Cynodon spp.) pastures. Paddocks were over-seeded in the fall with pasture-mix
(50% wheat, 40% rye, and 10% vetch) at a seeding rate of 135 kg/ha with a fertilization
(18-46-0) rate of 225kg/ha. The Angora, Boer and Spanish goats were also supplemented
with commercial low protein pellets (CP, 13.3%) during spring-summer, and with high
protein pellets (CP, 20.3%) during fall-winter (Stillwater Milling Inc., Stillwater,
Oklahoma), offered at approximately 0.25 kg per animal. Alpine goats were fed good
quality alfalfa hay; during lactation Alpine does were milked twice a day (0600 and 1700)
and provided concentrate (CP, 15.6%; ME 2.7 Mcal/kg; Ca, 1.5%; P, 1.0%) in the
paddock prior to the p.m. milking. Goats in the study had free access to round bales of
prairie, Bermuda and wheat hay placed in raised, portable metal half round feeders, as
well as to mineral blocks and fresh water.
Each goat was dewormed (Prohibit, Agri Laboratories, St. Joseph, MO) twice a year in
October and December; Angora and Spanish goats were also dewormed and deloused with
a pour-on insecticide (Ectrin, Fermenta Animal Health Company, Kansas City, MO) prior
to shearing in late February and after shearing in March. Boer does were deloused
(Atroban, Coopers Animal Health, Kansas City, MO) in April.
Goats were given a booster vaccination for enterotoxaemia and tetanus prophylaxis
(Vision CD-T & Spur, Intervet, Millsboro, DE) in February, and Spanish goats received
an additional vaccination (Covexin, Intervet, Upper Hutt, New Zealand) in mid April.
Breeding was scheduled from mid October to early January and kidding season started
in mid March and ended in early June.
41
Chapter 4
4.3.2. Administration and monitoring of identification devices
Each goat was visually identified with 1 standard flag-button plastic ear tag (4.6 g,
50.8 × 41.3 mm [flag dimensions]; Allflex USA, Dallas, TX) with opened locking system
and a 3- to 5-digit animal ID code printed for farm management purposes.
Goats were also electronically identified with cylindrical ruminal boluses (Rumitag,
Esplugues de Llobregat, Barcelona, Spain) made of atoxic and highly dense ceramic
materials, according to the patents of the European Community et al. (1998) and Caja et
al. (2005b). Three types of bolus were used, with the following features (material, weight,
length × o.d. and specific gravity): B1 (zirconia, 20.1 g, 56.4 × 11.2 mm and 3.9; n = 95),
B2 (alumina, 75.0 g, 68.2 × 21.0 mm and 3.4; n = 100), and B3 (alumina, 82.1 g, 69.1 ×
21.2 mm and 3.6; n = 100). Distribution of boluses according to goat breed and bolus type
is shown in Table 4.1.
Table 4.1. Electronic boluses used for the long-term (1 yr) identification of goats,
according to goat breed and bolus type
Bolus type1
Breed B1 B2 B3
Overall
Alpine 25 24 26 75
Angora 24 25 26 75
Boer-cross 23 26 24 73
Spanish 23 25 25 73
Overall 95 100 100 295
1Abbreviations: B1, mini-bolus 20.1 g and 56.4 × 11.2 mm; B2, standard sized bolus 75.0
g and 68.2 × 21.0 mm; B3, standard sized bolus 82.1 g and 69.1 × 21.2 mm.
The B1 bolus was a small-sized type specially designed for early administration in
lambs and kids. The B2 and B3 types were standard dimensioned boluses for
administration in replacement sheep and goats of more than 3 mo of age. Each bolus
contained a half-duplex (HDX), read-only, glass encapsulated transponder of 32 × 3.8 mm
(Ri-Trp-RR2B-06, Tiris, Almelo, The Netherlands). Serial numbers of transponders
included the manufacturer code (Rumitag, 964) and a 12-digit serial number, in
accordance with both the list of manufacturer codes of the International Committee for
Animal Recording (ICAR, 2008) and the ISO (International Organization for
42
Goat identification under semi-extensive conditions
Standardization) 11784 standard on animal electronic ID (ISO, 1996a). Transponders
worked at a frequency of 134.2 kHz, in agreement with the ISO 11785 standard (ISO,
1996b).
Figure 4.1. Electronic rumen boluses and visual ear tags used.
B2 B3 B1
Boluses were administered by trained operators using balling guns adapted to each
bolus type (Rumitag). For administration, 1 assistant restrained each goat between their
legs, holding the goat’s head to maintain it in a natural position. Subsequently, one
operator held the goat’s jaw by the region without teeth (diastema) and introduced the
balling gun laterally into the mouth through this same region. The balling gun was then
centered to frontally reach the bottom of the oropharyngeal cavity (base of the tongue) and
the bolus was released with a slight backward movement, stimulating the reflex of
deglution similarly as indicated by Caja et al. (1999a). After administration, each bolus
was read in static conditions (animals restrained) by using a full-ISO RFID handheld
transceiver (reader) (Ges2s, Rumitag). For the readings, a directional caudo-cranial sweep
in the abdomen region was performed to ensure that the bolus suitably reached its final
location in the reticulorumen. Time required for bolus administration with the goats
previously restrained, and for reading and data typing (ear tag animal ID, goat breed and
bolus type) on the transceiver were recorded for each goat; breed and bolus type data were
entered into the reader from a previously configured drop down menu. Administration
difficulties were monitored by registering the number of bolus administration attempts; an
administration attempt was registered when the bolus was not swallowed but expelled
43
Chapter 4
immediately after being released into the animal’s mouth. Attempts rate was expressed as
a,bWithin a row, values with different superscripts differ (P < 0.05). x,yFor the administration time and overall identification time, values with different superscripts within a column differ (P < 0.05). 1Abbreviations: B1, mini-bolus 20.1 g and 56.4 × 11.2 mm; B2, standard sized bolus 75.0 g and 68.2 × 21.0 mm; B3, standard sized bolus 82.1 g and 69.1 × 21.2 mm. 2Time recorded with animals restrained. 3Time for administration, reading and data typing on a handheld transceiver. 4Data recorded: Animal ID (3- to 5-digit code printed in the ear tag), goat breed, and bolus type (breed and bolus type from a drop down menu previously configured). 5Attempts rate = no. administration attempts / no. administered. 6Attempt: when a bolus is expelled without being swallowed just after being released into the animal’s mouth. 7One B3 bolus broke after felling out and hitting on the concrete ground in an indoors paddock when administered to an Alpine goat. 8Significant breed × bolus type interaction (P < 0.05).
No differences in time for B1 administration were observed among goat breeds, being
lower (P < 0.05) than for B2 and B3 (Table 4.2). In addition to these results, an interaction
(P < 0.05) between breed and bolus type was detected for both administration time and
attempts rate. Overall time for bolus administration averaged 22 s (Table 4.2), which was
deemed suitable for the implementation of this e-ID methodology in practice. Using
47
Chapter 4
similar sized boluses, Caja et al. (1999a) indicated times of 24 and 26 s for their
administration in sheep and goats, respectively.
No apparent health disturbances or injuries to the goats were observed due to
administration of the 3 bolus types at bolusing and in the subsequent reading controls,
agreeing with the fact that this kind of boluses can be safely administered by trained
operators to yearling goats and sheep with BW greater than 20 and 25 kg, respectively
(Caja et al., 1999a). Apart from administration attempts, the only incidence registered
during bolusing was the breakage of 1 B3 bolus, which was expelled by an Alpine goat
and broke when it fell to the concrete flooring. The bolus was discarded and a new one
was administered to the same goat. Despite the small format of the Angora goats no
specific difficulties for bolus administration were reported.
As might be expected, time for reading and data typing (ear tag ID code, breed and
bolus type) on the handheld reader did not differ (P > 0.05) among breed and bolus type,
being 27 ± 1 s on average.
Overall time registered for bolus administration, reading and data typing only differed
(P < 0.05) for Alpine goats, and between B1 and the other 2 bolus types (B2 and B3),
similar to observations for bolus administration. On average, time for completed ID of
goats with rumen boluses averaged 49 s (Table 4.2). By using mini-boluses, Ghirardi et al.
(2007) reported average time for ID of lambs (8 to 10 kg BW) of 35 s. Similar mini-
boluses were used by Carné et al. (2009), who indicated average times for goat kids (7 kg
BW) ID ranging from 26 to 28 s, but without taking into account time for restraining. The
time observed in our results for the administration of standard sized boluses, reading and
data typing on the reader (53 ± 2 s) was lower than that reported by Caja et al. (2003)
using similar boluses in yearling and adult sheep (71 s) in the United States; but in that
study time for animal restraining was included (G. Caja, personal communication).
4.4.2. Ruminal pH and short-term retention of identification devices
Ruminal pH differed (P < 0.05) according to both goat breed and feeding management
(lactating vs. yearling Alpine), and was 6.49 ± 0.03 on average. The lower values were
observed in Angora (6.34 ± 0.06) and Spanish (6.32 ± 0.04) goats, which differed (P <
0.05) from those in yearling Alpines (6.73 ± 0.07), Boer-cross (6.62 ± 0.04) and lactating
Alpines (6.50 ± 0.07). Differences were also detected (P < 0.05) between lactating Alpines
48
Goat identification under semi-extensive conditions
and the rest of breeds under study. Moreover, an interaction (P < 0.05) between goat breed
and sampling date was observed. Although ruminal fluid collection by using an oro-
ruminal probe may cause overestimation of pH values due to saliva contamination
(Geishauser and Gitzel, 1996), results obtained remained within a normal physiological
range.
On the contrary, no differences on the ruminal pH according to bolus type were
observed (B1, 6.45 ± 0.05; B2, 6.39 ± 0.07; B3, 6.49 ± 0.05; P > 0.05) and no interaction
with bolus type was detected either for breed or sampling date. According to our results,
standard sized boluses did not affect rumen environment when compared to mini-boluses.
Earlier studies reported no adverse effects of different types of ruminal boluses on feed
intake, digestibility, reticulorumen anatomophysiology and production performance (Caja
et al., 1999a; Garín et al., 2005; Antonini et al., 2006; Ghirardi et al., 2007).
Losses of unsuitably designed boluses are mainly caused by regurgitation (Caja et al.,
1999a; Fallon, 2001; Garín et al., 2005), although passage of small sized boluses through
the reticulo-omasal orifice is not discarded (Ghirardi et al., 2007; Carné et al., 2009). As
long as no early losses occurred in our study, no relationship between ruminal conditions
and bolus retention could be established. It must be highlighted that the majority of bolus
losses in goats in Europe have been reported in dairy breeds managed in highly intensified
conditions (JRC, 2003; MAPA, 2002), with concentrate-based diets. With this regard, goat
herds in the United States are essentially managed under extensive or semi-intensive
conditions, which might be a factor of major relevance for the retention of rumen boluses.
4.4.3. Long-term retention of identification devices
Long-term retention of the different ID devices until 1 yr and the contrasts between
devices obtained with the Logit model are shown in Figure 4.3. In this case, devices with
no registered losses (100% retention rate) could not be statistically analyzed. With regard
to boluses, only the loss of 1 B1 in a Boer goat was registered until 4 mo, which occurred
by regurgitation when having the animal sedated and inverted on an operating table during
a laparoscopic surgery; influence of this management on bolus losses remains a topic for
further research. On the other hand, 7 losses of ear tags were registered at that time, and
retention of boluses (99.7%) and ear tags (97.6%) tended to differ (P = 0.067). Ear tags
did not meet the 98% retention in the year following tagging required for official ID by the
49
Chapter 4
International Committee for Animal Recording (ICAR, 2007), although retention
remained over the 95% minimum retention required by the USDA for ID of sheep and
goats within the NAIS (USDA, 2008b). At 6 mo, no additional losses occurred except for
1 more ear tag, and the difference between bolus and ear tag retention (2.5%; P < 0.05)
was similar to that observed at 4 mo (2.1%; P < 0.07). At 1 yr, 4 more bolus losses
occurred, 3 of them (2 B1 and 1 B3) in Angora goats and 1 (1 B3) in a Boer goat, thereby
resulting in an overall bolus retention of 98.1%.
Figure 4.3. Retention of 3 electronic bolus types and 1 visual ear tag in goats throughout 1
yr of study. Abbreviations: B1, mini-bolus 20.1 g; B2, standard sized bolus 75 g; B3,
standard size bolus 82.1 g. Ear tag: flag-button, 4.6 g, and 50.8 × 41.3 mm (flag
dimensions). x,yFor each reading control, devices with different superscripts tended to
differ (P < 0.1). No statistical contrasts were done when retention rate values were 100%.
80
85
90
95
100
0 2 4 6 8 10
Time, mo
Ret
enti
on r
ate,
%
12
B1
B2
B3
Ear tag
x
y
x
y
xy xy
With regard to ear tags, retention at 8 mo (94.5%) already fell under the NAIS
requirements (USDA, 2008b). Likewise, a total of 22 ear tag losses were registered at 1 yr
leading to a final retention rate of 91.7%. At 1 yr, ear tag retention continued to be lower
(P < 0.05) than bolus retention.
As anticipated, the mini-bolus (B1) showed the lowest retention (96.3%) at 12 mo,
although not different (P = 0.562) from the retention rate for B3 (97.8%); the retention of
50
Goat identification under semi-extensive conditions
B2 was 100%. Although low losses did not allow differences to be established, lower
retention of the heavier bolus (B3) with respect to standard B2 was unexpected as the
increment of weight and specific gravity of boluses have been demonstrated to improve
their retention in the reticulorumen of cattle, sheep and goats (Fallon, 2001; Ghirardi et al.,
2006; Carné et al., 2007). When considering mini-bolus (B1) and standard sized boluses
(B2 and B3) as 2 separate groups of devices, retention tended to be greater for the standard
sized boluses (99.5% vs. 96.3%; P = 0.093) at 10 mo, but no difference could be
established at the end of the study (standard sized boluses, 98.9% vs. B1, 96.3%; P =
0.175).
Retention of ear tags tended to be lower (P = 0.063) than B3, whereas no difference (P
= 0.173) was observed with respect to B1. Due to lack of losses, no contrast between B2
and ear tags could be carried out with the Logit model, although a difference (P < 0.05)
between ear tags and overall standard sized boluses (B2 and B3) was detected.
Table 4.3. Estimated retention of identification devices with Kaplan-Meier non-
parametric survival analysis and log-rank tests between devices in goats at 1 yr of study
Electronic boluses1
Item B1 B2 B3 Overall Ear tags2
Devices, No.
Censored data, No.3
Events, No.4
Estimated readability, %
95
92
3
96.7abx
100
100
0
100ay
100
98
2
97.9a
295
290
5
98.2a
295
273
22
92.2b
a,bWithin a row, values with different superscripts differ (P < 0.05). x,yWithin a row, values with different superscripts differ (P < 0.1). 1Abbreviations: B1, mini-bolus 20.1 g and 56.4 × 11.2 mm; B2, standard sized bolus 75.0 g and 68.2 × 21.0 mm; B3, standard sized bolus 82.1 g and 69.1 × 21.2 mm. 2Visual flag-button plastic ear tag, 4.6 g, and 50.8 × 41.3 mm (flag dimensions). 3Devices in which the event was not observed or which left the study before 1 yr after application. 4Devices lost.
Results obtained with the Kaplan-Meier non-parametric survival analyses are shown in
Table 4.3. The Kaplan-Meier estimated values of retention were slightly greater (0.2% on
average) than actual values, which was expected according to the low number of censored
data before the end of the 1-yr study. Estimated retention of standard sized boluses (B2
51
Chapter 4
and B3) were greater (P < 0.05) than ear tags; moreover, B2 estimated retention tended to
be greater (P = 0.07) than B1.
According to our results, retention of B1 did not fulfill ICAR requirements (>98%)
from mo 8, and neither did B3 at 1 yr. Different authors have reported unsuitable retention
of mini-boluses in different goat breeds (MAPA, 2007; Carné et al., 2009). Conversely,
the use of properly designed standard sized boluses has shown suitable retention results in
most European goat breeds (JRC, 2003; Pinna et al., 2006), except for the case of some
Spanish goat breeds where bolus retention has turned out to be highly variable (Capote et
al., 2005; JRC, 2003; MAPA, 2007). Unlike in goats, properly designed mini- and
standard sized boluses have shown retention rates greater than 98% in different sheep
breeds in the United States (Caja et al., 2003) and Europe (Ghirardi et al., 2006; MAPA,
2007).
Retention of boluses and ear tags according to goat breed throughout the 1-yr study are
shown in Figure 4.4, as well as the contrasts between breeds obtained with the Logit
model. Retention of boluses in Angora (97.2%) fell under ICAR requirements at 8 mo
after administration. At 12 mo, retention in Alpine was 100%, whereas no differences (P >
0.05) were observed among Boer-cross (98.5%), Spanish (98.4%) and Angora (95.8%).
The majority (60%) of bolus losses occurred in the latter breed, whose size and BW is
markedly lower than in the other 3 breeds under study; no losses occurred in the larger
breed (Alpine). Thus, in addition to a possible breed and management effect, the BW of
the goats (not determined in the current study) might affect the retention of boluses.
Angora goats in our study were sheared between the 6 and 8 mo reading measurements,
during which time 2 of the 3 bolus losses occurred. Though no in situ loss was observed
during shearing, possible effects of this kind of specific management on bolus losses
needs to be studied in thorough detail. At the end of the study, only bolus retention in
Angora goats did not meet the ICAR requirements. This was mainly due to mini-bolus
performance for standard sized boluses (B2 and B3) retention was 98%. Even so, all
boluses tested met the retention requirements for official ID within the NAIS (USDA,
2008b).
52
Goat identification under semi-extensive conditions
Figure 4.4. Retention of electronic boluses (Panel a) and visual flag-button ear tags (Panel
b) throughout 1 yr of study according to goat breed. For each reading control, goat breeds
with different superscripts differ: x,yP < 0.1, a,bP < 0.05. No statistical contrasts were done
when retention rate values were 100%.
a) Electronic boluses
80
85
90
95
100
0 2 4 6 8 10
Time, mo
Ret
enti
on r
ate,
%
12
Alpine
Angora
Boer-cross
Spanish
a
a
a
aa
a
b) Visual ear tags
80
85
90
95
100
0 2 4 6 8 10 1
Time, mo
Ret
enti
on r
ate,
%
a
a
b
ab
b
ab
2
y
a
ax
c
bcy
abx
a
a
aa
aa
aa
aa
a
a
a
53
Chapter 4
In the case of ear tags, no differences in retention according to breed were detected
until mo 8, when retention of ear tags in Alpine (97.0%) and Boer-cross (98.6%) was
greater (P < 0.05) than in Angora (87.5%). Importance of ear tag losses in Angora goats
by accidentally cutting off the ear tag during shearing has been remarked by the NAIS
Goat Working Group (USDA, 2006b). Despite observing the greater increment of ear tag
losses (7.2%) at the subsequent reading after shearing (mo 8), the specific cause of losses
was not monitored.
At the end of the 1-yr study, ear tag retention in Boer-cross (98.6%) and Alpine
(96.9%) were greater than in Spanish (88.7%) and Angora (82.9%); moreover, retention in
Alpine and Spanish tended to differ (P = 0.095). Only the retention rate of ear tags in
Boer-cross goats met ICAR requirements (> 98%). Ear differences between breeds seem
to be mainly responsible for the retention variability of the ear tags used, although
different management and pens allocation may have contributed to ear tag loss as well. As
indicated for the boluses, materials and proper design of ear tags are key factors to
optimize their retention rate. In this regard, the button-flag ear tags used here proved not
to be efficient devices for goat ID. To our knowledge, no bibliographical references on the
retention of visual ear tags in goats are currently available. Carné et al. (2009) tested flag-
button and button-button electronic ear tags in Murciano-Granadina dairy goats in Spain
and reported an optimum long-term performance of the latter. In the US, the NAIS Goat
Working Group has pointed out a high incidence of ear tag losses, as well as drawbacks
when dealing with goat breeds where small ear size does not permit the suitable
application of ear tags (USDA, 2006b). Within this framework, the use of alternative ID
devices such as injectable transponders is under consideration. In fact, injectable
transponders of small size (12 mm in length) have been recommended instead of ear tags
for the deployment of the NAIS in camelids, although proper site for injection remains
under study (USDA, 2006a; USDA, 2008c). Performance of injectable transponders
highly depends on their size and the injection site (Conill et al., 2000; Carné et al., 2009),
which may bring about high levels of early losses before the injection site heals, as well as
subcutaneous migration and the impossibility of efficient removal from carcasses
(Klindtworth et al., 1999; Conill et al., 2000). Moreover, the use of small transponders
dramatically diminishes their reading distance and causes poor dynamic reading
efficiency.
54
Goat identification under semi-extensive conditions
55
Supplementary to retention rate and reading performance, guaranteeing the certainty of
available animal ID data is another relevant issue, regardless of whether mandatory or
voluntary ID programs are deployed. Only tamper evident devices are accepted under
boluses and transponders injected i.m. or i.p.) may be satisfactory because they are
extremely hard to remove. However, the main drawback of internally applied e-ID devices
is the need for additional visual ID for routine management whenever RFID readers are
not broadly available. In this regard, it must be underlined that no goat without both bolus
and ear tag was observed, which supports the idea of implementing dual ID systems with
devices from different ID methodologies in order to optimize animal traceability.
4.5. CONCLUSIONS
Because of poor retention, the mini-boluses used in this study can not be recommended
for general administration for the e-ID of goats under US conditions, although further
research with a greater number of animals is warranted to assess the influence of goat
breed on bolus performance. Standard sized boluses with suitable weight and specific
gravity have proven to be easily and safely administered and to offer suitable retention
according to ICAR and USDA requirements, irrespective of goat breed. The visual flag-
button plastic ear tags used in this work did not fulfill the official ID requirements, and
their performance strongly depended on goat breed. Larger scale experiments comparing
the performance of different ID devices in goats should be done to advice farmers on the
single or dual ID system which best works for both the specific goals of the NAIS and the
preferences of US goat industry. The results presented in this study confirm previous
reports in the European Union on the use of ear tags and boluses for goat identification
and registration.
CHAPTER 5
Experiment 3: Leg tags vs. rumen boluses and
electronic ear tags for dairy goat identification in the
milking parlor
Leg tags for identification of dairy goats
CHAPTER 5
Experiment 3: Readability of visual and electronic leg tags versus rumen boluses and
electronic ear tags for the permanent identification of dairy goats
5.1. ABSTRACT Murciano-Granadina dairy goats (n = 220) were used to assess the performance of leg tags compared to different visual and electronic identification (ID) devices: 1) leg tags (LT) in the shank of the right hind leg (metatarsus), consisting of plastic bands (181 × 39 mm, 21 g; n = 220) closed with 2 types of electronic button tags (ET1, 3.9 g, 26 mm o.d., n = 90; ET2, 5.5 g, 25 mm o.d., n = 130); 2) electronic rumen boluses (RB, 75 g, 68 × 21 mm, n = 220) containing 32 × 3.8 mm transponders; 3) electronic ear tags (EE, button-button, 4.8 g, 24 mm, n = 47); and, 4) visual plastic ear tags (VE; flag-button, 4.2 g, 40 × 38 mm, n = 220). All transponders used half-duplex technology. Shank circumference of 47 replacement kids (5 to 6 mo of age) and 103 adult goats were measured to evaluate the appropriate circumference of fastened LT. Goats had been identified with rumen boluses and ear tags prior to the start of the experiment. Total time for leg tagging (LT application and transponder attachment), reading and data recording with a handheld transceiver was measured. Readability [(read/readable) × 100] was monitored for 1 yr with goats restrained in the milking parlor. Reading time and errors for RB and ET2 in the milking parlor using the handheld transceiver were also recorded. Shank circumference of kids (70 ± 1 mm) was 79.5% of those in adult goats (88 ± 1 mm), thus, LT (107 ± 1 mm inner circumference) were only applied to adult goats, as were considered inadequate for 5-mo kids. Time for leg tagging and data recording was 53 ± 3 s. At 1 yr, readability of RB was 96.5%. No losses of LT occurred, although 3 (1.5%) had to be removed due to limping, being LT visual readability 98.5%. Moreover, 7 (3.6%) LT were found open and electronically unreadable due to loss or breakage of the button tag. Readability of button transponders, excluding removed LT, was 93.9% for ET1, and 98.3% for ET2. For ear tags, readability was 95.7 and 97.0% in EE and VE, respectively. Only LT and ET1 readabilities differed. Reading time in the milking parlor was greater for RB (61.2 s) than for ET1 (45.9 s), as well as reading errors (0.3 vs. 0%). In conclusion, leg tags were not adequate for the identification of goat kids < 6 mo of age although, if adequately sized and fastened, this may be an efficient method for adult goats under intensive conditions. Only leg tags with ET2 transponders met the ICAR requirements for official ID of adult goats (readability > 98%) under the conditions of this experiment.
5.2. INTRODUCTION
The European regulation CE 21/2004 on identification (ID) and registration of sheep
and goats, sets out a double ID system that includes the use of passive radio frequency ID
(RFID) devices in the Member States where total sheep and goat population surpasses
600,000 animals, as well as in goats where the total number is greater than 160,000.
57
Chapter 5
According to this regulation, RFID has been officially deployable since 2005 although its
compulsory implementation has been adopted from January 2010 (CE 1560/2007).
Regulation CE 21/2004 has already enforced in Spain, where RFID rumen boluses have
been in use since 2006 (Real Decreto 947/2005).
Nevertheless, bolus retention in goats has proved to be highly variable (Caja et al.,
1999; Pinna et al., 2006; Carné et al., 2009a,b). As a consequence, the use of subcutaneous
small size transponders (i.e., 10 to 15 mm) in the fore- (metacarpus) or hind-leg
(metatarsus) of goats was also approved to be used in goat herds with poor bolus retention.
However, transponders injected in the leg have also shown a wide range of losses and
reading performance of small transponders is low (MAPA, 2007; Carné et al., 2009a).
Moreover, injection in the hind-leg of dairy goats has proven more difficult than in the
fore-leg (MAPA, 2007).
Recently, European Regulation CE 21/2004 has been amended by Regulation CE
933/2008, which specifies the mandatory use of 1 visual and 1 electronic ID device
simultaneously. Rumen boluses and ear tags have eventually been established as the
authorized RFID devices whenever RFID is compulsory; visual ear tags and visual pastern
tags are accepted as the second ID device. Additionally, identification in the pastern by
using electronic marks (electronic leg tags) and injectable transponders has also been
accepted in sheep and goats whose first means of ID is a visual ear tag and only when not
leaving the Member State of origin (CE 933/2008). Although visual tags on the metatarsus
are common for goat ID in the milking parlor (Balvay, 2007), extremely scarce
information is available on the use in practice of leg tags for the long-term visual and
electronic readability. Thus, this work aimed at evaluating the visual and electronic
performance of leg tags placed on the metatarsus of dairy goats; rumen boluses, and visual
and electronic ear tags were also evaluated to allow for comparisons.
5.3. MATERIALS AND METHODS
Animal care conditions and management practices followed procedures stated by the
Ethical Committee of Animal and Human Experimentation of the Universitat Autònoma
de Barcelona, as well as the guidelines of the ICAR (2007) and the Spanish Committee on
Animal Electronic Identification (MAPA, 2007).
58
Leg tags for identification of dairy goats
5.3.1. Animals, management, and identification devices
A total of 220 adult Murciana-Granadina dairy goats from a commercial farm
(Ramaderia Huguet, Girona, Spain; n = 170) and from the experimental farm of the
Universitat Autònoma de Barcelona (S1GCE, Barcelona, Spain; n = 50) were used. All
goats were born before 2005 and were not subject to the new European Regulation EC
21/2004 on goat ID. Goats were fed indoors with dehydrated ryegrass hay ad libitum (12%
CP; as fed), 0.5 kg/d of alfalfa pellets (17% CP; as fed), and 0.5 to 1.0 kg/d of commercial
concentrate (1.53 Mcal of NEL/kg and 16% CP; as fed) according to the physiological
stage of the animal. Additionally, goats from the experimental farm grazed on cultivated
Italian ryegrass pasture for 5 h daily (1000 to 1500 h).
All goats were visually identified with a leg tag (LT) consisting of a yellow plastic
band (weight, 21 g; length and width, 181 × 39 mm; and thickness, 2.2 mm;
Animalcomfort, Jumilla, Murcia, Spain; Figure 5.1) with an adjustable buckle-like closure
system, specially designed for goat ID. Each leg tag had a 3-digit animal ID code printed
for farm management purposes. The buckle’s pin of the leg tags was specially designed to
be coupled with female ear tag pieces by using adapted tagger pliers supplied by the leg
tag manufacturer. Two types of button half-duplex (HDX) transponders were used (Figure
5.1): ET1 (weight, 3.9 g; o.d., 26 mm; open piece; n = 90; Allflex España, Madrid, Spain)
and ET2 (weight, 5.5 g; o.d., 25 mm; closed piece; n = 130; Rumitag, Esplugues de
Llobregat, Barcelona, Spain). Transponder serial numbers included the manufacturer code
(Allflex, 982; Rumitag, 964) and worked at 134.2 kHz in agreement with the International
Organization for Standardization (ISO) 11784 and 11785 standards on animal electronic
ID (ISO, 1996a,b).
As European regulations lay down that animals must be officially identified no later
than 6 mo of age, the metatarsus’ circumference of 103 adult and 47 replacement (5 to 6
mo of age) goats were measured to decide on the suitable inner circumference of leg tags
to be used. Subsequently, the inner circumference of 50 closed leg tags with the chosen
closing adjustment for adult goats was also measured to compare with leg circumferences
obtained.
Prior to the start of this study, goats were also identified with standard size cylindrical
boluses (RB; n = 220; weight, 75.0 g; length × o.d., 68 × 21 mm; and specific gravity, 3.4;
Rumitag) made of atoxic, nonporous and dense ceramic materials. These boluses were
59
Chapter 5
considered as control devices as they had already been tested in previous studies (Pinna et
al., 2006; MAPA, 2007; Carné et al., 2009a,b). Each bolus contained an ISO HDX, glass
encapsulated transponder of 32 × 3.8 mm (Ri-Trp-RR2B-06, Tiris, Almelo, The
Netherlands). Transponder serial numbers included the 3-digit manufacturer code
(Rumitag, 964) in agreement with corresponding ISO standards (ISO, 1996a,b). Boluses
were administered by trained operators as described by Caja et al. (1999a) and Carné et al.
(2009b). Boluses of these characteristics have been used since 2006 as the official RFID
device for sheep and goats in Spain (Real Decreto 947/2005).
Figure 5.1. Leg tags and attached transponders for the visual and electronic identification
of dairy goats in the hind leg. Abbreviations: LT = plastic-made leg tag with a 3-digit code
printed for individual visual identification (weight, 21 g; length × width, 18 × 4 cm; and
mm; Rumitag); EE = half-duplex electronic button-button ear tag (weight, 5.9 g; o.d., 24
mm; Azasa-Allflex).
90
91
92
93
94
95
96
97
98
99
100
0 2 4 6 8 10 12
t, mo
Rea
dab
ility
, %
Performance of compulsory official VE used in Spain at the time this work was carried
out was also evaluated at the end of the experiment. A total of 6 VE losses were
registered, thereby obtaining 97.0% retention. However, it must be stressed that damages
in the flag piece were observed in 24.9% of cases, 22.8% corresponding to the breakage of
the flag piece right by the base, making the VE appear as button-like devices.
Nevertheless, only lost devices were usually replaced by the veterinary officials during the
annual blood sampling. The high number of such findings might be related to an apparent
good retention rate of these resulting devices, especially considering the relatively low
incidence of annual losses. In sheep, retention of this same type of official ear tag
averaged 96.7%, although no reference to damages was made (Ghirardi et al., 2006).
68
Leg tags for identification of dairy goats
According to our results, only the visual readability of LT and electronic ET1 differed
(P < 0.05) at the end of the study, corresponding to the highest and lower readability
results obtained, respectively. Furthermore, only the LT visual readability and ET2
electronic readability were greater than 98%, as recommended by the ICAR for extended
field tests lasting 1 yr (ICAR, 2007).
Results of estimated readability of ID devices, obtained with the Kaplan-Meyer
survival analysis, are shown in Table 5.2. This analysis permitted the incorporation of data
corresponding to goats that could not be monitored until the end of the 1-yr study.
Differences between factual and estimated readability were low, ranging from 0.1 to 0.5%;
this was mainly due to the high number of devices being monitored until the end of the
study. As previously observed for factual results, estimated values of ET1 electronic
readability and LT visual readability differed (P < 0.05). Moreover, ET1 and ET2
estimates tended to differ (P = 0.08). On the other hand, and similarly to factual data, no
differences (P > 0.1) between LT, RB and EE were detected.
Table 5.2. Estimated readability of identification devices with Kaplan-Meier non-
parametric survival analysis and log-rank tests between devices in dairy goats throughout
1-yr study1
Button transponders
Item
LT ET1 ET2 Overall RB EE
Applied, n
Censored data, n2
Events, n3
Readability estimates, %
220
23
3
98.6a
90
12
5
94.1bx
130
14
2
98.4aby
220
26
7
96.7ab
220
23
7
96.6ab
47
1
2
95.7ab
a,bWithin a row, values with different superscripts differ (P < 0.05). x,yWithin a row, values with different superscripts differ (P < 0.10). 1Devices: LT = plastic-made leg tag with a 3-digit code printed for individual visual identification (weight, 21 g; length × width, 181 × 39 mm; and thickness, 2.2 mm; Animalcomfort); ET1 = half-duplex button transponder (weight, 3.9 g; o.d., 26 mm; Azasa-Allflex) attached to LT; ET2 = half-duplex button transponder (weight, 5.5 g; o.d., 25 mm; Rumitag) attached to LT; RB = ceramic-made rumen bolus (weight, 75 g; length × o.d., 68 × 21 mm; encasing a 32-mm half-duplex glass-encapsulated transponder; Rumitag); EE = half-duplex electronic button-button ear tag (weight, 5.9 g; o.d., 24 mm; Azasa-Allflex). 2Devices which left the study before 1 yr without an event being registered. 3Unreadable devices.
69
Chapter 5
5.4.3. Static reading efficiency of leg tags and boluses in the milking parlor
Results referring to reading efficiency of leg tags with electronic transponders (ET2)
and RB in static conditions from the pit side in the milking parlor are shown in Table 5.3.
Because of the distance between EE and the operator placed in the pit of the milking
parlor, EE reading was not possible. Reading time of ET2 in the milking parlor was 25%
lower (P < 0.001) than for RB. This was mainly due to an easier access to the ET2 from
the rear position of the animal, as the operator was located in the pit of the milking parlor,
allowing at the same time for a quicker transition between goats. In the case of RB, the
stick antenna had to be positioned close to the cranial left-side abdominal area, as boluses
have been described to remain mainly located in the reticulum of domestic ruminants
(Garín et al., 2003; Castro et al., 2004; Antonini et al., 2006).
Table 5.3. Comparison of static reading efficiency of electronic leg tags (ET2
transponders) and rumen boluses in dairy goats in the milking parlor (values are least
squares means ± SE), by using a handheld transceiver connected to a stick antenna1
Device2
Item RB ET2 P <
Readings, n3
Group reading time, s/24 goats4
Unitary reading time, s/goat
Static reading efficiency
Reading failures, n
False readings, n5
Readability, %
720
61.2 ± 1.0
2.6 ± 0.1
0
2 (0.3%)
99.7
720
45.9 ± 0.7
1.9 ± 0.1
0
0
100
—
0.001
0.001
— 6
— 6
— 6
1Smart Reader (Rumitag, Esplugues de Llobregat, Barcelona, Spain) connected to a 70-cm stick antenna. 2Devices: RB = ceramic-made rumen bolus (weight, 75 g; length × o.d., 68 × 21 mm; encasing a 32-mm half-duplex glass-encapsulated transponder ; Rumitag); ET2 = half-duplex button transponder (weight, 5.5 g; o.d., 25 mm; Rumitag) attached to a leg tag. 3Number of read devices, carried out in groups of 24 goats in the milking parlor. 4Groups of 24 goats in a double-12 stall parallel (side by side) milking parlor. 5Reading of transponders from adjacent goats in the milking parlor. 6No statistical contrasts could be carried out when no reading incidences or 100% readability were registered.
70
Leg tags for identification of dairy goats
The RB average unitary reading time (Table 5.3), obtained when reading the RB from
the rear of the goats, was within the previously reported range (2.4 to 4.0 s) by Caja et al.
(1996) for boluses administered to dairy sheep, and in a similar milking parlor. On the
contrary, ET2 average unitary reading time was lower than that obtained for RB (P <
0.001; Table 5.3). Similarly, low unitary reading times of electronic ear tags (1.9 to 2.8 s)
were reported in dairy sheep read from the front in the milking parlor, as the transponder
was quickly localized by sight (Caja et al., 1996).
As previously explained, in the case of RB, potential crossed reading of the bolus in
the adjacent goat to the left might occur when the boluses were not located in the
reticulum but in the rumen. For this reason, readings were performed starting from the left
side of each stall, in order to minimize the possibility of crossed readings with
transponders not read (corresponding to the contiguous goat to the right). As already
mentioned in the material and methods section, this detail is of major relevance as current
commercial transceivers can be configured so that no duplicate readings are registered in a
reading session; thus, if the goat to the left was wrongly read, the transceiver’s screen
would display that the transponder had already been registered. In such an event, the
operator would only have to perform a new reading attempt of the transponder expected to
be registered. In this regard, 2 such cases were observed in our experiment, representing
0.3% of overall bolus readings. As anticipated, no crossed reading with goats to the right
in the milking parlor occurred. Crossed readings might also occur if intending to read a
goat which had lost the rumen bolus.
In addition to crossed readings, in 3 (0.4%) cases the transceiver was unable to read
the RB after having the electromagnetic field activated for 2 s (as previously configured in
the transceiver settings); in these cases, successful readings were accomplished at the
second reading attempt. Ait-Saidi et al. (2008) indicated 0.6% of reading errors in similar
experimental conditions when carrying out semi-automated milk recordings, although the
nature of these reading anomalies was not specified. In our work, the aforementioned
reading methodology and transceiver configuration to avoid duplicate recording,
prevented mistaken assignation of the transponder to a different goat; in such conditions,
reading errors only caused an increment in the average reading time required per goat.
71
Chapter 5
5.4.4. Dynamic reading efficiency of leg tags and rumen boluses
Results of dynamic reading performance of RB and ET2 in a runway, according to the
position of the frame antenna, are shown in Table 5.4. The speed of passage of goats
through the runway was lower (P < 0.05) when goats were forced to pass through the
antenna, as goats tended to slow down just before crossing it. Nevertheless, the speed of
passage was in all cases lower than 1 goat/s, which agrees with conditions for proper
dynamic reading according to previous reports (JRC, 2003; Ghirardi et al., 2006b). Goats
in our study wore both RB and ET2 transponders (estimated distance between
transponders 30 cm), which led to the worst condition possibly faced when reading herds
identified with several types of RFID devices. In such conditions, the incidence of reading
collisions due to the presence of more than 1 transponder at a time inside the
electromagnetic field generated by the transceiver were maximized; this fact was expected
to cause an increment of transponder’s reading failures.
Results of dynamic reading efficiency according to the position of the frame antenna
in the runway (Table 5.4) showed that the greatest reading efficiency was obtained with
RB read with the antenna located laterally to the left of the runway. The following best
efficiencies were obtained with RB when goats had to pass through the antenna, as well as
for ET2 read with the antenna placed on the floor. According to our results, no antenna
location offered maximum reading performance for both types of devices. In fact, the best
antenna position for ET2 reading was likewise the worst option for proper RB reading.
These findings should be taken into account if dealing with goat herds where different
RFID devices are in place, as allowed by current Europe regulations (EC 21/2004 and EC
933/2008).
As anticipated, the reading collision reported in our experiment reduced the reading
efficiency of devices, when compared to previous studies with sheep identified with
standard-sized electronic boluses, and under similar reading conditions, in which average
dynamic reading efficiencies > 99% were obtained (Ghirardi et al., 2006b). Likewise, the
only reference available, to our knowledge, on the dynamic reading efficiency of rumen
boluses by using a frame antenna located on the floor of a runway (no details available on
the transceiver technical features) yielded 74.2% (MAPA, 2007), which is higher than the
value obtained in our study.
72
Leg tags for identification of dairy goats
Table 5.4. Dynamic reading efficiency1 (DRE) of electronic rumen boluses and button
transponders attached to leg tags in dairy goats (values are least squares means ± SE),
according to the position of the transceiver’s antenna2,3
RB ET2
Antenna position Passage speed,
goats/min n DRE, % n DRE, % P <
Lateral
Floor
Passing through
54 ± 3.7a
49 ± 3.2a
40 ± 3.1b
495
495
363
95.2 ± 1.7a
16.0 ± 1.3b
93.0 ± 1.9a
525
525
385
68.2 ± 3.4c
92.4 ± 1.9a
83.4 ± 1.5b
0.001
0.001
0.001
a,bWithin a column, values with different superscripts differ (P < 0.05). 1Using a frame antenna (94 × 52 mm; Tiris, Almelo, The Netherlands) connected to an F-210 portable stationary transceiver (Rumitag, Esplugues de Llobregat, Barcelona, Spain), in goats passing through a runway (width, 50 cm); DRE = (no. read devices/no. readable devices) × 100. 2Devices: RB = ceramic-made rumen bolus (weight, 75 g; length × o.d., 68 × 21 mm; encasing a 32-mm half-duplex glass-encapsulated transponder ; Rumitag); ET2 = half-duplex button transponder (weight, 5.5 g; o.d., 25 mm; Rumitag) attached to a leg tag. 3Reading sessions carried out in groups of 22 to 35 goats.
With regard to the performance of transponders attached to leg tags, no literature on
their dynamic reading efficiency is available. Nevertheless, an average dynamic reading
efficiency of 99.7% has been reported when using 15-mm transponders injected in the
foreleg pastern of Murciano-Granadina adult goats and the tranceiver’s antenna placed on
the floor (MAPA, 2007).
In our study, only RB read with the lateral antenna reached the 95% minimum
dynamic reading efficiency recommended by MAPA (2007) for sheep and goat ID on
field conditions. This recommended minimum value allows > 99.7% readability of
electronic devices when 2 consecutive readings of the same herd are performed and the
obtained ID data files are combined. For LT and RB in our study, final readability values
of 99.4 and 99.8% would be obtained if 2 consecutive readings were performed with the
antenna placed on the floor or laterally, respectively.
73
Chapter 5
74
5.5. CONCLUSIONS
Leg tags in the hind leg of adult goats offered a suitable (> 98%) visual and electronic
readability, if adequate button transponders are used. Nevertheless, both design and inner
circumference of fastened leg tags should be evaluated in thorough detail to avoid limping
and prevent other derived damages. This is also the case of early leg tag application in
replacement stock. In this study, standard-sized rumen boluses and electronic ear tags did
not reach the recommended readability (> 98%) for official identification of goats as a
consequence of losses, which should be reduced.
CHAPTER 6
Experiment 4: Modeling the retention of electronic
rumen boluses in goats
Modeling rumen bolus retention in goats
CHAPTER 6
Experiment 4: Modeling the retention of rumen boluses for the electronic
identification of dairy goats
6.1. ABSTRACT A regression model of the retention of rumen boluses in the reticulorumen of goats was constructed. With this aim, 2,482 boluses were administered to goats from dairy (Murciano-Granadina, n = 1,326; Alpine, n = 381) and meat (Blanca de Rasquera, n = 532) breeds. A total of 19 bolus types made of different materials (ceramic, plastic tubes filled with concrete and silicone, and ballasts) were used, thereby obtaining a wide variation in bolus features: o.d. (9 to 22 mm), length (37 to 84 mm), weight (5 to 111 g), volume (2.5 to 26 mL), and specific gravity (SG; 1.0 to 5.5). Each bolus contained a half-duplex glass encapsulated transponder (32 × 3.8 mm), and was administered using adapted balling guns. Goats also wore 2 visual plastic ear tags: V1 (double flag, 5.1 g), and V2 (flag-button, 4.2 g). Bolus and ear tag retention (retained/monitored × 100) was recorded for at least 1 yr. Dynamic reading efficiency (dynamic reading/static reading × 100) was also evaluated from a total of 1,496 bolus readings. No administration incidents or apparent behaviour and performance alterations were observed for any bolus type. Static reading efficiency of retained boluses was 100%, except for the prototypes with metal ballasts, which yielded a 93.3% reading efficiency. Retention of metal-ballasted boluses was confirmed using x-ray equipment. Excluding ballasted boluses, a 99.5% dynamic reading efficiency was obtained. Ear tag losses were 6.5 for V1 and 3.7 % for V2, ranging from 3.2 to 7.8% depending on ear tag type and goat breed. Bolus retention varied (0 to 100%) according to their physical features. Obtained data allowed the fitting of a logistic model of bolus retention rate according to bolus volume and weight (R2 41 = 0.98); the SG was implicitly considered. Inclusion of literature data was discarded as it caused overestimation of retention values when compared to the original model. Estimated weight and SG to produce mini- (5 mL), medium- (15 mL) and standard-sized (22 mL) boluses for 99.95% retention rate in goats were 42.9, 73.0, and 94.1 g, and 8.58, 4.87, and 4.28, respectively. In conclusion, increase of specific gravity was fundamental to optimize bolus retention and reduce bolus size in goats. Mini-boluses are not recommended, as no available radio translucent materials reach the required SG. By contrast, medium-sized boluses (10 to 15 mL; SG 5.9 to 5.2) to be administered at early ages and efficiently retained in adult goats could be produced.
6.2. INTRODUCTION
During the last decades, a number of passive radiofrequency identification (RFID)
devices have been tested to electronically identify domestic ruminants, including
injectable transponders in different body locations (Fonseca et al., 1994; Lambooij et al.,
1999), ear tags (Schuiling et al., 2004; Carné et al., 2009a), rumen boluses (Caja et al.,
75
Chapter 6
1999a; Fallon et al., 2002; JRC, 2003), and leg bands (Abecia et al., 2009; Carné et al.,
2009c, 2010). In the case of rumen boluses, these have proved to be easily administered
and show a suitable long-term retention when properly designed and administered in sheep
and cattle (Hasker and Bassingthwaighte, 1996; Teyssier et al., 2003; Ghirardi et al.,
2006a,b). In this sense, small-sized boluses (5 to 6.5 mL) have been successfully used to
permanently identify lambs at early ages (Garín et al., 2005; Ghirardi et al., 2007).
A relationship between physical features of boluses and their retention rate in the
reticulorumen has been pointed out by different authors (Ribó et al., 1994; Caja et al.,
1999a; Fallon, 2001). More recently, the possibility of satisfactorily predicting the
retention of boluses according to their physical features in both cattle and sheep has been
described (Ghirardi et al., 2006ab).
In agreement with provisions of current European regulations on sheep and goat
identification and registration (EC 21/2004; EC 1560/2007; EC 933/2008), RFID rumen
boluses have been used in Spain since 2006 as the electronic device (Real Decreto
947/2005). Nevertheless, retention rate of boluses in Spanish goat breeds has come to be
noticeably lower than in sheep, especially in the case of dairy breeds (JRC, 2003; MAPA,
2007; Carné et al., 2009a). It has been suggested that feed management, as well as goat
mature size and breed, affect bolus retention rates (MAPA, 2002; Capote et al., 2005;
Carné et al., 2009ab).
The objective of this study was to establish a regression model of the retention of
rumen boluses in goats, mainly of dairy purpose, according to bolus physical features.
Ultimately, results must enable the design of boluses which optimize their retention rate in
any goat breed and under different production systems.
6.3. MATERIALS AND METHODS
Animal care conditions and management practices followed procedures stated by the
Ethical Committee of Animal and Human Experimentation of the Universitat Autònoma
de Barcelona, and the guidelines of the Spanish Committee on Animal Electronic
Identification (MAPA, 2007).
76
Modeling rumen bolus retention in goats
6.3.1. Animals and management
A total of 2,239 adult goats from 3 breeds (dairy purpose: Murciano-Granadina, n =
1326; and French Alpine, n = 381; meat purpose: Blanca de Rasquera, n = 532) were used.
The Murciano-Granadina goats in Catalonia (Spain) belonged to 4 commercial farms
(Tona, Barcelona, n = 274; St. Vicenç de Castellet, Barcelona, n = 291; Juneda, Lleida, n
= 410; and Terradelles, Girona, n = 239) and 1 experimental farm (S1GCE, Serveis de
Granges i Camps Experimentals, Universitat Autònoma de Barcelona, Bellaterra,
Barcelona, n = 112). The Murciano-Granadina goats from the commercial farms were
managed under intensive conditions, being kept indoors and fed hay and concentrate. In
the case of the S1GCE experimental farm, goats additionally grazed 5 h a day (1000 to
1500 h) on cultivated Italian ryegrass pasture. In all cases, does were milked once daily in
the morning (0700 to 1100 h). The Alpine goats belonged to one commercial farm
(Villarcayo, Burgos, Spain) managed similarly to the Murciano-Granadina commercial
farms, although in this case does were milked twice daily (0630 and 1730 h).
The Blanca de Rasquera goats, a local Catalan breed highly rustic and intended for
meat production (Carné et al., 2007), belonged to 1 commercial farm (Horta de Sant Joan,
Tarragona, Spain), and were managed in a semi-extensive production system, grazing 8
h/d (1000 to 1800 h) on Mediterranean forest range lands. Kidding does were
supplemented with alfalfa hay and concentrate in the shelters.
All goats from the S1GCE experimental farm that died or were culled during the
experiment were sent to the Pathology Service of the Universitat Autònoma de Barcelona
for necropsy.
6.3.2. Visual ear tags
The Murciano-Granadina goats were individually identified with either 2 types of
official plastic ear tags: V1, double flag type (weight, 5.1 g; flag piece dimensions, 37 ×
39 mm; Rumitag, Esplugues de Llobregat, Barcelona, Spain), and V2, flag-button type
(weight, 4.2 g; flag piece dimensions, 38 × 40 mm; Azasa-Allflex, Madrid, Spain). All
goats born after July 2005 wore V1 in the right ear, according to currently deployable
European regulations in this regard. For goats born before July 2005, V2 were applied in
the right ear, in agreement with the former European and Spanish regulations on livestock
77
Chapter 6
ID (Directive 92/102/EEC; Real Decreto 205/1996), placing the button piece in the inner
face of the ear. The Blanca de Rasquera goats were visually identified with either V1 or
V2 official ear tag types in a similar way to that detailed for the Murciano-Granadina
goats.
The Alpine goats had been brought from different French farms 2 yr before and
maintained their official ID consisting of 1 official flag-flag plastic ear tag in each ear.
6.3.3. Rumen boluses and administration procedures
A total of 2,482 boluses, belonging to 19 different prototypes and commercial devices,
and varying in their physical features (length, o.d., volume, weight, and specific gravity
[SG]) were used (Table 6.1). Administration of boluses with extremely different physical
features was expected to result in a wide range of retention rate values, thereby allowing
the build up of a regression model of bolus retention in the reticulorumen of goats
according to bolus features.
Eleven bolus types were cylindrical devices made of non-porous dense ceramic
materials, of which 3 were commercial devices for ruminant electronic identification, and
the remaining 8 were specially made prototypes. Four more boluses consisted of
cylindrical capsules made of plastic tubes that contained small sized boluses, filling
materials (silicon, concrete, or metal ballasts), and were eventually sealed with epoxy
resin. The remaining 4 bolus types consisted of ceramic prototypes with stainless steel
ballasts attached to one end in order to increase the SG.
A random sample of 10 boluses of each type (n = 190) was collected to measure their
physical features under laboratory conditions using a precision weighing scale (accuracy,
0.01 g; BP 3100 P, Sartorius AG, Goettingen, Germany) and an electronic digital calliper
Bolus retention data were analyzed with a nonlinear least squares regression model,
using the NLIN procedure of SAS v.9.1 (SAS Inst. Inc., Cary, NC) and assuming a
logistic distribution, as previously carried out in beef cattle and sheep (Ghirardi et al.,
2006ab). The final model included the weight (W) and volume (V) of boluses as
independent covariates:
A y =
1 + b 0 · e –(b1
· W + b2
· V)
being: y, the bolus retention rate (response variable); b0, b1, and b2, the regression
coefficients; and A, the maximum value of bolus retention rate expressed as a percentage
(A = 100). The WEIGHT statement of SAS was used to allow for a weighted regression
according to the number of boluses of each type evaluated.
Retention rate of ear tags was analyzed with the CATMOD procedure of SAS, and a
Logit model with an estimation method of maximum likelihood (Cox, 1970) was used.
Effects evaluated were breed (Murciano-Granadina and Blanca de Rasquera) and ear tag
type (V1 and V2). The CATMOD procedure was also used to analyze the bolus dynamic
reading efficiency, evaluating the effects of bolus type, goat breed, and herd.
In all cases, significance was declared at P < 0.05 and variables that were not
significant (P > 0.20) were removed from the final models.
6.4. RESULTS AND DISCUSSION
6.4.1. Features of boluses, and administration and reading performances
Features of each bolus type are detailed in Table 6.1. For practical purposes, boluses
used in this study were divided into 3 categories according to their volume: small-sized
(2.7 to 7.2 mL), medium-sized (11.6 to 15.4 mL) and standard-sized boluses (18.1 to 26.0
mL). With regard to their dimensions, boluses ranged from 37.4 to 83.8 mm in length and
9.3 to 22.1 mm in o.d. Boluses also varied in weight, ranging from 5.3 to 110.8 g, as well
as SG, ranging from 1.0 to 5.5. Prototypes with attached stainless steel ballasts were not
81
Chapter 6
cylindrical, as the ballast was a ball and had a larger o.d. than the body of the bolus. A
total of 7 bolus types in our study (#2, 3, 4, 9, 12, 14 and 15; Table 6.1) have already been
tested in fattening lambs and adult sheep (Teyssier et al., 2003; Garín et al., 2005; Ghirardi
et al., 2006b, 2007).
No incidences at bolus administration were reported for any of the bolus types.
Moreover, an extra large bolus prototype (#10, 26 mL), which had never been tested in
small ruminants, was easily and safely administered to goats in our experiment. These
findings confirm earlier results in sheep and goats where 22-mL boluses were safely
administered by trained operators to adult sheep and goats (Caja et al., 1999a; Ghirardi et
al., 2006a; Carné et al., 2009b) as well as to replacement sheep and goats with BW greater
than 30 and 25 kg, respectively (Caja et al., 1999a). No casualties registered during the
study appeared to be related to bolus administration or their long-term location in the
reticulorumen; moreover, no necropsy reports of dead goats from the experimental farm
indicated any damage caused by the bolus, and in all cases the bolus was properly located
in the reticulorumen.
Retained boluses could be easily read in static conditions in the shelters and the milking
parlor by using handheld readers, except for the prototypes with metal ballasts. In these
last cases, several reading attempts were frequently necessary probably due to
interferences in the signal emitted by the transponder. In fact, proper retention of 8 of
these ballasted boluses had to be confirmed at the end of the study by using portable X-ray
equipment (Model X803G, MinXray Inc., Northbrook, IL, USA).
Nedap Agri, from The Netherlands, developed RFID boluses made of plastic with steel
ballasts attached to one end; these ballasts increased the SG and allowed a swift
submersion through the rumen content (Fallon, 2001). Nevertheless, the body of the bolus
encased larger transponders to compensate for poor reading performance due to
interferences caused by the metal ballast. The use of this sort of device, with SG up to
2.75, has been described in sheep (Caja et al., 1996) and cattle (Lambooij et al., 1999;
Fallon et al., 2002).
With respect to dynamic reading efficiency, boluses with attached metal ballasts were
not taken into account as unsuitable reading performance was anticipated. A total of 1,496
bolus readings were carried out, with the goats passing in front of the frame antenna at a
speed of up to 2 goats/s. At the end of the study, 8 reading failures were registered,
thereby obtaining a reading efficiency under dynamic conditions of 99.5%. Moreover, no
82
Modeling rumen bolus retention in goats
differences according to bolus type, goat breed or herd could be established. Similarly,
Pinna et al. (2006) reported bolus dynamic reading efficiency greater than 99.7% in Sarda
goats, using similar HDX transponders. Readabilities greater than 99.5% were also
described by using both mini- (3 to 5 mL) and standard-sized (22 mL) boluses in different
meat and dairy sheep breeds (Ghirardi et al., 2006b). No bolus or herd effect were detected
either in this case.
Figure 6.2. X-ray images of ballasted and ceramic standard-sized boluses located in the
reticulorumen of adult Murciano-Granadina dairy goats.
6.4.2. Bolus retention and regression model
Retention of the different bolus types is shown in Table 6.1. Retention rates ranged
from 0 to 100% (P < 0.001) as anticipated according to the variety of bolus features, and
previous research in sheep and cattle (Ghirardi et al., 2006a,b). The lowest retention rates
(< 3.8%) were obtained for the bolus types #1, 5 and 8, which varied in weight (5.3 to 46.2
g) and volume (5.2 to 22.2 mL), but with SG < 2.2. On the contrary, the greatest retention
rate values (100%) were observed with bolus types #6, 10, 18 and 19, which corresponded
to a wide range of weights (35.5 to 110.8 g) and volumes (7.2 to 26.0 mL), although with
SG > 4.1. Thus, SG appeared to be of major relevance for bolus performance according to
retention results. Only the 4 bolus types where no losses occurred were above the ICAR
retention requirement for animal ID (> 98% at 1 yr after administration; ICAR, 2007).
At the end of the study, 2,299 boluses (92.6%) had been monitored for at least 1 yr,
which corresponded to 1,398 (60.8%) Murciano-Granadina, 394 (17.1%) Alpine, and 507
83
Chapter 6
(22.1%) Blanca de Rasquera goats; these boluses made up the dataset utilized to assess the
regression model. Different parameters (weight, volume, SG, length, and o.d.) were
evaluated to properly estimate bolus retention rate according to their physical features.
Results obtained proved that a logistic model taking the weight and volume of boluses as
covariates offered the greatest adjustment (R2 = 0.98; P < 0.001), as similarly indicated
previously by using analogous models for sheep and beef cattle (Ghirardi et al., 2006ab).
It bears mentioning that when considering weight and volume, SG was being implicitly
considered as well. The equation of the model estimating the percentage of retention rate
in goats according to bolus weight and volume was as follows:
100 Retention rate (%) = (1)
1 + 0.734 · e 0.788 · V – 0.262 · W
Figure 6.3. Bolus retention rates (%) according to their weight (W, g) and volume (V,
mL) in goats under on-farm conditions (●, small size boluses: 2.7 to 7.2 mL; ○, medium
size boluses: 11.6 to 15.4 mL; ♦, standard and large size boluses: 18.1 to 26.0 mL). Lines
are the estimated retention rates for different bolus volumes according to the logistic
regression (equation 1 aforementioned).
0
10
20
30
40
50
60
70
80
90
100
0 10 20 30 40 50 60 70 80 90 100 110
Weight, g
Ret
enti
on r
ate,
%
2.7 to 7.2 mL 11.6 to 15.4 mL 18.1 to 26.0 mL
84
Modeling rumen bolus retention in goats
85
Factual retention data and estimated retention curves according to the different bolus
volumes are shown in Figure 6.3. As can be observed, for any given bolus volume,
retention rate increased when weight and SG increased. In contrast, increasing the bolus
weight while maintaining the SG invariable, only offered a moderate improvement of the
retention rate. It was also confirmed that suitable retention of small boluses is feasible if
appropriately designed; as previously indicated in sheep and cattle, a reduction in bolus
size not affecting the retention performance can be accomplished by increasing the SG
(Garín et al., 2005; Ghirardi et al., 2006ab).
0
10
20
30
40
50
60
70
80
90
100
0 10 20 30 40 50 60 70 80 90 100
Observed, %
Pre
dict
ed, %
0
10
20
30
40
50
60
70
80
90
100
0 10 20 30 40 50 60 70 80 90 100
Observed, %
Pred
icte
d, %
Figure 6.4. Comparison of observed and estimated values of bolus retention rate in goats
(SEM = 2.4)
Error of the estimated retention averaged 2.4 units of percentage (Figure 6.4), being
greater than those reported in sheep (1.3) and cattle (1.5) by Ghirardi et al. (2006ab).
Greater error in our study may be explained by the larger number of boluses tested and the
lower bolus types with 100% retention rate with respect to the aforementioned works. In
addition, and unlike other goat breeds, some Spanish dairy breeds have shown a great
variability in bolus retention rates (MAPA, 2002, 2007; Carné et al., 2009a). In fact, it has
been suggested that breed and management conditions affect bolus retention in goats
Chapter 6
(JRC, 2003; Capote et al., 2005; Carné et al., 2009ab).Taking into account this variability,
the construction of the model was aimed at obtaining devices with optimum retention rates
irrespective of breed and management, rather than estimating the most representative
mean retention in the goat species. For this reason, more than 60% of boluses included in
the model belonged to Murciano-Granadina Spanish dairy goat, which has been indicated
to show a wide range of retention values, generally being poorer than in other breeds
evaluated (MAPA, 2002, 2007; Capote et al., 2005; Pinna et al., 2006); concentrate-based
and small particle sized total mixed rations commonly used in Murciano-Granadina goats
have been suggested to affect bolus retention (Carné et al., 2009a).
In a subsequent step of our study, available literature referred to the medium and long-
term (> 8 mo) bolus retention in goats was joined to the model (Caja et al., 1999a; JRC,
2003; Capote et al., 2005; San Miguel et al., 2005; Pinna et al., 2006; MAPA, 2007; Carné
et al., 2009a,b). In this case, the regression coefficients obtained were: b0 = 0.832, b1 =
0.255, and b2 = −0.715. Results with our observed data tended to be more conservative
than those obtained when including literature data, that is, estimation curves with our data
were displaced to the right, thereby indicating that greater weight and specific gravity are
required to reach the desired bolus retention.
Hereinafter, to facilitate the presentation of results and their subsequent discussion,
reference will be made to the volumes of 5, 15 and 22 mL, which were chosen as
representative of commercially available mini-, medium-, and standard-sized boluses,
respectively. In this sense, differences between the 2 produced models were greater when
dealing with large volumes. Thus, average differences of estimated retentions including or
not including the literature data were 1.7, 4.3 and 6.3% for 5, 15 and 22 mL volumes,
respectively. Nevertheless, when focusing on critical retention > 98% indicated by the
ICAR (2007), these differences were reduced to 0, 0.3 and 0.6% for the same volumes
considered. In view of the low variability between the 2 models for retention rates close to
100%, and the more strict requirements of our data to design boluses with optimum
retention, it was concluded that the model obtained with our observed data was more
suitable for the purpose of this work.
In the present study, taking into consideration the unfavorable scenario of bolus losses
previously reported in goats, we decided to evaluate results for a retention rate of 99.95%,
thereby being even more stringent with bolus requirements. Hence, the previous equation
86
Modeling rumen bolus retention in goats
(1) was rearranged and 2 new equations were obtained, which allowed the assessment of
the estimated weight, volume and SG of boluses for their optimum retention in goats:
W = 27.83 + 3.01 · V (2)
SG = 27.83 / V + 3.01 (3)
According to these equations, the minimum weight and SG to obtain the desired
retention of small (5 mL), medium (15 mL), and standard size (22 mL) boluses were: 42.9
g (SG = 8.58), 73.0 g (SG = 4.87) and 94.1 g (SG = 4.28), respectively. Before comparing
our results with those obtained in the sheep and beef cattle models (Ghirardi et al.,
2006ab), it should be pointed out that volume and weight coefficients in the published
equation of the sheep model (Ghirardi et al., 2006b) were interchanged.
For an estimated retention of 99.95%, minimum bolus weight and SG in sheep were:
22.9 g (SG 4.57) for 5-mL boluses, 38.0 g (SG 2.53) for 15-mL boluses, and 48.6 g (SG
2.20) for 22-mL boluses. In the case of cattle, estimated weight and SG for the same
volumes were 58.1 g (SG 11.6), 74.8 g (SG 4.99), and 86.5 g (SG 3.93), respectively. It is
remarkable that values in goats approximately doubled those in sheep, which makes
evident the differences between species regarding the retention performance of boluses.
On the contrary, differences between goats and cattle were much lesser, although they
varied considerably depending on the dimensions of the bolus.
Figure 6.5 summarizes the results obtained in our study, showing the variety of
combinations of weight, volume and SG that would allow producing boluses with an
optimum retention rate (99.95%). From a view of designing boluses for an optimum
retention and also of allowing the administration at early ages, the use of high dense
boluses with reduced volume is required (Garín et al., 2005; Fallon, 2001; Ghirardi et al.,
2006ab). As radio frequency translucent materials are necessary, dense ceramic materials
are being used at present for this purpose, and boluses with SG up to 4.1 have been
produced. Yet, estimated SG for mini-boluses (e.g. 5 mL of volume) to be retained in
goats is greater than 8.5. Therefore, as long as currently utilized materials do not allow
such high SG values to be reached, the use of mini-boluses for goat ID should be
discarded. Unsuitability of mini-boluses for goat ID has already been pointed out in earlier
reports (Carné et al., 2009ab); this is a major difference between sheep and goats as mini-
boluses with SG greater than 3.5, and more than 15 g of weight, have been successfully
used (retention > 98%) for permanent sheep ID (Teyssier et al., 2003; Ghirardi et al.,
87
Chapter 6
0
20
40
60
80
100
120
0 5 10 15 20 25 30 35
Bolus volume, mL
Bol
us w
eigh
t, g
SG = 4
SG = 6
RR >99.95%
SG = 3
SG = 7
SG = 5
2006b, 2007; MAPA, 2007). Results of the present work indicate the need for a SG
between 4.9 and 5.8 to produce medium sized boluses (e.g. 10 to 15 mL of volume) which
can be properly retained in goats; available radio translucent materials could be
successfully used nowadays to obtain boluses with such required physical features.
Figure 6.5. Bolus weight and volume combinations that allow a retention rate (RR)
greater than 99.95% (grey zone) according to bolus specific gravity (SG) in goats on farm
conditions.
6.4.3. Ear tag retention
Performance of visual plastic ear tags is shown in Table 6.2. Damages by biting and
breakage of the flag pieces were greater (P < 0.05) in V2 than in V1 ear tags, and a breed
effect was also observed in V2. Most damages registered in this last ear tag type were due
to the breakage of the flag piece, thus obtaining button-like ear tags; the breakage of flag
pieces in V2 seemed to be caused by a too weak insertion of the flag piece to the ear tag
body. As only lost devices were replaced by the veterinary officials during the annual
blood sampling campaigns (Carné et al., 2010), yearly incidence of such breakages was
not established. These findings may be of relevance for V2 retention as button-button
88
Modeling rumen bolus retention in goats
RFID ear tags have been indicated to offer greater long-term retention rates than flag types
(Carné et al., 2009a). Retention rate varied among herds (92.2 to 98.0%), although only a
tendency of difference (P < 0.1) was detected for the V2. Moreover, retention of V2 was
numerically greater than V1 in the 2 goat breeds evaluated, even though only the retention
of V1 in Blanca de Rasquera and V2 in Murciano-Granadina goats differed (92.2 vs.
96.8%, respectively; P < 0.05). Despite the fact that literature in this regard is limited,
losses in our study remained within the wide range of 1.4 to 17.1% reported in different
goat breeds (Carné et al., 2009ab). Yet, visual ear tag retention values in our results did
not meet the ICAR recommendations (> 98%) for official animal ID (ICAR, 2007).
Table 6.2. Performance of visual plastic ear tags in Murciano-Granadina (dairy) and
Blanca de Rasquera (meat) goat breeds at 1 yr of study.1
Murciano-Granadina Blanca de Rasquera Overall
Item V1 V2 V1 V2 V1 V2
Ear tags, No.
Damaged2, %
Lost, %
Retention rate, %
168
3.0a
4.8
95.2ab
502
13.7b
3.2
96.8b
218
4.1a
7.8
92.2a
276
21.7cx
4.7
95.3ab
386
3.6a
6.5
93.5a
778
16.6bcy
3.7
96.3b
a,bWithin a row, values with different superscripts differ (P < 0.05). x,yWithin a row, values with different superscripts tended to differ (P < 0.1). 1Abbreviations: V1, double flag type, 5.1 g, 37 × 39 mm flag dimensions (Rumitag, Esplugues de
Llobregat, Spain); V2, flag-button type, 4.2 g, 38 × 40 mm flag dimensions with the button piece
placed on the inner side of the ear (Azasa-Allflex, Madrid, Spain). 2Ear tags with apparent signs of damage caused by biting or breakage of the flag pieces but still
readable.
6.5. CONCLUSIONS
Features of boluses affect their retention in the reticulorumen of goats. Moreover,
boluses need to be heavier and with greater SG than in sheep and cattle. Mini-boluses
similar to those used in sheep are not recommended in goats. On the other hand, medium
size boluses (10 to 15 mL) with SG of 4.9 to 5.8 could be successfully produced with
radio translucent materials for their efficient retention in the reticulorumen of goats,
thereby giving response to the current problem of using proper boluses for goat
2Hand made prototype consisting of a plastic tube filled with silicone and sealed with epoxy resin. 3Specially made prototype.
4Hand made prototype consisting of a plastic tube containing a type 4 ceramic bolus, filled with
silicone (type 5) or concrete (type 8) and sealed with epoxy resin. 5Hand made prototype consisting of a type 4 ceramic bolus with a stainless steel ballast (type 6:
16.7 g; type 10: 32.8 g) attached.
6Standard commercial bolus (Innoceramics, Teramo, Italy). 7Standard commercial bolus (Allflex, Vitré, France). 8Standard commercial bolus (Rumitag, Esplugues de Llobregat, Spain). 9Hand made prototype consisting of a type 15 bolus with a stainless steel ballast (30.5 g) attached,
and a thermo-retractile plastic cover.
10SG = specific gravity. 11Animals which died or left the study before 1 yr after bolusing.
91
CHAPTER 7
Electronic identification of goats: State of the art
State of the art of goat RFID
CHAPTER 7
Electronic identification of goats by using radio-frequency devices: State of the art
7.1. ABSTRACT The use of passive radio frequency (RFID) technology for goat identification has become a key issue in recent years, especially in the European Union, where its compulsory use in sheep and goats is regulated. This paper reviews research carried out so far on the use of ear tags, injectable transponders, rumen boluses, and leg tags for goat identification, basing on their retention, readability, and retrieval easiness. The healing process of ear tags is conditioned by ear tag features and the biocompatibility of making materials. Moreover, ear tag retention is highly variable, in most cases not reaching the long-term (12 mo) readability of at least 98% required by the International Committee of Animal Recording. Button ear tags have been suggested to offer suitable readability, and are regarded for official use in different official programs. The subcutaneous injection of encapsulated transponders in different body locations has also been evaluated, mainly focusing on readability and migration results. Injection in the armpit offers the greatest readability in goats, although it is subjected to the greatest migration rates. Injection in the extremities has also been considered, although smaller transponders are used in this case, thereby compromising their reading distance. The main drawback of injectable transponders is their deficient retrieval at slaughter. The retention of rumen boluses has shown a remarkable variability in goats, and the influence of breed and feeding management on losses has been suggested. Most studies have indicated lower retention rates in goats than in other ruminant species. Even though, a regression model of bolus retention according to bolus weight and volume has been proposed, similarly to previous models established for sheep and cattle. According to this model, especially heavier and denser boluses are required in the case of goats to ensure that the device is permanently retained. Considering radio translucent materials currently available, suitable boluses for goat identification can be efficiently produced. Different RFID leg tags have also been proposed, especially for dairy goats in the milking parlor. The proper circumference of the leg band is recognized as a key aspect to be studied in this case as it seriously conditions the identification at early ages, while preventing the unlawful removal during the goat lifespan. Electronic readability of leg tags is greatly influenced by the type of transponder.
7.2. Introduction
The different episodes of animal disease outbreaks (Transmissible spongiform
encephalopathies, scrapie, foot-and-mouth disease, swine flu, etc), food-borne diseases, as
well as the detection of certain forbidden or improperly used substances in the food chain,
have increased the public concern about the safety of products intended for human and
livestock consumption (McKean, 2001; Pettitt, 2001). Moreover, these episodes made it
93
Chapter 7
evident that livestock identification (ID) and traceability, as well as the origin of their
derived products, were seriously compromised by animal ID systems in place at that
moment.
Regarding goats, these concerns have become an issue of particular interest since the
publication of recent European regulations on the identification and registration of sheep
and goats (EC 21/2004; EC 933/2008). These regulations lay down the compulsory use of
a double ID system for replacement sheep and goats, consisting of 1 visual and 1 radio
frequency identification (RFID) device. Ear tags, rumen boluses, and marks on the pastern
(injects or leg bands) are the devices accepted for official use, each Member State being
entitled to choose the ID device to be officially used. In the case of goats, the possibility of
using such variety of ID methods is caused, to a great extent, by the greatly variable
results obtained in the different experiments carried out up to present (Schuiling et al.,
2004; Pinna et al., 2006; Carné et al., 2009a); this variability is even more remarkable in
the case of boluses, as devices successfully used for sheep ID seem not to be adequate for
the efficient ID of some goat breeds (JRC, 2003; Capote et al., 2005; MAPA, 2007).
In the United States, visual ear tags have been broadly used within the frame of goat
health surveillance programs (CFR, 2008), although RFID ear tags are recommended for
the current deployment of the National Animal Identification System (NAIS); even so, the
use of alternative devices is also under study for the cases where poor performance of ear
tags occurs (USDA, 2006c).
At this point, a general discussion on the performance of RFID devices used in goats
needs to be addressed. To our knowledge, the only review on goat RFID was published
more than 13 years ago (Caja et al., 1997), which justifies a re-evaluation of this topic.
Thus, and taking into consideration the experience and improvements achieved in recent
years, this work was aimed at presenting the state-of-the-art of radio frequency technology
for the permanent and reliable identification of goats. As ear tags are still the ID method of
reference, a brief allusion is also made to available research projects on the feasibility of
visual ear tags in goats.
7.3. Visual ear tags
Available published data on the performance of visual ear tags in goats is summarized
in Table 7.1. Most of available literature corresponds to ear tags used within official
94
State of the art of goat RFID
disease control and eradication programs of dairy goats managed in intensive conditions
(Caja et al., 1999a,b; Carné et al., 2009a, 2010a,b), with retention and readability rates
highly variable (80 to 97%). On the other hand, Pinna et al. (2008) and Carné et al.
(2009b, 2010b) evaluated official and non-official ear tags in different goat breeds under
semi-extensive and extensive conditions, likewise obtaining a wide variation in their
retention rate (80.2 to 98.6%).
The performances of ear tags are mainly dependant on their losses, which are basically
due to tag breakage or ear splitting; however, a wide range (2.5 to 21.7%) of ear tag
damage has also been described (biting,…), which can seriously conditions the readability
of the printed code in the remaining ear tags, as well as causing breakages that may lead to
further losses (Carné et al., 2009a). Button devices have been suggested as being less
subjected to losses in intensively managed dairy goats (Carné et al., 2009a), although the
extent of influence of ear tag features on their performance remains to be thoroughly
studied.
In conclusion, visual plastic ear tags showed a great variability in their readability
rates, remaining in most cases under the 98% value recommended by the International
Committee for Animal Recording (ICAR, 2007). If the need of tamper-proof or tamper-
evident devices is also considered, the use of visual ear tags can not be recommended in
practice as the unique system for the deployment of official ID programs. Therefore, the
evaluation of alternative ID methods is required.
95
Chapter 7
Rea
dabi
lity,
%
93.
71
94.
01
80.0
85.2
82.9
94.0
96.9
82.9
98.6
88.7
91.7
97.0
92.2
95.3
95.2
96.8
Dam
aged
, %
―
―
―
―3
2.5
6.0
―
―
―
―
―
24.9
4.1
21.7
3.0
13.7
Los
t, %
6.3
1
6.0
1
20
.0
14
.8
14
.6
0
3.1
1
7.1
1.4
1
1.3
8.3
3.0
7.8
4.7
4.8
3.2
Tri
al d
urat
ion,
d
360-
1,08
0
1,08
0
Adu
lts2
360
360
360
360
540
Age
, d
120
Doe
s
Doe
s
90-1
50
1 1 Doe
s &
year
ling
s
Doe
s
Doe
s
Doe
s
Typ
e
Fla
g-bu
tton
“ But
ton-
butto
n
―
Tip
-tag
“ Fla
g-bu
tton
“ “ “ “ Fla
g-bu
tton
Fla
g-fl
ag
“ Fla
g-bu
tton
“
Dev
ices
ap
plie
d, n
16
67
2,
160
210
41
50
74
75
73
73
295
220
218
276
168
502
Pro
duct
ion
syst
em
Sem
i-in
tens
ive
Inte
nsiv
e
Ext
ensi
ve
Sem
i-in
tens
ive
Sem
i-in
tens
ive
Ext
ensi
ve
Ext
ensi
ve
Ext
ensi
ve
Inte
nsiv
e
Ext
ensi
ve
Inte
nsiv
e
Bre
ed
Mur
cian
o-G
rana
dina
Mur
cian
o-G
rana
dina
,
Mal
ague
ña, &
Fre
nch
Saa
nen
Sar
da
Mur
cian
o-G
rana
dina
Alp
ine
Ang
ora
Boe
r
Spa
nish
Ove
rall
Mur
cian
o-G
rana
dina
Bla
nca
de R
asqu
era
Mur
cian
o-G
rana
dina
Tab
le 7
.1. P
erfo
rman
ce o
f vi
sual
ear
tags
in g
oats
.
Ref
eren
ce
Caj
a et
al.
(199
9a)
Caj
a et
al.
(199
9b)
Pin
na e
t al.
(200
8)
Car
né e
t al.
(200
9a)
Car
né e
t al.
(200
9b)
Car
né e
t al.
(201
0a)
Car
né e
t al.
(201
0b)
1 Dam
aged
ear
tags
wer
e in
clud
ed.
2 Mon
itore
d at
the
milk
ing
parl
or w
hen
beco
min
g la
ctat
ing
does
. 3 O
ffic
ial e
ar ta
gs f
rom
the
AS
L (
Loc
al H
ealt
h C
entr
e).
96
State of the art of goat RFID
7.4. Electronic ear tags
Similarly to what may occur with visual ear tags (Johnston and Edwards, 1996;
Edwards et al., 2001), evaluating the healing process of the tagging wound of RFID ear
tags is of major relevance for their use in practice. Using design-improved devices in adult
and goat kids, Schuiling et al. (2004) indicated that nearly 70% of tag wounds were healed
after 2 mo in both kids and does. At 4 mo, close to 5% of ears in goat kids remained
unhealed, as well as 8.5% in does. At the end of the 8-mo study, ears not fully recovered
had been reduced to 1.7 and 2.7% for kids and does, respectively. No differences between
tag types were reported, although a herd effect was shown. The same ear tags were also
tested in sheep and the percentage of unhealed ears was 10 to 30% lower throughout the
study, with a final value at 8 mo close to 1% (Schuiling et al., 2004).
In dairy Murciano-Granadina goat kids of 3 mo of age, Carné et al. (2009a) pointed
out only 3.3% of infections by using flag-button and double button electronic ear tags.
Moreover, 90.2% of wounds were totally healed within 2 mo after tagging. Caja et al.
(1998a) indicated a high incidence of infections at the tagging point in sheep identified
with similar ear tags.
Schuiling et al. (2004) also evaluated the incidence of severe damage caused by the
tag pressing the ear, and at 1 mo after tagging they registered 4.0 and 23.6% of such cases
in goat kids and adult goats, respectively. At 4 mo, pressure wounds had remitted in young
goats whereas 6.3% of cases were still apparent in adult goats. Moreover, appearance of
new pressure wounds was observed in ears previously registered as fully healed (Schuiling
et al., 2004). Distance between coupled male and female pieces to allow the ear not to be
pressed is, therefore, of key relevance to prevent such cases, as well as to allow air
circulation and so favor wound healing (Bauer et al., 2009). This is mostly dependant on
the length of the tag’s tip to be inserted in the ear, and should be adequately fitted for the
large variability of ear thickness according to goat age and breed. In this regard, Spanish
regulations establish a minimum distance of 9.4 mm between the 2 pieces of fastened ear
tags (Real Decreto 1486/2009).
Problems with ear tag biocompatibility have also been suggested. Thus, 6.5% of tissue
reaction, irritation, and swelling, but without bleeding or pus, were registered in dairy
Murciano-Granadina goat kids tagged with flag and button devices (Carné et al., 2009a);
although observed signs remained apparent up to 3 months after tagging, wounds
97
Chapter 7
eventually healed and no relationship with subsequent retention performance could be
established.
With respect to the readability of RFID ear tags in goats, current information is
summarized in table 7.2. Schuiling et al. (2004) evaluated different ear tags (button and
flag types) in both kids and adult goats. They indicated an increase of losses in adult goats
(5.1%) compared to goat kids (1.5%), and an increase of electronic failures (1.6 vs. 0.5%),
thereby obtaining a final readability of 93.3 and 98.0%, respectively. In addition to the
influence of age, the authors registered a remarkable variability in losses (0 to 7.1%)
between herds under study, with an average retention of 96.6%. Moreover, they indicated
0 to 2.9% electronic failures according to herd, thereby obtaining an overall mean
readability of 95.5%.
Carné et al. (2009a) evaluated the readability of button-button and flag-button ear tags
for a period of nearly 3 yr in Murciano-Granadina goat kids identified at 3 mo of age. No
electronic failures were detected during the study, and at 1 yr of age no losses were
registered, obtaining a 100% readability. At 2 yr, factual readability of flag-button ear tag
was 93.9%. In this case, estimated readability by using a nonparametric survival analysis
was also obtained to allow including data from goats leaving the study before its
conclusion; estimated readability of flag-button tags was lower (79.8%) than factual value.
All tag losses were caused by breakage or unfastening of the ear tag as no split ears were
registered (Carné et al., 2009a). Moreover, 9.1% of ear tags showed biting damage, which
might prevent proper visual readability. On the contrary, readability of button-button
devices was 100%. Accordingly, button ear tags were recommended for long-term ID of
goats from early ages (Carné et al., 2009a). A different type of button ear tag was also
tested in this goat breed, and a readability of 95.7% was obtained at 1 yr (Carné et al.,
2010a). Furthermore, 2.1% transponders occasionally failed, which might be caused by
humidity filtration into the ear tag. No results on the performance of RFID ear tags at the
slaughterhouse are available.
Although improvements on ear tag features have been undertaken to optimize their
retention and readability, the need for considering alternative devices has been suggested
in some goat breeds where size of the ear may prevent the proper insertion of ear tags, as
well as in conditions where low retention is achieved (USDA, 2006b).
98
State of the art of goat RFID
Rea
dabi
lity
, %
98.
0
93.
3
100
79
.82
95.7
Fai
lure
s, %
0.5
1.6
0
0
2.1
3
Los
ses,
%
1.5
5.1
0
2
0.22
4.3
Tri
al d
urat
ion,
d 24
0
1,05
0
240
Age
, d
Doe
s
& k
ids
90
Doe
s
Typ
e
Var
ious
1
But
ton-
butt
on
Fla
g-bu
tton
But
ton-
butt
on
Dev
ices
ap
plie
d, n
2,3
83
2,6
20
46
46
47
Pro
duct
ion
syst
em
Var
ious
Sem
i-in
tens
ive
Sem
i-in
tens
ive
Bre
ed
―
Mur
cian
o-
Gra
nadi
na
Mur
cian
o-
Gra
nadi
na
Tab
le 7
.2. P
erfo
rman
ce o
f ra
dio-
freq
uenc
y ea
r ta
gs f
or g
oat i
dent
ific
atio
n.
Ref
eren
ce
Sch
uili
ng e
t al.
(200
4)
Car
né e
t al.
(200
9a)
Car
né e
t al.
(201
0a)
P P P 1B
utto
n (n
= 2
,495
) an
d F
lag
(n =
2,5
08)
type
s.
2E
stim
ated
by
Kap
lan-
Mey
er n
onpa
ram
etri
c su
rviv
al a
naly
sis.
3O
ccas
iona
l fai
lure
s w
ere
not i
nclu
ded
in th
e fi
nal r
eada
bili
ty.
99
Chapter 7
In conclusion, information available on the use of RFID ear tag in goats makes
evident the need for further research to validate their use for permanent official ID. From
data currently available, it can be concluded that properly designed button devices might
offer adequate readability performance if suitably designed. Moreover, low incidence of
damages on button ear tags also ensures a suitable visual readability, although in this case
the size of printed codes would invariably require animal restraining.
7.5. Injectable transponders
When considering the use of injectable transponders, several aspects must be taken
into account. Firstly, easiness of application and the compliance with acceptable welfare
practices. Secondly, the long-term readability of devices, which depends on their losses,
breakages and electronic failures during the animal lifetime. Besides, attention must be
paid to possible migration caused by tissue reaction to transponders, as well as appropriate
retrieval at slaughter to ensure that no carcass contamination occurs. All these factors
determine both the size of transponders to be used and the proper body location where
injected.
A wide range of transponders injected in different body locations have been tested so
far in cattle (Klindtworth et al., 1999; Lambooij et al., 1999; Conill et al., 2000), sheep
(Hunt, 1994; Conill et al., 2002; Hogewerf et al., 2009) and swine (Lambooij et al., 1995;
Stärk et al., 1998; Caja et al., 2005a). Conversely, available literature referred to their use
in goats is scarce. Existing information on the features and readability of injectable
transponders utilized for goat RFID is summarized in Table 7.3.
First results in goats were obtained by Fonseca et al. (1994a) in the frame of the
European FEOGA Project (1993-94). They evaluated the performance of 32.5 × 3.8 mm
transponders subcutaneously injected in 4 different body sites (under tail, ear base, groin,
and armpit) in adult goats. After 1 yr, the lower readability rates were observed under the
tail (89.1%) and in the ear base (92.7%); moreover, an incidence of 5.5 and 3.6%
breakages was registered in these respective body locations. On the contrary, readabilities
greater than 98% were obtained in the groin and armpit. The poor readability rates
observed in the tail and ear base of goats are principally due to the limited room for
allocating the transponder, which entails a shorter injection channel and an increase of
100
State of the art of goat RFID
early losses due to the transponder falling out through the injection site before it is totally
healed.
Most losses have been observed within the first 2 wk in different species and injection
sites (Lambooij et al., 1999; Babot et al., 2006; Carné et al., 2009a). In order to diminish
these early losses, injections are performed whenever possible in an up down direction to
avoid the effect of gravity on the displacement of transponders (Conill et al., 2002). Stärk
et al. (1998) suggested the tension on the skin in too superficially injected transponders in
swine as a cause of skin necrosis that could lead to additional losses of transponders. This
fact can also occur in the event of necrosis due to infection and inflammation.
Likewise, transponder migration due to tissue reaction to the transponder may
contribute to losses or the finding of the transponder out of the body region where it was
injected. These findings may affect both the readability performance and the suitable
retrieval of devices at slaughter (Caja et al., 1998; Klindthworth et al., 1999). In a
desirably healing process, a fibrous conjunctive tissue capsule is produced outside the
transponder, thereby getting the device fixed on the tissue close to the site where initially
injected (Lambooij et al., 1992). These events have also been described in goats (Queiroga
et al., 1994; Roquete et al., 1994), where there was less tissue reaction with transponders
injected in the ear base and armpit.
With regard to migration distance, Fonseca et al. (1994a) found that the greatest mean
migration values of 32-mm transponders at 1 yr after injection occurred in the groin (56 ±
1 mm), whereas lowest values were registered in the tail (27 ± 1 mm). Equally, Ribó et al.
(1994a) observed the lowest migration values in the tail (26 mm) of Murciano-Granadina
goats, whilst the greatest average migration was observed in the armpit (63 mm).
In view of readability and migration results, armpit was considered as the most
appropriate site for injection of 32-mm transponders in adult goats (Fonseca et al., 1994a;
Ribó et al., 1994a). In adult sheep, mean migrations in the same body regions turned out to
be lower (< 43 mm) than in goats, although analogous lower readability rates in the tail
and ear base were indicated (Caja et al., 1998b).
101
Chapter 7
Rea
dabi
lity
, %
92.7
100
98.2
89
.1
98.0
100
98.3
9
8.72
51.9
96
.4
96.0
92
.9
Bre
akag
es, %
5.5
0
0 3.6
0.1
―
―
―
―
―
0 0
Los
ses,
%
1.8
0
1.8
7.3
1.9
0
1.71
1.
31, 2
48.2
1
3.6
1
4.0
7.1
Tri
al
dura
tion
, d
360
350
28
360
360
90
360
630
990
Age
, d
Doe
s
Doe
s
1-4
Doe
s
90
90
L ×
o.d
., m
m
32.5
× 3
.8
“ “ “
32.5
× 3
.8
32.5
× 3
.8
12.0
× 2
.1
15.0
× 3
.0
12.0
× 2
.1
“
12.0
× 2
.1
15.0
× 2
.1
Inje
ctio
n si
te
Ear
bas
e A
rmpi
t G
roin
T
ail
Arm
pit
Intr
aper
iton
eal
Met
acar
pus
Met
acar
pus
& m
etat
arsu
s2 P
eria
nal a
rea
Per
iana
l are
a
Met
acar
pus
Met
acar
pus
Dev
ices
ap
plie
d, n
55
63
55
55
2,1
60
47
378
890
141
91
100
75
Bre
ed
―
Mur
cian
o-G
rana
dina
Sar
da
Mur
cian
o-G
rana
dina
Mur
cian
o-G
rana
dina
Tab
le 7
.3. P
erfo
rman
ce o
f ra
dio-
freq
uenc
y tr
ansp
onde
rs in
ject
ed in
dif
fere
nt b
ody
loca
tion
s in
goa
ts.
Ref
eren
ce
Fon
seca
et a
l. (1
994a
)
Caj
a et
al.
(199
8a)
Pin
na e
t al.
(200
5a)
MA
PA
(20
07)
Car
né e
t al.
(200
9a)
1N
o ch
ecki
ng o
f tr
ansp
onde
r br
eaka
ge w
as c
arri
ed o
ut.
2R
esul
ts n
ot e
xpre
ssed
acc
ordi
ng to
the
2 in
ject
ions
sit
es te
sted
.
102
State of the art of goat RFID
Based on these previous experiments, Caja et al. (1999b) evaluated the large scale
readability of transponders injected in the armpit of dairy goats, with the objective of
implementing a semi-automated milk recording system by using handheld transceivers in
the milking parlor. During the 3 yr of study they indicated a readability of 98.0%,
confirming the suitability of this injection site for the long-term identification of adult
goats.
In recent years, the use of injects in the pastern has become of key importance as it is
the only body region where injects are currently accepted for official RFID of sheep and
goats in the European Union (EC 21/2004; EC 933/2008). This injection site is anticipated
to prevent food contamination as transponders can be safely removed from the carcass by
cutting out the distal part of legs; human consumption of animals injected is not allowed
though. Moreover, migration in this area is deemed of no relevance for reading and
retrieval efficiency. Nevertheless, no studies have been published in this regard.
In response to European regulations, different short and medium scale projects have
been carried out to evaluate the performance of injects located in the rear metacarpal (fore-
leg) and metatarsal (hind-leg) areas of adult goats (MAPA, 2007). Nevertheless, the use of
large transponders was discarded in this region despite small transponders (with small
antennas) offering lower reading distances. Two sizes of transponders were eventually
evaluated (12 × 2.1 and 15 × 3.0 mm). Readabilities obtained were greater than 98%,
although no specific results for the case of metatarsus were made available (MAPA,
2007). Likewise, no discrimination of losses, breakages or electronic failures was
considered.
As goats within the European Union must be identified before 6 mo of age or when
leaving the premises of origin, Carné et al. (2009a) evaluated the use of injects in the
metacarpus applied to replacement goat kids of 3 mo of age. In this case, transponders of 3
mm o.d. were discarded, and only devices with 2.1 mm o.d. and varying in their length (12
and 15 mm) were tested. At the end of the first yr of age, readabilities were 96 and 92%
for the 12- and 15-mm transponders, respectively. Moreover, most losses (90.9%)
occurred during the first 2 wk after injection. Likewise, readabilities at 2 yr of age were
90.9 and 96.0%. On the other hand, and unexpectedly, no infection or inflammation was
observed after injection. In addition, low incidences of bleeding (5.5%) and limping
(<1%) were registered, and remitted within the following hours.
103
Chapter 7
Metacarpal injection of 12-mm transponders had previously been evaluated in ewes
and lambs of different ages (Abecia et al., 2004), reporting similar incidences of bleeding,
infection, and limping than in goat kids. In this study, an overall readability of 2% was
obtained at approximately 2 mo after injection, all losses being observed within the first
wk after injection. However, approximately 8% of losses were observed in lambs
identified at 1mo of age, whereas losses <2% were obtained in younger lambs, and in
ewes (Abecia et al., 2004).
Although transponders placed in the distal areas of the legs may be expected to be
greatly subjected to breakages, no such findings were registered for transponders injected
in metacarpus and metatarsus (MAPA, 2007; Carné et al., 2009a). Similar results have
been reported in lambs and ewes (Abecia et al., 2004). Final location of transponders close
to the sesamoid bones is suggested as offering protection from damages (MAPA, 2007;
Carné et al., 2009a); moreover, the use of small size transponders would additionally
reduce the risk of breakages. According to readability values, injects in the legs
(metacarpus and metatarsus) can be a valid alternative method for goat RFID (MAPA,
2007). Conversely, these injection sites are not recommended in goat kids due to losses
observed and lower reading distance (Carné et al., 2009a). No data on the slaughter
recovery of subcutaneous injects can be found in goats. Irrespective of the readability at
slaughter, the main drawback observed in sheep and cattle was the time needed for the
efficient manual recovery of transponders from the carcasses, which exceeded the
slaughter line speed (Lambooij et al., 1999; Conill et al., 2000, 2002) and hindered the
implementation of this methodology for the animal ID and traceability in practice.
The intraperitoneal injection has been recently proposed as an alternative method to
subcutaneous injections in livestock, having first been evaluated in piglets (Caja et al.,
2002). This method seems to offer relevant advantages as it allows the use of large size
transponders at very early ages and minimizes the events of losses and breakages (Caja et
al., 2005a, Babot et al., 2006). In the case of goats, Pinna et al. (2005a) tested the
intraperitoneal injection in kids of 1-5 d of age and 1.5 to 3.4 kg BW. The authors
obtained a readability of 100% at 28 d after injection, when kids were sent to slaughter (7
to 8 kg BW). Nonetheless, although all transponders were properly removed from the
carcass, only 27.3% of them were found attached to the intestines; the rest of transponders
were found loose in the abdomen cavity. Similar results were also reported in lambs
(Pinna et al., 2005b). Although carcass contamination is prevented, the recovery of
104
State of the art of goat RFID
transponders not adhered to the omentus constitutes the main shortcoming to be solved in
order to avoid risks of meat contamination, as many of these transponders are lost or fall
onto the ground of the slaughterhouse during evisceration (Gosálvez et al., 2007). On the
other hand, an automated recovery system is guaranteed, given that manual recovery of
transponders adhered to the intestines omentus is a very time consuming process.
No data is available on the long-term performance of intraperitoneal injects in
ruminants. In fattening pigs slaughtered at 6 to 7 mo of age and 100 kg of BW,
readabilities greater than 98% have been registered (Caja et al., 2005a; Babot et al., 2006).
On the contrary, readabilities of 69 to 92% have been reported in extensively managed
Iberian pigs slaughtered at 15 mo of age and 150 kg BW (Gosálvez et al., 2007). Part of
the unreadable transponders might correspond to losses due to passage through the urethra
and rectum in the event of performing the injection in the bladder or the intestines, as well
as readability failures in fattened Iberian pigs (Caja et al., 2005a; Gosálvez et al., 2007).
7.6. Rumen boluses
The use of RFID boluses allocated in the reticulorumen of ruminants was first patented
by Hanton and Leach (1974), who described an active transponder that obtained the power
source from an internally attached battery. Whereas the idea of using boluses as a means
of ruminant identification was not further developed for 15 yr, the utilization of rumen
boluses for the slow release of medicaments or nutrients was widely explored in cattle
(Owens et al., 1980; Riner et al., 1982; Fallon, 2001). The interest for RFID boluses was
subsequently resumed in the early 90s, by means of passive transponders (Ribó et al.,
1994c). This technology allows the use of devices whose source of energy is obtained
from an externally generated electromagnetic field (Artmann, 1999). Consequently, no
internal energy source restricts the lifespan of transponders.
Existing information on the features and readability of rumen boluses intended for
goat RFID are summarized in Tables 7.4 to 7.6. Data referring to trials of short duration
have been included in these tables, although the obtained retention rates in these cases will
not be considered for discussion. The first attempt to produce boluses encasing a passive
transponder was carried out within the FEOGA Project (Caja et al., 1994; Ribó et al.
(1994c) supported by The European Commission. The authors used solid plastic tubes that
were drilled to make room for 32-mm transponders. Boluses of 32 g of weight and 60 × 20
105
Chapter 7
mm in dimensions were obtained (Table 7.4), and applied to 14 adult goats and 168 adult
sheep. Retention of boluses in goats at 24 h after administration was 50%, and only 7%
remained in the reticulorumen at 3 mo. Occurrence of bolus losses in sheep appeared to be
notably lower as, at 3 mo, 50% of boluses could still be properly read. According to
results, authors pointed out the influence of devices’ physical features on their retention
rate in the reticulorumen. Moreover, retention efficiency seemed to be also conditioned by
ruminant species.
Bolus losses have been shown to mainly occur due to regurgitation (Fallon, 2001;
Garín et al., 2005). In these events, ruminal motility causes the bolus to reach the cardias,
and it is subsequently carried into the oral cavity by antiperistaltic motility through the
esophagus. Consequently, bolus weight and specific gravity are regarded as the main
factors affecting their retention, as these features condition that boluses stay in the bottom
of the reticulum or the rumen (Caja et al., 1999a; Fallon and Rogers, 2002). Actually,
weight and specific gravity had already been shown to dramatically influence the retention
of slow-release boluses of trace elements, growth promoters, antihelmintics and antibiotics
in cattle (Riner et al., 1982; Fallon, 2001).
A heavier RFID bolus (61 g, 75 × 20 mm) also made up of plastic tubes was
subsequently tested (Ribó et al., 1994c), and no losses at the end of the first mo after
administration were observed (Table 7.4); it was concluded that weight increase was
responsible for the improvement of bolus performance.
At this point it should be indicated that volume and dimensions (length × o.d.) of
boluses are not deemed to be relevant for their retention. Nevertheless, attention must be
given to these features as they dramatically affect the weight and age of animals at which
boluses can be safely administered (Caja et al., 1999a; Garín et al., 2005; Ghirardi et al.,
2007).
The importance of physical features on the retention of RFID boluses was confirmed
in later studies, and new prototypes with heavier materials were tested from the middle
1990s for the identification of cattle (Fallon and Rogers, 1996; Hasker and
Bassingthwaighe, 1996; Caja et al., 1998a; Ghirardi et al., 2006a), sheep (Caja et al.,
1996; Ghirardi et al., 2006b) and goats (Caja et al., 1998a). Some prototypes consisted of
a transponder encased in a plastic tube with a stainless steel weight attached (Fallon and
Rogers, 1996; Fallon et al., 2002).
106
State of the art of goat RFID
Rea
dabi
lity,
%
7.0
100
98.
5
100
100
100
100
100
100 89
.7
98.2
98.0
100
100
100
99.8
95.4
95.7
97.2
SG
1
1.73
2.53
3.3
3.4
3.6
3.5
3.4
2.92
3.4
3.6
3.9
3.4
3.4
3.6
3.6
3.6
3.4
3.8
Vol
ume,
mL
192
242
202
22.4
22.4
14.4
2.6
22.4
22.4
18.9
22.4
22.4
22.4
22.4
22.4
22.4
18.9
Wei
ght,
g
32.0
61.0
67.0
75.0
80.0
51.0
9.0
15.0
75.0
80.0
73.0
75.0
75.0
80.0
80.0
80.0
75.0
73.0
L ×
o.d
., m
m
60 ×
20
75 ×
20
66 ×
20
68 ×
21
68 ×
21
68 ×
21
77 ×
18
68 ×
21
68 ×
21
68 ×
21
68 ×
21
68 ×
21
68 ×
21
77 ×
18
9 ×
35
68 ×
21
67 ×
51
12 ×
46
Tri
al d
urat
ion,
d
90
30
1
,080
30
100
33
63
360
Tab
le 7
.4. P
erfo
rman
ce o
f di
ffer
ent t
ypes
of
radi
o-fr
eque
ncy
rum
en b
olus
es in
goa
ts (
I).
Yea
rlin
gs
Doe
s &
year
ling
s
Age
, d
Doe
s
Doe
s
Doe
s
120
65
16
34
“ “ “ “ “ “ “ “ “
Dev
ices
ap
plie
d, n
50
54
94
310
275
134
202
440
198
109
27
15
15
15
14
67
16
48
48
Sem
i-ex
tens
ive
Sem
i-ex
tens
ive
Sem
i-ex
tens
ive
Sem
i-in
tens
ive
Sem
i-in
tens
ive
Sem
i-in
tens
ive
Sem
i-in
tens
ive
Sem
i-in
tens
ive
Sem
i-in
tens
ive
Pro
duct
ion
syst
em
Ext
ensi
ve
Ext
ensi
ve
“ “ “ “ “
Pal
mer
a, M
ajor
era,
&
Tin
erfe
ña
Mur
cian
o-G
rana
dina
Mur
cian
o-G
rana
dina
Mur
cian
o-G
rana
dina
Bla
nca
de R
asqu
era
Saa
nen
& A
nglo
-
Nub
ian
Bre
ed
Tin
erfe
ña
Maj
orer
a
Maj
orer
a
Pal
mer
a
Flo
rida
“ “ “ “ “
Cap
ote
et a
l.
(200
5)
Gec
ele
et a
l.
(200
4)
Mar
tín
et a
l.
(200
4)
Cas
tro
et a
l.
(200
5)
Rib
ó et
al.
(199
4c)
Ref
eren
ce
Caj
a et
al.
(199
9a)
P 1S
G =
spe
cifi
c gr
avit
y; 2E
stim
ated
acc
ordi
ng to
dim
ensi
ons;
3 Est
imat
ed a
ccor
ding
to w
eigh
t and
vol
ume.
107
Chapter 7
Nevertheless, the mainstream of manufacturers chose to increase the bolus weight by
using atoxic dense ceramic materials (Caja et al., 1999; ICAR, 2010), which are
translucent to the radio frequency electromagnetic fields.
With regard to the use of ceramic boluses for goat identification, Caja et al. (1998a;
1999a) indicated 98.5% readability in a 3-yr study where Murciano-Granadina dairy goats
were administered 65-g standard-sized boluses with a SG of 3.4 (Table 7.4); a total of 882
sheep and lambs were also evaluated, and offered 100% readability. These results were in
agreement with those indicated by Ribó et al. (1994c), where retention of boluses in goats
was lower than in sheep.
In the view of the technological development and the gained experience, an evaluation
of these devices at a larger scale was warranted. With this aim, 30,627 goats were
identified with boluses in Spain, Italy and Portugal in the frame of the European IDEA
Project (JRC, 2003). Ceramic boluses with similar features to those previously tested by
Caja et al. (1998a) and patented by the European Community (European Community et
al., 1998) were used.
Table 7.5. Results of the European large-scale IDEA Project: Readability of rumen
boluses for the electronic identification of goats.1
Country Breed Devices applied, n Readability, %
Spain Guadarrama
Murciano-Granadina
Saanen
Malagueña
Crossbreeds
Overall
7,365
6,330
1,385
451
1,094
16,625
93.5
93.9
99.6
91.1
95.3
94.2
Portugal and Italy Serpentina, Alpine, ... 14,002 99.8
Source: MAPA (2002), JRC (2003), San Miguel et al. (2005) 1Bolus features: weight, 65 g; length × o.d., 66 × 20 mm; volume, 22 mL; specific gravity, 3.4;
patent by the European Commission et al. (1998).
Bolus readabilities obtained are detailed in Table 7.5. Loss rate of boluses throughout
the project was >3%, on average (JRC, 2003). However, losses varied dramatically when
considering or not the results obtained in some Spanish breeds (JRC, 2003). Thus, losses
108
State of the art of goat RFID
in several Spanish breeds averaged 5.8% (MAPA, 2002; San Miguel et al., 2005). These
results are of key importance taking into account that more than 45% of goats included in
the IDEA project were from Spain.
When results were evaluated without considering data from Spain, bolus retention in
goats was 99.8%, which is similar to the retention reported in sheep within this same
project (JRC, 2003). It must be underlined that, differently to goats, bolus retention in
sheep was similar between the different participant countries. Given the great variability
of bolus performance in goats, it was concluded that this issue remained a topic for further
research (MAPA, 2002; JRC, 2003; San Miguel et al., 2005).
Different studies have been carried out after the IDEA Project regarding the evaluation
of different bolus types to suitably identify any goat breed, and under a variety of
production systems. Capote et al. (2005) evaluated the performance of rumen boluses in
1,866 goats from several Spanish breeds for a period of 1 to 3 yr (Table 7.4). Two
standard-sized boluses (22 mL) but differing in their weight (75 vs. 80 g) and SG (3.4 vs.
3.6) were used. Moreover, a new prototype of lighter (73 g) but denser (SG 3.9) bolus,
with a more reduced o.d. (18.1 mm) for administration at lower body weight, was also
evaluated. The authors confirmed that the heavier bolus improved average retention. The
greatest losses were observed in 2 breeds (Palmera and Blanca de Rasquera) characterized
by their rusticity and management in extensive conditions. Ethological particularities
(frequent fights and jumping) of some extensively managed breeds were suggested to
cause bolus displacement from the bottom of the reticulorumen and, thereby, to ease the
occasional regurgitation (Capote et al., 2005). In addition, differences between herds were
already pointed out.
It bears mentioning that a retention of 99.8% in Murciano-Granadina goats (var.
Granadina) administered with the 80-g bolus prototype was reported (Capote et al., 2005).
Although this heavier bolus seemed to improve previous results in this breed (MAPA,
2002; San Miguel et al., 2005), it was subsequently tested in other Murciano-Granadina
herds and average retention rates of 92.6% were obtained (MAPA, 2007). Moreover, the
75-g bolus was also tested in this same breed and management conditions, observing
retention values <97% (Carné et al., 2009a, 2010a).
109
Chapter 7
Rea
dabi
lity,
%
99.6
92.6
92.6
100
66.
33
81.
43
96.
83
96.3
97.8
96.5
10
0
>3.
3
SG
1
3.4
3.6
3.6
3.5
3.9
3.4
3.9
3.4
3.6
3.4
Vol
ume,
mL
22.4
22.5
22.5
22.4
22.3
22.1
22.8
22.1
3.9
5.2
5.2
Wei
ght,
g
75.0
80.0
80.0
75.0
13.7
20.1
75.0
20.1
75.0
82.1
75.0
L ×
o.d
.,
68 ×
21
51 ×
11
56 ×
11
56 ×
11
68 ×
21
70 ×
21
68 ×
21
70 ×
21
68 ×
21
69 ×
21
68 ×
21
mm
Tri
al d
urat
ion,
d
210
270
360
90-1
50
1,05
0
910
870
360
360
Age
, d
Doe
s &
kids
Doe
s
Doe
s2
30
171
Doe
s &
year
ling
s
Doe
s &
year
ling
s
Dev
ices
ap
plie
d, n
1
,411
365
199
210
92
28
34
95
100
100
220
Pro
duct
ion
syst
em
Ext
ensi
ve
Inte
nsiv
e
Ext
ensi
ve
Sem
i-in
tens
ive
Sem
i-ex
tens
ive
Sem
i-in
tens
ive
Bre
ed
Sar
da
Mur
cian
o-G
rana
dina
Sar
da
Mur
cian
o-G
rana
dina
Var
ious
2
Mur
cian
o-G
rana
dina
Tab
le 7
.6.
Ref
ere
Pin
na
(200
MA
(200
Pin
na
(200
Car
né e
t al
(2 Car
né e
t al
(200
Car
né e
t al
(2
P 1PS
G =
spe
cifi
P 2PA
lpin
e (n
= 7
4), A
ngP 3
PVal
ue
Per
form
ance
of
diff
eren
t typ
es o
f ra
dio-
freq
uenc
y ru
men
bol
uses
in g
oats
(II
).
ora
(n =
75)
, Boe
r-cr
oss
(n =
73)
, and
Spa
nish
(n
= 7
3).
s es
tim
ated
wit
h a
Kap
lan-
Mey
e r s
urvi
val a
naly
sis.
c gr
avit
y.
.
009a
)
.
9b)
.
010a
) et a
l.
6) et a
l.
8) nc
e
PA
7)
110
State of the art of goat RFID
Therefore, low bolus retention observed in the IDEA Project for some Spanish breeds
and production systems was still apparent with improved heavier boluses. Management of
goat herds under highly intensified conditions, with concentrate-based diets, has been
suggested to have an effect on the observed poorer performance of RFID boluses (Carné et
al., 2009a; 2010b).
Likewise, results from following experiments carried out with goat breeds from
outside of Spain and identified with standard-sized boluses, yielded average retention rates
>98%. In this regard, a large scale (n = 1,411) study on the retention of 75-g standard-
sized boluses in extensively managed Italian Sarda dairy goat, yielded a retention rate of
99.6% at 210 d after administration (Pinna et al., 2006). Goat kids were also identified
with 75-g boluses at 3 to 5 mo of age, obtaining 100% readability in the milking parlor
when being adult does (Pinna et al., 2008).
In a following study, Carné et al. (2009b) evaluated the retention of 75-g and 82-g
standard-sized boluses in 4 breeds managed in extensive (Angora, Boer-cross and
Spanish) or semi-intensive (Alpine) conditions in the United States. At 1 year, the authors
obtained average retentions of 100% and 97.8% for the 75 and 82-g boluses, respectively,
and overall retention was 99.5% (Carné et al., 2009b). Furthermore, only the Angora breed
showed a retention rate lower than the 98% required by the ICAR (2007).
It must be highlighted that the 75- and 80-g aforementioned bolus types have also been
broadly tested in sheep (Caja et al., 1999a; Caja et al., 2003; Teyssier et al., 2003; Ghirardi
et al., 2006b; MAPA, 2007), obtaining in all cases retention rates greater than 99%.
In addition to standard-sized boluses, research in recent years has also been focused on
the use of small-sized boluses to be administered at early ages so as to improve the
implementation of animal traceability systems. Considering the use of the so-called mini-
boluses, the issue of losses due to the bolus reaching the abomasum by going through the
reticulo-omasal orifice, and being eventually expelled by intestinal passage, has also
arisen. This possibility has been proposed in both sheep and goat as the diameter of the
reticulo-omasal orifice in adult sheep (22 to 23 mm; Ghirardi et al., 2006b), lambs (14
mm; Ghirardi et al., 2007) and goat kids (24 mm; Martín et al., 2004) was greater than the
o.d. of currently used mini-boluses (10 to 12 mm). In the case of goats, the size of the
reticulo-omasal orifice in kids was nearly twice the size in lambs, which might contribute
to the greater losses observed in goats.
111
Chapter 7
In this respect, Carné et al. (2009a) evaluated the long-term retention of 2 different
prototypes of mini-boluses administered to suckling kids of Murciano-Granadina breed
(Table 7.6). The 13.8-g mini-bolus (SG 3.5) was administered to kids of 6.8 kg BW. The
second mini-bolus was larger (20 g and 5.2 mL) and with greater specific gravity (3.9),
and was administered in the event of losses (n = 28) of the former mini-bolus. Readability
of the lighter mini-bolus was 71.4% at 1 yr of age and 69.6% at the end of the 3-yr study.
The heavier mini-bolus offered retentions of 84.6 and 81.4% at 1 and 3 yr of study,
respectively. Moreover, no effect of extending the rearing period on the retention of the
13.8-g mini-boluses could be confirmed (Carné et al., 2009a).
In a short-term study, Castro et al. (2005; 2010) also tested different mini-boluses in
suckling kids, showing 100% retention at slaughter (10 kg BW); in this case, trial duration
and pre-ruminant conditions of kids must be taken into account. Results in replacement
goat kids contrast with those previously reported by using the same mini-boluses in
fattening and replacement lambs (Ghirardi et al., 2007); in these cases, retention of the
13.8-g mini-bolus ranged from 97.3 to 100%, and was 100% for the 20-g mini-bolus.
The same 20-g mini-bolus has been tested in adult goats from different breeds
managed in extensive (Angora, Boer, and Spanish) and semi-intensive (Alpine) conditions
(Carné et al., 2009b); at 1-yr, an average retention of 96.3% was obtained, and a breed
effect was not able to be detected. In a later study, mostly using dairy goats managed
under intensive conditions, a long-term retention of 81.4% was observed (Carné et al.,
2010b). All these studies concluded, therefore, that available mini-boluses were not
recommendable for the permanent identification of goats.
More recently, the modeling of bolus retention in goats according to bolus features has
been completed (Carné et al., 2010b), similarly to what previously done in cattle and
sheep (Ghirardi et al., 2006a,b). The retention model in goats is of special interest given
the poor and variable retention rates of RFID boluses in goats, as already detailed.
Moreover, the model was shown to allow the assessing of the bolus features for an
adequate retention, as well as optimizing the reduction in bolus size (Carné et al., 2010b).
Bolus retention in cattle, sheep and goats fitted similar logistic regression models taking
the weight and the volume of boluses as covariates (Ghirardi et al., 2006a,b; Carné et al.,
2010b). To construct the goat model, 19 commercial and prototype boluses were
evaluated; for this reason, retention results for each bolus type will not be detailed in this
review, and only the obtained model will be next discussed.
112
State of the art of goat RFID
The different curves corresponding to the estimated models of rumen bolus retention
in goats, sheep, and cattle, according to bolus weight and volume are shown in Figure 7.1.
Estimations are expressed for 3 different volumes (5, 15 and 22 mL), which are considered
as representative of small-, medium-, and standard-sized boluses (Carné et al., 2010b).
Figure 7.1. Estimated retention rates for small-, medium-, and standard-sized rumen
boluses of 5, 15, and 22 mL of volume in cattle (—), sheep (---), and goats (─) according
to the weight (g) of boluses. Figures come from to the models published by Ghirardi et al.
(2006a,b) and Carné et al. (2010b).
0
10
20
30
40
50
60
70
80
90
100
0 10 20 30 40 50 60 70 80 90 10
Weight, g
Ret
entio
n ra
te, %
0
As can be observed, the curves corresponding to the goat model are noticeably
displaced to the right, indicating that for a same given volume, a considerable increase of
bolus weight is required; consequently, an increase in SG is necessary as well. In fact,
estimated SG to produce a 5-mL mini-bolus to be adequately retained in goats was 8.6
(Carné et al., 2010b), which nearly doubles the 4.6 required in sheep (Ghirardi et al.,
2006b). In the case of cattle, requirements for designing 5-mL boluses (SG 11.6; Ghirardi
et al., 2006a) were even more stringent than for goats. An increase of boluses going
through the reticulo-omasal orifice and subsequent intestinal passage might be an
additional cause of mini-bolus losses in this species, although no data in this regard is
available.
113
Chapter 7
On the other hand, requirements for producing larger boluses for cattle are less strict,
to the point that SG in medium- and standard-sized boluses are intermediary (3.9 to 5.0) in
relation to those in sheep and goats. In any case, it is crucial to have confirmed that,
similarly to what has already been observed in sheep and cattle, the increase of SG may
allow reduced bolus volumes to be used in goats without causing a lower retention rate.
However, as radio-translucent materials are necessary to produce rumen boluses (Caja
et al., 1999a; Garín, 2002; Fallon, 2001), the relatively low SG of these materials becomes
the main limitation to optimize the reduction of bolus size (Ghirardi et al., 2006a,b; Carné
et al., 2010b).
Figure 7.2. Volume (mL) and specific gravity of boluses for estimated retentions of
99.95% in goats, sheep and cattle calculated from models published by Ghirardi et al.
(2006a,b) and Carné et al. (2010b).
0
2
4
6
8
10
12
14
16
18
0 5 10 15 20 25
Volume, mL
Spe
cifi
c G
ravi
ty Goats
Sheep
Cattle
Boluses currently available have SG no greater than 4.1 (Carné et al., 2010b; ICAR,
2010). Therefore, a compromise has to be reached between the volume to be achieved and
the SG required for that purpose. Taking these aspects into consideration, and according to
the aforementioned retention models, the SG and volume required for producing boluses
with an optimum retention rate of 99.95% in goats, sheep, and cattle have been obtained,
and are shown in Figure 7.2.
114
State of the art of goat RFID
As can be observed, SG for producing boluses for cattle and goats dramatically
increases when attempting to reduce the bolus size. Moreover, the difference of SG
between sheep and goats is clearly noticeable, as this is steadily maintained at different
bolus volumes. According to these new curves, it was possible to fit a potential regression
model of the SG and volume in properly retained boluses. In the case of goats, the model
was as follows (R2 = 0.983; P < 0.001):
SG = 19.52 (V) · e (- 0.509)
This last equation is of practical interest as it takes into account the 2 very main
limitations encountered when designing new bolus types, namely, the manufacturing
material available, and the size of the bolus so as to be administered at lower age and BW
in the different ruminant species where utilized.
In addition to evaluating the retention rate of boluses, a number of studies have been
aimed at studying the possible effects derived from their administration and the
subsequent long-term retention in the reticulorumen of domestic ruminants (Hasker and
Bassingthwaighte, 1996; Caja et al., 1999a; Martín et al., 2006). In the case of goats,
studies have demonstrated that, if properly performed (Caja et al., 1999; Carné et al.,
2009a,b), bolus administration can be safely done at a lower BW than in sheep (Caja et al.,
1999a; Carné et al., 2009a; Castro et al. 2005, 2010); thus, 22-mL devices can be applied
to young goats with >20 kg BW, and 4-mL mini-boluses can be administered to suckling
kids of approximately 5 to 6 kg of BW (2 to 5 wk of age).
With regard to administration safety, less than 0.03% of deaths of goats due to bolus
administration were registered in the IDEA Project; the Spanish working group indicated
that >80% of casualties occurred during the first wk of the project deployment, thereby
corresponding to goats identified by untrained operators (JRC, 2003). Similar incidence of
administration problems were observed with sheep and cattle (JRC, 2003). Subsequently,
a number of authors have reported no incidences related to bolus administration in goats
(Ribó et al., 1994c; Caja et al., 1999a; Martín et al., 2006; Carné et al., 2009a,b; 2010a,b;
Castro et al., 2010). According to Macrae et al. (2003), the importance of the neck position
should be underlined to avoid incidences in the administration of boluses in Suffolk
lambs.
On the other hand, no shortcomings related to alterations in the reticulorumen, food
intake, digestibility, growth, and production efficiency have been reported in goats (Castro
115
Chapter 7
et al., 2005, 2010; Martín et al., 2006; Ait-Saidi et al., 2008). Similar conclusions have
been obtained in sheep (Caja et al., 1999a; Garín et al., 2003; Ghirardi et al., 2007) and
cattle (Hasker and Bassingthwaighte, 1996; Caja et al., 1999a; Antonini et al., 2006).
At slaughter, boluses are easily and quickly (8 s on average) recovered in the offal
room (Caja et al., 1999a), thereby not being directly conditioned by the slaughter line
speed. Similar results have been indicated in sheep and cattle (Caja et al., 1999a;
Lambooij et al., 1999; Ghirardi et al., 2006b).
7.7. Leg tags
Leg tags (leg bands or leg marks) are broadly used in dairy goat herds (Balvay, 2007),
either for individual ID or to mark animals for lot management. However, little attention
has been paid on their use for official ID until the publication of European Regulation EC
933/2008, amending Regulation EC 21/2004 regarding the identification and registration
of sheep and goats. Accordingly, visual and RFID leg marks can be used for official ID of
sheep and goats if they do not leave the country of origin. Spanish (Real Decreto
1486/2009) and French (Arrêté du 24 décembre 2009) transpositions of European
regulations already establish the official use of leg marks as visual devices.
Along with the possibility of using leg tags for visual ID, some RFID leg tags have
also appeared recently (Hilpert et al., 2009; ITW Reyflex, 2009). In fact, an on-field study
is being carried out in France since 2007 to evaluate the performance of visual (A.
Raymond, A. Raymond; Capritag, Chevillot) and RFID leg tags (Patuflex, ITW Reyflex)
in dairy goats. Results showed 12% of losses for a first model of Patuflex leg tag at 6 mo
after tagging adult goats, which were subsequently reduced to <1% by using an improved
model. Regarding electronic readability, 4.5 and 1.6% of devices unreadable for the first
and second model of Patuflex leg tag were obtained at 16 and 6 mo after tagging,
respectively (Balvay, 2009).
Unlike Patuflex leg tags, the A. Raymond leg bands were considered as suitable for
application to young goats as the inner circumference of the tag can be enlarged when the
goat grows; this leg tag yielded a retention close to 99%, although visual readability was
90%. Irrespective of the retention obtained, it appears clear to us that allowing the a
posteriori modification of the inner circumference of leg tags prevent their use as tamper-
proof devices as required in the EU (Regulations EC 21/2004 and EC 933/2008).
116
State of the art of goat RFID
Abecia et al. (2009) tested the threshold age and BW for application of Patuflex leg
tags in Murciano-Granadina dairy goats. The shank circumference of goat kids at 5 mo of
age (76 mm) reached 86.7% of circumference in adult goats (88 mm) (Abecia et al.,
2009); conversely, BW at that age only represented 35% of overall BW in adults.
However, several cases of leg band displacement to the pastern were registered in 25% of
goat kids. They concluded that a minimum age of 6 mo for leg tagging was appropriate to
avoid unlawful removal, and to allow the permanent identification during the goat’s
lifespan without causing constriction in the leg of adult does. This study did not evaluate,
however, losses and readability of devices in the subsequent months after tagging.
Carné et al. (2010a) evaluated the use of a new leg band of Spanish design
(Animalcomfort) where the buckle to fasten the leg band had a pin that allowed the device
to be closed with an ear tag button female piece, similarly to the closing systems of regular
ear tags. In this study, RFID button pieces were used, thereby obtaining RFID leg tags.
The shank circumference of adult goats (88 mm) was 79.5% of that in 5-mo kids (70 mm),
and the inner circumference of fastened leg tags in adult goats was 107 mm. Authors
concluded that early losses or removals, as well as constriction of the leg in grown goats
could not be prevented if leg bands were applied at 5 mo of age. Long-term visual and
RFID readability was also monitored during 1 yr. Visual readability was 98.5%, and the
remaining 1.5% corresponded to tags removed because they caused limping (Carné et al.,
2010a). Electronic readabilities were 93.6 and 98.3% for the 2 types of RFID button tags,
respectively. It was therefore concluded that properly designed leg tags could be
adequately used for permanent official identification of adult goats, whereas tagging at
early ages remained a topic for further research (Carné et al., 2010a).
7.8. Dynamic reading efficiency
The application of radio frequency technology for livestock ID has supposed the
possibility of widening the utilities of ID devices. Thus, in addition to ensuring the
permanent, accurate and reliable ID of animals, RFID may be a valuable tool for the
automation of farm management and data recording activities, thereby improving the
production efficiency (Speicher, 1981; Ait-Saidi et al., 2007; Voulodimos et al., 2009). In
this regard, efficient individual dynamic reading with livestock passing through a runway
117
Chapter 7
may facilitate lot-based management systems as well as quickly monitor great amounts of
animals.
Existing information on the dynamic reading efficiency (DRE) of RFID devices in
goats is summarized in Table 7.7. Although little information is found, the evaluation of
RFID devices in animals going through a runway with the antenna placed in different
locations has been tested by different authors. Thus, regarding ear tags Caja et al. (1998a)
indicated poor DRE rates ranging from 61.2 to 72.5% in goats, which depended on the
strength of the electromagnetic field generated by the transceiver; similar results (78.8%)
have been indicated in sheep (Caja et al., 1998a). A greater range of values (53.4 to
99.9%) has been pointed out in cattle (Conill et al., 2000; Stewart et al., 2007; Wallace et
al., 2008), which on one hand was a consequence of the variable performance in different
body sites; on the contrary, the lower passage speed and greater distance between
transponders in this species could reduce the occurrence of collisions between
transponders (Ghirardi et al., 2006b).
With a frame antenna located on the left side of the runway, DRE > 99% have been
obtained by using RFID rumen boluses (Caja et al., 1999a; Conill et al., 2000; Carné et al.,
2010b). These high values are explained by the use of large transponders (32-mm), which
show larger reading distances from the transceiver’s antenna. Moreover, readings are
optimized because rumen boluses are mostly located in the reticulum, at the very left side
of the abdominal area (Caja et al., 1999a; Castro et al., 2005; Antonini et al., 2006).
Similarly, results by using 32-mm transponders injected subcutaneously in the left armpit
yielded DRE of 100% in goats (Caja et al., 1999b), and 99.9% in cattle (Conill et al.,
2000).
Carné et al. (2010a) also evaluated the efficiency of boluses with the antenna placed
in other positions (on the floor, and with goats passing through it), and with goats also
being identified with RFID leg tags. In these conditions, where a remarkable increase of
reading collisions was anticipated, bolus DRE was still greater than 95% (Carné et al.,
2010a). Conversely, the lower bolus DRE was obtained with the antenna placed on the
floor (Carné et al., 2010a), which additionally resulted to be the best position for the
dynamic reading of leg tags (92.4%). The antenna on the floor was also indicated as the
best position for the DRE of 15-mm transponders injected in the fore- or hind-legs
(MAPA, 2007).
118
State of the art of goat RFID
DR
E, %
61.2
–72.
56
99.7
95.2
16
.0
93.0
68
.2
92.4
83
.4
99.5
1
00
1
00
Rea
ding
s, n
276
332
2
,160
5
578
495
495
363
525
525
385
1
,496
of
diff
eren
t rad
io-f
requ
ency
iden
tifi
cati
on d
evic
es in
goa
ts.
Ant
enna
pos
itio
n
Lef
t lat
eral
Lef
t lat
eral
Lef
t lat
eral
Flo
or
Lef
t lat
eral
F
loor
T
rans
vers
al
Lef
t lat
eral
F
loor
T
rans
vers
al
Lef
t lat
eral
Tra
nspo
nder
siz
e, m
m
―4
32.5
× 3
.83
32.5
× 3
.83
15.0
× 3
.0
32.5
× 3
.83
―
4
32.5
× 3
.83
Bdo
y si
te2
―
―
Arm
pit
Met
acar
pus
―
Hin
d le
g
―
Dev
ice
type
Ear
tag
Rum
en b
olus
Inje
ct
Inje
ct
Rum
en b
olus
L
eg ta
g R
umen
bol
us
Tab
le 7
.7. D
ynam
ic r
eadi
ng e
ffic
ienc
y (D
RE
)1
Ref
eren
ce
Caj
a et
al.
(199
8a)
Caj
a et
al.
(199
9a)
Caj
a et
al.
(199
9b)
MA
PA
(20
07)
Car
né e
t al.
(201
0a)
Car
né e
t al.
(201
0b)
1D
RE
= n
o. d
evic
es r
ead
/ no.
dev
ices
rea
dabl
e an
d pr
esen
t.
2D
evic
es a
ppli
ed to
the
left
of
the
anim
al e
xcep
t for
inje
ct in
the
past
ern.
3F
erri
te c
oil.
4A
ir c
oil (
butt
on tr
ansp
onde
r).
5G
oats
iden
tifi
ed th
roug
hout
a 3
-yr
stud
y.
6D
epen
ding
on
the
stre
ngth
of
the
tran
scei
ver’
s el
ectr
omag
neti
c fi
eld
(137
to 1
40 d
bμV
/m a
t 3 m
).
119
Chapter 7
120
It can be concluded that the reading efficiency strongly depends on the position of the
antenna and the type of RFID device, which becomes an issue of major relevance when
dealing with goat herds where different RFID methodologies are in use (Carné et al.,
2010a).
7.9. CONCLUSIONS
The performance of electronic devices for the identification of goats has been studied by
different authors in recent years. Obtained results showed that electronic identification
devices perform better than visual devices in most cases.
Transponders injected in the armpit yielded adequate readabilities (>98%) as
recommended by the ICAR (2007), although efficient retrieval at slaughter is a key
shortcoming to be solved as it constitutes a public health issue. Small-sized transponders
are necessary if intending to be injected in the pastern (metacarpus or metatarsus),
although variable readability rates have been obtained when injected at early ages.
Readability of electronic ear tags was markedly variable, but adequately designed button-
button ear tags showed a satisfactory retention and readability.
Leg bands with attached transponders were a valid alternative for the identification of
adult goats, although thorough study of leg band designs is required to ensure their use for
the identification of goats before 6 mo of age, as established in the EU regulations.
Rumen boluses currently used for sheep identification are not appropriately retained in
some goat breeds and production systems, which is the case of many Spanish goats.
Moreover, studies on the relationship between bolus features and their retention in the
reticulorumen concluded that boluses with greater specific gravity are required in
comparison to sheep. However, reduction in bolus size could be achieved by using
materials with suitable minimum specific gravity. The use of small-sized boluses in goats
is therefore conditioned by the availability of suitable radio translucent materials for bolus
manufacturing.
CHAPTER 8
Conclusions
Conclusions
CHAPTER 8
CONCLUSIONS
Electronic identification at early ages
Suitable electronic ear tags were easily applied to goat kids, the age at tagging
not affecting the subsequent performance of these devices.
The size of injectable transponders was the main limitation for their
subcutaneous injection in the pastern of goat kids. Transponders larger than 15
mm were discarded.
Appropriately dimensioned small-sized boluses were safely administered to goat
kids. Moreover, the body weight for bolus administration was lower in goats than
in sheep.
No influence could be established between the suckling period and the early
losses of small-sized rumen boluses in kids. Therefore, no increment of losses by
regurgitation or intestinal passage could be attributed to the anatomical and
physiological modifications that occur when the esophageal groove reflex is
activated.
Visual and electronic ear tags
Visual ear tags for the identification of replacement and adult goats showed long-
term readabilities lower than the minimum 98% recommended by the ICAR
(2007) for their official use in practice.
Retention rate of visual ear tags varied according to goat breed, although no
effect of production management (intensive vs. extensive) on ear tag