Single-molecule force spectroscopy to decipher the early signalling step in membrane-bound penicillin receptors embedded in a lipid
bilayer Andrea Mescolaa, Marjorie Dauvinb, Ana Amorosob, Anne-Sophie Duweza and Bernard Jorisb aMolecular Systems, Department of chemistry, University of Liège, 4000 Liège, Belgium. bBacterial physiology and genetics - Centre d'Ingénierie des Protéines- Integrative Biological Sciences, Department of Life Sciences, Liège University. Sart-Tilman B6a, 4000 Liège, Belgium.
B. subtilis-E. coli shuttle vector harboring xylR and PxylA promoter
Bacillus Genetic Stock Centre3
pBPG225
Derivative of pHCMC04 carrying the divergeon gfpmut3 and blaI and under the control of Pbla, and blaR1 under control of PxylA (for details see Figure S1.1).
M. Dauvin, unpublished data
pBPG227 Derivative of ECE189P carrying the divergeon Pbla gfpmut3-blaI This study
pBPG230
Derivative of pBPG225 carrying blaR1-poly-Gly40-tStrep-tag This study
Escherichia coli BL21 DE3
Host cell for heterologous expression of Bl-blaR1; fhuA2 [lon] ompT gal (λ DE3) [dcm] ∆hsdSλ DE3 = λ sBamHIo ∆EcoRI-B int::(lacI::PlacUV5::T7 gene1) i21 ∆nin5
New England BioLabs®Inc.
Bacillus subtilis 168
Host cell for induction assays with pBPG225 and pBPG230
Bacillus Genetic Stock Centre3
Supplementary Table 2. Plasmids and bacterial strains used in this study.
ESI – A. Mescola et al.
4
Supplementary Figure 1. Primary structure comparison between R-BlaR1, R-BlaR1-G40
and BlaRS. Sequence alignment between R-BlaR1, R-BlaR1-G40 and BlaRs. The N-terminal
transducer-amplifier (BlaRTA) and C-terminal sensor (BlaRS) domains of Bl-BlaR1 are
highlighted in pale grey and dark grey, respectively. BlaRS can be produced as a soluble
domain, it was crystallized and its 3D structure determined. The elements of its secondary
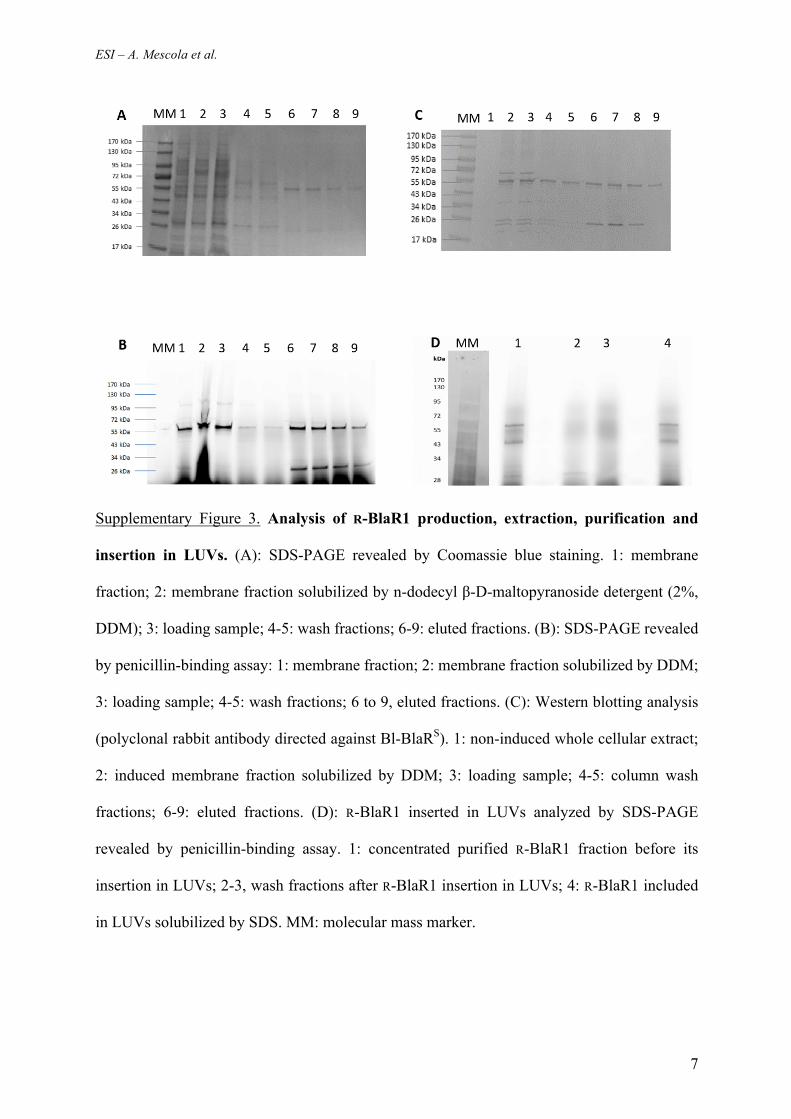
(C): Western blotting analysis (polyclonal rabbit antibody directed against Bl-BlaRS). 1: non-induced whole cellular extract; 2: induced membrane fraction solubilised by DDM; 3:loadingsample;4-5:columnwashfractions;6-9:elutedfractions
(D): R-BlaR1 inserted in LUVs analysed by SDS-PAGE revealed by penicillin-binding assay. 1:concentratedpurifiedR-BlaR1fractionbeforeitsinsertioninLUVs;2-3,washfractionsafterR-BlaR1insertioninLUVs;4:R-BlaR1includedinLUVssolubilisedbySDS.
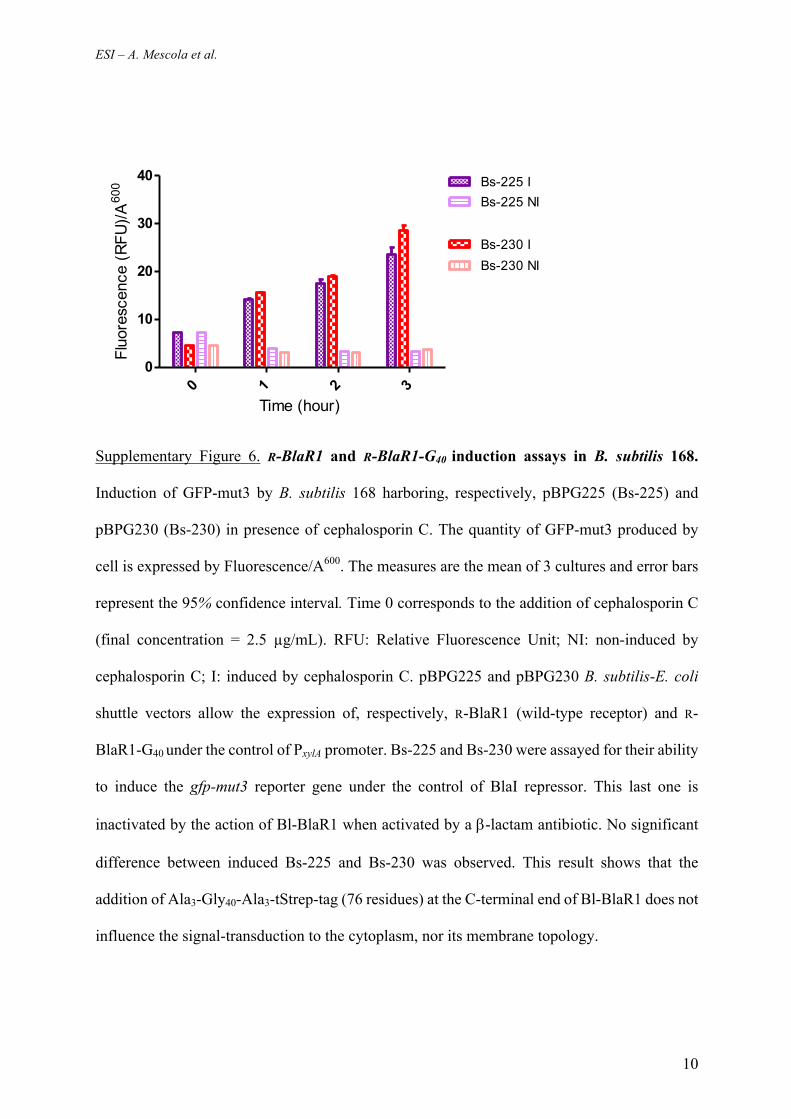
pBPG225 and pBPG230 B. subtilis-E. coli shuttle vectors allow the expression of Bl-BlaR1 (wild-typereceptor) and Bl-BlaR-G40-tStrep-tag under the control of PxylA promoter (for more details see S1.1). B.subtilis 168was transformedby pBPG225 and pBPG230 to generateB. subtilis-pBPG225 (Bs-225) andB.subtilis-pBPG230(Bs-230),respectively.Bs-225andBs-230wereassayedfortheirabilitytoinducethegfp-mut3reportergeneunderthecontrolofBlaIrepressor.ThislastoneisinactivatedbytheactionofBl-BlaR1whenactivatedbyab-lactamantibiotic (formoredetails seeFigureS1.1).The two recombinants strainsweregrowninLBmediumsupplementedwithkanamycin(10µg/ml)andxylose(1%,g/ml)untilthecellulardensity reached a value of A600nn= 0.6, then cephalosporin C (a b-lactam antibiotic) was added (finalconcentration:2.5µg/ml).TheGFP-mut3fluorescencewasmeasured(lexcitation=485nmandlemission=528
ESI – A. Mescola et al.
8
Supplementary Figure 4. Orientation of R-BlaR1 in Supported Lipid Bilayers (SLBs). AFM
topographic reconstruction of R-BlaR1 within SBLs on gold surface, after the introduction of
gold nanoparticles coupled to streptavidin. Planar and 3D AFM images (A and B). Profile
extracted from the planar reconstruction (C). The measured dimensions are highly dependent
on the geometry of the tip4–6, therefore, the measured lateral sizes are usually larger than the
true dimensions. Following a theoretical approach7, it is possible to establish that the width
values recorded are consistent with the real size of the object detected.
The original diameter of the Au nanoparticles is around 40 nm. To compare the apparent width
given by the AFM images with the original dimension, we used following equation:
where d is the apparent width of a spherical feature of radius r scanned by a tip with the radius
R. Using the apparent width measured (85 nm) and tip curvature radius, we found a radius of
the scanned object around 20 nm that is consistent with the Au nanoparticle dimension.
Thus, we can conclude that the objects revealed by AFM experiments corresponds to the gold
nanoparticles, confirming that the sensor domain of R-BlaR1 (BlaRS) is exposed to the external
side of proteoliposomes and accessible to the AFM tip.
A
B
C
A
ESI – A. Mescola et al.
9
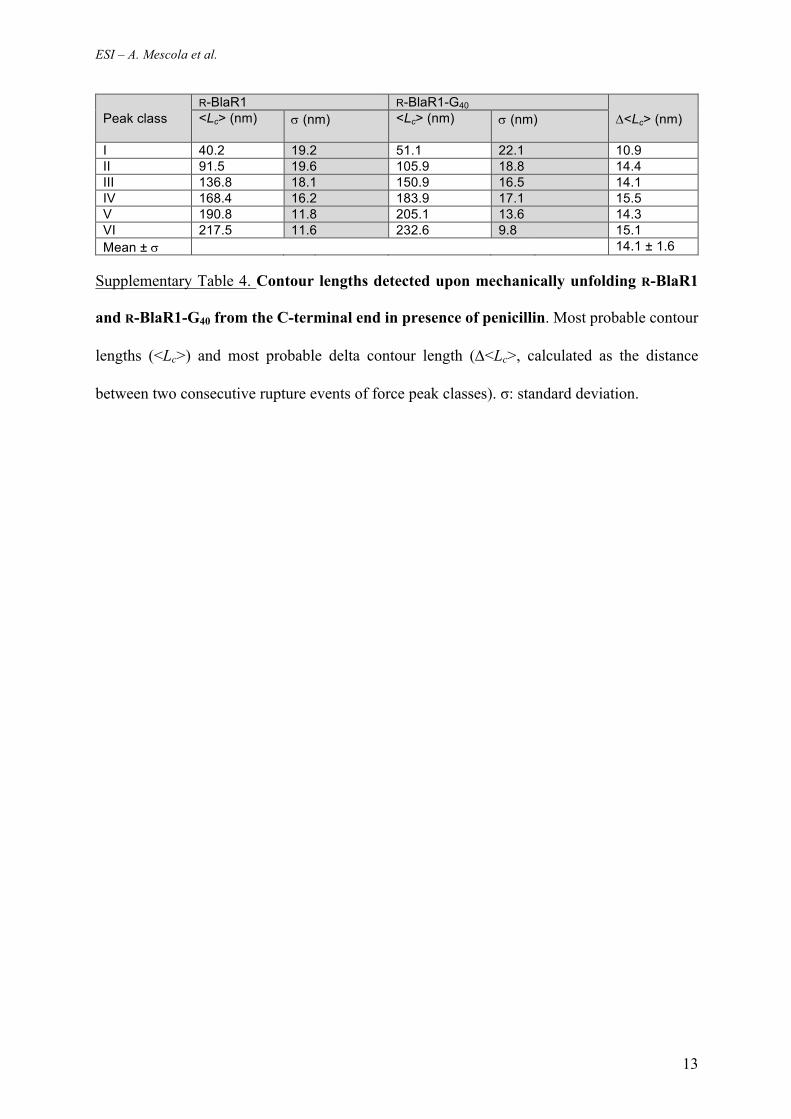
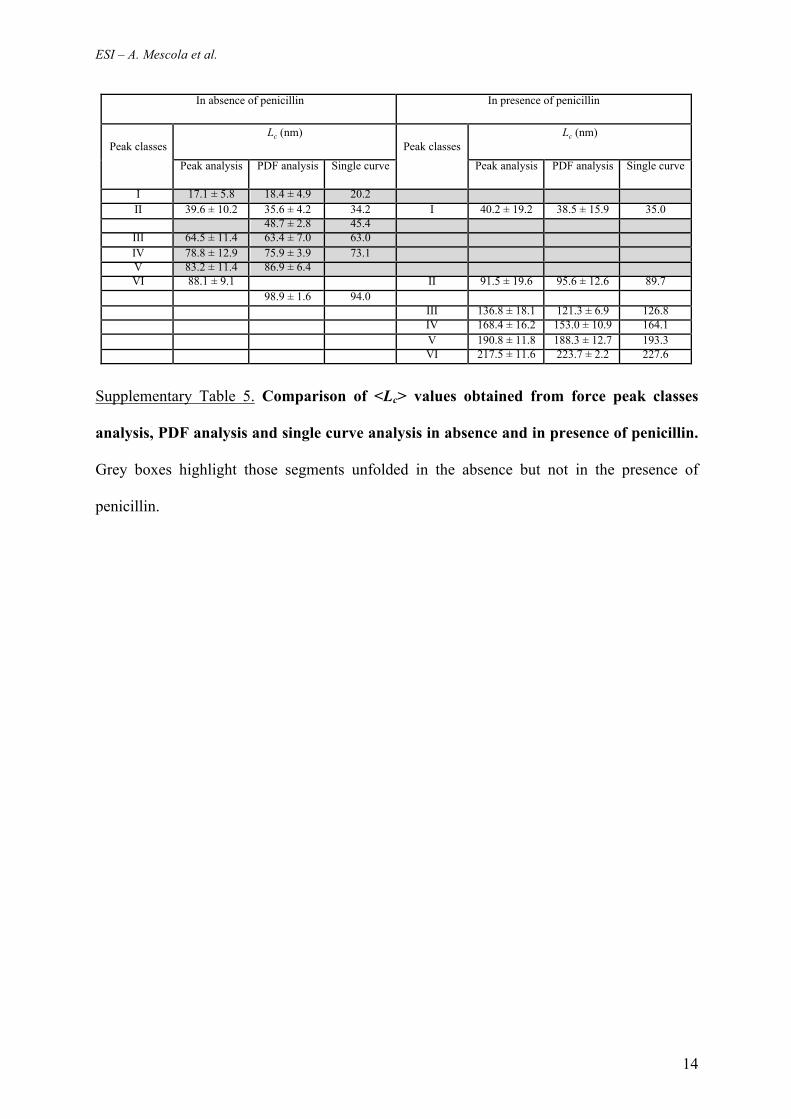
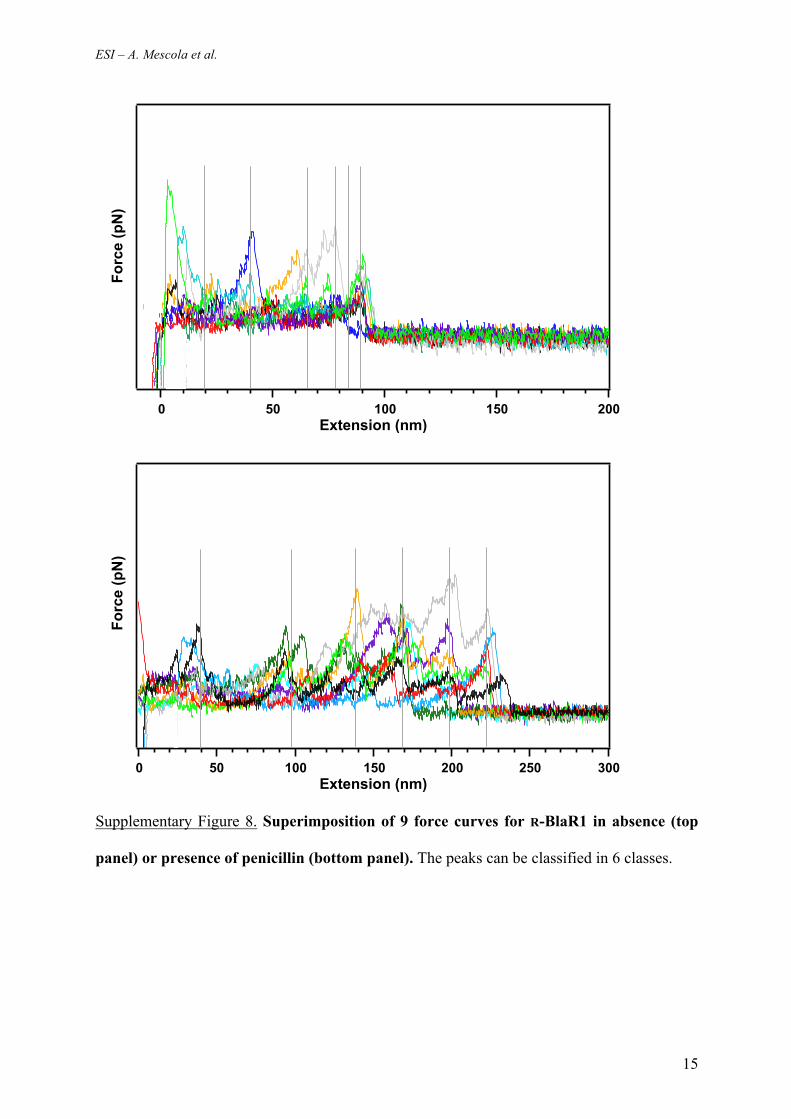
Supplementary Figure 5. Analysis of F-D curves having at least one rupture event, in
absence and presence of penicillin. Data analysis including all the F-D curves that have at
least one rupture event, in the absence (grey) and in the presence (orange) of penicillin. (A) and
(D): probability of number of rupture events in F-D curves. (B) and (E): contour length (Lc)
distribution histograms obtained by collecting all the Lc values recorded for each peak detected
in all F-D curves. (C) and (F): rupture force (Fr) histograms obtained by collecting all Fr
recorded for each peak detected in all F-D curves. B, C, E and F histograms were fitted with
single Gaussians (dashed line). Lc and Fr values are shown with their standard deviations. The
number F-D curves analyzed are shown in the boxes. For each F-D curve, all the rupture events
were fitted with the worm-like-chain (WLC) model to determine the length at maximum
extension (contour length, Lc) of the receptor segment that is stretched and unfolded.
cephalosporin C; I: induced by cephalosporin C. pBPG225 and pBPG230 B. subtilis-E. coli
shuttle vectors allow the expression of, respectively, R-BlaR1 (wild-type receptor) and R-
BlaR1-G40 under the control of PxylA promoter. Bs-225 and Bs-230 were assayed for their ability
to induce the gfp-mut3 reporter gene under the control of BlaI repressor. This last one is
inactivated by the action of Bl-BlaR1 when activated by a b-lactam antibiotic. No significant
difference between induced Bs-225 and Bs-230 was observed. This result shows that the
addition of Ala3-Gly40-Ala3-tStrep-tag (76 residues) at the C-terminal end of Bl-BlaR1 does not
influence the signal-transduction to the cytoplasm, nor its membrane topology.
ESI – A. Mescola et al.
11
Supplementary Figure 7. Comparison of R-BlaR1 and R-BlaR1-G40 F-D curves exhibiting
the maximum extension in absence or presence of penicillin. F-D curves exhibiting the
maximum extension and recorded from single R-BlaR1 (dashed line) and single C- terminally
elongated R-BlaR1 by Ala3-Gly40 peptide (R-BlaR1-G40, solid line) in absence (A) or in
presence of penicillin (B).
Page11of16
FigureS2.6.F-DcurvesexhibitingthemaximumextensionandrecordedfromsingleR-BlaR1(dashedline)and single C- terminally elongated R-BlaR1 by Ala3-Gly40 peptide (R-BlaR1-G40, solid line) inabsence(A)orinpresenceofpenicillin(B)
FigureS2.7.Probabilitydistributionsofcontourlength(Lc)foreachrupturepeakclass,computedfromFDcurves exhibiting themaximum extension for R-BlaR1 and single C- terminally elongated R-BlaR1byAla3-Gly40peptide(R-BlaR1-G40)inabsence(A,B)orinpresenceofpenicillin(C,D)