Elliott Wave Scan Results * Nasdaq-100 Component Stocks * 160319 To search for a ticker, use Ctrl F and search for (TIKR .. that is, use a ( before the ticker symbol. For summary sorted by Ticker, go to page 6. For summary sorted by Patterns, go to page 10. For summary sorted by Trade Type and Rating, go to page 14. For summary sorted by Better Than Random, go to page 18. Use Ctrl N to jump to page number. Note: Any ticker for which there is no chart indicates that the Elliott Wave analyzer found "no incomplete wave patterns" and therefore recommends you "stay out of the market" with that ticker. A word of CAUTION about these Elliott Wave forecast charts -- keep in mind that these chart sets are produced by a "scanner" feature that does not optimize the wave pattern selection beyond a very basic level. The scanner picks what it considers the "best fit" from the various possible pattern sequences. When you do a manual analysis, you would normally evaluate long term wave patterns, then shorter and shorter patterns and - most importantly - you would then match the short term pattern choices so they fit properly with the longer term patterns. Using the scanner feature to create "short term" predictions (from days to a few weeks), we are using only a small sample of the most recent data. Otherwise, the chart and patterns become congested and difficult to read. So, IF the scanner starts the short term wave count at an appropriate point and with the appropriate starting pattern, then the resulting prediction will be quite accurate. Otherwise, it is just one of many possibilities. Remember, also, that we provide a sorted list at the front of the chart sets where the Longs and Shorts are sorted based on the Rating. Ratings under 80 are not considered valid. The higher the rating, over 80, the more likely it is to be valid and important. Refer also to the BTR (Better Than Random) rating, which gives another measure of how relevant the forecast may be. Pattern sort is first by pattern (ascending), then by degree (ascending) and then by wave (descending, that is - latest waves first). Rating sort is by rating (descending) with Longs grouped first, then Shorts grouped; high numbers better, below 80 is "suspect." BTR sort is "Better Than Random" and shows the statistical probability that the prediction is better than random. WAVE DEGREES (from longer to shorter times): Grand, Supercycle, Cycle, Primary, Intermediate, Minor, Minute, Minuette, SubMinuette, Micro For some guidance on interpreting the EW charts provided here, download this file: http://jimcooper.biz/stockcharts/Interpreting_ewa_charts_02.pdf See next page for hyperlinked Table of Contents listed by Security name.
To search for a ticker, use Ctrl F and search for (TIKR .. that is, use a ( before the ticker symbol. For summary sorted by Ticker, go to page 6.
For summary sorted by Patterns, go to page 10.
For summary sorted by Trade Type and Rating, go to page 14.
For summary sorted by Better Than Random, go to page 18.
Use Ctrl N to jump to page number.
Note: Any ticker for which there is no chart indicates that the Elliott Wave analyzer found "no incomplete wave patterns" and therefore recommends you "stay out of the market" with that ticker.
A word of CAUTION about these Elliott Wave forecast charts -- keep in mind that these chart sets are produced by a "scanner" feature that does not optimize the wave pattern selection beyond a very basic level. The scanner picks what it considers the "best fit" from the various possible pattern sequences. When you do a manual analysis, you would normally evaluate long term wave patterns, then shorter and shorter patterns and - most importantly - you would then match the short term pattern choices so they fit properly with the longer term patterns. Using the scanner feature to create "short term" predictions (from days to a few weeks), we are using only a small sample of the most recent data. Otherwise, the chart and patterns become congested and difficult to read. So, IF the scanner starts the short term wave count at an appropriate point and with the appropriate starting pattern, then the resulting prediction will be quite accurate. Otherwise, it is just one of many possibilities. Remember, also, that we provide a sorted list at the front of the chart sets where the Longs and Shorts are sorted based on the Rating. Ratings under 80 are not considered valid. The higher the rating, over 80, the more likely it is to be valid and important. Refer also to the BTR (Better Than Random) rating, which gives another measure of how relevant the forecast may be.
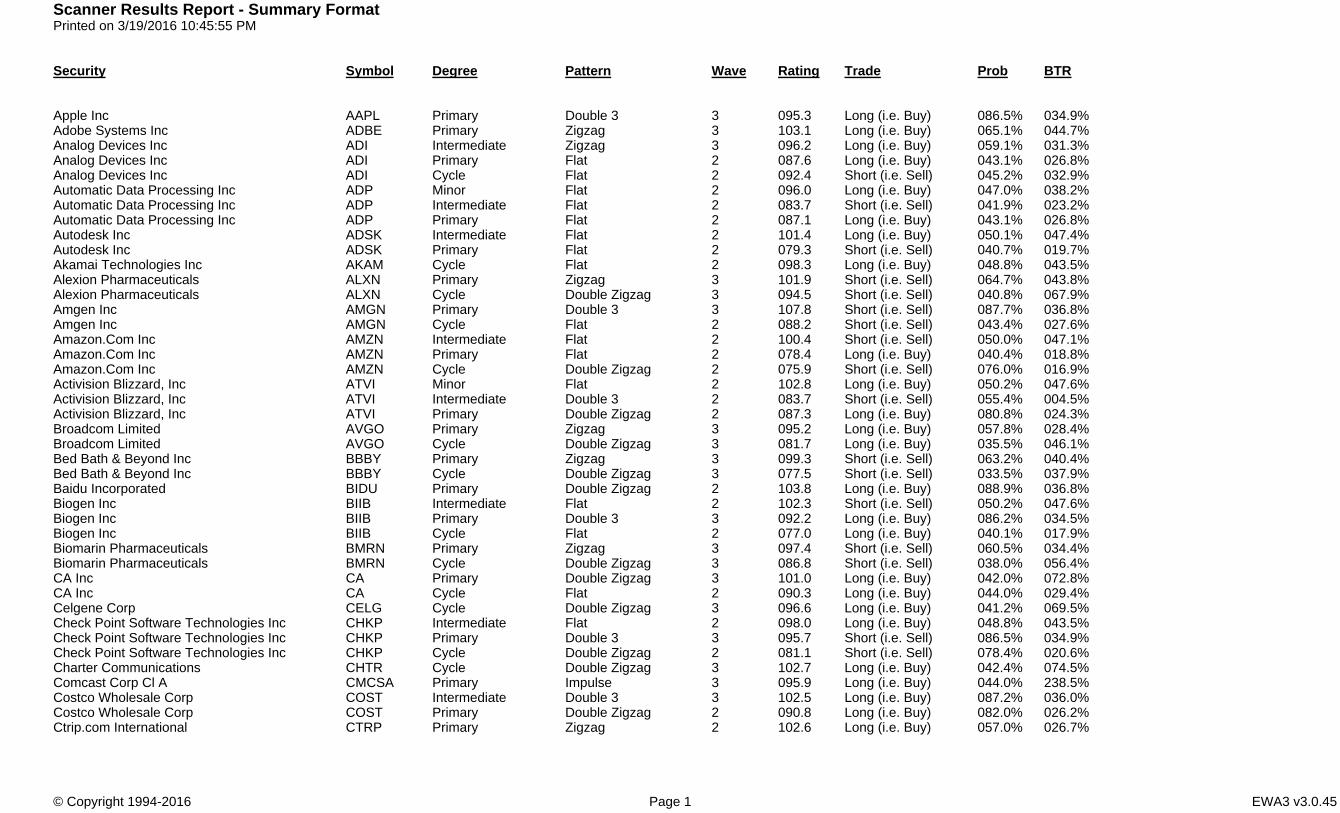
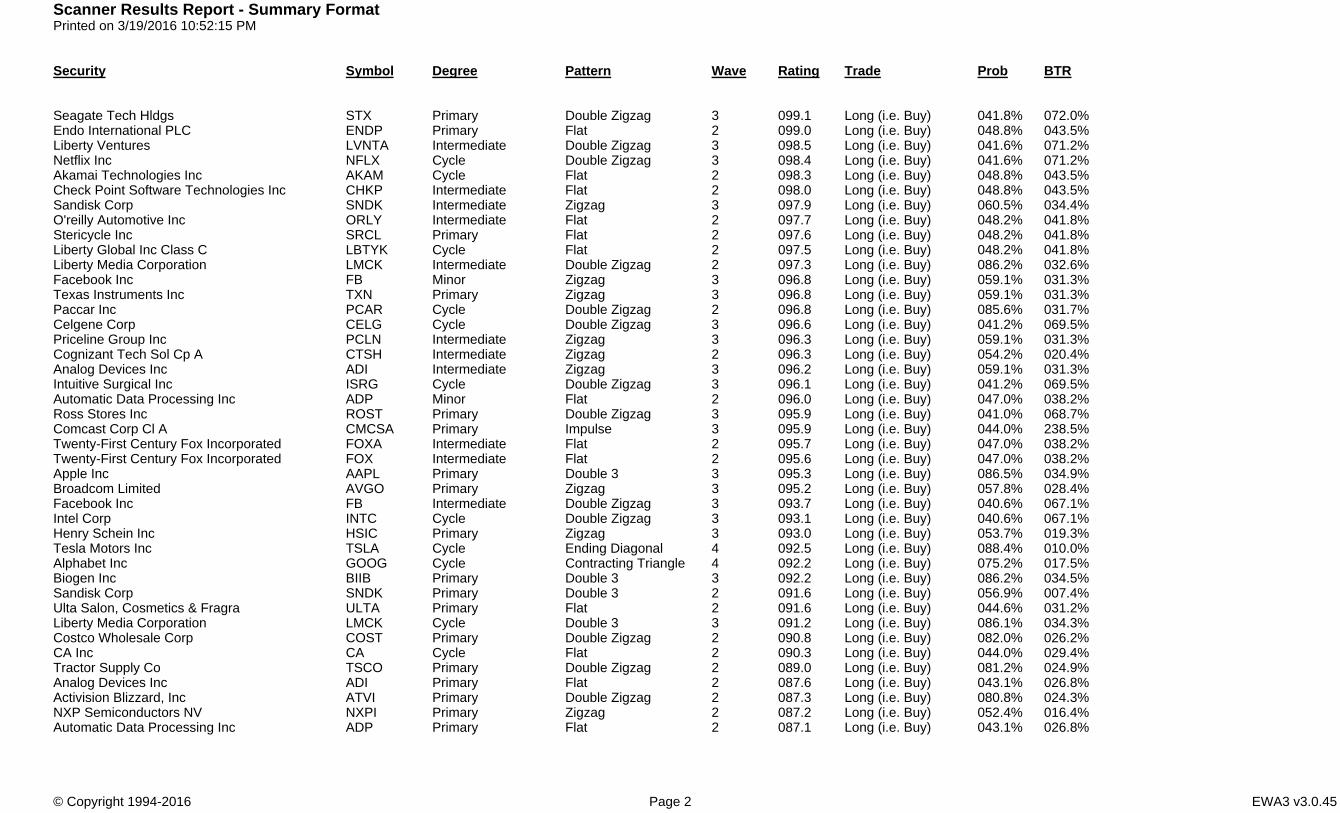
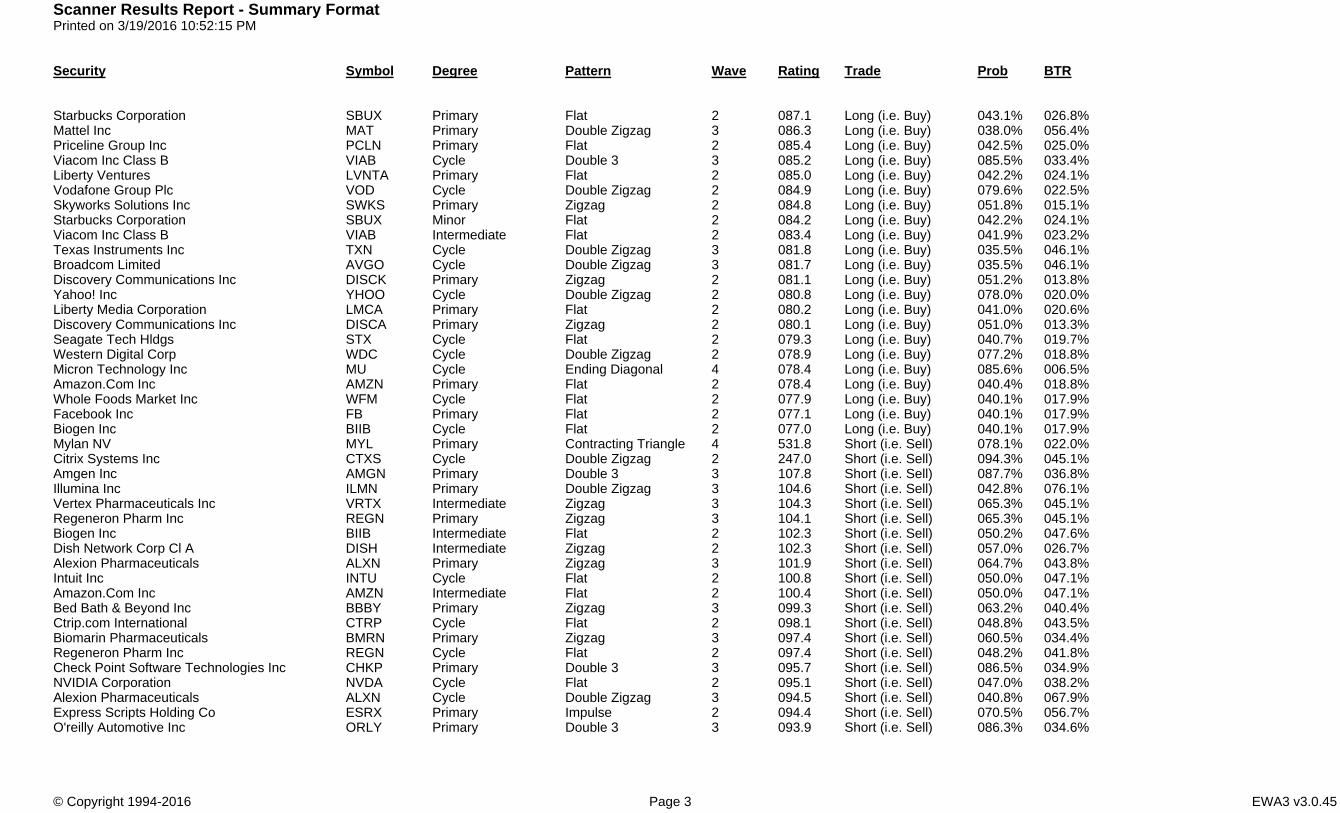
Pattern sort is first by pattern (ascending), then by degree (ascending) and then by wave (descending, that is - latest waves first).
Rating sort is by rating (descending) with Longs grouped first, then Shorts grouped; high numbers better, below 80 is "suspect."
BTR sort is "Better Than Random" and shows the statistical probability that the prediction is better than random.
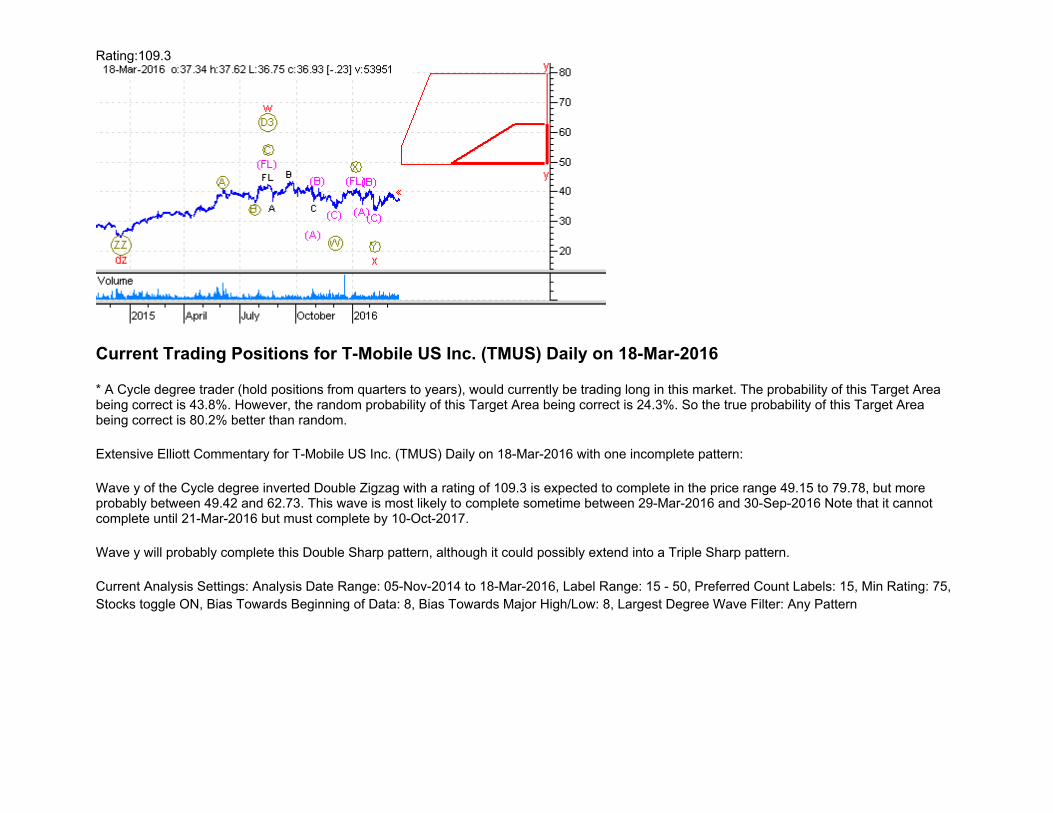
Current Trading Positions for Activision Blizzard, Inc (ATVI) Daily on 18-Mar-2016
* A Minor degree trader (hold positions from weeks to quarters), would currently be trading long in this market. The probability of this Target Area being correct is 50.2%. However, the random probability of this Target Area being correct is 34.0%. So the true probability of this Target Area being correct is 47.6% better than random.
* An Intermediate degree trader (hold positions from months to quarters), would currently be shorting this market. The probability of this Target Area being correct is 55.4%. However, the random probability of this Target Area being correct is 53.0%. So the true probability of this Target Area being correct is 4.5% better than random.
* A Primary degree trader (hold positions from months to years), would currently be trading long in this market. The probability of this Target Area being correct is 80.8%. However, the random probability of this Target Area being correct is 65.0%. So the true probability of this Target Area being correct is 24.3% better than random.
Extensive Elliott Commentary for Activision Blizzard, Inc (ATVI) Daily on 18-Mar-2016 with three incomplete patterns:
Wave B of the Minor degree Flat with a rating of 102.8 is expected to complete in the price range 31.9 to 39.86, but more probably between 31.94 and 33.45. This wave is due to complete anytime from now until 27-May-2016, but is most likely to complete before 01-Apr-2016.
After wave B is complete, expect the market to continue down into wave C, which should be a five wave Impulsive pattern. Expect wave C to retrace wave B by 89% - 167%. Wave C can also be expected to be 104% - 167% of the price length of wave A. The expected time for wave C to complete is 20% - 146% of the time taken for wave B to complete and 53% - 275% of the time taken for wave A to complete.
Wave (X) of the Intermediate degree inverted Double 3 with a rating of 83.7 is expected to complete in the price range 9.86 to 30.88, but more probably between 27.63 and 29.42. This wave is due to complete anytime from now until 03-Jun-2016, but is most likely to complete before 18-Mar-2016.
After wave (X) is complete, expect the market to continue up into wave (Y), which will probably be a three wave corrective pattern. Expect wave (Y) to retrace wave (X) by 98% - 212%. Wave (Y) can also be expected to be 73% - 212% of the price length of wave (W). The expected time for wave (Y) to complete is 27% - 214% of the time taken for wave (X) to complete and 38% - 222% of the time taken for wave (W) to complete.
Wave X of the Primary degree Double Zigzag with a rating of 87.3 is expected to complete in the price range 30.3 to 39.93, but more probably between 32.44 and 37.31. This wave is due to complete anytime from now until 08-Jul-2016, but is most likely to complete before 11-Apr-2016.
After wave X is complete, expect the market to continue down into wave Y, which should be a three wave Zigzag pattern. Expect wave Y to retrace wave X by 115% - 269%. Wave Y can also be expected to be 90% - 269% of the price length of wave W. The expected time for wave Y to complete is 22% - 147% of the time taken for wave X to complete and 53% - 204% of the time taken for wave W to complete.
Current Analysis Settings: Analysis Date Range: 13-Jan-2014 to 18-Mar-2016, Label Range: 15 - 50, Preferred Count Labels: 31, Min Rating: 75, Stocks toggle ON, Bias Towards Beginning of Data: 8, Bias Towards Major High/Low: 8, Largest Degree Wave Filter: Any Pattern
Rating:103.1
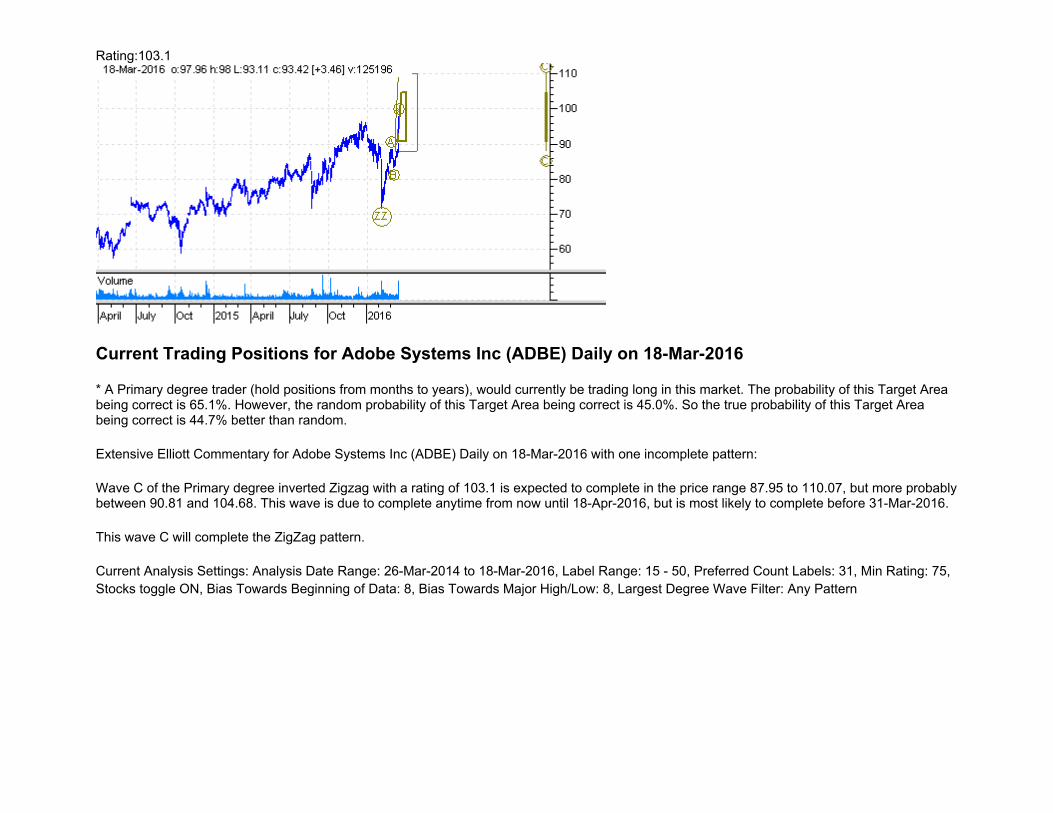
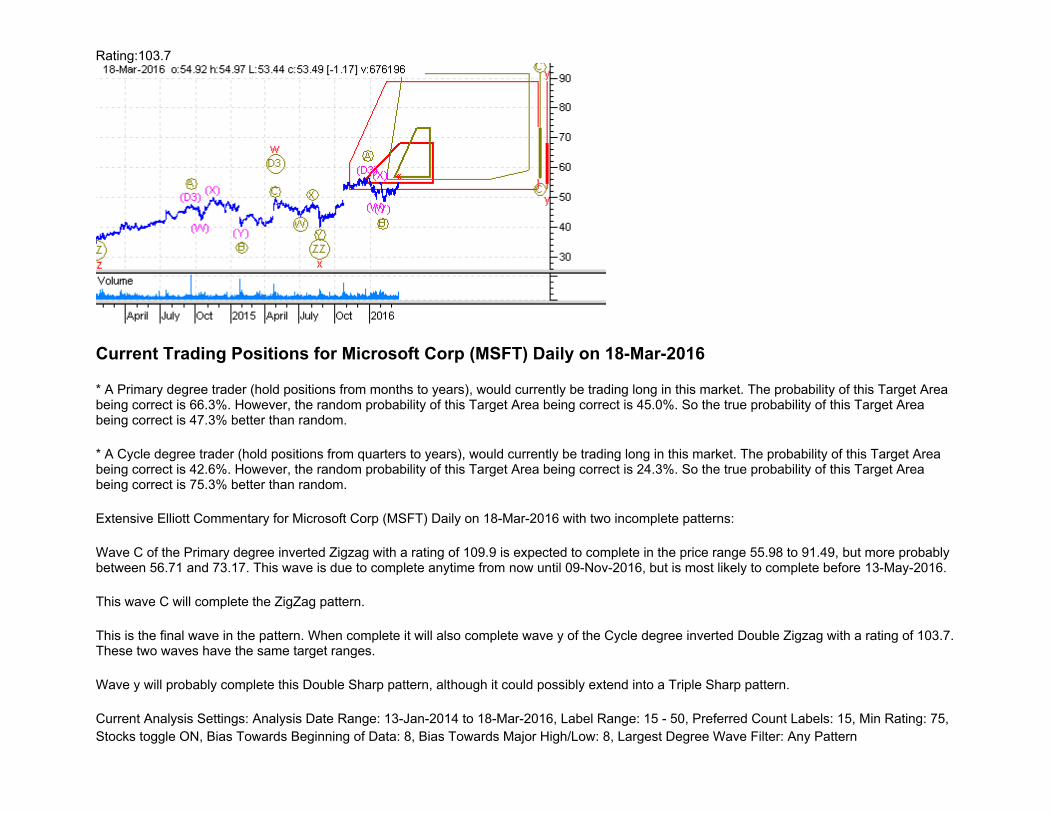
Current Trading Positions for Adobe Systems Inc (ADBE) Daily on 18-Mar-2016
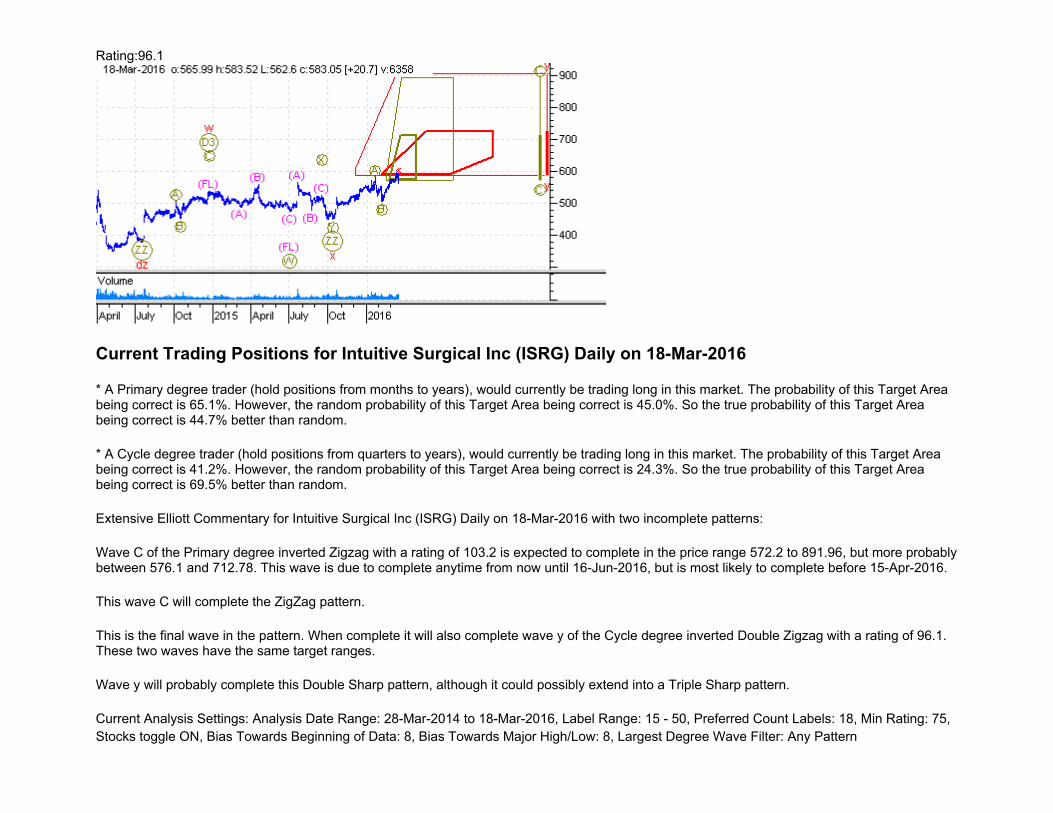
* A Primary degree trader (hold positions from months to years), would currently be trading long in this market. The probability of this Target Area being correct is 65.1%. However, the random probability of this Target Area being correct is 45.0%. So the true probability of this Target Area being correct is 44.7% better than random.
Extensive Elliott Commentary for Adobe Systems Inc (ADBE) Daily on 18-Mar-2016 with one incomplete pattern:
Wave C of the Primary degree inverted Zigzag with a rating of 103.1 is expected to complete in the price range 87.95 to 110.07, but more probably between 90.81 and 104.68. This wave is due to complete anytime from now until 18-Apr-2016, but is most likely to complete before 31-Mar-2016.
This wave C will complete the ZigZag pattern.
Current Analysis Settings: Analysis Date Range: 26-Mar-2014 to 18-Mar-2016, Label Range: 15 - 50, Preferred Count Labels: 31, Min Rating: 75, Stocks toggle ON, Bias Towards Beginning of Data: 8, Bias Towards Major High/Low: 8, Largest Degree Wave Filter: Any Pattern
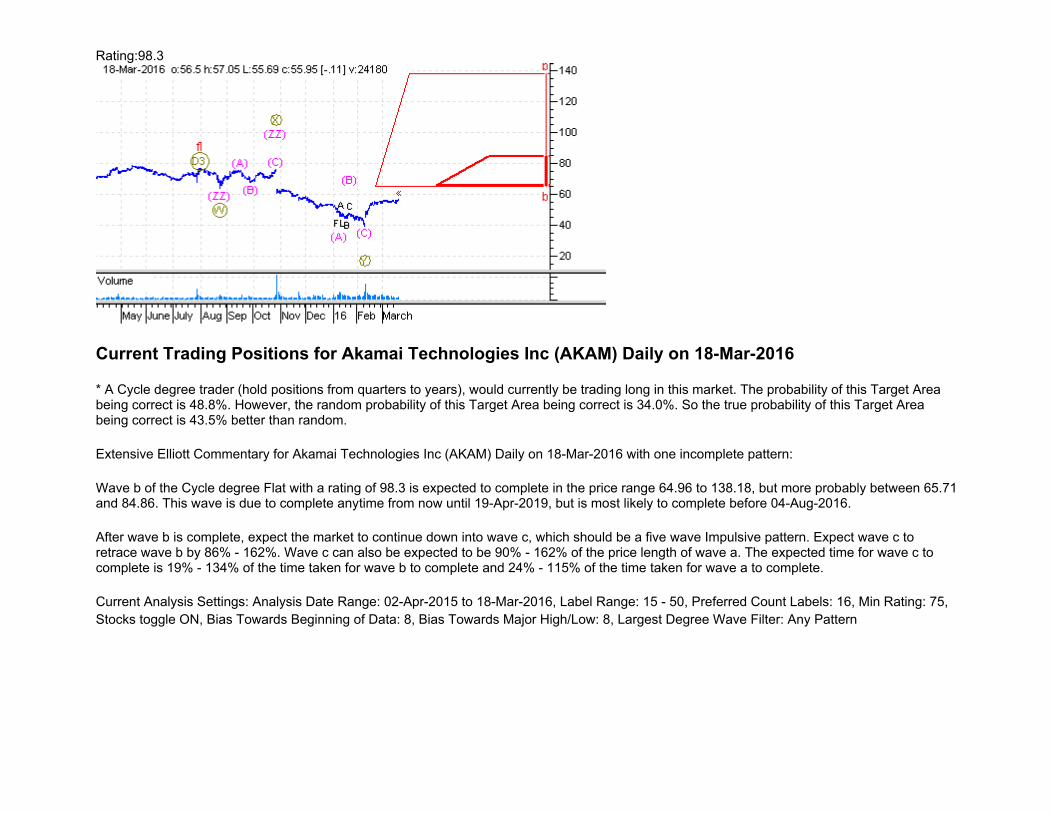
Rating:98.3
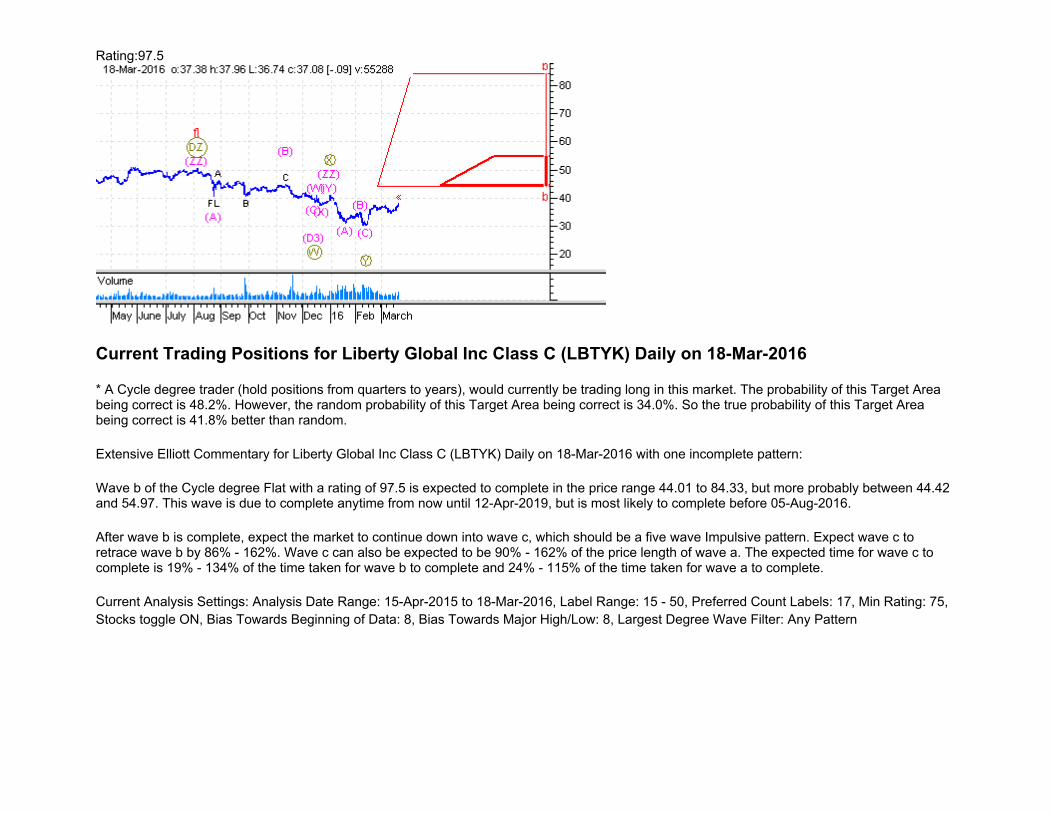
Current Trading Positions for Akamai Technologies Inc (AKAM) Daily on 18-Mar-2016
* A Cycle degree trader (hold positions from quarters to years), would currently be trading long in this market. The probability of this Target Area being correct is 48.8%. However, the random probability of this Target Area being correct is 34.0%. So the true probability of this Target Area being correct is 43.5% better than random.
Extensive Elliott Commentary for Akamai Technologies Inc (AKAM) Daily on 18-Mar-2016 with one incomplete pattern:
Wave b of the Cycle degree Flat with a rating of 98.3 is expected to complete in the price range 64.96 to 138.18, but more probably between 65.71 and 84.86. This wave is due to complete anytime from now until 19-Apr-2019, but is most likely to complete before 04-Aug-2016.
After wave b is complete, expect the market to continue down into wave c, which should be a five wave Impulsive pattern. Expect wave c to retrace wave b by 86% - 162%. Wave c can also be expected to be 90% - 162% of the price length of wave a. The expected time for wave c to complete is 19% - 134% of the time taken for wave b to complete and 24% - 115% of the time taken for wave a to complete.
Current Analysis Settings: Analysis Date Range: 02-Apr-2015 to 18-Mar-2016, Label Range: 15 - 50, Preferred Count Labels: 16, Min Rating: 75, Stocks toggle ON, Bias Towards Beginning of Data: 8, Bias Towards Major High/Low: 8, Largest Degree Wave Filter: Any Pattern
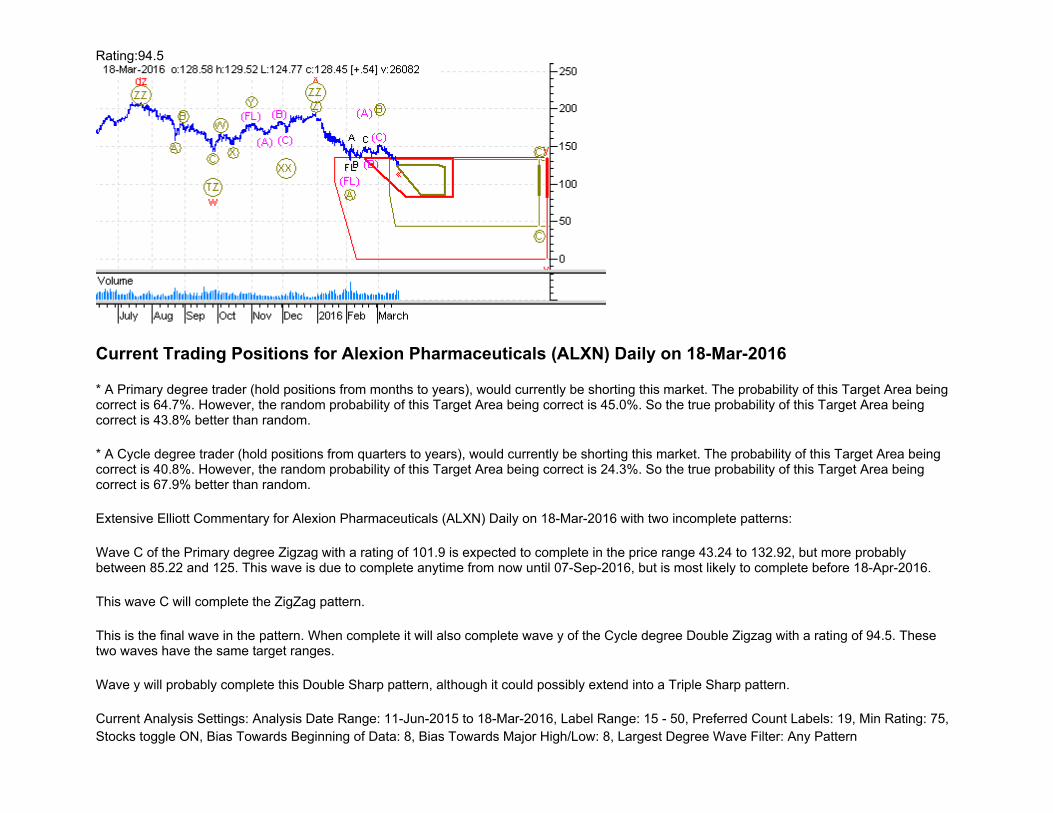
Rating:94.5
Current Trading Positions for Alexion Pharmaceuticals (ALXN) Daily on 18-Mar-2016
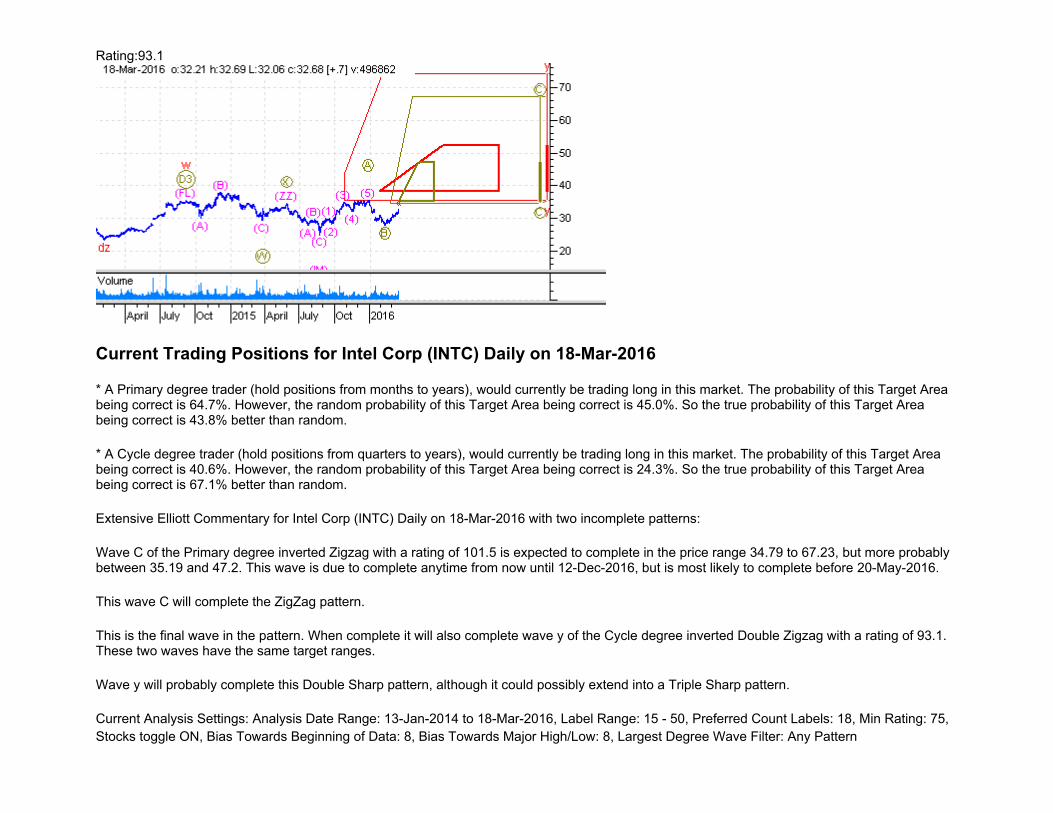
* A Primary degree trader (hold positions from months to years), would currently be shorting this market. The probability of this Target Area being correct is 64.7%. However, the random probability of this Target Area being correct is 45.0%. So the true probability of this Target Area being correct is 43.8% better than random.
* A Cycle degree trader (hold positions from quarters to years), would currently be shorting this market. The probability of this Target Area being correct is 40.8%. However, the random probability of this Target Area being correct is 24.3%. So the true probability of this Target Area being correct is 67.9% better than random.
Extensive Elliott Commentary for Alexion Pharmaceuticals (ALXN) Daily on 18-Mar-2016 with two incomplete patterns:
Wave C of the Primary degree Zigzag with a rating of 101.9 is expected to complete in the price range 43.24 to 132.92, but more probably between 85.22 and 125. This wave is due to complete anytime from now until 07-Sep-2016, but is most likely to complete before 18-Apr-2016.
This wave C will complete the ZigZag pattern.
This is the final wave in the pattern. When complete it will also complete wave y of the Cycle degree Double Zigzag with a rating of 94.5. These two waves have the same target ranges.
Wave y will probably complete this Double Sharp pattern, although it could possibly extend into a Triple Sharp pattern.
Current Analysis Settings: Analysis Date Range: 11-Jun-2015 to 18-Mar-2016, Label Range: 15 - 50, Preferred Count Labels: 19, Min Rating: 75, Stocks toggle ON, Bias Towards Beginning of Data: 8, Bias Towards Major High/Low: 8, Largest Degree Wave Filter: Any Pattern
Rating:88.5
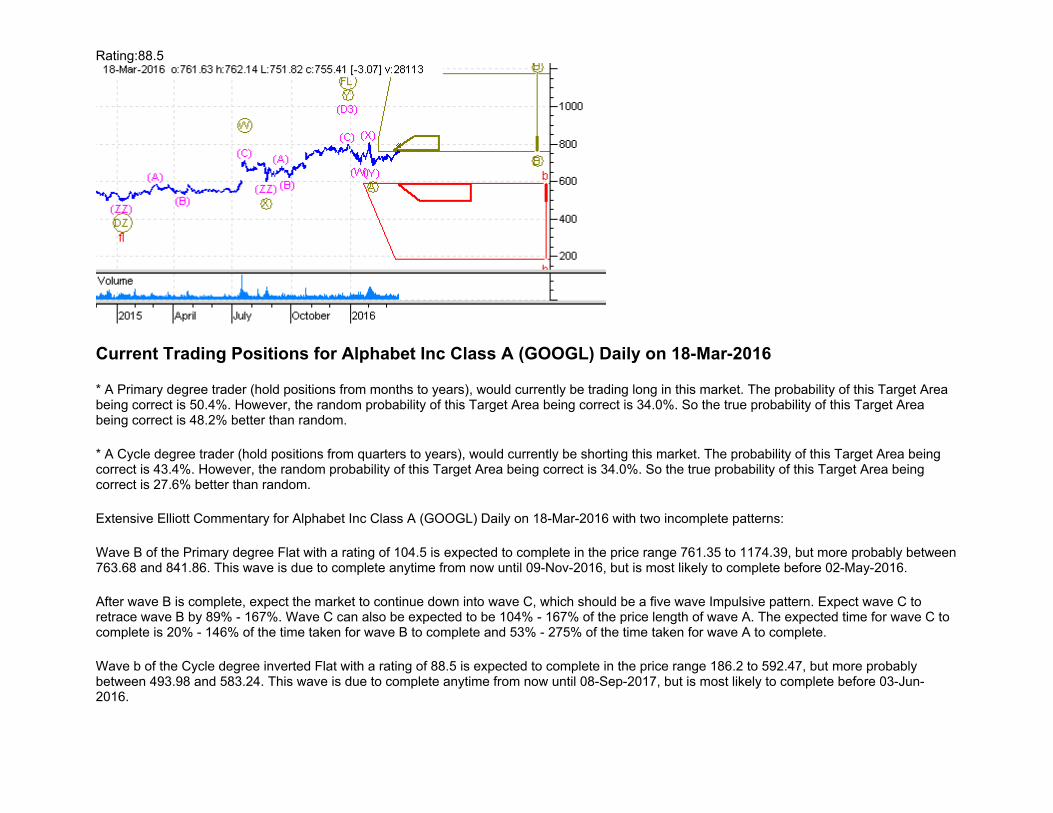
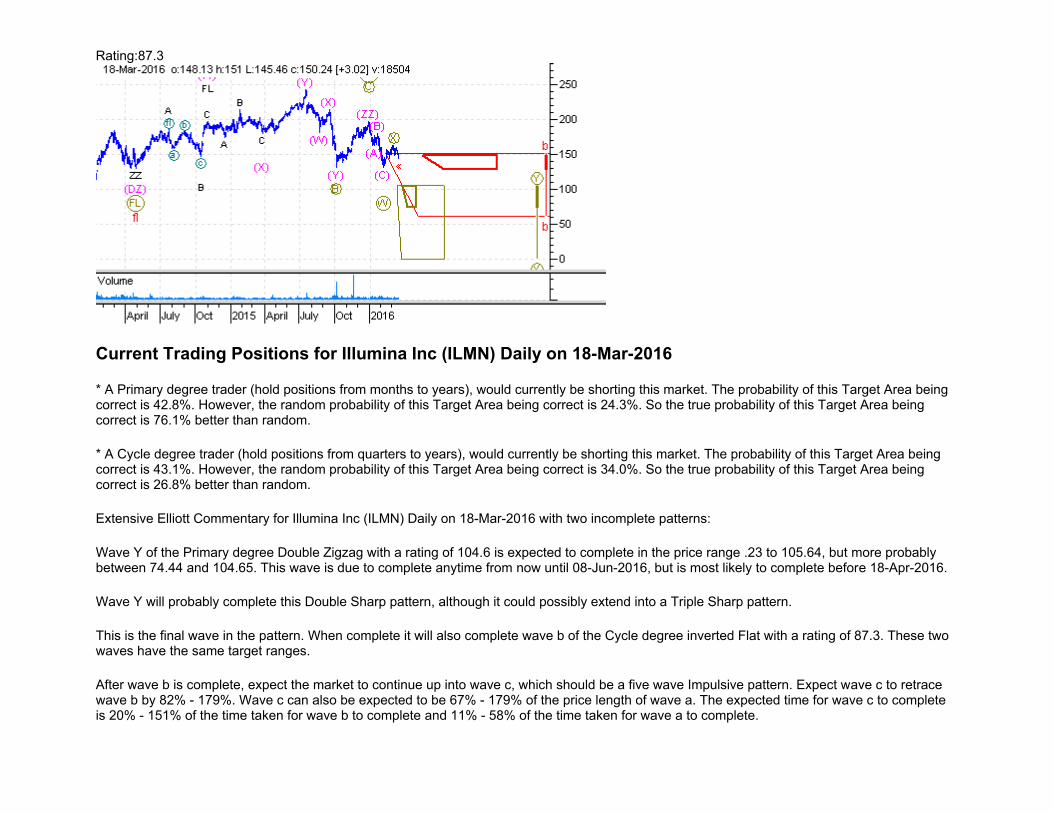
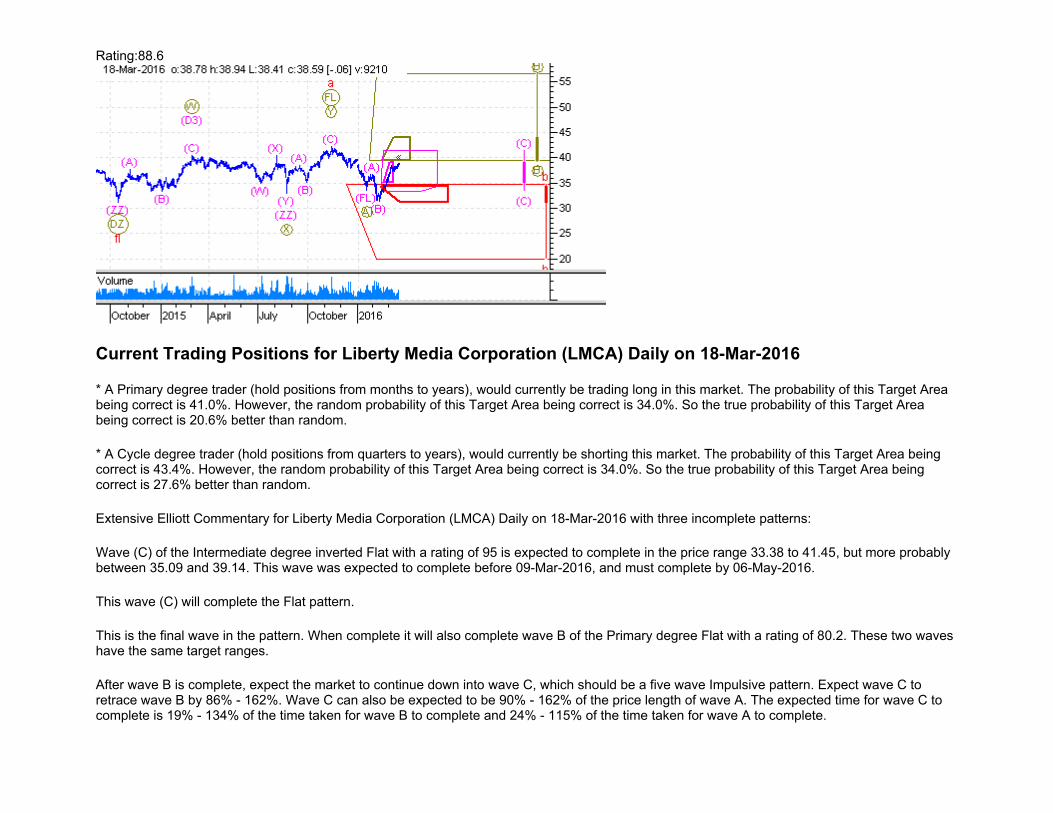
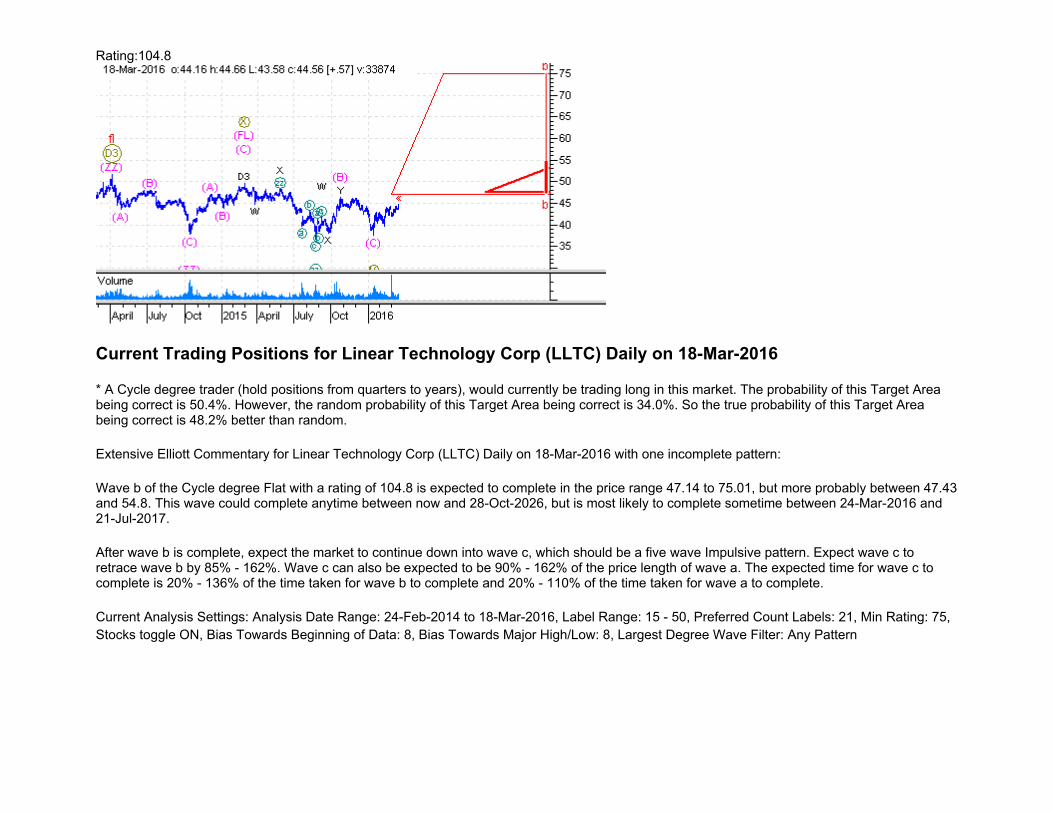
Current Trading Positions for Alphabet Inc Class A (GOOGL) Daily on 18-Mar-2016
* A Primary degree trader (hold positions from months to years), would currently be trading long in this market. The probability of this Target Area being correct is 50.4%. However, the random probability of this Target Area being correct is 34.0%. So the true probability of this Target Area being correct is 48.2% better than random.
* A Cycle degree trader (hold positions from quarters to years), would currently be shorting this market. The probability of this Target Area being correct is 43.4%. However, the random probability of this Target Area being correct is 34.0%. So the true probability of this Target Area being correct is 27.6% better than random.
Extensive Elliott Commentary for Alphabet Inc Class A (GOOGL) Daily on 18-Mar-2016 with two incomplete patterns:
Wave B of the Primary degree Flat with a rating of 104.5 is expected to complete in the price range 761.35 to 1174.39, but more probably between 763.68 and 841.86. This wave is due to complete anytime from now until 09-Nov-2016, but is most likely to complete before 02-May-2016.
After wave B is complete, expect the market to continue down into wave C, which should be a five wave Impulsive pattern. Expect wave C to retrace wave B by 89% - 167%. Wave C can also be expected to be 104% - 167% of the price length of wave A. The expected time for wave C to complete is 20% - 146% of the time taken for wave B to complete and 53% - 275% of the time taken for wave A to complete.
Wave b of the Cycle degree inverted Flat with a rating of 88.5 is expected to complete in the price range 186.2 to 592.47, but more probably between 493.98 and 583.24. This wave is due to complete anytime from now until 08-Sep-2017, but is most likely to complete before 03-Jun-2016.
After wave b is complete, expect the market to continue up into wave c, which should be a five wave Impulsive pattern. Expect wave c to retrace wave b by 82% - 179%. Wave c can also be expected to be 67% - 179% of the price length of wave a. The expected time for wave c to complete is 20% - 151% of the time taken for wave b to complete and 11% - 58% of the time taken for wave a to complete.
Current Analysis Settings: Analysis Date Range: 28-Nov-2014 to 18-Mar-2016, Label Range: 15 - 50, Preferred Count Labels: 15, Min Rating: 75, Stocks toggle ON, Bias Towards Beginning of Data: 8, Bias Towards Major High/Low: 8, Largest Degree Wave Filter: Any Pattern
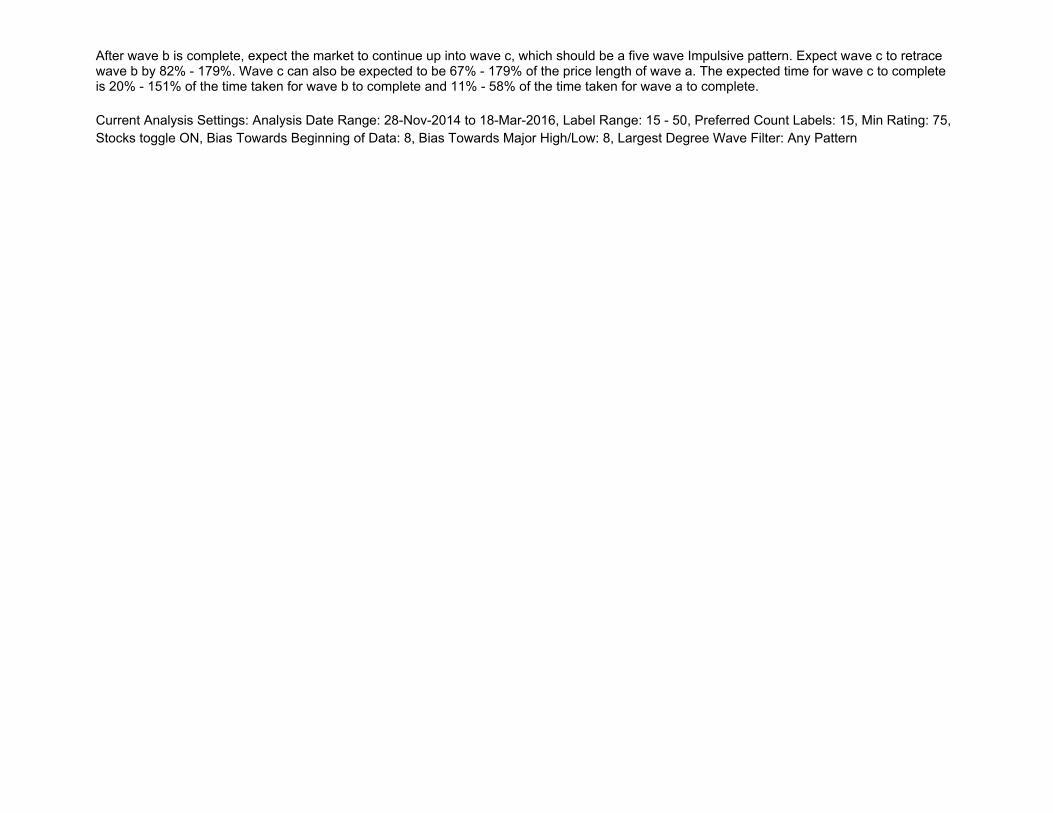
Rating:92.2
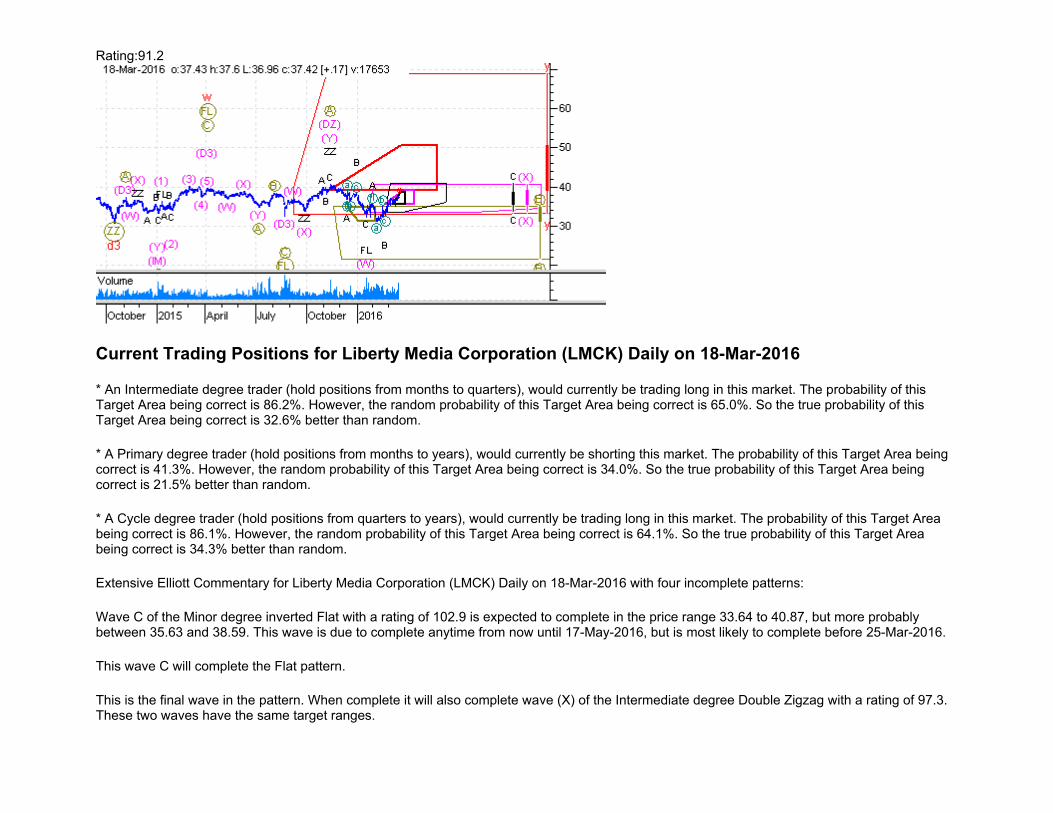
Current Trading Positions for Alphabet Inc (GOOG) Daily on 18-Mar-2016
* A Cycle degree trader (hold positions from quarters to years), would currently be trading long in this market. The probability of this Target Area being correct is 75.2%. However, the random probability of this Target Area being correct is 64.0%. So the true probability of this Target Area being correct is 17.5% better than random.
Extensive Elliott Commentary for Alphabet Inc (GOOG) Daily on 18-Mar-2016 with one incomplete pattern:
Wave d of the Cycle degree Contracting Triangle with a rating of 92.2 is expected to complete in the price range 725.38 to 779.98, but more probably between 738.86 and 758.4. This wave was expected to complete before 16-Mar-2016, and must complete by 09-May-2016.
Once this wave d is complete, expect the market to continue down to the end of wave e, which will most probably be a ZigZag family pattern or possibly a Contracting Triangle. Expect wave e to have between 39% and 67% of the price range of wave c and complete in 6% to 60% of the time taken by wave c. Expect also that wave e will have between 22% and 49% of the price range of wave a and complete in 3% to 29% of the time taken by wave a. The slope (ie. price range divided by time taken) of wave e should be between 28% and 143% of the slope of wave c and between 19% to 183% of the slope of wave a. Wave e will complete this Contracting Triangle.
Current Analysis Settings: Analysis Date Range: 28-Nov-2014 to 18-Mar-2016, Label Range: 15 - 50, Preferred Count Labels: 19, Min Rating: 75, Stocks toggle ON, Bias Towards Beginning of Data: 8, Bias Towards Major High/Low: 8, Largest Degree Wave Filter: Any Pattern
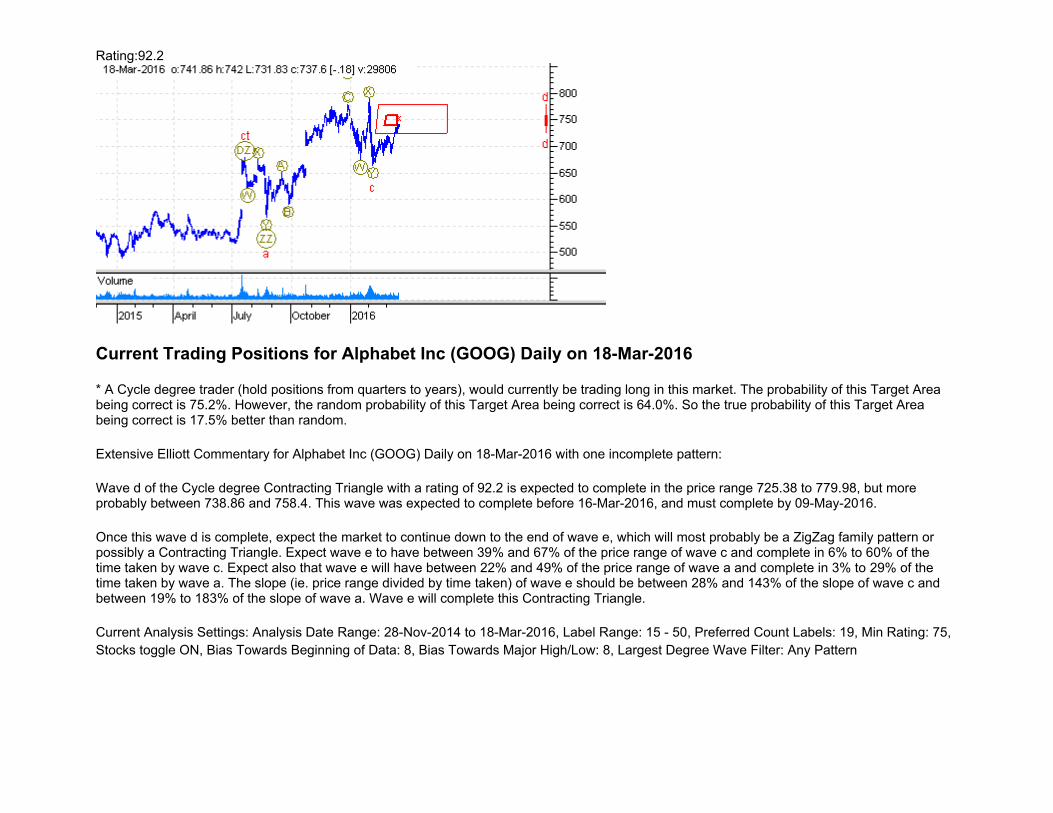
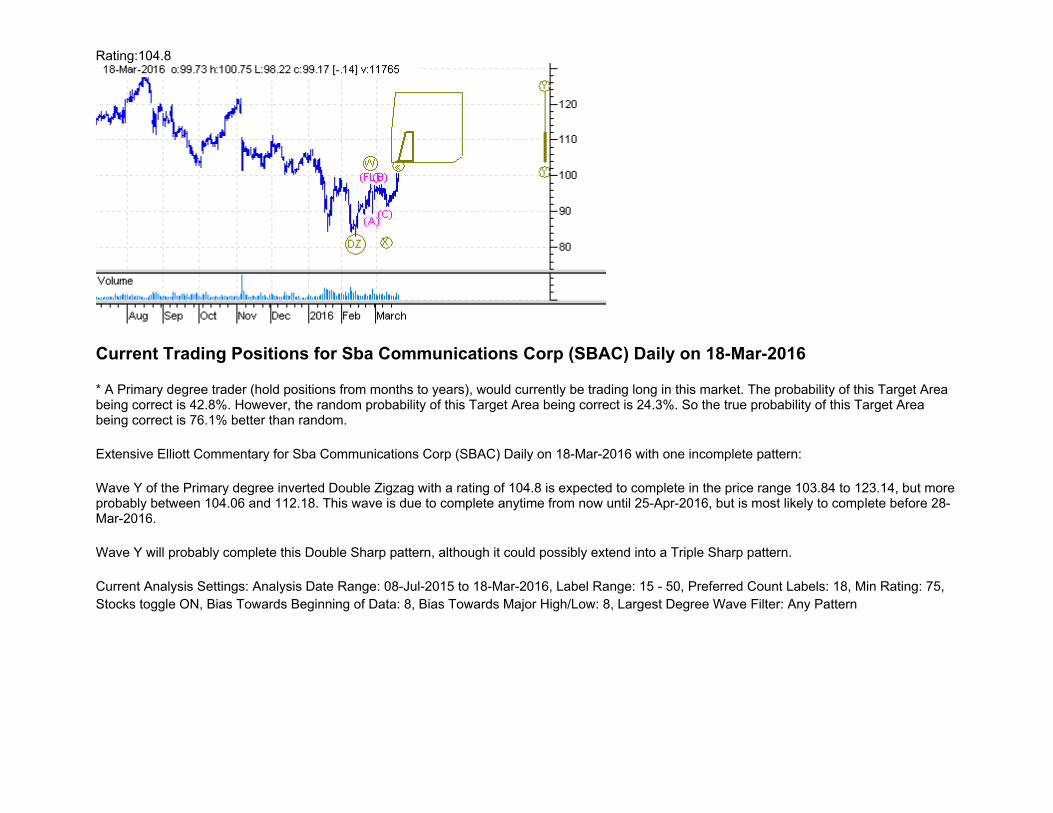
Rating:75.9
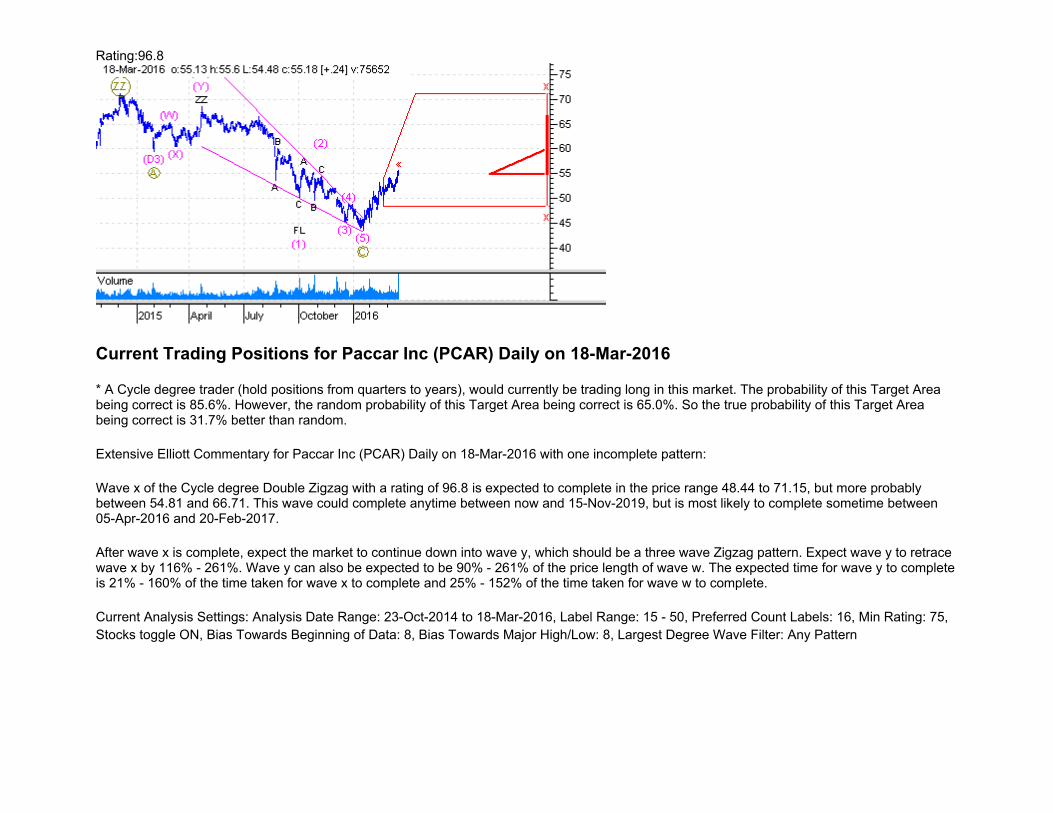
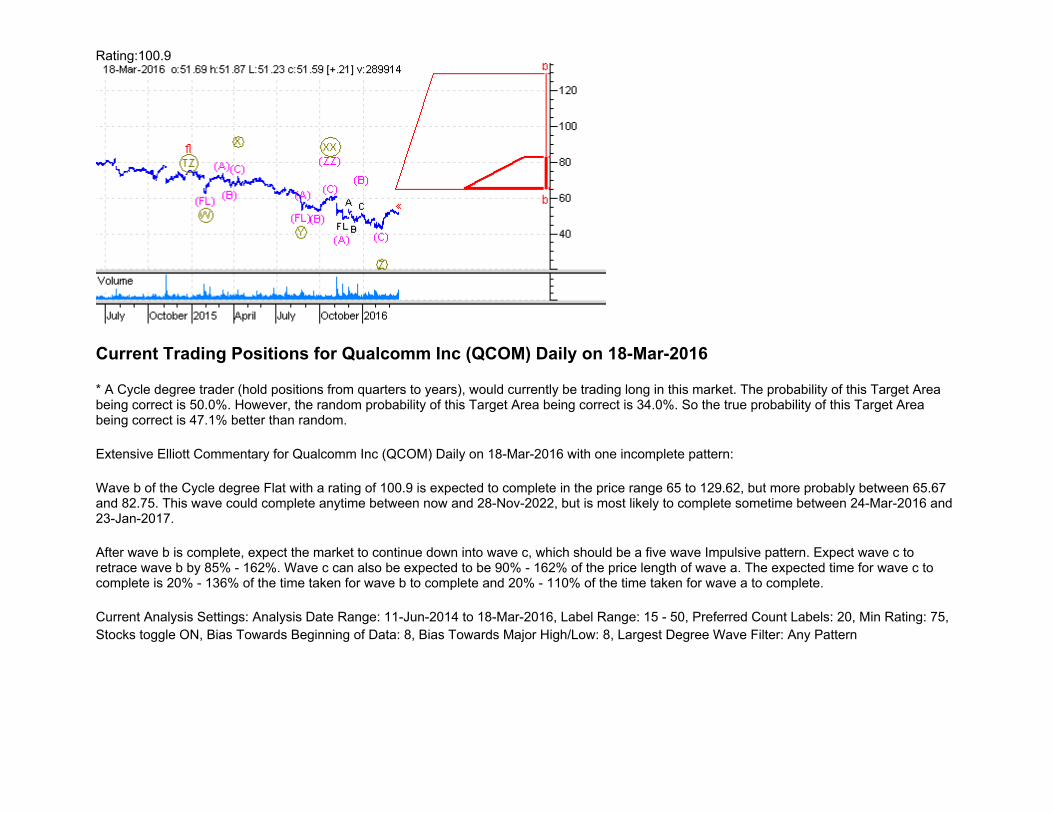
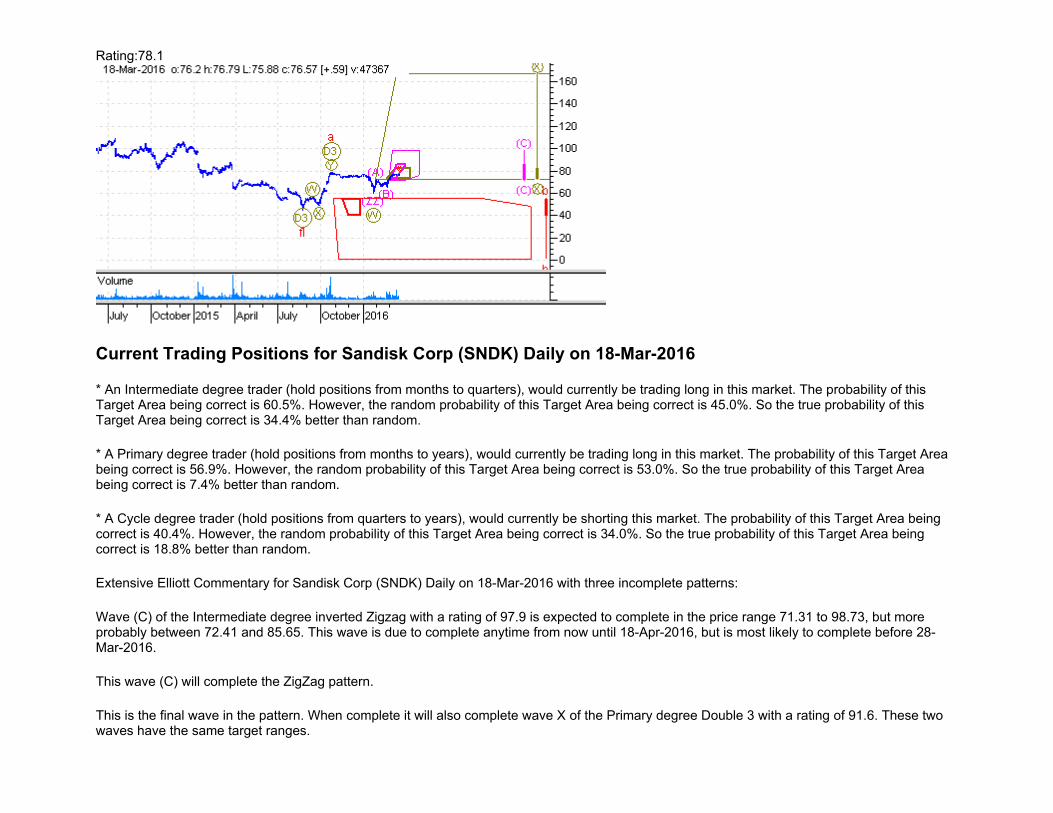
Current Trading Positions for Amazon.Com Inc (AMZN) Daily on 18-Mar-2016
* An Intermediate degree trader (hold positions from months to quarters), would currently be shorting this market. The probability of this Target Area being correct is 50.0%. However, the random probability of this Target Area being correct is 34.0%. So the true probability of this Target Area being correct is 47.1% better than random.
* A Primary degree trader (hold positions from months to years), would currently be trading long in this market. The probability of this Target Area being correct is 40.4%. However, the random probability of this Target Area being correct is 34.0%. So the true probability of this Target Area being correct is 18.8% better than random.
* A Cycle degree trader (hold positions from quarters to years), would currently be shorting this market. The probability of this Target Area being correct is 76.0%. However, the random probability of this Target Area being correct is 65.0%. So the true probability of this Target Area being correct is 16.9% better than random.
Extensive Elliott Commentary for Amazon.Com Inc (AMZN) Daily on 18-Mar-2016 with three incomplete patterns:
Wave (B) of the Intermediate degree inverted Flat with a rating of 100.4 is expected to complete in the price range 283.5 to 495.22, but more probably between 436.26 and 492.54. This wave could complete anytime between now and 24-Aug-2018, but is most likely to complete sometime between 25-Mar-2016 and 15-Jul-2016.
After wave (B) is complete, expect the market to continue up into wave (C), which should be a five wave Impulsive pattern. Expect wave (C) to retrace wave (B) by 82% - 177%. Wave (C) can also be expected to be 89% - 177% of the price length of wave (A). The expected time for wave (C) to complete is 15% - 160% of the time taken for wave (B) to complete and 16% - 118% of the time taken for wave (A) to complete.
Wave B of the Primary degree Flat with a rating of 78.4 is expected to complete in the price range 539.1 to 997.78, but more probably between 541.69 and 628.51. This wave was expected to complete before 11-Nov-2015, and must complete by 19-May-2016.
After wave B is complete, expect the market to continue down into wave C, which should be a five wave Impulsive pattern. Expect wave C to retrace wave B by 89% - 167%. Wave C can also be expected to be 104% - 167% of the price length of wave A. The expected time for wave C to complete is 20% - 146% of the time taken for wave B to complete and 53% - 275% of the time taken for wave A to complete.
Wave x of the Cycle degree inverted Double Zigzag with a rating of 75.9 is expected to complete in the price range 285.25 to 527.41, but more probably between 385.65 and 494.92. This wave was expected to complete before 02-Feb-2016, and must complete by 08-Jun-2017.
After wave x is complete, expect the market to continue up into wave y, which should be a three wave Zigzag pattern. Expect wave y to retrace wave x by 149% - 348%. Wave y can also be expected to be 90% - 348% of the price length of wave w. The expected time for wave y to complete is 23% - 188% of the time taken for wave x to complete and 28% - 133% of the time taken for wave w to complete.
Current Analysis Settings: Analysis Date Range: 15-Sep-2014 to 18-Mar-2016, Label Range: 15 - 50, Preferred Count Labels: 25, Min Rating: 75, Stocks toggle ON, Bias Towards Beginning of Data: 8, Bias Towards Major High/Low: 8, Largest Degree Wave Filter: Any Pattern
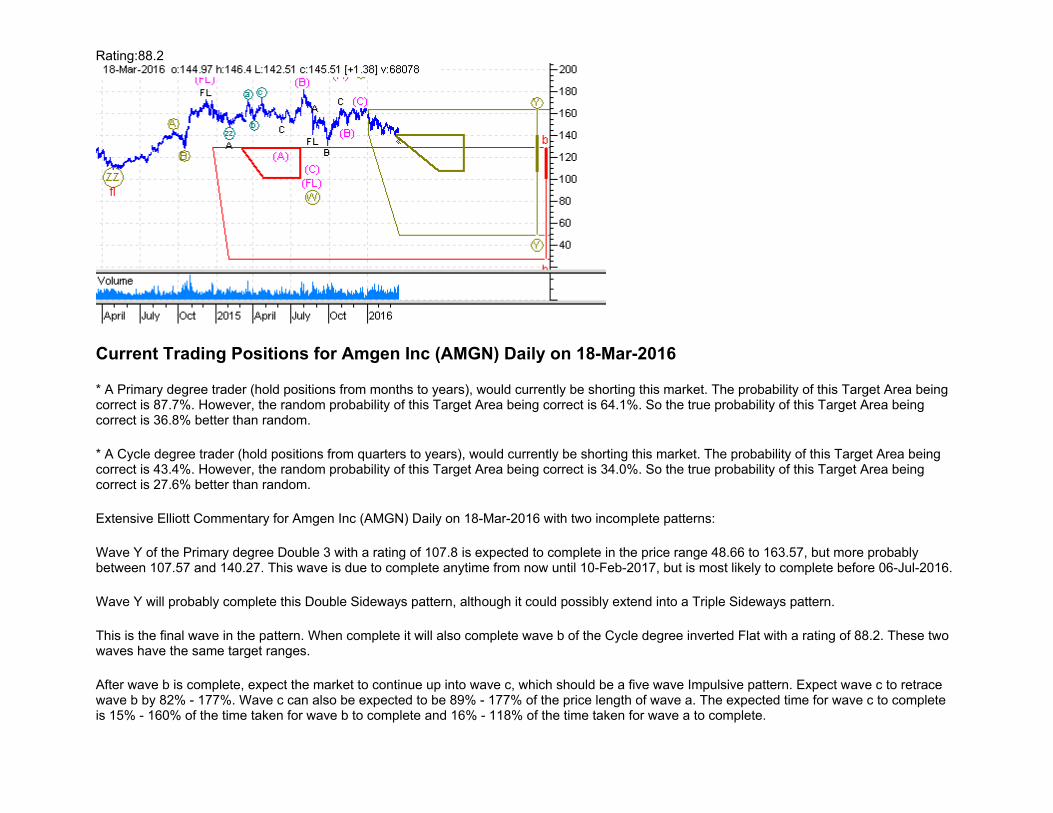
Rating:88.2
Current Trading Positions for Amgen Inc (AMGN) Daily on 18-Mar-2016
* A Primary degree trader (hold positions from months to years), would currently be shorting this market. The probability of this Target Area being correct is 87.7%. However, the random probability of this Target Area being correct is 64.1%. So the true probability of this Target Area being correct is 36.8% better than random.
* A Cycle degree trader (hold positions from quarters to years), would currently be shorting this market. The probability of this Target Area being correct is 43.4%. However, the random probability of this Target Area being correct is 34.0%. So the true probability of this Target Area being correct is 27.6% better than random.
Extensive Elliott Commentary for Amgen Inc (AMGN) Daily on 18-Mar-2016 with two incomplete patterns:
Wave Y of the Primary degree Double 3 with a rating of 107.8 is expected to complete in the price range 48.66 to 163.57, but more probably between 107.57 and 140.27. This wave is due to complete anytime from now until 10-Feb-2017, but is most likely to complete before 06-Jul-2016.
Wave Y will probably complete this Double Sideways pattern, although it could possibly extend into a Triple Sideways pattern.
This is the final wave in the pattern. When complete it will also complete wave b of the Cycle degree inverted Flat with a rating of 88.2. These two waves have the same target ranges.
After wave b is complete, expect the market to continue up into wave c, which should be a five wave Impulsive pattern. Expect wave c to retrace wave b by 82% - 177%. Wave c can also be expected to be 89% - 177% of the price length of wave a. The expected time for wave c to complete is 15% - 160% of the time taken for wave b to complete and 16% - 118% of the time taken for wave a to complete.
Current Analysis Settings: Analysis Date Range: 17-Mar-2014 to 18-Mar-2016, Label Range: 15 - 50, Preferred Count Labels: 19, Min Rating: 75, Stocks toggle ON, Bias Towards Beginning of Data: 8, Bias Towards Major High/Low: 8, Largest Degree Wave Filter: Any Pattern
Rating:92.4
Current Trading Positions for Analog Devices Inc (ADI) Daily on 18-Mar-2016
* An Intermediate degree trader (hold positions from months to quarters), would currently be trading long in this market. The probability of this Target Area being correct is 59.1%. However, the random probability of this Target Area being correct is 45.0%. So the true probability of this Target Area being correct is 31.3% better than random.
* A Primary degree trader (hold positions from months to years), would currently be trading long in this market. The probability of this Target Area being correct is 43.1%. However, the random probability of this Target Area being correct is 34.0%. So the true probability of this Target Area being correct is 26.8% better than random.
* A Cycle degree trader (hold positions from quarters to years), would currently be shorting this market. The probability of this Target Area being correct is 45.2%. However, the random probability of this Target Area being correct is 34.0%. So the true probability of this Target Area being correct is 32.9% better than random.
Extensive Elliott Commentary for Analog Devices Inc (ADI) Daily on 18-Mar-2016 with three incomplete patterns:
Wave (C) of the Intermediate degree inverted Zigzag with a rating of 96.2 is expected to complete in the price range 53.3 to 76.17, but more probably between 54.02 and 62.61. This wave was expected to complete before 14-Mar-2016, and must complete by 18-May-2016.
This wave (C) will complete the ZigZag pattern.
This is the final wave in the pattern. When complete it will also complete wave B of the Primary degree Flat with a rating of 87.6. These two waves have the same target ranges.
After wave B is complete, expect the market to continue down into wave C, which should be a five wave Impulsive pattern. Expect wave C to retrace wave B by 89% - 167%. Wave C can also be expected to be 104% - 167% of the price length of wave A. The expected time for wave C to complete is 20% - 146% of the time taken for wave B to complete and 53% - 275% of the time taken for wave A to complete.
Wave b of the Cycle degree inverted Flat with a rating of 92.4 is expected to complete in the price range 22.93 to 49.11, but more probably between 42.76 and 48.51. This wave is due to complete anytime from now until 07-Dec-2017, but is most likely to complete before 09-Jun-2016.
After wave b is complete, expect the market to continue up into wave c, which should be a five wave Impulsive pattern. Expect wave c to retrace wave b by 82% - 179%. Wave c can also be expected to be 67% - 179% of the price length of wave a. The expected time for wave c to complete is 20% - 151% of the time taken for wave b to complete and 11% - 58% of the time taken for wave a to complete.
Current Analysis Settings: Analysis Date Range: 29-Aug-2014 to 18-Mar-2016, Label Range: 15 - 50, Preferred Count Labels: 15, Min Rating: 75, Stocks toggle ON, Bias Towards Beginning of Data: 8, Bias Towards Major High/Low: 8, Largest Degree Wave Filter: Any Pattern
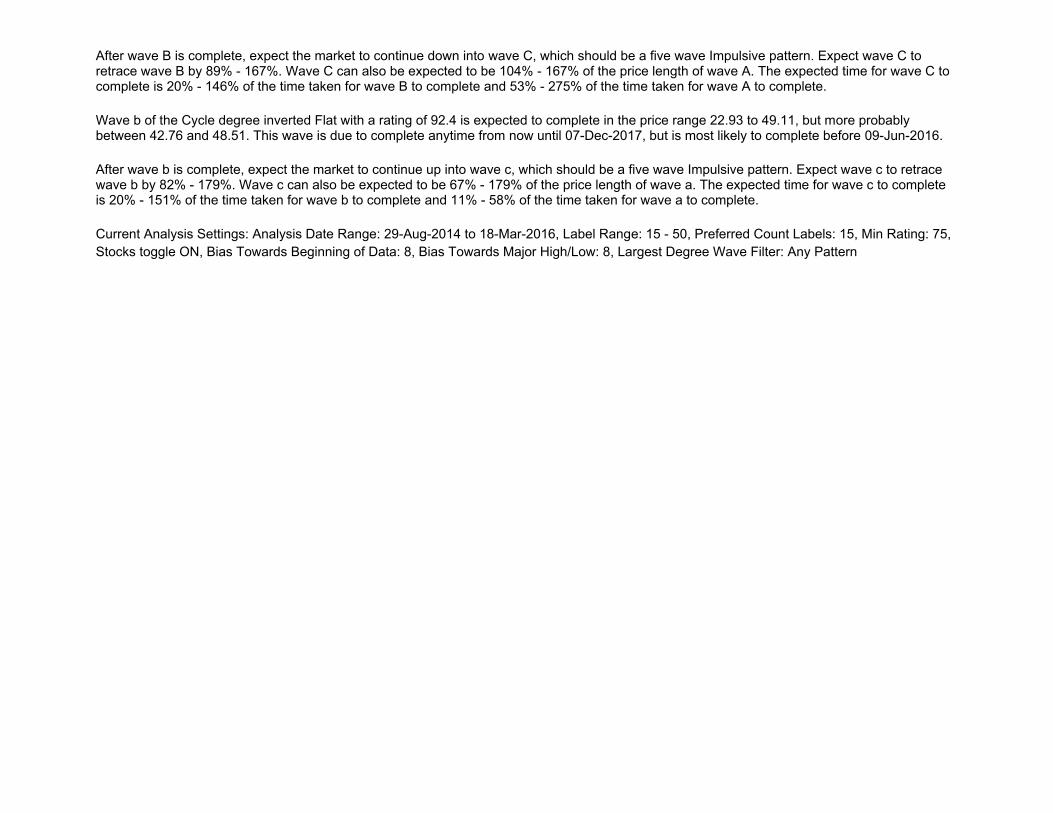
Rating:95.3
Current Trading Positions for Apple Inc (AAPL) Daily on 18-Mar-2016
* A Primary degree trader (hold positions from months to years), would currently be trading long in this market. The probability of this Target Area being correct is 86.5%. However, the random probability of this Target Area being correct is 64.1%. So the true probability of this Target Area being correct is 34.9% better than random.
Extensive Elliott Commentary for Apple Inc (AAPL) Daily on 18-Mar-2016 with one incomplete pattern:
Wave Y of the Primary degree inverted Double 3 with a rating of 95.3 is expected to complete in the price range 93.84 to 120.72, but more probably between 98.42 and 106.04. This wave was expected to complete before 15-Mar-2016, and must complete by 21-Mar-2016.
Wave Y will probably complete this Double Sideways pattern, although it could possibly extend into a Triple Sideways pattern.
Current Analysis Settings: Analysis Date Range: 13-Jan-2014 to 18-Mar-2016, Label Range: 15 - 50, Preferred Count Labels: 48, Min Rating: 75, Stocks toggle ON, Bias Towards Beginning of Data: 8, Bias Towards Major High/Low: 8, Largest Degree Wave Filter: Any Pattern
Rating:79.3
Current Trading Positions for Autodesk Inc (ADSK) Daily on 18-Mar-2016
* An Intermediate degree trader (hold positions from months to quarters), would currently be trading long in this market. The probability of this Target Area being correct is 50.1%. However, the random probability of this Target Area being correct is 34.0%. So the true probability of this Target Area being correct is 47.4% better than random.
* A Primary degree trader (hold positions from months to years), would currently be shorting this market. The probability of this Target Area being correct is 40.7%. However, the random probability of this Target Area being correct is 34.0%. So the true probability of this Target Area being correct is 19.7% better than random.
Extensive Elliott Commentary for Autodesk Inc (ADSK) Daily on 18-Mar-2016 with two incomplete patterns:
Wave (B) of the Intermediate degree Flat with a rating of 101.4 is expected to complete in the price range 57.13 to 71.08, but more probably between 57.2 and 59.77. This wave is due to complete anytime from now until 11-Apr-2016, but is most likely to complete before 21-Mar-2016.
After wave (B) is complete, expect the market to continue down into wave (C), which should be a five wave Impulsive pattern. Expect wave (C) to retrace wave (B) by 89% - 167%. Wave (C) can also be expected to be 105% - 167% of the price length of wave (A). The expected time for wave (C) to complete is 20% - 148% of the time taken for wave (B) to complete and 60% - 290% of the time taken for wave (A) to complete.
Wave B of the Primary degree inverted Flat with a rating of 79.3 is expected to complete at a price no higher than 47.12, but more probably between 37.24 and 46.78. This wave is due to complete anytime from now until 26-Aug-2016, but is most likely to complete before 13-Apr-2016.
After wave B is complete, expect the market to continue up into wave C, which should be a five wave Impulsive pattern. Expect wave C to retrace wave B by 80% - 169%. Wave C can also be expected to be 99% - 169% of the price length of wave A. The expected time for wave C to complete is 19% - 187% of the time taken for wave B to complete and 56% - 268% of the time taken for wave A to complete.
Current Analysis Settings: Analysis Date Range: 23-Oct-2015 to 18-Mar-2016, Label Range: 15 - 50, Preferred Count Labels: 20, Min Rating: 75, Stocks toggle ON, Bias Towards Beginning of Data: 8, Bias Towards Major High/Low: 8, Largest Degree Wave Filter: Any Pattern
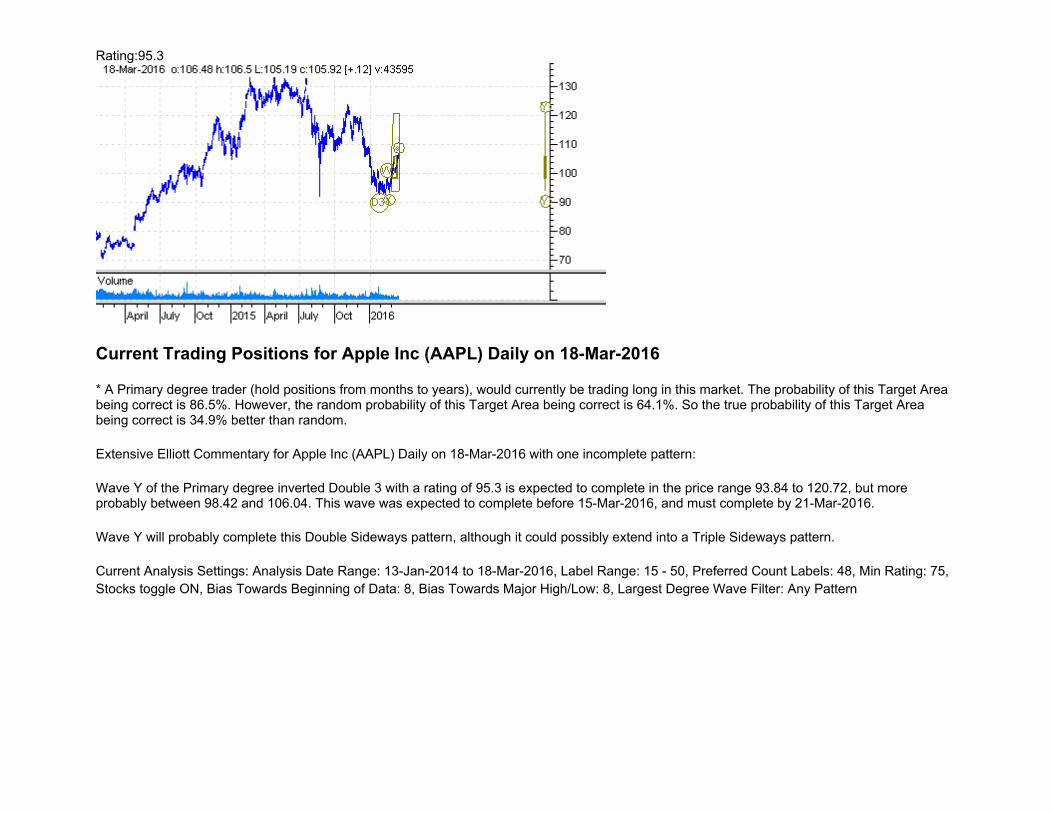
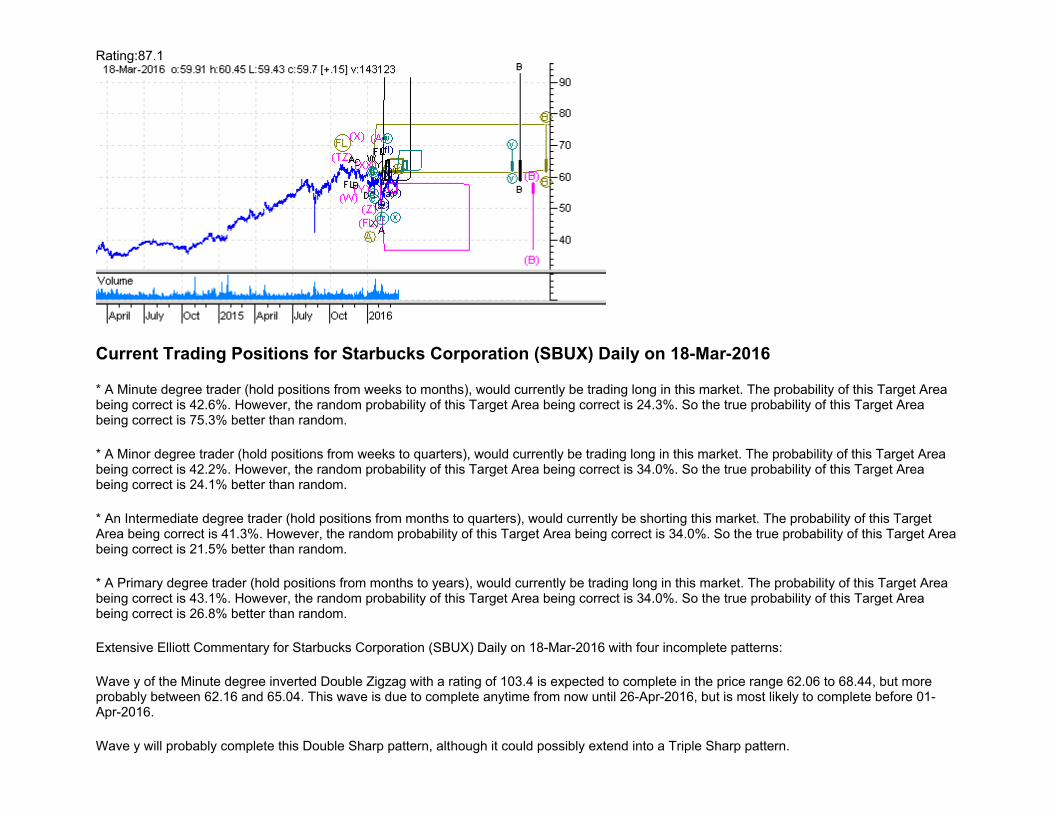
Rating:87.1
Current Trading Positions for Automatic Data Processing Inc (ADP) Daily on 18-Mar-2016
* A Minor degree trader (hold positions from weeks to quarters), would currently be trading long in this market. The probability of this Target Area being correct is 47.0%. However, the random probability of this Target Area being correct is 34.0%. So the true probability of this Target Area being correct is 38.2% better than random.
* An Intermediate degree trader (hold positions from months to quarters), would currently be shorting this market. The probability of this Target Area being correct is 41.9%. However, the random probability of this Target Area being correct is 34.0%. So the true probability of this Target Area being correct is 23.2% better than random.
* A Primary degree trader (hold positions from months to years), would currently be trading long in this market. The probability of this Target Area being correct is 43.1%. However, the random probability of this Target Area being correct is 34.0%. So the true probability of this Target Area being correct is 26.8% better than random.
Extensive Elliott Commentary for Automatic Data Processing Inc (ADP) Daily on 18-Mar-2016 with three incomplete patterns:
Wave B of the Minor degree Flat with a rating of 96 is expected to complete in the price range 85.58 to 99.16, but more probably between 85.65 and 88.15. This wave was expected to complete before 02-Mar-2016, and must complete by 21-Mar-2016.
After wave B is complete, expect the market to continue down into wave C, which should be a five wave Impulsive pattern. Expect wave C to retrace wave B by 89% - 167%. Wave C can also be expected to be 105% - 167% of the price length of wave A. The expected time for wave C to complete is 20% - 148% of the time taken for wave B to complete and 60% - 290% of the time taken for wave A to complete.
Wave (B) of the Intermediate degree inverted Flat with a rating of 83.7 is expected to complete in the price range 41.66 to 79.98, but more probably between 74.02 and 79.78. This wave is due to complete anytime from now until 14-Oct-2016, but is most likely to complete before 15-Apr-2016.
After wave (B) is complete, expect the market to continue up into wave (C), which should be a five wave Impulsive pattern. Expect wave (C) to retrace wave (B) by 80% - 169%. Wave (C) can also be expected to be 99% - 169% of the price length of wave (A). The expected time for wave (C) to complete is 19% - 187% of the time taken for wave (B) to complete and 56% - 268% of the time taken for wave (A) to complete.
Wave B of the Primary degree Flat with a rating of 87.1 is expected to complete in the price range 86.18 to 113.52, but more probably between 86.46 and 93.61. This wave is due to complete anytime from now until 08-Jun-2017, but is most likely to complete before 14-Apr-2016.
After wave B is complete, expect the market to continue down into wave C, which should be a five wave Impulsive pattern. Expect wave C to retrace wave B by 86% - 162%. Wave C can also be expected to be 90% - 162% of the price length of wave A. The expected time for wave C to complete is 19% - 134% of the time taken for wave B to complete and 24% - 115% of the time taken for wave A to complete.
Current Analysis Settings: Analysis Date Range: 13-Jan-2014 to 18-Mar-2016, Label Range: 15 - 50, Preferred Count Labels: 36, Min Rating: 75, Stocks toggle ON, Bias Towards Beginning of Data: 8, Bias Towards Major High/Low: 8, Largest Degree Wave Filter: Any Pattern
Rating:103.8
Current Trading Positions for Baidu Incorporated (BIDU) Daily on 18-Mar-2016
* A Primary degree trader (hold positions from months to years), would currently be trading long in this market. The probability of this Target Area being correct is 88.9%. However, the random probability of this Target Area being correct is 65.0%. So the true probability of this Target Area being correct is 36.8% better than random.
Extensive Elliott Commentary for Baidu Incorporated (BIDU) Daily on 18-Mar-2016 with one incomplete pattern:
Wave X of the Primary degree Double Zigzag with a rating of 103.8 is expected to complete in the price range 153.71 to 217.97, but more probably between 171.73 and 204.64. This wave is due to complete anytime from now until 11-Oct-2016, but is most likely to complete before 25-Apr-2016.
After wave X is complete, expect the market to continue down into wave Y, which should be a three wave Zigzag pattern. Expect wave Y to retrace wave X by 117% - 263%. Wave Y can also be expected to be 90% - 263% of the price length of wave W. The expected time for wave Y to complete is 21% - 161% of the time taken for wave X to complete and 27% - 154% of the time taken for wave W to complete.
Current Analysis Settings: Analysis Date Range: 03-Oct-2014 to 18-Mar-2016, Label Range: 15 - 50, Preferred Count Labels: 22, Min Rating: 75, Stocks toggle ON, Bias Towards Beginning of Data: 8, Bias Towards Major High/Low: 8, Largest Degree Wave Filter: Any Pattern
Rating:77.5
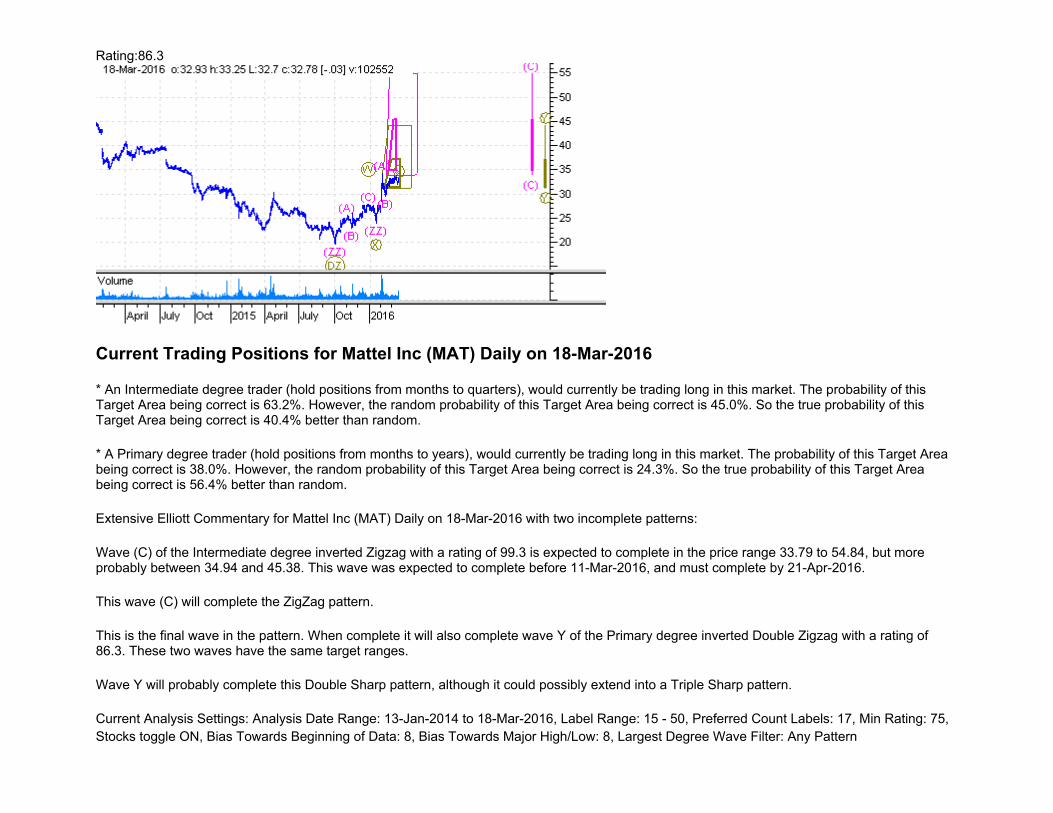
Current Trading Positions for Bed Bath & Beyond Inc (BBBY) Daily on 18-Mar-2016
* A Primary degree trader (hold positions from months to years), would currently be shorting this market. The probability of this Target Area being correct is 63.2%. However, the random probability of this Target Area being correct is 45.0%. So the true probability of this Target Area being correct is 40.4% better than random.
* A Cycle degree trader (hold positions from quarters to years), would currently be shorting this market. The probability of this Target Area being correct is 33.5%. However, the random probability of this Target Area being correct is 24.3%. So the true probability of this Target Area being correct is 37.9% better than random.
Extensive Elliott Commentary for Bed Bath & Beyond Inc (BBBY) Daily on 18-Mar-2016 with two incomplete patterns:
Wave C of the Primary degree Zigzag with a rating of 99.3 is expected to complete at a price no higher than 43.58, but more probably between 31.58 and 42.86. This wave is due to complete anytime from now until 02-Jan-2017, but is most likely to complete before 09-May-2016.
This wave C will complete the ZigZag pattern.
This is the final wave in the pattern. When complete it will also complete wave y of the Cycle degree Double Zigzag with a rating of 77.5. These two waves have the same target ranges.
Wave y will probably complete this Double Sharp pattern, although it could possibly extend into a Triple Sharp pattern.
Current Analysis Settings: Analysis Date Range: 25-Nov-2014 to 18-Mar-2016, Label Range: 15 - 50, Preferred Count Labels: 18, Min Rating: 75, Stocks toggle ON, Bias Towards Beginning of Data: 8, Bias Towards Major High/Low: 8, Largest Degree Wave Filter: Any Pattern
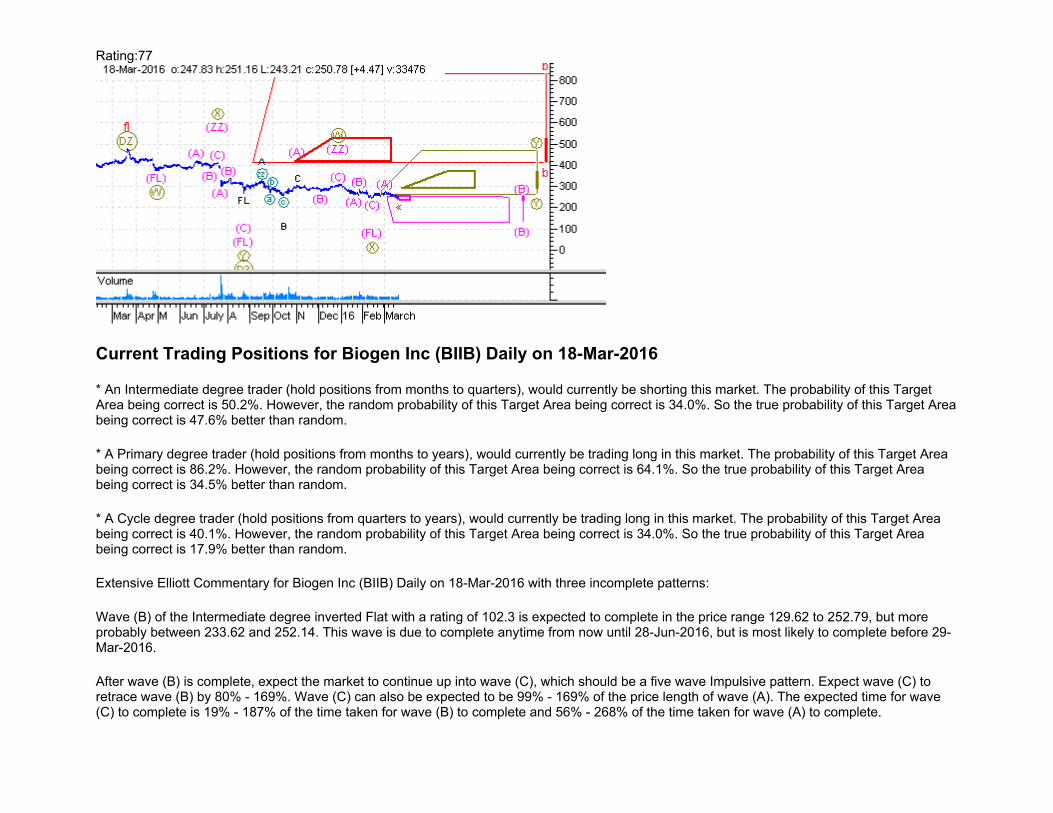
Rating:77
Current Trading Positions for Biogen Inc (BIIB) Daily on 18-Mar-2016
* An Intermediate degree trader (hold positions from months to quarters), would currently be shorting this market. The probability of this Target Area being correct is 50.2%. However, the random probability of this Target Area being correct is 34.0%. So the true probability of this Target Area being correct is 47.6% better than random.
* A Primary degree trader (hold positions from months to years), would currently be trading long in this market. The probability of this Target Area being correct is 86.2%. However, the random probability of this Target Area being correct is 64.1%. So the true probability of this Target Area being correct is 34.5% better than random.
* A Cycle degree trader (hold positions from quarters to years), would currently be trading long in this market. The probability of this Target Area being correct is 40.1%. However, the random probability of this Target Area being correct is 34.0%. So the true probability of this Target Area being correct is 17.9% better than random.
Extensive Elliott Commentary for Biogen Inc (BIIB) Daily on 18-Mar-2016 with three incomplete patterns:
Wave (B) of the Intermediate degree inverted Flat with a rating of 102.3 is expected to complete in the price range 129.62 to 252.79, but more probably between 233.62 and 252.14. This wave is due to complete anytime from now until 28-Jun-2016, but is most likely to complete before 29-Mar-2016.
After wave (B) is complete, expect the market to continue up into wave (C), which should be a five wave Impulsive pattern. Expect wave (C) to retrace wave (B) by 80% - 169%. Wave (C) can also be expected to be 99% - 169% of the price length of wave (A). The expected time for wave (C) to complete is 19% - 187% of the time taken for wave (B) to complete and 56% - 268% of the time taken for wave (A) to complete.
Wave Y of the Primary degree inverted Double 3 with a rating of 92.2 is expected to complete in the price range 265 to 471.12, but more probably between 292.72 and 370.49. This wave is due to complete anytime from now until 25-Jul-2016, but is most likely to complete before 27-May-2016.
Wave Y will probably complete this Double Sideways pattern, although it could possibly extend into a Triple Sideways pattern.
This is the final wave in the pattern. When complete it will also complete wave b of the Cycle degree Flat with a rating of 77. These two waves have the same target ranges.
After wave b is complete, expect the market to continue down into wave c, which should be a five wave Impulsive pattern. Expect wave c to retrace wave b by 86% - 162%. Wave c can also be expected to be 90% - 162% of the price length of wave a. The expected time for wave c to complete is 19% - 134% of the time taken for wave b to complete and 24% - 115% of the time taken for wave a to complete.
Current Analysis Settings: Analysis Date Range: 06-Feb-2015 to 18-Mar-2016, Label Range: 15 - 50, Preferred Count Labels: 22, Min Rating: 75, Stocks toggle ON, Bias Towards Beginning of Data: 8, Bias Towards Major High/Low: 8, Largest Degree Wave Filter: Any Pattern
Rating:86.8
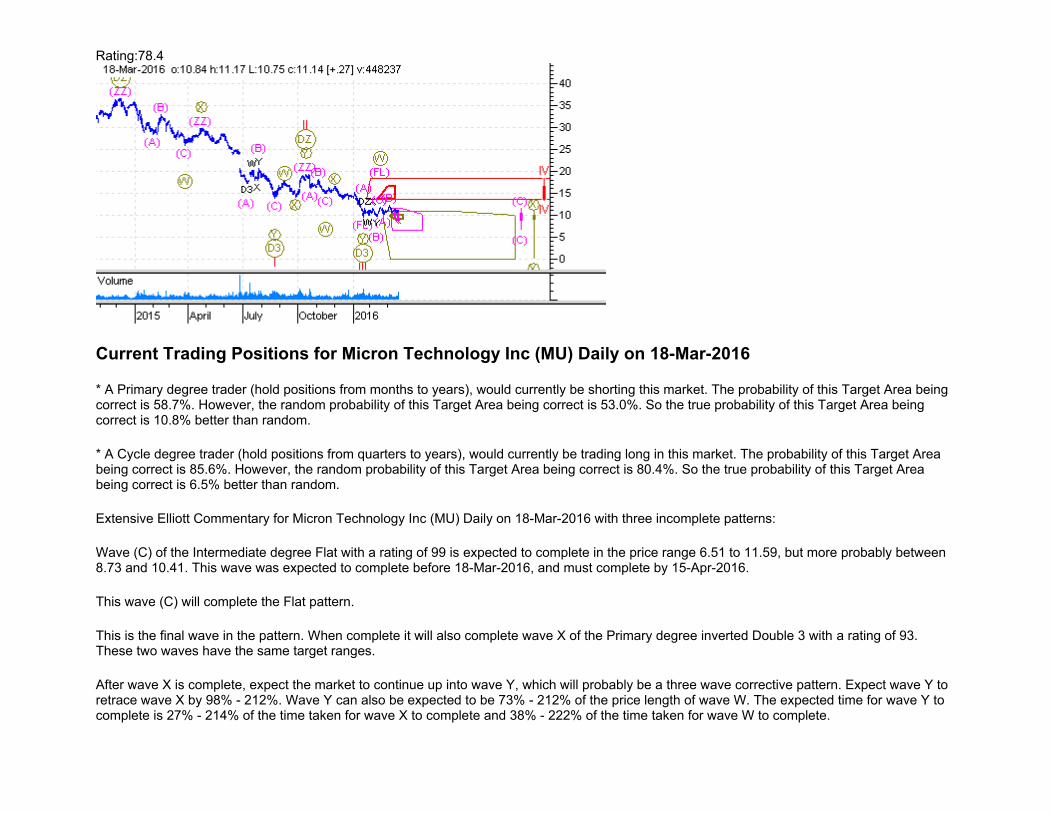
Current Trading Positions for Biomarin Pharmaceuticals (BMRN) Daily on 18-Mar-2016
* A Primary degree trader (hold positions from months to years), would currently be shorting this market. The probability of this Target Area being correct is 60.5%. However, the random probability of this Target Area being correct is 45.0%. So the true probability of this Target Area being correct is 34.4% better than random.
* A Cycle degree trader (hold positions from quarters to years), would currently be shorting this market. The probability of this Target Area being correct is 38.0%. However, the random probability of this Target Area being correct is 24.3%. So the true probability of this Target Area being correct is 56.4% better than random.
Extensive Elliott Commentary for Biomarin Pharmaceuticals (BMRN) Daily on 18-Mar-2016 with two incomplete patterns:
Wave C of the Primary degree Zigzag with a rating of 97.4 is expected to complete in the price range 9.97 to 76.48, but more probably between 49.18 and 73.38. This wave is due to complete anytime from now until 25-Jul-2016, but is most likely to complete before 21-Apr-2016.
This wave C will complete the ZigZag pattern.
This is the final wave in the pattern. When complete it will also complete wave y of the Cycle degree Double Zigzag with a rating of 86.8. These two waves have the same target ranges.
Wave y will probably complete this Double Sharp pattern, although it could possibly extend into a Triple Sharp pattern.
Current Analysis Settings: Analysis Date Range: 05-Mar-2014 to 18-Mar-2016, Label Range: 15 - 50, Preferred Count Labels: 18, Min Rating: 75, Stocks toggle ON, Bias Towards Beginning of Data: 8, Bias Towards Major High/Low: 8, Largest Degree Wave Filter: Any Pattern
Rating:81.7
Current Trading Positions for Broadcom Limited (AVGO) Daily on 18-Mar-2016
* A Primary degree trader (hold positions from months to years), would currently be trading long in this market. The probability of this Target Area being correct is 57.8%. However, the random probability of this Target Area being correct is 45.0%. So the true probability of this Target Area being correct is 28.4% better than random.
* A Cycle degree trader (hold positions from quarters to years), would currently be trading long in this market. The probability of this Target Area being correct is 35.5%. However, the random probability of this Target Area being correct is 24.3%. So the true probability of this Target Area being correct is 46.1% better than random.
Extensive Elliott Commentary for Broadcom Limited (AVGO) Daily on 18-Mar-2016 with two incomplete patterns:
Wave C of the Primary degree inverted Zigzag with a rating of 95.2 is expected to complete in the price range 146.17 to 264.33, but more probably between 147.94 and 195.17. This wave is due to complete anytime from now until 25-Jan-2017, but is most likely to complete before 13-May-2016.
This wave C will complete the ZigZag pattern.
This is the final wave in the pattern. When complete it will also complete wave y of the Cycle degree inverted Double Zigzag with a rating of 81.7. These two waves have the same target ranges.
Wave y will probably complete this Double Sharp pattern, although it could possibly extend into a Triple Sharp pattern.
Current Analysis Settings: Analysis Date Range: 13-Jan-2014 to 18-Mar-2016, Label Range: 15 - 50, Preferred Count Labels: 16, Min Rating: 75, Stocks toggle ON, Bias Towards Beginning of Data: 8, Bias Towards Major High/Low: 8, Largest Degree Wave Filter: Any Pattern
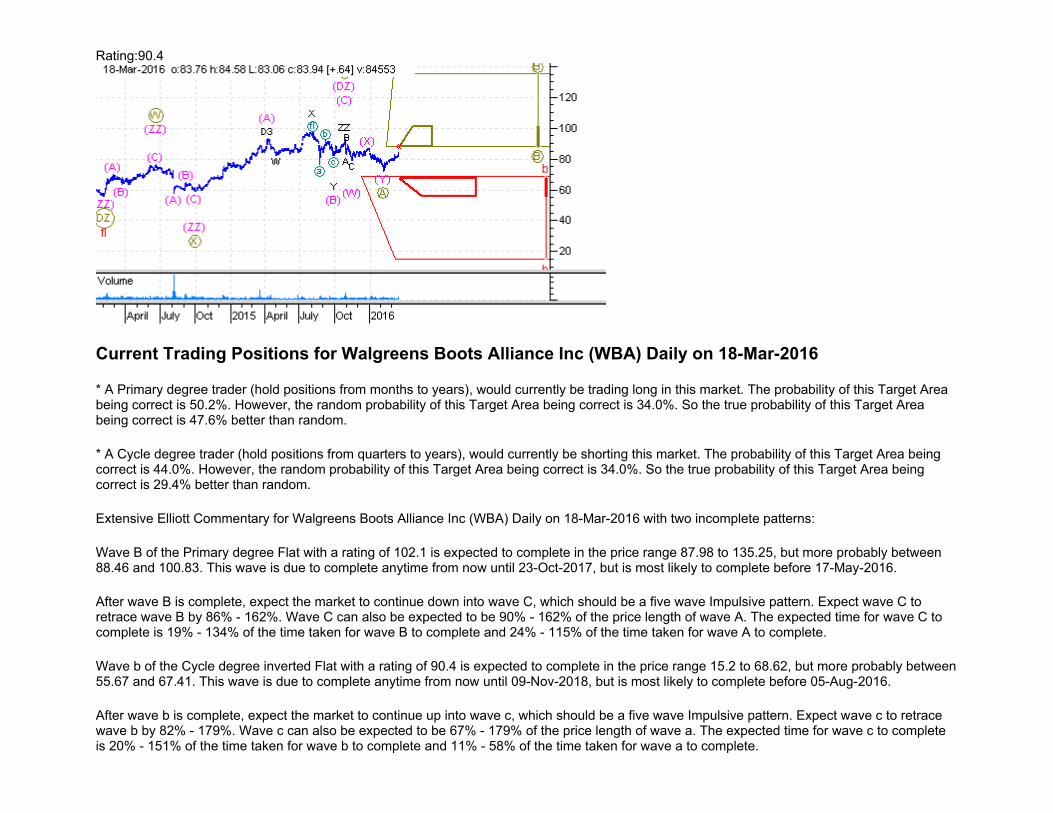
Rating:90.3
Current Trading Positions for CA Inc (CA) Daily on 18-Mar-2016
* A Primary degree trader (hold positions from months to years), would currently be trading long in this market. The probability of this Target Area being correct is 42.0%. However, the random probability of this Target Area being correct is 24.3%. So the true probability of this Target Area being correct is 72.8% better than random.
* A Cycle degree trader (hold positions from quarters to years), would currently be trading long in this market. The probability of this Target Area being correct is 44.0%. However, the random probability of this Target Area being correct is 34.0%. So the true probability of this Target Area being correct is 29.4% better than random.
Extensive Elliott Commentary for CA Inc (CA) Daily on 18-Mar-2016 with two incomplete patterns:
Wave Y of the Primary degree inverted Double Zigzag with a rating of 101 is expected to complete in the price range 30.59 to 39.87, but more probably between 30.72 and 34.5. This wave is due to complete anytime from now until 19-Jul-2016, but is most likely to complete before 18-May-2016.
Wave Y will probably complete this Double Sharp pattern, although it could possibly extend into a Triple Sharp pattern.
This is the final wave in the pattern. When complete it will also complete wave b of the Cycle degree Flat with a rating of 90.3. These two waves have the same target ranges.
After wave b is complete, expect the market to continue down into wave c, which should be a five wave Impulsive pattern. Expect wave c to retrace wave b by 85% - 162%. Wave c can also be expected to be 90% - 162% of the price length of wave a. The expected time for wave c to complete is 20% - 136% of the time taken for wave b to complete and 20% - 110% of the time taken for wave a to complete.
Current Analysis Settings: Analysis Date Range: 13-Jan-2014 to 18-Mar-2016, Label Range: 15 - 50, Preferred Count Labels: 28, Min Rating: 75, Stocks toggle ON, Bias Towards Beginning of Data: 8, Bias Towards Major High/Low: 8, Largest Degree Wave Filter: Any Pattern
Rating:96.6
Current Trading Positions for Celgene Corp (CELG) Daily on 18-Mar-2016
* A Cycle degree trader (hold positions from quarters to years), would currently be trading long in this market. The probability of this Target Area being correct is 41.2%. However, the random probability of this Target Area being correct is 24.3%. So the true probability of this Target Area being correct is 69.5% better than random.
Extensive Elliott Commentary for Celgene Corp (CELG) Daily on 18-Mar-2016 with one incomplete pattern:
Wave y of the Cycle degree inverted Double Zigzag with a rating of 96.6 is expected to complete in the price range 147.17 to 273.1, but more probably between 150.93 and 201.66. This wave is most likely to complete sometime between 20-Apr-2016 and 11-Jan-2017 Note that it cannot complete until 29-Mar-2016 but must complete by 25-Sep-2018.
Wave y will probably complete this Double Sharp pattern, although it could possibly extend into a Triple Sharp pattern.
Current Analysis Settings: Analysis Date Range: 05-Mar-2014 to 18-Mar-2016, Label Range: 15 - 50, Preferred Count Labels: 15, Min Rating: 75, Stocks toggle ON, Bias Towards Beginning of Data: 8, Bias Towards Major High/Low: 8, Largest Degree Wave Filter: Any Pattern
Rating:102.7
Current Trading Positions for Charter Communications (CHTR) Daily on 18-Mar-2016
* A Cycle degree trader (hold positions from quarters to years), would currently be trading long in this market. The probability of this Target Area being correct is 42.4%. However, the random probability of this Target Area being correct is 24.3%. So the true probability of this Target Area being correct is 74.5% better than random.
Extensive Elliott Commentary for Charter Communications (CHTR) Daily on 18-Mar-2016 with one incomplete pattern:
Wave y of the Cycle degree inverted Double Zigzag with a rating of 102.7 is expected to complete in the price range 227.66 to 370.48, but more probably between 228.89 and 290.93. This wave is most likely to complete sometime between 22-Apr-2016 and 12-Jan-2017 Note that it cannot complete until 01-Apr-2016 but must complete by 26-Oct-2018.
Wave y will probably complete this Double Sharp pattern, although it could possibly extend into a Triple Sharp pattern.
Current Analysis Settings: Analysis Date Range: 05-Mar-2014 to 18-Mar-2016, Label Range: 15 - 50, Preferred Count Labels: 17, Min Rating: 75, Stocks toggle ON, Bias Towards Beginning of Data: 8, Bias Towards Major High/Low: 8, Largest Degree Wave Filter: Any Pattern
Rating:81.1
Current Trading Positions for Check Point Software Technologies Inc (CHKP) Daily on 18-Mar-2016
* An Intermediate degree trader (hold positions from months to quarters), would currently be trading long in this market. The probability of this Target Area being correct is 48.8%. However, the random probability of this Target Area being correct is 34.0%. So the true probability of this Target Area being correct is 43.5% better than random.
* A Primary degree trader (hold positions from months to years), would currently be shorting this market. The probability of this Target Area being correct is 86.5%. However, the random probability of this Target Area being correct is 64.1%. So the true probability of this Target Area being correct is 34.9% better than random.
* A Cycle degree trader (hold positions from quarters to years), would currently be shorting this market. The probability of this Target Area being correct is 78.4%. However, the random probability of this Target Area being correct is 65.0%. So the true probability of this Target Area being correct is 20.6% better than random.
Extensive Elliott Commentary for Check Point Software Technologies Inc (CHKP) Daily on 18-Mar-2016 with three incomplete patterns:
Wave (B) of the Intermediate degree Flat with a rating of 98 is expected to complete in the price range 79.11 to 99.46, but more probably between 79.22 and 83.07. This wave was expected to complete before 03-Mar-2016, and must complete by 18-Apr-2016.
After wave (B) is complete, expect the market to continue down into wave (C), which should be a five wave Impulsive pattern. Expect wave (C) to retrace wave (B) by 89% - 167%. Wave (C) can also be expected to be 104% - 167% of the price length of wave (A). The expected time for wave (C) to complete is 20% - 146% of the time taken for wave (B) to complete and 53% - 275% of the time taken for wave (A) to complete.
Wave Y of the Primary degree Double 3 with a rating of 95.7 is expected to complete in the price range 58.31 to 80.6, but more probably between 69.29 and 75.93. This wave is due to complete anytime from now until 02-May-2016, but is most likely to complete before 05-Apr-2016.
Wave Y will probably complete this Double Sideways pattern, although it could possibly extend into a Triple Sideways pattern.
This is the final wave in the pattern. When complete it will also complete wave x of the Cycle degree inverted Double Zigzag with a rating of 81.1. These two waves have the same target ranges.
After wave x is complete, expect the market to continue up into wave y, which should be a three wave Zigzag pattern. Expect wave y to retrace wave x by 128% - 319%. Wave y can also be expected to be 90% - 319% of the price length of wave w. The expected time for wave y to complete is 23% - 167% of the time taken for wave x to complete and 47% - 204% of the time taken for wave w to complete.
Current Analysis Settings: Analysis Date Range: 18-Mar-2014 to 18-Mar-2016, Label Range: 15 - 50, Preferred Count Labels: 25, Min Rating: 75, Stocks toggle ON, Bias Towards Beginning of Data: 8, Bias Towards Major High/Low: 8, Largest Degree Wave Filter: Any Pattern
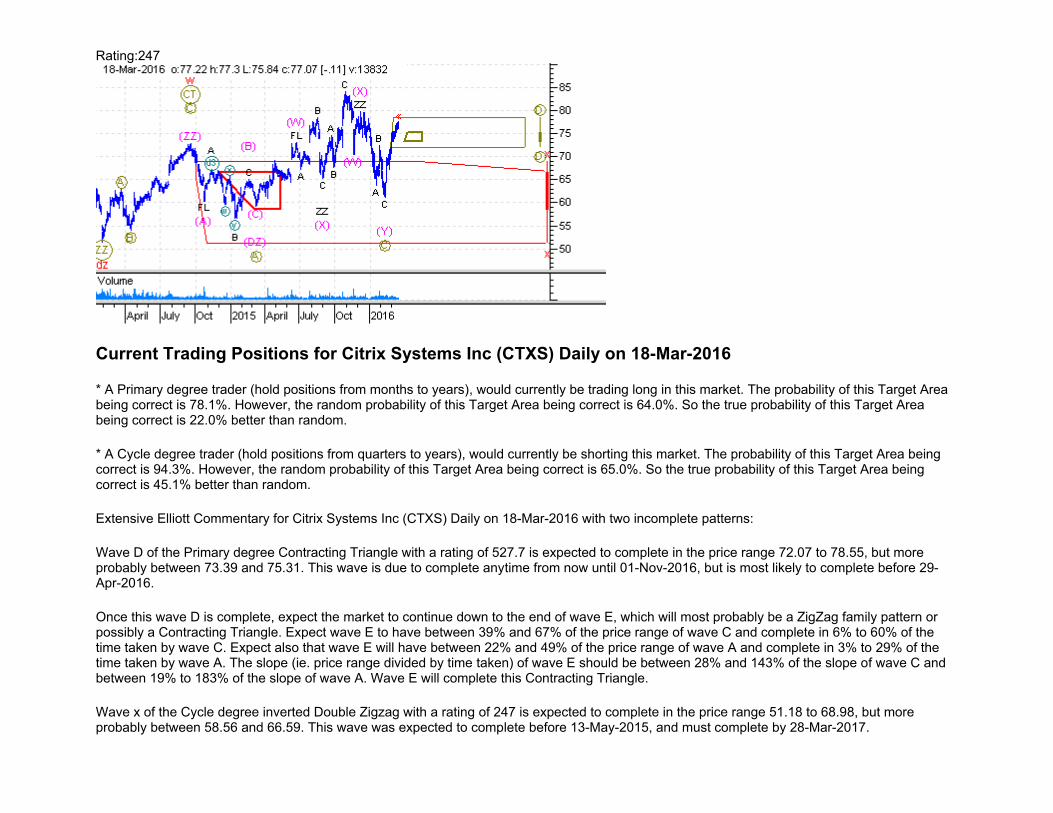
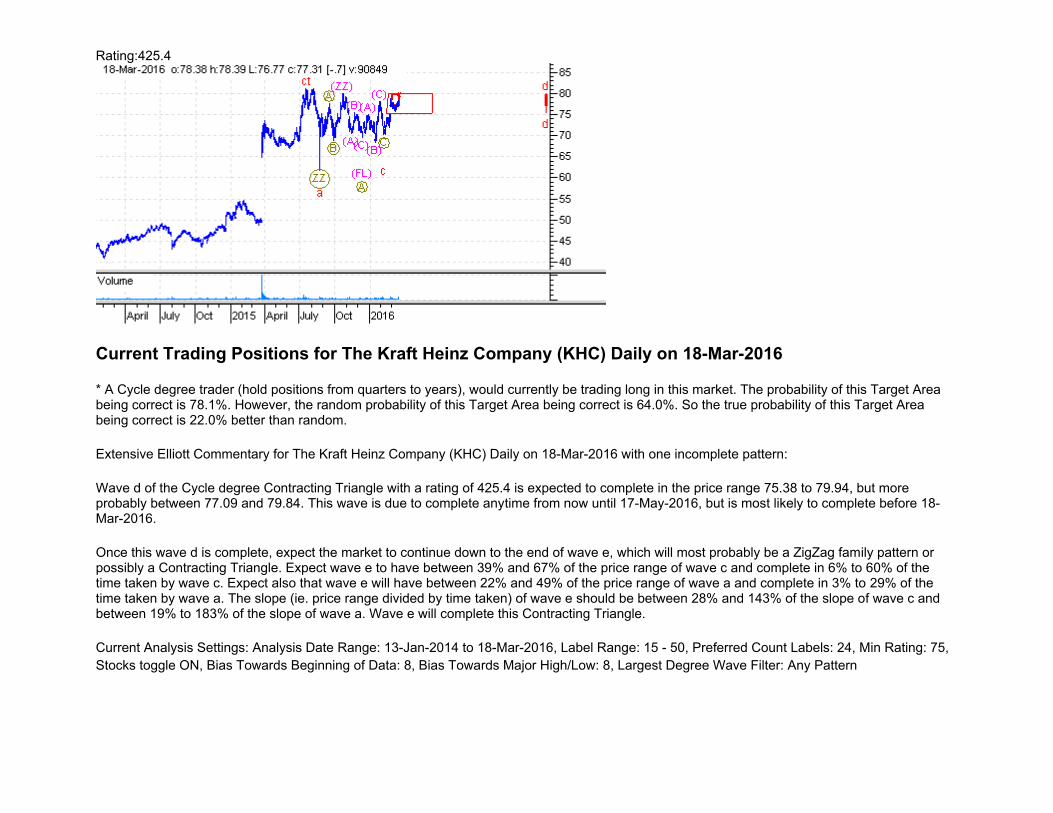
Rating:247
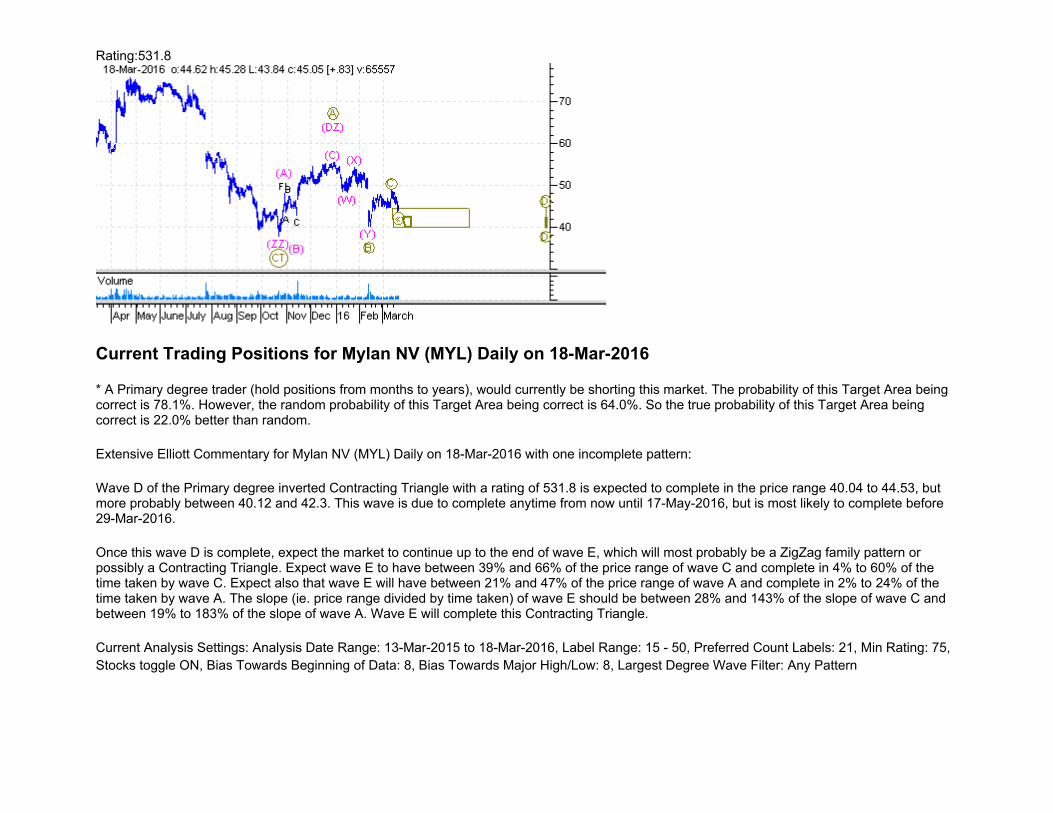
Current Trading Positions for Citrix Systems Inc (CTXS) Daily on 18-Mar-2016
* A Primary degree trader (hold positions from months to years), would currently be trading long in this market. The probability of this Target Area being correct is 78.1%. However, the random probability of this Target Area being correct is 64.0%. So the true probability of this Target Area being correct is 22.0% better than random.
* A Cycle degree trader (hold positions from quarters to years), would currently be shorting this market. The probability of this Target Area being correct is 94.3%. However, the random probability of this Target Area being correct is 65.0%. So the true probability of this Target Area being correct is 45.1% better than random.
Extensive Elliott Commentary for Citrix Systems Inc (CTXS) Daily on 18-Mar-2016 with two incomplete patterns:
Wave D of the Primary degree Contracting Triangle with a rating of 527.7 is expected to complete in the price range 72.07 to 78.55, but more probably between 73.39 and 75.31. This wave is due to complete anytime from now until 01-Nov-2016, but is most likely to complete before 29-Apr-2016.
Once this wave D is complete, expect the market to continue down to the end of wave E, which will most probably be a ZigZag family pattern or possibly a Contracting Triangle. Expect wave E to have between 39% and 67% of the price range of wave C and complete in 6% to 60% of the time taken by wave C. Expect also that wave E will have between 22% and 49% of the price range of wave A and complete in 3% to 29% of the time taken by wave A. The slope (ie. price range divided by time taken) of wave E should be between 28% and 143% of the slope of wave C and between 19% to 183% of the slope of wave A. Wave E will complete this Contracting Triangle.
Wave x of the Cycle degree inverted Double Zigzag with a rating of 247 is expected to complete in the price range 51.18 to 68.98, but more probably between 58.56 and 66.59. This wave was expected to complete before 13-May-2015, and must complete by 28-Mar-2017.
After wave x is complete, expect the market to continue up into wave y, which should be a three wave Zigzag pattern. Expect wave y to retrace wave x by 149% - 348%. Wave y can also be expected to be 90% - 348% of the price length of wave w. The expected time for wave y to complete is 23% - 188% of the time taken for wave x to complete and 28% - 133% of the time taken for wave w to complete.
Current Analysis Settings: Analysis Date Range: 13-Jan-2014 to 18-Mar-2016, Label Range: 15 - 50, Preferred Count Labels: 26, Min Rating: 75, Stocks toggle ON, Bias Towards Beginning of Data: 8, Bias Towards Major High/Low: 8, Largest Degree Wave Filter: Any Pattern
Rating:87.9
Current Trading Positions for Cognizant Tech Sol Cp A (CTSH) Daily on 18-Mar-2016
* An Intermediate degree trader (hold positions from months to quarters), would currently be trading long in this market. The probability of this Target Area being correct is 54.2%. However, the random probability of this Target Area being correct is 45.0%. So the true probability of this Target Area being correct is 20.4% better than random.
* A Primary degree trader (hold positions from months to years), would currently be shorting this market. The probability of this Target Area being correct is 38.5%. However, the random probability of this Target Area being correct is 24.3%. So the true probability of this Target Area being correct is 58.4% better than random.
Extensive Elliott Commentary for Cognizant Tech Sol Cp A (CTSH) Daily on 18-Mar-2016 with two incomplete patterns:
Wave (B) of the Intermediate degree Zigzag with a rating of 96.3 is expected to complete in the price range 51.95 to 63.43, but more probably between 54.02 and 58.54. This wave was expected to complete before 25-Feb-2016, and must complete by 26-Apr-2016.
After wave (B) is complete, expect the market to continue down into wave (C), which should be a five wave impulsive pattern. Expect wave (C) to retrace wave (B) by 127% - 277%. Wave (C) can also be expected to be 43% - 277% of the price length of wave (A). The expected time for wave (C) to complete is 19% - 191% of the time taken for wave (B) to complete and 55% - 222% of the time taken for wave (A) to complete.
Wave Y of the Primary degree Double Zigzag with a rating of 87.9 is expected to complete in the price range 37.18 to 53.29, but more probably between 48.46 and 53.11. This wave is due to complete anytime from now until 14-Jul-2016, but is most likely to complete before 08-Apr-2016.
Wave Y will probably complete this Double Sharp pattern, although it could possibly extend into a Triple Sharp pattern.
Current Analysis Settings: Analysis Date Range: 25-Jun-2014 to 18-Mar-2016, Label Range: 15 - 50, Preferred Count Labels: 23, Min Rating: 75, Stocks toggle ON, Bias Towards Beginning of Data: 8, Bias Towards Major High/Low: 8, Largest Degree Wave Filter: Any Pattern
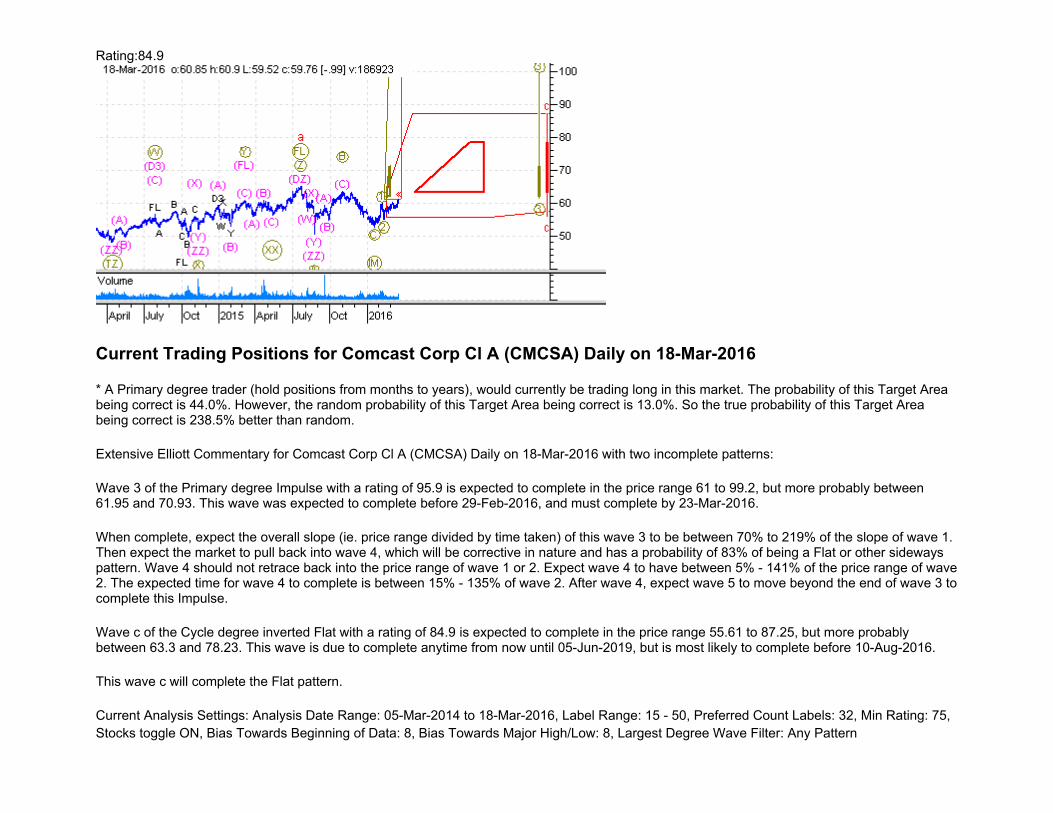
Rating:84.9
Current Trading Positions for Comcast Corp Cl A (CMCSA) Daily on 18-Mar-2016
* A Primary degree trader (hold positions from months to years), would currently be trading long in this market. The probability of this Target Area being correct is 44.0%. However, the random probability of this Target Area being correct is 13.0%. So the true probability of this Target Area being correct is 238.5% better than random.
Extensive Elliott Commentary for Comcast Corp Cl A (CMCSA) Daily on 18-Mar-2016 with two incomplete patterns:
Wave 3 of the Primary degree Impulse with a rating of 95.9 is expected to complete in the price range 61 to 99.2, but more probably between 61.95 and 70.93. This wave was expected to complete before 29-Feb-2016, and must complete by 23-Mar-2016.
When complete, expect the overall slope (ie. price range divided by time taken) of this wave 3 to be between 70% to 219% of the slope of wave 1. Then expect the market to pull back into wave 4, which will be corrective in nature and has a probability of 83% of being a Flat or other sideways pattern. Wave 4 should not retrace back into the price range of wave 1 or 2. Expect wave 4 to have between 5% - 141% of the price range of wave 2. The expected time for wave 4 to complete is between 15% - 135% of wave 2. After wave 4, expect wave 5 to move beyond the end of wave 3 to complete this Impulse.
Wave c of the Cycle degree inverted Flat with a rating of 84.9 is expected to complete in the price range 55.61 to 87.25, but more probably between 63.3 and 78.23. This wave is due to complete anytime from now until 05-Jun-2019, but is most likely to complete before 10-Aug-2016.
This wave c will complete the Flat pattern.
Current Analysis Settings: Analysis Date Range: 05-Mar-2014 to 18-Mar-2016, Label Range: 15 - 50, Preferred Count Labels: 32, Min Rating: 75, Stocks toggle ON, Bias Towards Beginning of Data: 8, Bias Towards Major High/Low: 8, Largest Degree Wave Filter: Any Pattern
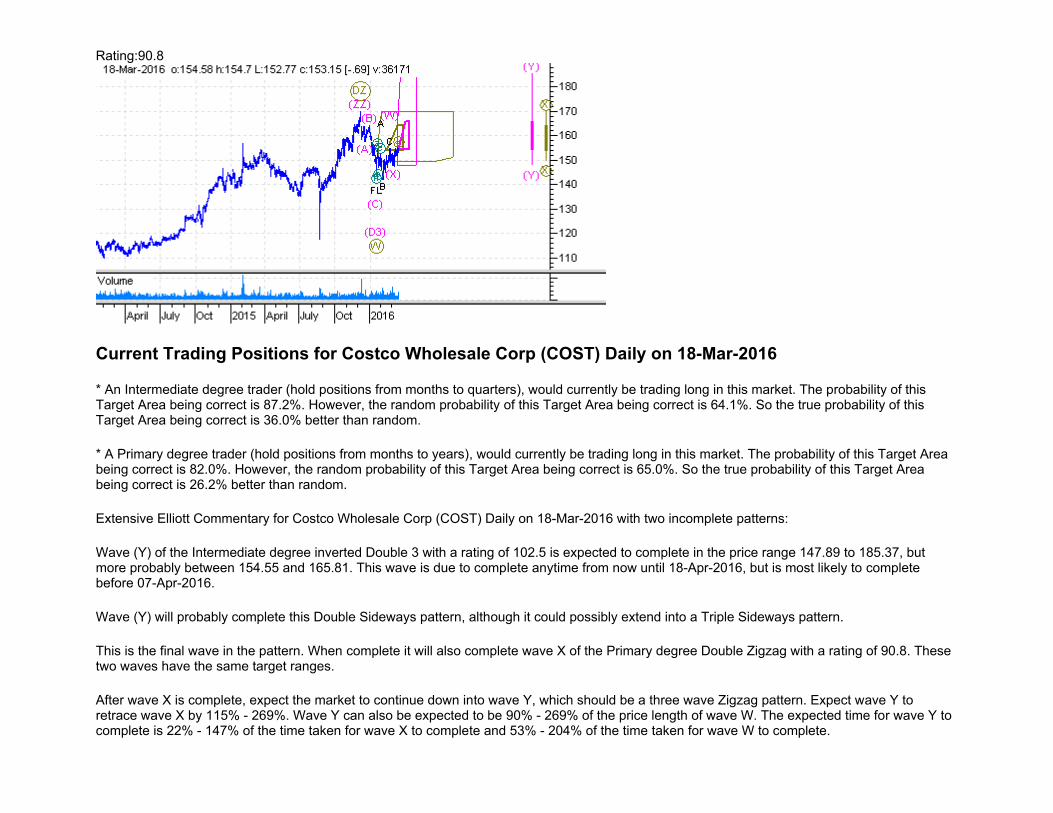
Rating:90.8
Current Trading Positions for Costco Wholesale Corp (COST) Daily on 18-Mar-2016
* An Intermediate degree trader (hold positions from months to quarters), would currently be trading long in this market. The probability of this Target Area being correct is 87.2%. However, the random probability of this Target Area being correct is 64.1%. So the true probability of this Target Area being correct is 36.0% better than random.
* A Primary degree trader (hold positions from months to years), would currently be trading long in this market. The probability of this Target Area being correct is 82.0%. However, the random probability of this Target Area being correct is 65.0%. So the true probability of this Target Area being correct is 26.2% better than random.
Extensive Elliott Commentary for Costco Wholesale Corp (COST) Daily on 18-Mar-2016 with two incomplete patterns:
Wave (Y) of the Intermediate degree inverted Double 3 with a rating of 102.5 is expected to complete in the price range 147.89 to 185.37, but more probably between 154.55 and 165.81. This wave is due to complete anytime from now until 18-Apr-2016, but is most likely to complete before 07-Apr-2016.
Wave (Y) will probably complete this Double Sideways pattern, although it could possibly extend into a Triple Sideways pattern.
This is the final wave in the pattern. When complete it will also complete wave X of the Primary degree Double Zigzag with a rating of 90.8. These two waves have the same target ranges.
After wave X is complete, expect the market to continue down into wave Y, which should be a three wave Zigzag pattern. Expect wave Y to retrace wave X by 115% - 269%. Wave Y can also be expected to be 90% - 269% of the price length of wave W. The expected time for wave Y to complete is 22% - 147% of the time taken for wave X to complete and 53% - 204% of the time taken for wave W to complete.
Current Analysis Settings: Analysis Date Range: 13-Jan-2014 to 18-Mar-2016, Label Range: 15 - 50, Preferred Count Labels: 34, Min Rating: 75, Stocks toggle ON, Bias Towards Beginning of Data: 8, Bias Towards Major High/Low: 8, Largest Degree Wave Filter: Any Pattern
Rating:98.1
Current Trading Positions for Ctrip.com International (CTRP) Daily on 18-Mar-2016
* A Primary degree trader (hold positions from months to years), would currently be trading long in this market. The probability of this Target Area being correct is 57.0%. However, the random probability of this Target Area being correct is 45.0%. So the true probability of this Target Area being correct is 26.7% better than random.
* A Cycle degree trader (hold positions from quarters to years), would currently be shorting this market. The probability of this Target Area being correct is 48.8%. However, the random probability of this Target Area being correct is 34.0%. So the true probability of this Target Area being correct is 43.5% better than random.
Extensive Elliott Commentary for Ctrip.com International (CTRP) Daily on 18-Mar-2016 with two incomplete patterns:
Wave B of the Primary degree Zigzag with a rating of 102.6 is expected to complete in the price range 36.15 to 58.23, but more probably between 38.34 and 46.64. This wave is due to complete anytime from now until 28-Apr-2017, but is most likely to complete before 06-Apr-2016.
After wave B is complete, expect the market to continue down into wave C, which should be a five wave impulsive pattern. Expect wave C to retrace wave B by 96% - 215%. Wave C can also be expected to be 33% - 215% of the price length of wave A. The expected time for wave C to complete is 22% - 199% of the time taken for wave B to complete and 24% - 111% of the time taken for wave A to complete.
Wave b of the Cycle degree inverted Flat with a rating of 98.1 is expected to complete at a price no higher than 30.97, but more probably between 18.37 and 29.79. This wave is due to complete anytime from now until 25-Jan-2019, but is most likely to complete before 05-Sep-2016.
After wave b is complete, expect the market to continue up into wave c, which should be a five wave Impulsive pattern. Expect wave c to retrace wave b by 82% - 179%. Wave c can also be expected to be 67% - 179% of the price length of wave a. The expected time for wave c to complete is 20% - 151% of the time taken for wave b to complete and 11% - 58% of the time taken for wave a to complete.
Current Analysis Settings: Analysis Date Range: 13-Jan-2014 to 18-Mar-2016, Label Range: 15 - 50, Preferred Count Labels: 19, Min Rating: 75, Stocks toggle ON, Bias Towards Beginning of Data: 8, Bias Towards Major High/Low: 8, Largest Degree Wave Filter: Any Pattern
Rating:85.3
Current Trading Positions for Discovery Communications Inc (DISCA) Daily on 18-Mar-2016
* A Primary degree trader (hold positions from months to years), would currently be trading long in this market. The probability of this Target Area being correct is 51.0%. However, the random probability of this Target Area being correct is 45.0%. So the true probability of this Target Area being correct is 13.3% better than random.
* A Cycle degree trader (hold positions from quarters to years), would currently be shorting this market. The probability of this Target Area being correct is 37.5%. However, the random probability of this Target Area being correct is 24.3%. So the true probability of this Target Area being correct is 54.3% better than random.
Extensive Elliott Commentary for Discovery Communications Inc (DISCA) Daily on 18-Mar-2016 with three incomplete patterns:
Wave (C) of the Intermediate degree inverted Flat with a rating of 89.9 is expected to complete in the price range 25.11 to 33.33, but more probably between 27.04 and 30.77. This wave is due to complete anytime from now until 08-Apr-2016, but is most likely to complete before 21-Mar-2016.
This wave (C) will complete the Flat pattern.
This is the final wave in the pattern. When complete it will also complete wave B of the Primary degree Zigzag with a rating of 80.1. These two waves have the same target ranges.
After wave B is complete, expect the market to continue down into wave C, which should be a five wave impulsive pattern. Expect wave C to retrace wave B by 127% - 277%. Wave C can also be expected to be 43% - 277% of the price length of wave A. The expected time for wave C to complete is 19% - 191% of the time taken for wave B to complete and 55% - 222% of the time taken for wave A to complete.
Wave y of the Cycle degree Double Zigzag with a rating of 85.3 is expected to complete in the price range 3.96 to 20.78, but more probably between 16.02 and 20.54. This wave is due to complete anytime from now until 31-Mar-2017, but is most likely to complete before 25-Mar-2016.
Wave y will probably complete this Double Sharp pattern, although it could possibly extend into a Triple Sharp pattern.
Current Analysis Settings: Analysis Date Range: 14-Jul-2014 to 18-Mar-2016, Label Range: 15 - 50, Preferred Count Labels: 23, Min Rating: 75, Stocks toggle ON, Bias Towards Beginning of Data: 8, Bias Towards Major High/Low: 8, Largest Degree Wave Filter: Any Pattern
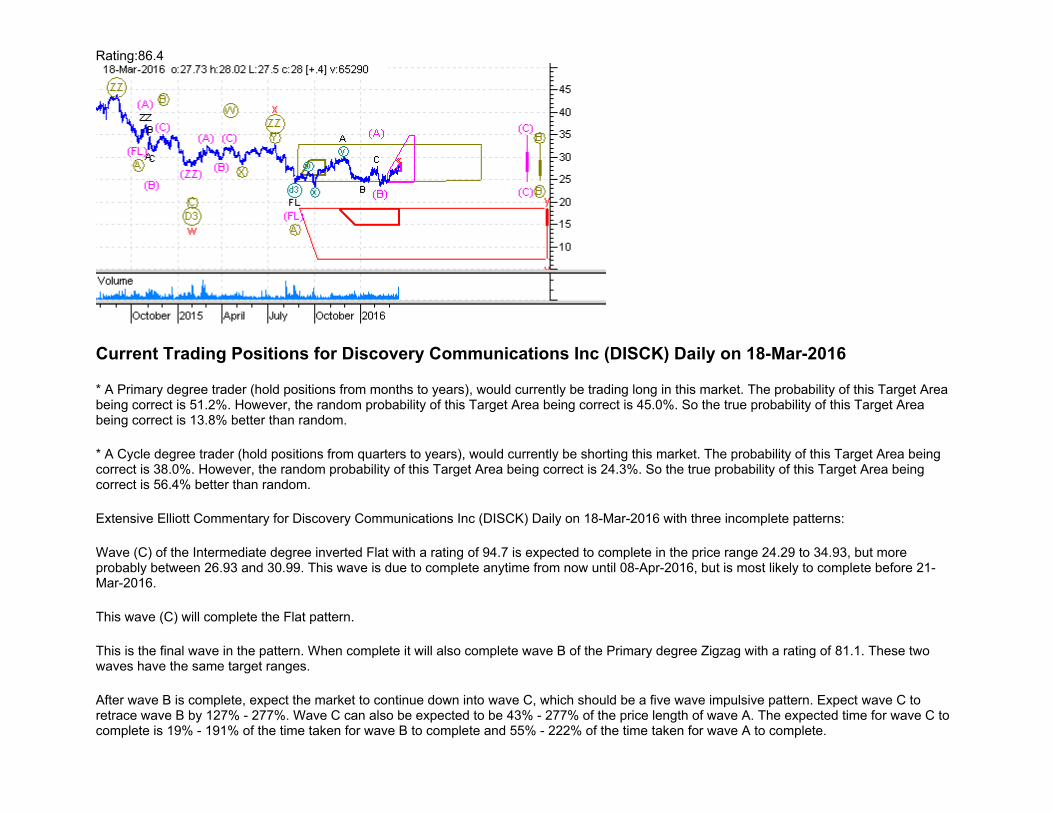
Rating:86.4
Current Trading Positions for Discovery Communications Inc (DISCK) Daily on 18-Mar-2016
* A Primary degree trader (hold positions from months to years), would currently be trading long in this market. The probability of this Target Area being correct is 51.2%. However, the random probability of this Target Area being correct is 45.0%. So the true probability of this Target Area being correct is 13.8% better than random.
* A Cycle degree trader (hold positions from quarters to years), would currently be shorting this market. The probability of this Target Area being correct is 38.0%. However, the random probability of this Target Area being correct is 24.3%. So the true probability of this Target Area being correct is 56.4% better than random.
Extensive Elliott Commentary for Discovery Communications Inc (DISCK) Daily on 18-Mar-2016 with three incomplete patterns:
Wave (C) of the Intermediate degree inverted Flat with a rating of 94.7 is expected to complete in the price range 24.29 to 34.93, but more probably between 26.93 and 30.99. This wave is due to complete anytime from now until 08-Apr-2016, but is most likely to complete before 21-Mar-2016.
This wave (C) will complete the Flat pattern.
This is the final wave in the pattern. When complete it will also complete wave B of the Primary degree Zigzag with a rating of 81.1. These two waves have the same target ranges.
After wave B is complete, expect the market to continue down into wave C, which should be a five wave impulsive pattern. Expect wave C to retrace wave B by 127% - 277%. Wave C can also be expected to be 43% - 277% of the price length of wave A. The expected time for wave C to complete is 19% - 191% of the time taken for wave B to complete and 55% - 222% of the time taken for wave A to complete.
Wave y of the Cycle degree Double Zigzag with a rating of 86.4 is expected to complete in the price range 7.28 to 18.56, but more probably between 14.88 and 18.31. This wave is due to complete anytime from now until 24-Feb-2017, but is most likely to complete before 18-Mar-2016.
Wave y will probably complete this Double Sharp pattern, although it could possibly extend into a Triple Sharp pattern.
Current Analysis Settings: Analysis Date Range: 23-Jul-2014 to 18-Mar-2016, Label Range: 15 - 50, Preferred Count Labels: 22, Min Rating: 75, Stocks toggle ON, Bias Towards Beginning of Data: 8, Bias Towards Major High/Low: 8, Largest Degree Wave Filter: Any Pattern
Rating:102.3
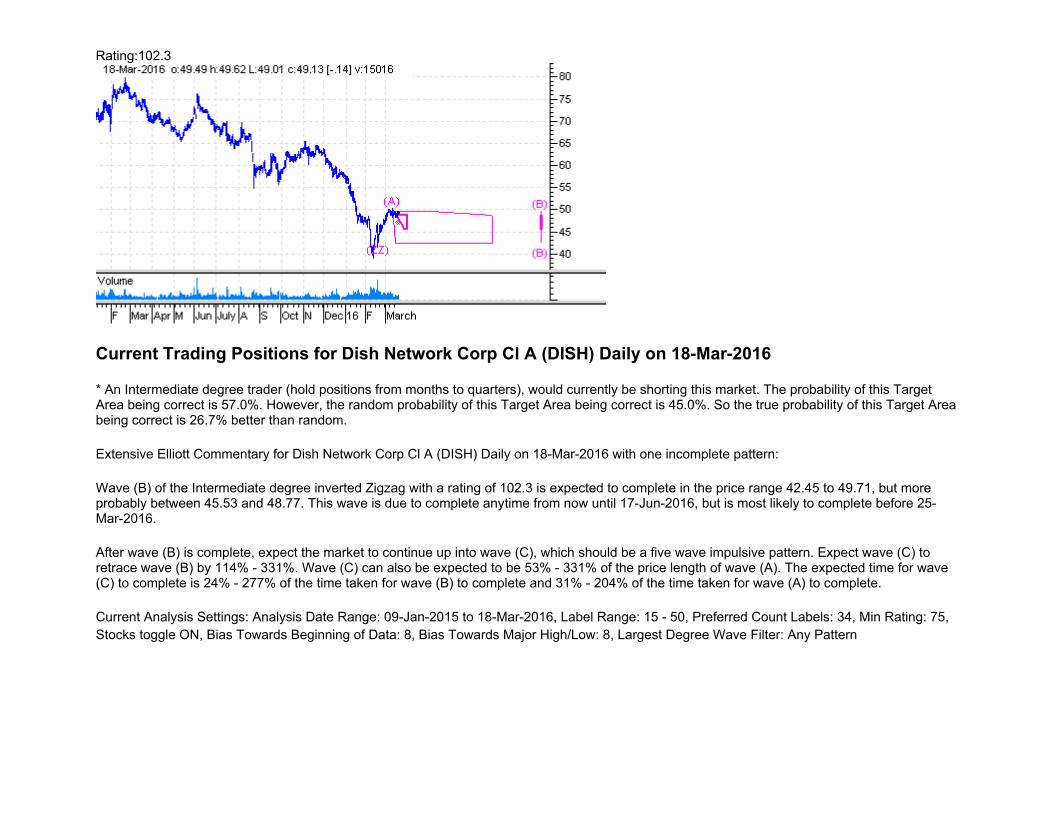
Current Trading Positions for Dish Network Corp Cl A (DISH) Daily on 18-Mar-2016
* An Intermediate degree trader (hold positions from months to quarters), would currently be shorting this market. The probability of this Target Area being correct is 57.0%. However, the random probability of this Target Area being correct is 45.0%. So the true probability of this Target Area being correct is 26.7% better than random.
Extensive Elliott Commentary for Dish Network Corp Cl A (DISH) Daily on 18-Mar-2016 with one incomplete pattern:
Wave (B) of the Intermediate degree inverted Zigzag with a rating of 102.3 is expected to complete in the price range 42.45 to 49.71, but more probably between 45.53 and 48.77. This wave is due to complete anytime from now until 17-Jun-2016, but is most likely to complete before 25-Mar-2016.
After wave (B) is complete, expect the market to continue up into wave (C), which should be a five wave impulsive pattern. Expect wave (C) to retrace wave (B) by 114% - 331%. Wave (C) can also be expected to be 53% - 331% of the price length of wave (A). The expected time for wave (C) to complete is 24% - 277% of the time taken for wave (B) to complete and 31% - 204% of the time taken for wave (A) to complete.
Current Analysis Settings: Analysis Date Range: 09-Jan-2015 to 18-Mar-2016, Label Range: 15 - 50, Preferred Count Labels: 34, Min Rating: 75, Stocks toggle ON, Bias Towards Beginning of Data: 8, Bias Towards Major High/Low: 8, Largest Degree Wave Filter: Any Pattern
Rating:101.8
Current Trading Positions for Dollar Tree Stores Inc (DLTR) Daily on 18-Mar-2016
* A Primary degree trader (hold positions from months to years), would currently be trading long in this market. The probability of this Target Area being correct is 64.7%. However, the random probability of this Target Area being correct is 45.0%. So the true probability of this Target Area being correct is 43.8% better than random.
Extensive Elliott Commentary for Dollar Tree Stores Inc (DLTR) Daily on 18-Mar-2016 with one incomplete pattern:
Wave C of the Primary degree inverted Zigzag with a rating of 101.8 is expected to complete in the price range 82 to 112.84, but more probably between 84.5 and 102.01. This wave could complete anytime between now and 21-Oct-2016, but is most likely to complete sometime between 18-Mar-2016 and 23-May-2016.
This wave C will complete the ZigZag pattern.
Current Analysis Settings: Analysis Date Range: 13-Jan-2014 to 18-Mar-2016, Label Range: 15 - 50, Preferred Count Labels: 21, Min Rating: 75, Stocks toggle ON, Bias Towards Beginning of Data: 8, Bias Towards Major High/Low: 8, Largest Degree Wave Filter: Any Pattern
Rating:102
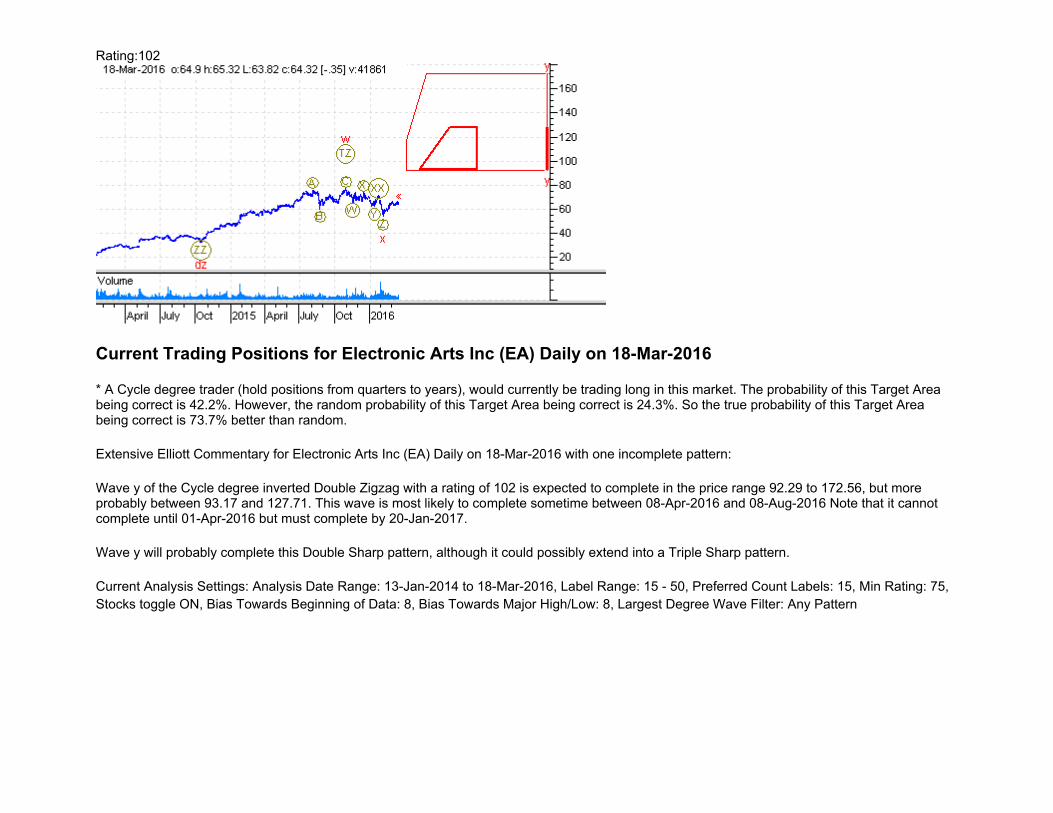
Current Trading Positions for Electronic Arts Inc (EA) Daily on 18-Mar-2016
* A Cycle degree trader (hold positions from quarters to years), would currently be trading long in this market. The probability of this Target Area being correct is 42.2%. However, the random probability of this Target Area being correct is 24.3%. So the true probability of this Target Area being correct is 73.7% better than random.
Extensive Elliott Commentary for Electronic Arts Inc (EA) Daily on 18-Mar-2016 with one incomplete pattern:
Wave y of the Cycle degree inverted Double Zigzag with a rating of 102 is expected to complete in the price range 92.29 to 172.56, but more probably between 93.17 and 127.71. This wave is most likely to complete sometime between 08-Apr-2016 and 08-Aug-2016 Note that it cannot complete until 01-Apr-2016 but must complete by 20-Jan-2017.
Wave y will probably complete this Double Sharp pattern, although it could possibly extend into a Triple Sharp pattern.
Current Analysis Settings: Analysis Date Range: 13-Jan-2014 to 18-Mar-2016, Label Range: 15 - 50, Preferred Count Labels: 15, Min Rating: 75, Stocks toggle ON, Bias Towards Beginning of Data: 8, Bias Towards Major High/Low: 8, Largest Degree Wave Filter: Any Pattern
Rating:99
Current Trading Positions for Endo International PLC (ENDP) Daily on 18-Mar-2016
* A Primary degree trader (hold positions from months to years), would currently be trading long in this market. The probability of this Target Area being correct is 48.8%. However, the random probability of this Target Area being correct is 34.0%. So the true probability of this Target Area being correct is 43.5% better than random.
Extensive Elliott Commentary for Endo International PLC (ENDP) Daily on 18-Mar-2016 with one incomplete pattern:
Wave B of the Primary degree Flat with a rating of 99 is expected to complete in the price range 52.1 to 122.81, but more probably between 52.83 and 71.32. This wave is most likely to complete sometime between 28-Mar-2016 and 10-Jun-2016 Note that it cannot complete until 21-Mar-2016 but must complete by 10-Nov-2017.
After wave B is complete, expect the market to continue down into wave C, which should be a five wave Impulsive pattern. Expect wave C to retrace wave B by 86% - 162%. Wave C can also be expected to be 90% - 162% of the price length of wave A. The expected time for wave C to complete is 19% - 134% of the time taken for wave B to complete and 24% - 115% of the time taken for wave A to complete.
Current Analysis Settings: Analysis Date Range: 05-Mar-2015 to 18-Mar-2016, Label Range: 15 - 50, Preferred Count Labels: 15, Min Rating: 75, Stocks toggle ON, Bias Towards Beginning of Data: 8, Bias Towards Major High/Low: 8, Largest Degree Wave Filter: Any Pattern
Rating:93.3
Current Trading Positions for Expedia Inc (EXPE) Daily on 18-Mar-2016
* A Primary degree trader (hold positions from months to years), would currently be trading long in this market. The probability of this Target Area being correct is 49.4%. However, the random probability of this Target Area being correct is 34.0%. So the true probability of this Target Area being correct is 45.3% better than random.
* A Cycle degree trader (hold positions from quarters to years), would currently be shorting this market. The probability of this Target Area being correct is 45.8%. However, the random probability of this Target Area being correct is 34.0%. So the true probability of this Target Area being correct is 34.7% better than random.
Extensive Elliott Commentary for Expedia Inc (EXPE) Daily on 18-Mar-2016 with two incomplete patterns:
Wave B of the Primary degree Flat with a rating of 99.6 is expected to complete in the price range 123.83 to 225.44, but more probably between 124.87 and 151.45. This wave is due to complete anytime from now until 23-Aug-2017, but is most likely to complete before 09-May-2016.
After wave B is complete, expect the market to continue down into wave C, which should be a five wave Impulsive pattern. Expect wave C to retrace wave B by 86% - 162%. Wave C can also be expected to be 90% - 162% of the price length of wave A. The expected time for wave C to complete is 19% - 134% of the time taken for wave B to complete and 24% - 115% of the time taken for wave A to complete.
Wave b of the Cycle degree inverted Flat with a rating of 93.3 is expected to complete at a price no higher than 88.41, but more probably between 63.53 and 86.08. This wave is due to complete anytime from now until 10-Dec-2018, but is most likely to complete before 18-Aug-2016.
After wave b is complete, expect the market to continue up into wave c, which should be a five wave Impulsive pattern. Expect wave c to retrace wave b by 82% - 179%. Wave c can also be expected to be 67% - 179% of the price length of wave a. The expected time for wave c to complete is 20% - 151% of the time taken for wave b to complete and 11% - 58% of the time taken for wave a to complete.
Current Analysis Settings: Analysis Date Range: 13-Jan-2014 to 18-Mar-2016, Label Range: 15 - 50, Preferred Count Labels: 18, Min Rating: 75, Stocks toggle ON, Bias Towards Beginning of Data: 8, Bias Towards Major High/Low: 8, Largest Degree Wave Filter: Any Pattern
Rating:79.4
Current Trading Positions for Express Scripts Holding Co (ESRX) Daily on 18-Mar-2016
* A Primary degree trader (hold positions from months to years), would currently be shorting this market. The probability of this Target Area being correct is 70.5%. However, the random probability of this Target Area being correct is 45.0%. So the true probability of this Target Area being correct is 56.7% better than random.
Extensive Elliott Commentary for Express Scripts Holding Co (ESRX) Daily on 18-Mar-2016 with two incomplete patterns:
Wave 2 of the Primary degree Impulse with a rating of 94.4 is expected to complete in the price range 65.55 to 71.95, but more probably between 68.78 and 71.29. This wave was expected to complete before 11-Mar-2016, and must complete by 26-Apr-2016.
After this wave 2 is complete, expect the market to continue up into wave 3. Wave 3 should always be an Impulse and should retrace wave 2 completely. Expect wave 3 to retrace wave 2 by 164% - 383%. Wave 3 can also be expected to be 83% - 383% of the price length of wave 1. The expected time for wave 3 to complete is 87% - 367% of the time taken for wave 2 to complete and 16% - 97% of the time taken for wave 1 to complete. The slope (ie. price range divided by time taken) of wave 3 should be between 70% and 219% of the slope of wave 1. Once wave 3 is complete, expect wave 4 to be a sideways corrective movement, then wave 5 to continue in the same direction as wave 3. Wave 5 will complete this Impulse.
Wave c of the Cycle degree inverted Flat with a rating of 79.4 is expected to complete in the price range 71.94 to 145.75, but more probably between 87.5 and 116.88. This wave could complete anytime between now and 22-Nov-2019, but is most likely to complete sometime between 24-Mar-2016 and 05-Sep-2016.
This wave c will complete the Flat pattern.
Current Analysis Settings: Analysis Date Range: 19-Mar-2014 to 18-Mar-2016, Label Range: 15 - 50, Preferred Count Labels: 29, Min Rating: 75, Stocks toggle ON, Bias Towards Beginning of Data: 8, Bias Towards Major High/Low: 8, Largest Degree Wave Filter: Any Pattern
Rating:79.1
Current Trading Positions for Facebook Inc (FB) Daily on 18-Mar-2016
* A Minor degree trader (hold positions from weeks to quarters), would currently be trading long in this market. The probability of this Target Area being correct is 59.1%. However, the random probability of this Target Area being correct is 45.0%. So the true probability of this Target Area being correct is 31.3% better than random.
* An Intermediate degree trader (hold positions from months to quarters), would currently be trading long in this market. The probability of this Target Area being correct is 40.6%. However, the random probability of this Target Area being correct is 24.3%. So the true probability of this Target Area being correct is 67.1% better than random.
* A Primary degree trader (hold positions from months to years), would currently be trading long in this market. The probability of this Target Area being correct is 40.1%. However, the random probability of this Target Area being correct is 34.0%. So the true probability of this Target Area being correct is 17.9% better than random.
* A Cycle degree trader (hold positions from quarters to years), would currently be shorting this market. The probability of this Target Area being correct is 40.7%. However, the random probability of this Target Area being correct is 34.0%. So the true probability of this Target Area being correct is 19.7% better than random.
Extensive Elliott Commentary for Facebook Inc (FB) Daily on 18-Mar-2016 with four incomplete patterns:
Wave C of the Minor degree inverted Zigzag with a rating of 96.8 is expected to complete in the price range 115.3 to 200.67, but more probably between 117.9 and 151.79. This wave was expected to complete before 03-Mar-2016, and must complete by 08-Apr-2016.
This wave C will complete the ZigZag pattern.
This is the final wave in the pattern. When complete it will also complete wave (Y) of the Intermediate degree inverted Double Zigzag with a rating of 93.7. These two waves have the same target ranges.
Wave (Y) will probably complete this Double Sharp pattern, although it could possibly extend into a Triple Sharp pattern.
This is the final wave in the pattern. When complete it will also complete wave B of the Primary degree Flat with a rating of 77.1. These two waves have the same target ranges.
After wave B is complete, expect the market to continue down into wave C, which should be a five wave Impulsive pattern. Expect wave C to retrace wave B by 89% - 167%. Wave C can also be expected to be 104% - 167% of the price length of wave A. The expected time for wave C to complete is 20% - 146% of the time taken for wave B to complete and 53% - 275% of the time taken for wave A to complete.
Wave b of the Cycle degree inverted Flat with a rating of 79.1 is expected to complete in the price range 10.52 to 69.37, but more probably between 55.1 and 68.03. This wave is due to complete anytime from now until 31-Oct-2017, but is most likely to complete before 21-Mar-2016.
After wave b is complete, expect the market to continue up into wave c, which should be a five wave Impulsive pattern. Expect wave c to retrace wave b by 82% - 179%. Wave c can also be expected to be 67% - 179% of the price length of wave a. The expected time for wave c to complete is 20% - 151% of the time taken for wave b to complete and 11% - 58% of the time taken for wave a to complete.
Current Analysis Settings: Analysis Date Range: 13-Jan-2014 to 18-Mar-2016, Label Range: 15 - 50, Preferred Count Labels: 26, Min Rating: 75, Stocks toggle ON, Bias Towards Beginning of Data: 8, Bias Towards Major High/Low: 8, Largest Degree Wave Filter: Any Pattern
Rating:103.6
Current Trading Positions for Gilead Sciences Inc (GILD) Daily on 18-Mar-2016
* A Cycle degree trader (hold positions from quarters to years), would currently be trading long in this market. The probability of this Target Area being correct is 42.6%. However, the random probability of this Target Area being correct is 24.3%. So the true probability of this Target Area being correct is 75.3% better than random.
Extensive Elliott Commentary for Gilead Sciences Inc (GILD) Daily on 18-Mar-2016 with one incomplete pattern:
Wave y of the Cycle degree inverted Double Zigzag with a rating of 103.6 is expected to complete in the price range 128.28 to 256.24, but more probably between 131.91 and 181.34. This wave is most likely to complete sometime between 19-Apr-2016 and 09-Mar-2017 Note that it cannot complete until 12-Apr-2016 but must complete by 25-Dec-2017.
Wave y will probably complete this Double Sharp pattern, although it could possibly extend into a Triple Sharp pattern.
Current Analysis Settings: Analysis Date Range: 03-Mar-2014 to 18-Mar-2016, Label Range: 15 - 50, Preferred Count Labels: 18, Min Rating: 75, Stocks toggle ON, Bias Towards Beginning of Data: 8, Bias Towards Major High/Low: 8, Largest Degree Wave Filter: Any Pattern
Rating:93
Current Trading Positions for Henry Schein Inc (HSIC) Daily on 18-Mar-2016
* A Primary degree trader (hold positions from months to years), would currently be trading long in this market. The probability of this Target Area being correct is 53.7%. However, the random probability of this Target Area being correct is 45.0%. So the true probability of this Target Area being correct is 19.3% better than random.
Extensive Elliott Commentary for Henry Schein Inc (HSIC) Daily on 18-Mar-2016 with one incomplete pattern:
Wave C of the Primary degree inverted Zigzag with a rating of 93 is expected to complete in the price range 153.1 to 191.91, but more probably between 154.42 and 169.66. This wave was expected to complete before 01-Mar-2016, and must complete by 07-Apr-2016.
This wave C will complete the ZigZag pattern.
Current Analysis Settings: Analysis Date Range: 05-Sep-2014 to 18-Mar-2016, Label Range: 15 - 50, Preferred Count Labels: 15, Min Rating: 75, Stocks toggle ON, Bias Towards Beginning of Data: 8, Bias Towards Major High/Low: 8, Largest Degree Wave Filter: Any Pattern
Rating:87.3
Current Trading Positions for Illumina Inc (ILMN) Daily on 18-Mar-2016
* A Primary degree trader (hold positions from months to years), would currently be shorting this market. The probability of this Target Area being correct is 42.8%. However, the random probability of this Target Area being correct is 24.3%. So the true probability of this Target Area being correct is 76.1% better than random.
* A Cycle degree trader (hold positions from quarters to years), would currently be shorting this market. The probability of this Target Area being correct is 43.1%. However, the random probability of this Target Area being correct is 34.0%. So the true probability of this Target Area being correct is 26.8% better than random.
Extensive Elliott Commentary for Illumina Inc (ILMN) Daily on 18-Mar-2016 with two incomplete patterns:
Wave Y of the Primary degree Double Zigzag with a rating of 104.6 is expected to complete in the price range .23 to 105.64, but more probably between 74.44 and 104.65. This wave is due to complete anytime from now until 08-Jun-2016, but is most likely to complete before 18-Apr-2016.
Wave Y will probably complete this Double Sharp pattern, although it could possibly extend into a Triple Sharp pattern.
This is the final wave in the pattern. When complete it will also complete wave b of the Cycle degree inverted Flat with a rating of 87.3. These two waves have the same target ranges.
After wave b is complete, expect the market to continue up into wave c, which should be a five wave Impulsive pattern. Expect wave c to retrace wave b by 82% - 179%. Wave c can also be expected to be 67% - 179% of the price length of wave a. The expected time for wave c to complete is 20% - 151% of the time taken for wave b to complete and 11% - 58% of the time taken for wave a to complete.
Current Analysis Settings: Analysis Date Range: 13-Jan-2014 to 18-Mar-2016, Label Range: 15 - 50, Preferred Count Labels: 25, Min Rating: 75, Stocks toggle ON, Bias Towards Beginning of Data: 8, Bias Towards Major High/Low: 8, Largest Degree Wave Filter: Any Pattern
Rating:93.1
Current Trading Positions for Intel Corp (INTC) Daily on 18-Mar-2016
* A Primary degree trader (hold positions from months to years), would currently be trading long in this market. The probability of this Target Area being correct is 64.7%. However, the random probability of this Target Area being correct is 45.0%. So the true probability of this Target Area being correct is 43.8% better than random.
* A Cycle degree trader (hold positions from quarters to years), would currently be trading long in this market. The probability of this Target Area being correct is 40.6%. However, the random probability of this Target Area being correct is 24.3%. So the true probability of this Target Area being correct is 67.1% better than random.
Extensive Elliott Commentary for Intel Corp (INTC) Daily on 18-Mar-2016 with two incomplete patterns:
Wave C of the Primary degree inverted Zigzag with a rating of 101.5 is expected to complete in the price range 34.79 to 67.23, but more probably between 35.19 and 47.2. This wave is due to complete anytime from now until 12-Dec-2016, but is most likely to complete before 20-May-2016.
This wave C will complete the ZigZag pattern.
This is the final wave in the pattern. When complete it will also complete wave y of the Cycle degree inverted Double Zigzag with a rating of 93.1. These two waves have the same target ranges.
Wave y will probably complete this Double Sharp pattern, although it could possibly extend into a Triple Sharp pattern.
Current Analysis Settings: Analysis Date Range: 13-Jan-2014 to 18-Mar-2016, Label Range: 15 - 50, Preferred Count Labels: 18, Min Rating: 75, Stocks toggle ON, Bias Towards Beginning of Data: 8, Bias Towards Major High/Low: 8, Largest Degree Wave Filter: Any Pattern
Rating:100.8
Current Trading Positions for Intuit Inc (INTU) Daily on 18-Mar-2016
* A Primary degree trader (hold positions from months to years), would currently be trading long in this market. The probability of this Target Area being correct is 50.5%. However, the random probability of this Target Area being correct is 34.0%. So the true probability of this Target Area being correct is 48.5% better than random.
* A Cycle degree trader (hold positions from quarters to years), would currently be shorting this market. The probability of this Target Area being correct is 50.0%. However, the random probability of this Target Area being correct is 34.0%. So the true probability of this Target Area being correct is 47.1% better than random.
Extensive Elliott Commentary for Intuit Inc (INTU) Daily on 18-Mar-2016 with two incomplete patterns:
Wave B of the Primary degree Flat with a rating of 105.6 is expected to complete in the price range 101.65 to 140.32, but more probably between 102.05 and 112.16. This wave is due to complete anytime from now until 16-Jun-2017, but is most likely to complete before 02-May-2016.
After wave B is complete, expect the market to continue down into wave C, which should be a five wave Impulsive pattern. Expect wave C to retrace wave B by 86% - 162%. Wave C can also be expected to be 90% - 162% of the price length of wave A. The expected time for wave C to complete is 19% - 134% of the time taken for wave B to complete and 24% - 115% of the time taken for wave A to complete.
Wave b of the Cycle degree inverted Flat with a rating of 100.8 is expected to complete in the price range 37.23 to 84.17, but more probably between 72.79 and 83.1. This wave is due to complete anytime from now until 21-Sep-2018, but is most likely to complete before 08-Aug-2016.
After wave b is complete, expect the market to continue up into wave c, which should be a five wave Impulsive pattern. Expect wave c to retrace wave b by 82% - 179%. Wave c can also be expected to be 67% - 179% of the price length of wave a. The expected time for wave c to complete is 20% - 151% of the time taken for wave b to complete and 11% - 58% of the time taken for wave a to complete.
Current Analysis Settings: Analysis Date Range: 13-Jan-2014 to 18-Mar-2016, Label Range: 15 - 50, Preferred Count Labels: 18, Min Rating: 75, Stocks toggle ON, Bias Towards Beginning of Data: 8, Bias Towards Major High/Low: 8, Largest Degree Wave Filter: Any Pattern
Rating:96.1
Current Trading Positions for Intuitive Surgical Inc (ISRG) Daily on 18-Mar-2016
* A Primary degree trader (hold positions from months to years), would currently be trading long in this market. The probability of this Target Area being correct is 65.1%. However, the random probability of this Target Area being correct is 45.0%. So the true probability of this Target Area being correct is 44.7% better than random.
* A Cycle degree trader (hold positions from quarters to years), would currently be trading long in this market. The probability of this Target Area being correct is 41.2%. However, the random probability of this Target Area being correct is 24.3%. So the true probability of this Target Area being correct is 69.5% better than random.
Extensive Elliott Commentary for Intuitive Surgical Inc (ISRG) Daily on 18-Mar-2016 with two incomplete patterns:
Wave C of the Primary degree inverted Zigzag with a rating of 103.2 is expected to complete in the price range 572.2 to 891.96, but more probably between 576.1 and 712.78. This wave is due to complete anytime from now until 16-Jun-2016, but is most likely to complete before 15-Apr-2016.
This wave C will complete the ZigZag pattern.
This is the final wave in the pattern. When complete it will also complete wave y of the Cycle degree inverted Double Zigzag with a rating of 96.1. These two waves have the same target ranges.
Wave y will probably complete this Double Sharp pattern, although it could possibly extend into a Triple Sharp pattern.
Current Analysis Settings: Analysis Date Range: 28-Mar-2014 to 18-Mar-2016, Label Range: 15 - 50, Preferred Count Labels: 18, Min Rating: 75, Stocks toggle ON, Bias Towards Beginning of Data: 8, Bias Towards Major High/Low: 8, Largest Degree Wave Filter: Any Pattern
Rating:103.8
Current Trading Positions for Kla-Tencor Corp (KLAC) Daily on 18-Mar-2016
* A Primary degree trader (hold positions from months to years), would currently be trading long in this market. The probability of this Target Area being correct is 50.3%. However, the random probability of this Target Area being correct is 34.0%. So the true probability of this Target Area being correct is 47.9% better than random.
Extensive Elliott Commentary for Kla-Tencor Corp (KLAC) Daily on 18-Mar-2016 with one incomplete pattern:
Wave B of the Primary degree Flat with a rating of 103.8 is expected to complete in the price range 67.73 to 95.87, but more probably between 67.89 and 73.22. This wave is due to complete anytime from now until 12-Dec-2016, but is most likely to complete before 12-May-2016.
After wave B is complete, expect the market to continue down into wave C, which should be a five wave Impulsive pattern. Expect wave C to retrace wave B by 89% - 167%. Wave C can also be expected to be 104% - 167% of the price length of wave A. The expected time for wave C to complete is 20% - 146% of the time taken for wave B to complete and 53% - 275% of the time taken for wave A to complete.
Current Analysis Settings: Analysis Date Range: 15-Oct-2014 to 18-Mar-2016, Label Range: 15 - 50, Preferred Count Labels: 32, Min Rating: 75, Stocks toggle ON, Bias Towards Beginning of Data: 8, Bias Towards Major High/Low: 8, Largest Degree Wave Filter: Any Pattern
Rating:109.1
Current Trading Positions for Lam Research Corp (LRCX) Daily on 18-Mar-2016
* A Primary degree trader (hold positions from months to years), would currently be trading long in this market. The probability of this Target Area being correct is 87.9%. However, the random probability of this Target Area being correct is 64.1%. So the true probability of this Target Area being correct is 37.1% better than random.
Extensive Elliott Commentary for Lam Research Corp (LRCX) Daily on 18-Mar-2016 with one incomplete pattern:
Wave Y of the Primary degree inverted Double 3 with a rating of 109.1 is expected to complete in the price range 64.7 to 152.41, but more probably between 79.14 and 105.04. This wave is due to complete anytime from now until 19-Jul-2016, but is most likely to complete before 11-May-2016.
Wave Y will probably complete this Double Sideways pattern, although it could possibly extend into a Triple Sideways pattern.
Current Analysis Settings: Analysis Date Range: 13-Jan-2014 to 18-Mar-2016, Label Range: 15 - 50, Preferred Count Labels: 26, Min Rating: 75, Stocks toggle ON, Bias Towards Beginning of Data: 8, Bias Towards Major High/Low: 8, Largest Degree Wave Filter: Any Pattern
Rating:104
Current Trading Positions for Liberty Global Inc Class A (LBTYA) Daily on 18-Mar-2016
* A Primary degree trader (hold positions from months to years), would currently be trading long in this market. The probability of this Target Area being correct is 42.6%. However, the random probability of this Target Area being correct is 24.3%. So the true probability of this Target Area being correct is 75.3% better than random.
Extensive Elliott Commentary for Liberty Global Inc Class A (LBTYA) Daily on 18-Mar-2016 with one incomplete pattern:
Wave Y of the Primary degree inverted Double Zigzag with a rating of 104 is expected to complete in the price range 41.41 to 52.33, but more probably between 41.53 and 46.03. This wave is due to complete anytime from now until 25-Apr-2016, but is most likely to complete before 01-Apr-2016.
Wave Y will probably complete this Double Sharp pattern, although it could possibly extend into a Triple Sharp pattern.
Current Analysis Settings: Analysis Date Range: 15-Apr-2015 to 18-Mar-2016, Label Range: 15 - 50, Preferred Count Labels: 37, Min Rating: 75, Stocks toggle ON, Bias Towards Beginning of Data: 8, Bias Towards Major High/Low: 8, Largest Degree Wave Filter: Any Pattern
Rating:97.5
Current Trading Positions for Liberty Global Inc Class C (LBTYK) Daily on 18-Mar-2016
* A Cycle degree trader (hold positions from quarters to years), would currently be trading long in this market. The probability of this Target Area being correct is 48.2%. However, the random probability of this Target Area being correct is 34.0%. So the true probability of this Target Area being correct is 41.8% better than random.
Extensive Elliott Commentary for Liberty Global Inc Class C (LBTYK) Daily on 18-Mar-2016 with one incomplete pattern:
Wave b of the Cycle degree Flat with a rating of 97.5 is expected to complete in the price range 44.01 to 84.33, but more probably between 44.42 and 54.97. This wave is due to complete anytime from now until 12-Apr-2019, but is most likely to complete before 05-Aug-2016.
After wave b is complete, expect the market to continue down into wave c, which should be a five wave Impulsive pattern. Expect wave c to retrace wave b by 86% - 162%. Wave c can also be expected to be 90% - 162% of the price length of wave a. The expected time for wave c to complete is 19% - 134% of the time taken for wave b to complete and 24% - 115% of the time taken for wave a to complete.
Current Analysis Settings: Analysis Date Range: 15-Apr-2015 to 18-Mar-2016, Label Range: 15 - 50, Preferred Count Labels: 17, Min Rating: 75, Stocks toggle ON, Bias Towards Beginning of Data: 8, Bias Towards Major High/Low: 8, Largest Degree Wave Filter: Any Pattern
Rating:88.6
Current Trading Positions for Liberty Media Corporation (LMCA) Daily on 18-Mar-2016
* A Primary degree trader (hold positions from months to years), would currently be trading long in this market. The probability of this Target Area being correct is 41.0%. However, the random probability of this Target Area being correct is 34.0%. So the true probability of this Target Area being correct is 20.6% better than random.
* A Cycle degree trader (hold positions from quarters to years), would currently be shorting this market. The probability of this Target Area being correct is 43.4%. However, the random probability of this Target Area being correct is 34.0%. So the true probability of this Target Area being correct is 27.6% better than random.
Extensive Elliott Commentary for Liberty Media Corporation (LMCA) Daily on 18-Mar-2016 with three incomplete patterns:
Wave (C) of the Intermediate degree inverted Flat with a rating of 95 is expected to complete in the price range 33.38 to 41.45, but more probably between 35.09 and 39.14. This wave was expected to complete before 09-Mar-2016, and must complete by 06-May-2016.
This wave (C) will complete the Flat pattern.
This is the final wave in the pattern. When complete it will also complete wave B of the Primary degree Flat with a rating of 80.2. These two waves have the same target ranges.
After wave B is complete, expect the market to continue down into wave C, which should be a five wave Impulsive pattern. Expect wave C to retrace wave B by 86% - 162%. Wave C can also be expected to be 90% - 162% of the price length of wave A. The expected time for wave C to complete is 19% - 134% of the time taken for wave B to complete and 24% - 115% of the time taken for wave A to complete.
Wave b of the Cycle degree inverted Flat with a rating of 88.6 is expected to complete in the price range 19.95 to 34.72, but more probably between 31.14 and 34.38. This wave is due to complete anytime from now until 19-Oct-2017, but is most likely to complete before 20-May-2016.
After wave b is complete, expect the market to continue up into wave c, which should be a five wave Impulsive pattern. Expect wave c to retrace wave b by 82% - 179%. Wave c can also be expected to be 67% - 179% of the price length of wave a. The expected time for wave c to complete is 20% - 151% of the time taken for wave b to complete and 11% - 58% of the time taken for wave a to complete.
Current Analysis Settings: Analysis Date Range: 04-Sep-2014 to 18-Mar-2016, Label Range: 15 - 50, Preferred Count Labels: 15, Min Rating: 75, Stocks toggle ON, Bias Towards Beginning of Data: 8, Bias Towards Major High/Low: 8, Largest Degree Wave Filter: Any Pattern
Rating:91.2
Current Trading Positions for Liberty Media Corporation (LMCK) Daily on 18-Mar-2016
* An Intermediate degree trader (hold positions from months to quarters), would currently be trading long in this market. The probability of this Target Area being correct is 86.2%. However, the random probability of this Target Area being correct is 65.0%. So the true probability of this Target Area being correct is 32.6% better than random.
* A Primary degree trader (hold positions from months to years), would currently be shorting this market. The probability of this Target Area being correct is 41.3%. However, the random probability of this Target Area being correct is 34.0%. So the true probability of this Target Area being correct is 21.5% better than random.
* A Cycle degree trader (hold positions from quarters to years), would currently be trading long in this market. The probability of this Target Area being correct is 86.1%. However, the random probability of this Target Area being correct is 64.1%. So the true probability of this Target Area being correct is 34.3% better than random.
Extensive Elliott Commentary for Liberty Media Corporation (LMCK) Daily on 18-Mar-2016 with four incomplete patterns:
Wave C of the Minor degree inverted Flat with a rating of 102.9 is expected to complete in the price range 33.64 to 40.87, but more probably between 35.63 and 38.59. This wave is due to complete anytime from now until 17-May-2016, but is most likely to complete before 25-Mar-2016.
This wave C will complete the Flat pattern.
This is the final wave in the pattern. When complete it will also complete wave (X) of the Intermediate degree Double Zigzag with a rating of 97.3. These two waves have the same target ranges.
After wave (X) is complete, expect the market to continue down into wave (Y), which should be a three wave Zigzag pattern. Expect wave (Y) to retrace wave (X) by 117% - 263%. Wave (Y) can also be expected to be 90% - 263% of the price length of wave (W). The expected time for wave (Y) to complete is 21% - 161% of the time taken for wave (X) to complete and 27% - 154% of the time taken for wave (W) to complete.
Wave B of the Primary degree inverted Flat with a rating of 81.1 is expected to complete in the price range 21.64 to 34.96, but more probably between 31.25 and 34.79. This wave was expected to complete before 05-Feb-2016, and must complete by 18-Jan-2017.
After wave B is complete, expect the market to continue up into wave C, which should be a five wave Impulsive pattern. Expect wave C to retrace wave B by 82% - 177%. Wave C can also be expected to be 89% - 177% of the price length of wave A. The expected time for wave C to complete is 15% - 160% of the time taken for wave B to complete and 16% - 118% of the time taken for wave A to complete.
Wave y of the Cycle degree inverted Double 3 with a rating of 91.2 is expected to complete in the price range 32.92 to 68.85, but more probably between 39.13 and 50.48. This wave is due to complete anytime from now until 17-Feb-2017, but is most likely to complete before 05-May-2016.
Wave y will probably complete this Double Sideways pattern, although it could possibly extend into a Triple Sideways pattern.
Current Analysis Settings: Analysis Date Range: 12-Sep-2014 to 18-Mar-2016, Label Range: 15 - 50, Preferred Count Labels: 35, Min Rating: 75, Stocks toggle ON, Bias Towards Beginning of Data: 8, Bias Towards Major High/Low: 8, Largest Degree Wave Filter: Any Pattern
Rating:89.8
Current Trading Positions for Liberty Ventures (LVNTA) Daily on 18-Mar-2016
* An Intermediate degree trader (hold positions from months to quarters), would currently be trading long in this market. The probability of this Target Area being correct is 41.6%. However, the random probability of this Target Area being correct is 24.3%. So the true probability of this Target Area being correct is 71.2% better than random.
* A Primary degree trader (hold positions from months to years), would currently be trading long in this market. The probability of this Target Area being correct is 42.2%. However, the random probability of this Target Area being correct is 34.0%. So the true probability of this Target Area being correct is 24.1% better than random.
* A Cycle degree trader (hold positions from quarters to years), would currently be shorting this market. The probability of this Target Area being correct is 85.9%. However, the random probability of this Target Area being correct is 64.1%. So the true probability of this Target Area being correct is 34.0% better than random.
Extensive Elliott Commentary for Liberty Ventures (LVNTA) Daily on 18-Mar-2016 with three incomplete patterns:
Wave (Y) of the Intermediate degree inverted Double Zigzag with a rating of 98.5 is expected to complete in the price range 38.75 to 47.67, but more probably between 38.82 and 42.31. This wave was expected to complete before 08-Mar-2016, and must complete by 21-Mar-2016.
Wave (Y) will probably complete this Double Sharp pattern, although it could possibly extend into a Triple Sharp pattern.
This is the final wave in the pattern. When complete it will also complete wave B of the Primary degree Flat with a rating of 85. These two waves have the same target ranges.
After wave B is complete, expect the market to continue down into wave C, which should be a five wave Impulsive pattern. Expect wave C to retrace wave B by 89% - 167%. Wave C can also be expected to be 104% - 167% of the price length of wave A. The expected time for wave C to complete is 20% - 146% of the time taken for wave B to complete and 53% - 275% of the time taken for wave A to complete.
Wave y of the Cycle degree Double 3 with a rating of 89.8 is expected to complete at a price no higher than 44.89, but more probably between 25.84 and 36.76. This wave is due to complete anytime from now until 29-Nov-2016, but is most likely to complete before 19-May-2016.
Wave y will probably complete this Double Sideways pattern, although it could possibly extend into a Triple Sideways pattern.
Current Analysis Settings: Analysis Date Range: 04-Sep-2014 to 18-Mar-2016, Label Range: 15 - 50, Preferred Count Labels: 22, Min Rating: 75, Stocks toggle ON, Bias Towards Beginning of Data: 8, Bias Towards Major High/Low: 8, Largest Degree Wave Filter: Any Pattern
Rating:104.8
Current Trading Positions for Linear Technology Corp (LLTC) Daily on 18-Mar-2016
* A Cycle degree trader (hold positions from quarters to years), would currently be trading long in this market. The probability of this Target Area being correct is 50.4%. However, the random probability of this Target Area being correct is 34.0%. So the true probability of this Target Area being correct is 48.2% better than random.
Extensive Elliott Commentary for Linear Technology Corp (LLTC) Daily on 18-Mar-2016 with one incomplete pattern:
Wave b of the Cycle degree Flat with a rating of 104.8 is expected to complete in the price range 47.14 to 75.01, but more probably between 47.43 and 54.8. This wave could complete anytime between now and 28-Oct-2026, but is most likely to complete sometime between 24-Mar-2016 and 21-Jul-2017.
After wave b is complete, expect the market to continue down into wave c, which should be a five wave Impulsive pattern. Expect wave c to retrace wave b by 85% - 162%. Wave c can also be expected to be 90% - 162% of the price length of wave a. The expected time for wave c to complete is 20% - 136% of the time taken for wave b to complete and 20% - 110% of the time taken for wave a to complete.
Current Analysis Settings: Analysis Date Range: 24-Feb-2014 to 18-Mar-2016, Label Range: 15 - 50, Preferred Count Labels: 21, Min Rating: 75, Stocks toggle ON, Bias Towards Beginning of Data: 8, Bias Towards Major High/Low: 8, Largest Degree Wave Filter: Any Pattern
Rating:86.3
Current Trading Positions for Mattel Inc (MAT) Daily on 18-Mar-2016
* An Intermediate degree trader (hold positions from months to quarters), would currently be trading long in this market. The probability of this Target Area being correct is 63.2%. However, the random probability of this Target Area being correct is 45.0%. So the true probability of this Target Area being correct is 40.4% better than random.
* A Primary degree trader (hold positions from months to years), would currently be trading long in this market. The probability of this Target Area being correct is 38.0%. However, the random probability of this Target Area being correct is 24.3%. So the true probability of this Target Area being correct is 56.4% better than random.
Extensive Elliott Commentary for Mattel Inc (MAT) Daily on 18-Mar-2016 with two incomplete patterns:
Wave (C) of the Intermediate degree inverted Zigzag with a rating of 99.3 is expected to complete in the price range 33.79 to 54.84, but more probably between 34.94 and 45.38. This wave was expected to complete before 11-Mar-2016, and must complete by 21-Apr-2016.
This wave (C) will complete the ZigZag pattern.
This is the final wave in the pattern. When complete it will also complete wave Y of the Primary degree inverted Double Zigzag with a rating of 86.3. These two waves have the same target ranges.
Wave Y will probably complete this Double Sharp pattern, although it could possibly extend into a Triple Sharp pattern.
Current Analysis Settings: Analysis Date Range: 13-Jan-2014 to 18-Mar-2016, Label Range: 15 - 50, Preferred Count Labels: 17, Min Rating: 75, Stocks toggle ON, Bias Towards Beginning of Data: 8, Bias Towards Major High/Low: 8, Largest Degree Wave Filter: Any Pattern
Rating:78.4
Current Trading Positions for Micron Technology Inc (MU) Daily on 18-Mar-2016
* A Primary degree trader (hold positions from months to years), would currently be shorting this market. The probability of this Target Area being correct is 58.7%. However, the random probability of this Target Area being correct is 53.0%. So the true probability of this Target Area being correct is 10.8% better than random.
* A Cycle degree trader (hold positions from quarters to years), would currently be trading long in this market. The probability of this Target Area being correct is 85.6%. However, the random probability of this Target Area being correct is 80.4%. So the true probability of this Target Area being correct is 6.5% better than random.
Extensive Elliott Commentary for Micron Technology Inc (MU) Daily on 18-Mar-2016 with three incomplete patterns:
Wave (C) of the Intermediate degree Flat with a rating of 99 is expected to complete in the price range 6.51 to 11.59, but more probably between 8.73 and 10.41. This wave was expected to complete before 18-Mar-2016, and must complete by 15-Apr-2016.
This wave (C) will complete the Flat pattern.
This is the final wave in the pattern. When complete it will also complete wave X of the Primary degree inverted Double 3 with a rating of 93. These two waves have the same target ranges.
After wave X is complete, expect the market to continue up into wave Y, which will probably be a three wave corrective pattern. Expect wave Y to retrace wave X by 98% - 212%. Wave Y can also be expected to be 73% - 212% of the price length of wave W. The expected time for wave Y to complete is 27% - 214% of the time taken for wave X to complete and 38% - 222% of the time taken for wave W to complete.
Wave IV of the Cycle degree inverted Ending Diagonal with a rating of 78.4 is expected to complete in the price range 13.5 to 18.3, but more probably between 13.59 and 16.45. This wave was expected to complete before 14-Mar-2016, and must complete by 21-Sep-2016.
Expect this wave IV to complete in the price range of wave 2, and then continue down to the end of wave V, which should be a ZigZag family three wave pattern. Expect wave V to have between 52% and 91% of the price range of wave III and complete in 18% to 62% of the time taken by wave III. Expect also that wave V will have between 31% and 72% of the price range of wave I and complete in 3% to 22% of the time taken by wave I. The slope (ie. price range divided by time taken) of wave V should be between 49% and 173% of the slope of wave III and between 77% to 312% of the slope of wave I. Wave V will complete this Ending Diagonal pattern.
Current Analysis Settings: Analysis Date Range: 27-Oct-2014 to 18-Mar-2016, Label Range: 15 - 50, Preferred Count Labels: 27, Min Rating: 75, Stocks toggle ON, Bias Towards Beginning of Data: 8, Bias Towards Major High/Low: 8, Largest Degree Wave Filter: Any Pattern
Rating:103.7
Current Trading Positions for Microsoft Corp (MSFT) Daily on 18-Mar-2016
* A Primary degree trader (hold positions from months to years), would currently be trading long in this market. The probability of this Target Area being correct is 66.3%. However, the random probability of this Target Area being correct is 45.0%. So the true probability of this Target Area being correct is 47.3% better than random.
* A Cycle degree trader (hold positions from quarters to years), would currently be trading long in this market. The probability of this Target Area being correct is 42.6%. However, the random probability of this Target Area being correct is 24.3%. So the true probability of this Target Area being correct is 75.3% better than random.
Extensive Elliott Commentary for Microsoft Corp (MSFT) Daily on 18-Mar-2016 with two incomplete patterns:
Wave C of the Primary degree inverted Zigzag with a rating of 109.9 is expected to complete in the price range 55.98 to 91.49, but more probably between 56.71 and 73.17. This wave is due to complete anytime from now until 09-Nov-2016, but is most likely to complete before 13-May-2016.
This wave C will complete the ZigZag pattern.
This is the final wave in the pattern. When complete it will also complete wave y of the Cycle degree inverted Double Zigzag with a rating of 103.7. These two waves have the same target ranges.
Wave y will probably complete this Double Sharp pattern, although it could possibly extend into a Triple Sharp pattern.
Current Analysis Settings: Analysis Date Range: 13-Jan-2014 to 18-Mar-2016, Label Range: 15 - 50, Preferred Count Labels: 15, Min Rating: 75, Stocks toggle ON, Bias Towards Beginning of Data: 8, Bias Towards Major High/Low: 8, Largest Degree Wave Filter: Any Pattern
Rating:103.4
Current Trading Positions for Monster Beverage Corporation (MNST) Daily on 18-Mar-2016
* A Primary degree trader (hold positions from months to years), would currently be trading long in this market. The probability of this Target Area being correct is 67.7%. However, the random probability of this Target Area being correct is 53.0%. So the true probability of this Target Area being correct is 27.7% better than random.
Extensive Elliott Commentary for Monster Beverage Corporation (MNST) Daily on 18-Mar-2016 with one incomplete pattern:
Wave X of the Primary degree Double 3 with a rating of 103.4 is expected to complete in the price range 144.85 to 375.31, but more probably between 146.27 and 168.56. This wave is due to complete anytime from now until 20-Oct-2016, but is most likely to complete before 01-Apr-2016.
After wave X is complete, expect the market to continue down into wave Y, which will probably be a three wave corrective pattern. Expect wave Y to retrace wave X by 98% - 193%. Wave Y can also be expected to be 76% - 193% of the price length of wave W. The expected time for wave Y to complete is 20% - 178% of the time taken for wave X to complete and 12% - 115% of the time taken for wave W to complete.
Current Analysis Settings: Analysis Date Range: 28-Mar-2014 to 18-Mar-2016, Label Range: 15 - 50, Preferred Count Labels: 16, Min Rating: 75, Stocks toggle ON, Bias Towards Beginning of Data: 8, Bias Towards Major High/Low: 8, Largest Degree Wave Filter: Any Pattern
Rating:531.8
Current Trading Positions for Mylan NV (MYL) Daily on 18-Mar-2016
* A Primary degree trader (hold positions from months to years), would currently be shorting this market. The probability of this Target Area being correct is 78.1%. However, the random probability of this Target Area being correct is 64.0%. So the true probability of this Target Area being correct is 22.0% better than random.
Extensive Elliott Commentary for Mylan NV (MYL) Daily on 18-Mar-2016 with one incomplete pattern:
Wave D of the Primary degree inverted Contracting Triangle with a rating of 531.8 is expected to complete in the price range 40.04 to 44.53, but more probably between 40.12 and 42.3. This wave is due to complete anytime from now until 17-May-2016, but is most likely to complete before 29-Mar-2016.
Once this wave D is complete, expect the market to continue up to the end of wave E, which will most probably be a ZigZag family pattern or possibly a Contracting Triangle. Expect wave E to have between 39% and 66% of the price range of wave C and complete in 4% to 60% of the time taken by wave C. Expect also that wave E will have between 21% and 47% of the price range of wave A and complete in 2% to 24% of the time taken by wave A. The slope (ie. price range divided by time taken) of wave E should be between 28% and 143% of the slope of wave C and between 19% to 183% of the slope of wave A. Wave E will complete this Contracting Triangle.
Current Analysis Settings: Analysis Date Range: 13-Mar-2015 to 18-Mar-2016, Label Range: 15 - 50, Preferred Count Labels: 21, Min Rating: 75, Stocks toggle ON, Bias Towards Beginning of Data: 8, Bias Towards Major High/Low: 8, Largest Degree Wave Filter: Any Pattern
Rating:102.8
Current Trading Positions for Netapp Inc (NTAP) Daily on 18-Mar-2016
* A Cycle degree trader (hold positions from quarters to years), would currently be trading long in this market. The probability of this Target Area being correct is 50.2%. However, the random probability of this Target Area being correct is 34.0%. So the true probability of this Target Area being correct is 47.6% better than random.
Extensive Elliott Commentary for Netapp Inc (NTAP) Daily on 18-Mar-2016 with one incomplete pattern:
Wave b of the Cycle degree Flat with a rating of 102.8 is expected to complete in the price range 37.86 to 86.69, but more probably between 38.37 and 51.27. This wave could complete anytime between now and 27-Jan-2028, but is most likely to complete sometime between 01-Apr-2016 and 25-Sep-2017.
After wave b is complete, expect the market to continue down into wave c, which should be a five wave Impulsive pattern. Expect wave c to retrace wave b by 85% - 162%. Wave c can also be expected to be 90% - 162% of the price length of wave a. The expected time for wave c to complete is 20% - 136% of the time taken for wave b to complete and 20% - 110% of the time taken for wave a to complete.
Current Analysis Settings: Analysis Date Range: 13-Jan-2014 to 18-Mar-2016, Label Range: 15 - 50, Preferred Count Labels: 15, Min Rating: 75, Stocks toggle ON, Bias Towards Beginning of Data: 8, Bias Towards Major High/Low: 8, Largest Degree Wave Filter: Any Pattern
Rating:98.4
Current Trading Positions for Netflix Inc (NFLX) Daily on 18-Mar-2016
* A Cycle degree trader (hold positions from quarters to years), would currently be trading long in this market. The probability of this Target Area being correct is 41.6%. However, the random probability of this Target Area being correct is 24.3%. So the true probability of this Target Area being correct is 71.2% better than random.
Extensive Elliott Commentary for Netflix Inc (NFLX) Daily on 18-Mar-2016 with one incomplete pattern:
Wave y of the Cycle degree inverted Double Zigzag with a rating of 98.4 is expected to complete in the price range 155.2 to 326.65, but more probably between 159.82 and 229.61. This wave is most likely to complete sometime between 19-Apr-2016 and 03-Nov-2016 Note that it cannot complete until 11-Apr-2016 but must complete by 14-Nov-2017.
Wave y will probably complete this Double Sharp pattern, although it could possibly extend into a Triple Sharp pattern.
Current Analysis Settings: Analysis Date Range: 17-Mar-2014 to 18-Mar-2016, Label Range: 15 - 50, Preferred Count Labels: 15, Min Rating: 75, Stocks toggle ON, Bias Towards Beginning of Data: 8, Bias Towards Major High/Low: 8, Largest Degree Wave Filter: Any Pattern
Rating:95.1
Current Trading Positions for NVIDIA Corporation (NVDA) Daily on 18-Mar-2016
* A Primary degree trader (hold positions from months to years), would currently be trading long in this market. The probability of this Target Area being correct is 50.6%. However, the random probability of this Target Area being correct is 34.0%. So the true probability of this Target Area being correct is 48.8% better than random.
* A Cycle degree trader (hold positions from quarters to years), would currently be shorting this market. The probability of this Target Area being correct is 47.0%. However, the random probability of this Target Area being correct is 34.0%. So the true probability of this Target Area being correct is 38.2% better than random.
Extensive Elliott Commentary for NVIDIA Corporation (NVDA) Daily on 18-Mar-2016 with two incomplete patterns:
Wave B of the Primary degree Flat with a rating of 106.8 is expected to complete in the price range 30.99 to 63.53, but more probably between 31.18 and 37.34. This wave is due to complete anytime from now until 12-Dec-2016, but is most likely to complete before 13-May-2016.
After wave B is complete, expect the market to continue down into wave C, which should be a five wave Impulsive pattern. Expect wave C to retrace wave B by 89% - 167%. Wave C can also be expected to be 104% - 167% of the price length of wave A. The expected time for wave C to complete is 20% - 146% of the time taken for wave B to complete and 53% - 275% of the time taken for wave A to complete.
Wave b of the Cycle degree inverted Flat with a rating of 95.1 is expected to complete at a price no higher than 22.43, but more probably between 16.94 and 21.92. This wave is due to complete anytime from now until 12-Feb-2018, but is most likely to complete before 11-Jul-2016.
After wave b is complete, expect the market to continue up into wave c, which should be a five wave Impulsive pattern. Expect wave c to retrace wave b by 82% - 179%. Wave c can also be expected to be 67% - 179% of the price length of wave a. The expected time for wave c to complete is 20% - 151% of the time taken for wave b to complete and 11% - 58% of the time taken for wave a to complete.
Current Analysis Settings: Analysis Date Range: 13-Jan-2014 to 18-Mar-2016, Label Range: 15 - 50, Preferred Count Labels: 20, Min Rating: 75, Stocks toggle ON, Bias Towards Beginning of Data: 8, Bias Towards Major High/Low: 8, Largest Degree Wave Filter: Any Pattern
Rating:89
Current Trading Positions for NXP Semiconductors NV (NXPI) Daily on 18-Mar-2016
* A Primary degree trader (hold positions from months to years), would currently be trading long in this market. The probability of this Target Area being correct is 52.4%. However, the random probability of this Target Area being correct is 45.0%. So the true probability of this Target Area being correct is 16.4% better than random.
* A Cycle degree trader (hold positions from quarters to years), would currently be shorting this market. The probability of this Target Area being correct is 39.0%. However, the random probability of this Target Area being correct is 24.3%. So the true probability of this Target Area being correct is 60.5% better than random.
Extensive Elliott Commentary for NXP Semiconductors NV (NXPI) Daily on 18-Mar-2016 with three incomplete patterns:
Wave (C) of the Intermediate degree inverted Flat with a rating of 92.6 is expected to complete in the price range 66.93 to 91.94, but more probably between 72.69 and 84.12. This wave was expected to complete before 08-Mar-2016, and must complete by 15-Apr-2016.
This wave (C) will complete the Flat pattern.
This is the final wave in the pattern. When complete it will also complete wave B of the Primary degree Zigzag with a rating of 87.2. These two waves have the same target ranges.
After wave B is complete, expect the market to continue down into wave C, which should be a five wave impulsive pattern. Expect wave C to retrace wave B by 127% - 277%. Wave C can also be expected to be 43% - 277% of the price length of wave A. The expected time for wave C to complete is 19% - 191% of the time taken for wave B to complete and 55% - 222% of the time taken for wave A to complete.
Wave y of the Cycle degree Double Zigzag with a rating of 89 is expected to complete at a price no higher than 57.71, but more probably between 37.38 and 57.08. This wave is due to complete anytime from now until 21-Oct-2016, but is most likely to complete before 15-Apr-2016.
Wave y will probably complete this Double Sharp pattern, although it could possibly extend into a Triple Sharp pattern.
Current Analysis Settings: Analysis Date Range: 13-Jan-2014 to 18-Mar-2016, Label Range: 15 - 50, Preferred Count Labels: 26, Min Rating: 75, Stocks toggle ON, Bias Towards Beginning of Data: 8, Bias Towards Major High/Low: 8, Largest Degree Wave Filter: Any Pattern
Rating:93.9
Current Trading Positions for O'reilly Automotive Inc (ORLY) Daily on 18-Mar-2016
* An Intermediate degree trader (hold positions from months to quarters), would currently be trading long in this market. The probability of this Target Area being correct is 48.2%. However, the random probability of this Target Area being correct is 34.0%. So the true probability of this Target Area being correct is 41.8% better than random.
* A Primary degree trader (hold positions from months to years), would currently be shorting this market. The probability of this Target Area being correct is 86.3%. However, the random probability of this Target Area being correct is 64.1%. So the true probability of this Target Area being correct is 34.6% better than random.
Extensive Elliott Commentary for O'reilly Automotive Inc (ORLY) Daily on 18-Mar-2016 with two incomplete patterns:
Wave (B) of the Intermediate degree Flat with a rating of 97.7 is expected to complete in the price range 253.51 to 400.48, but more probably between 254.31 and 281.32. This wave was expected to complete before 23-Feb-2016, and must complete by 29-Mar-2016.
After wave (B) is complete, expect the market to continue down into wave (C), which should be a five wave Impulsive pattern. Expect wave (C) to retrace wave (B) by 89% - 167%. Wave (C) can also be expected to be 105% - 167% of the price length of wave (A). The expected time for wave (C) to complete is 20% - 148% of the time taken for wave (B) to complete and 60% - 290% of the time taken for wave (A) to complete.
Wave Y of the Primary degree Double 3 with a rating of 93.9 is expected to complete in the price range 76.3 to 263.58, but more probably between 173.45 and 226. This wave is due to complete anytime from now until 08-Apr-2016, but is most likely to complete before 22-Mar-2016.
Wave Y will probably complete this Double Sideways pattern, although it could possibly extend into a Triple Sideways pattern.
Current Analysis Settings: Analysis Date Range: 13-Jan-2014 to 18-Mar-2016, Label Range: 15 - 50, Preferred Count Labels: 24, Min Rating: 75, Stocks toggle ON, Bias Towards Beginning of Data: 8, Bias Towards Major High/Low: 8, Largest Degree Wave Filter: Any Pattern
Rating:96.8
Current Trading Positions for Paccar Inc (PCAR) Daily on 18-Mar-2016
* A Cycle degree trader (hold positions from quarters to years), would currently be trading long in this market. The probability of this Target Area being correct is 85.6%. However, the random probability of this Target Area being correct is 65.0%. So the true probability of this Target Area being correct is 31.7% better than random.
Extensive Elliott Commentary for Paccar Inc (PCAR) Daily on 18-Mar-2016 with one incomplete pattern:
Wave x of the Cycle degree Double Zigzag with a rating of 96.8 is expected to complete in the price range 48.44 to 71.15, but more probably between 54.81 and 66.71. This wave could complete anytime between now and 15-Nov-2019, but is most likely to complete sometime between 05-Apr-2016 and 20-Feb-2017.
After wave x is complete, expect the market to continue down into wave y, which should be a three wave Zigzag pattern. Expect wave y to retrace wave x by 116% - 261%. Wave y can also be expected to be 90% - 261% of the price length of wave w. The expected time for wave y to complete is 21% - 160% of the time taken for wave x to complete and 25% - 152% of the time taken for wave w to complete.
Current Analysis Settings: Analysis Date Range: 23-Oct-2014 to 18-Mar-2016, Label Range: 15 - 50, Preferred Count Labels: 16, Min Rating: 75, Stocks toggle ON, Bias Towards Beginning of Data: 8, Bias Towards Major High/Low: 8, Largest Degree Wave Filter: Any Pattern
Rating:99.5
Current Trading Positions for Paychex Inc (PAYX) Daily on 18-Mar-2016
* A Cycle degree trader (hold positions from quarters to years), would currently be trading long in this market. The probability of this Target Area being correct is 41.8%. However, the random probability of this Target Area being correct is 24.3%. So the true probability of this Target Area being correct is 72.0% better than random.
Extensive Elliott Commentary for Paychex Inc (PAYX) Daily on 18-Mar-2016 with one incomplete pattern:
Wave y of the Cycle degree inverted Double Zigzag with a rating of 99.5 is expected to complete in the price range 56.13 to 75.56, but more probably between 56.31 and 64.83. This wave could complete anytime between now and 27-Sep-2018, but is most likely to complete sometime between 08-Apr-2016 and 21-Dec-2016.
Wave y will probably complete this Double Sharp pattern, although it could possibly extend into a Triple Sharp pattern.
Current Analysis Settings: Analysis Date Range: 03-Mar-2014 to 18-Mar-2016, Label Range: 15 - 50, Preferred Count Labels: 16, Min Rating: 75, Stocks toggle ON, Bias Towards Beginning of Data: 8, Bias Towards Major High/Low: 8, Largest Degree Wave Filter: Any Pattern
Rating:85.4
Current Trading Positions for Priceline Group Inc (PCLN) Daily on 18-Mar-2016
* An Intermediate degree trader (hold positions from months to quarters), would currently be trading long in this market. The probability of this Target Area being correct is 59.1%. However, the random probability of this Target Area being correct is 45.0%. So the true probability of this Target Area being correct is 31.3% better than random.
* A Primary degree trader (hold positions from months to years), would currently be trading long in this market. The probability of this Target Area being correct is 42.5%. However, the random probability of this Target Area being correct is 34.0%. So the true probability of this Target Area being correct is 25.0% better than random.
Extensive Elliott Commentary for Priceline Group Inc (PCLN) Daily on 18-Mar-2016 with two incomplete patterns:
Wave (C) of the Intermediate degree inverted Zigzag with a rating of 96.3 is expected to complete in the price range 1300.316 to 1566.36, but more probably between 1351.302 and 1508.283. This wave was expected to complete before 09-Mar-2016, and must complete by 21-Mar-2016.
This wave (C) will complete the ZigZag pattern.
This is the final wave in the pattern. When complete it will also complete wave B of the Primary degree Flat with a rating of 85.4. These two waves have the same target ranges.
After wave B is complete, expect the market to continue down into wave C, which should be a five wave Impulsive pattern. Expect wave C to retrace wave B by 86% - 162%. Wave C can also be expected to be 90% - 162% of the price length of wave A. The expected time for wave C to complete is 19% - 134% of the time taken for wave B to complete and 24% - 115% of the time taken for wave A to complete.
Current Analysis Settings: Analysis Date Range: 25-Sep-2015 to 18-Mar-2016, Label Range: 15 - 50, Preferred Count Labels: 15, Min Rating: 75, Stocks toggle ON, Bias Towards Beginning of Data: 8, Bias Towards Major High/Low: 8, Largest Degree Wave Filter: Any Pattern
Rating:100.9
Current Trading Positions for Qualcomm Inc (QCOM) Daily on 18-Mar-2016
* A Cycle degree trader (hold positions from quarters to years), would currently be trading long in this market. The probability of this Target Area being correct is 50.0%. However, the random probability of this Target Area being correct is 34.0%. So the true probability of this Target Area being correct is 47.1% better than random.
Extensive Elliott Commentary for Qualcomm Inc (QCOM) Daily on 18-Mar-2016 with one incomplete pattern:
Wave b of the Cycle degree Flat with a rating of 100.9 is expected to complete in the price range 65 to 129.62, but more probably between 65.67 and 82.75. This wave could complete anytime between now and 28-Nov-2022, but is most likely to complete sometime between 24-Mar-2016 and 23-Jan-2017.
After wave b is complete, expect the market to continue down into wave c, which should be a five wave Impulsive pattern. Expect wave c to retrace wave b by 85% - 162%. Wave c can also be expected to be 90% - 162% of the price length of wave a. The expected time for wave c to complete is 20% - 136% of the time taken for wave b to complete and 20% - 110% of the time taken for wave a to complete.
Current Analysis Settings: Analysis Date Range: 11-Jun-2014 to 18-Mar-2016, Label Range: 15 - 50, Preferred Count Labels: 20, Min Rating: 75, Stocks toggle ON, Bias Towards Beginning of Data: 8, Bias Towards Major High/Low: 8, Largest Degree Wave Filter: Any Pattern
Rating:97.4
Current Trading Positions for Regeneron Pharm Inc (REGN) Daily on 18-Mar-2016
* A Primary degree trader (hold positions from months to years), would currently be shorting this market. The probability of this Target Area being correct is 65.3%. However, the random probability of this Target Area being correct is 45.0%. So the true probability of this Target Area being correct is 45.1% better than random.
* A Cycle degree trader (hold positions from quarters to years), would currently be shorting this market. The probability of this Target Area being correct is 48.2%. However, the random probability of this Target Area being correct is 34.0%. So the true probability of this Target Area being correct is 41.8% better than random.
Extensive Elliott Commentary for Regeneron Pharm Inc (REGN) Daily on 18-Mar-2016 with two incomplete patterns:
Wave C of the Primary degree Zigzag with a rating of 104.1 is expected to complete in the price range 76.67 to 361.94, but more probably between 231.2 and 346.02. This wave is due to complete anytime from now until 25-Jul-2016, but is most likely to complete before 19-Apr-2016.
This wave C will complete the ZigZag pattern.
This is the final wave in the pattern. When complete it will also complete wave b of the Cycle degree inverted Flat with a rating of 97.4. These two waves have the same target ranges.
After wave b is complete, expect the market to continue up into wave c, which should be a five wave Impulsive pattern. Expect wave c to retrace wave b by 82% - 179%. Wave c can also be expected to be 67% - 179% of the price length of wave a. The expected time for wave c to complete is 20% - 151% of the time taken for wave b to complete and 11% - 58% of the time taken for wave a to complete.
Current Analysis Settings: Analysis Date Range: 13-Jan-2014 to 18-Mar-2016, Label Range: 15 - 50, Preferred Count Labels: 15, Min Rating: 75, Stocks toggle ON, Bias Towards Beginning of Data: 8, Bias Towards Major High/Low: 8, Largest Degree Wave Filter: Any Pattern
Rating:95.9
Current Trading Positions for Ross Stores Inc (ROST) Daily on 18-Mar-2016
* An Intermediate degree trader (hold positions from months to quarters), would currently be trading long in this market. The probability of this Target Area being correct is 64.9%. However, the random probability of this Target Area being correct is 45.0%. So the true probability of this Target Area being correct is 44.2% better than random.
* A Primary degree trader (hold positions from months to years), would currently be trading long in this market. The probability of this Target Area being correct is 41.0%. However, the random probability of this Target Area being correct is 24.3%. So the true probability of this Target Area being correct is 68.7% better than random.
Extensive Elliott Commentary for Ross Stores Inc (ROST) Daily on 18-Mar-2016 with two incomplete patterns:
Wave (C) of the Intermediate degree inverted Zigzag with a rating of 102.7 is expected to complete in the price range 59.07 to 72.56, but more probably between 59.95 and 66.9. This wave is due to complete anytime from now until 11-Apr-2016, but is most likely to complete before 30-Mar-2016.
This wave (C) will complete the ZigZag pattern.
This is the final wave in the pattern. When complete it will also complete wave Y of the Primary degree inverted Double Zigzag with a rating of 95.9. These two waves have the same target ranges.
Wave Y will probably complete this Double Sharp pattern, although it could possibly extend into a Triple Sharp pattern.
Current Analysis Settings: Analysis Date Range: 05-Jun-2014 to 18-Mar-2016, Label Range: 15 - 50, Preferred Count Labels: 36, Min Rating: 75, Stocks toggle ON, Bias Towards Beginning of Data: 8, Bias Towards Major High/Low: 8, Largest Degree Wave Filter: Any Pattern
Rating:78.1
Current Trading Positions for Sandisk Corp (SNDK) Daily on 18-Mar-2016
* An Intermediate degree trader (hold positions from months to quarters), would currently be trading long in this market. The probability of this Target Area being correct is 60.5%. However, the random probability of this Target Area being correct is 45.0%. So the true probability of this Target Area being correct is 34.4% better than random.
* A Primary degree trader (hold positions from months to years), would currently be trading long in this market. The probability of this Target Area being correct is 56.9%. However, the random probability of this Target Area being correct is 53.0%. So the true probability of this Target Area being correct is 7.4% better than random.
* A Cycle degree trader (hold positions from quarters to years), would currently be shorting this market. The probability of this Target Area being correct is 40.4%. However, the random probability of this Target Area being correct is 34.0%. So the true probability of this Target Area being correct is 18.8% better than random.
Extensive Elliott Commentary for Sandisk Corp (SNDK) Daily on 18-Mar-2016 with three incomplete patterns:
Wave (C) of the Intermediate degree inverted Zigzag with a rating of 97.9 is expected to complete in the price range 71.31 to 98.73, but more probably between 72.41 and 85.65. This wave is due to complete anytime from now until 18-Apr-2016, but is most likely to complete before 28-Mar-2016.
This wave (C) will complete the ZigZag pattern.
This is the final wave in the pattern. When complete it will also complete wave X of the Primary degree Double 3 with a rating of 91.6. These two waves have the same target ranges.
After wave X is complete, expect the market to continue down into wave Y, which will probably be a three wave corrective pattern. Expect wave Y to retrace wave X by 98% - 193%. Wave Y can also be expected to be 76% - 193% of the price length of wave W. The expected time for wave Y to complete is 20% - 178% of the time taken for wave X to complete and 12% - 115% of the time taken for wave W to complete.
Wave b of the Cycle degree inverted Flat with a rating of 78.1 is expected to complete in the price range 1.09 to 55.68, but more probably between 40.47 and 54.99. This wave was expected to complete before 24-Dec-2015, and must complete by 30-Sep-2016.
After wave b is complete, expect the market to continue up into wave c, which should be a five wave Impulsive pattern. Expect wave c to retrace wave b by 82% - 177%. Wave c can also be expected to be 89% - 177% of the price length of wave a. The expected time for wave c to complete is 15% - 160% of the time taken for wave b to complete and 16% - 118% of the time taken for wave a to complete.
Current Analysis Settings: Analysis Date Range: 04-Jun-2014 to 18-Mar-2016, Label Range: 15 - 50, Preferred Count Labels: 22, Min Rating: 75, Stocks toggle ON, Bias Towards Beginning of Data: 8, Bias Towards Major High/Low: 8, Largest Degree Wave Filter: Any Pattern
Rating:104.8
Current Trading Positions for Sba Communications Corp (SBAC) Daily on 18-Mar-2016
* A Primary degree trader (hold positions from months to years), would currently be trading long in this market. The probability of this Target Area being correct is 42.8%. However, the random probability of this Target Area being correct is 24.3%. So the true probability of this Target Area being correct is 76.1% better than random.
Extensive Elliott Commentary for Sba Communications Corp (SBAC) Daily on 18-Mar-2016 with one incomplete pattern:
Wave Y of the Primary degree inverted Double Zigzag with a rating of 104.8 is expected to complete in the price range 103.84 to 123.14, but more probably between 104.06 and 112.18. This wave is due to complete anytime from now until 25-Apr-2016, but is most likely to complete before 28-Mar-2016.
Wave Y will probably complete this Double Sharp pattern, although it could possibly extend into a Triple Sharp pattern.
Current Analysis Settings: Analysis Date Range: 08-Jul-2015 to 18-Mar-2016, Label Range: 15 - 50, Preferred Count Labels: 18, Min Rating: 75, Stocks toggle ON, Bias Towards Beginning of Data: 8, Bias Towards Major High/Low: 8, Largest Degree Wave Filter: Any Pattern
Rating:79.3
Current Trading Positions for Seagate Tech Hldgs (STX) Daily on 18-Mar-2016
* A Primary degree trader (hold positions from months to years), would currently be trading long in this market. The probability of this Target Area being correct is 41.8%. However, the random probability of this Target Area being correct is 24.3%. So the true probability of this Target Area being correct is 72.0% better than random.
* A Cycle degree trader (hold positions from quarters to years), would currently be trading long in this market. The probability of this Target Area being correct is 40.7%. However, the random probability of this Target Area being correct is 34.0%. So the true probability of this Target Area being correct is 19.7% better than random.
Extensive Elliott Commentary for Seagate Tech Hldgs (STX) Daily on 18-Mar-2016 with two incomplete patterns:
Wave Y of the Primary degree inverted Double Zigzag with a rating of 99.1 is expected to complete in the price range 32.13 to 54.06, but more probably between 34.98 and 42.
Wave Y will probably complete this Double Sharp pattern, although it could possibly extend into a Triple Sharp pattern.
This is the final wave in the pattern. When complete it will also complete wave b of the Cycle degree Flat with a rating of 79.3. These two waves have the same target ranges.
After wave b is complete, expect the market to continue down into wave c, which should be a five wave Impulsive pattern. Expect wave c to retrace wave b by 86% - 162%. Wave c can also be expected to be 90% - 162% of the price length of wave a. The expected time for wave c to complete is 19% - 134% of the time taken for wave b to complete and 24% - 115% of the time taken for wave a to complete.
Current Analysis Settings: Analysis Date Range: 11-Nov-2014 to 18-Mar-2016, Label Range: 15 - 50, Preferred Count Labels: 16, Min Rating: 75, Stocks toggle ON, Bias Towards Beginning of Data: 8, Bias Towards Major High/Low: 8, Largest Degree Wave Filter: Any Pattern
Rating:100.1
Current Trading Positions for Sirius XM Holdings Inc (SIRI) Daily on 18-Mar-2016
* A Primary degree trader (hold positions from months to years), would currently be trading long in this market. The probability of this Target Area being correct is 64.5%. However, the random probability of this Target Area being correct is 45.0%. So the true probability of this Target Area being correct is 43.3% better than random.
Extensive Elliott Commentary for Sirius XM Holdings Inc (SIRI) Daily on 18-Mar-2016 with one incomplete pattern:
Wave C of the Primary degree inverted Zigzag with a rating of 100.1 is expected to complete in the price range 3.7 to 4.44, but more probably between 3.75 and 4.15. This wave was expected to complete before 10-Mar-2016, and must complete by 21-Mar-2016.
This wave C will complete the ZigZag pattern.
Current Analysis Settings: Analysis Date Range: 17-Mar-2014 to 18-Mar-2016, Label Range: 15 - 50, Preferred Count Labels: 47, Min Rating: 75, Stocks toggle ON, Bias Towards Beginning of Data: 8, Bias Towards Major High/Low: 8, Largest Degree Wave Filter: Any Pattern
Rating:82.4
Current Trading Positions for Skyworks Solutions Inc (SWKS) Daily on 18-Mar-2016
* A Primary degree trader (hold positions from months to years), would currently be trading long in this market. The probability of this Target Area being correct is 51.8%. However, the random probability of this Target Area being correct is 45.0%. So the true probability of this Target Area being correct is 15.1% better than random.
* A Cycle degree trader (hold positions from quarters to years), would currently be shorting this market. The probability of this Target Area being correct is 36.0%. However, the random probability of this Target Area being correct is 24.3%. So the true probability of this Target Area being correct is 48.1% better than random.
Extensive Elliott Commentary for Skyworks Solutions Inc (SWKS) Daily on 18-Mar-2016 with three incomplete patterns:
Wave (C) of the Intermediate degree inverted Flat with a rating of 98.4 is expected to complete in the price range 58.5 to 90.52, but more probably between 66.74 and 79.28. This wave was expected to complete before 09-Mar-2016, and must complete by 06-May-2016.
This wave (C) will complete the Flat pattern.
This is the final wave in the pattern. When complete it will also complete wave B of the Primary degree Zigzag with a rating of 84.8. These two waves have the same target ranges.
After wave B is complete, expect the market to continue down into wave C, which should be a five wave impulsive pattern. Expect wave C to retrace wave B by 96% - 215%. Wave C can also be expected to be 33% - 215% of the price length of wave A. The expected time for wave C to complete is 22% - 199% of the time taken for wave B to complete and 24% - 111% of the time taken for wave A to complete.
Wave y of the Cycle degree Double Zigzag with a rating of 82.4 is expected to complete in the price range .27 to 51.91, but more probably between 37.44 and 51.27. This wave is due to complete anytime from now until 16-Aug-2016, but is most likely to complete before 08-Apr-2016.
Wave y will probably complete this Double Sharp pattern, although it could possibly extend into a Triple Sharp pattern.
Current Analysis Settings: Analysis Date Range: 13-Jan-2014 to 18-Mar-2016, Label Range: 15 - 50, Preferred Count Labels: 18, Min Rating: 75, Stocks toggle ON, Bias Towards Beginning of Data: 8, Bias Towards Major High/Low: 8, Largest Degree Wave Filter: Any Pattern
Rating:87.1
Current Trading Positions for Starbucks Corporation (SBUX) Daily on 18-Mar-2016
* A Minute degree trader (hold positions from weeks to months), would currently be trading long in this market. The probability of this Target Area being correct is 42.6%. However, the random probability of this Target Area being correct is 24.3%. So the true probability of this Target Area being correct is 75.3% better than random.
* A Minor degree trader (hold positions from weeks to quarters), would currently be trading long in this market. The probability of this Target Area being correct is 42.2%. However, the random probability of this Target Area being correct is 34.0%. So the true probability of this Target Area being correct is 24.1% better than random.
* An Intermediate degree trader (hold positions from months to quarters), would currently be shorting this market. The probability of this Target Area being correct is 41.3%. However, the random probability of this Target Area being correct is 34.0%. So the true probability of this Target Area being correct is 21.5% better than random.
* A Primary degree trader (hold positions from months to years), would currently be trading long in this market. The probability of this Target Area being correct is 43.1%. However, the random probability of this Target Area being correct is 34.0%. So the true probability of this Target Area being correct is 26.8% better than random.
Extensive Elliott Commentary for Starbucks Corporation (SBUX) Daily on 18-Mar-2016 with four incomplete patterns:
Wave y of the Minute degree inverted Double Zigzag with a rating of 103.4 is expected to complete in the price range 62.06 to 68.44, but more probably between 62.16 and 65.04. This wave is due to complete anytime from now until 26-Apr-2016, but is most likely to complete before 01-Apr-2016.
Wave y will probably complete this Double Sharp pattern, although it could possibly extend into a Triple Sharp pattern.
This is the final wave in the pattern. When complete it will also complete wave B of the Minor degree Flat with a rating of 84.2. These two waves have the same target ranges.
After wave B is complete, expect the market to continue down into wave C, which should be a five wave Impulsive pattern. Expect wave C to retrace wave B by 89% - 167%. Wave C can also be expected to be 105% - 167% of the price length of wave A. The expected time for wave C to complete is 20% - 148% of the time taken for wave B to complete and 60% - 290% of the time taken for wave A to complete.
Wave (B) of the Intermediate degree inverted Flat with a rating of 81.6 is expected to complete in the price range 36.71 to 58.01, but more probably between 54.69 and 57.9. This wave was expected to complete before 16-Mar-2016, and must complete by 15-Jul-2016.
After wave (B) is complete, expect the market to continue up into wave (C), which should be a five wave Impulsive pattern. Expect wave (C) to retrace wave (B) by 80% - 169%. Wave (C) can also be expected to be 99% - 169% of the price length of wave (A). The expected time for wave (C) to complete is 19% - 187% of the time taken for wave (B) to complete and 56% - 268% of the time taken for wave (A) to complete.
Wave B of the Primary degree Flat with a rating of 87.1 is expected to complete in the price range 61.49 to 76.77, but more probably between 61.64 and 65.64. This wave is due to complete anytime from now until 06-Mar-2017, but is most likely to complete before 25-Mar-2016.
After wave B is complete, expect the market to continue down into wave C, which should be a five wave Impulsive pattern. Expect wave C to retrace wave B by 86% - 162%. Wave C can also be expected to be 90% - 162% of the price length of wave A. The expected time for wave C to complete is 19% - 134% of the time taken for wave B to complete and 24% - 115% of the time taken for wave A to complete.
Current Analysis Settings: Analysis Date Range: 05-Mar-2014 to 18-Mar-2016, Label Range: 15 - 50, Preferred Count Labels: 48, Min Rating: 75, Stocks toggle ON, Bias Towards Beginning of Data: 8, Bias Towards Major High/Low: 8, Largest Degree Wave Filter: Any Pattern
Rating:97.6
Current Trading Positions for Stericycle Inc (SRCL) Daily on 18-Mar-2016
* An Intermediate degree trader (hold positions from months to quarters), would currently be trading long in this market. The probability of this Target Area being correct is 65.3%. However, the random probability of this Target Area being correct is 45.0%. So the true probability of this Target Area being correct is 45.1% better than random.
* A Primary degree trader (hold positions from months to years), would currently be trading long in this market. The probability of this Target Area being correct is 48.2%. However, the random probability of this Target Area being correct is 34.0%. So the true probability of this Target Area being correct is 41.8% better than random.
Extensive Elliott Commentary for Stericycle Inc (SRCL) Daily on 18-Mar-2016 with two incomplete patterns:
Wave (C) of the Intermediate degree inverted Zigzag with a rating of 104.8 is expected to complete in the price range 117.37 to 140.35, but more probably between 119.05 and 131.19. This wave is due to complete anytime from now until 19-May-2016, but is most likely to complete before 04-Apr-2016.
This wave (C) will complete the ZigZag pattern.
This is the final wave in the pattern. When complete it will also complete wave B of the Primary degree Flat with a rating of 97.6. These two waves have the same target ranges.
After wave B is complete, expect the market to continue down into wave C, which should be a five wave Impulsive pattern. Expect wave C to retrace wave B by 86% - 162%. Wave C can also be expected to be 90% - 162% of the price length of wave A. The expected time for wave C to complete is 19% - 134% of the time taken for wave B to complete and 24% - 115% of the time taken for wave A to complete.
Current Analysis Settings: Analysis Date Range: 09-Sep-2015 to 18-Mar-2016, Label Range: 15 - 50, Preferred Count Labels: 19, Min Rating: 75, Stocks toggle ON, Bias Towards Beginning of Data: 8, Bias Towards Major High/Low: 8, Largest Degree Wave Filter: Any Pattern
Rating:92.5
Current Trading Positions for Tesla Motors Inc (TSLA) Daily on 18-Mar-2016
* A Cycle degree trader (hold positions from quarters to years), would currently be trading long in this market. The probability of this Target Area being correct is 88.4%. However, the random probability of this Target Area being correct is 80.4%. So the true probability of this Target Area being correct is 10.0% better than random.
Extensive Elliott Commentary for Tesla Motors Inc (TSLA) Daily on 18-Mar-2016 with one incomplete pattern:
Wave IV of the Cycle degree inverted Ending Diagonal with a rating of 92.5 is expected to complete in the price range 181.4 to 258.51, but more probably between 183.05 and 203.31. This wave is due to complete anytime from now until 14-Dec-2016, but is most likely to complete before 14-Apr-2016.
Expect this wave IV to complete in the price range of wave 2, and then continue down to the end of wave V, which should be a ZigZag family three wave pattern. Expect wave V to have between 52% and 91% of the price range of wave III and complete in 18% to 62% of the time taken by wave III. Expect also that wave V will have between 31% and 72% of the price range of wave I and complete in 3% to 22% of the time taken by wave I. The slope (ie. price range divided by time taken) of wave V should be between 49% and 173% of the slope of wave III and between 77% to 312% of the slope of wave I. Wave V will complete this Ending Diagonal pattern.
Current Analysis Settings: Analysis Date Range: 13-Jan-2014 to 18-Mar-2016, Label Range: 15 - 50, Preferred Count Labels: 16, Min Rating: 75, Stocks toggle ON, Bias Towards Beginning of Data: 8, Bias Towards Major High/Low: 8, Largest Degree Wave Filter: Any Pattern
Rating:81.8
Current Trading Positions for Texas Instruments Inc (TXN) Daily on 18-Mar-2016
* A Primary degree trader (hold positions from months to years), would currently be trading long in this market. The probability of this Target Area being correct is 59.1%. However, the random probability of this Target Area being correct is 45.0%. So the true probability of this Target Area being correct is 31.3% better than random.
* A Cycle degree trader (hold positions from quarters to years), would currently be trading long in this market. The probability of this Target Area being correct is 35.5%. However, the random probability of this Target Area being correct is 24.3%. So the true probability of this Target Area being correct is 46.1% better than random.
Extensive Elliott Commentary for Texas Instruments Inc (TXN) Daily on 18-Mar-2016 with two incomplete patterns:
Wave C of the Primary degree inverted Zigzag with a rating of 96.8 is expected to complete in the price range 52.81 to 69.95, but more probably between 53.33 and 60.77. This wave was expected to complete before 03-Mar-2016, and must complete by 07-Apr-2016.
This wave C will complete the ZigZag pattern.
This is the final wave in the pattern. When complete it will also complete wave y of the Cycle degree inverted Double Zigzag with a rating of 81.8. These two waves have the same target ranges.
Wave y will probably complete this Double Sharp pattern, although it could possibly extend into a Triple Sharp pattern.
Current Analysis Settings: Analysis Date Range: 13-Jan-2014 to 18-Mar-2016, Label Range: 15 - 50, Preferred Count Labels: 36, Min Rating: 75, Stocks toggle ON, Bias Towards Beginning of Data: 8, Bias Towards Major High/Low: 8, Largest Degree Wave Filter: Any Pattern
Rating:425.4
Current Trading Positions for The Kraft Heinz Company (KHC) Daily on 18-Mar-2016
* A Cycle degree trader (hold positions from quarters to years), would currently be trading long in this market. The probability of this Target Area being correct is 78.1%. However, the random probability of this Target Area being correct is 64.0%. So the true probability of this Target Area being correct is 22.0% better than random.
Extensive Elliott Commentary for The Kraft Heinz Company (KHC) Daily on 18-Mar-2016 with one incomplete pattern:
Wave d of the Cycle degree Contracting Triangle with a rating of 425.4 is expected to complete in the price range 75.38 to 79.94, but more probably between 77.09 and 79.84. This wave is due to complete anytime from now until 17-May-2016, but is most likely to complete before 18-Mar-2016.
Once this wave d is complete, expect the market to continue down to the end of wave e, which will most probably be a ZigZag family pattern or possibly a Contracting Triangle. Expect wave e to have between 39% and 67% of the price range of wave c and complete in 6% to 60% of the time taken by wave c. Expect also that wave e will have between 22% and 49% of the price range of wave a and complete in 3% to 29% of the time taken by wave a. The slope (ie. price range divided by time taken) of wave e should be between 28% and 143% of the slope of wave c and between 19% to 183% of the slope of wave a. Wave e will complete this Contracting Triangle.
Current Analysis Settings: Analysis Date Range: 13-Jan-2014 to 18-Mar-2016, Label Range: 15 - 50, Preferred Count Labels: 24, Min Rating: 75, Stocks toggle ON, Bias Towards Beginning of Data: 8, Bias Towards Major High/Low: 8, Largest Degree Wave Filter: Any Pattern
Rating:109.3
Current Trading Positions for T-Mobile US Inc. (TMUS) Daily on 18-Mar-2016
* A Cycle degree trader (hold positions from quarters to years), would currently be trading long in this market. The probability of this Target Area being correct is 43.8%. However, the random probability of this Target Area being correct is 24.3%. So the true probability of this Target Area being correct is 80.2% better than random.
Extensive Elliott Commentary for T-Mobile US Inc. (TMUS) Daily on 18-Mar-2016 with one incomplete pattern:
Wave y of the Cycle degree inverted Double Zigzag with a rating of 109.3 is expected to complete in the price range 49.15 to 79.78, but more probably between 49.42 and 62.73. This wave is most likely to complete sometime between 29-Mar-2016 and 30-Sep-2016 Note that it cannot complete until 21-Mar-2016 but must complete by 10-Oct-2017.
Wave y will probably complete this Double Sharp pattern, although it could possibly extend into a Triple Sharp pattern.
Current Analysis Settings: Analysis Date Range: 05-Nov-2014 to 18-Mar-2016, Label Range: 15 - 50, Preferred Count Labels: 15, Min Rating: 75, Stocks toggle ON, Bias Towards Beginning of Data: 8, Bias Towards Major High/Low: 8, Largest Degree Wave Filter: Any Pattern
Rating:89
Current Trading Positions for Tractor Supply Co (TSCO) Daily on 18-Mar-2016
* A Primary degree trader (hold positions from months to years), would currently be trading long in this market. The probability of this Target Area being correct is 81.2%. However, the random probability of this Target Area being correct is 65.0%. So the true probability of this Target Area being correct is 24.9% better than random.
Extensive Elliott Commentary for Tractor Supply Co (TSCO) Daily on 18-Mar-2016 with two incomplete patterns:
Wave (C) of the Intermediate degree inverted Flat with a rating of 94.4 is expected to complete in the price range 80.04 to 97.98, but more probably between 84.92 and 91.81. This wave was expected to complete before 29-Feb-2016, and must complete by 07-Apr-2016.
This wave (C) will complete the Flat pattern.
This is the final wave in the pattern. When complete it will also complete wave X of the Primary degree Double Zigzag with a rating of 89. These two waves have the same target ranges.
After wave X is complete, expect the market to continue down into wave Y, which should be a three wave Zigzag pattern. Expect wave Y to retrace wave X by 117% - 263%. Wave Y can also be expected to be 90% - 263% of the price length of wave W. The expected time for wave Y to complete is 21% - 161% of the time taken for wave X to complete and 27% - 154% of the time taken for wave W to complete.
Current Analysis Settings: Analysis Date Range: 04-Sep-2014 to 18-Mar-2016, Label Range: 15 - 50, Preferred Count Labels: 29, Min Rating: 75, Stocks toggle ON, Bias Towards Beginning of Data: 8, Bias Towards Major High/Low: 8, Largest Degree Wave Filter: Any Pattern
Rating:100.7
Current Trading Positions for TripAdvisor (TRIP) Daily on 18-Mar-2016
* A Cycle degree trader (hold positions from quarters to years), would currently be trading long in this market. The probability of this Target Area being correct is 50.0%. However, the random probability of this Target Area being correct is 34.0%. So the true probability of this Target Area being correct is 47.1% better than random.
Extensive Elliott Commentary for TripAdvisor (TRIP) Daily on 18-Mar-2016 with one incomplete pattern:
Wave b of the Cycle degree Flat with a rating of 100.7 is expected to complete in the price range 92.75 to 204.23, but more probably between 93.91 and 123.36. This wave could complete anytime between now and 13-Nov-2025, but is most likely to complete sometime between 05-Apr-2016 and 19-Jun-2017.
After wave b is complete, expect the market to continue down into wave c, which should be a five wave Impulsive pattern. Expect wave c to retrace wave b by 85% - 162%. Wave c can also be expected to be 90% - 162% of the price length of wave a. The expected time for wave c to complete is 20% - 136% of the time taken for wave b to complete and 20% - 110% of the time taken for wave a to complete.
Current Analysis Settings: Analysis Date Range: 19-May-2014 to 18-Mar-2016, Label Range: 15 - 50, Preferred Count Labels: 18, Min Rating: 75, Stocks toggle ON, Bias Towards Beginning of Data: 8, Bias Towards Major High/Low: 8, Largest Degree Wave Filter: Any Pattern
Rating:89.8
Current Trading Positions for Twenty-First Century Fox Incorporated (FOX) Daily on 18-Mar-2016
* An Intermediate degree trader (hold positions from months to quarters), would currently be trading long in this market. The probability of this Target Area being correct is 47.0%. However, the random probability of this Target Area being correct is 34.0%. So the true probability of this Target Area being correct is 38.2% better than random.
* A Primary degree trader (hold positions from months to years), would currently be shorting this market. The probability of this Target Area being correct is 81.6%. However, the random probability of this Target Area being correct is 65.0%. So the true probability of this Target Area being correct is 25.5% better than random.
Extensive Elliott Commentary for Twenty-First Century Fox Incorporated (FOX) Daily on 18-Mar-2016 with two incomplete patterns:
Wave (B) of the Intermediate degree Flat with a rating of 95.6 is expected to complete in the price range 27.25 to 31.43, but more probably between 27.28 and 28.04. This wave was expected to complete before 02-Mar-2016, and must complete by 21-Mar-2016.
After wave (B) is complete, expect the market to continue down into wave (C), which should be a five wave Impulsive pattern. Expect wave (C) to retrace wave (B) by 89% - 167%. Wave (C) can also be expected to be 105% - 167% of the price length of wave (A). The expected time for wave (C) to complete is 20% - 148% of the time taken for wave (B) to complete and 60% - 290% of the time taken for wave (A) to complete.
Wave X of the Primary degree inverted Double Zigzag with a rating of 89.8 is expected to complete in the price range 22.65 to 26.72, but more probably between 23.99 and 25.97. This wave was expected to complete before 10-Mar-2016, and must complete by 08-Apr-2016.
After wave X is complete, expect the market to continue up into wave Y, which should be a three wave Zigzag pattern. Expect wave Y to retrace wave X by 128% - 319%. Wave Y can also be expected to be 90% - 319% of the price length of wave W. The expected time for wave Y to complete is 23% - 167% of the time taken for wave X to complete and 47% - 204% of the time taken for wave W to complete.
Current Analysis Settings: Analysis Date Range: 11-Nov-2014 to 18-Mar-2016, Label Range: 15 - 50, Preferred Count Labels: 41, Min Rating: 75, Stocks toggle ON, Bias Towards Beginning of Data: 8, Bias Towards Major High/Low: 8, Largest Degree Wave Filter: Any Pattern
Rating:90.4
Current Trading Positions for Twenty-First Century Fox Incorporated (FOXA) Daily on 18-Mar-2016
* An Intermediate degree trader (hold positions from months to quarters), would currently be trading long in this market. The probability of this Target Area being correct is 47.0%. However, the random probability of this Target Area being correct is 34.0%. So the true probability of this Target Area being correct is 38.2% better than random.
* A Primary degree trader (hold positions from months to years), would currently be shorting this market. The probability of this Target Area being correct is 82.0%. However, the random probability of this Target Area being correct is 65.0%. So the true probability of this Target Area being correct is 26.2% better than random.
Extensive Elliott Commentary for Twenty-First Century Fox Incorporated (FOXA) Daily on 18-Mar-2016 with two incomplete patterns:
Wave (B) of the Intermediate degree Flat with a rating of 95.7 is expected to complete in the price range 27.24 to 31.57, but more probably between 27.26 and 28.06. This wave was expected to complete before 02-Mar-2016, and must complete by 21-Mar-2016.
After wave (B) is complete, expect the market to continue down into wave (C), which should be a five wave Impulsive pattern. Expect wave (C) to retrace wave (B) by 89% - 167%. Wave (C) can also be expected to be 105% - 167% of the price length of wave (A). The expected time for wave (C) to complete is 20% - 148% of the time taken for wave (B) to complete and 60% - 290% of the time taken for wave (A) to complete.
Wave X of the Primary degree inverted Double Zigzag with a rating of 90.4 is expected to complete in the price range 22.66 to 26.72, but more probably between 23.99 and 25.98. This wave was expected to complete before 10-Mar-2016, and must complete by 08-Apr-2016.
After wave X is complete, expect the market to continue up into wave Y, which should be a three wave Zigzag pattern. Expect wave Y to retrace wave X by 128% - 319%. Wave Y can also be expected to be 90% - 319% of the price length of wave W. The expected time for wave Y to complete is 23% - 167% of the time taken for wave X to complete and 47% - 204% of the time taken for wave W to complete.
Current Analysis Settings: Analysis Date Range: 11-Nov-2014 to 18-Mar-2016, Label Range: 15 - 50, Preferred Count Labels: 41, Min Rating: 75, Stocks toggle ON, Bias Towards Beginning of Data: 8, Bias Towards Major High/Low: 8, Largest Degree Wave Filter: Any Pattern
Rating:91.6
Current Trading Positions for Ulta Salon, Cosmetics & Fragra (ULTA) Daily on 18-Mar-2016
* An Intermediate degree trader (hold positions from months to quarters), would currently be trading long in this market. The probability of this Target Area being correct is 65.3%. However, the random probability of this Target Area being correct is 45.0%. So the true probability of this Target Area being correct is 45.1% better than random.
* A Primary degree trader (hold positions from months to years), would currently be trading long in this market. The probability of this Target Area being correct is 44.6%. However, the random probability of this Target Area being correct is 34.0%. So the true probability of this Target Area being correct is 31.2% better than random.
Extensive Elliott Commentary for Ulta Salon, Cosmetics & Fragra (ULTA) Daily on 18-Mar-2016 with two incomplete patterns:
Wave (C) of the Intermediate degree inverted Zigzag with a rating of 104.2 is expected to complete in the price range 169.79 to 221.95, but more probably between 172.2 and 197.32. This wave is due to complete anytime from now until 29-Apr-2016, but is most likely to complete before 28-Mar-2016.
This wave (C) will complete the ZigZag pattern.
This is the final wave in the pattern. When complete it will also complete wave B of the Primary degree Flat with a rating of 91.6. These two waves have the same target ranges.
After wave B is complete, expect the market to continue down into wave C, which should be a five wave Impulsive pattern. Expect wave C to retrace wave B by 86% - 162%. Wave C can also be expected to be 90% - 162% of the price length of wave A. The expected time for wave C to complete is 19% - 134% of the time taken for wave B to complete and 24% - 115% of the time taken for wave A to complete.
Current Analysis Settings: Analysis Date Range: 13-Jan-2014 to 18-Mar-2016, Label Range: 15 - 50, Preferred Count Labels: 28, Min Rating: 75, Stocks toggle ON, Bias Towards Beginning of Data: 8, Bias Towards Major High/Low: 8, Largest Degree Wave Filter: Any Pattern
Rating:83.1
Current Trading Positions for Verisk Analytics Inc (VRSK) Daily on 18-Mar-2016
* A Primary degree trader (hold positions from months to years), would currently be trading long in this market. The probability of this Target Area being correct is 68.0%. However, the random probability of this Target Area being correct is 53.0%. So the true probability of this Target Area being correct is 28.3% better than random.
* A Cycle degree trader (hold positions from quarters to years), would currently be shorting this market. The probability of this Target Area being correct is 41.9%. However, the random probability of this Target Area being correct is 34.0%. So the true probability of this Target Area being correct is 23.2% better than random.
Extensive Elliott Commentary for Verisk Analytics Inc (VRSK) Daily on 18-Mar-2016 with two incomplete patterns:
Wave X of the Primary degree Double 3 with a rating of 104.2 is expected to complete in the price range 74.9 to 148.23, but more probably between 75.35 and 82.44. This wave is due to complete anytime from now until 02-Feb-2018, but is most likely to complete before 17-Jun-2016.
After wave X is complete, expect the market to continue down into wave Y, which will probably be a three wave corrective pattern. Expect wave Y to retrace wave X by 98% - 193%. Wave Y can also be expected to be 76% - 193% of the price length of wave W. The expected time for wave Y to complete is 20% - 178% of the time taken for wave X to complete and 12% - 115% of the time taken for wave W to complete.
Wave b of the Cycle degree inverted Flat with a rating of 83.1 is expected to complete in the price range 33.09 to 64.12, but more probably between 56.6 and 63.42. This wave is due to complete anytime from now until 15-Dec-2017, but is most likely to complete before 05-Apr-2016.
After wave b is complete, expect the market to continue up into wave c, which should be a five wave Impulsive pattern. Expect wave c to retrace wave b by 82% - 179%. Wave c can also be expected to be 67% - 179% of the price length of wave a. The expected time for wave c to complete is 20% - 151% of the time taken for wave b to complete and 11% - 58% of the time taken for wave a to complete.
Current Analysis Settings: Analysis Date Range: 03-Mar-2014 to 18-Mar-2016, Label Range: 15 - 50, Preferred Count Labels: 20, Min Rating: 75, Stocks toggle ON, Bias Towards Beginning of Data: 8, Bias Towards Major High/Low: 8, Largest Degree Wave Filter: Any Pattern
Rating:86.7
Current Trading Positions for Vertex Pharmaceuticals Inc (VRTX) Daily on 18-Mar-2016
* An Intermediate degree trader (hold positions from months to quarters), would currently be shorting this market. The probability of this Target Area being correct is 65.3%. However, the random probability of this Target Area being correct is 45.0%. So the true probability of this Target Area being correct is 45.1% better than random.
* A Primary degree trader (hold positions from months to years), would currently be shorting this market. The probability of this Target Area being correct is 36.5%. However, the random probability of this Target Area being correct is 24.3%. So the true probability of this Target Area being correct is 50.2% better than random.
* A Cycle degree trader (hold positions from quarters to years), would currently be shorting this market. The probability of this Target Area being correct is 42.8%. However, the random probability of this Target Area being correct is 34.0%. So the true probability of this Target Area being correct is 25.9% better than random.
Extensive Elliott Commentary for Vertex Pharmaceuticals Inc (VRTX) Daily on 18-Mar-2016 with three incomplete patterns:
Wave (C) of the Intermediate degree Zigzag with a rating of 104.3 is expected to complete in the price range 36.44 to 83.92, but more probably between 56.33 and 79.22. This wave is due to complete anytime from now until 07-Oct-2016, but is most likely to complete before 22-Apr-2016.
This wave (C) will complete the ZigZag pattern.
This is the final wave in the pattern. When complete it will also complete wave Y of the Primary degree Double Zigzag with a rating of 83.8. These two waves have the same target ranges.
Wave Y will probably complete this Double Sharp pattern, although it could possibly extend into a Triple Sharp pattern.
This is the final wave in the pattern. When complete it will also complete wave b of the Cycle degree inverted Flat with a rating of 86.7. These two waves have the same target ranges.
After wave b is complete, expect the market to continue up into wave c, which should be a five wave Impulsive pattern. Expect wave c to retrace wave b by 82% - 179%. Wave c can also be expected to be 67% - 179% of the price length of wave a. The expected time for wave c to complete is 20% - 151% of the time taken for wave b to complete and 11% - 58% of the time taken for wave a to complete.
Current Analysis Settings: Analysis Date Range: 05-Mar-2014 to 18-Mar-2016, Label Range: 15 - 50, Preferred Count Labels: 16, Min Rating: 75, Stocks toggle ON, Bias Towards Beginning of Data: 8, Bias Towards Major High/Low: 8, Largest Degree Wave Filter: Any Pattern
Rating:85.2
Current Trading Positions for Viacom Inc Class B (VIAB) Daily on 18-Mar-2016
* A Minor degree trader (hold positions from weeks to quarters), would currently be trading long in this market. The probability of this Target Area being correct is 42.4%. However, the random probability of this Target Area being correct is 24.3%. So the true probability of this Target Area being correct is 74.5% better than random.
* An Intermediate degree trader (hold positions from months to quarters), would currently be trading long in this market. The probability of this Target Area being correct is 41.9%. However, the random probability of this Target Area being correct is 34.0%. So the true probability of this Target Area being correct is 23.2% better than random.
* A Primary degree trader (hold positions from months to years), would currently be shorting this market. The probability of this Target Area being correct is 39.5%. However, the random probability of this Target Area being correct is 34.0%. So the true probability of this Target Area being correct is 16.2% better than random.
* A Cycle degree trader (hold positions from quarters to years), would currently be trading long in this market. The probability of this Target Area being correct is 85.5%. However, the random probability of this Target Area being correct is 64.1%. So the true probability of this Target Area being correct is 33.4% better than random.
Extensive Elliott Commentary for Viacom Inc Class B (VIAB) Daily on 18-Mar-2016 with four incomplete patterns:
Wave Y of the Minor degree inverted Double Zigzag with a rating of 102.4 is expected to complete in the price range 45.38 to 48.18, but more probably between 45.52 and 46.78. This wave is due to complete anytime from now until 15-Apr-2016, but is most likely to complete before 29-Mar-2016.
Wave Y will probably complete this Double Sharp pattern, although it could possibly extend into a Triple Sharp pattern.
This is the final wave in the pattern. When complete it will also complete wave (B) of the Intermediate degree Flat with a rating of 83.4. These two waves have the same target ranges.
After wave (B) is complete, expect the market to continue down into wave (C), which should be a five wave Impulsive pattern. Expect wave (C) to retrace wave (B) by 89% - 167%. Wave (C) can also be expected to be 105% - 167% of the price length of wave (A). The expected time for wave (C) to complete is 20% - 148% of the time taken for wave (B) to complete and 60% - 290% of the time taken for wave (A) to complete.
Wave B of the Primary degree inverted Flat with a rating of 76 is expected to complete in the price range 8.48 to 41.61, but more probably between 36.45 and 41.43. This wave is due to complete anytime from now until 16-Aug-2016, but is most likely to complete before 25-Mar-2016.
After wave B is complete, expect the market to continue up into wave C, which should be a five wave Impulsive pattern. Expect wave C to retrace wave B by 80% - 169%. Wave C can also be expected to be 99% - 169% of the price length of wave A. The expected time for wave C to complete is 19% - 187% of the time taken for wave B to complete and 56% - 268% of the time taken for wave A to complete.
Wave y of the Cycle degree inverted Double 3 with a rating of 85.2 is expected to complete in the price range 40.01 to 105.94, but more probably between 51.15 and 71.33. This wave is due to complete anytime from now until 02-Sep-2016, but is most likely to complete before 22-Apr-2016.
Wave y will probably complete this Double Sideways pattern, although it could possibly extend into a Triple Sideways pattern.
Current Analysis Settings: Analysis Date Range: 04-Jun-2014 to 18-Mar-2016, Label Range: 15 - 50, Preferred Count Labels: 30, Min Rating: 75, Stocks toggle ON, Bias Towards Beginning of Data: 8, Bias Towards Major High/Low: 8, Largest Degree Wave Filter: Any Pattern
Rating:84.9
Current Trading Positions for Vodafone Group Plc (VOD) Daily on 18-Mar-2016
* A Cycle degree trader (hold positions from quarters to years), would currently be trading long in this market. The probability of this Target Area being correct is 79.6%. However, the random probability of this Target Area being correct is 65.0%. So the true probability of this Target Area being correct is 22.5% better than random.
Extensive Elliott Commentary for Vodafone Group Plc (VOD) Daily on 18-Mar-2016 with two incomplete patterns:
Wave C of the Primary degree inverted Flat with a rating of 100.1 is expected to complete in the price range 30.11 to 44.89, but more probably between 33.23 and 39.12. This wave is due to complete anytime from now until 14-Sep-2017, but is most likely to complete before 20-Jun-2016.
This wave C will complete the Flat pattern.
This is the final wave in the pattern. When complete it will also complete wave x of the Cycle degree Double Zigzag with a rating of 84.9. These two waves have the same target ranges.
After wave x is complete, expect the market to continue down into wave y, which should be a three wave Zigzag pattern. Expect wave y to retrace wave x by 117% - 263%. Wave y can also be expected to be 90% - 263% of the price length of wave w. The expected time for wave y to complete is 21% - 161% of the time taken for wave x to complete and 27% - 154% of the time taken for wave w to complete.
Current Analysis Settings: Analysis Date Range: 13-Jan-2014 to 18-Mar-2016, Label Range: 15 - 50, Preferred Count Labels: 36, Min Rating: 75, Stocks toggle ON, Bias Towards Beginning of Data: 8, Bias Towards Major High/Low: 8, Largest Degree Wave Filter: Any Pattern
Rating:90.4
Current Trading Positions for Walgreens Boots Alliance Inc (WBA) Daily on 18-Mar-2016
* A Primary degree trader (hold positions from months to years), would currently be trading long in this market. The probability of this Target Area being correct is 50.2%. However, the random probability of this Target Area being correct is 34.0%. So the true probability of this Target Area being correct is 47.6% better than random.
* A Cycle degree trader (hold positions from quarters to years), would currently be shorting this market. The probability of this Target Area being correct is 44.0%. However, the random probability of this Target Area being correct is 34.0%. So the true probability of this Target Area being correct is 29.4% better than random.
Extensive Elliott Commentary for Walgreens Boots Alliance Inc (WBA) Daily on 18-Mar-2016 with two incomplete patterns:
Wave B of the Primary degree Flat with a rating of 102.1 is expected to complete in the price range 87.98 to 135.25, but more probably between 88.46 and 100.83. This wave is due to complete anytime from now until 23-Oct-2017, but is most likely to complete before 17-May-2016.
After wave B is complete, expect the market to continue down into wave C, which should be a five wave Impulsive pattern. Expect wave C to retrace wave B by 86% - 162%. Wave C can also be expected to be 90% - 162% of the price length of wave A. The expected time for wave C to complete is 19% - 134% of the time taken for wave B to complete and 24% - 115% of the time taken for wave A to complete.
Wave b of the Cycle degree inverted Flat with a rating of 90.4 is expected to complete in the price range 15.2 to 68.62, but more probably between 55.67 and 67.41. This wave is due to complete anytime from now until 09-Nov-2018, but is most likely to complete before 05-Aug-2016.
After wave b is complete, expect the market to continue up into wave c, which should be a five wave Impulsive pattern. Expect wave c to retrace wave b by 82% - 179%. Wave c can also be expected to be 67% - 179% of the price length of wave a. The expected time for wave c to complete is 20% - 151% of the time taken for wave b to complete and 11% - 58% of the time taken for wave a to complete.
Current Analysis Settings: Analysis Date Range: 13-Jan-2014 to 18-Mar-2016, Label Range: 15 - 50, Preferred Count Labels: 21, Min Rating: 75, Stocks toggle ON, Bias Towards Beginning of Data: 8, Bias Towards Major High/Low: 8, Largest Degree Wave Filter: Any Pattern
Rating:78.9
Current Trading Positions for Western Digital Corp (WDC) Daily on 18-Mar-2016
* A Cycle degree trader (hold positions from quarters to years), would currently be trading long in this market. The probability of this Target Area being correct is 77.2%. However, the random probability of this Target Area being correct is 65.0%. So the true probability of this Target Area being correct is 18.8% better than random.
Extensive Elliott Commentary for Western Digital Corp (WDC) Daily on 18-Mar-2016 with two incomplete patterns:
Wave C of the Primary degree inverted Flat with a rating of 97 is expected to complete in the price range 42.28 to 65.54, but more probably between 48.04 and 57.69. This wave was expected to complete before 04-Mar-2016, and must complete by 08-Apr-2016.
This wave C will complete the Flat pattern.
This is the final wave in the pattern. When complete it will also complete wave x of the Cycle degree Double Zigzag with a rating of 78.9. These two waves have the same target ranges.
After wave x is complete, expect the market to continue down into wave y, which should be a three wave Zigzag pattern. Expect wave y to retrace wave x by 116% - 261%. Wave y can also be expected to be 90% - 261% of the price length of wave w. The expected time for wave y to complete is 21% - 160% of the time taken for wave x to complete and 25% - 152% of the time taken for wave w to complete.
Current Analysis Settings: Analysis Date Range: 07-Nov-2014 to 18-Mar-2016, Label Range: 15 - 50, Preferred Count Labels: 15, Min Rating: 75, Stocks toggle ON, Bias Towards Beginning of Data: 8, Bias Towards Major High/Low: 8, Largest Degree Wave Filter: Any Pattern
Rating:77.9
Current Trading Positions for Whole Foods Market Inc (WFM) Daily on 18-Mar-2016
* A Primary degree trader (hold positions from months to years), would currently be trading long in this market. The probability of this Target Area being correct is 87.1%. However, the random probability of this Target Area being correct is 64.1%. So the true probability of this Target Area being correct is 35.9% better than random.
* A Cycle degree trader (hold positions from quarters to years), would currently be trading long in this market. The probability of this Target Area being correct is 40.1%. However, the random probability of this Target Area being correct is 34.0%. So the true probability of this Target Area being correct is 17.9% better than random.
Extensive Elliott Commentary for Whole Foods Market Inc (WFM) Daily on 18-Mar-2016 with two incomplete patterns:
Wave Y of the Primary degree inverted Double 3 with a rating of 101.9 is expected to complete in the price range 30.18 to 51.68, but more probably between 33.16 and 41.02. This wave is due to complete anytime from now until 21-Jul-2016, but is most likely to complete before 20-May-2016.
Wave Y will probably complete this Double Sideways pattern, although it could possibly extend into a Triple Sideways pattern.
This is the final wave in the pattern. When complete it will also complete wave b of the Cycle degree Flat with a rating of 77.9. These two waves have the same target ranges.
After wave b is complete, expect the market to continue down into wave c, which should be a five wave Impulsive pattern. Expect wave c to retrace wave b by 86% - 162%. Wave c can also be expected to be 90% - 162% of the price length of wave a. The expected time for wave c to complete is 19% - 134% of the time taken for wave b to complete and 24% - 115% of the time taken for wave a to complete.
Current Analysis Settings: Analysis Date Range: 07-Jan-2015 to 18-Mar-2016, Label Range: 15 - 50, Preferred Count Labels: 22, Min Rating: 75, Stocks toggle ON, Bias Towards Beginning of Data: 8, Bias Towards Major High/Low: 8, Largest Degree Wave Filter: Any Pattern
Rating:80.2
Current Trading Positions for Xilinx Inc (XLNX) Daily on 18-Mar-2016
* An Intermediate degree trader (hold positions from months to quarters), would currently be shorting this market. The probability of this Target Area being correct is 30.0%. However, the random probability of this Target Area being correct is 13.0%. So the true probability of this Target Area being correct is 130.8% better than random.
* A Cycle degree trader (hold positions from quarters to years), would currently be shorting this market. The probability of this Target Area being correct is 41.0%. However, the random probability of this Target Area being correct is 34.0%. So the true probability of this Target Area being correct is 20.6% better than random.
Extensive Elliott Commentary for Xilinx Inc (XLNX) Daily on 18-Mar-2016 with three incomplete patterns:
Wave (3) of the Intermediate degree inverted Impulse with a rating of 93.1 is expected to complete in the price range 20.9 to 44.93, but more probably between 38.71 and 44.28. This wave was expected to complete before 14-Mar-2016, and must complete by 06-Apr-2016.
When complete, expect the overall slope (ie. price range divided by time taken) of this wave (3) to be between 47% to 194% of the slope of wave (1). Then expect the market to pull back into wave (4), which will be corrective in nature and has a probability of 0% of being a Flat or other sideways pattern. Wave (4) should not retrace back into the price range of wave (1) or (2). Expect wave (4) to have between 5% - 140% of the price range of wave (2). The expected time for wave (4) to complete is between 16% - 136% of wave (2). After wave (4), expect wave (5) to move beyond the end of wave (3) to complete this Impulse.
Wave C of the Primary degree Flat with a rating of 79.8 is expected to complete in the price range 24.46 to 46.94, but more probably between 34.15 and 42.02. This wave is due to complete anytime from now until 27-Apr-2016, but is most likely to complete before 21-Mar-2016.
This wave C will complete the Flat pattern.
This is the final wave in the pattern. When complete it will also complete wave b of the Cycle degree inverted Flat with a rating of 80.2. These two waves have the same target ranges.
After wave b is complete, expect the market to continue up into wave c, which should be a five wave Impulsive pattern. Expect wave c to retrace wave b by 82% - 179%. Wave c can also be expected to be 67% - 179% of the price length of wave a. The expected time for wave c to complete is 20% - 151% of the time taken for wave b to complete and 11% - 58% of the time taken for wave a to complete.
Current Analysis Settings: Analysis Date Range: 07-Feb-2014 to 18-Mar-2016, Label Range: 15 - 50, Preferred Count Labels: 31, Min Rating: 75, Stocks toggle ON, Bias Towards Beginning of Data: 8, Bias Towards Major High/Low: 8, Largest Degree Wave Filter: Any Pattern
After wave x is complete, expect the market to continue down into wave y, which should be a three wave Zigzag pattern. Expect wave y to retrace wave x by 116% - 261%. Wave y can also be expected to be 90% - 261% of the price length of wave w. The expected time for wave y to complete is 21% - 160% of the time taken for wave x to complete and 25% - 152% of the time taken for wave w to complete.
Wave C of the Primary degree inverted Flat with a rating of 95.3 is expected to complete in the price range 29 to 46.18, but more probably between 33.04 and 40.83. This wave is due to complete anytime from now until 10-Mar-2017, but is most likely to complete before 16-May-2016.
Current Analysis Settings: Analysis Date Range: 08-Oct-2014 to 18-Mar-2016, Label Range: 15 - 50, Preferred Count Labels: 17, Min Rating: 75, Stocks toggle ON, Bias Towards Beginning of Data: 8, Bias Towards Major High/Low: 8, Largest Degree Wave Filter: Any Pattern
* A Cycle degree trader (hold positions from quarters to years), would currently be trading long in this market. The probability of this Target Area being correct is 78.0%. However, the random probability of this Target Area being correct is 65.0%. So the true probability of this Target Area being correct is 20.0% better than random.
This is the final wave in the pattern. When complete it will also complete wave x of the Cycle degree Double Zigzag with a rating of 80.8. These two waves have the same target ranges.
Extensive Elliott Commentary for Yahoo! Inc (YHOO) Daily on 18-Mar-2016 with two incomplete patterns:
Current Trading Positions for Yahoo! Inc (YHOO) Daily on 18-Mar-2016