34
0 Emaar Development PJSC An Enduring Enterprise. Prepared for the Up-cycle Investor Presentation August 2019

0
Emaar Development PJSCAn Enduring Enterprise. Prepared for the Up-cycle
Investor Presentation
August 2019

1 | EMAAR DEVELOPMENT
Disclaimer
23 August 2019 Page 1
Emaar Development PJSC gives notice that: The particulars of this presentation do not constitute any part of an offer or a contract.
Given that the presentation contains information based on forecasts and roll outs, all statements contained in this presentation are
made without responsibility on the part of Emaar Development PJSC, their advisors, or members of Emaar Group (including their
directors, officers and employees).
None of the statements contained in this presentation is to be relied upon as a statement or representation of fact.
All parties must satisfy themselves as to the correctness of each of the statements contained in this presentation.
Emaar Development PJSC and members of the Emaar Group do not make or give, and neither members of the Emaar Group nor any
of their directors or officers or persons in their employment or advisors has any authority to make or give, any representation or
warranty whatsoever in relation to this presentation.
This presentation may not be stored, copied, distributed, transmitted, retransmitted or reproduced, in whole or in part, in any form or
medium without the permission of Emaar Development PJSC.

2 | EMAAR DEVELOPMENT
DiscussionSummary
Investment Rationale
Business Overview
Business Strategy & Outlook
H1 2019 Results Update
Annexure
3 | EMAAR DEVELOPMENT
Investment Rationale
4 | EMAAR DEVELOPMENT
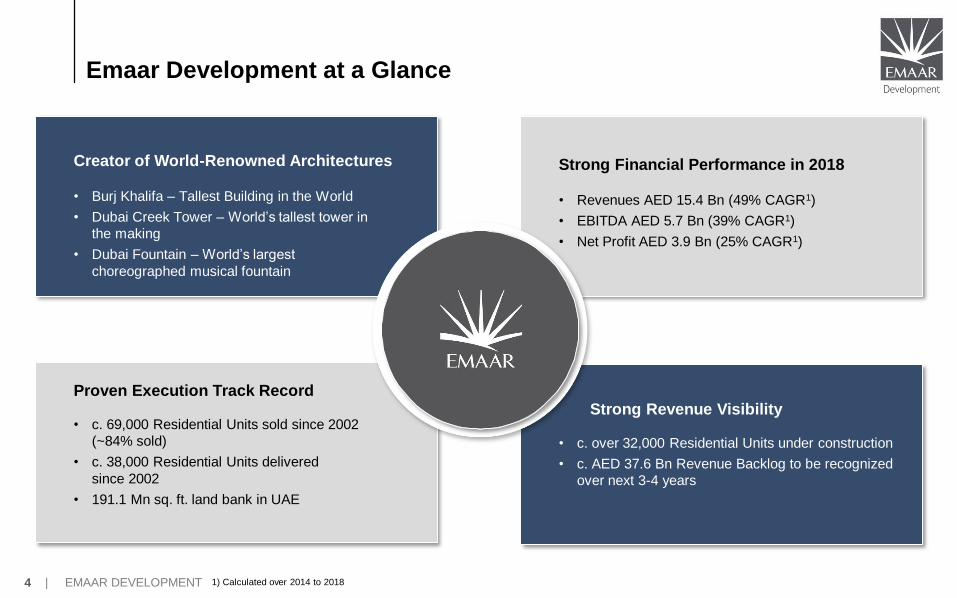
Emaar Development at a Glance
Creator of World-Renowned Architectures
• Burj Khalifa – Tallest Building in the World
• Dubai Creek Tower – World’s tallest tower in
the making
• Dubai Fountain – World’s largest
choreographed musical fountain
Proven Execution Track Record
• c. 69,000 Residential Units sold since 2002
(~84% sold)
• c. 38,000 Residential Units delivered
since 2002
• 191.1 Mn sq. ft. land bank in UAE
Strong Revenue Visibility
• c. over 32,000 Residential Units under construction
• c. AED 37.6 Bn Revenue Backlog to be recognized
over next 3-4 years
Strong Financial Performance in 2018
• Revenues AED 15.4 Bn (49% CAGR1)
• EBITDA AED 5.7 Bn (39% CAGR1)
• Net Profit AED 3.9 Bn (25% CAGR1)
1) Calculated over 2014 to 2018
5 | EMAAR DEVELOPMENT
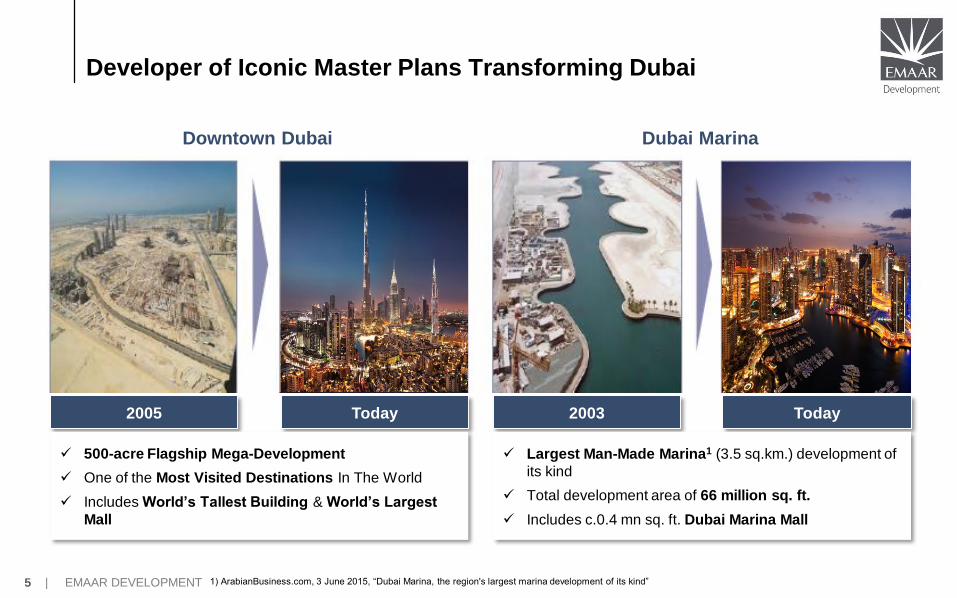
Downtown Dubai Dubai Marina
2005 Today 2003 Today
✓ 500-acre Flagship Mega-Development
✓ One of the Most Visited Destinations In The World
✓ Includes World’s Tallest Building & World’s Largest
Mall
✓ Largest Man-Made Marina1 (3.5 sq.km.) development of
its kind
✓ Total development area of 66 million sq. ft.
✓ Includes c.0.4 mn sq. ft. Dubai Marina Mall
Developer of Iconic Master Plans Transforming Dubai
1) ArabianBusiness.com, 3 June 2015, “Dubai Marina, the region's largest marina development of its kind”
6 | EMAAR DEVELOPMENT
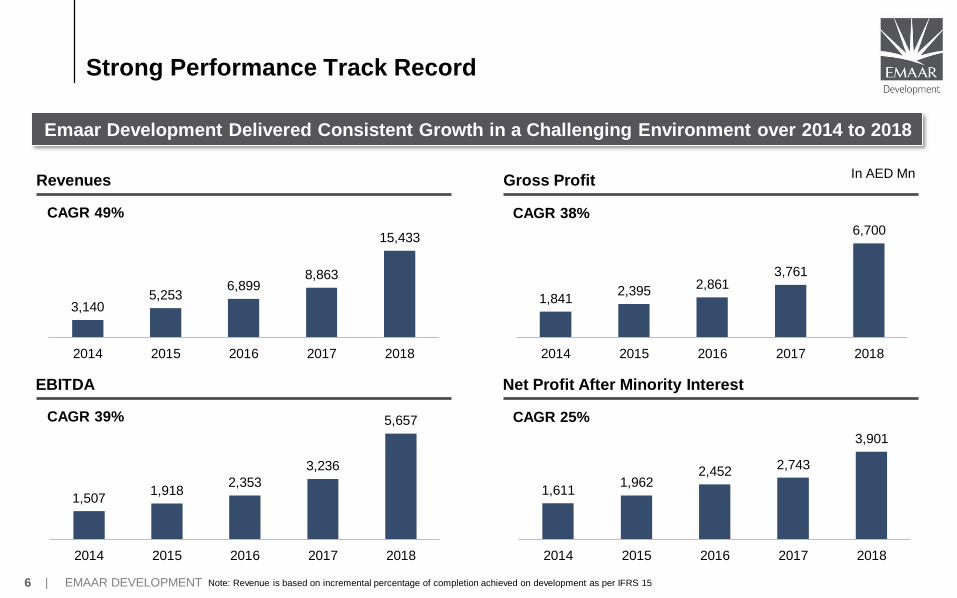
Strong Performance Track Record
Emaar Development Delivered Consistent Growth in a Challenging Environment over 2014 to 2018
3,1405,253
6,8998,863
15,433
2014 2015 2016 2017 2018
1,8412,395
2,8613,761
6,700
2014 2015 2016 2017 2018
1,5071,918
2,353
3,236
5,657
2014 2015 2016 2017 2018
1,6111,962
2,4522,743
3,901
2014 2015 2016 2017 2018
Revenues Gross Profit
EBITDA Net Profit After Minority Interest
CAGR 49% CAGR 38%
CAGR 39% CAGR 25%
In AED Mn
Note: Revenue is based on incremental percentage of completion achieved on development as per IFRS 15

7 | EMAAR DEVELOPMENT
12.310.2
14.4
18.0
14.211.5
9.17.0 7.5
4.3
2014 2015 2016 2017 2018
Emaar Development Listed Peer
Robust Sales – Ahead of the Competition (More than 3x in 2018)
✓ Displayed strong sales traction, despite
difficult market conditions
✓ Significant long-term value creation through
Integrated Master Developments centered
around Iconic Assets
✓ Strong customer trust and brand loyalty
✓ Emaar’s off-plan sales of c. AED 14.2 Bn in
2018, accounted for more than 65% of total
off-plan sales (AED 21.4 Bn1) in Dubai
Consistently Ahead of the Competition
Emaar Development Maintained Robust Sales Trend over 2014 to 2018
In AED Bn
3,192 3,033
4,657
7,4376,502
2014 2015 2016 2017 2018
Number of Units Sold
1) Source: JLL

8 | EMAAR DEVELOPMENT
Well-Defined Dividend Policy
Focus on Sustained Dividend Payout in Future
Total AED 2.08 Bn dividends
paid for 2018
Committed to pay
AED 2.08 Bn dividends
each for 2019 & 2020
Target aggregate
dividend distribution of
USD 1.7 Bn (AED 6.2 Bn)
dividends over 2018-2020
Robust Cash Flow Generation
• Robust OCF supported by robust
sales over next 4 years
• Revenue Backlog – AED 37.6 Bn
• Sale of unsold units under
development
Target Dividend Policy Dividend Distribution Well-Positioned to Sustain
Future Dividend Payments
Total Dividend of AED 2.08 Bn paid for 2018 translating into
Dividend Payout Ratio of 53.3% and Dividend Yield of 11.8% as on December 2018

9 | EMAAR DEVELOPMENT
Business Overview
10 | EMAAR DEVELOPMENT
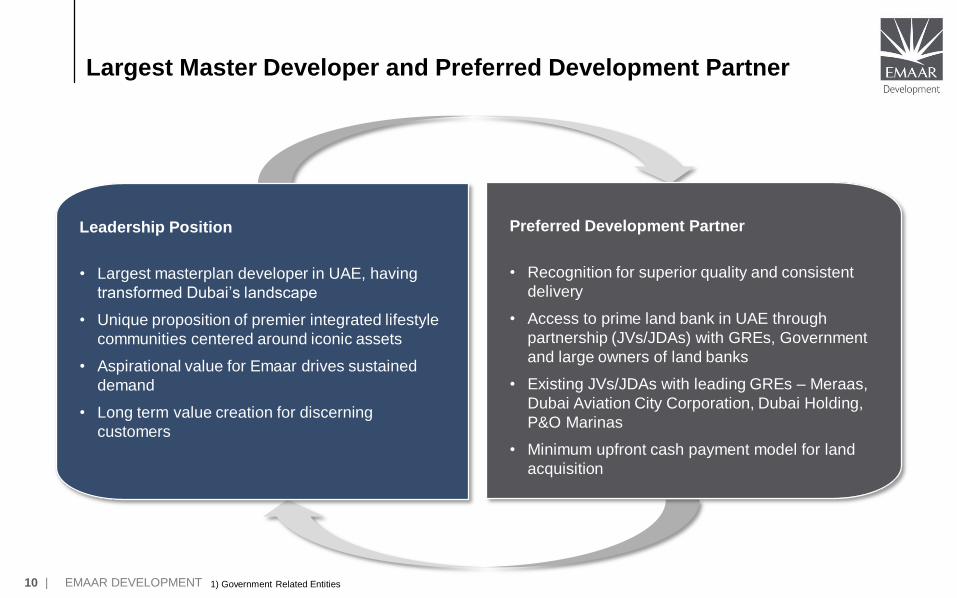
Largest Master Developer and Preferred Development Partner
1) Government Related Entities
Leadership Position
• Largest masterplan developer in UAE, having
transformed Dubai’s landscape
• Unique proposition of premier integrated lifestyle
communities centered around iconic assets
• Aspirational value for Emaar drives sustained
demand
• Long term value creation for discerning
customers
Preferred Development Partner
• Recognition for superior quality and consistent
delivery
• Access to prime land bank in UAE through
partnership (JVs/JDAs) with GREs, Government
and large owners of land banks
• Existing JVs/JDAs with leading GREs – Meraas,
Dubai Aviation City Corporation, Dubai Holding,
P&O Marinas
• Minimum upfront cash payment model for land
acquisition

11 | EMAAR DEVELOPMENT
De-risked Business Model to Deliver Self-Sustaining Growth
Minimal Cash
Requirement for Land Self-Funded Construction Minimal Default Rate
• Sufficient land bank, limited
incremental investment in
new land
• Minimal upfront cash
payment model for land
acquisitions
• Structures where JV
partners commit the land as
their economic contribution
• Construction cost is funded
through pre-sales
• On average, 60%-70% of
units are pre-sold and
~30% cash collection in sold
projects is achieved by
construction
commencement
• >80% of off-plan projects
sold
• Minimal default rates levels
of ~2%
• Upon default, up to 40% of
the sales value as per the
law can be forfeited and the
property can be resold
12 | EMAAR DEVELOPMENT
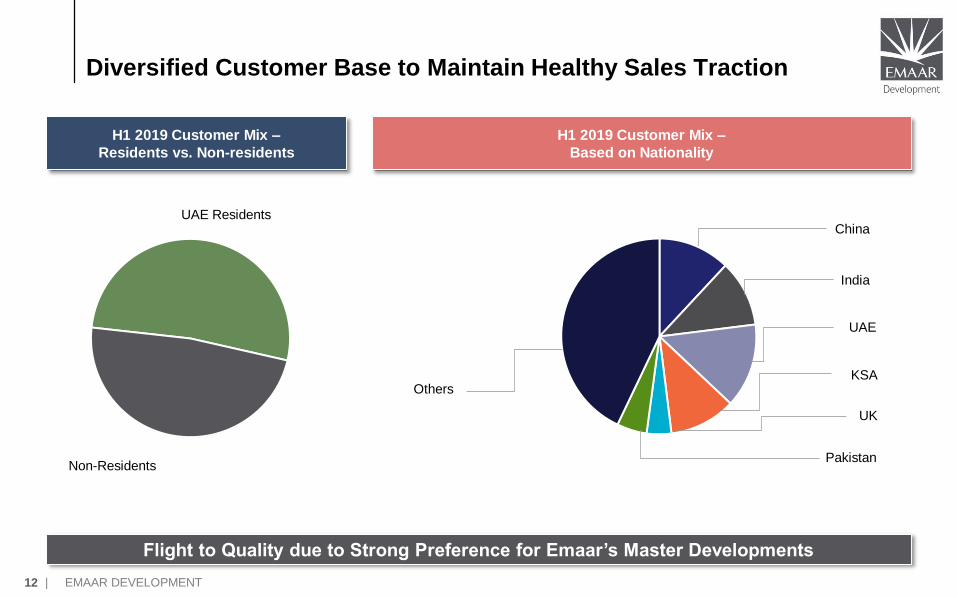
Diversified Customer Base to Maintain Healthy Sales Traction
H1 2019 Customer Mix –
Residents vs. Non-residents
H1 2019 Customer Mix –
Based on Nationality
Flight to Quality due to Strong Preference for Emaar’s Master Developments
China
India
UAE
KSA
UK
Pakistan
Others
UAE Residents
Non-Residents

13 | EMAAR DEVELOPMENT
Sufficient Land Bank to Deliver Long-term Growth
No Long Term Need for Land Purchase
Note: Cumulative historical GFA BTS not adjusted for GFA developed post 2011 nor GFA currently under development
Land Bank Evolution Though Investments & Strategic Partners
(million sq ft)
GFA BTS Gross Land Area BTS
13 18
78
167
198 199 211 211
240.0
9
25
114 162
231 233 234 234
267
2011 2012 2013 2014 2015 2016 2017 2018 H1 2019
UAE Available Land BankGross Land Area
(Million sq. ft.)
UAE wholly owned 23.32
Ras Al Khaima 0.84
Others (Downtown,
Arabian Ranches etc.)21.81
Emaar Beachfront 0.67
Dubai Hills 52.08
Dubai Creek 54.97
Mina Rashid 10.11
Emaar South 50.61
Total UAE Available Land
Bank191.09
+50%
CAGR
20x
Multiple
GFA BTS 2011-H1 2019
Year Area
2012 Arabian Ranches II
2013 Dubai Hills Estate
2014 Dubai Creek Harbour
2015 Emaar South
2016 Downtown Views, Ras Al Khaimah
2017 Zabeel Square & Emaar Beachfront*
2019 Arabian Ranches III & Mina Rashid
*Emaar Beachfront partial acquisition completed and launched in Jan 2018. In March 2018 an MOU with Aldar was signed to jointly develop the project; formal
agreement is under process,
14 | EMAAR DEVELOPMENT
Business Strategy & Outlook

15 | EMAAR DEVELOPMENT
Our Assessment Of The Dubai’s Economy
Sustained Population Growth
• Dubai’s population: 3.3mn, 2x over 2007-18 (7% CAGR)
• Oxford Economics expects Dubai’s employment
population to grow at 3.4% from 2019-22 (vs. 2.7% in
2018)
• Dubai is one of the most progressive places in the
GCC region, politically secure & conducive for business
/ investments
• HSBC Expat Explorer Survey (Jan 19) has ranked UAE
as the 4th Best Place to Work in the World
Dubai Economy Back on Recovery
Dubai economy is expected to grow at
3.0% in 2019 and 3.7% in 2020 1
Tourism Growth
• Tourism is one of the pillars of
Dubai’s economy
• Dubai Airport registered 89.1
mn international passengers
in 2018
• Dubai’s Tourism registered
15.9 mn international guests
in 2018
• ‘Visa on Arrival’ led to strong
influx of tourists from China
(0.8 mn) & Russia (0.6 mn)
• Transit Visa up to 96 hours
Positive Tailwinds
• 10 Year Resident Visa
• 100% Foreign Investment
• Expo 2020
• Dubai Vision 2030 - Create
Additional 27,000 specialised
jobs by 2030
• Government initiatives to
make Dubai an international
hub for knowledge-based
industry
1) Source: Dubai Economy

16 | EMAAR DEVELOPMENT
Residential Real Estate To Gradually Move Towards Equilibrium
Key Factors Affecting
Residential Market Equilibrium
Supply Rationalisation
• Historical avg. materialization rate of ~43.2%
• Expected deliveries may get aligned with market cycles
• Well-calibrated new project launches
Demand Creation
• 2.3 bn people <4 hrs & 2/3rd world population <8 hrs
flight
• Aspiration for better living, preference for mega
community lifestyle
• Increasing end-user demand - attractive price-to-rent
ratio, rising mortgage contribution (18% in 2012 to 52%
in 2018)
• Stabilisation of rental yields supported by tenant
migration from neighbouring Emirates
Increased Affordability
Investment Attractiveness
1) Source: www.globalpropertyguide.com, www.tradingeconomics.com, 2) As on Dec 2017
Affordability
Index1Price
(USD/sqm.)
Price /
GDP Per Capita2Mortgage
Rate
Rental
Yield
Price /
Rent
Dubai 5,918 8.8% 3.24% 5.19% 19x
Sydney 10,711 24.0% 3.62% 2.52% 40x
Mumbai 10,932 170.1% 8.60% 2.32% 43x
Singapore 13,748 16.1% 1.85% 2.54% 39x
New York 17,191 31.7% 3.27% 2.91% 34x
Hong Kong 28,570 51.0% 2.15% 2.35% 42x
London 29,676 74.7% 1.49% 2.71% 37x
• Dubai’s GDP Per Capita2 (PPP terms) - USD 59,419 in 2012 to
USD 66,616 in 20181
• Dubai’s real estate is highly attractive for global investors
• For EM investors, it offers a hedge against depreciating local
market currencies
17 | EMAAR DEVELOPMENT
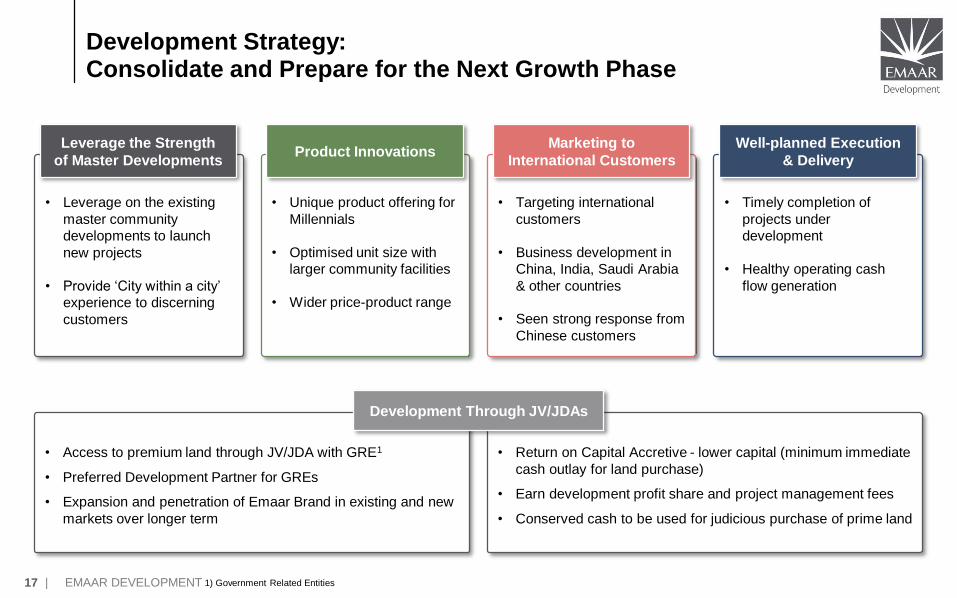
• Leverage on the existing
master community
developments to launch
new projects
• Provide ‘City within a city’
experience to discerning
customers
Leverage the Strength
of Master Developments
• Unique product offering for
Millennials
• Optimised unit size with
larger community facilities
• Wider price-product range
Product Innovations
• Targeting international
customers
• Business development in
China, India, Saudi Arabia
& other countries
• Seen strong response from
Chinese customers
Marketing to
International Customers
• Timely completion of
projects under
development
• Healthy operating cash
flow generation
Well-planned Execution
& Delivery
• Access to premium land through JV/JDA with GRE1
• Preferred Development Partner for GREs
• Expansion and penetration of Emaar Brand in existing and new
markets over longer term
• Return on Capital Accretive - lower capital (minimum immediate
cash outlay for land purchase)
• Earn development profit share and project management fees
• Conserved cash to be used for judicious purchase of prime land
Development Through JV/JDAs
1) Government Related Entities
Development Strategy:Consolidate and Prepare for the Next Growth Phase
18 | EMAAR DEVELOPMENT
H1 2019Results Update

19 | EMAAR DEVELOPMENT
H1 2019 Key Highlights
1) Including 100% of Escrow balances of Joint Ventures & JDA’s, 2) Sales value of properties sold but not yet recognised as revenue under IFRS including 100% of joint
ventures as of 30 June 2019
Property Sales
AED 9.4 Bn
+50% YoY
Revenues
AED 6.2 Bn
EBITDA
AED 1.9 Bn
Net Profit
AED 1.4 Bn
16 Projects launched
with a total value
of c. AED 8.9 Bn
c. 2,700 Units Delivered
c. over 32,000 Units
Under Construction
c. AED 37.6 Bn
Revenue Backlog 2
To be recognized over next 3-4 years
c. AED 6.3 Bn
Escrow Balance1
20 | EMAAR DEVELOPMENT
H1 2019 Key Highlights
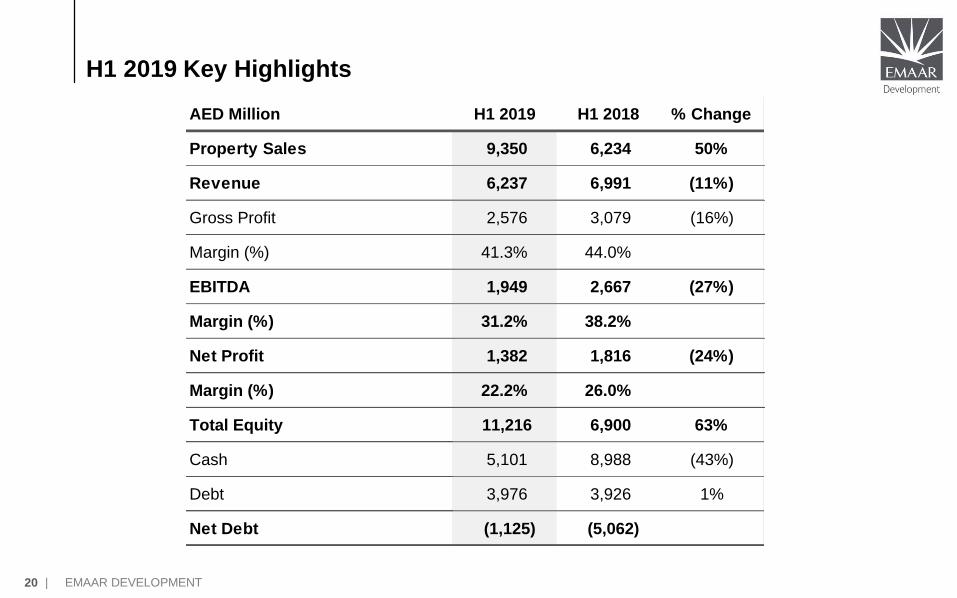
AED Million H1 2019 H1 2018 % Change
Property Sales 9,350 6,234 50%
Revenue 6,237 6,991 (11%)
Gross Profit 2,576 3,079 (16%)
Margin (%) 41.3% 44.0%
EBITDA 1,949 2,667 (27%)
Margin (%) 31.2% 38.2%
Net Profit 1,382 1,816 (24%)
Margin (%) 22.2% 26.0%
Total Equity 11,216 6,900 63%
Cash 5,101 8,988 (43%)
Debt 3,976 3,926 1%
Net Debt (1,125) (5,062)

21 | EMAAR DEVELOPMENT
Balance Sheet & Cash Flow Overview
15%
38%
44%
3%
1
Bank Balances &
Cash
Trade & Other
Receivables
Development
Properties
Loans & Investments
in Associates & JVs
Property, Plant &
Equipment
39%
14%
12%
2%
24%
9%
1
Trade & Other
Payables
Advances from
Customers
Interest Bearing Loans
& Borrowings
Other Liabilities
Shareholder's Equity
Non-Controlling
Interests
Total: AED 33,908 Mn
Balance Sheet Overview
Assets Liabilities &
Equity
Cash Flow Overview In AED Mn
6,789
5,061
(146) (117)
(1,465)
Dec-18 Cash& Cash
Equivalents
Operating CF Investing CF Financing CF Jun-19 Cash& Cash
Equivalents

22 | EMAAR DEVELOPMENT
# Based on launches till 30 June 2019
1) Sales value of units sold but not yet recognised as revenue under IFRS, including 100%
ownership of joint ventures as of 30 June 2019
2) Based on units sold which are under development as at 30 June 2019, margin is not necessarily
indicative of margin at completion
3) JVs/JDA numbers are on the basis of the full project and not proportional to Emaar’s share,
while Emaar’s entitlement/share of profits is 50%
Project Development Status / Overview
4) Emaar Beachfront launched in January 2018. In March 2018, an MOU with Aldar was signed to
jointly develop the project; formal agreement is under process
5) Includes Arabian Ranches III
* Details are based on current master plan as of 30 June 2019
@ BTL/ BTO are being developed on behalf of Emaar Properties PJSC for a management fee
Others
Downtown
Dubai
Arabian
Ranches 5
Dubai
Marina
Emirates
Living
Emaar
Beachfront 4
Dubai
Hills Mina Rashid
Dubai
Creek 3
Emaar
South 3
Ras Al Khaimah (100%
owned land bank);
Zabeel Square (JV with
60% share) 3
Total
Units # 9,100 1,713 843 137 1,572 8,247 172 7,427 2,868 In Planning Stage 32,079
Area (Mn sq. ft.) # 11.7 2.7 0.9 0.2 1.6 13.2 0.2 7.5 3.8 In Planning Stage 41.8
Value (AED Bn) 32.2 2.8 1.9 0.4 4.2 20.0 0.3 14.1 3.6 In Planning Stage 79.6
% Units Sold 94% 91% 98% 99% 69% 83% 37% 74% 83% In Planning Stage 84%
% Value Sold 88% 89% 97% 99% 63% 88% 37% 67% 78% In Planning Stage 83%
% Collected of sold units 45% 16% 52% 84% 20% 46% 7% 28% 27% In Planning Stage 41%
Revenue Backlog 1 16.4 2.5 1.0 0.0 2.7 6.0 0.1 7.0 1.9 In Planning Stage 37.6
Gross Margin Achieved 2 41% 30% 37% 29% 32% 47% 33% 30% 29% In Planning Stage 39%
Total Remaining GFA
(Million Sqf)2.4 16.3 - 0.2 7.4 55.0 11.3 101.3 30.1 3.5 227.5
Remaining GFA of Build-to-Lease
(BTL) / Build-to-Operate (BTO)(@
)
(Million Sqf)
0.5 0.1 - 0.0 0.7 13.7 0.2 24.3 3.0 0.4 43.0
Remaining GFA of Build-to-Sale
(BTS) (Million Sqf)2.0 16.2 - 0.2 6.7 41.3 11.1 77.0 27.1 3.1 184.5
100% Owned Developments JV/JDAs with 50% Share
Remaining GFA to be launched in future (*)
100% Consolidated JV
23 | EMAAR DEVELOPMENT
Annexure
24 | EMAAR DEVELOPMENT
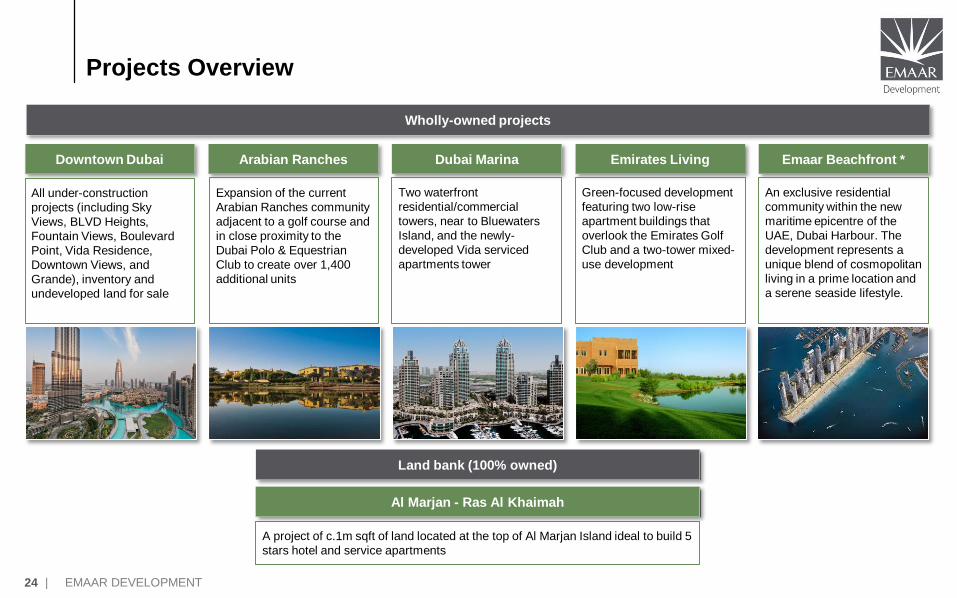
Projects Overview
Arabian Ranches
Expansion of the current
Arabian Ranches community
adjacent to a golf course and
in close proximity to the
Dubai Polo & Equestrian
Club to create over 1,400
additional units
Dubai Marina
Two waterfront
residential/commercial
towers, near to Bluewaters
Island, and the newly-
developed Vida serviced
apartments tower
Downtown Dubai
All under-construction
projects (including Sky
Views, BLVD Heights,
Fountain Views, Boulevard
Point, Vida Residence,
Downtown Views, and
Grande), inventory and
undeveloped land for sale
Wholly-owned projects
Emirates Living
Green-focused development
featuring two low-rise
apartment buildings that
overlook the Emirates Golf
Club and a two-tower mixed-
use development
Emaar Beachfront *
An exclusive residential
community within the new
maritime epicentre of the
UAE, Dubai Harbour. The
development represents a
unique blend of cosmopolitan
living in a prime location and
a serene seaside lifestyle.
Land bank (100% owned)
Al Marjan - Ras Al Khaimah
A project of c.1m sqft of land located at the top of Al Marjan Island ideal to build 5
stars hotel and service apartments

25 | EMAAR DEVELOPMENT
Projects Overview
100% Consolidated JV
Dubai Creek Harbour
Joint Venture between Emaar
and Dubai Holding for the
development of an iconic mixed-
use waterfront project situated
on the banks of the historic
Dubai Creek
Emaar South
Joint Venture between Emaar
and Dubai Aviation City
Corporation that is part of 145
sqkm smart city set to become a
pivotal hub in the global
economy, located within
Emirates’ flagship urban project,
Dubai South
Dubai Hills Estate
Joint Venture between Emaar
and Meraas Holding to create a
mixed-use development with a
series of unique neighbourhoods
set around an 18-hole
championship golf course
Zabeel Square
Joint venture between Emaar
and Meraas to create a mixed-
use development near Zabeel
Park, Dubai
JVs/JDAs with 50% share
Mina Rashid
Joint Venture between Emaar
and Mina Rashid Properties LLC
to develop Mina Rashid land into
a mixed-use community as per
the master plan. It will be known
as world’s new sailing
destination set by historic Dubai
Creek
26 | EMAAR DEVELOPMENT
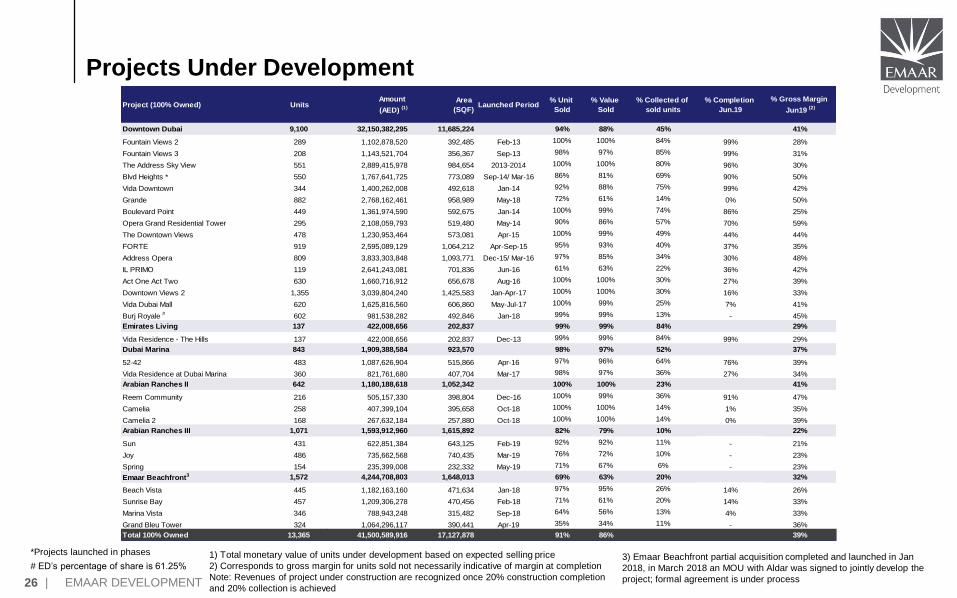
Projects Under Development
1) Total monetary value of units under development based on expected selling price
2) Corresponds to gross margin for units sold not necessarily indicative of margin at completion
Note: Revenues of project under construction are recognized once 20% construction completion
and 20% collection is achieved
*Projects launched in phases3) Emaar Beachfront partial acquisition completed and launched in Jan
2018, in March 2018 an MOU with Aldar was signed to jointly develop the
project; formal agreement is under process
# ED’s percentage of share is 61.25%
Project (100% Owned) UnitsAmount
(AED) (1)
Area
(SQF)Launched Period
% Unit
Sold
% Value
Sold
% Collected of
sold units
% Completion
Jun.19
% Gross Margin
Jun19 (2)
Downtown Dubai 9,100 32,150,382,295 11,685,224 94% 88% 45% 41%
Fountain Views 2 289 1,102,878,520 392,485 Feb-13 100% 100% 84% 99% 28%
Fountain Views 3 208 1,143,521,704 356,367 Sep-13 98% 97% 85% 99% 31%
The Address Sky View 551 2,889,415,978 984,654 2013-2014 100% 100% 80% 96% 30%
Blvd Heights * 550 1,767,641,725 773,089 Sep-14/ Mar-16 86% 81% 69% 90% 50%
Vida Downtown 344 1,400,262,008 492,618 Jan-14 92% 88% 75% 99% 42%
Grande 882 2,768,162,461 958,989 May-18 72% 61% 14% 0% 50%
Boulevard Point 449 1,361,974,590 592,675 Jan-14 100% 99% 74% 86% 25%
Opera Grand Residential Tower 295 2,108,059,793 519,480 May-14 90% 86% 57% 70% 59%
The Downtown Views 478 1,230,953,464 573,081 Apr-15 100% 99% 49% 44% 44%
FORTE 919 2,595,089,129 1,064,212 Apr-Sep-15 95% 93% 40% 37% 35%
Address Opera 809 3,833,303,848 1,093,771 Dec-15/ Mar-16 97% 85% 34% 30% 48%
IL PRIMO 119 2,641,243,081 701,836 Jun-16 61% 63% 22% 36% 42%
Act One Act Two 630 1,660,716,912 656,678 Aug-16 100% 100% 30% 27% 39%
Downtown Views 2 1,355 3,039,804,240 1,425,583 Jan-Apr-17 100% 100% 30% 16% 33%
Vida Dubai Mall 620 1,625,816,560 606,860 May-Jul-17 100% 99% 25% 7% 41%
Burj Royale # 602 981,538,282 492,846 Jan-18 99% 99% 13% - 45%
Emirates Living 137 422,008,656 202,837 99% 99% 84% 29%
Vida Residence - The Hills 137 422,008,656 202,837 Dec-13 99% 99% 84% 99% 29%
Dubai Marina 843 1,909,388,584 923,570 98% 97% 52% 37%
52-42 483 1,087,626,904 515,866 Apr-16 97% 96% 64% 76% 39%
Vida Residence at Dubai Marina 360 821,761,680 407,704 Mar-17 98% 97% 36% 27% 34%
Arabian Ranches II 642 1,180,188,618 1,052,342 100% 100% 23% 41%
Reem Community 216 505,157,330 398,804 Dec-16 100% 99% 36% 91% 47%
Camelia 258 407,399,104 395,658 Oct-18 100% 100% 14% 1% 35%
Camelia 2 168 267,632,184 257,880 Oct-18 100% 100% 14% 0% 39%
Arabian Ranches III 1,071 1,593,912,960 1,615,892 82% 79% 10% 22%
Sun 431 622,851,384 643,125 Feb-19 92% 92% 11% - 21%
Joy 486 735,662,568 740,435 Mar-19 76% 72% 10% - 23%
Spring 154 235,399,008 232,332 May-19 71% 67% 6% - 23%
Emaar Beachfront3 1,572 4,244,708,803 1,648,013 69% 63% 20% 32%
Beach Vista 445 1,182,163,160 471,634 Jan-18 97% 95% 26% 14% 26%
Sunrise Bay 457 1,209,306,278 470,456 Feb-18 71% 61% 20% 14% 33%
Marina Vista 346 788,943,248 315,482 Sep-18 64% 56% 13% 4% 33%
Grand Bleu Tower 324 1,064,296,117 390,441 Apr-19 35% 34% 11% - 36%
Total 100% Owned 13,365 41,500,589,916 17,127,878 91% 86% 39%
27 | EMAAR DEVELOPMENT
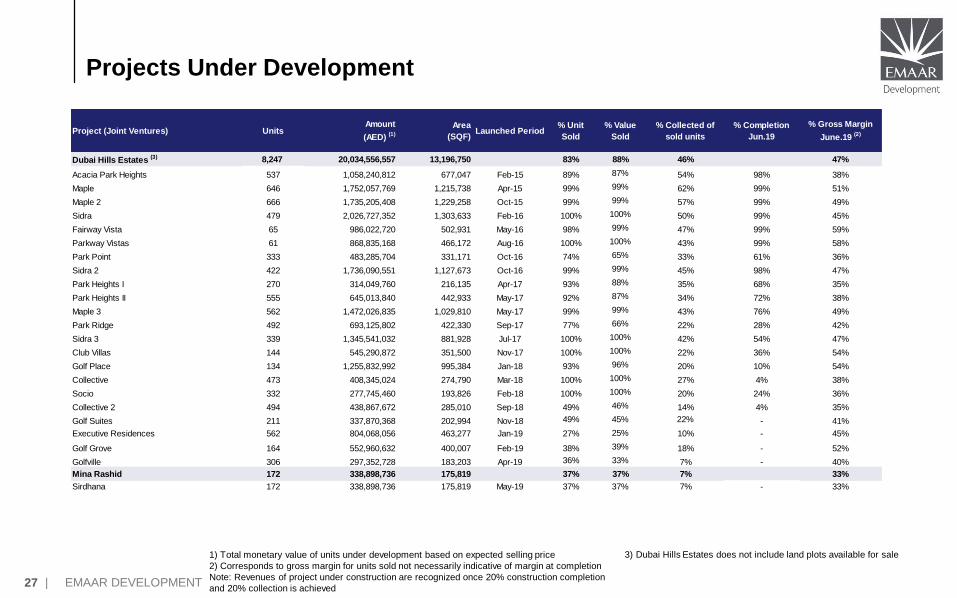
Projects Under Development
1) Total monetary value of units under development based on expected selling price
2) Corresponds to gross margin for units sold not necessarily indicative of margin at completion
Note: Revenues of project under construction are recognized once 20% construction completion
and 20% collection is achieved
Project (Joint Ventures) UnitsAmount
(AED) (1)
Area
(SQF)Launched Period
% Unit
Sold
% Value
Sold
% Collected of
sold units
% Completion
Jun.19
% Gross Margin
June.19 (2)
Dubai Hills Estates (3) 8,247 20,034,556,557 13,196,750 83% 88% 46% 47%
Acacia Park Heights 537 1,058,240,812 677,047 Feb-15 89% 87% 54% 98% 38%
Maple 646 1,752,057,769 1,215,738 Apr-15 99% 99% 62% 99% 51%
Maple 2 666 1,735,205,408 1,229,258 Oct-15 99% 99% 57% 99% 49%
Sidra 479 2,026,727,352 1,303,633 Feb-16 100% 100% 50% 99% 45%
Fairway Vista 65 986,022,720 502,931 May-16 98% 99% 47% 99% 59%
Parkway Vistas 61 868,835,168 466,172 Aug-16 100% 100% 43% 99% 58%
Park Point 333 483,285,704 331,171 Oct-16 74% 65% 33% 61% 36%
Sidra 2 422 1,736,090,551 1,127,673 Oct-16 99% 99% 45% 98% 47%
Park Heights I 270 314,049,760 216,135 Apr-17 93% 88% 35% 68% 35%
Park Heights II 555 645,013,840 442,933 May-17 92% 87% 34% 72% 38%
Maple 3 562 1,472,026,835 1,029,810 May-17 99% 99% 43% 76% 49%
Park Ridge 492 693,125,802 422,330 Sep-17 77% 66% 22% 28% 42%
Sidra 3 339 1,345,541,032 881,928 Jul-17 100% 100% 42% 54% 47%
Club Villas 144 545,290,872 351,500 Nov-17 100% 100% 22% 36% 54%
Golf Place 134 1,255,832,992 995,384 Jan-18 93% 96% 20% 10% 54%
Collective 473 408,345,024 274,790 Mar-18 100% 100% 27% 4% 38%
Socio 332 277,745,460 193,826 Feb-18 100% 100% 20% 24% 36%
Collective 2 494 438,867,672 285,010 Sep-18 49% 46% 14% 4% 35%
Golf Suites 211 337,870,368 202,994 Nov-18 49% 45% 22% - 41%
Executive Residences 562 804,068,056 463,277 Jan-19 27% 25% 10% - 45%
Golf Grove 164 552,960,632 400,007 Feb-19 38% 39% 18% - 52%
Golfville 306 297,352,728 183,203 Apr-19 36% 33% 7% - 40%
Mina Rashid 172 338,898,736 175,819 37% 37% 7% 33%
Sirdhana 172 338,898,736 175,819 May-19 37% 37% 7% - 33%
3) Dubai Hills Estates does not include land plots available for sale
28 | EMAAR DEVELOPMENT
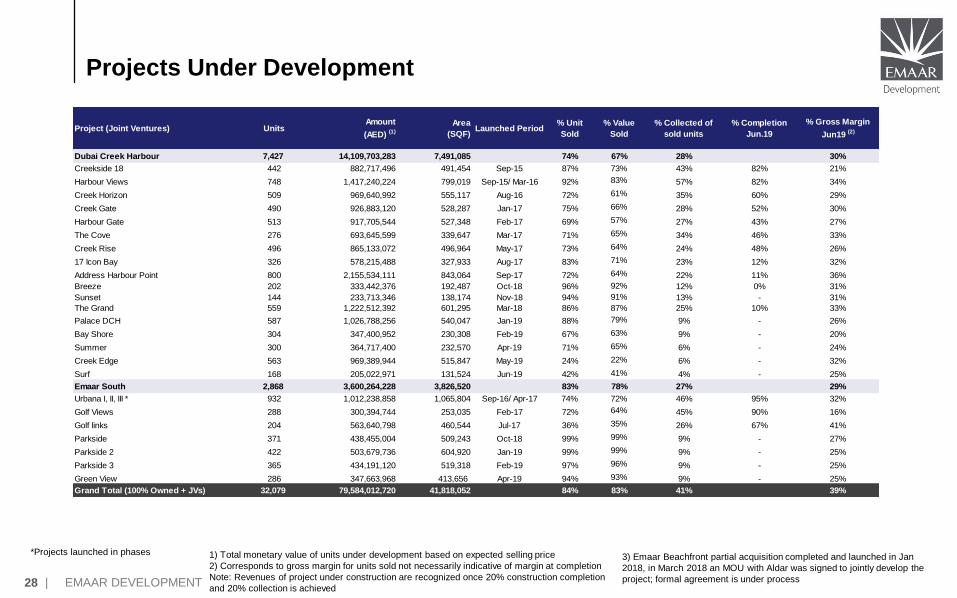
Projects Under Development
1) Total monetary value of units under development based on expected selling price
2) Corresponds to gross margin for units sold not necessarily indicative of margin at completion
Note: Revenues of project under construction are recognized once 20% construction completion
and 20% collection is achieved
*Projects launched in phases3) Emaar Beachfront partial acquisition completed and launched in Jan
2018, in March 2018 an MOU with Aldar was signed to jointly develop the
project; formal agreement is under process
Project (Joint Ventures) UnitsAmount
(AED) (1)
Area
(SQF)Launched Period
% Unit
Sold
% Value
Sold
% Collected of
sold units
% Completion
Jun.19
% Gross Margin
Jun19 (2)
Dubai Creek Harbour 7,427 14,109,703,283 7,491,085 74% 67% 28% 30%
Creekside 18 442 882,717,496 491,454 Sep-15 87% 73% 43% 82% 21%
Harbour Views 748 1,417,240,224 799,019 Sep-15/ Mar-16 92% 83% 57% 82% 34%
Creek Horizon 509 969,640,992 555,117 Aug-16 72% 61% 35% 60% 29%
Creek Gate 490 926,883,120 528,287 Jan-17 75% 66% 28% 52% 30%
Harbour Gate 513 917,705,544 527,348 Feb-17 69% 57% 27% 43% 27%
The Cove 276 693,645,599 339,647 Mar-17 71% 65% 34% 46% 33%
Creek Rise 496 865,133,072 496,964 May-17 73% 64% 24% 48% 26%
17 Icon Bay 326 578,215,488 327,933 Aug-17 83% 71% 23% 12% 32%
Address Harbour Point 800 2,155,534,111 843,064 Sep-17 72% 64% 22% 11% 36%
Breeze 202 333,442,376 192,487 Oct-18 96% 92% 12% 0% 31%
Sunset 144 233,713,346 138,174 Nov-18 94% 91% 13% - 31%
The Grand 559 1,222,512,392 601,295 Mar-18 86% 87% 25% 10% 33%
Palace DCH 587 1,026,788,256 540,047 Jan-19 88% 79% 9% - 26%
Bay Shore 304 347,400,952 230,308 Feb-19 67% 63% 9% - 20%
Summer 300 364,717,400 232,570 Apr-19 71% 65% 6% - 24%
Creek Edge 563 969,389,944 515,847 May-19 24% 22% 6% - 32%
Surf 168 205,022,971 131,524 Jun-19 42% 41% 4% - 25%
Emaar South 2,868 3,600,264,228 3,826,520 83% 78% 27% 29%
Urbana I, II, III * 932 1,012,238,858 1,065,804 Sep-16/ Apr-17 74% 72% 46% 95% 32%
Golf Views 288 300,394,744 253,035 Feb-17 72% 64% 45% 90% 16%
Golf links 204 563,640,798 460,544 Jul-17 36% 35% 26% 67% 41%
Parkside 371 438,455,004 509,243 Oct-18 99% 99% 9% - 27%
Parkside 2 422 503,679,736 604,920 Jan-19 99% 99% 9% - 25%
Parkside 3 365 434,191,120 519,318 Feb-19 97% 96% 9% - 25%
Green View 286 347,663,968 413,656 Apr-19 94% 93% 9% - 25%
Grand Total (100% Owned + JVs) 32,079 79,584,012,720 41,818,052 84% 83% 41% 39%

29 | EMAAR DEVELOPMENT
Location of Development Projects
Emaar Beachfront(1)
(1) Emaar Beachfront partial acquisition completed and launched in Jan 2018. In March 2018 an MOU with Aldar was signed to jointly develop the project; formal agreement is under process
(2) Not in the perimeter of Emaar Development PJSC
Arabian Ranches I & II
Mina Rashid
Arabian Ranches III

30 | EMAAR DEVELOPMENT
Expected Delivery Schedule
CompletedUnder
Development
Under Development Delivery Schedule
Already
delivered
in 2019
2019 2020 2021 2022 2023
-
A - Emaar Development (fully consolidated)
Downtown 11,723 9,100 646 2,391 773 3,832 2,104 -
Emaar Beachfront - 1,572 - - - 1,248 - 324
Dubai Marina 4,450 843 - - 483 360 - -
Arabian Ranches 4,360 - - - - - - -
Arabian Ranches II 1,022 642 108 216 - 426 - -
Arabian Ranches III - 1,071 - - - 431 640 -
Emirates Living (Excluding Land) 14,831 137 426 137 - - - -
Emaar Towers 168 - - - - - - -
Dubai Hills Estate 732 8,247 676 2,876 3,027 2,133 211 -
Umm Al Quwain 277 - - - - - - -
Mina Rashid - 172 - - - - 172 -
Total – A 37,563 21,784 1,856 5,620 4,283 8,430 3,127 324
B - Joint Ventures
Dubai Creek Harbour 872 7,427 872 - 3,474 976 2,977 -
Emaar South - 2,868 - - 1,424 371 1,073 -
Total – B 872 10,295 872 - 4,898 1,347 4,050 -
Total (A + B) 38,435 32,079 2,728 5,620 9,181 9,777 7,177 324
31 | EMAAR DEVELOPMENT
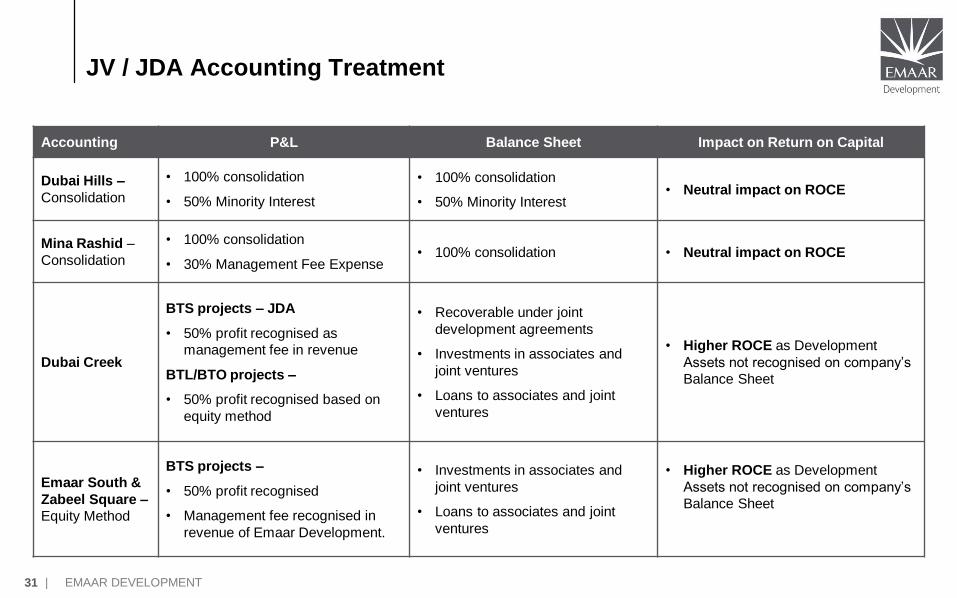
JV / JDA Accounting Treatment
Accounting P&L Balance Sheet Impact on Return on Capital
Dubai Hills –
Consolidation
• 100% consolidation
• 50% Minority Interest
• 100% consolidation
• 50% Minority Interest• Neutral impact on ROCE
Mina Rashid –
Consolidation
• 100% consolidation
• 30% Management Fee Expense• 100% consolidation • Neutral impact on ROCE
Dubai Creek
BTS projects – JDA
• 50% profit recognised as
management fee in revenue
BTL/BTO projects –
• 50% profit recognised based on
equity method
• Recoverable under joint
development agreements
• Investments in associates and
joint ventures
• Loans to associates and joint
ventures
• Higher ROCE as Development
Assets not recognised on company’s
Balance Sheet
Emaar South &
Zabeel Square –
Equity Method
BTS projects –
• 50% profit recognised
• Management fee recognised in
revenue of Emaar Development.
• Investments in associates and
joint ventures
• Loans to associates and joint
ventures
• Higher ROCE as Development
Assets not recognised on company’s
Balance Sheet
32 | EMAAR DEVELOPMENT
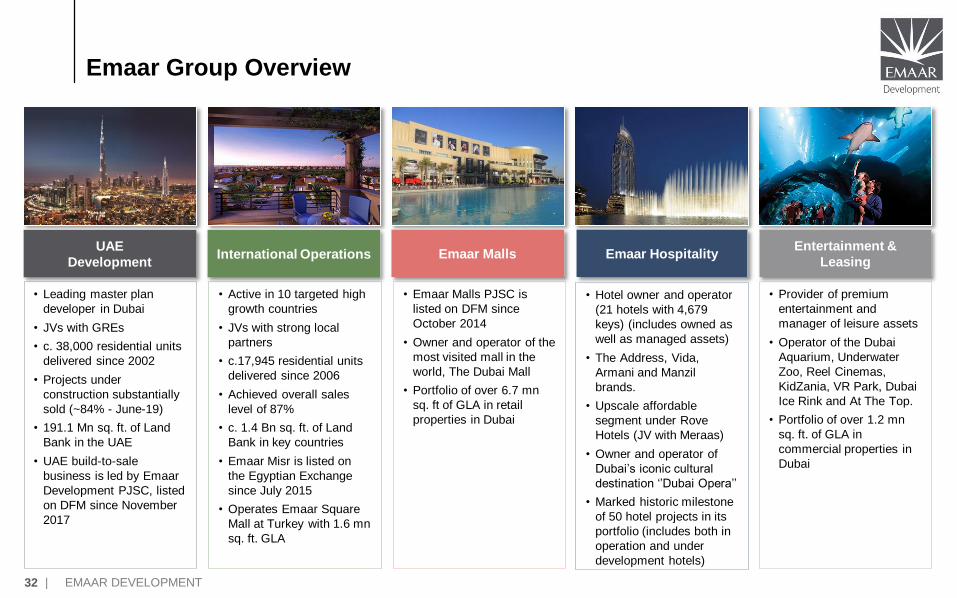
Emaar Group Overview
UAE
Development
• Leading master plan
developer in Dubai
• JVs with GREs
• c. 38,000 residential units
delivered since 2002
• Projects under
construction substantially
sold (~84% - June-19)
• 191.1 Mn sq. ft. of Land
Bank in the UAE
• UAE build-to-sale
business is led by Emaar
Development PJSC, listed
on DFM since November
2017
International Operations
• Active in 10 targeted high
growth countries
• JVs with strong local
partners
• c.17,945 residential units
delivered since 2006
• Achieved overall sales
level of 87%
• c. 1.4 Bn sq. ft. of Land
Bank in key countries
• Emaar Misr is listed on
the Egyptian Exchange
since July 2015
• Operates Emaar Square
Mall at Turkey with 1.6 mn
sq. ft. GLA
Emaar Malls
• Emaar Malls PJSC is
listed on DFM since
October 2014
• Owner and operator of the
most visited mall in the
world, The Dubai Mall
• Portfolio of over 6.7 mn
sq. ft of GLA in retail
properties in Dubai
Emaar Hospitality
• Hotel owner and operator
(21 hotels with 4,679
keys) (includes owned as
well as managed assets)
• The Address, Vida,
Armani and Manzil
brands.
• Upscale affordable
segment under Rove
Hotels (JV with Meraas)
• Owner and operator of
Dubai’s iconic cultural
destination ‘’Dubai Opera’’
• Marked historic milestone
of 50 hotel projects in its
portfolio (includes both in
operation and under
development hotels)
Entertainment &
Leasing
• Provider of premium
entertainment and
manager of leisure assets
• Operator of the Dubai
Aquarium, Underwater
Zoo, Reel Cinemas,
KidZania, VR Park, Dubai
Ice Rink and At The Top.
• Portfolio of over 1.2 mn
sq. ft. of GLA in
commercial properties in
Dubai
33 | EMAAR DEVELOPMENT
ThankYou
EMAAR DEVELOPMENT
Name – Abhay Singhvi
Email id - [email protected]
DICKENSON IR
Name – Aakash Mehta / Mehul Mehta
Email id – [email protected]


![[TRANSLATION FROM ARABIC] Emaar Properties PJSC Corporate ...](https://static.documents.pub/doc/80x56/61f0e875ec66ee0e72497ec3/translation-from-arabic-emaar-properties-pjsc-corporate-.jpg)


