18
EMAAR MALLS PJSC Q2 2017 RESULTS 15 August 2017

EMAAR MALLS PJSC
Q2 2017 RESULTS15 August 2017

218 May 2017Q2 2017 RESULTS15 August 2017 2
DISCLAIMER
Emaar Malls PJSC (EM) gives notice that: The particulars of this presentation do not constituteany part of an offer or a contract.
Given that the presentation contains information based on forecasts and roll outs, allstatements contained in this presentation are made without responsibility on the part of EmaarMalls PJSC, its advisors (including their directors, officers and employees).
None of the statements contained in this presentation is to be relied upon as a statement orrepresentation of fact.
All parties must satisfy themselves as to the correctness of each of the statements contained inthis presentation.
Emaar Malls PJSC does not make or give, and none of it directors or officers or persons in theiremployment or advisors has any authority to make or give, any representation or warrantywhatsoever in relation to this presentation.
This presentation may not be stored, copied, distributed, transmitted, retransmitted orreproduced, in whole or in part, in any form or medium without the permission of Emaar MallsPJSC

318 May 2017Q2 2017 RESULTS15 August 2017 3
TABLE OF CONTENTS
• Highlights 4
• Vision and strategy 5
• Financial results 6
• Portfolio 7
• Portfolio results 8 - 9
• Rental income 10
• Key strengths 11 - 12
• Lease renewal status 13
• Development pipeline 14
• The Dubai Mall expansions 15
• Financial highlights 16
• Balance sheet and key ratios 17
418 May 2017Q2 2017 RESULTS15 August 2017 4
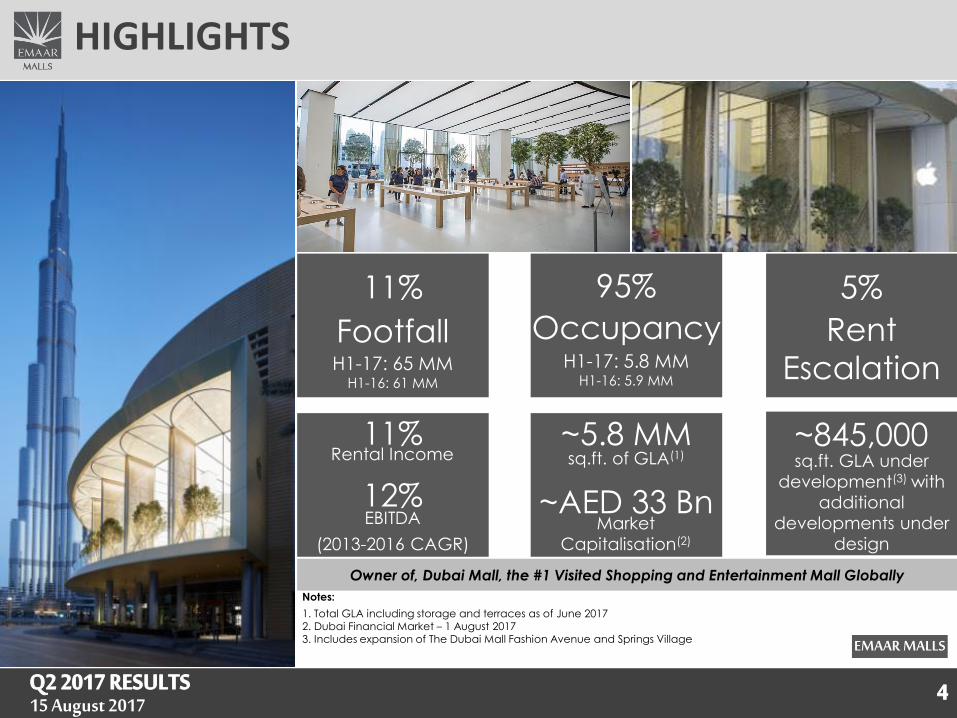
Owner of, Dubai Mall, the #1 Visited Shopping and Entertainment Mall Globally
EMAAR MALLS
HIGHLIGHTS
Notes:
1. Total GLA including storage and terraces as of June 20172. Dubai Financial Market – 1 August 20173. Includes expansion of The Dubai Mall Fashion Avenue and Springs Village
~AED 33 BnMarket
Capitalisation(2)
~5.8 MMsq.ft. of GLA(1)
H1-17: 65 MM H1-16: 61 MM
H1-17: 5.8 MMH1-16: 5.9 MM
Occupancy
11% Rental Income
12%EBITDA
~845,000sq.ft. GLA under
development(3) with
additional
developments under
design
Footfall
11% 95%
(2013-2016 CAGR)
Rent
Escalation
5%

55Q2 2017 RESULTS15 August 2017
Our VisionTo create world class malls delivering memorable experiences
123
Protect and Grow Portfolio in Local Market
Expand Internationally
Innovate and Lead Transition to Next
Generation Mall
Strategy

618 May 2017Q2 2017 RESULTS15 August 2017 6
FINANCIAL RESULTS
Track Record of Double Digit Top Line GrowthTotal Rental Income for the year/period
AED MM 11%
EBITDA Margin
Consistently Improving EBITDAEBITDA for the year/period
AED MM
CAGR
Net IncomeProfit for the Year/period
AED MM19%
Main Units GLA (‘000 sq.ft.)
Strong Value Creation Through Rental Growth and Cost Optimization
12%
2,386 2,694
2,992 3,227
1,618 1,624
2013 2014 2015 2016 H1 2016 H1 2017
5,4195,4235,295 5,371 5,425 5,340
1,7302,018
2,2502,447
1,270 1,304
2013 2014 2015 2016 H1 2016 H1 2017
73% 75% 75% 76% 78% 80%
1,0991,351
1,6561,874
987 1,021
2013 2014 2015 2016 H1 2016 H1 2017
46% 50% 55% 58% 61% 63%
5,423
Net Income Margin

718 May 2017Q2 2017 RESULTS15 August 2017 7
PORTFOLIO
Super Regional Malls
Regional Malls
Specialty Retail
Community Integrated Retail
Division Assets
Dubai Marina Mall (including Pier 7)
The Dubai Mall
Souk Al Bahar, fine dining destination with views on the Dubai Fountain
and Burj Khalifa
Gold & Diamond Park, only dedicated gold & diamond mall in Dubai
Mohammed bin Rashid Boulevard Retail
Dubai Marina Retail
Shopping centres in Emaar residential developments
Broad Product Offering Complementing the Dubai Mall
GLA(1)
420
3,632(2)
735
1,014
Notes:
1. Total GLA (‘000 sq.ft.) including storage and terrace, as of June 20172. Compared to Q2-16 of 3,711 Sq. ft. due to tenants repositioning in preparation for Fashion Avenue opening
Emaar Malls 5,801
818 May 2017Q2 2017 RESULTS15 August 2017 8
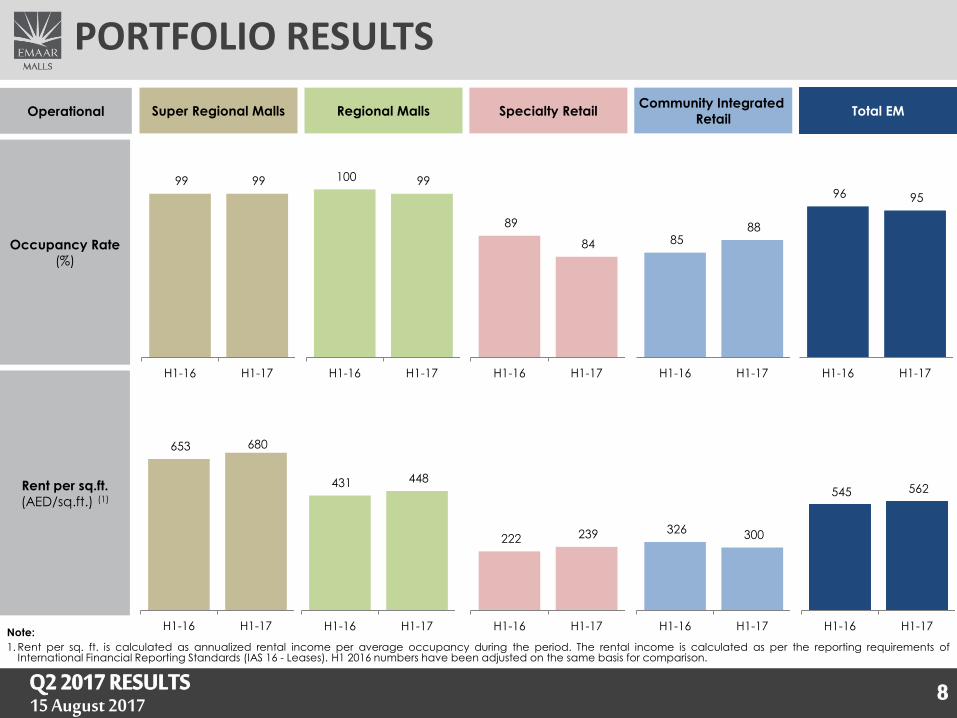
653 680
H1-16 H1-17
Rent per sq.ft.
(AED/sq.ft.) (1)
326 300
H1-16 H1-17
222 239
H1-16 H1-17
545 562
H1-16 H1-17
PORTFOLIO RESULTS
Operational Regional MallsSuper Regional MallsCommunity Integrated
RetailSpecialty Retail Total EM
99 99
H1-16 H1-17
100 99
H1-16 H1-17
Occupancy Rate
(%)
85 88
H1-16 H1-17
89
84
H1-16 H1-17
96 95
H1-16 H1-17
431 448
H1-16 H1-17Note:
1. Rent per sq. ft. is calculated as annualized rental income per average occupancy during the period. The rental income is calculated as per the reporting requirements ofInternational Financial Reporting Standards (IAS 16 - Leases). H1 2016 numbers have been adjusted on the same basis for comparison.

918 May 2017Q2 2017 RESULTS15 August 2017 9
1,618 1,624
H1-16 H1-17
PORTFOLIO RESULTS (CONT’D)
Rental Income
(AED MM)
1,318 1,332
H1-16 H1-17
95 94
H1-16 H1-17
EBITDA
Margin
(%)
84 84
H1-16 H1-17
81 80
H1-16 H1-17
129 122
H1-16 H1-17
77 74
H1-16 H1-17
76 76
H1-16 H1-17
79 81
H1-16 H1-17
78 80
H1-16 H1-17
Operational Regional MallsSuper Regional MallsCommunity Integrated
RetailSpecialty Retail Total EM

1018 May 2017Q2 2017 RESULTS15 August 2017 10
67%72%
7%4%
12% 12%
13% 12%
H1 2016 H1 2017
1
2
3
4
Base rent Service and other charges
1
2
3
Other rental income(2)
4
Net turnover rent
EM Revenue Growth Driven by Base Rent Escalation and Net Effective Rent
Contractual base rent
escalation of typically
7%(1)&(2) per annum
Net turnover rent based
on percentage of tenants
sales
Service charges
recovered from tenants
(c.75% in H1 2017)(3)
Other rental income(2)&(4)
RENTAL INCOME
Notes:1. The Dubai Mall and Dubai Marina Mall2. Increase in H1- 2016 contractual base rent and decrease in H1-2016 other rental income is due to reporting requirements of International Financial Reporting Standards (IAS 17 –
Leases).3. Overall portfolio4. Derived primarily from the payment of store design fit-out fees, late opening penalties, interest charges on deferred payments and certain admin charges, and income from the
leasing of storage units and terraces, specialty leasing and multimedia sales
63%66% 67%
12%8%
7%11%
12%12%14%
14%14%
2,694
2,992
3,227
2014 2015 2016
11%
8%
1,6181,624
1118 May 2017Q2 2017 RESULTS15 August 2017 11
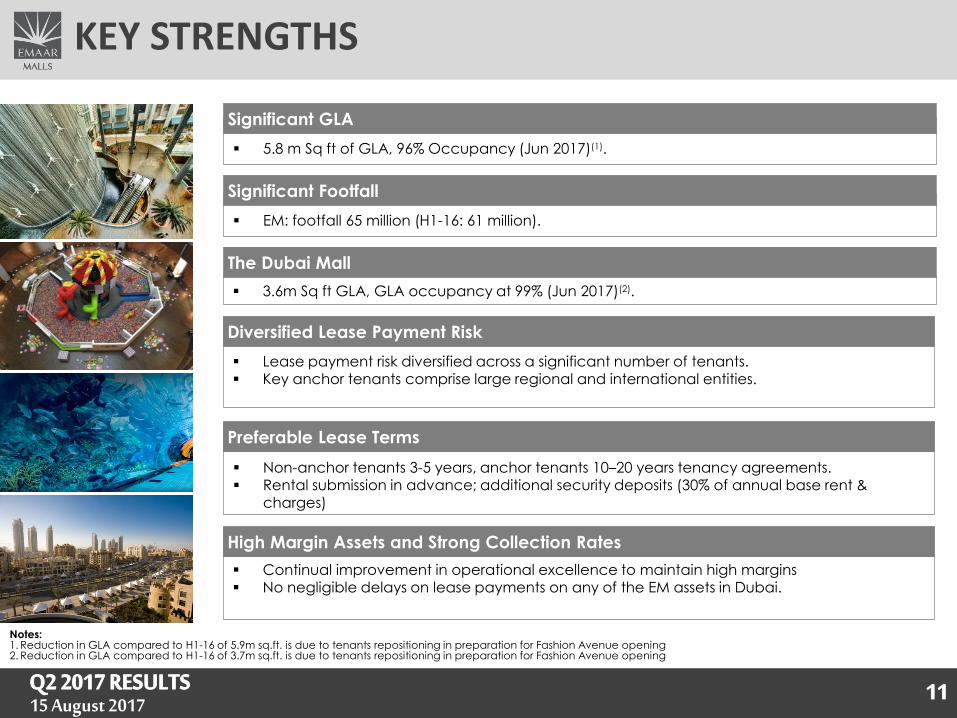
Significant GLA
▪ 5.8 m Sq ft of GLA, 96% Occupancy (Jun 2017)(1).
▪ EM: footfall 65 million (H1-16: 61 million).
Significant Footfall
▪ 3.6m Sq ft GLA, GLA occupancy at 99% (Jun 2017)(2).
The Dubai Mall
▪ Continual improvement in operational excellence to maintain high margins▪ No negligible delays on lease payments on any of the EM assets in Dubai.
▪ Non-anchor tenants 3-5 years, anchor tenants 10–20 years tenancy agreements. ▪ Rental submission in advance; additional security deposits (30% of annual base rent &
charges)
▪ Lease payment risk diversified across a significant number of tenants.▪ Key anchor tenants comprise large regional and international entities.
Diversified Lease Payment Risk
Preferable Lease Terms
High Margin Assets and Strong Collection Rates
KEY STRENGTHS
Notes:1. Reduction in GLA compared to H1-16 of 5.9m sq.ft. is due to tenants repositioning in preparation for Fashion Avenue opening2. Reduction in GLA compared to H1-16 of 3.7m sq.ft. is due to tenants repositioning in preparation for Fashion Avenue opening
1218 May 2017Q2 2017 RESULTS15 August 2017 12
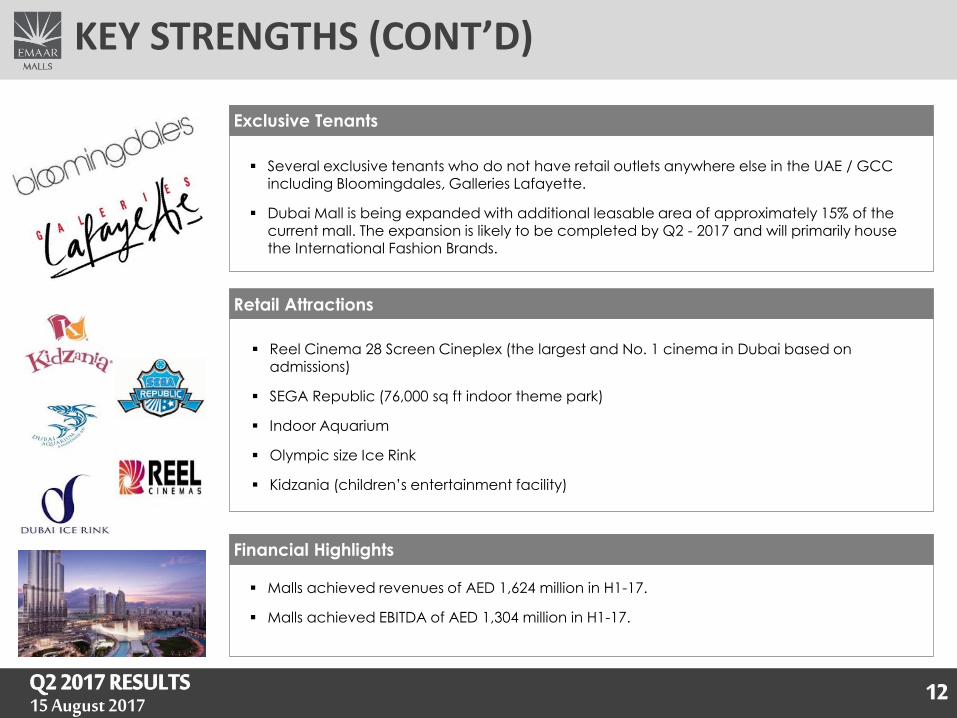
Exclusive Tenants
▪ Several exclusive tenants who do not have retail outlets anywhere else in the UAE / GCC including Bloomingdales, Galleries Lafayette.
▪ Dubai Mall is being expanded with additional leasable area of approximately 15% of the current mall. The expansion is likely to be completed by Q2 - 2017 and will primarily house the International Fashion Brands.
Retail Attractions
▪ Reel Cinema 28 Screen Cineplex (the largest and No. 1 cinema in Dubai based on admissions)
▪ SEGA Republic (76,000 sq ft indoor theme park)
▪ Indoor Aquarium
▪ Olympic size Ice Rink
▪ Kidzania (children’s entertainment facility)
Financial Highlights
▪ Malls achieved revenues of AED 1,624 million in H1-17.
▪ Malls achieved EBITDA of AED 1,304 million in H1-17.
KEY STRENGTHS (CONT’D)

1318 May 2017Q2 2017 RESULTS15 August 2017 13
Lease Expiry Schedule% of leased main unit GLA due to be expiring in the forthcoming years (as of 30-Jun-2017)
Significant waitlist allows EM to actively manage its tenant base
Healthy wait list of retailers across all properties
Favorable standard lease terms
Lack of early tenant termination clause
Tenant does not have the option of renewal
Post-dated cheques covering base rent +
charges(1)
No rent free period in The Dubai Mall and Marina
Mall(2)
Most leases on 3-5 year terms to give EM more flexibility in managing tenants
Notes:1. Overall portfolio2. Excluding Pier 7
Attractive Renewal Terms Achieved in H1-2017Active Tenant Management
Significant Upside Witnessed from Strong Increase in Renewal Rates
LEASE RENEWAL STATUS
17
25 27
12 9 10
2017 2018 2019 2020 2021 >2022
Base Rent Increase: For the leases expiring in 2017,
base rent increase of 13% achieved over the
previous lease term
Lease Renewal: During H1 2017, 56% of the leases
(in terms of GLA) expiring during the year 2017
have been already renewed.

1418 May 2017Q2 2017 RESULTS15 August 2017 14
<20%of GAV
Up to 100%Extension
Project NameGLA
(sq.ft.)Expected
Opening Date
Pre-leasing(%)
TDM Fashion Avenue
Expansion~600,000 H2 201780%
Springs Village ~245,000 H1-201876%
Under Development ~845,000
The Dubai Mall Fashion expansion
Anticipated grand opening during H2 2017
Targeted tenancy mix: mostly high end fashion, high end jewellery and food and beverage units
Leasing Status:
- Executed lease against ~ 65% of GLA
- Confirmed offers for ~15% of GLA
EM expects 90%+ of the Fashion Expansion to be pre-leased prior to opening
Targeted Weight of EM Development Pipeline vs. Total Portfolio
Extensions vs. Greenfield Under DevelopmentIn % of GLA
Overview of Pipeline
Significant Upside Through Expansion and New Developments
DEVELOPMENT PIPELINE

1518 May 2017Q2 2017 RESULTS15 August 2017 15
THE DUBAI MALL - EXPANSIONS
1
2
3
4
Fashion Avenue Expansion1.
Zabeel Expansion
(including car park)
2.
Boulevard Expansion3.
Fountain View Expansion
(including car park)
4.
1618 May 2017Q2 2017 RESULTS15 August 2017 16
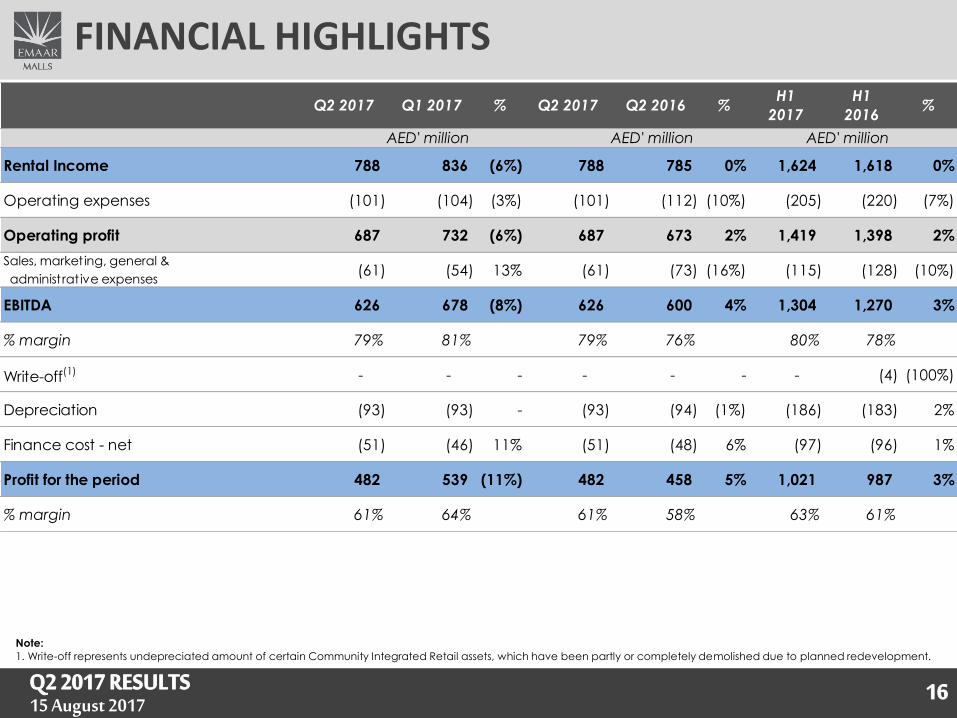
Rental Income 788 836 (6%) 788 785 0% 1,624 1,618 0%
Operating expenses (101) (104) (3%) (101) (112) (10%) (205) (220) (7%)
Operating profit 687 732 (6%) 687 673 2% 1,419 1,398 2%
Sales, marketing, general &
administrat ive expenses(61) (54) 13% (61) (73) (16%) (115) (128) (10%)
EBITDA 626 678 (8%) 626 600 4% 1,304 1,270 3%
% margin 79% 81% 79% 76% 80% 78%
Write-off(1) - - - - - - - (4) (100%)
Depreciation (93) (93) - (93) (94) (1%) (186) (183) 2%
Finance cost - net (51) (46) 11% (51) (48) 6% (97) (96) 1%
Profit for the period 482 539 (11%) 482 458 5% 1,021 987 3%
% margin 61% 64% 61% 58% 63% 61%
%Q2 2017 Q1 2017 % Q2 2017
AED' million AED' million
%H1
2017
H1
2016Q2 2016
AED' million
FINANCIAL HIGHLIGHTS
Note:
1. Write-off represents undepreciated amount of certain Community Integrated Retail assets, which have been partly or completely demolished due to planned redevelopment.
1718 May 2017Q2 2017 RESULTS15 August 2017 17
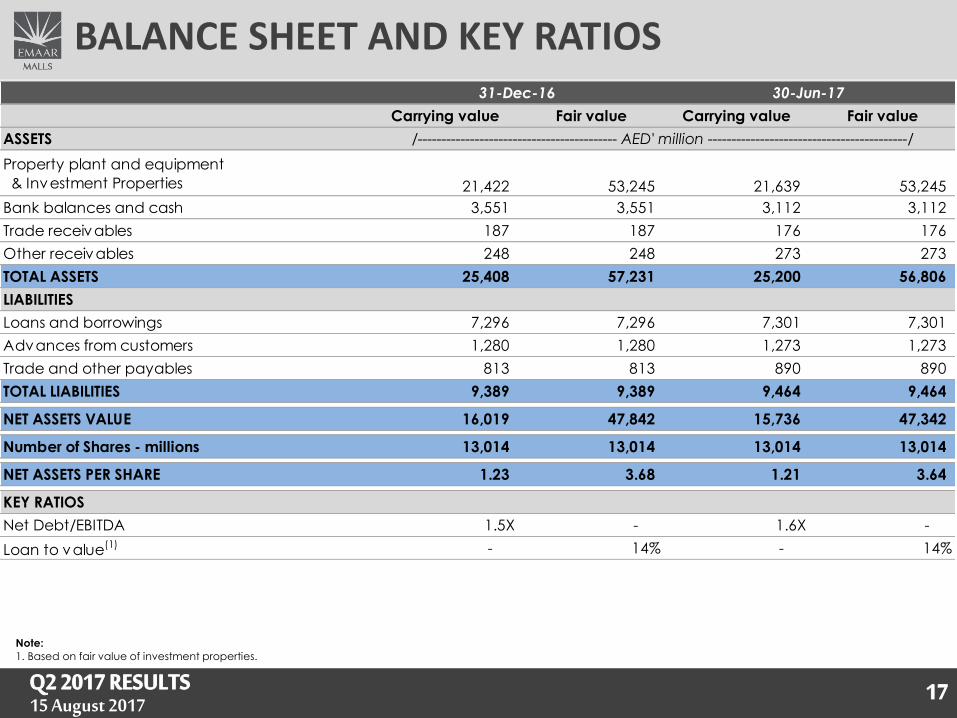
Carrying value Fair value Carrying value Fair value
ASSETS
Property plant and equipment
& Investment Properties 21,422 53,245 21,639 53,245
Bank balances and cash 3,551 3,551 3,112 3,112
Trade receivables 187 187 176 176
Other receivables 248 248 273 273
TOTAL ASSETS 25,408 57,231 25,200 56,806
LIABILITIES
Loans and borrowings 7,296 7,296 7,301 7,301
Advances from customers 1,280 1,280 1,273 1,273
Trade and other payables 813 813 890 890
TOTAL LIABILITIES 9,389 9,389 9,464 9,464
NET ASSETS VALUE 16,019 47,842 15,736 47,342
Number of Shares - millions 13,014 13,014 13,014 13,014
NET ASSETS PER SHARE 1.23 3.68 1.21 3.64
KEY RATIOS
Net Debt/EBITDA 1.5X - 1.6X -
Loan to value(1) - 14% - 14%
/------------------------------------------ AED' million ------------------------------------------/
31-Dec-16 30-Jun-17
BALANCE SHEET AND KEY RATIOS
Note:
1. Based on fair value of investment properties.

18Q2 2017 RESULTS15 August 2017
شكرا


![DUBAI CREEK HARBOUR - Emaar Properties PJSC | … Creek Harbour: The Cove Visualization - Docklands I Entrance Lobby [Block D] Latest Version For more information on The COVE in Dubai](https://static.documents.pub/doc/80x56/5afe6bbf7f8b9a814d8f0182/dubai-creek-harbour-emaar-properties-pjsc-creek-harbour-the-cove-visualization.jpg)