28
Emerging Markets 2nd quarter 2009 Turnaround! Source: www.pixelio.de

8/14/2019 Emerging Markets (English Version)
http://slidepdf.com/reader/full/emerging-markets-english-version 1/28
Emerging Markets
2nd quarter 2009
Turnaround!
Source: www.pixelio.de

8/14/2019 Emerging Markets (English Version)
http://slidepdf.com/reader/full/emerging-markets-english-version 2/28
2
Content
Introduction - Emerging Markets - Further outperforming? 3
Investment strategy 4
Asia
Latin America 8
South Africa 10
Charts and tables:
Economics 12
Fixed income 16Chartbook FX 18
Equity markets 20
Risk indicators 22
Technical analysis 24
Correlations 26
Abbreviations 27
Asia: China, India, South Korea, Taiwan, Singapore, Thailand, Malaysia, Philippines, IndonesiaLatin America: Argentina, Brazil, Chile, Colombia, Mexico, Paraguay, Venezuela
Africa and Middle East (MEA); Bahrain, Iran, Iraq, Israel, Yemen, Qatar, Kuwait, Libya, Saudi Arabia, Syria, United Arab Emirates (UAE),Middle- and Eastern European Countries (CEE): Poland, Slovakia, Czech Republic, Hungary
Emerging Markets Content

8/14/2019 Emerging Markets (English Version)
http://slidepdf.com/reader/full/emerging-markets-english-version 3/28
3
Introduction
Equity market performance in the Emerging Marketssince the beginning of the year has been substan-tially better than in the established markets. At thesame time, the currencies in the markets we coverhave been able to strengthen versus the US dollar,and exceptionally strong gains have also been regis-tered on the local bond markets and on Eurobonds.On the one hand, the Emerging Markets are profitingfrom the general relief as market participants beginto grasp that the economic system has survived thiscrisis and that the likelihood of a deep, long depres-sion has declined. On the other hand, the economicdata from the Emerging Markets has also been sur-
prisingly positive. For example, in China there areclear-cut signs of a relatively rapid recovery in eco-nomic activity, and Brazil’s performance has alsobeen more robust than expected so far. Against thisbackdrop, more portfolio investment is flowing intothe EM financial markets again, and commodityprices have also bounced back.
The main risk continues to be the necessary processof deleveraging in the financial sector. As the IMFnotes in its April issue of the Global Financial Stabil-ity Report, Asia requires about 9% of GDP for exter-
nal financing in 2009, and the figure is around 8%for Latin America. While the banks in both regionsare not critically affected by write-downs on assetbacked securities and generally exhibit relatively lowlevels of leverage, there have been tangible impactsfrom the increase in default rates stemming from theeconomic crisis. Furthermore, the countries are grap-pling with a decline in direct investment, both in thebanking sector and in other sectors of the economyas well. Financing opportunities for small and me-dium-sized enterprises in the Emerging Markets alsocontinue to be very limited, and default rates are setto rise.
At the same time, in respect the markets covered inthis publication – China, India, Brazil, Mexico andSouth Africa – only China has the ability to massivelysupport domestic demand using public funds. Whileall of the other countries have also passed fiscal pack-ages, these pale in comparison to China’s actions.Over the longer term, past and future rate cuts havea positive effect, along with levels of food prices,which are hovering at relatively low levels.
Although we remain optimistic for the longer term,
over the medium term we foresee a correction occur-ring on the equity markets.Veronika Lammer
0
5,00010,000
15,000
20,000
25,000
30,000
Mar-04 Mar-05 Mar-06 Mar-07 Mar-08 Mar-09
Asia Latin America
CE MEA
Total
EM-Bondfunds holdings
In USD mnSource: EmergingPortfolio.com
Emerging Markets Further outperforming?
40
60
80
100
120
Jan-08 Apr-08 Jul-08 Oct-08 Jan-09 Apr-09
MSCI EM AsiaMSCI EM Latin America
MSCI EM Middle East / Africa
EM equity performance of regions
Source: Thomson Financial Datastream, Raiffeisen RESEARCH
0
1
2
3
4
5
6
US JP DE CN IN KR TH ZA AR BR MX
Fiscal packages in % of GDP
Excl. off budget measuresSource: OECD, Credit Suisse, Raiffeisen RESEARCH

8/14/2019 Emerging Markets (English Version)
http://slidepdf.com/reader/full/emerging-markets-english-version 4/28
4
Investment strategy
Latin America: 22%[+0 PP]
CEE: 9% [-5 PP]
Asia: 55% [+0 PP]
Africa & Middle East:14% [+5 PP]
Investment strategy - equity markets*
* Benchmark: current MSCI EM weightingsSource: Thomson Financial Datastream, Raiffeisen RESEARCH
In retrospect: Emerging Markets have performed very well in recent months: Latin America achievedthe best performance, ahead of Asia and EMEA.
The investment recommendation for Braziliangovernment bonds resulted in a performance of 35% and the investment recommendation for Mexican government bonds brought in +12% .
Modest outperformance by our EM portfolio inQ4
New weighting for the next 3 months: Withinthe regional portfolio, we underweight EasternEurope, overweight Africa and weight Latin America and Asia neutral. Taking a longer-term
perspective (> 1 year), we would overweight theEmerging Markets compared to established mar-kets at any rate.
The expanded range of protection offered by thespecial IMF programmes is generally positive forthe Emerging Markets. Regional developmentbanks are also offering cross-border funds for thefirst time.
Asia: overweight China over the long run
China and India have seen good performance inrecent months. HSCE and Sensex are dependenton international risk sentiment.
Over the short term, the markets are showing some fatigue and the good data is hard to top.
Valuations have risen sharply again A correction can be expected Using corrections to build up long-term invest-
ments in the countries China and India ADB and IMF are extending their safety nets;
exploit risk premia for investment in EUR -denominated bonds.
Latin America – bonds show potential in 2009
Economic activity stabilised in Brazil in Q1 2009(Q1e: -1.5% yoy), whereas the economic situ-ation continued to deteriorate in Mexico (Q1e:-4.5% yoy).
Positive growth expected as early as Q2 in Brazil,and from H2 in Mexico.
Inflation is stubbornly high in Mexico , but ratesshould subside after the currency stabilises. Brazil: inflation is dropping faster .
End of the rate-cutting cycle should be reached by the end of the summer. Interest rates to remainsteady until early 2010.
Equities - performance overview in Euro in % 1 week 1 month 1 year MSCI Eastern Europe 10.7 18.0 -53.9MSCI Asia 6.6 18.0 -25.5MSCI Latin America 11.0 16.6 -32.7S&P Composite 4.1 6.3 -23.4Germany 3.0 9.4 -29.8Austria 13.8 15.4 -50.3Egypt 0.1 5.8 -55.5Argentina 15.7 24.8 -30.6Brazil 11.5 15.6 -31.5Bulgaria 6.9 26.8 -66.4Chile 9.5 12.0 -4.5China 4.3 5.2 -5.7
India 4.2 9.5 -34.0Indonesia 7.7 35.8 -26.4Israel 4.2 7.0 -23.2Colombia 9.1 16.1 -15.8Malaysia 3.1 9.6 -16.9Mexico 14.4 15.3 -27.6Pakistan -2.6 -8.1 -52.4Peru 14.1 18.2 -29.4Philippines 7.2 7.7 -17.0Poland 2.9 3.0 -52.2Romania 10.5 15.5 -57.5Russia 10.7 12.4 -53.0South Africa 5.4 9.4 -31.4
South Korea 4.3 9.8 -25.8Taiwan 8.2 14.1 -20.5Thailand 6.7 15.7 -34.6Czech Republic 11.3 15.0 -43.8Turkey 3.8 11.7 -27.7Hungary 15.0 17.3 -43.8Venezuela -1.7 -0.7 32.9Source: Thomson Financial Datastream, Raiffeisen RESEARCH
Investment strategy Corrections ahead
8/14/2019 Emerging Markets (English Version)
http://slidepdf.com/reader/full/emerging-markets-english-version 5/28
5
Investment strategy
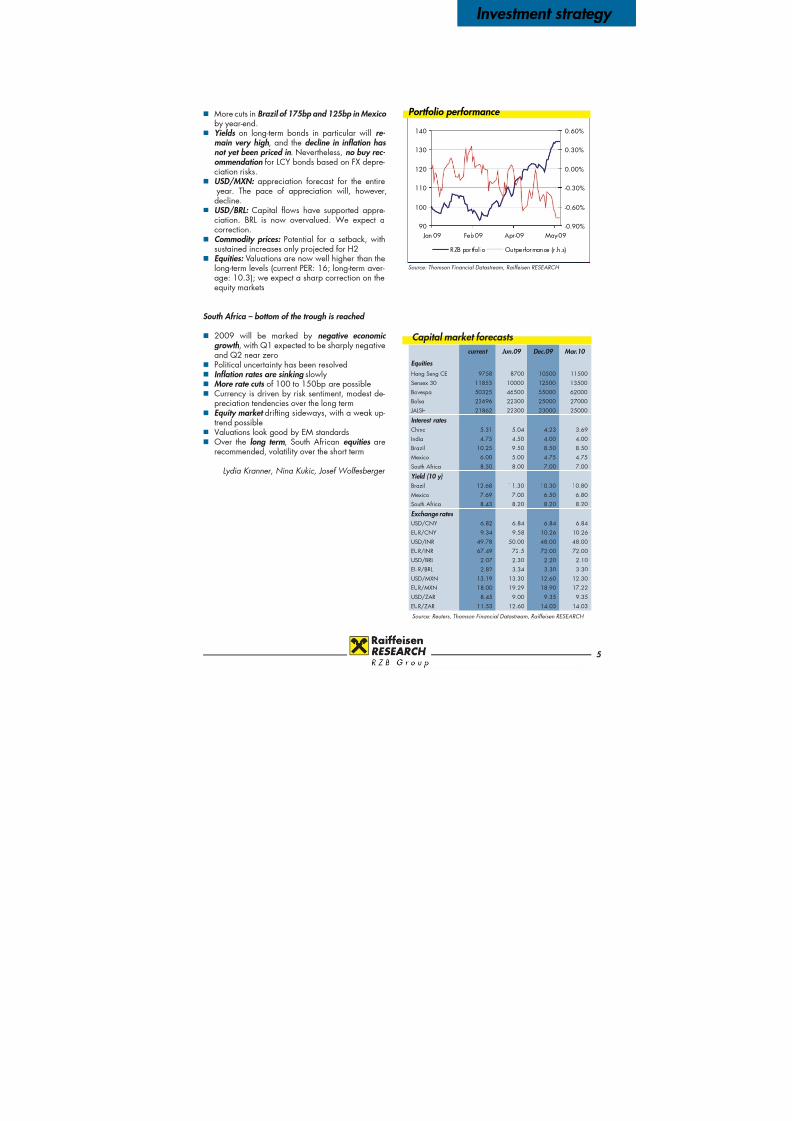
More cuts in Brazil of 175bp and 125bp in Mexico by year-end.
Yields on long-term bonds in particular will re- main very high, and the decline in inflation has not yet been priced in. Nevertheless, no buy rec- ommendation for LCY bonds based on FX depre-ciation risks.
USD/MXN: appreciation forecast for the entire year. The pace of appreciation will, however,decline.
USD/BRL: Capital flows have supported appre-ciation. BRL is now overvalued. We expect acorrection.
Commodity prices: Potential for a setback, withsustained increases only projected for H2
Equities: Valuations are now well higher than thelong-term levels (current PER: 16; long-term aver-age: 10.3); we expect a sharp correction on theequity markets
South Africa – bottom of the trough is reached
2009 will be marked by negative economic growth, with Q1 expected to be sharply negative
and Q2 near zero Political uncertainty has been resolved Inflation rates are sinking slowly More rate cuts of 100 to 150bp are possible Currency is driven by risk sentiment, modest de-
preciation tendencies over the long term Equity market drifting sideways, with a weak up-
trend possible Valuations look good by EM standards Over the long term, South African equities are
recommended, volatility over the short term
Lydia Kranner, Nina Kukic, Josef Wolfesberger
90
100
110
120
130
140
Jan-09 Feb-09 Apr-09 May-09
-0.90%
-0.60%
-0.30%
0.00%
0.30%
0.60%
RZB por tfol io Outperformance (r .h.s)
Portfolio performance
Source: Thomson Financial Datastream, Raiffeisen RESEARCH
Capital market forecasts current Jun.09 Dec.09 Mar.10
Equities
Hang Seng CE 9758 8700 10500 11500
Sensex 30 11853 10000 12500 13500
Bovespa 50325 46500 55000 62000
Bolsa 23696 22300 25000 27000
JALSH 21862 22300 23000 25000
Interest rates China 5.31 5.04 4.23 3.69
India 4.75 4.50 4.00 4.00
Brazil 10.25 9.50 8.50 8.50
Mexico 6.00 5.00 4.75 4.75
South Africa 8.50 8.00 7.00 7.00
Yield (10 y)Brazil 12.68 11.30 10.30 10.80
Mexico 7.69 7.00 6.50 6.80
South Africa 8.43 8.20 8.20 8.20
Exchange rates USD/CNY 6.82 6.84 6.84 6.84
EUR/CNY 9.34 9.58 10.26 10.26
USD/INR 49.78 50.00 48.00 48.00
EUR/INR 67.49 72.5 72.00 72.00
USD/BRL 2.07 2.30 2.20 2.10
EUR/BRL 2.82 3.34 3.30 3.30
USD/MXN 13.19 13.30 12.60 12.30
EUR/MXN 18.00 19.29 18.90 17.22
USD/ZAR 8.45 9.00 9.35 9.35EUR/ZAR 11.53 12.60 14.03 14.03
Source: Reuters, Thomson Financial Datastream, Raiffeisen RESEARCH
8/14/2019 Emerging Markets (English Version)
http://slidepdf.com/reader/full/emerging-markets-english-version 6/28
6
Asia
Hopes for growthThe recession has hit Asia as well now. Singapore,Hong Kong, Taiwan and Japan are all registeringnegative growth rates. In response, the Asian Devel-opment Bank (ADB) has set up a crisis fund with avolume of USD 120 bn, creating Asia’s first multi-lateral liquidity facility. With regard to 2009, ADBprojects a massive slump in capital inflows fromabroad, which amounted to USD 300 bn in 2007and just USD 100 bn in 2008. Along with the newfinancing options offered by the IMF, this new fundwill expand the scope of protection for the countriesin Asia.
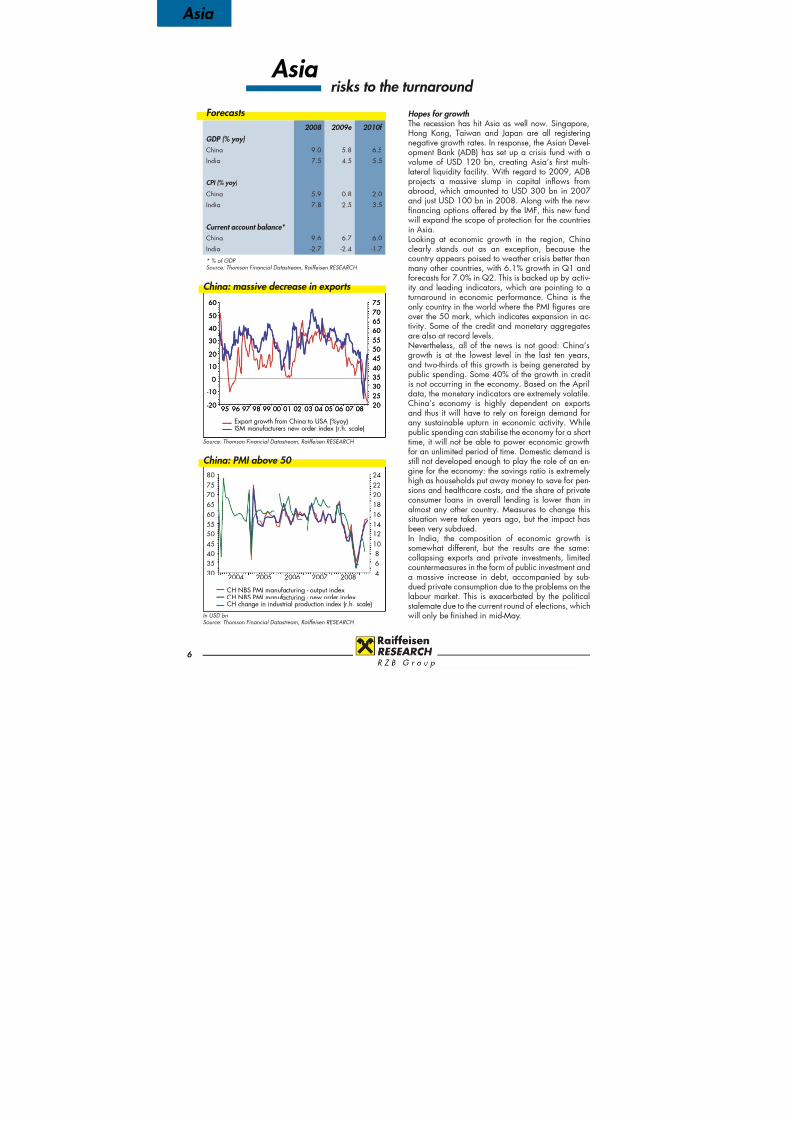
Looking at economic growth in the region, Chinaclearly stands out as an exception, because thecountry appears poised to weather crisis better thanmany other countries, with 6.1% growth in Q1 andforecasts for 7.0% in Q2. This is backed up by activ-ity and leading indicators, which are pointing to aturnaround in economic performance. China is theonly country in the world where the PMI figures areover the 50 mark, which indicates expansion in ac-tivity. Some of the credit and monetary aggregatesare also at record levels.Nevertheless, all of the news is not good: China’s
growth is at the lowest level in the last ten years,and two-thirds of this growth is being generated bypublic spending. Some 40% of the growth in creditis not occurring in the economy. Based on the Aprildata, the monetary indicators are extremely volatile.China’s economy is highly dependent on exportsand thus it will have to rely on foreign demand forany sustainable upturn in economic activity. Whilepublic spending can stabilise the economy for a shorttime, it will not be able to power economic growthfor an unlimited period of time. Domestic demand isstill not developed enough to play the role of an en-gine for the economy: the savings ratio is extremelyhigh as households put away money to save for pen-sions and healthcare costs, and the share of privateconsumer loans in overall lending is lower than inalmost any other country. Measures to change thissituation were taken years ago, but the impact hasbeen very subdued.In India, the composition of economic growth issomewhat different, but the results are the same:collapsing exports and private investments, limitedcountermeasures in the form of public investment anda massive increase in debt, accompanied by sub-dued private consumption due to the problems on the
labour market. This is exacerbated by the politicalstalemate due to the current round of elections, whichwill only be finished in mid-May.
Asia risks to the turnaround
2004 2005 2006 2007 200830
354045
5055
60
65707580
4
68
10
1214
16
18202224
CH NBS PMI manufacturing - output index
CH NBS PMI manufacturing - new order indexCH change in industrial production index (r.h. scale)
China: PMI above 50
In USD bnSource: Thomson Financial Datastream, Raiffeisen RESEARCH
95 96 97 98 99 00 01 02 03 04 05 06 07 08-20
-10
0
10
20
30
40
50
60
202530354045
505560657075
95 96 97 98 99 00 01 02 03 04 05 06 07 08-20
-10
0
10
20
30
40
50
60
202530354045
505560657075
Export growth from China to USA (%yoy)ISM manufacturers new order index (r.h. scale)
China: massive decrease in exports
Source: Thomson Financial Datastream, Raiffeisen RESEARCH
Forecasts
2008 2009e 2010f
GDP (% yoy)
China 9.0 5.8 6.5
India 7.5 4.5 5.5
CPI (% yoy)
China 5.9 0.8 2.0
India 7.8 2.5 3.5
Current account balance*
China 9.6 6.7 6.0India -2.7 -2.4 -1.7
* % of GDP Source: Thomson Financial Datastream, Raiffeisen RESEARCH
8/14/2019 Emerging Markets (English Version)
http://slidepdf.com/reader/full/emerging-markets-english-version 7/28
7
Asia
Running out of interest rate cuts? Although some Asian countries have already resortedto a zero interest rate policy, there is still enoughroom for rates to go lower in China and India. Withregard to China, however, some respected advisorsand economists are already calling for a more re-strictive monetary policy stance. The official policyline, however, is to stick with an expansive strategy.Indeed, as long as conditions hover near deflation,the trend will be slanted more in favour of rate cuts,in order to bring real interest rates down. The situa-tion is similar in this regard in India. The repo ratewas lowered by 25bp to 4.75% in March. Moreo-
ver, the RBI is pursuing a policy of quantitative easingas well: this is intended to boost liquidity in the mar-ket on the one hand and on the other aims to smoothout the extremely steep yield curve via purchases of government bonds.
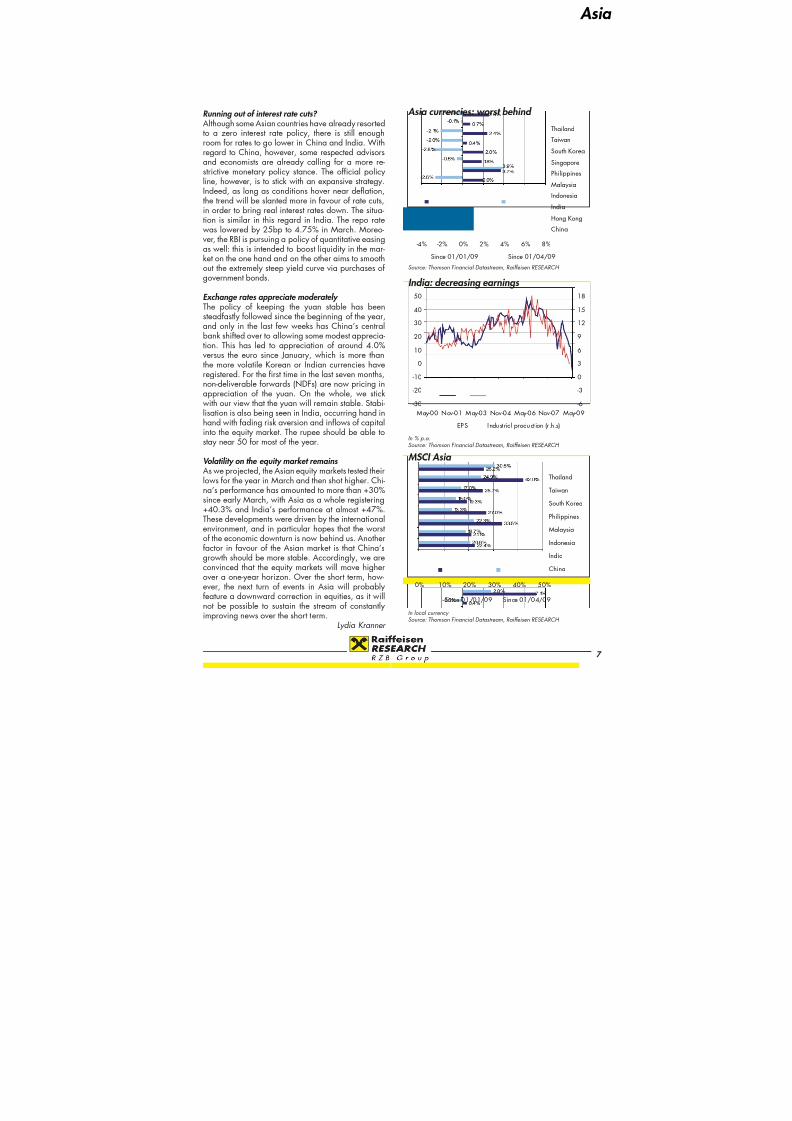
Exchange rates appreciate moderately The policy of keeping the yuan stable has beensteadfastly followed since the beginning of the year,and only in the last few weeks has China’s centralbank shifted over to allowing some modest apprecia-tion. This has led to appreciation of around 4.0%
versus the euro since January, which is more thanthe more volatile Korean or Indian currencies haveregistered. For the first time in the last seven months,non-deliverable forwards (NDFs) are now pricing inappreciation of the yuan. On the whole, we stickwith our view that the yuan will remain stable. Stabi-lisation is also being seen in India, occurring hand inhand with fading risk aversion and inflows of capitalinto the equity market. The rupee should be able tostay near 50 for most of the year.
Volatility on the equity market remains As we projected, the Asian equity markets tested theirlows for the year in March and then shot higher. Chi-na’s performance has amounted to more than +30%since early March, with Asia as a whole registering+40.3% and India’s performance at almost +47%.These developments were driven by the internationalenvironment, and in particular hopes that the worstof the economic downturn is now behind us. Anotherfactor in favour of the Asian market is that China’sgrowth should be more stable. Accordingly, we areconvinced that the equity markets will move higherover a one-year horizon. Over the short term, how-ever, the next turn of events in Asia will probably
feature a downward correction in equities, as it willnot be possible to sustain the stream of constantlyimproving news over the short term.
Lydia Kranner
-30
-20
-10
0
10
20
30
40
50
May-00 Nov-01 May-03 Nov-04 May-06 Nov-07 May-09-6
-3
0
3
6
9
12
15
18
EPS Indust rial product ion (r .h.s)
India: decreasing earnings
In % p.a.Source: Thomson Financial Datastream, Raiffeisen RESEARCH
2 2 . 4 %
2 1 . 1 %
3 3 . 5 %
2 7 . 0 %
1 9 . 3 %
2 5 . 7 %
4 2 . 0 %
2 6 . 2 %
2 0 . 6 %
1 8 . 7 %
2 2 . 3 %
1 3 . 3 %
1 5 . 0 %
1 7 . 0 %
2 4 . 9 %
3 0 . 5 %
0% 10% 20% 30% 40% 50%
China
India
Indonesia
Malaysia
Philippines
South Korea
TaiwanThailand
Since 01/01/09 Since 01/04/09
MSCI Asia
In local currency Source: Thomson Financial Datastream, Raiffeisen RESEARCH
1 . 8 %
2 . 0 %
0 . 4 %
2 . 4 %
0 . 7 %
0 . 4 %
- 2 . 6 %
- 0 . 5 %
- 2 . 0 %
- 2 . 1 %
- 0 . 1 %
- 0 . 4 %
- 0 . 5 %
2 . 8 %
2 . 6 %
7 . 1 %
2 . 0 %
3 . 7 %
3 . 9 %
- 2 . 8 %
-4% -2% 0% 2% 4% 6% 8%
China
Hong Kong
India
Indonesia
Malaysia
Philippines
Singapore
South Korea
Taiwan
Thailand
Since 01/01/09 Since 01/04/09
Asia currencies: worst behind
Source: Thomson Financial Datastream, Raiffeisen RESEARCH

8/14/2019 Emerging Markets (English Version)
http://slidepdf.com/reader/full/emerging-markets-english-version 8/28
8
Latin America
Partial stabilisation of the economies During the first quarter of 2009, economic activityin Brazil stabilised a great deal. For example, foreach month industrial production was higher than inthe previous month. The purchasing managers’ indexalso continued to recover and is pointing to more im-provement in the economy. The situation is somewhatdifferent in Mexico, where industrial production con-tinued to fall in January, with no improvement seenin February either. As a result, the GDP figures forQ1 2009 will decline even more severely than inQ2 2008. The impact of the swine flu on production,in particular in the services sector, will result in more
negative performance in the second quarter, but therate will only be slightly in the red in our view. Wechange our forecast for economic growth in Mexicofrom -3% yoy to -5% yoy. In Brazil, we expect to seea modest increase as early as the second quarter,and confirm our forecast of -1.2% yoy for 2009. In-flation is proving to be stubbornly high (Brazil: 5.6%
yoy, and Mexico: 6.2% yoy). Inflation expectations,however, are already dropping fast (e.g. 4.3% inBrazil).
End of the rate-cutting cycle in the summer
Since the beginning of the year, the central bankshave lowered their interest rates significantly. Brazilhas seen interest rates fall from a peak 14.75% to thecurrent level of 10.25%. In our opinion, the situationin the Brazilian economy and the declines in inflationwill lead to more rate cuts. We project that the down-ward cycle of rates will end at 8.5% in the summeror the autumn. The situation in Mexico is somewhatmore complex, due to the higher inflation rates. Butthe economic situation is also much worse, and thuswe expect to see more cuts from the current 6% to aslow as 4.5% by early in H2.
Bonds profit from FX appreciationThe yield curve in both Brazil and Mexico has grownsteeper since the beginning of the year. For us, it issurprising that in Brazil the decline in inflation and in-flation expectations is not being reflected in 10-yearLCY bonds. In our opinion, there should be more po-tential for yields to fall on these instruments. Withregard to short-dated bonds, however, there is hardlyany potential for lower yields, neither in Mexico norin Brazil. Nevertheless, due to the very positive cur-rency developments we do not recommend buyingLatin American bonds.
-20%
-15%
-10%
-5%
0%
5%
10%
15%
Apr-06 Jan-07 Oct-07 Jul-08 Apr-0930
35
40
45
50
55
60
65
Industrial production yoyPMI (r.h.s.)
BR: IP / PMI recovering
Source: Thomson Financial Datastream, Raiffeisen RESEARCH
Latin America economic low reached
Forecasts
2008 2009e 2010f
GDP (% yoy)
Brazil 5.1 -1.2 3.5
Mexico 1.4 -5.0 2.2
CPI (% yoy)
Brazil 5.9 4.1 4.5
Mexico 6.0 4.0 4.0
Current account balance*
Brazil -1.8 -1.4 -1.2Mexico -1.4 -2.1 -2.3
* in % of GDP Source: Thomson Financial Datastream, Raiffeisen RESEARCH
100
105
110
115
120
Mar-04 Mar-05 Mar-06 Mar-07 Mar-08 Mar-09
Index of economic activity
MX: Low level of activity
Source: Thomson Financial Datastream, Raiffeisen RESEARCH

8/14/2019 Emerging Markets (English Version)
http://slidepdf.com/reader/full/emerging-markets-english-version 9/28
9
Latin America
Currencies profit from strong supply of USD Following the outbreak of swine flu, the Mexicanpeso came under pressure for a short time. After itbecame clear that the illness was apparently easilytreatable, the currency stabilised again quickly. Useof the IMF’s “flexible line of credit” and positive FXinflows lead us to believe that developments will besteady. For the second half of the year, we projectthat the Mexican peso will appreciate against USD.The Brazilian real (BRL) has firmed up significantlyagainst USD in recent weeks, bolstered by the re-turn of larger USD capital inflows. The ample supplyof USD is reflected by a measure of the Brazilian
central bank, which has placed a reverse FX swapand thereby siphoned off USD from the market. Inour view, the current level of the Brazilian real is notcommensurate with actual conditions in the country’seconomy. We expect that BRL will depart from theseexaggerated levels in the weeks ahead, and weakenversus USD.
Equities: valuations are highLatin American equity markets have been able topost increases of up to 40% since early March. InBrazil this performance was mainly borne by strong
demand for commodities from China. Mexico prof-ited from the stabilisation in the US economy. Thereporting season which just came to a close in Mex-ico presented a mixed picture. In the end, 31% of the companies were able to beat expectations while41% presented disappointing results. On the whole,earnings contracted by 7.3% yoy. We believe thatthis will mark the low point. There is also cause forconcern in relation to the current valuation levels forLatin American stocks. The 2009 PER for the Brazil-ian market is now at 15.7 and at 14.5 in Mexico,whereas the long-term average for the price-earningsratio on the Latin American stock markets is just over10. Due to the strong trend, more rises will probablybe seen in May. By June at the latest, however, weexpect to see a hefty correction.
Josef Wolfesberger
-40%
-20%
0%
20%
40%
60%
80%
Apr-07 Oct-07 Apr-08 Oct-08 Apr-09Impor t growth yoy Expor t growth yoy
BR: Stronger export growth
Source: Thomson Financial Datastream, Raiffeisen RESEARCH
0
100
200
300
400
500
01 02 03 04 05 06 07 08 09
Copper imports China*
Commodity exports to China booming
* in tousand tonsSource: Thomson Financial Datastream, Raiffeisen RESEARCH
50
100
150
200
May-06 Feb-07 Nov-07 Aug-08 May-09
Bovespa MexBol
Correction on equity markets likely
Source: Thomson Financial Datastream, Raiffeisen RESEARCH

8/14/2019 Emerging Markets (English Version)
http://slidepdf.com/reader/full/emerging-markets-english-version 10/28
10
South Africa
The economy in South Africa has now also techni-cally entered into recession: Q1 2009 will be thesecond quarter in a row with negative economicperformance. This was reflected by the recently re-leased data on industrial production (-15%), miningoutput (-11.5% incl. gold production) and retail sales(-4.5%). The country’s strong dependence on exportsis having a very negative impact on economic per-formance. In particular, demand from the developedmarkets and Asia has dropped off strongly in recentmonths. Measures to stimulate the economy have al-ready been taken, especially within the field of infra-structure projects and programmes to fight poverty.
Above and beyond these efforts, there is alreadysome speculation that South Africa could also use thecredit line extended by the IMF if it needs to. Nego-tiations are also underway with the African Develop-ment Bank for a loan of USD 2.5 to 5 bn.Dim economic prospects, low inflation and the ap-preciation of the South African rand will result inmore cuts in interest rates.
Economic growth reaches its low Domestic consumption remains very weak, and Feb-ruary’s retail sales data surprised market observers
by slipping lower yet again. Looking at credit de-mand, it appears that this is tapering off as well.Another negative surprise came in the form of thelatest publication on the purchasing managers’ index(PMI), which fell to the lowest level since the begin-ning of the time series for this indicator, dropping to35.8 from 36. The individual sub-indices, however,reflected some positive developments: for example,sentiment on production level and new orders im-proved somewhat. There was also little good newsin the field of foreign trade. Compared to the previ-ous year, exports dropped 7% in April, as exportsto Europe fell by 24%, whereas the exports to Asiaincreased by 20 %. If Asia’s economy is the first tocome out of the slump, this will have a very positiveeffect on the South African economy as well, as Asiais now the country’s biggest trade partner.On the whole, we project a decline of 0.8% in GDPin 2009. In 2010, the football World Cup being heldin the country should have a positive effect, and ac-cordingly we forecast economic growth of 2.8% next
year, which is still below potential.
Interest rates already at low levels During recent months, monetary policy in South Af-
rica has been expansive, in an effort to stimulateeconomic activity. The SARB has lowered its interestrates by 350bp since December from 12% to 8.5%.
-60%
-40%
-20%
0%
20%
40%
60%
80%100%
Mar -05 Nov-05 Ju l-06 Mar -07 Nov-07 Ju l-08 Mar-09
Expor ts USA (% yoy) Export s Europe (% yoy)Exports Asia (% yoy)
Exports' turnaround?
Source: Thomson Financial Datastream, Raiffeisen RESEARCH
South Africa First recession in a decade
-10
-5
0
5
10
15
20
Mar-01 Mar-03 Mar-05 Mar-07 Mar-0935
40
45
50
55
60
65
Retail sales (% yoy)
Industrial production (% yoy)
PMI (r.h. scale)
Recovery not in sight yet
Source: Bloomberg, Thomson Financial Datastream, Raiffeisen RESEARCH
Forecasts
2007 2008 2009e 2010f
GDP (% yoy) 5.10 3.20 -0.80 2.80
Current account* -7.00 -7.60 -7.20 -8.00
CPI (% yoy) 7.08 11.20 7.00 5.50
* in % of GDP Source: Thomson Financial Datastream, Raiffeisen RESEARCH
8/14/2019 Emerging Markets (English Version)
http://slidepdf.com/reader/full/emerging-markets-english-version 11/28
11
South Africa
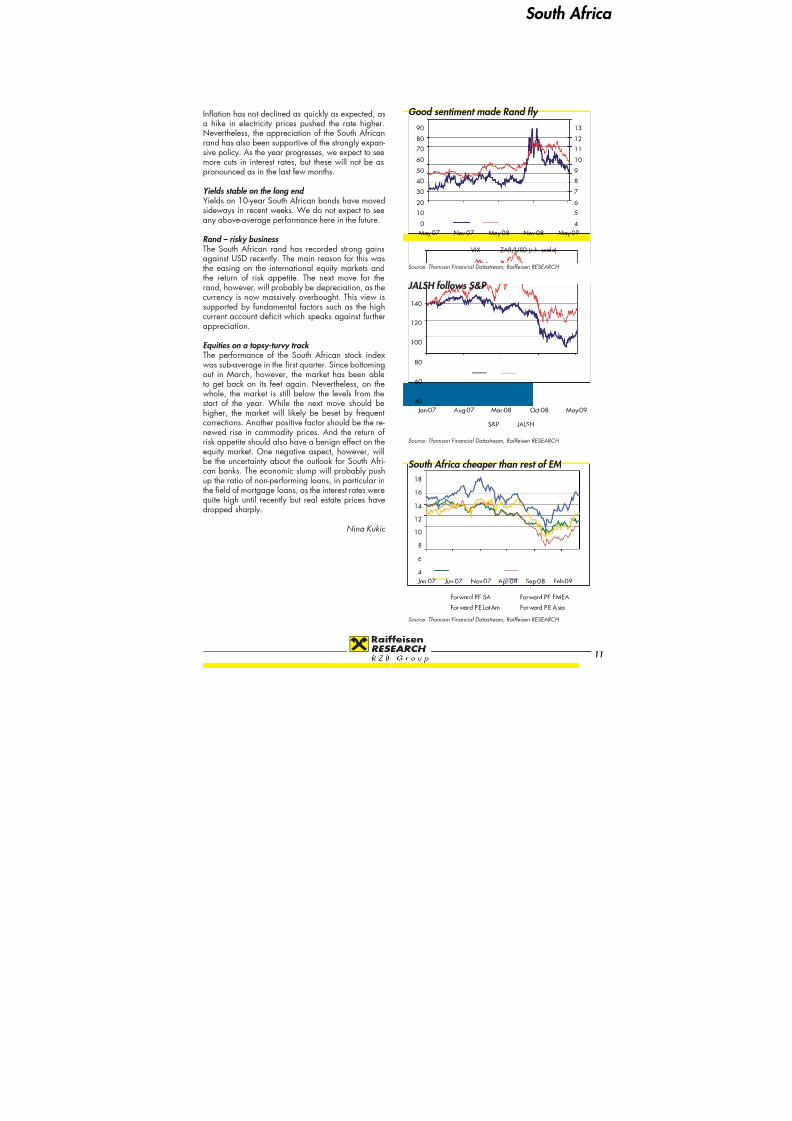
Inflation has not declined as quickly as expected, asa hike in electricity prices pushed the rate higher.Nevertheless, the appreciation of the South Africanrand has also been supportive of the strongly expan-sive policy. As the year progresses, we expect to seemore cuts in interest rates, but these will not be aspronounced as in the last few months.
Yields stable on the long end Yields on 10-year South African bonds have movedsideways in recent weeks. We do not expect to seeany above-average performance here in the future.
Rand – risky business The South African rand has recorded strong gainsagainst USD recently. The main reason for this wasthe easing on the international equity markets andthe return of risk appetite. The next move for therand, however, will probably be depreciation, as thecurrency is now massively overbought. This view issupported by fundamental factors such as the highcurrent account deficit which speaks against furtherappreciation.
Equities on a topsy-turvy track
The performance of the South African stock indexwas sub-average in the first quarter. Since bottomingout in March, however, the market has been ableto get back on its feet again. Nevertheless, on thewhole, the market is still below the levels from thestart of the year. While the next move should behigher, the market will likely be beset by frequentcorrections. Another positive factor should be the re-newed rise in commodity prices. And the return of risk appetite should also have a benign effect on theequity market. One negative aspect, however, willbe the uncertainty about the outlook for South Afri-can banks. The economic slump will probably pushup the ratio of non-performing loans, in particular inthe field of mortgage loans, as the interest rates werequite high until recently but real estate prices havedropped sharply.
Nina Kukic
40
60
80
100
120
140
Jan-07 Aug-07 Mar-08 Oct-08 May-09
S&P JALSH
JALSH follows S&P
Source: Thomson Financial Datastream, Raiffeisen RESEARCH
4
6
8
10
12
14
16
18
Jan-07 Jun-07 Nov-07 Apr-08 Sep-08 Feb-09
Forward PE SA Forward PE EMEAForward PE LatAm Forward PE Asia
South Africa cheaper than rest of EM
Source: Thomson Financial Datastream, Raiffeisen RESEARCH
0
10
20
30
40
50
60
70
80
90
May-07 Nov-07 May-08 Nov-08 May-094
5
6
7
8
9
10
11
12
13
VIX ZAR/USD (r.h. scal e)
Good sentiment made Rand fly
Source: Thomson Financial Datastream, Raiffeisen RESEARCH

8/14/2019 Emerging Markets (English Version)
http://slidepdf.com/reader/full/emerging-markets-english-version 12/28
12
Economics
-5%
0%
5%
10%
15%
Q42001
Q42002
Q42003
Q42004
Q42005
Q42006
Q42007
Q42008
China India Thailand Asia
Asia: GDP (% yoy)
Source: Thomson Financial Datastream, Raiffeisen RESEARCH
-5%
0%
5%
10%
15%
China India Thailand Malaysia Asia
2008 2009e 2010f
Asia: C/A balance (% of GDP)
Source: Thomson Financial Datastream, Raiffeisen RESEARCH
-3%
0%
3%
6%
9%
12%
Feb-04 Feb-05 Feb-06 Feb-07 Feb-08 Feb-09
China India Thailand Asia
Asia: CPI (% yoy)
Source: Thomson Financial Datastream, Raiffeisen RESEARCH
-4%
-1%
2%
5%
8%
Q42001
Q42002
Q42003
Q42004
Q42005
Q42006
Q42007
Q42008
-20%
-10%
0%
10%
20%
Brazil MexicoLatin America Argentina (r.h.s.)
Latin America: GDP (% yoy)
Source: Thomson Financial Datastream, Raiffeisen RESEARCH
-4%
-2%
0%
2%
4%
Argentina Brazil Mexico Chile LatinAmerica
2008 2009e 2010f
Latin America: C/A balance (% of GDP)
Source: Thomson Financial Datastream, Raiffeisen RESEARCH
1%
4%
7%
10%
13%
Feb-04 Feb-05 Feb-06 Feb-07 Feb-08 Feb-09
Argentina BrazilMexico Latin America
Latin America: CPI (% yoy)
Source: Thomson Financial Datastream, Raiffeisen RESEARCH

8/14/2019 Emerging Markets (English Version)
http://slidepdf.com/reader/full/emerging-markets-english-version 13/28
13
Economics
0%
2%
4%
6%
8%
10%
12%
14%
1996 1998 2000 2002 2004 2006 2008
South Africa UAE Africa Middle East
MEA: GDP (% yoy)
Source: Thomson Financial Datastream, Raiffeisen RESEARCH
-10%
0%
10%
20%
30%
40%
SouthAfrica
Kuwait UAE Africa MiddleEast
2008 2009e 2010f
MEA: C/A balance (% of GDP)
Source: Thomson Financial Datastream, Raiffeisen RESEARCH
-4%
0%
4%
8%
12%
16%
20%
Feb-04 Feb-05 Feb-06 Feb-07 Feb-08 Feb-09
South Africa Kuwait Africa Middle East
MEA: CPI (% yoy)
Source: Thomson Financial Datastream, Raiffeisen RESEARCH
-2%
0%
2%
4%
6%
8%
10%
Q42001
Q42002
Q42003
Q42004
Q42005
Q42006
Q42007
Q42008
EMU USA CE Russia
Reference countries: GDP (% yoy)
Source: Thomson Financial Datastream, Raiffeisen RESEARCH
-6%
-4%
-2%
0%
2%
4%
6%
EMU USA CE Russia
2008 2009e 2010f
Ref. countries: C/A balance (% of GDP)
Source: Thomson Financial Datastream, Raiffeisen RESEARCH
0%
2%
4%
6%
8%
Feb-04 Feb-05 Feb-06 Feb-07 Feb-08 Feb-090%
4%
8%
12%
16%
EMU USA CE Russia (r.h.s.)
Reference countries: CPI (% yoy)
Source: Thomson Financial Datastream, Raiffeisen RESEARCH
8/14/2019 Emerging Markets (English Version)
http://slidepdf.com/reader/full/emerging-markets-english-version 14/28
14
Economics
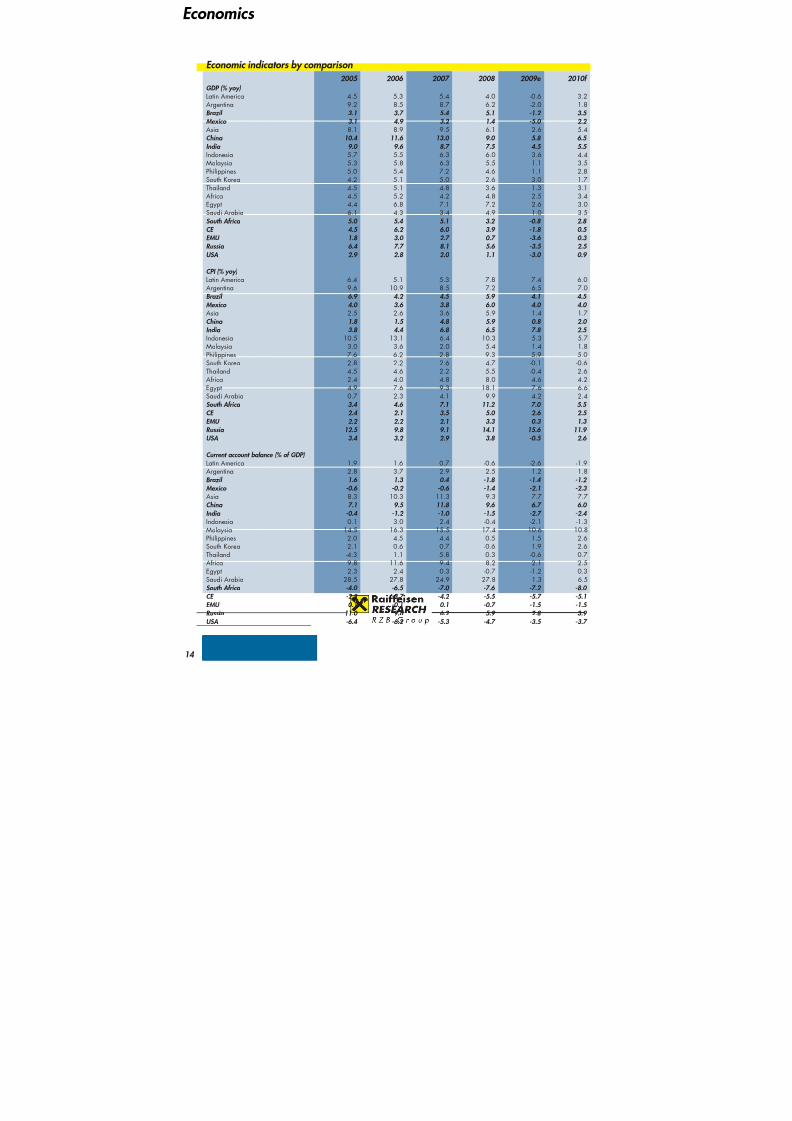
Economic indicators by comparison2005 2006 2007 2008 2009e 2010f
GDP (% yoy)Latin America 4.5 5.3 5.4 4.0 -0.6 3.2Argentina 9.2 8.5 8.7 6.2 -2.0 1.8Brazil 3.1 3.7 5.4 5.1 -1.2 3.5
Mexico 3.1 4.9 3.2 1.4 -5.0 2.2 Asia 8.1 8.9 9.5 6.1 2.6 5.4China 10.4 11.6 13.0 9.0 5.8 6.5 India 9.0 9.6 8.7 7.5 4.5 5.5 Indonesia 5.7 5.5 6.3 6.0 3.6 4.4Malaysia 5.3 5.8 6.3 5.5 1.1 3.5Philippines 5.0 5.4 7.2 4.6 1.1 2.8South Korea 4.2 5.1 5.0 2.6 -3.0 1.7Thailand 4.5 5.1 4.8 3.6 1.3 3.1Africa 4.5 5.2 4.2 4.8 2.5 3.4Egypt 4.4 6.8 7.1 7.2 2.6 3.0Saudi Arabia 6.1 4.3 3.4 4.9 1.0 3.5South Africa 5.0 5.4 5.1 3.2 -0.8 2.8 CE 4.5 6.2 6.0 3.9 -1.8 0.5
EMU 1.8 3.0 2.7 0.7 -3.6 0.3 Russia 6.4 7.7 8.1 5.6 -3.5 2.5 USA 2.9 2.8 2.0 1.1 -3.0 0.9
CPI (% yoy)Latin America 6.4 5.1 5.3 7.8 7.4 6.0Argentina 9.6 10.9 8.5 7.2 6.5 7.0Brazil 6.9 4.2 4.5 5.9 4.1 4.5 Mexico 4.0 3.6 3.8 6.0 4.0 4.0 Asia 2.5 2.6 3.6 5.9 1.4 1.7China 1.8 1.5 4.8 5.9 0.8 2.0 India 3.8 4.4 6.8 6.5 7.8 2.5 Indonesia 10.5 13.1 6.4 10.3 5.3 5.7Malaysia 3.0 3.6 2.0 5.4 1.4 1.8
Philippines 7.6 6.2 2.8 9.3 5.9 5.0South Korea 2.8 2.2 2.6 4.7 -0.1 -0.6Thailand 4.5 4.6 2.2 5.5 -0.4 2.6Africa 2.4 4.0 4.8 8.0 4.6 4.2Egypt 4.9 7.6 9.3 18.1 7.6 6.6Saudi Arabia 0.7 2.3 4.1 9.9 4.2 2.4South Africa 3.4 4.6 7.1 11.2 7.0 5.5 CE 2.4 2.1 3.5 5.0 2.6 2.5 EMU 2.2 2.2 2.1 3.3 0.3 1.3 Russia 12.5 9.8 9.1 14.1 15.6 11.9 USA 3.4 3.2 2.9 3.8 -0.5 2.6
Current account balance (% of GDP)Latin America 1.9 1.6 0.7 -0.6 -2.6 -1.9Argentina 2.8 3.7 2.9 2.5 1.2 1.8
Brazil 1.6 1.3 0.4 -1.8 -1.4 -1.2 Mexico -0.6 -0.2 -0.6 -1.4 -2.1 -2.3 Asia 8.3 10.3 11.3 9.3 7.7 7.7China 7.1 9.5 11.8 9.6 6.7 6.0 India -0.4 -1.2 -1.0 -1.5 -2.7 -2.4 Indonesia 0.1 3.0 2.4 -0.4 -2.1 -1.3Malaysia 14.5 16.3 15.5 17.4 10.6 10.8Philippines 2.0 4.5 4.4 0.5 1.5 2.6South Korea 2.1 0.6 0.7 -0.6 1.9 2.6Thailand -4.3 1.1 5.8 0.3 -0.6 0.7Africa 9.8 11.6 9.4 8.2 2.1 2.5Egypt 2.3 2.4 0.3 -0.7 -1.2 0.3Saudi Arabia 28.5 27.8 24.9 27.8 1.3 6.5South Africa -4.0 -6.5 -7.0 -7.6 -7.2 -8.0
CE -2.8 -3.7 -4.2 -5.5 -5.7 -5.1EMU 0.1 -0.1 0.1 -0.7 -1.5 -1.5 Russia 11.0 9.6 6.2 5.9 2.8 3.9 USA -6.4 -6.2 -5.3 -4.7 -3.5 -3.7

8/14/2019 Emerging Markets (English Version)
http://slidepdf.com/reader/full/emerging-markets-english-version 15/28
15
Economics
2005 2006 2007 2008 2009e 2010f Budget balance (% of GDP)Latin America -1.0 -0.8 -0.5 -0.8 -2.7 -2.5Argentina 1.8 1.8 1.6 1.3 -0.2 -0.4Brazil -3.0 -3.0 -3.3 -1.3 -2.3 -1.5
Mexico -0.1 0.1 -0.2 -1.8 -2.3 -2.5 Asia -1.3 -0.7 0.8 -0.8 -2.8 -2.1China -1.2 -0.8 0.7 -1.0 -3.5 -3.0 India -6.7 -5.6 -5.2 -9.5 -12.0 -9.4 Indonesia -0.4 -1.0 -0.7 -0.8 -2.3 -1.4Malaysia -3.6 -3.3 -3.2 -3.4 -5.1 -5.1Philippines -2.7 -1.1 -1.0 -1.0 -3.0 -1.3South Korea 0.4 0.5 3.8 0.5 -5.7 -2.1Thailand -0.5 1.4 -2.0 -1.0 -2.5 -2.2Africa 2.9 4.1 0.9 0.6 -4.5 -3.6Egypt -8.1 -8.7 -6.4 -7.3 -8.6 -8.4Saudi Arabia 18.4 21.0 12.3 18.5 -12.7 -5.8South Africa -0.5 0.3 0.7 -0.7 -3.0 -2.0 CE -3.9 -4.3 -2.1 -2.5 -4.1 -3.6
EMU -2.5 -1.3 -0.6 -2.0 -4.4 -4.8 Russia 8.1 8.4 6.0 4.8 -8.8 -5.0 USA -3.6 -2.6 -1.4 -5.7 -12.0 -10.0
International reserves (in USD bn)Argentina 27.2 30.9 44.7 45.0 - -Brazil 53.2 85.2 179.4 192.8 - - Mexico 74.1 76.3 87.1 95.1 - - China 825.7 1072.8 1530.3 1948.0 - - India 136.5 145.8 192.3 299.6 - - Indonesia 33.1 41.1 55.0 47.2 - -Malaysia 69.9 82.1 101.0 92.5 - -Philippines 15.9 20.0 30.2 32.7 - -South Korea 208.0 233.6 261.0 204.0 - -Thailand 50.7 65.3 85.2 108.3 - -Egypt 20.6 24.5 30.2 33.4 - -Saudi Arabia 26.5 27.5 33.8 30.3 - -South Africa 18.6 23.1 29.6 33.0 - - CE 33.7 34.2 42.6 47.6 - - EMU 320.1 325.8 347.4 383.9 - - Russia 175.9 295.6 465.9 412.5 - - USA 65.5 65.9 70.6 72.6 - -
Net foreign debt (% of GDP)Argentina 70.3 64.0 52.6 46.1 54.2 56.5Brazil 19.2 16.1 14.7 13.0 17.1 18.1Mexico 20.4 17.8 18.9 18.2 25.0 25.4 China 12.6 12.2 11.0 9.4 8.1 7.1India 15.2 17.5 17.7 15.9 13.2 12.4
Indonesia 48.4 35.3 31.6 29.1 33.5 30.7Malaysia 37.9 33.4 30.4 25.9 29.0 27.5Philippines 62.3 52.4 43.8 37.4 30.3 22.8South Korea 23.7 29.3 39.3 26.1 29.6 24.9Thailand 29.6 28.9 25.2 23.8 24.0 22.9Egypt 32.3 28.3 25.9 23.9 26.8 25.7Saudi Arabia 10.7 9.2 8.6 7.1 8.5 7.5South Africa 20.0 23.0 26.6 27.6 30.2 27.7 CE 50.3 53.7 57.0 61.5 67.3 69.2 EMU - - - - - - Russia 33.7 31.6 36.7 31.1 35.8 31.9 USA 76.2 84.9 97.0 95.6 91.3 86.3
Bold countries: own estimatesSource: Thomson Financial Datastream, Global Insight, Raiffeisen RESEARCH

8/14/2019 Emerging Markets (English Version)
http://slidepdf.com/reader/full/emerging-markets-english-version 16/28
16
Fixed income
20
40
60
80
100
120
140
160
May-06 Nov-06 May-07 Nov-07 May-08 Nov-08 May-09
Argentina Brazil Mexico Latin America
Latin America: JPM bond indices*
* in local currency Source: Thomson Financial Datastream, Raiffeisen RESEARCH
75
90
105
120
135
150
May-06 Nov-06 May-07 Nov-07 May-08 Nov-08 May-09
Argentina BrazilMexico Latin America
Latin America: JPM bond indices (Euro)
Source: Thomson Financial Datastream, Raiffeisen RESEARCH
95
105
115
125
135
145
May-06 Nov-06 May-07 Nov-07 May-08 Nov-08 May-09
China India Thailand Asia
Asia: JPM bond indices*
* in local currency Source: Thomson Financial Datastream, Raiffeisen RESEARCH
85
100
115
130
145
May-06 Nov-06 May-07 Nov-07 May-08 Nov-08 May-09
China India Thailand Asia
Asia: JPM bond indices (Euro)
Source: Thomson Financial Datastream, Raiffeisen RESEARCH
Key interest rates base rate current last change change
Latin America
Brazil SELIC overnight rate 10.25 29/04/09 -1.00
Chile Discount rate 1.25 07/05/09 -0.50
Colombia Repo rate 6.00 30/04/09 -1.00
Mexico Repo rate 6.00 17/04/09 -0.75
Peru Reference rate 4.00 07/05/09 -0.50
Source: Reuters, Bloomberg, Raiffeisen RESEARCH
Key interest rates base rate current last change change
Asia
China Base lending rate (1y) 5.31 22/12/08 -0.27
Hong Kong Base rate 0.50 17/12/08 -1.00
India Repo rate 4.75 21/04/09 -0.25
Indonesia Reference rate 7.25 05/05/09 -0.25
Malaysia Overnight policy rate 2.00 24/02/09 -0.50
Philippines Reverse repo rate 4.50 16/04/09 -0.25
Singapore SIBOR 3 month 0.50 - -
SouthKorea
Call rate 2.00 12/02/09 -0.50
Taiwan Rediscount rate 1.25 18/02/09 -0.25Thailand 1-day repo rate 1.25 08/04/09 -0.25
Source: Reuters, Bloomberg, Raiffeisen RESEARCH

8/14/2019 Emerging Markets (English Version)
http://slidepdf.com/reader/full/emerging-markets-english-version 17/28
17
Fixed income
95
105
115
125
135
May-06 Nov-06 May-07 Nov-07 May-08 Nov-08 May-09EMU USA CE Russia
Reference countries: JPM bond indices*
* in local currency
Source: Thomson Financial Datastream, Raiffeisen RESEARCH
70
84
98
112
126
140
May-06 Nov-06 May-07 Nov-07 May-08 Nov-08 May-09
EMU USA CE Russia
Ref. countries: JPM bond indices (Euro)
Source: Thomson Financial Datastream, Raiffeisen RESEARCH
100
109
118
127
May-06 Nov-06 May-07 Nov-07 May-08 Nov-08 May-09
South Africa
MEA: JPM bond indices*
* in local currency Source: Thomson Financial Datastream, Raiffeisen RESEARCH
50
60
70
80
90
100
May-06 Nov-06 May-07 Nov-07 May-08 Nov-08 May-09
South Africa
MEA: JPM bond indices (Euro)
Source: Thomson Financial Datastream, Raiffeisen RESEARCH
Key interest rates base rate current last change change
Africa and Middle East
Egypt Deposit rate 10.00 26/03/09 -0.50
South Africa Repo rate 8.50 30/04/09 -1.00
Israel Repo rate 0.50 23/03/09 -0.25
Kuwait Discount rate 3.50 13/04/09 -0.25
Saudi Arabia n.a. n.a. n.a. n.a.
UAE n.a. n.a. n.a. n.a.
Source: Reuters, Bloomberg, Raiffeisen RESEARCH
Key interest rates base rate current last change change
USA, EMU, CE and Russia
EMU Tender rate 1.00 07/05/09 -0.25
Poland Repo rate 3.75 25/03/09 -0.25
Russia Repo rate 7.75 23/04/09 -0.50
Czech Republic Repo rate 1.50 07/05/09 -0.25
Hungary Base rate 9.50 19/01/09 -0.50
USA Target rate 0 -0,25
16/12/08 -0,75 --1
Source: Reuters, Bloomberg, Raiffeisen RESEARCH
8/14/2019 Emerging Markets (English Version)
http://slidepdf.com/reader/full/emerging-markets-english-version 18/28
18
Chartbook FX
65
75
85
95
105
115
May-06 Nov-06 May-07 Nov-07 May-08 Nov-08 May-09
Argentina Brazil
Mexico Latin America
Latin America: Currency *
* Euro to local currency Source: Thomson Financial Datastream, Raiffeisen RESEARCH
75
85
95
105
115
125
May-06 Nov-06 May-07 Nov-07 May-08 Nov-08 May-09
China India Thailand Asia
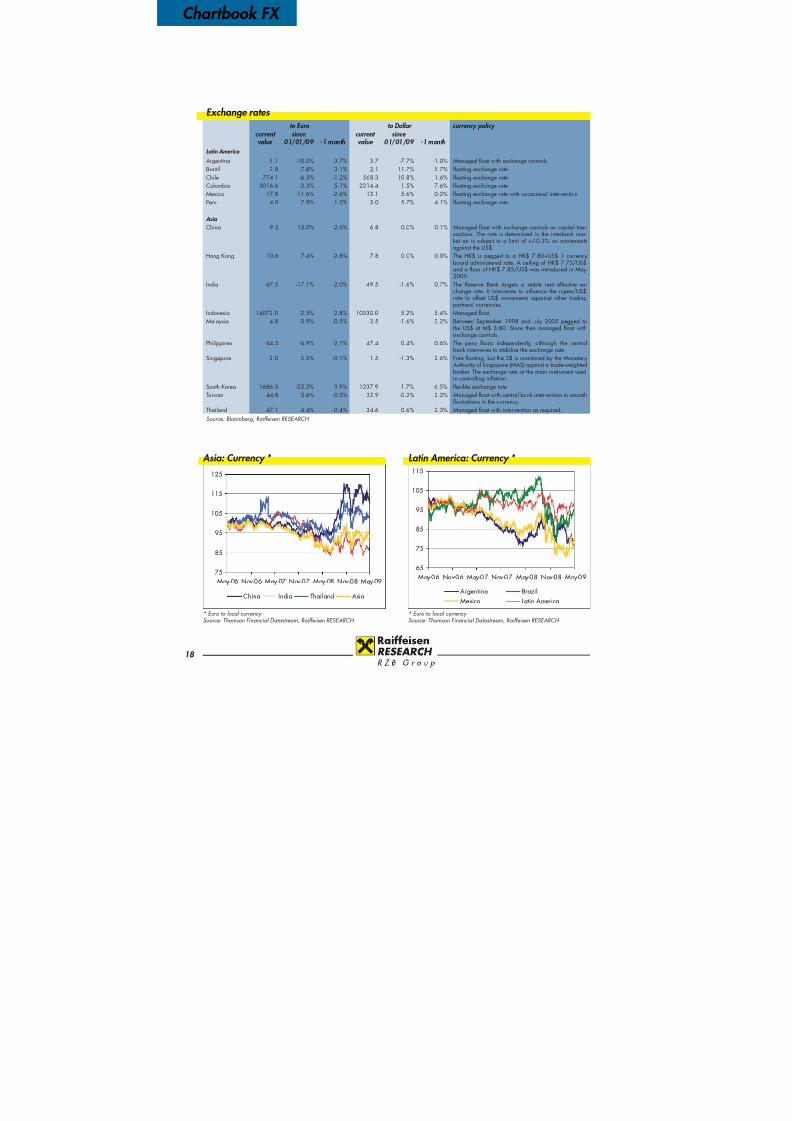
Asia: Currency *
* Euro to local currency Source: Thomson Financial Datastream, Raiffeisen RESEARCH
Exchange rates to Euro to Dollar currency policy
current value
since 01/01/09 -1 month
current value
since 01/01/09 -1 month
Latin America
Argentina 5.1 -10.0% -3.7% 3.7 -7.7% -1.0% Managed float with exchange controlsBrazil 2.8 -7.8% 3.1% 2.1 11.7% 5.7% floating exchange rateChile 774.1 -6.3% -1.2% 568.3 10.8% 1.6% floating exchange rateColombia 3016.6 -2.3% 5.1% 2214.4 1.5% 7.6% floating exchange rateMexico 17.8 -11.6% -2.6% 13.1 5.6% 0.2% floating exchange rate with occasional interventionPeru 4.0 7.9% 1.5% 3.0 5.7% 4.1% floating exchange rate
Asia
China 9.3 13.0% -2.6% 6.8 0.0% 0.1% Managed float with exchange controls on capital tran-sactions. The rate is determined in the interbank mar-ket an is subject to a limit of +/-0.3% on movementsagainst the US$.
Hong Kong 10.6 7.4% -2.8% 7.8 0.0% 0.0% The HK$ is pegged to a HK$ 7.80=US$ 1 currencyboard administered rate. A ceiling of HK$ 7.75/US$and a floor of HK$ 7.85/US$ was introduced in May2005.
India 67.5 -17.1% -2.0% 49.5 -1.6% 0.7% The Reserve Bank targets a stable real effective ex-change rate. It intervenes to influence the rupee/US$rate to offset US$ movements aganinst other tradingpartners' currencies.
Indonesia 14072.0 -2.5% 2.8% 10330.0 5.2% 5.4% Managed float.Malaysia 4.8 0.9% -0.5% 3.5 -1.6% 2.2% Between September 1998 and July 2005 pegged to
the US$ at M$ 3.80. Since then managed float withexchange controls.
Philippines 64.5 -6.9% -2.1% 47.4 0.4% 0.6% The peso floats independently, although the centralbank intervenes to stabilise the exchange rate.
Singapore 2.0 5.5% -0.1% 1.5 -1.3% 2.6% Free floating, but the S$ is monitored by the MonetaryAuthority of Singapore (MAS) against a trade-weightedbasket. The exchange rate ist the main instrument usedin controlling inflation.
South Korea 1686.3 -23.2% 3.9% 1237.9 1.7% 6.5% flexible exchange rateTaiwan 44.8 5.6% -0.5% 32.9 -0.2% 2.2% Managed float with central bank intervention to smooth
fluctuations in the currency.Thailand 47.1 4.4% -0.4% 34.6 0.6% 2.3% Managed float with intervention as required.
Source: Bloomberg, Raiffeisen RESEARCH
8/14/2019 Emerging Markets (English Version)
http://slidepdf.com/reader/full/emerging-markets-english-version 19/28
19
Chartbook FX
70
80
90
100
110
120
May-06 Nov-06 May-07 Nov-07 May-08 Nov-08 May-09
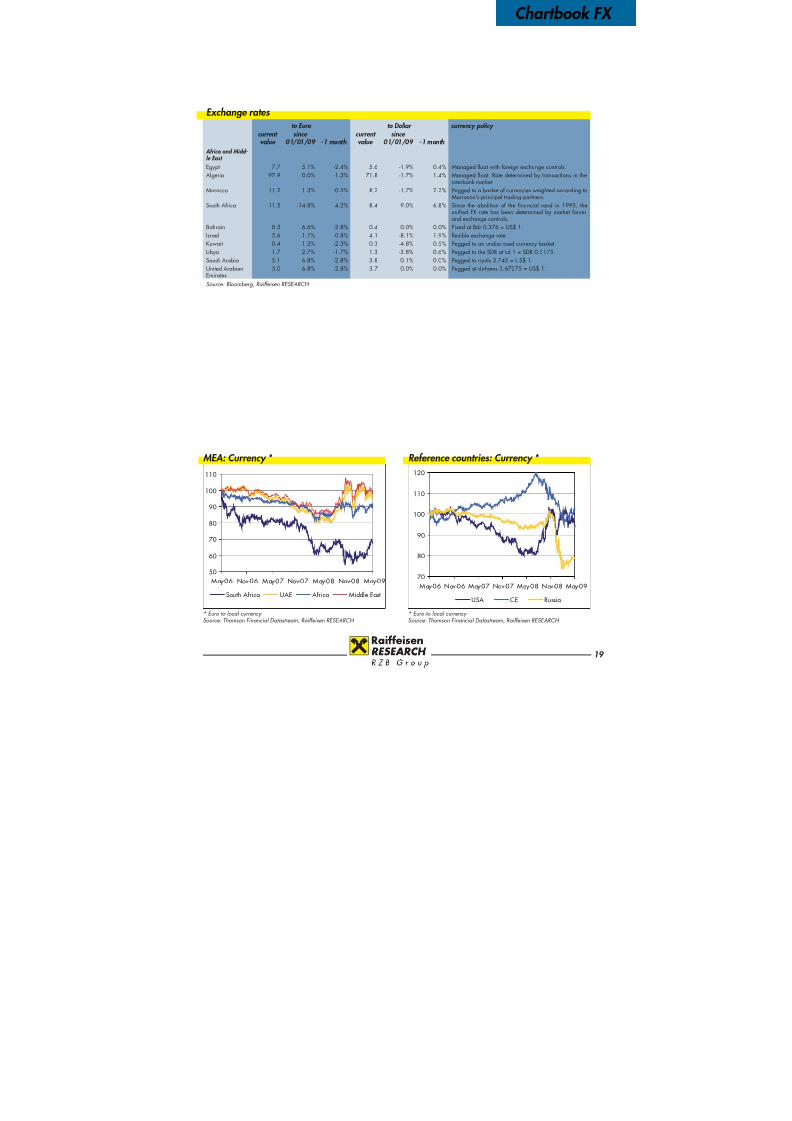
USA CE Russia
Reference countries: Currency *
* Euro to local currency Source: Thomson Financial Datastream, Raiffeisen RESEARCH
50
60
70
80
90
100
110
May-06 Nov-06 May-07 Nov-07 May-08 Nov-08 May-09
South Africa UAE Africa Middle East
MEA: Currency *
* Euro to local currency Source: Thomson Financial Datastream, Raiffeisen RESEARCH
Exchange rates to Euro to Dollar currency policy
current value
since 01/01/09 -1 month
current value
since 01/01/09 -1 month
Africa and Midd- le East
Egypt 7.7 5.1% -2.4% 5.6 -1.9% 0.4% Managed float with foreign exchange controls.Algeria 97.9 0.0% -1.3% 71.8 -1.7% 1.4% Managed float. Rate determined by transactions in the
interbank market.Morocco 11.2 1.3% -0.5% 8.2 -1.7% 2.2% Pegged to a basket of currencies weighted according to
Morrocco's principal trading partners.South Africa 11.5 -14.8% 4.2% 8.4 9.0% 6.8% Since the abolition of the financial rand in 1995, the
unified FX rate has been determined by market forcesand exchange controls.
Bahrain 0.5 6.6% -2.8% 0.4 0.0% 0.0% Fixed at Bdr 0.376 = US$ 1.
Israel 5.6 1.1% -0.8% 4.1 -8.1% 1.9% flexible exchange rateKuwait 0.4 1.2% -2.3% 0.3 -4.8% 0.5% Pegged to an undisclosed currency basket.Libya 1.7 2.7% -1.7% 1.3 -3.8% 0.6% Pegged to the SDR at Ld 1 = SDR 0.5175.Saudi Arabia 5.1 6.8% -2.8% 3.8 0.1% 0.0% Pegged to riyals 3.745 = US$ 1.United ArabienEmirates
5.0 6.8% -2.8% 3.7 0.0% 0.0% Pegged at dirhams 3.67275 = US$ 1.
Source: Bloomberg, Raiffeisen RESEARCH

8/14/2019 Emerging Markets (English Version)
http://slidepdf.com/reader/full/emerging-markets-english-version 20/28
20
Equity markets
Asia: Valuation
Price/earnings ratio Profit growth*
2008 2009e 2008 2009e
Asia 12.6 14.9 -25.8% -6.8%
China 14.9 15.2 -10.2% 4.8%India 15.0 14.2 -8.3% 3.9%
Malaysia 14.8 16.2 -24.0% -13.9%
Thailand 12.2 10.3 33.3% 2.8%
* ConsensusSource: IBES, MSCI, Bloomberg, Raiffeisen RESEARCH
Latin America: Valuation
Price/earnings ratio Profit growth*
2008 2009e 2008 2009e
Latin America 10.8 10.7 -8.7% -0.4%
Argentina 3.9 5.0 14.5% -16.8%Brazil 9.7 9.9 -5.6% -2.1%
Chile 17.8 16.5 5.9% 10.0%
Mexico 13.3 12.1 -25.2% 10.6%
* ConsensusSource: IBES, MSCI, Bloomberg, Raiffeisen RESEARCH
40
80
120
160
200
240
280
May-06 May-07 May-08 May-09
China India Thailand Asia
Asia: MSCI equity indices
In local currency, Return IndizesSource: Thomson Financial Datastream, Raiffeisen RESEARCH
40
70
100
130
160
190
May-06 May-07 May-08 May-09
Argentina BrazilMexico Latin America
Latin America: MSCI equity indices
In local currency, Return IndizesSource: Thomson Financial Datastream, Raiffeisen RESEARCH
-90%
-70%
-50%
-30%
-10%
10%
30%
50%70%
90%
May-06 May-07 May-08 May-09
China India Asia Asia forward
Asia: Earnings growth*
* Forward = rolling earnings expectations for one year Source: IBES, Thomson Financial Datastream, Raiffeisen RESEARCH
-40%
-20%
0%
20%
40%
60%
May-06 May-07 May-08 May-09
Brazil Mexico
Latin America Latin America forward
Latin America: Earnings growth*
* Forward = rolling earnings expectations for one year Source: IBES, Thomson Financial Datastream, Raiffeisen RESEARCH
8/14/2019 Emerging Markets (English Version)
http://slidepdf.com/reader/full/emerging-markets-english-version 21/28
21
Equity markets
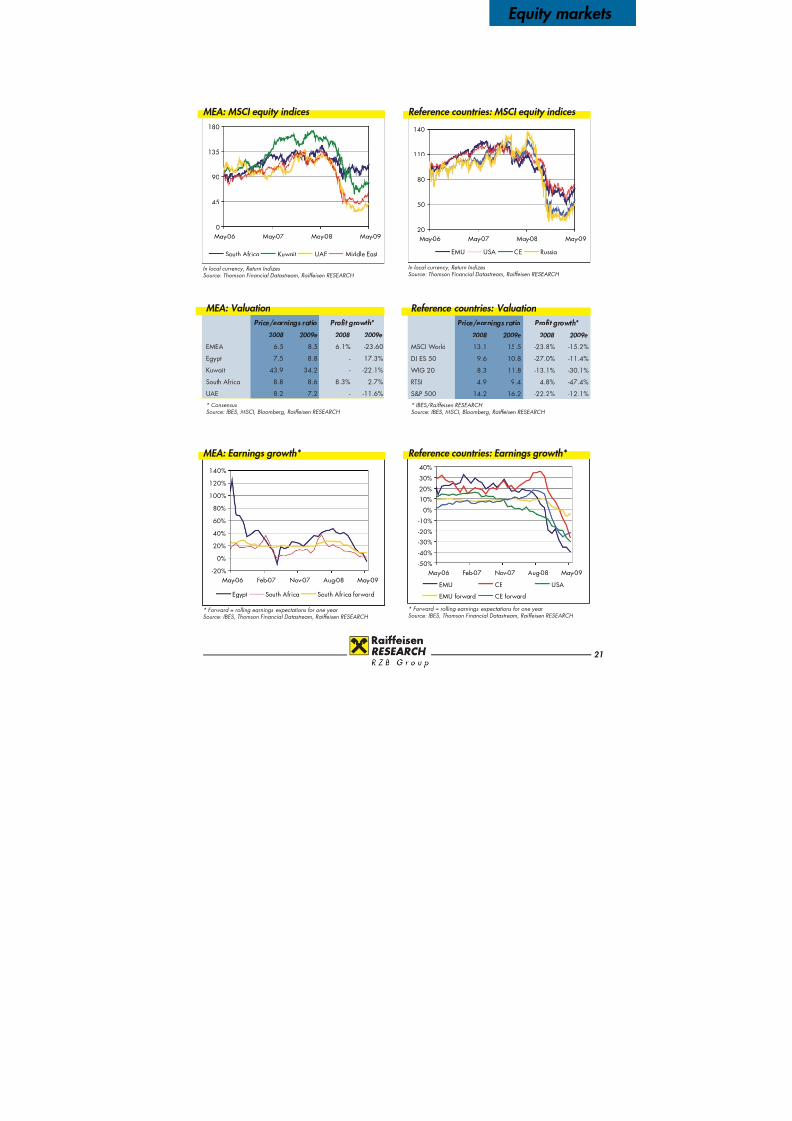
MEA: Valuation
Price/earnings ratio Profit growth*
2008 2009e 2008 2009e
EMEA 6.5 8.5 6.1% -23.60
Egypt 7.5 8.8 - 17.3%Kuwait 43.9 34.2 - -22.1%
South Africa 8.8 8.6 8.3% 2.7%
UAE 8.2 7.2 - -11.6%
* ConsensusSource: IBES, MSCI, Bloomberg, Raiffeisen RESEARCH
Reference countries: Valuation
Price/earnings ratio Profit growth*
2008 2009e 2008 2009e
MSCI World 13.1 15.5 -23.8% -15.2%
DJ ES 50 9.6 10.8 -27.0% -11.4%WIG 20 8.3 11.8 -13.1% -30.1%
RTSI 4.9 9.4 4.8% -47.4%
S&P 500 14.2 16.2 -22.2% -12.1%
* IBES/Raiffeisen RESEARCH Source: IBES, MSCI, Bloomberg, Raiffeisen RESEARCH
0
45
90
135
180
May-06 May-07 May-08 May-09
South Africa Kuwait UAE Middle East
MEA: MSCI equity indices
In local currency, Return IndizesSource: Thomson Financial Datastream, Raiffeisen RESEARCH
20
50
80
110
140
May-06 May-07 May-08 May-09
EMU USA CE Russia
Reference countries: MSCI equity indices
In local currency, Return IndizesSource: Thomson Financial Datastream, Raiffeisen RESEARCH
-20%
0%
20%
40%
60%
80%
100%
120%
140%
May-06 Feb-07 Nov-07 Aug-08 May-09
Egypt South Africa South Africa forward
MEA: Earnings growth*
* Forward = rolling earnings expectations for one year Source: IBES, Thomson Financial Datastream, Raiffeisen RESEARCH
-50%
-40%
-30%
-20%
-10%
0%
10%
20%30%
40%
May-06 Feb-07 Nov-07 Aug-08 May-09
EMU CE USA
EMU forward CE forward
Reference countries: Earnings growth*
* Forward = rolling earnings expectations for one year Source: IBES, Thomson Financial Datastream, Raiffeisen RESEARCH

8/14/2019 Emerging Markets (English Version)
http://slidepdf.com/reader/full/emerging-markets-english-version 22/28
22
Risk indicators
Asia MSCI World
Beta Beta up Beta down Volatility
China 1.88 3.32 1.06 30.6%
Hong Kong 1.50 2.25 0.88 26.3%
India 1.08 0.19 0.32 37.5%
Indonesia 0.96 -0.63 0.29 35.5%
Malaysia 0.46 0.49 -0.40 18.1%
Philippines 1.08 1.00 0.54 31.9%
Singapore 1.03 1.34 0.67 47.1%
South Korea 1.07 1.24 0.63 28.4%
Taiwan 1.02 0.04 0.48 22.6%
Thailand 1.03 1.22 -0.19 23.1%
MSCI Emerging Markets Beta Beta up Beta down Difference
China 1.73 2.06 1.84 0.21
Hong Kong 1.15 1.47 1.29 0.19
India 1.09 0.73 1.09 -0.36
Indonesia 1.06 0.34 0.95 -0.61
Malaysia 0.59 0.70 0.39 0.31
Philippines 0.86 0.99 0.85 0.14
Singapore 0.76 1.36 0.46 0.90
South Korea 0.81 0.71 0.58 0.13
Taiwan 0.86 0.21 0.64 -0.43
Thailand 0.91 0.59 0.41 0.18
Source: Thomson Financial Datastream, Raiffeisen RESEARCH
Latin America MSCI World
Beta Beta up Beta down Volatility
Argentina 1.0 0.7 1.0 41.1%
Brazil 1.4 1.1 1.5 21.6%
Chile 1.0 0.7 1.4 23.4%
Colombia 0.7 -0.2 0.5 16.9%
Mexico 1.0 1.6 1.2 33.8%
Peru 1.1 0.9 1.3 39.7%
MSCI Emerging Markets Beta Beta up Beta down Difference
Argentina 0.8 0.9 0.9 0.1Brazil 1.1 1.2 1.4 -0.1
Chile 0.6 0.4 1.1 -0.6
Colombia 0.4 -0.4 0.1 -0.5
Mexico 0.6 1.3 0.6 0.7
Peru 0.9 0.9 1.0 0.0
Source: Thomson Financial Datastream, Raiffeisen RESEARCH
0
100
200
300
400
500
600
700
May-07 Nov-07 May-08 Nov-08 May-09
China India South Korea Thailand
Asia: CDS 5 years
Source: Thomson Financial Datastream, Raiffeisen RESEARCH
0
100
200
300
400
500
600
May-07 Nov-07 May-08 Nov-08 May-090
800
1,600
2,400
3,200
4,000
4,800
Brazil Mexico
Chile Argentina (r.h.s.)
Latin America: CDS 5 years
Source: Thomson Financial Datastream, Raiffeisen RESEARCH
8/14/2019 Emerging Markets (English Version)
http://slidepdf.com/reader/full/emerging-markets-english-version 23/28
23
Risk indicators
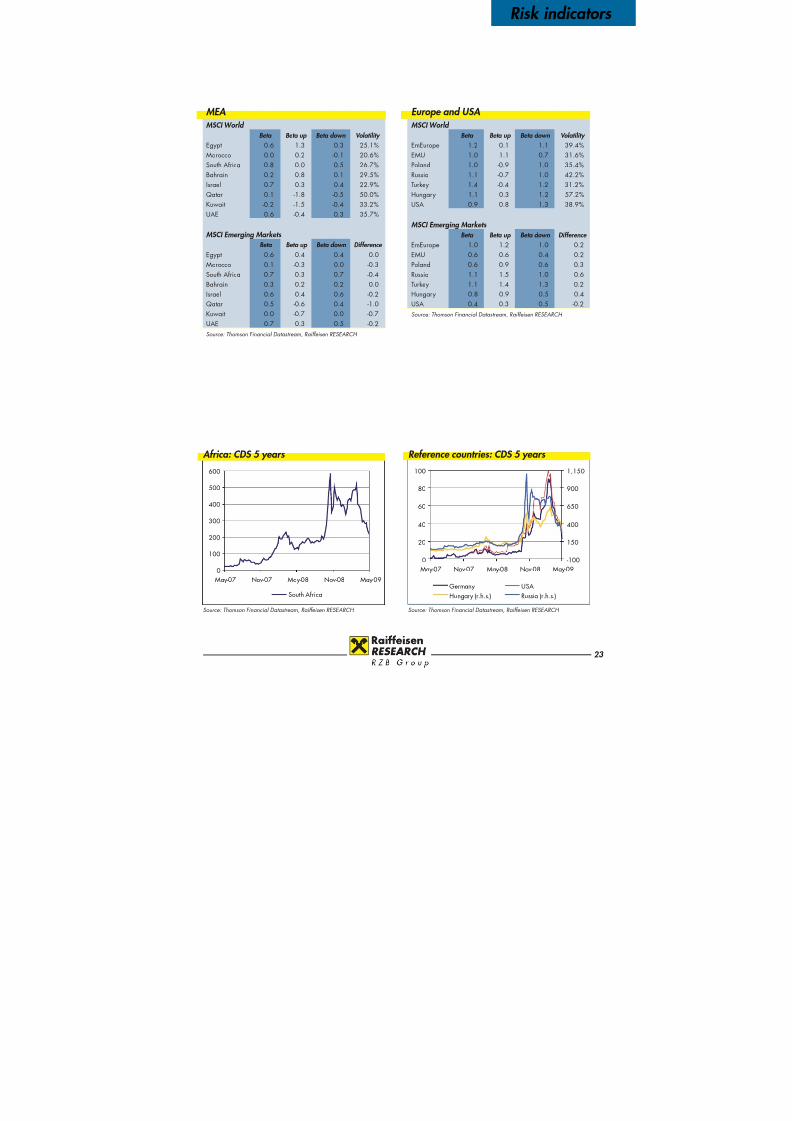
MEA MSCI World
Beta Beta up Beta down Volatility
Egypt 0.6 1.3 0.3 25.1%
Morocco 0.0 0.2 -0.1 20.6%
South Africa 0.8 0.0 0.5 26.7%
Bahrain 0.2 0.8 0.1 29.5%
Israel 0.7 0.3 0.4 22.9%
Qatar 0.1 -1.8 -0.5 50.0%
Kuwait -0.2 -1.5 -0.4 33.2%
UAE 0.6 -0.4 0.3 35.7%
MSCI Emerging Markets Beta Beta up Beta down Difference
Egypt 0.6 0.4 0.4 0.0
Morocco 0.1 -0.3 0.0 -0.3
South Africa 0.7 0.3 0.7 -0.4
Bahrain 0.3 0.2 0.2 0.0
Israel 0.6 0.4 0.6 -0.2
Qatar 0.5 -0.6 0.4 -1.0
Kuwait 0.0 -0.7 0.0 -0.7
UAE 0.7 0.3 0.5 -0.2
Source: Thomson Financial Datastream, Raiffeisen RESEARCH
Europe and USA MSCI World
Beta Beta up Beta down Volatility
EmEurope 1.2 0.1 1.1 39.4%
EMU 1.0 1.1 0.7 31.6%
Poland 1.0 -0.9 1.0 35.4%
Russia 1.1 -0.7 1.0 42.2%
Turkey 1.4 -0.4 1.2 31.2%
Hungary 1.1 0.3 1.2 57.2%
USA 0.9 0.8 1.3 38.9%
MSCI Emerging Markets
Beta Beta up Beta down Difference EmEurope 1.0 1.2 1.0 0.2
EMU 0.6 0.6 0.4 0.2
Poland 0.6 0.9 0.6 0.3
Russia 1.1 1.5 1.0 0.6
Turkey 1.1 1.4 1.3 0.2
Hungary 0.8 0.9 0.5 0.4
USA 0.4 0.3 0.5 -0.2
Source: Thomson Financial Datastream, Raiffeisen RESEARCH
0
20
40
60
80
100
May-07 Nov-07 May-08 Nov-08 May-09-100
150
400
650
900
1,150
Germany USA
Hungary (r.h.s.) Russia (r.h.s.)
Reference countries: CDS 5 years
Source: Thomson Financial Datastream, Raiffeisen RESEARCH
0
100
200
300
400
500
600
May-07 Nov-07 May-08 Nov-08 May-09
South Africa
Africa: CDS 5 years
Source: Thomson Financial Datastream, Raiffeisen RESEARCH

8/14/2019 Emerging Markets (English Version)
http://slidepdf.com/reader/full/emerging-markets-english-version 24/28
24
Technical analysis
WeeklyQ/.HSCE 22.06.2008- 31.05.2009(HKG)
10500
Price
HKD
.12
5.000
6.000
7.000
8.000
9.000
10.000
11.000
12.000
13.000
Price
HKD
.12
5.000
6.000
7.000
8.000
9.000
10.000
11.000
12.000
13.000
Jul Aug Sep Okt Nov Dez Jän Feb Mär Apr Mai
Q3 2008 Q4 2008 Q1 2009 Q2 2009
Hang Seng CE
Source: Thomson Financial Datastream, Raiffeisen RESEARCH
Monthly Q.BVSP 31.01.2008- 31.07.2009(SAO)
36.962,01
45.660,16
56.461,83
59.831,82
63.201,8
Cndl;Q.BVSP;Last Trade
31.05.2009;47.289,53;52.095,85;47.289,53;50.976,39
Cndl;Q.BVSP;Last Trade
31.05.2009;47.289,53;52.095,85;47.289,53;50.976,39
Price
BRL
.12
32.000
36.000
40.000
44.000
48.000
52.000
56.000
60.000
64.000
68.000
Price
BRL
.12
32.000
36.000
40.000
44.000
48.000
52.000
56.000
60.000
64.000
68.000
72.000
Q1 Q2 Q3 Q4 Q1 Q2 Q3
2008 2009
Bovespa Index
Source: Thomson Financial Datastream, Raiffeisen RESEARCH
Hang Seng CE
last: 9,722 buy target: 10,500The price could rise towards the resistance 10,500after the breakout of the flag-pattern.
Bovespa Index
last: 50,976 position: long target: 56,460As the Fibo-area has been left behind at 45,660,an advance towards 56,460 is expectable. Stop49,100 -> 46,540.
Monthly Q/.JALSH 30.11.2007- 31.07.2009(JHB)
18.792,87
22.218,87
26.476,78
27.773,87
29.070,95
Cndl;Q/.JALSH;Last Trade
31.05.2009;20.647,03;22.172,41;20.647,03;21.800,20
Cndl;Q/.JALSH;Last Trade
31.05.2009;20.647,03;22.172,41;20.647,03;21.800,20
Price
ZAR
.12
19.000
20.000
21.000
22.000
23.000
24.000
25.000
26.000
27.000
28.000
29.000
30.000
31.000
32.000
Price
ZAR
.12
19.000
20.000
21.000
22.000
23.000
24.000
25.000
26.000
27.000
28.000
29.000
30.000
31.000
32.000
Q1 Q2 Q3 Q4 Q1 Q2 Q3
2007 2008 2009
JSE All-Share Index
Source: Thomson Financial Datastream, Raiffeisen RESEARCH
WeeklyQ.BSESN 13.07.2008- 07.06.2009(BOM)
Price
INR
.12
8.000
9.000
10.000
11.000
12.000
13.000
14.000
15.000
Price
INR
.12
8.000
9.000
10.000
11.000
12.000
13.000
14.000
15.000
Aug Sep Okt Nov Dez Jän Feb Mär Apr Mai Jun
Q3 2008 Q4 2008 Q1 2009 Q2 2009
Bombay SENSEX
Source: Thomson Financial Datastream, Raiffeisen RESEARCH
JSE All-Share Index
last: 21,872 position: long target: 26,500Per se rated neutral while inst the range 17,770 -23,050, a buy-signal is expectable, stop 20,275 ->
18,090 - 17,770.
Bombay SENSEX
last: 12,026 position: long target: 13,000The up-trend is still valid (-> 136,00 - 13,400). There-fore the index will stay beyond 10,950.

8/14/2019 Emerging Markets (English Version)
http://slidepdf.com/reader/full/emerging-markets-english-version 25/28
25
Technical analysis
Weekly Q.CRB 19.10.2008- 14.06.2009(NYC)
93,79
25,78
38,84
51,91
Cndl;Q.CRB;Last Trade
17.05.2009;243,11;243,11;240,97; 242,60
Cndl;Q.CRB;Last Trade
17.05.2009;243,11;243,11;240,97; 242,60
Price
USD
.12
210
220
230
240
250
260
270
280
290
300
Price
USD
.12
210
220
230
240
250
260
270
280
290
300
19 26 02 09 16 23 30 07 14 21 28 04 11 18 25 01 08 15 22 01 08 15 22 29 05 12 19 26 03 10 17 24 31 07 14
Okt 08 Nov 08 Dez 08 Jän 09 Feb 09 Mär 09 Apr 09 Mai 09 Jun 09
CRB Index
Source: Thomson Financial Datastream, Raiffeisen RESEARCH
Weekly QMXN= 21.09.2008- 21.06.2009 (GMT)
10,7386
11,662
12,5854
Cndl;QMXN=;Bid
17.05.2009;13,0249;13,2975;12,9895; 13,2250
Cndl;QMXN=;Bid
17.05.2009;13,0249;13,2975;12,9895; 13,2250
Price
/USD
.1234
10
10,5
11
11,5
12
12,5
13
13,5
14
14,5
15
15,5
Price
/USD
.1234
10
10,5
11
11,5
12
12,5
13
13,5
14
14,5
15
15,5
21 28 05 12 19 26 02 09 16 23 30 07 14 21 28 04 11 18 25 01 08 15 22 01 08 15 22 29 05 12 19 26 03 10 17 24 31 07 14 21
Sep 08 Okt 08 Nov 08 Dez 08 Jän 09 Feb 09 Mär 09 Apr 09 Mai 09 Jun 09
USD/MXN
Source: Thomson Financial Datastream, Raiffeisen RESEARCH
USD/MXN
last: 13,22 sell 12,85 target: 12,37 - 10,73The price is still testing the trend-channel from above,might fall back into it at 12.37, but in before reverseto in beyond of 13.35 -> 13.74 - 14.
Weekly QZAR= 19.10.2008- 14.06.2009 (GMT)
9,2818
11,0436
11,5784
Cndl;QZAR=;Bid
17.05.2009;8,2940;8,5350;8,2100; 8,4341
Cndl;QZAR=;Bid
17.05.2009;8,2940;8,5350;8,2100; 8,4341
Price
/USD
.1234
8,4
8,8
9,2
9,6
10
10,4
10,8
11,2
11,6
Price
/USD
.1234
8,4
8,8
9,2
9,6
10
10,4
10,8
11,2
11,6
19 26 02 09 16 23 30 07 14 21 28 04 11 18 25 01 08 15 22 01 08 15 22 29 05 12 19 26 03 10 17 24 31 07 14
Okt 08 Nov 08 Dez 08 Jän 09 Feb 09 Mär 09 Apr 09 Mai 09 Jun 09
USD/ZAR
Source: Thomson Financial Datastream, Raiffeisen RESEARCH
Monthly QBRL= 30.04.2007- 30.09.2009(GMT)
1,5272
,0010
,4747
Cndl;QBRL=;Bid
31.05.2009;2,1893;2,1893;2,0509; 2,0665
Cndl;QBRL=;Bid
31.05.2009;2,1893;2,1893;2,0509; 2,0665
Price
/USD
.1234
1,6
1,7
1,8
1,9
2
2,1
2,2
2,3
2,4
2,5
2,6
Price
/USD
.1234
1,6
1,7
1,8
1,9
2
2,1
2,2
2,3
2,4
2,5
2,6
Q2 Q3 Q4 Q1 Q2 Q3 Q4 Q1 Q2 Q3
2007 2008 2009
USD/BRL
Source: Thomson Financial Datastream, Raiffeisen RESEARCH
USD/ZAR
last: 8.44 buy 8.5780 target: 8.90 - 9.27Real good support inst the range 7.90 - 8.10, thusbullish reversal and recovery towards the target-area
expectable. Bearish confirmation: 7.82 -> 7.15
USD/BRL
last: 2.0665 sell 2.04 target: 1.80 - 1.50With regard to the failure at 2.47 a drop towards 2.0and thus 1.8975 -> 1.5541 is likely. Buy 2.0850 ->
2.1210 - 2.18.
CRB Index
last: 242,60 position: long target: 270Massive resistance at 245, backed-up by rectangleand rising-resistance-line. Thus a bounce-back to 234- 225 cannot be fully ruled out.
8/14/2019 Emerging Markets (English Version)
http://slidepdf.com/reader/full/emerging-markets-english-version 26/28
26
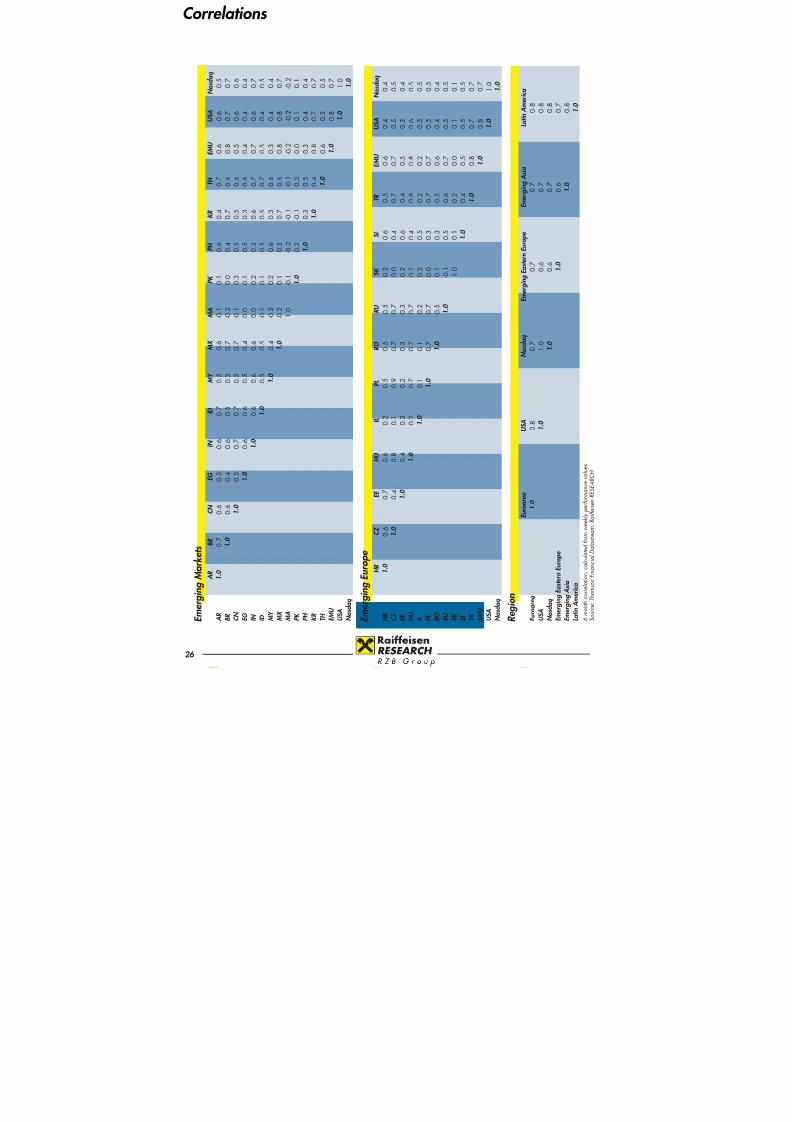
Correlations
E m e r g i n g M a r k e t s
A R
B R
C N
E G
I N
I D
M Y
M X
M A
P K
P H
K R
T H
E M U
U
S A
N a s d a q
A R
1 . 0
0 . 7
0 . 6
0 . 5
0 . 6
0 . 7
0 . 5
0 . 6
- 0 . 1
0 . 1
0 . 6
0 . 4
0 . 7
0 . 6
0
. 6
0 . 5
B R
1 . 0
0 . 6
0 . 4
0 . 6
0 . 5
0 . 2
0 . 7
- 0 . 2
0 . 0
0 . 4
0 . 7
0 . 6
0 . 8
0
. 7
0 . 7
C N
1 . 0
0 . 5
0 . 7
0 . 7
0 . 5
0 . 7
- 0 . 1
0 . 3
0 . 5
0 . 5
0 . 6
0 . 5
0
. 6
0 . 6
E G
1 . 0
0 . 6
0 . 6
0 . 5
0 . 4
0 . 0
0 . 1
0 . 5
0 . 3
0 . 6
0 . 4
0
. 4
0 . 4
I N
1 . 0
0 . 6
0 . 6
0 . 6
0 . 0
0 . 2
0 . 3
0 . 6
0 . 7
0 . 7
0
. 6
0 . 7
I D
1 . 0
0 . 5
0 . 5
- 0 . 1
0 . 1
0 . 5
0 . 5
0 . 7
0 . 5
0
. 4
0 . 5
M Y
1 . 0
0 . 4
- 0 . 2
0 . 2
0 . 6
0 . 3
0 . 6
0 . 3
0
. 4
0 . 4
M X
1 . 0
- 0 . 2
0 . 1
0 . 3
0 . 7
0 . 6
0 . 8
0
. 8
0 . 7
M A
1 . 0
- 0 . 1
- 0 . 2
- 0 .
1
- 0 .
1
- 0 .
2
- 0
. 2
- 0 .
2
P K
1 . 0
0 . 2
- 0 .
1
0 . 0
0 . 0
0
. 1
0 . 1
P H
1 . 0
0 . 3
0 . 5
0 . 3
0
. 4
0 . 4
K R
1 . 0
0 . 4
0 . 8
0
. 7
0 . 7
T H
1 . 0
0 . 6
0
. 5
0 . 5
E M U
1 . 0
0
. 8
0 . 7
U S A
1
. 0
1 . 0
N a s d a q
1 . 0
E m e r g i n g E u r o p e
H R
C Z
E E
H U
I L
P L
R O
R U
S K
S I
T R
E M U
U S A
N a s d a q
H R
1 . 0
0 .
6
0 . 7
0 .
6
0 . 2
0 .
5
0 .
5
0 . 5
0 .
2
0
. 6
0 .
5
0 .
6
0 . 4
0 .
4
C Z
1 . 0
0 . 4
0 .
8
0 . 1
0 .
9
0 .
7
0 . 7
0 .
0
0
. 4
0 .
7
0 .
7
0 . 5
0 .
5
E E
1 . 0
0 .
4
0 . 3
0 .
2
0 .
3
0 . 3
0 .
2
0
. 6
0 .
4
0 .
5
0 . 3
0 .
4
H U
1 . 0
0 . 2
0 .
7
0 .
7
0 . 7
0 .
1
0
. 4
0 .
8
0 .
8
0 . 6
0 .
5
I L
1 . 0
0 .
1
0 .
1
0 . 2
0 .
2
0
. 5
0 .
2
0 .
2
0 . 5
0 .
5
P L
1 . 0
0 .
7
0 . 7
0 .
0
0
. 3
0 .
7
0 .
7
0 . 5
0 .
5
R O
1 . 0
0 . 5
0 .
1
0
. 3
0 .
5
0 .
6
0 . 4
0 .
4
R U
1 . 0
- 0 .
1
0
. 5
0 .
6
0 .
7
0 . 5
0 .
5
S K
1 .
0
0
. 1
0 .
2
0 .
0
0 . 1
0 .
1
S I
1
. 0
0 .
4
0 .
5
0 . 5
0 .
5
T R
1 . 0
0 .
8
0 . 7
0 .
7
E M U
1 . 0
0 . 8
0 .
7
U S A
1 . 0
1 .
0
N a s d a q
1 . 0
R e g i o n
E u r o a r e a
U S A
N a s d a q
E m e r g i n g E a s t e r n E u r o p
e
E m e r g i n g A s i a
L a t i n A m e r i c a
E u r o a r e a
1 . 0
0 . 8
0 .
7
0 .
7
0 . 7
0 .
8
U S A
1 . 0
1 .
0
0 .
6
0 . 7
0 .
8
N a s d a q
1 . 0
0 .
6
0 . 7
0 .
8
E m e r g i n g
E a s t e r n E u r o p e
1 . 0
0 . 6
0 .
7
E m e r g i n g
A s i a
1 . 0
0 .
8
L a t i n A m e r i c a
1 . 0
6 m o n t h c o r r e l a t i o n , c a l c u l a t e d f r o m
w e e k l y p e r f o r m a n c e v a l u e s
S o u r c e : T h
o m s o n F i n a n c i a l D a t a s t r e a m , R a i f f e i s e n R E S E A R C
H
8/14/2019 Emerging Markets (English Version)
http://slidepdf.com/reader/full/emerging-markets-english-version 27/28
27
Abbreviations
Countries
AR ArgentinaBR BrazilCN ChinaCZ Czech RepublicDE GermanyEE EstoniaEM Emerging MarketsEMU European monetary unionHR CroatiaHU HungaryID IndonesiaIL IsraelIN India
JP JapanKR Korea (Republic)MA MoroccoMEA Africa and Middle EastCE Middle- and Eastern European
CountriesMX MexicoMY MalaysiaPH PhilippinesPK PakistanPL Poland
RO RomaniaRU RussiaSL SloveniaSK SlovakiaTH ThailandTR TurkeyUSA United States of AmericaUAE United Arab EmiratesZA South Africa
Economic abbreviations
GDP Gross Domestic Productbp basis points
yoy year on yearpp percentage pointsCPI Consumer Price IndexC/A Current Account
Cut-off for data: 11 May 2009
This document does not constitute an offer or invitation to subscribe for or purchase any securities and neither this document nor anything contained herein shall form the
basis of any contract or commitment whatsoever. This document is being furnished to you solely for your information and may not be reproduced or redistributed to anyother person. Any investment decision with respect to any securities of the respective company must be made on the basis of an offering circular or prospectus approved bysuch company and not on the basis of this document. RZB may have effected an own account transaction in any investment mentioned herein or related investments and ormay have a position or holding in such investments as a result. RZB may have been, or might be, acting as a manager or co-manager of a public offering of any securitiesmentioned in this report or in any related security. Information contained herein is based on sources, including annual reports and other material which might have beenmade available by the entity which is the subject of this document. RZB believes all the information to be reliable, but no representations are made as to their accuracy andcompleteness. Unless otherwise stated, all views (including statements and forecasts) are solely those of RZB and are subject to change without notice.Investors in emerging markets need to be aware that settlement and custodial risk may be higher than in markets where there is a long established infrastructure and that stockliquidity may be impacted by the numbers of market makers which may therefore impact upon the reliability of any investments made as a result of acting upon informationcontained in this document. Special regulations for the Republic of Austria: This document does not constitute either a public offer in the meaning of the Kapitalmarktgesetz(„KMG“) nor a prospectus in the meaning of the KMG or of the Börsegesetz. Furthermore this document does not intend to recommend the purchase or the sale of securitiesor investments in the meaning of the Wertpapieraufsichtsgesetz. This document shall not replace the necessary advice concerning the purchase or the sale of securities orinvestments. For any advice concerning the purchase or the sale of securities of investments kindly contact your RAIFFEISENBANK. Special regulations for the United Kingdomof Great Britain and Northern Ireland (UK): Raiffeisen Zentralbank. This publication has been either approved or issued by Raiffeisen Zentralbank Österreich AG (RZB) inorder to promote its investment business. RZB is regulated for the conduct of investment business within the UK by the Financial Service Authority (FSA) and a member of theLondon Stock Exchange. This publication is not intended for investors who are private customers within the meaning of the FSA rules and should therefore not be distributedto them. Neither the information nor the opinions expressed herein constitute or are to be construed as an offer or solicitation of an offer to buy (or sell) investments. RZB mayhave effected an Own Account Transaction within the meaning of FSA rules in any investment mentioned herein or related investments and or may have a position or holdingin such investments as a result. RZB may have been, or might be, acting as a manager or co-manager of a public offering of any securities mentioned in this report or in any
related security. Special regulations for the United States of America (USA) and Canada: This document or any copy hereof may not be taken or transmitted or distributed,in the USA or Canada or their respective territories or possessions nor may it be distributed to any USA-person or person resident in Canada by any means other than via aU.S. Broker Dealer. Any failure to comply with these restrictions may constitute a violation of USA or Canadian securities laws.Authorised by the Austrian Financial Market Authority and by the Financial Services Authority; regulated by the Financial Services Authority for the conduct of UK businessRegulated by the Jersey Financial Services Commission
Emerging Markets Abbreviations

8/14/2019 Emerging Markets (English Version)
http://slidepdf.com/reader/full/emerging-markets-english-version 28/28
www.raiffeisenresearch.at
Kommen Sie den
Finanzmärkten
ein gutes Stück näher.
Head, strategy Peter Brezinschek
Head Assistent ResearchPhilipp Bonato
Quant Research / Emerging Markets
Veronika Lammer (Head)Lydia KrannerNina KukicChristian LinkAndreas Reschreiter Josef Wolfesberger
Technical analysis Klemens HrovathRobert Schittler
Publications, layout Silvia FaschingKathrin KorinekMarion StadlerMarion Zeller
Economics, interest rates, currencies Valentin Hofstätter (Head)Walter DemelWolfgang ErnstIngo JungwirthMarcin KopaczynskiAndreas Schwabe
Gintaras ShlizhyusGottfried SteindlMartin Stelzeneder
Credit/Corporate Bonds Christoph Klaper (Head)Carmen DohrMartin KutnyMatthias LauermannDoris OswaldManuel SchreiberGleb ShpilevoyAlexander SkleminBeatrix Thaler
Stock market researchHelge Rechberger (Head)Aaron AlberChristian Hinterwallner Jörn LangeHannes LoackerRichard Malzer
Johannes MattnerChristine NowakLeopold SalcherAndreas SchillerMagdalena Wasowicz
Company ResearchBirgit Kuras (Head)
Stefan Maxian (Head Austria & CEE)Philipp ChladekDaniel DamaskaNatalia Frey
Marta GizejowskaKlaus KüngBernd MaurerDominik NiszczKlaus OfnerTeresa Schinwald Jovan SikimicAlexander StiegerArno SupperIryna Trygub
Raiffeisen RESEARCH Team
Albania
Helga Strazimiri Bosnia & Herzegovina Zeljko PeharSergio Ermacora Jasmin GabelaLejla BaljevicIvona KristicTarik SirbegovicMaida Gopo Bulgaria Dimitar Chobanow
Croatia Anton StarcevicZdeslav SanticZrinka Zivkovic Matijevic
Marijana CveljoNada HarambasicAna Franin
Poland
Jacek WisniewskiMarta Petka-ZagajewskaMarcin GrotekWojciech BogackiDorota Strauch
Romania Ionut DumitruNicolae CovrigRomulus MirceaIon Gheorghe GutaBogdan CampianuOleg GalburIonut GutisAlexander CombeiIuliana Mocanu
Russia
Anton PletenevAlexander ProtsenkoMikhail NikitinKonstantin SorinAnna Yudina
Serbia
Aleksandra VukosavljevicLjiljana GrubicMiodrag Sladojevic Jovana Orlic
Slovakia Robert Prega Juraj ValachyBranislav BaricakMartin JelenciakBoris Fojtik
Slovenia Primoz Kovacic
Czech Republic Pavel MertlikHelena Horska
Michal BrozkaAles Michl Jindrich SvatekLenka Kalivodova
Ukraine
Dmytro SologubLudmila Zagoruyko
Hungary Zoltan TörökMatyas KovacsAkos HerczenikLevente Blaho
Belarus Oleg LeontevVasily PirogovskyNatalya Chernogorova


