Christopher B. Barry Texas Christikln Univenity Joha W. Peavy In, CFA Founders Tmst Company lMaurPicio Rodra'ggez Texas Christian U~iuenit-y Emerging Stock Markets: Risk, Rewrn, and Perfo The Research Foundation of The InstlWute of Chartered Financial Analysts
Transcript
Christopher B. Barry Texas Christikln Univenity
Joha W. Peavy In, CFA Founders Tmst Company
lMaurPicio Rodra'ggez Texas Christian U~iuenit-y
Emerging Stock Markets: Risk, Rewrn, and Perfo
The Research Foundation of The InstlWute of Chartered Financial Analysts
Research Foundatism Publications
Active Currency ~Vanagement by Murali Ramaswarni
Analysts'Eaf7zitzgs Forecast Accuracy i9a japan aazd the United States
by Robert M. Comoy, Robert S. Harris, and Young S. Park
Bankrzrptcy Prediction Using AAz>cial Neuml Systems
by Robert E. Dorsey, Robert 0. Edrnister, and John D. Johnson
Cmzadian Stocks, Bonds, Bills, and I~zjlatiow: 1950-1987
by James E. Hatch and Robert E. White
Company Pe$ormann awd Measures of Value Added
by Pamela P. Peterson, CFA, and David R. Peterson
Corporate Bond Rating D$?: Examination of Credit Qualzty Rating Changes over Tinw
by Edward I. Altinan and Duen Li Kao
Corporafc Governance and Firm P~q6or$?zance by Jonathan M. Karpoff, M. Wayne Marr, Jr., and
Morris G. Danielson
Currezcy L%nagenzent: Concepts and Practices by Roger G. Clarke and Mark P. Kritzman, CFA
Earnings Fo$recash and Slzave Price Reversals by Werner F.M. De Bondt
Ecoazomically Targeted and Social Investments: bvestnze%t Manag~nzent aazd Pension Fzmd Performance
by M. Wayne Marr, John R. Nofsinger, and John L. Trirnble
Equity Trading Costs by Hans R. Sloll
Ethics, Fairness, Eficiejzcy, a d Financial Markets by Hersh Shefrin and Meir Statman
Ethics in the Ifizuest~zent Profission: A Survey by E. Theodore Veit, CFA, and Michael R.
Murphy, CFA
Ethics in the I~z~estancnt Profession. Alz I~tter~tational Sz4rvey
by B. Kent Baker, CFA, E. Theodore Veit, CFA, and Michael R. Murphy, CFA
The Fouazders of Modern finance: Their Prize- Winnhg Concepts aalzd 19.90 hTobel Lectures
Fmnclzise Value and the P'ice/Earnings Ratio by Ma~-&in L. Leibowitz and Stanley bge lman
Fundas~cntal Considerations in Cross-Border Investvzent: The Earopean View
by Bruno Soinik
Global Assrt ,Vanagemeat and Pe$oronna~zce Attribution
by Denis S. Karaosky and Brian D. Singer, CFA
Iazformation Trading, Volatility, a d Liquidity in Ofltioaz ,%farkets
by Joseph A. Cherian and Anne Frernae~lt Vila
Initial Dividends and Inzpkicafions for Investors by James W. Wansley, CFA, William R. Lane, CFA,
and Phillip R. Daves
Igitial Public Offerif~gs: Tlze Role of Veztztre Capitalists
by Joseph T. Lim and Anthony Saunders
Interest Rate and Currency SwQs: A Tutorial by Keith 6. Brown, CFA, arid Dondd J. Smith
Interest Rate Modcling alzd the Risk Prenziunzs in Inkrest Rate Szuaps
by Robert Brooks, CFA
Managed Fatares afld Their Role in Inuestnzent Po~oEios
by Don M. Chance, CFA
The ,Wodern Role ofBond Covenants by Ileen B. hlalitz
A ,%rew Pempectivp on Asset Allocatioaz by Martin L. Leibowitz
Options alzd Futzeres: A Tuton'al by Roger G. Clarke
The Poison PiEI Anti-TakeovcrDef"esc: The Price of Strategic Deterrence
by Robert F. Bruner
A Practitioazer's Guide to Factor Modck
Predictable Time-Va'arying Components of Intergational Asset Rebunzs
by Bruno Solnik
Tlze Role of Risk Tolerance i~z the Asset Allocation Process: A New Perspcctiv~
by W.V. Harlow 111, GFA, and Keith C. Brown, CFA
Selecting Superior Secuf,itics by Marc R. Reinganum
Time Diuersificatio% &visited by William Reichenstein, GFA, and Dovalee
Dorsett
Emerging Stock Markets: Risk, Return, and Perfo
Q 1997 The Research Foundation of the Institute of Chartered Financial Analysts
All rights reserved. No part of this publication may be reproduced, stored in a retrieval system, or transmitted, in any form or by any means, electronic, mechanical, photocopying, recording, or otherwise, without the prior written permission of the copyright holder.
This publication is designed to provide accurate and authoritative information in regard to the subject matter covered. It is sold with the understanding that the publisher is not engaged in rendering legal, accounting, or other professional service. If legal advice or other expert assistance is required, the services of a competent professional should be sought.
The Institute of Chartered Financial Analysts is a subsidiary of the Association for Investment Management and Research.
Printed in the United States of America
June 1997
Bette Collins Editor
Roger Mitchell Assistant Editor
Christine P. Martin Production Coordinator
Jaynee kl. Dudley Production Manager
Diane B. Ramshar Typesetting/Layout
Th ~aearch~oundation's mission is to
ihnttB/ f ind ; andpublish resear& tht
member inves nt practitioners a d
The Research Foundation of The H~zstitzkte of Chartered fi~zancial Azalysts
I? 0. Box 3668 Charlottesoille, Virginia 22903
U. S. A. Telephone: 804-980-3655 Fax: 804-963-6826
Ghdsbpher B. Barry is a professor of finance and holds the Robert and Maria Lowdon Chair of Business Adminiska~on in the M.J. Neeley School of Business at Texas Christian University. Previously, he sewed as chair of the Department of Finance at Southern Methodist University and held positions on the faculties of The University of Texas at Austin and the University of Florida. Professor Barry also has taught extensively throughout Latin America and Europe. He is the author of numerous journal articles in the areas of uncertainty in portfolio management and capital markets, the going-public process, venture capital, and emerging capital markets. Professor Barry is book review editor of tl~eJourpzal ofFhame and associate editor o i the jou r~a l ofmvcsting, Efazergipzg Markets Quarterly, and the kadi?t American Busi~ess Review. He holds a B.S. from Georgia Tech and a D.B.A. from Indiana University.
John W. Peavy 111, CFA7 is chair of the board and chief investment officer of Founders Tmst Company. He also serves as adjunct professor of finance at the American Graduate School of International Management mundea-bird) and as an instructor in the Personal Trust Administration School of the Texas Bankers Association and the Graduate Finance Certificate program at Southern Methodist University. Previously, Mr. Peavy served as the Mary Jo Vaughn-Rauscher Chair of Financial Investments and chair of the Department of Finance in the Edwin L. Cox School of Business at Southern Methodist University and was the M u r J. Morris Visiting Professor of Finance at the Colgate Darden Graduate School of Business at the University of Virginia. He is associate editor of theJournak ofP?zvestipzg and serves on the editorial boards of the Finaazcial AnalystsJsurnal and the Review ofFina~cia1 Economics. Mr. Peavy is the author offour books and numerous articles published in leading academic and professional journals and writes The Peavy Poiat of View newsletter. He holds a B.B.A. kom Southern Methodist University, an M.B.A. from the Miharton School at the University of Pennsylvania, and a Ph.D. from The University of Texas at Arlington.
Maurido Rodfiguez is an assistant professor of finance in the M.J. Neeley School of Business at Texas Christian University. He is the author of articles published in finance and real estate academic journals. Professor Rodriguez is an associate editor of thejourpzal ofReal Estate Literature and a member of the board of directors of the International Real Estate Society. He holds a B.B.A. from The George Washington University, an M.B.A. from The American University, and a Ph.D. from the University of Connecticut.
There is an old joke that goes something like this: Late one night, a man is on his hands and knees under a lamppost, obviously searching for something. A passerby stops and asks the man what he is looking for. "My keys," responds the man. "Where exactly did you lose then12" the other asks. "About half a block down on the other side of the street." "Why are you looking here then?" "Because the light is better," he replies.
Udortunately, this story can sewe as a metaphor for some of the empirical research conducted b-j financial economists today. Too often, researchers x e forced away from tackling the most interesting conceptual questions on a particular topic because of various inadequacies in the data required to answer them. h excellent example is the study of security performance in a country with an emerging market. For several years, investors and researchers have been intrigued with the promise of these stocks but have been frustrated in their efforts to find tbe information they need to perform the requisite analyses. Indeed, even the data that did exist were frequently incomplete, unreliable, and hard to compare across borders.
In this monograph, Christopher Barry, John Peavy, and Mauricio Rodriguez allay this hstration by shining a light directly on the keys to understanding how emerging markets have functioned in the past two decades. Tneir work makes two contributions. First, and quite possibly foremost, the authors have done a thorough (and, by their own admission, painstaking) job sf analyzing and summarizing stock return data for more than two dozen countries in the Emerging Markets Data Base maintained by the International Finance Corporation at the World Bank. The country- specific historical return and risk series they report-as well as the statistics for aggregate and regional indexes of these countries-offer readers a remarkable snapshot of the evolution in the investment performance, on both a local currency and U.S. dollar basis, of the emerging sector of the global economy. Simply stated, no other compendium of this information is currently available.
Although refining a database that will keep researchers busy for years to come would be enough of an accomplishment for many authors, Barry, Peavy, and Rodriguez do not stop there. 'Their second achievement is to scrutinize these return series to confirm or refute some of the most widely held beliefs about the way emerging markets operate. Their findings are enlightening-and sometimes surprising. For instance, the risk-reward trade-off in many of these developing countries has changed dramatically over time and in a way that contradicts the usual time diversification arguments advanced in many textbooks. The authors confirm the relatively Io~v correlation coegcients between emerging and developed market securities (hence, the diversification benefits of including the former in portfolios of the latter) but caution that these correlations are extremely volatile when measured historically. To many readers, these results will go a long way toward establishing the efficacy of emerging market investments as a separate asset class.
One cannot describe the potential impact of this monograph without mentioning Roger Ibbotson and Rex Sinquefield's Stocks, Roads, Rills, a d bgflation (SBBO, an ongoing project that was first publislled by the Research Foundation of the Institute of Chartered Financial h d y s t s almost a decade ago. In that work, Ibbotson and
viii #!The Research Foundation of the ICFA
Sinquefield provided return data and asset classifications for capital markets in the United States for the majority of the 20th century. So pervasive is SBBl's impact that few investment practitioners are untouched by its influence; it is truly the definitive support reference for research on topics in the U.S. market ranging from security evaluation to performance measurement. Ten years from now, Emerging Stock Markets: Risk, Re tur~ , a& Pe$ormaace, which is loosely patterned after SBH, could well be described in the same terms for this increasingly impoMt set of securities.
With this volume, Barry, Peavgr, and Rodriguez push the frontier of research into emerging stock markets farther than it has ever been before. Wthsut question, no extant source contains such a complete "A to Z" coverage of the topic, and for this effort, they are to be commended. As impressive as this work is, however, E suspect that the ultimate legacy of the research that you are now holding will be the future projects it inspires; this monograph will shine a light in the right direction for years to come. The Research Foundation is pleased to bring it to your attention.
Keith G. Brom, CFA Research Director
The Research Bsozegd~tio~z ofthe Institgte of Cha?$ered Finalzciak Analysts
QXme Research Foundation of the IClFA
Acknowledgments
We appreciate the assistance provided by Rufat Alimardanov, Sean Conner, Shane Evatt, Deron Kawarnoto, Francisco Lorenzo, Duane McPherson, Lee Neathery, Federico Ochoa, John Olsen, and Judi Wilson. h y errors are, of course, the responsibility of the authors. We would also like to thank the International Finance Corporation for making their Emerging Markets Data Base available to us for this endeavor. Finally, we would like to thank the Research Foundation of the Institute of Chartered Financial Analysts and MMR for their support.
Christopher B. Barry J o h ~ W. Peavy In, CFA
Mauricio Rodriguez
OThe Research Foundation of the ICFA
Introduction
The primary objective of this monograph is to provide a comprehensive source of historical data about the performance of securities in emerging markets. Although historical returns cannot he relied on to predict future performance, such empirical. data can provide useful insights for financial and investment managers. A wide array of informational sources report- historical security returns in developed countries, but only recently have investors and managers had access to data about returns of stocks in emerging markets.
Another objective of the monograph is to reveal important historical trade-offs between risk and return and to demonstrate how risk-return relationships vary over time. We also illustrate the effects on risk and return sf adding emerging market securities to traditional U.S. stock portfolios. Our overall intent is to provide a comprehensive knowledge base that will enable the investor or investment manager to make informed investment decisions regarding emerging market assets.
What Are Emerging Maukeas? Mthougl~ the term "emerging markets" was introduced only recently, such markets have long been a recognized investment alternative among institutional and individual investors. Indeed, many of the world's most successful investors have accepted the emerging markets as a separate asset class.
Unfortunately, no universally accepted definition of an emerging market exists, nor does a consensus about which markets merit the "emerging" status. In the 1960s, Japan was an emerging market, and only slightly more than a century has passed since the United States was considered to be an emerging market. In short, the composition of the emerging market universe is in a contirlual state of flux. Today's emerging market may be tornorrow's vibrant economy-thus, the attractiveness and excitement of this important asset class.
The World Bank, by far the largest investor in these markets, defines a 66devel~ping" country as one having a per capita gross national product of less than US$8,626 (IFC 1995a). According to this definition, 170 economies fdl into the developing category. Only a handful of the many countries that can be called developing merit the emerging title, however. "Emerging" implies the kind of growth and change that lead to investment opportunities-growth and change that can occur only as the people of a country gain realistic possibilities for improved economic, social, and political conditions. Investors strive to identify the emerging markets among the developing countries and invest in those markets, but they tend to shun the markets that do not possess the important traits that classify them as emerging.
To attract the attention and capital of foreign investors, an emerging market must also be investable. Although developing countries contain approximately 85 percent of the world's population, they represent only about 63 percent of the world's stock market capitalization. 'This dispropo~-lionate popula~on-to-capitalization mix vividly indicates the future growth potential for stocks in developing countries, but it also indicates the selectivity that must accompany investments in these markets. The
Emergizg Stock Markets: Risk, Return, and Pe$ornzance
International Finance Corporation OFC), a leading compiler of emerging market returns, considers the size (as measured by market capitalization) and liquidity (as measured by turnover) of a market in classifying that market as emerging and in deciding to commence coverage of the market and to include the securities in the market in its Emerging Markets Data Base (EMDB). In addition, inclusion in the EMDB is affected by the industry in which a company operates; the IFC attempts to provide broad coverage of industries important within the market. Thus, a smaller, less liquid security might be included whereas a larger, more liquid one is excluded if the former security represents a particular industry, which would otherwise be underrepresented.
Currently, the IFC includes the stocks of 26 countries in the EMDB and includes 25 of those country markets in its a'nuestablc index. (Nigeria is considered not investable because the market is closed to foreign investors.) Four of those countries-Korea, Malaysia, South Africa, and Taiwan-account for approximately 50 percent of the weighting of the market capitalization of the investable index. So, an investor might question the diversification benefits of such a concentrated grouping.
Significant differences exist among emerging markets, but as a group, they share one primary similarity--change. Through improved communications, individuals all over the world can see the rewards of economic growth, and they want to participate. The rising aspirations sf people and demographic realities are driving changes in developing countries. When development and political reform give rise to structural changes, economic growth and the rewards associated with it persist. The economic growth, in turn, leads to profitable opportunities for investors. Of course, risks accompany these emerging market opportunities. Investors can foster success, however, by seeking out economies that have or will soon have political stability, open markets, policies that encourage growth, strong institutional structures, clearly defined investment rules, equitable ha t ion , market liquidity, and satisfactory intermediaries.
The Appeal of Emerging Market Investing The primary motivation of investors in emerging markets is the desire to add value at the margin to a conventional world or domestic portfolio for some period. Emerging market equities may be one of the smallest asset groups in terms of current value of market capitalization, but they constitute potentially the fastest growing investment class. At year-end 1975, the total market capitalization of emerging markets was substantially less than the market value of IBM Corporation alone. By 1985, however, the markets had grown dramatically, and as Table 1 shows, the market capitalization of stocks in emerging markets increased fsom USS167.7 billion in 1985 to about USS1.8 trillion in 1995, a more than l M l d increase. In this same time period, the stock market capitalization of developed countries only approximately tripled-from USS4.5 trillion in 1985 to USS15.9 trillion in 1995. Consequently, emerging market stocks climbed from a 3.6 percent share of world market capitalization in 1985 to an 11.9 percent share in 1995.
The dramatic growth in the market value of emerging market stocks is attributable to three factors. The most important growth factor is the appreciation over time of the individual securities composing these rnarkets. The second factor is the inclusion of new countries in the emerging market group. After 1985, eight new countries were added to the group. Finally, value growth occurred as new stocks
became publicly available in the emerging countries. For example, some US$13 billion of the increased market capitalization of the Argentine Bolsa was accounted for by the privatization (and public oHering of shares) of WF (the former national oil and gas company) and two telecommunications firms. Overall, the number of companies in the emerging markets covered by the EMDB more than doubled from 1985 to 1995, going from 8,207 to 16,751. In comparison, the number of investable companies in U.S. markets increased only 7.4 percent in this time period.
Emerging markets have become increasingly attractive to investors as the developing countries focus on creating favorable conditions for economic growth. The low correlations of emerging markets with each other and, as a group, with developed markets combined with the emerging markets' growth prospects provide the potential for enhancing the return and reducing the risk of the total portfolio.
Many prospective investors in emerging markets proceed with caution, however; they recognize that the risks must be carefully evaluated and understood. Emerging market investors must cope with high market volatility, economic and political instability, dramatic currency swings, illiquidity, high transaction costs, rapid but volatile growth, constant change, and a limited mount of reliable information. For such reasons, most investors find that investing in oldy one or a few emerging markets is an excessively risky approach. Annual standard deviations of returns may exceed 50 percent, which is high enough to cause even the most venturesome investor to pause. The risks can be illustrated by Argentina's market in 1991 and 1992: In 1991, Argentina adopted a currency plan that made the Argentine currency convertible with the U.S. dollar. In that year, the Argentine Bolsa registered a dollar-denominated return of almost 400 percent. Many investors were attracted to the market, and the market rose an additional 38 percent early in 1992. Then, from May through November of 1992, the market lost more than 56 percent of its value.
Selection of Emerging Markets for the Study Because the focus of this study is on investment rates of return and risk, the study uses the IFC's classification scheme of a subset of developing economies that are deemed to be emerging markets. As the viability of emerging markets has increased, so has the IFC's coverage. Thus, the current IFC emerging market universe provides a representative cross-section of emerging economies.
The IFC's EMDB has gained recognition as one of the world's premier sources for reliable, comprehensive information and statistics on stock markets in developing countries. At this point in time, the EMDB covers the 26 markets examined in this study with information collected since 1975 and provides regular updates on the more than 1,600 stocks in its composite index. EMDB data do contain a "look-back" bias; stocks existing as of 1981 were tracked back to 1975 in some instances.
EMDB products are available in computerized form and as publications. Three levels of computerized data cara be provided: comprehensive data on individual stocks covered in all markets, data series for each index computed, and data series for each market covered.
The IFC began to produce its own standardized stock indexes for developing countries in mid-1981. Using a sample of stocks in each market, the IFC calculates indexes of stock market performance designed to serve as benchmarks calculated on a consistent basis across national boundaries. These indexes eliminate the difficulties in comparing markets that arise from inconsistencies among locally produced indexes with differing methodologies.
OThe Research Foundation of the ICFA
The original IFC indexes were calct~lated only once ayear, used end-month prices, were based on the 10-20 most active stocks in each of 10 emerging markets, were equally weighted, and were available on a "price onlyy'and total returns basis. Nine of the 10 markets had a history back to December 1975; one Uordan) had a base in January 1978, when the Amman Financial Market first opened. Gradually, calculation periods tightened up to once a quarter, on end-month prices. The IFC now provides monthly indexes from the end of 1975 for nine markets and weekly indexes for several markets from the end of 1988.
The IFC's composite index combines country market indexes and thus can serve as a measure of return and diversification benefits from broad-based emerging market investing.
In late 6985, the IFC changed its me&odology from equal weighting to market- capitalization weighting, improved the timeliness of calculation of end-month indexes from a quarterly to a one-month lag, expanded the number of stocks covered, and increased &e number of markets covered from 10 to 17. In addition, the IFC added regional indexes for Latin America and Asia to supplement the all-market composite index.
The new IFC indexes, with a base date of December 1984, were launched in January 1987 and proved to be very popular with money managers. Other markets were added to coverage in 1989 (Portugal andTurkey, with base periods back to f 986) and in 1990 (Indonesia, 154th a base period of December 1989). Beginning in 1988, the IFC improved the timeliness of index calculation from end month, with considerable lag, to end week with a one-week lag.
From 1988 until 1992, the IFC expanded the number of stocks covered in the indexes and added to the number of data variables available for each stock. In mid 11991, the IFC released the industry indexes, which sorted the stocks of the IFC Composite Index by industry categories.
The IFC introduced investable indexes in March 1993. Adjusted to reflect the accessibility of markets and individual stocks to foreign investors, the IFC investable indexes offer a perfomance benchmark for international investors who might view the illiquid or restricted securities in a market to be irrelevant. The former series of YFC indexes were renamed the "global indexes" to distinguish them from the new series.
In 1993, the I[FG launched indexes for China, Hungary, Peru, Poland, and Sri Lanka. South Africa was added in 1994, and the Czech Republic in 1995.
Table 2 shows the wide variations among the year-end stock market capitalizations of the emerging markets. For example, at year-end 1995, Soutl~iafi-ica9s market capitdization of USS280.5 billion was more than 140 times Sri Lanka's at USS1.9 billion. Table 3 shows the impact of the market capitalizations on the market weightings in the ZFC indexes.
Ccbnstruction of the Study Isadexes and Calculation of Returns For this study, we constructed indexes using EMDB data back to December 31,1975. The first period is the 9 1/2-year period from the start of the sample, January 1976, through June 1985; the second period is the subsequent 10 years, July 1985 through June 1995. For simplicity, we will be referring to 20-, lo-, and 5-year periods when discussing results. We developed indexes by country or regional market and for a composite. We calculated those returns (given in the appendix) after adjusting the EMDB data for certain timing problems in the reporting of some information and then constructed indexes based on those adjusted returns.
Table 2. Stack Market Capltalizatlsn, December 31,6995 (US$ billions)
Market Counby Capitalization
Market Country Capitalization
South Africa Malaysia Taiwan Korea Brazil Thailand India Mexico Chile Indonesia Philippines China Argentina
Turkey Portugal Colombia Greece Peru Pakistan Jordan Poland Venezuela
Hungary Nigeria Zimbabwe Sri Lanka
Individual local returns were calculated for each company that had data available from the IFC. Similar to firm returns found in the Center for Research in Security Prices (CRSP) files, we adjusted prices for return calculations to reflect stock splits, stock dividends, new issues, and rights issues. The reported return series includes dividends paid during the return period. The individual stock return calculation for month t can be expressed as follows:
where:
St = number of shares outstanding at time t (including new shares from stock splits and stock dividends)
Pt = price per share at t h e t HSt = n u d e r of new shares from rights issues during period t S 4 = subscription price for the rights issue PRISt = pre-rights-issue price per share at time t S,,, = number of other new shares issued during period t Dt = cash dividends paid during period t
Because subscription prices for new issues were not available, the current value associated with new issues was subtracted out of the return calculation.
In several cases, the IFC recorded dividend, stock split, or rights issue information at a date later than the actual date, perhaps because of late notification to the IFC. We aligned all of the data so that all information of this nature was dated back to the date on which the event occurred. Dollar-based returns were calculated from exchange rate information available in the IFC data files.
The indexes for the study are based on value-weighted portfolios for each market. Value-weighted return series were also calculated for the regional portfolios and the composite portfolio. The value-weighted return for a given market portfolio was calculated as the weighted average of the returns of the individual stocks in the porkfolio as follows:
@'The Research Foundation of the ECFA
where is the market value weight of security i at the end of period t-1. Similarly to how CRSP value-weighted portfolio returns md other common value-
weighted return series are calculated, the weight assigned to a security's return for this study is its percentage of total market capitalization from the end sf the previous period. Given that new companies appeared (and some disappeared) as the emerging markets grew, the number of firms in a given market portfolio is not constant. The number of firms in a portfolio at a given point in time depends on the number of firms with valid returns.
The process of calculat.irmg individual rate-of-return data and then computing value-weighted returns resulted in market returns very much like those reported for the IFC Global Index. Our value-weighted portfolio returns for individual emerging markets were highly correlated with IFC Global-Index-based returns (an of more than 90 percent).
TabRe 3. Market Wights In %he IF: Imdexes, End of March a995
IFC Global Index IFC Investable Index
Total Market Market Weight Market Weight Capitalization Number of Capitalization in IFC Number Capitalization in IFC
East Asia Philippines 58,859 45 31,965 2.9 25 16,950 2.8 South Korea 181,955 162 123,648 2.3 159 17,112 2.8 Taiwan 187,206 93 113,032 10.4 93 16,955 2.8
South Asia India 127,199 123 57,753 5.3 101 13,489 2.2 Indonesia 66,585 50 37,703 3.5 42 19,631 3.2 Malaysia 222,729 114 142,494 13.1 114 118,996 19.7 Pakistan 9,286 80 6,482 0.6 36 4,832 0.8 Thailand 141,507 76 94,963 8.8 68 28,176 4.7
O n e Research Foundation of the ICFA
Emerging Stock Markets: Risk, Return, and Peljformance
Structure @f the Maasgraph This monograph begins with a presentation m d discussion of historical rates of return for stocks in 26 emerging country markets, for a composite index of emerging market stocks, and for subindexes of broad geographical regions. The monthly returns are in the appendix. For comparison purposes, we have included return data for U.S. stocks, U.S. Treasury bills, and U.S. domestic idation.' These additional data allow the reader to explore fundamental real-versus-nominal and risk-versusrebrn relationships. Standard deviations were computed for the individual emerging markets, for the composite index, and for regional indexes. Standard deviations for domestic stocks, U.S. TF-bills, and inflation were calculated and included for comparison purposes.
Chapter 1 provides the investor with comprehensive data about the rates of return and risk of emerging markets in the aggregate, for selected regions, and for individual countries. Returns are presented in U.S. dollar terms and in terms of local currencies. This information is designed to equip the investor with solid empirical data documenting the historical performance of securities in emerging markets. A particular focus of Chapter 1 is changes in emerging market returns over time.
Because one of the purported benefits of emerging market securities is their low correlations among themselves (across markets, although not within markets) and with securities in developed markets, Chapter 2 addresses portfolio combinations of emerging market assets with U.S. domestic securities. The chapter deals explicitly with empirical results needed for portfolio construction. We present comprehensive statistical information showing the correlations between the various emerging markets and the U.S. market (and between the emerging markets) and discuss how securities from all of these markets can be combined to form efficient portfolios.
Chapter 3 compares the performance of the full set of EMDB markets with an investable subset of the EMDB universe. The chapter then goes on to discuss the effect sf using the investable subset only in portfolios of U.S. stocks.
Chapter 4 of the monograph analyzes the performance of country, regional, and broad-based closed-end emerging market funds. This final chapter focuses on the pros and cons of achieving exposure to the emerging markets through such funds.
l~ased on Ibbotson Associates data.
O n e Research Foundation of the ICFA
Historical Pe$omance of Emerging Equity Markets
1. Historical Performance of Emerging Equity Markets
A key consequence of the relative newness of emerging markets as an investable outlet is the limited information on historical rates of return for securities in these markets. Investors in securities of developed markets have access to extensive historical performance results for long periods of time. Unfortunately, performance results for emerging markets do not exist for such extended time periods. Although securities have existed and traded in emerging markets for many decades, reliable performance results exist for a much briefer time. The International Finance Corporation's (IFC's) Emerging Markets Data Base (EMDB) dates back only to year- end 1975, and only 9 of the 26 markets currently designated emerging by the IFC (Argentina, Brazil, Chile, Greece, Mexico, India, South Korea, Thailand, and Zimbabwe) have performance data for the entire time. In fact, historical results for another 7 of the emerging markets (China, Hungary, Indonesia, Peru, Poland, South Mica, and Sri Lanka) are available for fewer than 10 years (starting dates for inclusion in the EMDB are given in the first column of Table I). Even though the limited historical data for emerging markets do not offer the investor the luxury of drawing conclusions from long-term empirically validated relationships, the data do offer investors important information about how emerging markets react to events, interact among themselves, and relate to developed markets.
Aeregate Returns and Risks Table 4 presents comparative average monthly rates of return, computed both geometrically and arithmetically, and standard deviations of monthly returns for our Emerging Markets Composite Value-Weighted Index (the Composite), the S&P 500 Index, the National Association of Securities Dealers Automated Quotation Composite Index (Nasdaq), 91-day U.S. Treasury bills, and U.S. inflation in the form of the U.S. Consumer Price Index (CPI). Monthly emerging market returns are in the appendix.
Panel A of Table 4 presents results for the entire 1975-95 period. For the 20-year period, the performance of stocks in emerging markets trailed the returns for U.S. stocks.' The Composite provided a 0.99 percent compound average monthly rate of return, compared with the 1.11 percent return for the S&P 500 and the 1.07 percent return for the Nasdaq. Stocks in emerging markets fared well in comparison with T- bills and U.S. inflation. The 0.62 percent compound average monthly rate of return for T-bills was approximately tvvo-thirds olthe comparable return for emerging market stocks. Furthermore, the inflation rate for this period was less than one-half the average rate of return for emerging market stocks.
The full period is 19Ih years and the first subperiod is 9% years, but when discussing results, for simplicity, we will refer to the periods in round numbers-as 20-, lo-, and Syear periods.
@The Research Foundation of the IGFA
Emergiulg Stock Markets: Risk, Returtz, and Pe&rmance
Table 4. Series Historical Monthly Returns amd Standard DeviaBiarss
A: December 1975-June 1995
Series
Composite S&P 500 Nasdaq T-bills CPI
Arithmetic Average Return
1.15% 1.20 1.21 0.62 0.44
Compound Sharpe Standard Average Index Deviation Return Values
Figure 1 graphically portrays the growth for the 28-year period of a dollar invested in each asset class and a hypothetical asset returning the U.S. inflation rate. Table 5 summarizes the results for the 20-year period: USS1.00 invested in the Composite grew to US10.01 at June 30,1995, but the same amount invested in the S&P 500 grew to USS13.14 and in the Nasdaq grew to USS12.03.
As would be expected, emerging market stocks experienced greater variability of returns in the full period than did U.S. equities, as the last column in Panel A of Table 4 shows. The 5.61 percent monthly standard deviation of returns for the Composite exceeded the monthly standard deviation for the S&P 500 (4.25 percent) and for the Nasdaq (5.26 percent) for the period, although the margin may be lower than many investors would have expected.
The return and risk results reported here for 1975 through 1995 contradict conventional wisdom that higher risk emerging market stocks provide higher rates of return than stocks in developed markets. For example, Claessens, Dasgupta, and Glen (1995) reported higher average returns for the IFC9s Composite Index of emerging market securities than for the United States, Japan, and the Morgan Stanley Capital International World Index. One reason for the different results is that most of the recent studies of emerging market performance have focused on the post-1984 period because 1984 was the base year for the IFG's value-weighted indexes. We believe, however, that limiting data to the period following the debt crisis in Latin America severely biases results by omitting a period in which one of the risks of investing in the markets was indeed realized.
The results here present an obvious problem to investors. If the stocks of emerging markets provide lower rates of return at higher risk than domestic securities, they are not particularly attractive additions to broadly diversified portfolios.
Figure 1 shows, however, that emerging markets experienced vastly different results during the first 10 years as opposed to the remaining 10 years of the period.
10 @The Research Foundation of the ICFA
Histo~icak Pe#o~maace ofEmergigg Equity Markets
Figure 1. PeaFormanee of Composite versus Various A s s e t ellasses and the GPI. December f 975-June 1995
.......... S&P 500 Nasdaq T-Bills
......-.... ..... CPI Composite
Structural changes have occurred in the markets since 1984, and again since 1989, and the Composite during the initial years consisted of a narrower, less diversified set of securities than later. Consequently, in addition to the full period, we also analyzed the most recent 10-year and 5-year periods.
The 1985-95 Subperiod. Performance results dramatically reversed during the 10-year period from June 1985 through June 6995. In contrast to the 1975-95 performance results, in the 1985-95 period, emerging market stocks exhibited higher rates of return than their U.S. counterparts. As shown in Panel B of Table 4, for the later 10-year period, the Composite returned 1.50 percent compounded monthly, compared with 1.13 percent for the S&P 500 and 0.96 percent for the Nasdaq. Figure 2 shows the wealth increase of a dollar invested as previously, andTable 5 summarizes the results: During this decade, a wealth index of the Composite appreciated sixfold, thus substantially outperforming the S&P 500's increase of 3.79 times and the Nasdaq's advance of 2.92 times. (A dollar invested in emerging stocks in mid-1985 grew to USS6.00 by June 1995, compared with growth to US$3.87 for the S&P 500 and USS3.15 for the Nasdaq.
As Panel B of Table 4 shows, the higher rates of return in emerging markets in the 1985-95 period were accompanied by higher variability of returns. The 6.65 percent monthly standard deviation of returns for the Composite exceeded the 4.38 percent monthly standard deviation for the S&P 500 and the 5.31 percent monthly standard deviation for the Nasdaq. f i e standard deviation in this decade was also higher than in the full period, in spite of the fact that a larger number of markets and companies were included in the database in these later years.
The 1990-95 Period. During the most recent five-year period, as Panel C in
@The Research Foundation of the ICFA 11
E m e ~ g i ~ g Stock Mavkeis: Risk, Return, ngd Peq?omza~ce -
Composite tiS$lO.OIC US$S.OOc S&P 500 13.14 3.87 Nasdaq 12.03 3.15 T-bills 4.24 1.78 CPI 2.78 1.43 aData had to start before July 1985 to be included in this column. b ~ a t a had to start before July 1990 to be included in this column. Values of the Composite in an average of local currencies were 107.25 for one unit of local currency invested at year-end 1975 and 19.42 for one unit of local currency invested at mid-year 1985.
Table 4 indicates, stocks in emerging markets experienced lower rates of return than U.S. stocks. From June 1990 through June 1995, the Composite recorded a 0.84 percent compound monthly rate of return, compared with a return of 0.93 percent for the S&P 500 and 1.18 percent for the Nasdaq. As shorn in Figure 3, during this period, USS1.00 invested in the Composite grew to USS1.66, compared with USS1.75 for the S&P 500 and USS2.02 for the Nasdaq.
Table 4 also shows that volatility was higher for the emerging market stocks than for U.S. stocks in this period. f i e monthly standard deviation of the Composite for June 1990 through June 1995 was 5.66 percent, compared with 4.89 percent for the Nasdaq and 3.30 percent for the S&P 500.
Figure 2. Pedmrmance of Composite versus Various Asset Classes and the CPI, June i988-June 111995
Rgure 3. PerFormance of Composite versus Various Asset Classes and the CPI. June 1990June 1995
S&P 500 .......... Nasdaq - - - - - T-Bills
. CPI Composite
Risk-Aausted Returns. To calculate risk-adjusted rates of return for securities in the aggregate series, we used Sharpe's Portfolio Performance Index:
Asset's average rate of return - Riskless rate of return Sharpe Index = Asset's standard deviation of returns
The results reveal that for the 1985-95 period, emerging market stocks provided higher rates of return than U.S. stocks after adjustment for risk. Calculated using monthly data, the Sharpe Index for emerging markets stocks equaled 18.80 percent, which exceeded the Sharpe Index for the S&P 500 (17.62 percent) and the Nasdaq (11.86 percent).
Stocks in emerging markets underperformed U.S. stocks on a risk-adjusted basis, however, in the period h m June 1990 through June 1995. The Sharpe Index for the Composite was 10.78 percent, only approximately one-half the Sharpe Index for the S&P 500 (18.18 percent) or the Nasdaq (18.61 percent).
Table 4 shows that during the entire time period from December 1975 through June 1995, emerging markets underperformed U.S. stocks on a risk-adjusted basis. The Sharpe Index for the composite was 9.45 percent, about two-thirds the Sharpe Index for the S&P 500 (13.65 percent) and closer to the Nasdaq Sharpe Index value of 11.22 percent.
Summary of Findings from Agregate Series. The poor relative perfor- mance of emerging market stocks from the end of 1975 through 1995 seems to contradict the popular belief among many investors that emerging market securilies are an attractive asset dass with high expected rates of return and strong
OThe Research Foundation of the ICFA 13
Emazcrging Stock Ma~kets: Risk, Rekrn, and Pe$or~za~ce -- --
diversification benefits. Although the diversification benefit was indeed available during this period, the emerging market stocks undepperformed U.S. stocks.
The underperformance of emerging market assets in the overall time period is largely attributable to poor relative performance during the five years ending in 1985-a time period during which the emerging markets were substantially smaller and less developed than they currently are. A large part of that pedorknarlce must be associated nit11 the global recession of late 1980 through 1982, when interest rates hit record highs and oil prices soared. Those events precipitated the Latin American debt crisis, and they are reflected in the results reported here. The four years beginning in December 1980 could be called the 'lost years" of the emerging equity markets.
1Fron1 1985 to 1995, stocks in emerging markets fared favorably relative to U.S. stock markets on an absolute and on a riskadjusted basis. The relative overpedormance of the emerging market stocks in later subperiods would have been even more pronounced if the crash in certain Latin American markets had not occurred in late f 994 and early 1995.
The dramatic reversal of the fortunes of emerging market stocks during the most recent decade creates a dilemma for investors. Does this performance grove that investments in emerging markets truly provide the ofcen-touted benefits of high expected rates of return and overdl portfolio risk reduction through enhanced diversification? Or will investments in this evolving asset class continue to experience the kind of dramatic reversals of fortune observed during the past 20 years? Only time aviH tell. Even during this recent period of relative prosperity among emerging market equities, erratic price swings were frequent. No fewer than three major bear markets occurred for these securities during the recent decade (late 1987,1989, and 1994-95) verws only one ~zlajor decline in U.S. stocks (October 1987). Given the relatively short span of time in which data regarding the performance of these assets have been available, however, it is probably too early to use empirical performance results to conclusively support either side of this question. One conclusion seems certain: Equities in emerging markets will continue to experience substantial price fluctuations. Thus, considering these securities as strictly long-term holdings is imperative..
In the remainder of this chapter, we consider the i r n p o ~ n c e of currency issues and then take currency issues into account as we present detailed empirical results and analyses of the performance of emerging market stocks by region and by individual country market.
The Currency Factor Investing in an emerging market exposes ihe investor to the market's currency values. The currency, in turn, is exposed to political risk and a host of economic influences. Indeed, at least a portion of the interest the developed world has shown in the securities of emerging markets has come as a result of fundamental changes in monetary and fiscal policies on the part of emerging market governments that affect currency values. For example, investor interest in Argentina increased dramatically in March 1991 after the Cx1os Menern administration adopted a currency board and a "conwrt-libiliiyn plan under which the government stood ready to buy and sell U.S. dollars at a rate caf one Argentine peso to the dollar. Pesos would be printed only to the extent that they nTere fully backed by U.S. dollar reserves. During that same year, as noted in the Introduction, the Argentine stock market achieved the highest rate of return in the world, a return in excess of400 percent. To achieve the currency stability,
14 @)The Research Foundation of the ICFA
Historical Perpormance of Emergilzg Eqzadty Markets
the country had to adopt a new economic platform to eliminate government budget deficits and stabilize the economy. Brazil followed Argentina's lead in July 6994, and global investor interest in the Brazilian markets rapidly increased.
The currency risk fador is well known. Anyone prone to forget about it was rudely reminded in December 1994 when the Mexican peso collapsed, losing more than half of its value. Mexico was thrown into a broad economic crisis in which inflation returned to past high levels, interest rates soared, and economic growth was reversed. Indexes of equity values for stocks traded on the Bolsa Mexicana de Valores fell more than 50 percent in the ensuing weeks, and the markets of some of the other Latin American economies (notably, Argentina and Brazil) also declined sharply.
Currency issues are also relevant h m another point of view. Equity market performance may look quite different to a domestic investor than it looks to a global investor. Aglobal investor's opportunities to diversify away the risk of a given market's currency may give that investor quite a different outlook from the outlook of a domestic investor, particularly if the domestic investor is restricted from investing in foreign securities. On the other hand, some emerging markets are removing or decreasing restrictions against investing in foreign securities, so domestic investors in those markets now need to know the performance of a broader set of prospective investments than concerned them in the past. For example, Chile's privately managed pension hnds were granted the right to invest in foreign equities in 1994, and although as of late 1995 no specificvehicles for such investment had been approved, as Chileans consider investment outside Chile, they will need to broaden their views of performance appraisal.
Because the currency risk factor is crucial to the decision to invest in emerging markets, performance of the 26 emerging markets in the study is presented here in both local cuwency terms and in U.S. dollar terms. ' f i e goals are to demonstrate for the reader the impact of the currency factor on performance and to give domestic investors in the emerging markets a sense of how their markets stack up against other markets.
The Fsliacy of Cuo uvrency Gomparimms of PaPffollos. Comparing per- formance in alternative currencies rather than in a single currency can produce misleading results. For example, Panel A of Figure 4 shows that Chile's performance since I975 in Chilean peso terns so dominated South Korea's performance in won terns that the Korean index is indistinguishable from the horizontal axis. Panel B shows, however, that when a common currency is used-in this case, the U.S. dollar-although Chile still dominated in total returns, the margin, still huge by the end of the period, was not so wide. Figure 5 examines a case in which performance is reversed: Mexico versus India. In the local cuwency numbers used in Panel A, Mexico dominated India so much that India (like Korea in the previous example) is virtually flat by comparison. In the U.S. dollar terms of Panel B, however, the performmces of the two markets are virtually identical at the end of the period (mid-1995). Panel B in Figure 5 also illustrates that relative performance is highly sensitive to the time period selected: If the analysis were stopped shortly before the Mexican peso crisis, Mexico's performance would be substantially stronger -than that of Korea. The shock effect of the peso crisis wiped out all of Mexico's comparative gain prior to the crisis.
2~ai ley and Chung (1995) evaluated the cuwency risk and political risk associated with hdexican debt and equity securities. Unfortunately, their study's data concluded in 1994 before the crisis in the peso in December of that year. Nevertheless, their results demonstrate the importance of ctirrency a ~ d political risk factors in the pricing of securities.
@The Researdl Foundation of the HCFA 15
Emer&a.ka Stock ii;E4a~kt.is: Risk. R G ~ U Y ~ Z . a?$$ ID~~TPOr~~~~?tce
Figure 4. Pe&@rmance of GhiEe versus Korea: Locag Currency and U.8. Dollar Tg~ms, December 1975mJune 1994
49 i z<erra 1 213 t . . . . .__ . ....,... . I . . ....
1
GT'ie Xesearch Foundation oi" the ICFA
Figure 5. Peuformance of India versus Mexico: Local Curre~cy and U.8. Dollar Perms. December f 97SJune 1995
QThe Research Foundation of the ICFA
Eme~gittg Stock IWa~kets: Risk, Retura, a ~ d Pe$orzance!
Thus, currency values are very important to the performance of alternative markets. In the next section, we display currency values across all of the markets in our sample for varying time periods. %$%ile reading -this section, readers should keep the time sensitivity in mind.
PeHormanee by Gesgraphica! Region amd Market To provide greater detail about the performance of emerging markets by various geographical regions, we constructed a series of subindexes-for Europe, Latin America, Asia (and also separately for East Asia and South Asia), Africa, and a combined Europe/Mideast/Mca (EMB) area. The findings are reported in local currency and U.S. dollar terms.
Tables 6, 7, and 8 show local currency versus U.S. dollar arithmetic average monthly returns, standard deviations of monthly returns, and compound returns for, respectively, the 20-year, 10-year, and 5-year periods. Table 9 shows the wealth accumulation of USS1.00 or one unit of local cuwency invested in the regional and country markets between December 1975 and June 1995; Table 10 reports similarly for investments made between June 1985 and June 1995. The regions and country markets included in the tables are those for which performance data for the period were available. For some markets, data were not available for some of the periods; if
Table 6. Monthly Mean Returns, Standard Deviations, and Compound Average Retwras in U.S. Dollar Terms versus Local Currency Terms: Markets with Data Available December 1975June 1995
U.S. Dollar Terms Local Currency Terms
Arithmetic Cornpound Arithmetic Compound Average Standard Average Average Standard Average
Asia 1.38 6.14 1.20 1.55 6.05 1.37 East Asia '1.86 9.54 1.43 1.98 9.40 1.56 Korea 1.69 9.00 1.32 1.88 8.89 1.51 Philippines 3.68 10.65 3.14 3.91 11.07 3.35 Taiwan 2.83 14.77 1.79 2.46 14.48 1.45
South Asia 1.30 5.29 1.16 1.56 5.24 1.43 India 1.55 7.87 1.26 2.11 8.17 1.80 Malaysia 1.46 7.82 1.15 1.47 7.88 1.15 Pakistan 1.60 6.96 1.38 2.17 7.02 1.95 Thailand 1.95 7.82 1.65 2.03 7.77 1.73
Note: Data had to start before July 1985 to be included in this table.
18 @The Research Foundation sf the ICFA
Table 7. Monthly Mean Returns, Standard Deviations, and Compound Average Returns In U.S. Dollar Terms versus Local Cuareney Terms: Markets with Data Avallabie dune 1985-June 1995
U.S. Dollar Terms Local Currency Terms - Arithmetic Compound Arithmetic Compound Average Standard Average Average Standard Average
Asia 1.58 7.32 1.31 1.53 7.29 1.26 East Asia 2.40 9.63 1.94 2.15 9.43 1.71 Korea 2.03 8.55 1.68 1.89 8.42 1.56 Philippines 3.68 10.84 3.12 3.99 11.31 3.40 Taiwan 3.11 15.08 2.03 2.71 14.79 1.66
South Asia 1.36 6.15 1,17 1.59 6.28 1.39 India 1.27 9.64 0.82 2.10 10.33 1.60 Indonesia 0.44 8.89 0.05 0.68 8.86 0.30 Malaysia 1.54 7.96 1.22 1.52 8.02 1.20 Pakistan 1.59 7.11 1.36 2.16 7.18 1.92 Thailand 2.69 9.09 2.28 2.61 9.15 2.19
Note: Data had to start before July 1990 to be included in this table.
a market was included in the EMDB before the end of the given period, that market is included in the table with results based on that portion of the period for which data were available. Beginning dates for a market's inclusion in the EMDB are given in Table 1.) Comparing the "U.S. Dollar" set of columns with the "]Local Currency" set of columns reveals the performance in the different terms for each period. Table 11 shows the performance of the currencies themselves in U.S. dollar terms-that is, the compound average gain or loss in value in U.S. dollars of each market's currency (or an average of a region's currencies) over the three periods.
Note first the currency effect on emerging markets in the aggregate. Table 6 provides results for the full 20-year period. Note that for the Composite, monthly average performance was considerably higher when measured in local currency terms than when measured in U.S. dollar terms. Both the arithmetic returns and geometric returns were about 100 basis points a month lower in U.S. dollar terms. h effect, emerging market currencies lost about 1 percent of their value a month over the full 20-year period. Table 11 confirms that conclusion: The Composite emerging market "currency" lost 1.008 percent of its value a month, on average, over this period.
OThe Research Foundation of the ICEA 19
Emergipzg Stock Markets: Risk, Returpz, a d Pet$omaace
Table 8. Monthly Meam Returns, Standard Deviations, and Compound Awerage Returns in U.S. Dollar Terms versus Lacal Currency Terms: Markets with Data Awaiiable Jarme 199Wune 1995
1 J . S Dollar Terms Local Currency Terms
Arithmetic Compound Arithmetic Compound Average Standard Average Average Standard Average
South Asia 1.37 6.48 1.17 1.58 6.70 1.37 India 1.59 10.96 1.03 2.70 12.12 2.03 Indonesia -0.13 8.69 -0.50 0.10 8.66 -0.27 Malaysia 1.65 7.52 1.37 1.49 7.79 1.19 Pakistan 2.23 9.57 1.82 2.85 9.71 2.42 Sri Lanka 0.89 9.83 0.43 1.18 9.82 0.72 Thailand 1.83 9.85 1.37 1.77 9.99 1.30
In other words, approximately 50 percent of the performance (in local currency terms) of emerging markets over the full period was wiped out by declining currency values. The currency effect is indeed impoptant in the analysis of emerging stock markets.
The effect described in the previous paragraph is relatively stable over time, at least at the aggregate (Composite) level: Comparing the returns in Tables 7 and 8 for the Composite index reveals that, again, a large fraction of the overall performance of ernerging markets in local currency terms has been erased by the poor performance of hei r currencies against the U.S. dollar. In the case of the 10-year period, presented in Table 7, about 40 percent of the compound return of emerging markets was eliminated by declines in currency values. In the live-year period, shown in Table 8, somewhat more than 60 percent of local performance was eliminated by the currency effect vis-A-vis the U.S. dollar.
20 @The Research Foundation of the ICFA
Tabie 9. Csuntw and Region Irrdex Values as of duly 1995 Based on All Data Avaiiable December 197SJune 1995
Market USS1.00 Invested
1 Unit of Local Currency Invested
EhllA Europe Greece
Jordan
Mica 0.84 Nigeria 1.04 Zimbabwe 4.84
Latin America 35.06 77,121.77 Argentina 133.06 12,614,237,215.55 Brazil 5.11 1,406,319,309,360.73 Chile 331.36 14,590.48 Colombia 38.90 347.43 Mexico 19.17 9,590.59 Venezuela 3.00 67.93
Asia 16.18 East Asia 27.70 Korea 21.30 Philippines 49.34 Taiwan 9.40
South Asia 14.80 27.60 India 18.54 65.09 Malaysia 4.21 4.23 Pakistan 5.62 11.33 Thailand 45.82 55.47
Note: Data had to start before July 1985 to be included in this table.
The results vary sharply by region of the globe, and the variations are relatively stable for the periods of time examined. For example, Table 6 reveals that Latin America exhibited the highest compound average returns of any region in local currency terms in the 1975-95 period-and by a wide margin, In U.S. dollar terms, however, Latin America registered a performance only slightly better than East Asia's. Similar results are shown in Table 7 for the 10-year period ending in 1995, except that the margin in both local currency and U.S. dollar terms is greater for h t i n America in this case. Finally, very similar results can be seen for the five-year period ending in 1995. (The similarity of results is, of course, less surprising because the periods overlap. The final section of this chapter presents results for separate 10-year periods &at demonstrate, among other things, that Latin America ulzderfleflo~med East Asia and South Asia in U.S. dollar terms in the initial 10 years of the study period.)
In summary, nearly all of the emerging markets' currencies declined in value, on average, through the three time periods. h d some performed spectacularly badly. For example, Brazilian currencies lost a compound werage of 10.6 percent of their value a moazth against the U.S. dollar during the full 20-year period. Ira essence, the U.S. dollar multiplied in value against a series of Brazilian currencies by a factor of 275 billion times over the full period of these data. Accordingly9 Brazilian monetary autl~oriti~s have replaced currencies by computing them to new bases (usually, dividing by 1,000) five times during the period.
GThe Research Foundation sf the HCFA
Table 10. Country and Reglam Index Values as @f July 1995 Based on All Data Avallabie June 1985- June 1995
Greece 6.ti3 11.33 Portugal 8.57 8.08 r 7 i urkey 7.94 1.09
3~rd;in 1.85 3.22
k i c a Nigeria Zimbabwe
Latin America Argentina Brzil C3ie Coiornbia hriexico \ enezueIa
Asia 4.78 East M a 10.02 Korea 7.36 Philippines 40.08 Taiwan 11.11
South Asia India Indonesia Malaysia Pakist~n Thailand 14.91 13.43
AV~te: Data had to start before July 1990 to he included in this table.
Argentina's case is very different. Until 1991, Argentina underwent frequent currency devaluations of magnitudes similar to Brazil's. Since 1991, however, the Argentine peso has maintained its value against the U.S. dollar at &to-1 m d government policy has brought inflation down to the level found in developed nations. Not surprisingly, Brazil introduced a system of currency masnagemerlt similar to that of Argentina when it introduced the Brazilian real in July 1994.
Both the Brazilian real and the Argentine peso withstood enormous pressure after the Mexican peso crisis of December 1994. The Brzilian real declined in value but stabilized; the Argentine peso was maintained at its constant exchange rate. The Mexkan peso crisis was a tough test for these two relatively new currencies, but both passed the test.
Mexico's devaluatio~s of 1976, 1982, and 1994 are well knourll to most U.S. i~vestors. Investors may be surprised, therefore, chat the Mexican peso has perfonxed margin21ly better than the average emerging market currency in the period from July 1990 through June 1995. The peso was managed on a "crawEngpeg9' basis throughout the regime of Carlos Salinas (Mexican president from 1988 t c? 6994). H e ~ c e , the devaluation of 1994 was highjy visible, but for the broader period, the peso perfonxed about as well as other emerging market currencies.
Table I1 shows that only the currency of Taiwan increased in value against the
22 CYBe Research Famdatbn of the ICFA
Historical Pe$omance of Emergilzg- Equity Markets
Table lli. Peflormancs of Emerging Market Curreneles In Terms sf U.S. Dollars
All Data All Data All Data since December sinceJune since June
Market 1975a 1985~ 1990
Composite -1.008% -0.974% -1.396%
EAU Europe Greece Hungary Poland Portugal Turkey
Jordan
Africa -1.632 -2.366 -1.746 Nigeria -3.613 -3.709 -3.857 South M i c a - - 1.136 Zimbabwe -1.112 -1.405 -2.045
Latin America Argentina Brazil Chile Colombia Mexico Peru Venezuela
Asia -0.169 0.049 4.080 East Asia -0.124 0.224 -0.018
South Asia -0.266 -0.220 -0.199 India 4.535 4.769 -0.982 Indonesia - -0.246 4.227 Malaysia 4.004 0.018 0.176 Pakistan -0.555 -0.549 -0.592 Sri h k a - - -0.292
Thailand -0.082 0.087 0.068
aData had to start before July 1985 to be included in this column. b ~ a t a had to start before July 1990 to be included in this column.
dollar on a sustained basis in the three lime periods. Malaysia and Thailand experienced gains in their currencies' values against the dollar over the 10-year period ending in June 1995. Most other markets experienced serious depreciation in the values of their currencies against the U.S. dollar. The cases of South M e a , Taiwan, Malaysia, and Thailand illustrate, however, that "emerging" is not synonymous with "currency falling in value."
In addition to analyzing the effects of currency on relative returns for evaluation purposes, investors should be wary of interpreting results based on any single currency, even the U.S. dollar. In the decade after mid-1985, a period during which the United States experienced large fiscal and trade deficits, the dollar itself declined in value against the currencies of other major developed markets. From the end of June 1985 through the end of June 1996, the dollar fell nearly 50 percent against the
OThe Research Foundation of the ICFA 23
Emergitzg Stock Markets: Risk, Returaz, and Pefir~zapzce
French fn--anc, more than 50 percent against both the German mark andJapanese yen, and 30 percent against the British pound. A 50 percent decline over I1 years translates into a compound average decline of about 0.52 percent a month. Declining currency values are not unique to emerging markets.
The poor performance of the U.S. dollar in the 1985-96 period provokes awarning to readers outside the United States: Performance results in this monograph are presented only in U.S. dollar terms or local currency terms. Therefore, the returns overstate the performance of emerging markets against currencies in some other developed nations, notably, Japan, Germmy, France, and the United Kingdom.
The following sections summarize the performance of emerging markets in terms of wealth accumulation in the various regional and country markets. As previously, if a market was included in the EMDB before the end of the five-year period relevant to the table, that market is induded in the table with results based on the portion of the period for which data were available. (Beginning dates for a market's inclusion in the EMDB are given in Table 1.)
Europe. Figure 6 reveals that the stocks of the European emerging markets (Greece, Hungary, Poland, Portugal, and Turkey) have been unable to keep up with U.S. inflation, largely because of extremely weak performance results from 1980 through 1985. For the entire period from 1975 through June f 995, USS1.00 invested in an index of the stocks of European emerging markets would have advanced only to USS2.37, less than one-third the value for the S&P 500 (USS13.14 from Table 5).
Greece. Greek stocks, which have been included in the EMDB since its n, have performed poorly. As reported in Table 9, USS1.00 invested in Greek
stocks on December 31, 1975, had appreciated to only USS1.72 at June 30, 1995. Consequently, Greek equities not only substantially underperformed U.S. stocks (from Table 5, S&P 500 appreciation to USS13.14 and Nasdaq appreciation to USS12.03) but also failed to provide rates of return s&icient to oftset U.S. inflation (from Table 5, CPI appreciation to USS2.78). In only one time period, five years endingJune 1990, did Greek
provide unusualBy attractive rates of returns. Hufzgayr. Included in the EMDB only since December 31, 1992, Hungarian have exhibited highly sporadic returns. A wealth index in Hungarian equities
appreciated only 5 percent in U.S. dollar terms from year-end 1992 to midyear 1995, thus considerably underperlomhg the U.S. stock indexes and hiling to keep up with U.S.
PoEa~d. Polish equities recorded exceptionally strong results from the time of usion in the EMDB on December 31,1992, to early 1994. During $his period,
a wealth index of Polish stocks grew by a factor of almost 63. Subsequently, however, Polish stocks lost almost two-thirds of their total market values. Nevertheless, at June 30, 1995, this market still showed cumulative returns meaninghl9y in excess of the
ative returns of U.S. equities. Portugal. M e r approximately their k s t 1% years of inclusion in the EMDB,
Portuguese stocks had appreciated approximately 20-fold, During the next 1% years, however, Portuguese stocks relinquished more than two-thirds of these accumulated gains. Nevertheless, Table 10 indicates that by June 30, 6995, a US$1.00 investment made in July 1985 in Portuguese stocks had grown to US$8.57, more than double the
Porkfolio management and risk management techniques allow the investor to manage currency risk separately while incorporating a market play into the investor's portfolio. See, for example, Karnosky and Singer (1994).
24 QThe Research Foundation of the lGFA
Historical Pe$omzance of Enzergizg Equity Markets
Figure 6. PerFormamce of European Emerging Markets versus Various Asset Ciasses and the 6PI. December 1975June 1995
value growth of a wealth index of the S&P 500 for the same period (USS3.87). 8 T~rkey. From the time of its inclusion in the EMDB at the end of 1986, the
Turkish stock market exploded upward until mid-1990. Largely as a result of the Iraqi invasion of Kuwait, Turkish stock prices then collapsed during the following 1% years, After strong price recoveries in 1993 and 1995, the wealth index of Turkish stocks resided at a level substantially above that of U.S. equities. From year-end 1986 through midyear 1995, US1.00 invested in Turkish stocks grew to USS7.94 (see Table lo), as compared with USS3.87 for investing in the S&P 500.
Jardam. After experiencing healthy rates of return from 1979 to 1981, Jordanian stocks struggled through a decade of virtually no value growth. Only since 1992 have Jordanian equities resumed their upward price movement, interrupted only by a 1994 price setback. Primarily as a result sf the stagnant market from 1982 through 1991, the wealth index of Jordan stocks did not keep pace with U.S. equities. The wealth index for Jordan by midyear 1995 (USS6.68 for the full period, see Table 9) was approximately 50 percent below the wealth index of the S&P 500 index (USS13.14).
Lath America. The Latin American subindex consists of seven emerging markets: Argentina, Brazil, Chile, Colombia, Mexico, Peru, and Venezuela. As portrayed in Figure 7, rates of return for Latin American equities showed considerable
@The Research Foundation of the ICFA 25
E m e r ~ i n ~ Stock Markets: Rislz. Return. a d Peltbnnance
Figure 7. Pehrmance of Latin American Emerging Marbts versaas Variaus Asset Classes and the CPI, December 1975June 1995
variability while, from 1976 through 1985, substantially underperforming the U.S. stock markets, U.S. T-bills, and U.S. inflation. In the most recent decade, however, Latin American equities experienced explosive returns. During this period, as Table 10 shows, a wealth index of Latin American stocks appreciated to USS23.87 in U.S. dollar terms, more than six times the rate of U.S. stocks as measured by the S&P 500 (USS3.87) and more than seven times the Nasdaq @JS$3.15). The relative price performance of Latin American equities would have been even more spectacular without the "crash" during late 1994 and early 1995, which was largely concentrated among Mexican securities.
variances in rates of return occurred m o n g the individual Latin American markets. Chile and Argentina provided the highest rates of return among all the individual emerging markets; Brazil and Venezuela yielded among the worst returns of all the markets. Some of the most violent price swings in the emerging markets occurred among Latin American securities.
i j Argentifza. Argentine equities experienced highly variable returns for 1976 through June 1995, as Table 6 shows. By the early part of 1980, the index of Argentine stocks had soared almost 50.fold-a remarkable performance, especially when considering that U.S. stock returns were lethargic during this time period. By the end of 1984, however, Argentine stocks had relinquished ally all of this appreciation.
From that point on, Argentine stocks began a dramatic, but erratic, price surge. By June 1995 (see Table 9), the Argentine stock index stood at 133 times its December 1975 value, having at one point during 1992 peaked at over 200 times its initial value. Argentina's stock market provided the second highest returns among all emerging markets, even during a time of rampant idation throughout the Argentine economy. Table 9 shows that in local currency terms, by June 30, 1995, Argentine stocks had appreciated more that 12.6 billion times their year-end 1975 value.
I Brazi1. In local currency terms, a wealth index composed of Brazilian stocks appreciated an astounding 1.4 trillion times from December 31, 1975, to June 30, 1995 (seeTable 9). This enormous appreciation did not translate, however, to attractive rates of return for foreign investors. Measured in U.S. dollars, Brazilian stocks showed only a 5.11 times appreciation over this period. The wealth index of Brazilian stocks was at only approximately 60 percent ofthe level of the S&P 500's index at June 30,1995 (at USS13.14) and only slightly surpassed the wealth index of U.S. T-bills (at USS4.24). Note that stocks of Brazil's neighbor Argentina appreciated in value by more than 25 times the value of Brazilian stocks in U.S. dollar terns.
Chile. largely as a result of its widely acclaimed transformation to a free-market economy, Chile recorded the highest stock market total returns mong dl emerging markets in the studied time period. Table 9 reports that USS1.00 invested in Chilean stocks at year-end 1975 appreciated to Us331.36 by mid-1995. Thus, a portfolio of Chilean stocks provided more than 20 times the value increase of a portfolio of U.S. equities (USS13.14 for the S&P 500 and US$12.03 for the Nasdaq). A large portion of the value growth in Chilean stocks occurred during the most recent decade, as Table 10 shows.
Chile provides an excellent example of the volatility of emerging market equities. Even within this remarkable stock growth spiral, erratic price swings occurred. For example, from mid-1980 to year-end 1984, Chilean stocks lost Inore than 90 percent of their market value. Stock prices soared thereafter, but even the rapid price appreciation during the recent decade was not without intemption; Chilean stocks experienced meaningful price declines during 1992,1993, and 1994.
Colombia. Reported results of Colombian stock performance date back only to During the decade ended June 30, 1995, Colombian stocks significantly
outperformed U.S. securities. As indicated in Table 10, a USS1.00 investment in Colombian stocks would have grown to Us41.83, more than 10-fold the growth of an investment in the S&P 500 (lJS$3.85) and more than 13 times the Nasdaq (USS3.15). Furthermore, ofthe emerging markets, only Chile recorded higher equity returns than Colombia during this period. Most of Colombia's stock market appreciation occurred during two h e periods, late 1991 and early 1993 to early 1994. Eke some other Latin American markets, Colombia suffered severe stock price declines during late 1994 and
& f @ c o . In terms of market capitahation, Mexico is the largest market in Latin America. In terns of performance, Mexico has been among the most erratic. By year- end 1993, the Mexican stock market, riding on the North Amemcan Free Trade Agreement, had appreciated by almost 50 times its yewend 1975 value. However, as reported in Table 9, by mid-1995, the Mexican stock market was at only 19.17 times its year-end 1975 value. The devastating collapse of the Mexican market during 1994 and 1995 overshadowed the stock returns experienced pre-eviousljr. As Table 10 shows, even after accounting for the market collapse, Mexican stocks (at a growth of USS1.00 to USS16.83) outperfomed their U.S. counterparts by more than fourfold (S&P 500 at USS3.87 and Nasdaq at USS3.15) during the decade ended June 30,1995.
O n e Research Foundation of the ICFA 27
Ernergi~g Stock Ms~kets: Risk. Retwn. and P c d o r ~ n a ~ c e
P ~ A Pemvian stock performance data have k e n reported only since December 1992. During the brief period to 1995, Pemvjan stocks performed well in c o m p ~ s o n with U.S. securities. The stock market in Peru achieved a 2.69 percent monthly compound werage rate of return while the U.S. market experienced a 0.93 percent compound average rate of re-e'reem.
Venezuela. The stock marketin Venezuela has not perfomled well relative to the U.S. markets. As indicated in Table 9, USIj1.00 in~rested in ITenezue8an stocks at December 31,1984, would have 6gosaTn to only USS3.00 by June 30,1995. In contrast, the same investment in the S&P 508 ~7ouTd have appreciated to USIj4.55. Venezuelan stock rates of rehm were the worst among dI Latin _American countries during the decade ended June 30,1995; Table 8 indicates that the compound average monthly rate of return in U.S. dollars was only 0.85 percent as compared with 1.98 percent per month for the bti~ America regional index.
Asia. The performance of the Asian eme~ging markets from 1975 to 1995 is depicted in Figare 8. For purposes of performance review, these markets are divided here into East Asia and South Asia subregions.
East Asia. The East Asian emerging markets consist of China, Korea, the Philippines, and Taiwan. Figure 9 graphically portrays the performance results for East
Figure 8. Perf@vmance of Asia@ Emerging Markets versrrs Various Asset Classes and t he CPI, December 197SJume 1995
years, as exhibited by the more than doubling of Malaysian stock prices in 1993, followed by wild price gyrations and a sharp price correction in late 11393 and early 1991.
After moving roughly in tandem with the U.S. equity markets from 1985 to 1990, the Pakistani stock market began a series of erratic price movements-more than doubling in 1990, increasing another 50 percent in 1993, and declining almost 75 percent from its peak 1994 value before showing a minor upturn in mid-1985. US$1.00 invested in Pakistani stocks at year-end 1984 appreciated by midyear 1995 (Table 10) to USS5.06, slightly more than LJSS1.00 invested in the S&P 500 over the same time period (USS3.79).
Data for Ssi Lankan stocks date from only year-end 1992. Through midyear 1995, Sri Lankan stocks experienced wild price gyrations but provided returns only slightly in excess of the returns generated by U.S. T-bills. The stock market in S I ~ h n k a produced a 0.43 percent monthly compound average rate of return from December 1992 to June 1995. T-bills achieved a 0.33 percent monthly compound average rate of return during the same time period. Reliable f sk-return characteristics, however,
will have to await a longer performance history. Thai stocks matched the performance ofthe S&P 500 for 1976 through 1986. After
1986, however, Thai equities began a major upward movement, including almost 100 percent price increases in each of 1989 and 1992. As a result, the wealth index of Thai stocks for the &I1 period (see Table 9) was at USS45.82 on June 30,1995, more than three times the comparable-period wealth index for the S&P 500 (USS13.14).
Africa. The Mican emerging markets are Nigeria, South Africa, and Zimbabwe. South Africa was introduced into the EMDB beginning in 1994; &us, pre-1994 results contain only Nigeria and Zimbabwe stock returns. As shorn in Figure 11, African stocks performed poorly from 1975 to 1995. USS1.00 Invested in African stocks over this time period would be worth only USS0.84 at period end, compared with USS10.01 per dollar invested in the Composite of emerging markets stocks and US$13.f$ for a dollar invested in the S&P 500. Thus, M c a was the worst investment outlet, by a substantial margin, among all regions. The 1994 inclusion ofthe sizable South k c a n market signgcantly changes the complexion of the &can index; thus, past returns may not be very relevant to future performance.
Nigeria. Nigerian stock results begin in 1985. As shown in Table 10, US$1.00 invested in Nigerian stocks at July 1, 1985, would be valued at only USS1.03 after 10 years. Over this time period, Nigerian stocks not only failed to keep up with the U.S.
Figure 11. Be~armanse? of Afrimn Emerging Markets versus the Varlous A s e t Classes and the CPi, December 1975-June 1995
CPI (growth to US$1.43) and T-bills (US$1.78), but they also tied with Indonesia for the lowest appreciation rate m s n g all of the individual emerging markets. Furthemore, the low rates of return have been accompanied by high volatility (see Table 6) , including a dramatic Nigerian stock market collapse in early 1995.
South Afiica. Although South Mican stocks have actively traded for many decades, they were not included in the EMDB until recently, primarily because of South African apartheid policies. Clearly, the addition of South M c a will have substantial repercussions on the Ahican emerging market composite index because of the large size of the market in comparison with other African markets.
I I Zimbabwe. Table 9 reveals that US$d.OO invested in Zimbabwean stocks at year- end 1975 had appreciated to USS4.84 at mid-1995, thus providing less than one-half of the value increase of an investment in the S&P 500 (USS13.14) over the same period. After keeping pace with U.S. stocks through 1980, the Zimbabwean market collapsed, losing approximately 80 percent of its value by 1984. Subsequently, Zimbabwean stocks experienced an almost uninterrupted six-year period of explosive growth, moving the wealth index value above the S&P 500 by year-end 1990. During 1991 and 1992, Zimbabwean stocks again lost more than 80 percent of their market value, then rebounded in 1992. The collective results are that the highly volatile Zimbabwean stocks yielded only slightly better returns than low-risk U.S. T-bills kom 1975 to 1995.
Variations in Peufovmamce over FivemYear Periods The preceding discussions clearly show that over the 20-year period of our data, emerging markets have gone through periods of extremes in performance. The variations across time should serve to remind the investor of the boilerplate caveat that goes on virtually all mutual fund reports of performance: "'Past performance may not be indicative of future performance." The warning goes double in emerging markets.
Why does performance vary so much in these markets? A key reason is that governments change fundamental economic policies, and in the case of emerging markets, those policies can have dramatic effects on security values. This section provides details of the extent to which emerging markets have registered variations in performance over time by breaking down the performance for the nine markets that have been in the EMDB for the full period into five-year segments. The final part of the chapter then illustrates the effects of important economic events in particular markets.
Nine Markets with 20 Years af Data: Wealth Appreciation, Variations in performance for the nine markets that have been in the IFC's EMDB since December 1975 are shown in the five-year segments of data given in Table 12. The data are the compound values of a USS1.00 investment in each of the markets. The wealth index results in Table 12 reinforce the earlier demonstration that the emerging markets have widely varying performance even over relatively long periods.
Of these nine markets, Chile is the most extreme example. On the one hand, an investor putting US$1.00 in a value-weighted portfolio in the Chilean market at the end of December 1975 would have had USS33.40 by the end of the June 1980, a gain of 3,340 percent. On the other hand, if the investor had put USS1.00 in the market at the end of June 1980, the investor would have had only USS0.16 five years later-a performance consistent with a -84 percent return. This 1980-85 period spanned the beginning of the Latin American debt crisis. The same investor entering the market in Chile at the end of June 1985 would have seen the US$1.00 grow by a factor of 10
OThe Research Foundation of the ICFA 33
Enerpivzp Stock Markets: Risk. Retura. and Pedomzance
Table 3.2. Fiwdear Comp~ursd Values of a USS1.08 Investment in Markets Listed in the EMDB from December 1975
Market 12/75-6/80 6/806/85 6/85-6/90 6/90-6/95
Argentina 29.42 0.19 6.21 3.93 Brazil 0.83 1.81 1.11 3.04 Chile 33.40 0.16 10.04 6.25 Greece 1.00 0.25 12.33 0.55 India 2.59 2.68 1.45 1.85 Korea 2.91 0.99 5.96 1.24 Mexico 3.45 0.33 9.98 1.69 Thailand 2.07 1.48 6.61 2.26 Zimbabwe 1.59 0.63 5.48 0.89 Note: The values shown are compound values of a US$1.00 investment at the start of the period listed at the top of each colulnn and held until the end of the period listed at the top of the column. The only markets included are those for which data were available for the entire time period of our study, December 1975 to June 1995.
times in the subsequent five years. Timing is everything, but unfortunately, the correct timing is not easy to see
before the fact. Argentina's five-year compound growth values were nearly as volatile as Chile's, but Chile's returns after June 1985 were substantially greater than Argentina's. This outcome may be associated with the fact that Chile's reform process led that of Argentina by nearly a decade. The results for Chile and Argentina during the second period in Table 12 are similar to the results for a U.S. investor who entered the U.S. market just before the Great Depression. Such an investor would have lost about 80 percent of her or his investment in large stocks or about 90 percent in small stocks. Thus, the terrible performance of these two Latin American markets in the 1980-85 period is not without precedent elsewhere.
b o n g the nine markets in Table 12, the ones with the least volatile five-year performances are India and Brazil. India's relative stability is not surprising; Table 6 showed that India's monthly standard deviation of returns has been among .the lowest in the EMDB. Brazil, however, had a monthly standard deviation that ranked second only % Argentina (in Table 6) , yet its successive five-year returns are relatively stable. It is as if Brazil has a high degree of volatility around a constant central tendency; over five-year periods, the dominant effect has been the central tendency.
Figure 12 demonstrates graphically the successive five-year compound values for the nine markets. The contrast between the large variations in perfomance for Argentina and Chile and the comparative stability of India and Brazil stands out clearly. Stability is presumably a good thing, but note that the impression of instability for Argentina and Chile in Figure 12 is caused primarily by the extremely high performance in the earliest period. Of course, as noted, no markets fell so far in the second period. Not only did Argentina and Chile fail to continue their prior high performance, but each lost more than 80 percent of its value.
O n e Research Foundation of the ICFA
Figure 12. Suceessivar FiveYeaar Comlpownd Growth far Nine Markets
0 December 1975-June 1980 July 1985-June 1990
July 1980-June 1985 July 1990-June 1995
NOIP: Includes only those companies entering the database as of December 1975.
Risk aasd Return Far Five-Year Periods: Ail EMDB Markets. Tables 13-16 provide compound values of a USS1.00 investment and an investment of one unit of local currency in successive five-year periods for all the markets in the EMDB as of the middle of 1995. As previously, if a market was included in the EMDB before the end of the five-year period relevant to the table, that market is included in the table with results based on the portion of the period for which data were available. (Beginning dates for a market's inclusion in the EMDB are given in Table 1.) For comparison, results are also shown for the S&P 500, the Nasdaq, T-bills, and the U.S. GPI.
Note from Tables 13-16 that the Composite gained 227 percent in the first five- year period, lost 49 percent of its value in the next period, gained 262 percent in the subsequent period, and gained 66 percent in the final five-year period. The average emerging market currency lost value in each of the periods, which is reflected by the fact that compound values of the Composite in local currency t e m s are greater in each of the periods than are values in U.S. dollar terms. Of course, as discussed previously, some emerging market currencies gained against the dollar in some time periods. During the December 1975 to June 1980 period, for example, Jordan and India registered higher compound changes in dollar t ems than in local currency terms. In each of the subperiods, at least one of the emerging markets experienced lower compound growth in local currency terms than in U.S. dollar terms. Especially noteworthy are some sf the Asian markets in the latter half of the 1980s and in the first half of the 1990s.
@The Research Foundation of the IGFA
Emerging Stock Markets: Risk, Return, and Pe$ormaacc
Table 13. Commund Values as af dune 1980 Based om All Data Awaiilable December iS"bJune 1980
usSl.00 Invested
1 Unit of Local Currency Invested
Composite 3.27 4.54
S&P 500 Nasdaq T-bills CPI
EMA Europe Greece
Jordan
Latin America 5.99 Argentina 29.42 Brazil 0.83 Chile 33.40 Mexico 3.45
Asia East Asia Korea
South Asia 2.26 2.09 India 2.59 2.26 Thailand 2.07 2.07
Note: Data had to start before June 1980 to be included in this table.
Table i4. Cornpma~ind Values as @f Jume A985 Bamd can Ail Data Available June 1980-June 1985
1 Unit of Local US$l.00 Currency Invested Invested
Composite
S&P 500 Nasdaq T-bills GPI
E m Europe Greece
Jordan
Airica Nigeria Zimbabwe
Latin America Argentina Brazil Chile Colombia Mexico Venezuela
Asia East Asia Korea Philippines Taiwan
South Asia India Malaysia Pakistan Thailand
Noto: Data had to start before June 1985 to be included in this table.
O l l e Research Foundation of the IGFA
Emergi~g Stock Markets: Risk, Return, and Pgdomatzce
Table %5. Csmpund Values as of lane a990 Bamd om All Dsrta Available June 1985-June 1998
Market usS1.00 Invested
1 Unit of Local Currency Invested
Composite 3.62 5.04
S&P 500 Nasdaq T-bills CR
EMA Europe
Greece Portugal Turkey
Jo~dan
Mica Nigeria Zimbabwe
Latin America Argentina Brazil Chile Colombia Mexico Venezuela
Asia East Asia Korea Philippines Taiwan
South M a 2.01 2.32 India 1.45 2.02 Indonesia 1.40 1.44 Malaysia 1.89 2.05 Pakistan 1.72 2.33 Thailand 6.61 6.20
Note: Data had to start before June 1990 to be included in this table.
@The Research Foundation of the ICFA
Historical Pet$omna~ce of Emerging Equily Markets
Table 16. Compound Values as &June 1995 Based on All Data Awailsrlble June 1996)-June 1995
Market USS1.00 Invested
1 Unit of Local Currency Invested
Composite
S&P 500 Nasdaq T-bills CPI
EMA Europe Greece Hungary Poland Portugal Turkey
Jordan
Africa Nigeria South Africa Zimbabwe
Latin America Argentina Brazil Chile Colombia Mexico Peru Venezuela
Asia East Asia China Korea Philippines Taiwan
South Asia India Indonesia Malaysia Pakistan Sri h k a Thailand
A highlight of Table 15 is the extraordinary gains of Argentina and Brazil in local currency terms vis-84s U.S. dollar terms during the 1985-90 period. Argentina registered a full 521 percent gain in value in U.S. dollar terms in that period, in spite of suEering huge currency depreciation against the dollar. Note that Argentina's enormous percentage gain in U.S. dollar terns occurred in the same period in which the Nasdaq gained only 56 percent m d the S&P 500 only 122 percent. Thus, a stable currency is not a necessary condition for strong investment performance. The same
4 ~ o m e evidence exists that, within limits, a weak currency is associated with increasing share prices because exporters with high domestic content in their products benefit from lower relative costs. Dramatic losses in currency values do tend to be associated, however, with unstable economic conditions.
OThe Research Foundation of the ICFA 39
Emer~itzp Stock Markets: Risk. Return. and Pedormance
phenomenon is illustrated in Table 16: Brazil in the 1990-95 period registered a local currency gain sf 12,854,287 percent (related to a series of huge inflationary periods) while it gained 204 percent in U.S. dollar terns. During the same period, the S&P 500 and Nasdaq gahed, respectively, only 75 percent and 102 percent.
Tables 17-20 show mean monthly returns and standard deviations of monthly returns for the successive five-year periods. Note that in the first three periods (Tables 17, 68, and 191, Argentina registered the highest standard deviation of the markets, but it fell to Bth place (in U.S. dollar terms) during the final, 1990-95, period (Table 20) when Poland and China were added to the EMDB and Turkey and Nigeria registered high volatility. As a rule, Latin American markets have typically been more volatile than others, but their volatility has become relatively less pronounced in recent years. Moreover, new markets that come onto the global scene tend to experience volatile periods early in their emergence.
Table 17. Monthly Mean Retums, Standard Deviations, and Gomgaund Awerage Returns: All Data Available December 1975-June 1980
U.S. Dollar Lacal Currency
Arithmetic Compound Arithmetic Compound Average Standard Average Average Standard Average
Latin America hgentina Brazil Chile Colombia Mexico Peru Venezuela
Asia East Asia China Korea Philippines Taiwan
South Asia India Indonesia Malaysia Pakistan Sri Lanka Thailand
Ec~nornic Policies and Market PerFormance The policy changes and their effects in this section were chosen to illustrate the importance of following economic events in emerging markets that the reader is considering for investment. All of the figures in this section are based on market indexes expressed in U.S. dollar terns.
Argentina. The effects of the enactment of the Convertibility Plan in Argentina in early 1991 and the initial public ogering @PO) of YPF in June 1993 are depicted in Figure 13. The Convertibility Plan was the brainchild of Domingo Cavallo, the former Argentine Minister of the Economy and the man credited with having stabilized Argentina's economy. Under the Convertibility Plan, Argentina pegs the value of the peso (initially, 18,000 australs) one-to-one with the U.S. dollar. In addition, the government maintains a policy of limiting money creation to the amount of foreim
Figure A3. Economic Policy Changes and Market Pe~armanee: Argentina, December 19'45-June 1995
reserves on hand, thus guaranteeing convertibility of any amount of Argentine currency at any time. In essence, the Convertibility Plan removed monetary policy from the discretion of the government. In response to implementation of the plan, inflation quickly fell, interest rates began a sharp decline, and capital flight was reversed. The Argentine equity market increased by some 400 percent (in U.S. dollar terms) during the remainder of 1991.
The second event highlighted in Figure 13 is the initial pubbc offering of WF, the former national petroleum company of Argentina. WF was notable for its inefficiency and, despite its near-monopoly position in the petroleum markets of Argentina, chronic losses. Although focusing on a single initial public offering as a key economic event might at first glance seem odd, the privatization of national assets has been a major step in the liberalizing of emerging market economies. Moreover, F F is the Bxgest security (measured by market capitalization and by trading) on the Argentine Bolsa. Its p r iva~za~on was one of a series of moves by the government of Carlos Menem to privatize national assets. In fact, three stocks on the Argentine Bolsa account for more than 50 percent of the market capitalization of the full market: F F and the two telephone companies that were created from the former national telephone company. WF's initial public offering was followed by another rapid m n up in security prices that ended only with the collapse of the Mexican peso in December 1994.
Mexico. The devastating effect of the devaluation of the Mexican peso that occurred on December 19, 1994, is clearly visible in Figure 14. Earlier peso devaluations in 1976 and 1982 are associated with other declines in the value of the
44 @The Research Foundation of the IGFA
Mexican market, but no effect is so sharp as the one in 1994. Figure 14 also shows the effect of Mexico's August 1982 closing of its foreign exchange markets. In response to rapid capital flight, the country imposed restrictions on the conversion of the domestic currency m d koze the foreign currency accounts of its citizens.
Turkey. As Figure 15 shows, Turkey has historically had a volatile market. The event singled out is the downgrading of Turkey's sovereign debt by Moody's (from investment grade to speculative grade) in January 1994. Investors feared a severe devaluation of the Turkish lira, which indeed materialized, and expected a new austerity program. A body of research in the United States demonstrates that the downgrading of U.S. corporate debt often follows rather than leads the decline in value of a corporation's equity. In Turkey, the downgrade was itself apparently newsworthy to the market and was associated with a sharp decline in the equity market.
South Korea. A warning about government announcements versus government actions is provided by the case of South Korea. Since the early 1980s, Korea's government has often made an~~ouncements about the opening up of its capital markets to foreign ownership. Figure 16 points out the effects of several such moves. In January 1981, the government announced a plan to internationalize the capital market. This move was followed by years of promised additional opening-and failures to achieve such opening. One particularly newsworthy move was the creation of the well-known Korea Fund (a closed-end fund) in August 1984. Finally, during late
Figure 14. Economic Policy Changes and Market Peflarmailace: Mexico, December f 9953une 1995
1991 through January 1992, a series of announcements were made permitting foreign investment in significant percentages of the equity in Korean stocks. What is notewortby from Figure 16 is that these announcements do not appear to be associated with the market perfommce one might expect iYsm such a market opening. Thus, investors would be well advised not to assume that announced intentions to open a market will be greeted with increases in the value of the shares in that market.
Coneluslorn The comprehensive data and discussion in this chapter of the rates of return and risks of emerging markets-in the aggregate, by regions, and for individual country markets-was designed to equip the investor with solid empirical information about the long-term performance of securities in emerging markets. The chapter illustrated the high variability in the performance of emerging markets over time. Whether measured in monthly standard deviations or in five-year compound growth, emerging markets have been highly inconsistent in pehrmance over time. Thus, investors should be aware that not only do emerging markets entail high risk but the risk is not necessarily removed by commitment to a "long" holding period. Furthermore, the higher risk, or greater variability in returns, is not always compensated with higher returns. Finally, currency considerations can dramatically affect the performance analysis of a given market and must be seriously considered in portfolio design.
Figure 15. Economic Policy Changes and Market Performance: Turkey, December 11986-darns 1495
One of the key concepts of modern portfolio theory (Mm is the efficient portfolio- a portfolio that combines assets so as to minimize the risk for a given level of return. In order to evaluate the efficiency of various portfolio combinations, the investor must know the expected return and risk characteristics of each of the individual securities within the portfolio. In addition, to determine the overdl return and risk characteristics of the portiolio, the investor must understand how the securities interact.
Correlation Statistics In Chapter 1, we focused on the returns and risks ofthe emerging markets as a class, emerging markets grouped by geographical regions, and emerging country markets. In this section, we address the relationships between the returns of the various countries and regions. For this purpose, we calculated the standard deviation of returns as the measure of portfolio risk. For a multiasset portfolio, the standard deviation is expressed as follows:
where CF = standard deviation Z = the sum over all of the investments in the portfolio (i = 1,2 ,3 , . . . , IV) w = the weight of an investment in the portfolio pj; = the comela th between investment i and investmenti
The correlation coefficient, p, measures the degree of association between pairs of investments in the portfolio. Although a correlation coefficient can range in value from -1 to +I, in most cases, its value falls somewhere in be.tween these two extremes.
N e n e v e r two assets have a correlation coefficient less than 1.0, some risk reduction will occur when the two assets are combined in a portfolio-that is, the portlolio's risk will be less than the weighted-average risk of the individual securities. The lower the correlation between the assets, the greater will be the risk reduction. In fact, when t-wo assets are negatively correlated, the co~mbina~on of the two assets can produce a portfolio with a lower standard deviation of returns than that for either of the two assets alone. Consequently, the no st important risk consideration for an individual asset may not be its own risk level but how it contributes to total portfolio risk through its correlation with the other assets in the portfolio.
Car~.elatioes with U.S. Markets. One of the benefits of investing in emerging markets is that the security returns in these markets are not highly correlated with the returns ofthe developed markets. Therefore, adding emerging market securities
to porkfolios containing only securities from developed markets can reduce overall portfolio risk, even though securities from emerging markets are characterized by higher expected risk than securities from developed markets.
Table 21 shows that in the full 1975-95 period, ihe returns from portfolios of the emerging markets typically had low or negative cowelations with U.S. stocks-the S&P 500 Index and the National ~ssociation of Securities Dealers Automated Quotation Composite Index (Nasdaq). During this period, our Emerging Markets Composite Value-Weighted Index (the Composite) had only a 0.27 correlation with the S&P 500 (0.28 with the Nasdaq) . Table 21. Correlations between Emerging Markets and U.S. Equity Markets
December 1975- June 1985- June 1985- June 1990- June 1995a June 1 9 9 0 ~ June 1995~ June 1995C
EblA Europe Greece IHungary Poland Portugal Turkey
Jordan
M i c a 0.07 0.06 0.06 0.08 0.04 0.05 0.03 0.02 Nigeria 0.02 0.05 0.10 0.12 0.03 0.05 -0.02 0.01 South Africa na na na na na na 026 0.24 Zimbabwe 0.03 0.01 -0.30 -0.26 -0.10 -0.11 0.03 -0.02
Latin America Argentina Brazil Chile Colombia Mexico Peru Venezuela
Asia 0.21 0.22 0.24 0.26 0.27 0.28 0.32 0.32 East Asia 0.16 0.16 0.18 0.20 0.21 0.21 0.27 0.26 China na na na na na na 0.06 0.08 Korea 0.16 0.16 0.31 0.27 0.23 0.20 0.06 0.14 Philippines 0.25 0.22 0.16 0.10 0.24 0.21 0.38 0.37 Taiwan 0.14 0.14 0.08 0.11 0.15 0.15 0.28 0.22
South Asia 0.24 0.24 0.52 0.52 0.38 0.39 0.23 0.26 India -0.01 0.01 0.02 0.06 -0.06 -0.04 -0.16 -0.14 Indonesia na na -0.15 -0.11 0.26 0.25 0.34 0.32 Malaysia 0.45 0.41 0.54 0.50 0.46 0.42 0.33 0.32 Pakistan -0.02 0.00 -0.12 -0.04 -0.02 0.00 0.04 0.01 Sri Lanka na na na na na na -0.12 0.03 Thailand 0.15 0.17 0.37 0.41 0.33 0.38 0.31 0.37
na = not applicable.
aData had to start before July 1985 to be included in this time series. b ~ a t a had to start before July 1990 to be included in these time series. CPrice data for Hungary, Poland, Peru, China, and Sri h k a start on December 1992. Price data for South Africa start in January 1994.
Note: Correlations calculated using aU available U.S. dollar returns over the indicated periods.
58 QThe Research Foundation of the ICFA
Among the several regional groups, Latin h ~ e r i c a had B e highest correlation with the United States (0.24 for the S&P 500 and 0.26 for the Nasdaq) for the total time period, although it was only slightly greater than the correlation of the U.S. market vvith Asia (0.21 and 0.22). The relationship of the U.S. stock market with the European and Mican markets was subsbntiaHy weaker; the Europe index had a correlation of only 0+10 with the S&P 500 (0.05 with the Nasdaq) , and the Mica index had a correlation of 0.07 with the S&P 500 (0.06 with the Nasdaq). Of special interest is the fact that the Latin American and Asian markets have become more closely related to the U.S. markets during recent years, whereas the returns of European and African stocks continue to have drbalIy no relationship to U.S. stock market returns.
Only h4alaysia among the 16 emerging markets for which data were available for the ha411 time period had a meaninghlly high correlation with the U.S. markets (0.45 with the S&P 500 and 0.41 with the Nasdaq). Becaase Malaysia is among the largest and is, arma"oy, one of the most economically developed of the emerging markets, it is not suwrising that Malaysia's equity markets would have the highest correlation with U.S. stocks.
With a 0.28 conelation coeficient between it and both the S&P 500 and the Nasdaq, the Mexican stock market had the next closest relationship to the 1J.S. markets. This relationship would be expected because of the relatively large size of the Nlexican stock market and the country's geographical progmiw to the United States. The correlation has varied across subperiods, registering a high of 0.45 with the S&P 500 in the 1985-90 period versus only 0.24 for the 8998-95 period.
Over the entire data period, the equity returns for three emerging markets were negatively correlated with the S&P 500 (Venezuela at -0.04, Pakistan at -0.02, and India at -0.01). These markets continue to be negatively or only slightly positive$ correlated with the U.S. markets, as shorn by their correlation coe5cients for the 1985-95 and 1990-95 periods, Zimbabwe was the only other emerging market to be negatively correlated ('-0.10) with the U.S. market from 1985 through 1995, and in the 1990-95 period, the negative conelation declined to -0.03.
Several major changes have occurred over time in the correlations between various emerging markets and the U.S. market. For example, asTable 21 shows, the comelation coescient between the Chilean stock market md the S&P 500 was only 0.04 for the entire 197595 period, indica$ing that stock market returns between these h-o markets were almost randon~ly related. The Chilean economy has developed subshntiauy in recent years, however, mith the resuit that the Chilean and U.S. stock markets have become much more related. The correlation between these two markets increased to 0.29 for the most recent 10-year period and to 0.36 for the most recent 5-year period.
The same phenomenon occurred between the S&P 500 and Brazilian stocks, as evidenced by an increase in the correlation between these markets from 0.05 for the f1.111197695 period to 0.43 for the 1990-95 period. The Brazilian market also shows how volatile the relagonship of emerging markets to the U.S. markets c m be. As recently as the 1985-90 period, the S&P 500 and Brazilian stocks were slightly negatively correlated.
!unong the Asian marketsj several ndceable changes occtarred in vakous periods. Taiwan, the largest emerging market in terms of market capitalization, experienced a signgcmt correlation increase with the United States. Over the 1975-95 period (see Table 211, the correlation coeacient was 0.14 with boCi the S&P 500 and khe Xasdaq; for the 1990-95 period, however, the correlation was 0.28 with the S&P 500 (0.22 with the Nasdaq). Thailand, the sixth largest emerging market, experienced a similar change; its correlation with the S&P 500 was only 0.15 (0.17' with the Nasdaq) for the
full period but was 0.31 (0.37) for the 1990-95 period. Two other large Asian markets, Korea and Malaysia, showed declines in their correlation coefficients with the U.S. markets between the full period and the two most recent five-year periods (1985-90 versus 1990-95).
Correllatisns &tween Emerging Markets. Empirical research has also r e vealed that, in addition to low correlations with developed markets, such as the U.S. markets, equity portfolios from the various emerging markets are not highly correlated among themselves, Correlation coefficients for all pairs of regional markets and for all pairs of emerging markets are presented in Table 22. Generally, the correlations between the emerging country markets are low, even for stock markets witbin the same geographical region. For example, only the Peruvian stock market showed any significant relationship with other Latin American markets (0.57 correlation with Chile and 0.47 with Argentina and Mexico); none of the other pairs of Latin American markets had correlations of more than 0.25. Some of the relationships were especially weak, such as the -0.03 correlation between neighbors Brazil and Venezuela.
The correlations between pairs of Asian markets are somewhat larger than those between pairs of Latin American markets. The highest correlation of returns shown in Table 22 is between Malaysia and Thailand, which are among the large emerging markets. The two largest East Asian markets, however, Taiwan and Korea, had a correlation coefficient of only 0.07, indicating virtually no relationship.
EFFicient Frontiers Combining U.S. and Emerging Markets. Figure 17 con- tains the risk-return curve for portfolios containing various combinations of emerging markets and S&P 500 stocks for the December 1975-June 1995 period. As shown, a portiolio composed entirely of emerging market stocks was inefficient-that is, it experienced lower reiturns at higher risk in this period than did a portfolio consisting entirely of U.S. stocks. Nevertheless, some efficient portfolios did contain emerging market stocks because of the diversification benefits provided by emerging markets. Portfolios containing 30 percent or less of emerging market stocks fell on the efficient portion of the risk-return curve, the efficient frontier.
For the most recent decade, emerging market securities experienced much stronger relative returns. Consequently, as illustrated in Figure 18, the efficient frontier for this period includes a greater representation of emerging market stocks. Portfolios ranging from 20 percent to 100 percent investment in emerging markets fell on the efficient frontier. A particularly important result is that a portfolio mix of 20 percent emerging market stocks represented the lowest risk portfolio on the efficient frontier. Thus, the addition of the higher risk emerging market securities created a portfolio less risky than a portfolio composed entirely of U.S. stocks-a prime example of the beneficial reduction of overall portfolio risk by adding nondomestic securities having low cowelations with domestic securities. The diversification benefit is so powerful that a postfolio containing only U.S. stocks is dominated by portfolios including emerging market stocks.
Similar results occurred for the most recent five-year period. As shown in Figure 19, from 1990 to 1995, the efficient frontier for portfolios of U.S. and emerging market equities consisted of porttolios with weights in emerging markets from about 10 percent to 100 percent. Note, however, that the tight return scale on Figure 19 indicates that emerging market stocks provided little return premium over U.S. stocks on an arithmetic-return basis, and recall that the geometric mean returns were reversed.
52 O n e Research Foundation of the ICFA
OThe Research Foundation of the ICFA 53
Emerging Stock Markets: Risk, Retura, a ~ d Pe@r?naulce
Figure 17. Risk versus Returm For Gamlblma tions @f Emeeing Market Stocks and M S . Stocks, Decemlber 1975- June 1995
1.14 1 I I I 3.5 4.0 4.5 5.0 5.5 6.0
Standard Deviation of Returns (5%)
Rgure 18. Risk versus Return for Combin* %ions ef Earergng Market Stacks and US. Stocks, Jums 31985 June 1995
4 5 6 7 Standard Deviation of Returns (%)
Figure 19. Risk versus Return Tor Combina- tions af Emerging Market Stocks and US. Stocks, Jume 1998- June 1988
u.7uu
3 4 5 6 Standard Deviation of Returns (%I
--
OThe Research Foundation of the ICFA
Podfolio Corzstrzkction Uslsiag Emerging Markets
Figures 20-23 present eEcient porkfolio combinations ofU.S. stocks (the S&P 500) and vario.4~ regional emerging market portfolios. The efficient podolio combinations of h t i n ,herican and U.S. stocks in Figure 22 reveal particularjy q~~ell the diversification benefits of emerging markets. f lhough the Latin h ~ e r i c a n markets have been substantially more volatile than the U.S. market, the addition of Latin American stocks to a U S stockpo&olio over the 1975-95 period could have increased the portfolio's realized rate of return while reducing overall portfolio volatility. For example, the lowest risk podolio o~ the efficient frontier consisted of 90 percent S&P 500 and 10 percent h t i n American stocks and produced a rate of return in excess of the return experienced by U.S. stocks alone. A similar relationship occurred between U.S. and Asian stocks (Figure 23). In this instance, the efficient polr@olio consisted of 70 percent S&P 500 and 38 percent Asim stocks and provided the least risky podolio on the eEcient frontier but still at a rate of return in excess of the S&P 580 alone.
The less mature Mican and European emerging markets failed to provide meaningful diversifica"kion benegts for U.S. investors, largely because stocks in these markets provided low rates of return during the observed time period. For example, Figure 21 shows that the addition of a small portion of higher risk, lower return Mican stocks to a U.S. stock portfolio would have resulted in a portfolio with less variabiliw than the S&P 500 for the 1975-95 period but only at the expense of a Bower rate of return. A sinailar effect is exhibired in Figure 20 for the emerging European markets.
Egure 20. Risk versus Return: Eurape a~td the S&P 500, December 1975Jtfne 1995
2- I 5 0.7 ' I I . 3 1 6 8 10
Standard Deviation of Retarns (Q)
FCgure 21. Risk versus Reeurn: Africa arrd the S&P 500, December P9759uwe 1998
2 4 6 8 l n ili
." l d
Standard Deviation of Reiurns ( ' X )
aThe Research Foundation ef the 6CFA 55
Erner~im Stock Markets: Risk. Return. and Pedo~mance
Egure 22. Risk versus Return: btlm Amerla and the S%P 580, December 19ilbJune 1995
America
1.0 1 I I I 4 6 8 10
Standard Deviation of Returns (%)
Figure 23. Wlsk versus Return: Asla and the S&P 500, heember 1975- Jurne 1995
3.5 4.0 4.5 5.0 5.5 6.0 6.5
Standard Deviation of Returns (%)
Many U.S. portfolio managers view emerging market investments as a potential component of their international (i.e., non-U.S.) portfolios. Within that international portfolio, the Europe/Aust ra /ar East (EWE) Index maintained by Morgan Stanley Capital International (MSCI) is often viewed as the reference portfolio. Figure 24 shows that the diversikation benefits of emerging markets have been present for an EAFE- based portfolio as well as for an S&P 500-based portfolio. The minimumvariance combination of EAFE with the Composite included an approximately 40 percent investment in emerging markets when data for the full sample period were used.
Table 21 showed that the correlations between the S&P 500 compound mean rates of return and the compound mean rates of return of individual emerging markets varied widely. Accordingly, configurations of the eficient frontiers representing combinations of the individual emerging markets with the U.S. market vary substantially. For example, as might be expected, the larger, more developed of the individual emerging markets have provided relatively attractive diversification benefits when combined with U.S. stocks. The efficient combinations of stocks from Thailand and the United States depicted in Figure 25 provide a representative example. The inclusion of 20 percent Thai stocks with 80 percent S&P 500 stocks
56 @The Research Foundation of the ICFA
Po@iolio Constmctio~ Us i~g Emerging Markets
Flgwre 24. Risk versus Return: Composite and the EAFE Index, b e m k r 197SJurne 1995
Figure 25. Risk vevsus Return: Thailand and the S&P 500, December P975- June 1995
-
- E 2.0
2 1.8
h 1.6 2
1.4 % Thailand/80% S&P 500
g i 1.2 2 4 1.0
3 4 5 6 7 8 9
Standard Deviation of Returns (lo)
1.40 - 2 1.35
5 1.30
2.25
3 1.20
% 1.15 E p 1.10
would have produced a meaningfully higher rate of return at substantially lower variability than the S&P 500 alone.
In contrast, many of the small, new emerging markets do not by themselves provide meaningful diversification benefits to stock portfolios based on developed domestic markets. The correlations in some instances are not low enough to offset the efiects of very high volatility in the emerging market. For example, Figure 26
-
- 40% Composite/60% EAFE
-
-
- Composite
I I I
Figure 28. Risk versus Return: Pslaad and the S&P 500, December 1975June 1995
4.0 4.5 5.0 5.5 6.0
Standard Deviation of Returns (%)
Standard Deviation of Returns (7%)
OThe Research Foundation of the ICFA
Elncrailaa Stock Markek: Risk. Rekm. and Pedo~ma~zce
shows that the lowest risk "combination" of U.S. and Polish stocks is composed entirely of U.S. stocks. Thus, only by accepting risk greater than for the S&P 500 would ara investor add Polish stocks by themselves to a U.S. podfolio.
Changes In PaPltfeli~s BCCOS Time The previous sections showed that emerging markets offer important diversification benefits to the investor holding a portfolio of U.S. equities or of equities related to the E N E Index. In this section, we examine whether the diversification benefits hold consistently over time. We note the time variation in correlations and examine the construction of portfolios across time, including a graphical analysis of the efficient combinations of U.S. and emerging market portfolios.
Chamges in EFFisient Combinations of Emevgiaag Markets with the 8%8 580. Figure 27 illustrates the change over tirne that took place in the ex @st risk- return trade-off between the Composite and the S&P 500 between the roughly two 10-year periods of our data. The first period depicted in Figure 27 is the 9 1/2-year period from the start of the sample, December 1975 through June 1985; the second period is the subsequent 10 years, June 1985 through June 1995. For simplicity, we will refer to these periods as 20- and l@year periods; the most recent 5-year period is June 1990 through June 1995. The lower graph is for roughly the first 10 years, and the upper graph is for the most recent decade. m e two points fiat represent 100 percent investment in the S&P 500 are nearly in the same location on the graph, but the points representing 100 percent investment in emerging markets are separated by a large distance in risk-return space. Ira the earlier-period graph, the rninimum- variance combination occurs at approximately 50 percent investment in emerging markets, but in the later period, the minimum-variance point is at about a 20 percent investment in emerging markets. Furthermore, emerging markets were dominated in risk-return space in the earlier-period graph but not in the later one.
Consider the minimum-variance point in the earlier period. As mentioned, that point occurs at about a 50 percent investment in emerging markets. Investors who derived that value in the first period might decide that investing 50 percent of their
Figure 27. Risk versrrs Return: Composite and the SBP 800, December 8975 June 1985 versus June 311885-June 1995
Composite
Standard Deviation of Returns (%))
-+- December 1975-June 1985 -A- June 1985-June 1995
GThe Research Foundation of the ICFA
Pon$4oolio Comtraction Using Enzergi~g Markets
money in emerging markets would sharply reduce the risk of their U.S. portfolios. Where would they be in the later period? Rather than lowering risk relative to We S&P 500, their emerging market investments would have increased risk. Therein lies the problem of using historical data to construct portfolios. As markets change over time, the characteristics of those markets in risk-return terms also change, so what effect the portfolio decisions an investor makes in one period will have on the portfolio returns in the next period is difficult to foretell.
Changes in Correlations between Emerging Markets and the 81.S. Market over Time. Table 23 shows selected correlation coefficients between various emerging country markets or regions and the S&P 500. The table illustrates the sometimes sharp changes that have taken place in correlations over time. The table separates selected correlations into those for the June 1985-June 1990 period and those for the June 1990-June 1995 period-the two most recent five-year periods in our study. These changes help explain the difficulty in using risk-return trade-offs for portfolio construction.
Table 23. Illudr&lwe Changes In Gauuel&lons between the 8&P 500 and Selgeted EmerBng Markels
June 1985- June 1990- Market June 1990 June 1995
Combinations of markets Composite 0.31 0.41 Latin America 0.41 0.38 Asia 0.24 0.32
Markets with inc~easixg cowelations Argentina -0.02 0.30 Brazil -0.03 0.43 Greece 0.07 0.29 Indonesia -0.15 0.34 Portugal 0.17 0.43 Taiwan 0.08 0.28 Zimbabwe -0.30 0.03
Markets with decreasing correlations Korea 0.31 0.06 India 0.02 -0.16
The first set of results is for correlations of the S&P 500 with the Composite and two regional indexes. The table then shows changes in correlations for seven of the markets that showed increases in correlation with the S&P 500 of at least 0.20 and changes for those markets for which correlations with the S&P 500 decreased. Note that the correlations of the Composite, the Latin America, and the Asia indexes with the S&P 500 changed relatively little between the two periods. Those results are sharply at variance with the story for the individual markets. Apparently, correlation is more stable among broadly diversified portfolios than between individual, narrow markets and a broadly diversified portfolio such as the S&P 500.
Of the markets whose correlations with the S&B 500 increased, the largest change was for Indonesia, whose correlation coefficient rose from -0.15 to a positive 0.34, a change of 0.49. Brazil increased by a slightly smaller mount, horn -0.03 to 0.43, a change of 0.46. The tendency of these markets toward increased association with the U.S. market may be a result of the integration of capital markets and expansion of
global trade among the nations used in the analysis. For such reasons, apparently excellent diversification vehicles in one period may turn out to be mediocre for the task in a subsequent period.
Onlytwo markets showed decreased correlations with the U.S. market. Korea fell from a relatively high (among emerging markets) 0.31 correlation coefficient in the earlier period to 0.06 in the later period. India fell from a slightly positive value to -0.16.
Changes irra Cgarrelatlons amen$ Emerging Markets over Time. Using the correlation data from Table 22 for the nine rnarkets for which data were available for the full study period (Argentina, Brazil, Chile, Greece, India, Mexico, South Korea, Thailand, and Zirnbzbwe) and the markets' standard deviations, we constructed efficient sets of emerging market portfolios for the first decade and the second decade. The curved line with the square boxes in Figure 28 represents portIolio combinations for the period of June 1985 to June 1995. Separately, we calculated the efficient frontier from ex post data on the nine markets in the 1975-85 period. We identified five points along that earlier frontier that we could use to determine how eEcient portfolios from the period would have performed in the 1985-95 period. The five prior-period efficient portfolios are indicated in Figure 28 by the cluster of circles in the lower left area. The prior-period escient portfolios are not on the efficient frontier in the later period. Thus, identifying efficient portfolios in one period is no assurance that those poriiolios will be efficient in a later period.
As an alternative way of demonstrating the instability of portfsliss across time, we identified the portfolio weights of the minimum-variance portfolios for the same two periods and same emerging markets used in Figure 28. Table 24 shows those weights. Dramatic shjifts occurred behveen the two periods in the composition of the minimum-variance portfolio. For example, the weight of Greece fell from 24 percent to 8 percent, the weight of Mexico fell from 9 percent to zero, and the weight of Brazil fell from 11 percent to 2 percent. In sharp contrast, Zimbabwe's weight rose from 2 percent to 24 percent and Korea's rose from 9 percent to 25 percent.
Comditiomal Expe&alloms and Emerging Market Psvtfoiiass. Because mar- ket performances and correlations between market returns change from one time
Figure 28. Emerging Markets Emciemt Frontier, July 1198SJume 1995
L
0 10 20 30 40
Standard Deviation of Montl~ly Returns (5%)
Note: The circles represent expost performance for poltfoEios based on weights from ex sate optimization. The weights making up these inefficient porkiolicss for this period produced results on the efficient frontier calculated for December 31,1975, through June 1995.
OThe Research Foundation of the ICFA
Politfolio Constructiort Usilzg Emerging Markets
Table 24. W e i a t s in the MlnimumVariance Ps14Folios for the Nine EmeveJimg Markets In the EWRDB Beglnnlng Decembr 1975
December 1975- June 1985- Market June 1985 June 1995
Greece 24% 8% Thailand 22 11 India 21 15 Brazil 11 2 Korea 9 25 Mexico 9 0 Chile 3 13 Zimbabwe 2 24 Argentina 0 2
period to another, investors and managers can find opportunities to improve their portfolio asset allocation decisions. For example, when a portfolio manager selects portfolios based on historical means, variances, and correlations, that process is called '6unconditional optimization." T%e process produces efficient portfolios based on ex post data, and after the fact, the manager has no di6Eiculty deciding which asset allocations would have produced efficient porkfolios. The procedure is considered "unconditional" because expected returns, variances, and correlations are simply estimated at their previous values without adjustment for the current state of the market. The procedure implies that, because stock returns are not predictable, one's best guess about future performance is the historical average. Basing asset allocation decisions on historical measures, however, without adjusting them to market realities may be misleading.
Instead, on an ex ante basis, the optimization procedure should make use of the best available forecasts for returns, variances, and correlations. If stock returns can be partidly predicted, asset allocation conditioned on those forecasts will allow managers to make superior asset allocation decisions.
Conditional expectations techniques such as those applied by Harvey (1994) condition the estimates of portfolio parameters on the state of the market. (For example, in the market for U.S. securities, researchers have observed, when dividend yields are low relative to historical noms, subsequent average returns on U.S. stocks tend to be low.) Harvey compared unconditional optimization procedures with procedures that condition expectations on the state of the market as indicated by world and local infomation variables. l He found h a t both procedures show the diversification benefit of adding emerging markets to portfolios of developed markets but that conditional expectations methods were superior. The unconditional procedures result in improved returns (relative to a zero allocation to emerging markets) for a given level of risk because, even though cowelations are changing, the correlations between emerging and developed markets are remaining low. When conditional expectations methods were used, however, the return for a given level of volatility more than doubled.
1 ~ h e world variables included the lagged world return, the lagged return on a 10-country currency index, the lagged MSCI world dividend yield, the lagged MSCI earnings-to-price ratio, and the lagged short-term Eurodollar rate of interest. Local information variables consisted of the lagged country equity return in local currency terns, the lagged change in the country's currency exchange rate per U.S. dollar, the lagged country dividend yield, and the lagged country earnings-to-price ratio.
Csnclassion Stocks in emerging markets are generally riskier than their U.S. counterparts. Nevertheless, they can provide important diversification benefits. When properly combined with U.S. stock portfolios, emerging market securities can enhance overall portfolio return while maintaining or even reducing portfolio risk. The reason is that, on average, the returns of emerging stock markets are not highly correlated with each other or with the U.S. stock market.
When dealing with emerging markets, applying inputs estimated in one period to portfolio choices in a subsequent period is dangerous. Chapter 1 demonstrated that fact in terms of arithmetic means, compound means, standard deviations, and compound terminal values. This chapter demonstrated that the identzcation of efficient or desirable portfolios in one period is no assurance that they will be efficient or desirable in a subsequent period. The analyst or portfolio manager must be cognizant of much more than historical performance and parameter estimates in the selection of alternative markets for portfolios. Moreover, although the low correlations between emerging and developed stock market returns provide diversification opportunities for investors even if only historical data are used, properties of portfolios and their performance in terms of risk and return can be greatly enhanced if investors use forecasted inputs for asset allocation decisions.
OThe Research Foundation of the ICFA
3. Investability in Emerging Markets
Even before considering investments in emerging markets, investors should note that indexes based on l[FC (International Finmce Corporatiom) data do not include all the securities in a market. For example, a late-1996 Wall SfreetJozk~~al article on India's equity markets pointed out that 7,895 distinct equities were listed in the Indian markets at the tirne.l The IFC9s Emerging Markets Data Base (EMDB), however, included data on only 138 Indian equities as of June 1995. Therefore, the real nature of a market may be quite different horn We view of it by the EMDB.
Moreover, among the 138 Indian securities contained in the ENIDB, the ZFC has identified only $01 as investable by foreign investors. Because the oppo~unities available to domestic investors may be dkfferent From those available to foreign investors and because performance analysis that ignores the feasibility of investing in certain securities risks misstating the performance actually achievable in the market, the question considered in this chapter is whether the performance results described in Chapters P and 2 based on the fun EMDB continue to hold when the data are further limited to the set of investable securities.
The IFC established its investability data in December 1988, so only relatively recent data reflect this measure. When we used these data in this study, we included total returns beginning in December 1988 or compound values starting at a value of USS1.00 at the end of November 1988. Because investment performance varies over time, readers should keep in mind the short time period for which investability data exist; a longer time period would increase the confidence readers could have in the results. These data are for the most recent periods of the study, however, and thus particularly pertinent to present circumstances in the markets.
"Be Investable Unlwease Foreigners are prohibited altogether from investing in the equities of some markets. In other markets, the fraction of a given company's stock that may be held by foreigners is restricted. In South Korea, for example, the restriction is typically 10 percent of outstanding shares. In Thailand, foreign limits exist, but when the limits are reached, shares held by foreigners may trade on the Alien Board. In some markets, foreign investors are limited to holding only certain classes of equity; for example, China provides A Shares for domestic investors while limiting foreign investors to I3 Shares. Foreign ownership may be restricted by the government of a country or the articles of inco~oration of a specific company.
The IFC Investable Index includes the stocks of 25 of the 26 countries covered in the EMDB; Nigeria is considered to be not investable. The IFC identifies a security as investable under certain condi~ions.~ One condition is that foreigners not be
Isurnit Sharma, "Mmy Investors in Indian Stocks Have Nothing but Woe to Share," WalE Street journal (November 25, f 996):Cl.
2Tl~e 1[FCqs publication tilled "IFC Index MethodoIogyV describes the investable indexes and the various restrictions pHaced on foreign ownership.
OThe Research Foundation of the HCFA 63
Emzergigzg Stock Markets: Risk, Return, a d Pe~oornzance
restricted from buying the security. Under the IFC9s definition, securities are not investable if foreigners are prohibited from holding them. For each security in which foreign holding is allowed but limited, the EMDB identifies the fraction of that security that can be held by foreigners. The remaining conditions are not explicitly stated by the IFC. Presumably, the size, liquidity, and industry factors initially used for inclusion of securities in the EMDB are applied more strictly in identifying investable securities.
For this study, we began with the IFC7s designation of securities investable by foreign investors and constructed our own indexes based on the IFC's definition. When we refer to an investable index here, we mean we have used the IFC7s identification of investable securities, not that we are using the IFCs Investable Index.
So that the results reported here can be compared with results reported earlier in the monograph, comparisons in this chapter are made between the investable securities (Investables) and all the securities (41) in a market or region included in the EMDB, rather than between "investables" and "uninvestables." Investables is a subset of All.
One final note: We do not report separate results for Thailand in the comparison of investable securities with the EMDB set of securities because Thailand's system of foreign trading, the Alien Board system, can lead to distinct price differences between shares traded among foreigners and those traded among Thai citizens. The EMDB does not separately identify the prices when the same security trades at different prices on and off the Alien Board. Thus, performance of truly investable securities cannot be distinguished from performance of uninvestable securities in Thailand.
PerFormanee Comparisons: Inwestables versus All The performance comparisons in this section are of value-weighted portfolios of Investables with value-weighted poPtfolios constructed from All securities. Figure 29 compares the compound value of a USS1.00 investment in Inveslables with the same investment in All over the period from late 1988 through mid-1995.3 As the figure demonstrates, Investables have consistently outperformed All since September 1989. A foreign investor has indeed had access to performance in emerging markets comparable to that available to domestic investors on an overall basis.
Table 25 breaks down the aggregate results to a broad set of regional indexes to contrast Investables with All on a regional basis. The table shows the compound value of USS1.00 invested for the period covered in each of eight regional indexes, including the investable subset from our Emerging Markets Composite Value-Weighted Index (the Composite). The compound value of an investment of USS1.00 in Investables is greater than a comparable investment in All in every case except those of Europe and the Europe/Mideast/&ica @MA) index. Note that monthly geometric mean returns compare in the same manner because the higher a compound return value, the higher the geometric mean.
An important issue for the investor to consider is why Investables perform better than All. A likely explanation is that the opening up of emerging markets and the lessening of restrictions led to substantial flows of portfolio capital into the markets that opened. That capital could only flow into securities for which foreign investment was not prohibited. The demand for investable securities thus rose sharply and, accordingly, so did the prices. Although this explanation may appear reasonable,
3 ~ o m e markets were added to the database later than others and do not have data available for the full period covered in this chapter, December 1988 through June 1995. See Table 1 lor dates when markets were added to the EMDB.
O n e Research Foundation of the ICFA
Figure 29. PevfFormance oP larveolables versus Peflormarace of Ail, data Rom end November 1988-June 1995 -
Table 25. Relative Peflormance of ~nwestalbies, December 198s June 2995
Compound Index Value Monthly Geometric of US$1.00 Invested Mean Rebrn - Standard Deviation
Market All Investables All l[nvestables All Investables
Composite
EMA Europe
Africaa Latin America Asia
East Asia South Asia
aValues for Africa are calculated from June 1993 through June 1995. Nigerian securities were not identified as investable by the IFC.
rigorous tests of the explanation have not been conducted. The cause of the difference remains open for further study.
The last two columns of Table 25 allow comparison of standard deviations of returns for the HnvestabIes and 41. The results are mixed. For the Composite, Asia, and Africa, standard deviation is lower for the Investables than for HI. The opposite holds for Latin America, South Asia, East Asia, the EMA, and Europe. The reason is not clear. The effects of foreign investors might be expected to increase the volatility of foreign-owned securities. Also, because A1 contains securities not available in linvestables, MI may generally be more diverse and have lower risk. Counteracting those influences, to the extent that the Investables group tends to be biased toward larger and more liquid securities, Investables may tend to be less volatile.
OThe Research Foundation of the IGFA
Emerging Stock Markets: Risk, Retur~, and Potfiormance
Pa#olio Charaetevisti~s of inwestables In Chapter 2, we examined the results of combining emerging markets and the S&P 500 Index in portfolios. In this section, we compare the performance of portfolios containing Investables plus the S&P 500 with the pedormance of portfolios containing All plus the S&P 500.
The results for the Composite Investables or All securities combined with the S&P 500 are shown in Figure 30. The results come from applying standard Markowjitz portfolio analysis to the following data: The mean monthly rate of return and monthly standard deviation of return for the S&P 500 for the study period were, respectively, 1.18 percent and 3.50 percent; the Composite Investables for the period had an arithmetic average monthly return of 1.93 percent and standard deviation of 5.72 percent; for All, the corresponding values were 0.96 percent and 6.11 percent.
Figure 30. PorNollos of Inwestables and the S&P 500 versus Poutfolios of All and the S&P 500: Conrblslatlons Based on Monthly Returns, December 1988Juae 1995
Correlation coefficients of these emerging markets with the S&P 500 were 0.3750 for the Investables and 0.2695. for All.
The Investables produced a superior expost set of porkfolio combinations with the S&P 500 when compared with All. Although the sets of emerging market securities produced minimum-variance combinations with the S&P 500 ~ t h similar weights, the All portfolio was dominated (in mean-variance terms) by the S&P 500. Cerkain combinations of the Investables portfolio with the S&P 500, however, dominated the S&P 500: Using Investables as the emerging market vehicle produced a set of portfolio combinations with lower standard deviations and higher compound mean returns than the S&P 500 by itself* The investment opportunity set was dramatically more efficient with investable securities than with the full set of emerging market securities.
Tables 26 and 27 develop the results shown in Figure 30. Table 26 shows the correlations between each regional or country market and the S&P 500 and standard deviations of monthly returns over the period for which data were available in each
Table 26. Correllations sf Emerging Markets with the S&P 500 and Standard Deviations for Invedables and All Emerging Market Securities, December 1988-June 1995
Correlation with S&P 500 Standard Deviation
Market All Investables All Investables
Composite
Em Europe Greece Hungary Jordan Poland Portugal Turkey South M c a a
ziinbabweb
Latin Anlerica Argentina Brazil Chile Colombia Mexico Peru Venezuela
Asia East Asia
China Korea Philippines Taiwan
South Asia India Indonesia Malaysia Pakistan Sri h n k a
aData for South Africa start January 1994. bData for Zimbabwe start June 1993.
O n e Research Foundation of the ICFA
Egnergilzg Stock Markets: Risk, Return, and Pe$ormzance
Table 29. Padfolio Mimimum-Variance Weights sf Emergiag Markets C~rnbianed with the S&P 500, December 1988-June 1995
All Investables
Composite
EMA Europe Greece Hungary Jordon Poland Portugal Turkey South Mica
Zimbabwe
Latin America Argentina Brazil Chile Colombia Mexico Peru Venezuela
Asia East Asia
China Korea Philippines Taiwan
South Asia India Indonesia iLlalaysia Pakistan Sri Lanka
Note: The S&P 500 total returns index had a standard deviation of monthly returns of 3.50 percent during the sample period.
market. In both cases, data are shown for Investables and All. Note in the correlation values that 13 of the 31 reported values are lower for Investables than for All and, in general, the correlations for Investables are very similar to those for fill. The standard deviations form more distinctive patterns: Only five of the standard deviations are smaller for Investables than for All, perhaps a reflection of the greater diverszcation available when more securities are included in an opportunity set.
One of the most important results of Chapter 2 is the finding that some combinations of emerging markets with developed markets lie on the efficient fisntier. That result is important because it means that combining emerging market securities with U.S. investments can reduce portfolio risk even though the emerging markets are themselves riskier than the S&P 500. Table 27 examines whether that result holds in the case of the Investables. Minimum-variance weights for each of the markets or regions are shown for portfolios consisting of the corresponding market and the S&P 500 using either the Investables set or the All set. The weights were
68 O n e Research Foundation of the ICFA
Izvcstability in Emerging Markets
calculated under the assumption of no short sales (that is, their minimuan value was restricted to zero).4 In the case of All, the minimum-variance combination has no positive investment in emerging markets in only three combinations-the S&P 500 with Brazil, Hungary, and Poland. When only Investables are used, there are five cases of zero investment in the emerging market in combination with the S&P 500 (three of which are the same as for combinations with MI): Brazil, China, the Philippines, Hg~gary, and Pslapzd. Note also that, on average, the investments in emerging markets are slightly less in the ease of Investables than in the case of AII but the results are very similar in the two sets. In two cases, South Korea and Zimbabwe, the minimum- variance combination actually includes more of the emerging market when lnvestables are used than when All is used, although the differences are not large.
Concliusion This chapter showed that the results of Chapters 1 and 2 hold to a strong degree when investability is incorporated in performance analysis. The investable subset sf EMDB securities actually outperformed the broader set on a compound-returns basis in recent years. The diversification benefits that appear to be available on examining emerging markets continue to be present, for the most part, when practical account is taken of the investability of the securities included in a portfolio.
This chapter did not deal with a number of other practical issues, one of which is information cost. In an era when small investors in the United States have easy access to massive quantities of historical data and financial reports on U.S. securities, the information costs of including emerging market securities are likely to be an impediment to the use of emerging markets in combination with U.S. securities. Other issues are liquidity costs, in the form of bid-ask spreads that are higher than in developed markets; tax laws, which vary widely among emerging markets; and restrictions on the repatriation of funds, which can impede investment in some markets.
4 ~ h e minimum-variance weight was calculated from the two-security Markowitz portfolio model: The minimum-variance value is the larger of zero and w ', where to* is (Vsp500- cEM,,SP50d/(VEM+ VSm - 2 x CEE1/l,,SPS&. The terms VEMand Vmoo refer, respectively, to the (sample) variances of monthly returns of the corresponding emerging market and the S&P 500, and CE1w,SB500i~ the covariance between the emerging market and the S&P 500. Covariance between the two markets is calculated as correlation between them multiplied by the product of the turo markets' standard deviations.
@The Research Foundation of the IGFA
Investing in Emerging Markets via Closed-Em? F ~ n d s
4. Investing in Emerging Markets via Closed-End Funds
Investors who are not inhabitants of the relevant country but want to invest directly in an individual emerging market will be confronted with risks not associated with investments in their domestic markets or in developed nondomestic markets. Some of those risks are very practical ones that are not related to ordinary fluctuations in security values over time. They include the risk that the investor does not understand the laws in the target market that d e c t the investor's ability to hold a position or repatriate funds. The investor may also incur the risk of misinterpreting accounting information that is presented under a unique set of accounting rules in the market. Even such practical issues as custody and clearing operations may present an unexpected risk to the investor. Given these risks, and the costs of gathering the information required to overcome them, the investor may prefer to buy shares sf professionally managed funds that invest in the chosen markets. In this way, the investor can rely on the expertise of professional investment managers who specialize in these markets and spread the costs over a larger investment size.
Two primary types of funds are available through which to invest in emerging markets: open-end (mutual) funds and closed-end funds. A mutual fund has a variable number of shares outstanding; investors can purchase or redeem shares at the fund's net asset value (NAV), which is defined as follows:
Market value of securities owned - Total liabilities NAV = Shares outstanding
Hence, the number of mutual fund shares outstanding changes as investors purchase and redeem shares. Nl mutual Pund transactions occur at the NAV.
In contrast, closed-end funds have a fixed number of shares outstanding. Closed- end fund shares trade in the open market at a price determined by willing buyers and sellers. Tlaus, the shares of a closed-end fund may trade at prices different from the fund's underlying NAY.
Although several open-end emerging market funds exist, the majority of the funds investing in these markets are of the closed-end variety. Rarely will a fund investing in the securities of a single country be open ended, largely because of the potential problem of having to sell shares of relatively illiquid securities from the fund's porkfolio on short notice in order to accommodate investor redemptions.
Table 28 lists 20 closed-end funds that invest exclusively in emerging markets. Sixteen of the funds, known as "country funds," invest only in the securities of a particular emerging country.l The Mexico Fund, which went public on June 11,1981, is the senior country ∧ it is followed by the Korea Fund, which began public trading on August 19,1984. As of December 31,1995, these two funds were also the largest
l ~ o r e than one countq fund exists for several of the individual emerging markets. In those instances, Table 28 lists on$ the oldest country fund from a particular market.
OThe Research Foundation of the ICFA 7 1
Emerging Stock Markets: Risk, Rekm, and Pe&manca
Table 28. Closed-End Funds of the EmeMing Markets Annual Return since
Inception
1995 Date of Discount or Expense
Fund Inception Premiuma Ratio NAV Market
Argentina 10/11/91 2.7% 1.98% 4.76% 4.16% Brazil 04/08/88 2.0 1.62 15.37 13.34 Chile 09/27/89 -12.6 1.39 30.43 27.47 China 07/10/92 2.7 2.55 1.77 1.97 First Philippine 11/15/89 -18.4 1.82 15.24 10.54 India Growth 08/19/88 9.9 1.94 8.81 10.38 Indonesia 03/09/90 21.4 1.96 -4.35 -3.46 Korea 08/29/84 4.2 1.32 20.35~ 17.97~ Malaysia 05/04/87 6 . 7 1.44 12.86 11.05 Mexico 06/11/81 2.6 1.14 25.06~ 28.81b New South Africa 03/04/94 -20.7 2.10 21.74 6.08 Pakistan Investment 12/17/93 -19.4 2.20 -27.02 -31.72 Portugal 11/02/89 -12.0 1.41 0.95 -2.16 Taiwan 12/05/86 4.8 2.43 20.22 20.22 Thailand 02/16/88 -11.7 1.30 21.55 19.70 Turkish Investment 12/05/89 8.7 2.16 -8.75 -8.69
Asia Tigers 11/19/93 -11-5 1.65 -0.93 -5.43 Latin American Investment 07/25/90 -7.8 1.72 23.83 21.15
Morgan Stanley Emerging 10/25/91 0.6 1.86 17.18 16.34 Templeton Emerging 02/26/87 13.7 1.73 20.53 21.79
'Vote: All of these funds trade on the New York Stock Exchange. aAverage for 1995. b ~ s t 10 years only. Source: Morningstar Closed-EB~ Funds.
funds; the Mexico Fund had net assets of US$750 million, and the Korea Fund had net assets amounting to USS747 million. The remaining 14 country funds went public from 1986 to 1994 and range in net assets from US$32 million (Turkish Investment Fund) to US$336 million (Brazil Fund). As of June 30,1995,l.O markets in the EMDB were not represented by a US.-based closed-end country fund-Colombia, Greece, Hungary, Jordan, Nigeria, Peru, Poland, Sri Lanka, Venezuela, and Zimbabwe.
In addition to the country funds, two funds (Asia Tigers and Latin American Investment) invest in the securities of emerging markets in particular regions; two other funds listed in Table 28 (Morgan Stanley and Templeton) invest in diversified portfolios containing securities from many emerging markets. The Templeton Emerging Markets Fund, having gone public on February 27, 1987, is the oldest broadly diversified emerging market fund and also, with net assets of US$242 million as of December 31,1995, the largest.
Hlstorlcal PeHormanee af Clasd-End Emerging Market Funds An investor contemplating participating in a closed-end fund needs to understand how effectively the fund shares represent the performance of the underlying securities of the relevant rnarket(s). Most emerging market closed-end funds trade on the New York Stock Exchange (NYSE) , which has caused some investors to question whether the prices of h n d shares are influenced by movements in the U.S. stock market. These investors also contend that a change in a fund's discount from or premium to NAV may cause the fund's performance to differ from the performance of its portfolio of securities. Finally, these investors express concern about the abilities of the funds' managers to generate returns at least as high as those of the underlying markets.
7% @The Research Foundation sf the ICFA
Table 29 allows comparison of the emerging market funds' performance relative to their underlying market(s) . The table presents rates of return and risk information for roughly a five-year period ended June 30, 1995.~ Also presented are cowelations of each individual fund m d its market with the S&P 500 Index.
Over the period studied, the average monthly geometric mean rate sf return for the 16 country funds was 0.35 percent, as compared with a 0.70 percent monthly return for the relevant country indexes. For all 20 funds, the average monthly return was 0.45 percent, versus a 0.79 percent return for the relevant markets. The monthly geometric mean rate of return for only five country frrnds (the China Fund, the Indonesia Fund, Mexico Fund, First Philippines Fund, and Taiwan Fund) exceeded the rate of return for their market indexes. The remaining country funds experienced a lower compound mean rate of return than its market index.
One of the causes of t!x relative underperformance of the country funds is their high expense ratios. Mor~iazgstar Closed-End Fmds reports that the average annual expense ratio for these 16 funds for 1995 was 1.80 percent; the range was from 1.14 percent (the Mexico Fund) to 2.55 percent (the China Fund).
Excluding the two funds with less than a fl%-year history as of June 30, 1995 (the China Fund and the New South. Mica Fund), only five country Punds recorded a lower standard deviation of returns than their market indexes. Each of the other nine funds experienced greater volatility .than its market index. The average monthly standad deviation for the 14 country funds (excluding the two new funds) was 10.91 percent, more than three times the S&P 500's monthly standard deviation of 3.30 percent over the s m e period. Seven country funds experienced lower compound rates of return and higher volatility than their market benchmarks. The China Fund with only a 2%-year history and the Taiwan Fund with only six months of history were the only country funds to show a higher monthly compound rate of return at lower volatility than its benchmark index.
Both of the broadly diversified emerging market closed-end funds, Morgan Stanley's and Templeton's, provided monthly compound rates of return in excess of their benchmark indexes, the Emerging Markets Composite Index, even though the funds had high expense ratios (for 1995, 1.86 percent for Morgan Stanley and 1.73 percent for Templeton). The two funds also recorded average monthly mean rates of return that were higher than their corresponding index-for Morgan Stanley, 1.58 percent versus 1.25 percent for the index over the same period; for Templeton, 2.24 percent versus 1.00 percent. h d the average monthly standard deviation of returns for these funds (7.80 percent for Morgan Stanley and 9.69 percent for Tkeanpleton) was lower than the average standard deviation for the individual country funds, which was 10.88 percent but higher than that of the emerging market composite, which was less than 6 percent. On a risk-adjusted basis, the results are mixed for these two diversiltied funds. The Morgan Stanley Fund underperformed the composite index. The Shape Index values were 116.06 percent and 18.02 percent, respectively. TheTempleton Fund, which covers 16 more months, achieved a higher risk-adjusted return than the composite (19.03 percent versus 18.76 percent). Apparently the greater diversification among these funds reduced risk, at least relative to the country funds.
Blversificatiom Benefits of Closed-End Funds In order to provide meaningful diversification benefits to U.S. investors when
2 ~ o r m y fund with less than a five-year history, rates of return and standard deviations were computed kern the first full quarker of the fund's existence through June 30,1995.
OThe Research Foundation of the ICFA '93
Eaeaine Stock IMa~kets: Risk. Retzknz. and PerTiurmance
Table 29. Rates of Retusa and Standard Devlatlons Far Closed-End Funds and Value-Weighted Market BortBQilos plus Correlations with the S&P 500, Various Tlme Periods
Fund or Market
Average Geometric Compounded Correlation Monthly Standard Mean Value of with Period Return Deviation Return USS1.00 S&P 500 Covered
combined with domestic stocks, emerging market funds must provide returns that are not highly cornlakeel with the returns of U.S. stocks. Table 29 shows ~ a l : over the roughly five-year period ended June 30, 1995, khe returns of these funds were not highly correlated with S&P 500 returns. Correla~on coefficients range horn a low of
74 OThe Research Foundation of the ICFA
Investing in Emerging Markets via Closed-Epzd finds
0.06 (New South M i c a Fund) to a high of 0.67 (Asia Tigers Fund). The average correlation coefficient of the 20 funds with the S&P 500 is 0.36. Consequently, emerging market closed-end funds appear to provide diversification benefits to investors holding U.S. stocks.
In addition to correlation, another key consideration with respect to the diversification benefits of an emerging market closed-end fund is the extent to which the fund returns reflect primarily the underlying market rather than outside factors. As noted, some investors have been concerned that the returns of these funds may be considerably affected by movements in the stock markets in which the shares are sold, which would cause the funds to be less-than-perfect proxies for their respective emerging markets. The empirical results provide support for this argument.
As shown in Table 29, for the period studied, the returns of 18 of the 20 closed- end funds were more highly correlated with the S&P 500 than were the returns for their respective benchnlark markets. Only the newest fund, the New South M i c a Fund, with a brief 15month performance history, and the First Philippine Fund were less correlated with the S&P 500 than were their underlying market indexes. The average correlation coeffacient of the markets is 0.2123, only slightly more than half the magnitude of the average correlation coefficient for the 20 closed-end funds. Therefore, over the observed period, emerging market closed-end funds did not provide as substantial diversification benefits as would have direct (indexed) investments in the underlying securities of the relevant emerging markets.
Concluslosa The availability of closed-end funds that invest in the stocks of emerging markets provides investors with a convenient way to invest in these markets. Because many of these funds trade actively on the WSE, their shares can be purchased readily at low transaction costs.
A key question is whether these specialized funds can generate rates of return comparable to those of the under-lying markets the funds represent and at comparable risk. The relative newness of the funds, and thus the paucity of empirical findings about long-term returns, prevents a definitive answer to this question. Empirical results for the roughly five years ended June 30, 1995, indicate, however, that emerging market closed-end funds provide some diversification benefits to holders of U.S. stock porkfolios (as a result of their low correlations with U.S. stocks) but the hnds have not been highly representative of their underlying markets. With the exception of the two broadly diversified funds, the funds have, on average, under~pedomed their respective benchmarks and experienced greater volatility. Of additional importance is the fact that these funds have not provided as meanin&I diversification benefits as direct investments in the securities of the underlying markets would have provided because the funds' returns are substantially more correlated with U.S. stocks. If these funds are to provide returns representative of their underlying markets in the future, they must show higher correlations with their market indexes than in the past.
3 ~ f the New South Africa Fund, with only a 1%-year trading history, is excluded, then the Korea Fund had the lowest correlation with the S&P 500 (0.1506).
OThe Research Foundation of the ICEA
Appendix: Monthly Value-Weighted Stock Returns
This appendix reports the monthly returfis calcilliated from International Finance Corporation (IFC) data for the Emerging Markets Composite Value-Weighted Index (the Composite), the subindexes for the Europe/Middle EastJAfica (EiW), Europe, Mica, Latin Asia, East Asla, and South Asia regions, and the indi~dual country markets. Stock price data begin December 1975; hence, return data begin January 1, 1976, and end June 30, 1995. Table A.1 contains comparable data for the S&P 500 Index and the Morgan Stanley Capital Internaeonal E N E (Europe/ Australia/Far East) Index.
May 95 0.0645 0.0170 0.1708 -0.0040 0.1318 -0.0195
Jun 95 -0.0155 -0.0232 -0.0835 0.0096 0.0069 -0.0494
Note: Blanks in columns indicate market was not yet covered by the EMDB.
O n e Research Foundation of the ICFA
Emerniw Stock Markcfs: Risk. Return. and Pcnbrmancc
Table A.6. Asia arrd South Asia: Total Value-Weighted Stack Returns, Jaaauaw 1976- June 1995 Asia South Asia India Indonesia Malaysia Pakistan Sri Lanka Thailand
Jan 76 0.1683 0.1247 0.1829 -0.0146
Feb 76 -0.0039 -0.0078 -0.0143 0.0111
Mar 76 0.0027 -0.0253 4.0197 -0.0410
Apr 76 -0.0053 -0.0076 -0.0329 0.0656
May 76 -0.0448 -0.0483 -0.0486 -0.0475
Jun 76 0.0614 0.0633 0.0922 -0.0109
Jul76 0.0316 0.0508 0.0642
Aug 76 0.0203 0.0517 0.0537
Sep 76 0.0282 0.0367 0.0417
Oct 76 0.0067 4.0298 --0.0481
NQV 76 4.0005 -0.0210 -0.0223
Dec 76 0.0729 0.0408 0.0432
Jan 77 0.0528 0.0155 0.0001
Feb 77 0.0322 0.0210 0.0145
Mar 77 0.0345 0.0605 0.0366
Apr 77 -0.0105 0.0198 0.0014
May 77 0.0335 0.0240 0.0206
Jun 77 0.0205 0.0055 -0.0347
Jul77 0.0121 0.0299 -0.0035
Aug 77 0.0966 0.1208 0.0486
Sep 77 0.0688 -0.0210 -0.0297
Oct 77 0.0994 0.1155 0.0042
NQV 77 -0.0490 -0.0684 -0.0630
Dec 77 0.0868 0.0658 0.1228
Jan 78 0.0935 0.0649 0.0531
Feb 78 0.0247 0.0027 0.0084
Mar 78 0.0076 0.0135 0.0734
Alpr 18 0.0161 -0.0086 0.0019
May 78 0.0405 0.0263 0.0464
Jun 78 0.0348 0.0166 0.0199
Jul78 0.8303 0.0064 0.0316
Aug 78 0.0260 0.0226 0.0047
Sep 78 0.0056 0.0715 0.0707
Oct 78 0.0023 0.1282 0.0734
NOV 78 -0.0261 -0.0772 -0.0961
Dec 78 0.0441 0.0317 0.0495
Jan 79 -0.0491 -0.0337 0.0131
Feb 79 -0.0430 -0.0301 0.0201
Mar 79 -0.0254 0.0260 0.0686
~ p r 79 -0.0728 -0.0530 0.0164
May 79 -0,0152 0.0155 -0.0153
Jun 79 -0.0010 0.0118 0.0535
O n e Research Foundation of ehe ICFA
Table A.8. (continued) Asia South Asia
Ju179 -0.0221 -0.0138
Aug 79 0.1554 -0.0238
Sep 79 0.0182 0.0291
Oct 79 -0.0963 4.0363
Nov 79 0.0424 -0.0179
Dec 79 -0.0355 0.0410
Jan 80 -0.0535 -0.0190
Feb 80 -0.0003 0.0401
Mar 80 -0.0055 -0.0116
Apr 80 0.0897 0.0075
May 80 -0.0038 -0.0106
Jun 80 -0.0164 0.0395
Jul 80 -0.0012 0.0262
Aug 80 -0.0040 0.0261
Sep 80 -0.0433 -0.0116
Oct 80 -0.061 -0.0051
Nov 80 0.0645 0.0877
Dec 80 -0.0036 0.0246
Jan 81 0.0551 -0.0273
Feb 81 0.0065 0.0536
Mar 81 0.0664 0.0720
Apr 81 0.0809 0.0342
May 81 -0.0251 -0.0628
Jun 81 0.1753 0.1037
Ju181 -0.0609 -0.0444
A u ~ 81 -0.0658 -0.0701
Sep 81 -0.0253 0.0182
Oct 81 -0.0277 0.0207
Nov 81 0.0598 0.0359
Dec 81 -0.0050 0.0362
Jan 82 0.0104 -0.0294
Feb 82 0.0218 0.0125
Mar 82 -0.0306 -0.0402
Apr 82 -0.0023 0.0442
May 82 -0.0235 0.0159
Jun 82 -0.0056 -0.0649
Jul82 0.0011 0.0118
Aug 82 -0.0209 -0.0063
Sep 82 0.0492 0.0898
Oct 82 -0.0171 -0.0366
Nov 82 0.0172 0.0248
Dec 82 0.0446 0.0328
India Indonesia Malaysia Pakistan Sri Lanka Thailand
-0.0261 0.0041
-0.0218 -0.0267
0.0202 0.0416
-0.0180 -0.0617
-0.0193 -0.0159
0.0751 -0.0090
OThe Research Foundation of the ICFA
E m e ~ ~ i n e Stock Markets: Risk. R ~ k m . ce%d h7%rmance
Jan 83
Feb 83
Mar 83
Apr 83
May 83
Jun 83
Ju183
Aug 83
Sep 83
Oct 83
Nov 83
Dec 83
Jan 84
Feb 84
Mar 84
Apr 84
May 84
Jun 84
Ju184
Aug 84
Sep 84
Oct 84
Nov 84
Dec 84.
Jan 85
Feb 85
Mar 85
Apr 85
May 85
Jun 85
Ju185
Aug 85
Sep 85
Oct 85
Nov 85
Dec 85
Jan 86
Feb 86
Mar 86
Apr 86
May 86
Jun 86
Asia
-0.0518
0.0270
.-0,0376
0.0626
0.0420
-0.0173
0.0064
-0.0115
-0.0024
0.0023
-0.0231
0.0403
0.0077
0.0199
-0.0073
-0.0268
-0.0145
0.0199
0.0309
0.0020
0.0157
-0.0055
-0.0281
0.0329
0.0155
-0.0240
0.0403
0.0019
0.0215
-0.0083
0.0165
-0.0417
0.0795
0.0370
-0.0203
-0.0179
0.0173
0.0534
-0.0253
-0.0226
0.0702
0.0456
South Asia
-0.0620
0.0256
-0.0372
0.0235
0.0906
-0.0047
0.0090
0.0109
-0.0014
-0.0112
-0.0086
0.0393
-0.0322
0.0062
-0.0177
-0.0213
0.0058
0.0201
-0.0053
0.0098
0.0355
0.0073
-0.0465
0.0181
0.0275
-0.0221
0.0601
0.0145
0.0344
-0.0081
0.0452
-0.0623
0.0845
0.0143
-0.0530
-0.0701
0.0003
0.0142
-0.0850
-0.0209
0.0440
0.0523
India Indonesia Malaysia
-0.0929
0.0223
-0.0540
0.0044
0.1133
-0.0050
Pakistan Sri Lanka Thziland
0.0268
0.0340
0.0061
0.0700
0.0391
-0.0040
110 8The Research Foundation of the I C F .
Table A.6. (comtlnued)
Asia South *Asia India Indonesia h3aiajrsia - Jui 86
Aug 86
Sep 86
Oct 86
Nov 86
Dec 86
Jan 87
Feb 87
Mar 87
Apr 87
May 87
Jim 87
Jul87
Aug 87
Sep 87
Oct 87
Nov 87
Dee 87
Jan 88
Feb 88
Mar 88
-4pr 88
May 88
Jun 88
Jc188
, k g 88
Sep 88
Oci 88
Kov 88
Dec 88
Jan 89
Feb 89
Mar 89
Air 89
hizy 89
j,, 89
Ju189
Aug 89
Sep 89
Oct 89
Nov 89
Dec 89
QThe Research Foundation sf the fCFA
Emergiatg Stock M ~ ~ k e t s : Risk, Retzam, a d Pegormn~ea?
Table A.6. (continoled) Asia South Asia
J2n 90 0.1584 -0.0197
Feb 90 -0.0378 0.0211
Mar 90 -0.0707 0.0202
Apr 90 -0.1343 -0.0526
May 90 -0.0692 0.0953
Jun 90 -0.150i 0.0101
India Indonesia
0.X82
0.1336
0.1874
-0.0314
-0.0074
-0.0342
Pakistan Sri Lanka %:?,ailand A
Ju! 90 0.0553 0.1244
A~fiug 90 -0.1983 -0.0642
Sep 90 -0.1234 -0.1023
Oct 90 0.1032 -0.0250
Nov 90 0.0743 -0.0731
Dec 90 0.0304 0.0285
jan 91 -0.0770 -0.0129
Feb 91 0.1481 0.1231
Mar 91 0.0013 0.0304
Apr 91 0.0540 0.0021
May 91 -0.0255 0.0089
Juil91 -0.0118 4.0456
Ju191 0.0075 -0.0019
Aug 91 -0.0631 -0.0365
Sep 91 0.0224 -0.0309
Oct 91 -0.0461 -0.0055
NOV 91 -0.0097 0.0329
Dec 91 0.0215 0.0614
Jan 92 0.1241 0.0942
Feb 92 -0.0200 0.0599
Mar 92 -0.0055 0.1031
Apr 92 -0.0320 -0.0406
May 92 -0.0501 -0.0767
3un 92 0.0242 0.0413
Ju '~ 92 -0.0622 -0.0322
h g 92 0.0020 0.000 1
Sep 92 -0.0353 0.0811
Oct 92 0.0752 0.0317
Nov 92 0.3042 -0.0419
Dec 92 -0.0233 -0.0091
Jan 93 0.0166 0.0264
Feb 93 0.0677 -0.0080
Mar 93 -0.0067 -0.0496
Apr 93 0.0447 0.0585
May 93 -0.0102 0.0328
Jun 93 -0.0290 0.0101
C%e Research Fouadatio~.i of the ICFA
Table 8.8. (continued) --
Asia Sou& Asia India Indonesia Malaysia Pakis ta~ Sni Eanka Thailand
Jun 95 -0.0155 -0.0088 4.0352 0.0524 -0.0171 0.0757 0.0275 0.0004
-%ti.: Blanks in coiumrrs indicate mzket was not yet covered by the EMDB.
,CThe Research Foundation of the ICFA
References
References and Selected Bibliography
AIMR. 1997. Implementing Global Equity Strategy: Spotlight on AsM (Charlottesville, VA: Association for Investment Management and Research).
. 1996. Inuesting Worldwide VPL ficus on EnzergingMarkets (Char~ottesville, VA: As- sociation for Investment Management and Research).
. Forthcoming 1997. Investing World- wide VIII: Deuelopments in Global Podfolio Management (Charlottesville, VA: Associa- tion for Investment Management and Re- search). Bailey, Warren, and U. Peter Chung. 1995. 'Txchange Rate Fluctuations, Political Risk, and Stock Returns: Some Evidence from an Emerging Market."journab ofFi'inancia8 and Quantitative Analysis, vol. 30, no. 4541-61. Bany, C.B., and LJ. Lockwood. 1995. "New Directions in Research on Emerging Capital Markets." Financial Markets, Instiktio$zs, and Imtmments, vol. 4, no. 535-36. Barry, C.B., and M. Rodriguez. 1997. "Risk, Return, and Performance of Eatin America's Equity Markets, 1975-95." Working paper, Texas Christian University. Barry, C.B., J.W. Peavy 111, and M. Rodriguez. 1997a. "A Convenient Way to Invest in the Emerging Markets." EmergingMarkets Quar- tedy, vol* 1, no. 1:4148.
199%. 'The Performance Character- istics of Emerging Capital Markets." Working paper, Texas Christian University. Bekaert, 6.1995. ""Market Integration and In- vestment Barriers in Emerging Equity Mar- kets." WorkdBankEconomicReuiew, vol. 9, no. 9:7F107. Bekaert? GG., and G.R. Harvey. 1995. Varying World Market Integration."]ournal ofFi~zance, vol. 50, no. 2403-43. Bekaert, G., and M. Urias. 1996. '6Diversifica- tion, Integration, and Emerging Market Closed End Funds."Journal of Finance, vol. 51, no. 3:835-69. Claessens, Stijn, Susmita Dasgupta, and Jack Glen. 1995. "'Return Behavior in Emerging Stock Markets." World Bazk Ecolzomie Re- view, vol. 9, no. 1:131-51.
Divecha, AB., J. Drach, and D. Stefek. 1992. "Emerging Markets: A Quantitative Perspec- tive."JoumaE ofPortfolio Management, vol. 19, no. 1:41-56. Edwards, S. 1995. Crisis and Reform in Latin America: From Despair to Hope. New York: Oxford University Press. Frankel, J., and S. Schmulker. 1996. "Crisis, Contagion, and Country Funds: Effects on East Asia and Latin America." Working Paper No. PB96-84, Federal Reserve Bank of San Francisco. Goetzmann, W.N., and P. Jorion. 199th. "Re- emerging Markets." Working paper, Yale School of Management.
. 199613. "A Century of Global Stock Markets." Working paper, Yale School of Management. Harvey, C.R. 1994. "Portfolio Enhancement Using Emerging Markets and Conditioning Information." Hn PoMolZo Inuestment in Deuel- oping Countries. Stijn Claessens and Shan Gooptu, eds. The World Bank Discussion Se- ries, Washington DC:P1044. IFC. 1995a. Emergagzng Stock Markets Factbook (Washington DG: International Finance Cor- poration). IFC. 1995b. Emerging Market Factbook 1995 (Washington DC: International Finance Cor- porahn). TFC.1993. IFC I d e x Meti'zodoloy (Washing- ton DC: International Finance Corporation).
osky, Denis S., and Brian D. Siger. 1994. GlobaEAsset A4anagemeazt and Fe$omance At- tribution. GharlottesviIle, V k Research Foun- dation of the Institute of Chartered Financial halysts. Price, M.P. 1994. Emergiagg Stock Markets. New York McGraw-Hill. Sachs, J., A. Tornell, and A. Velasco. 1996. "Fi- nancial Crises in Emerging Markets: The Les- sons from 1995." Working Paper 5576. Cambridge, Mfl: National Bureau of Econom- ic Research. Stanley, M.T. 1995. Guide to H~uesting in EmergingMarkets. Chicago: Richard ID. Irwin Publishing.


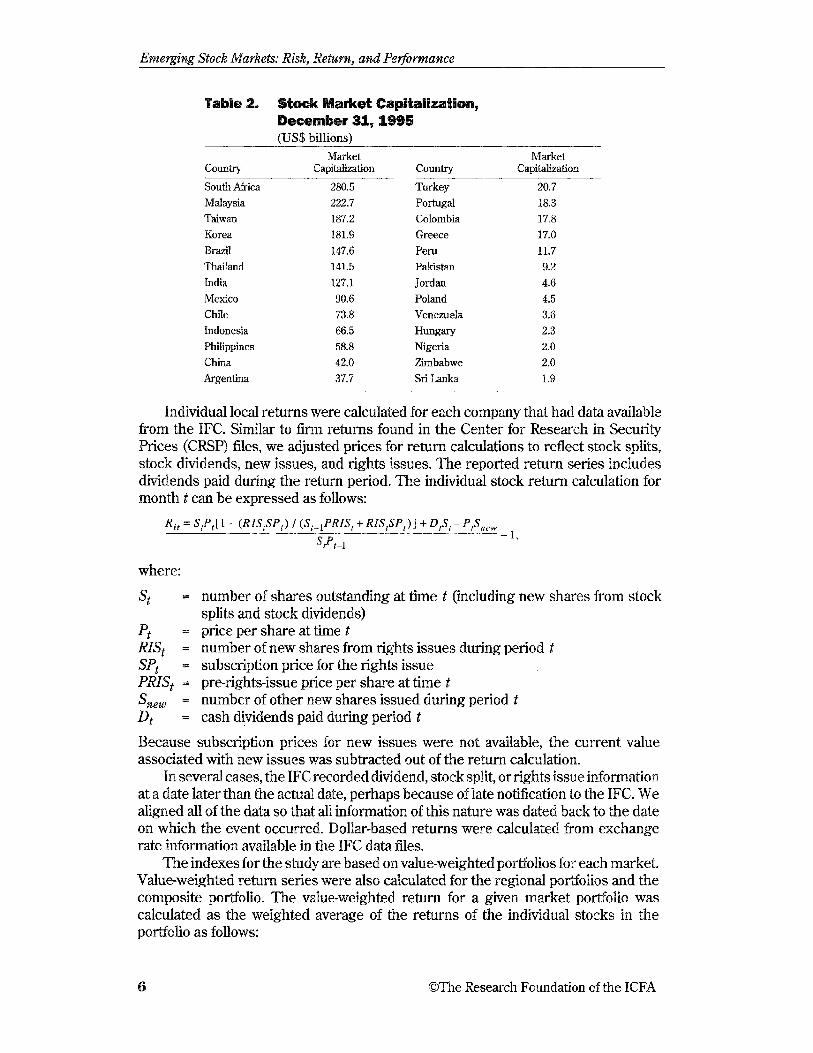


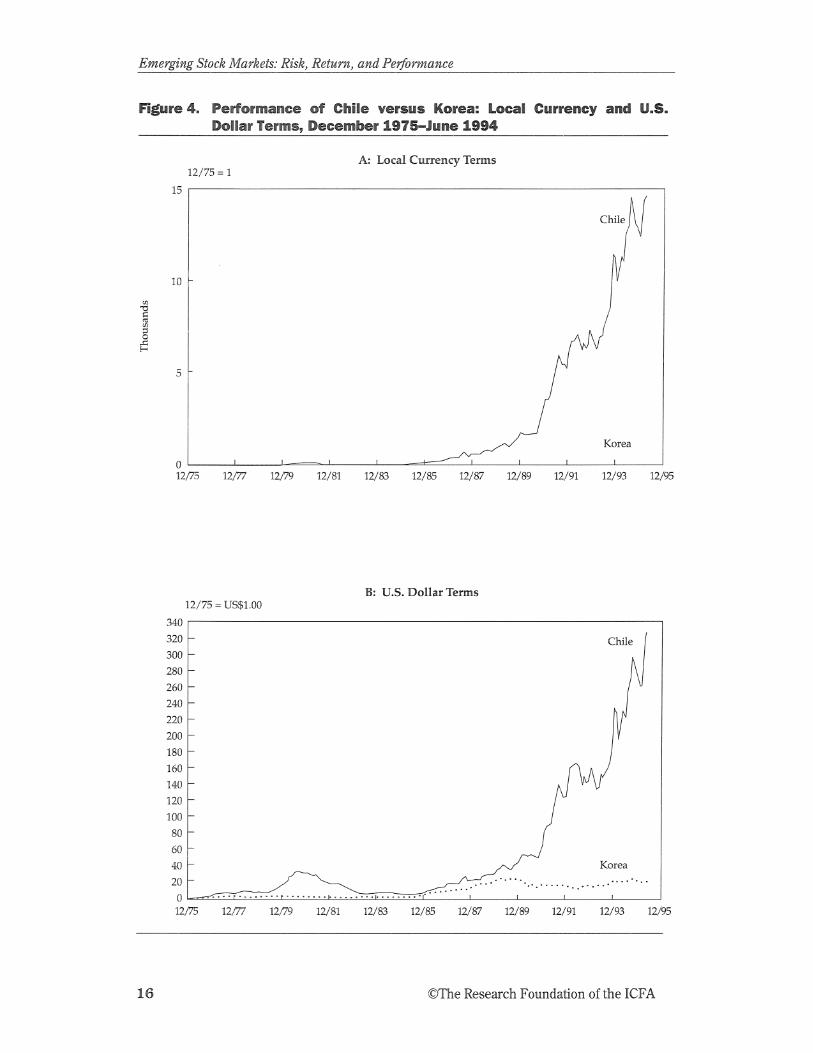


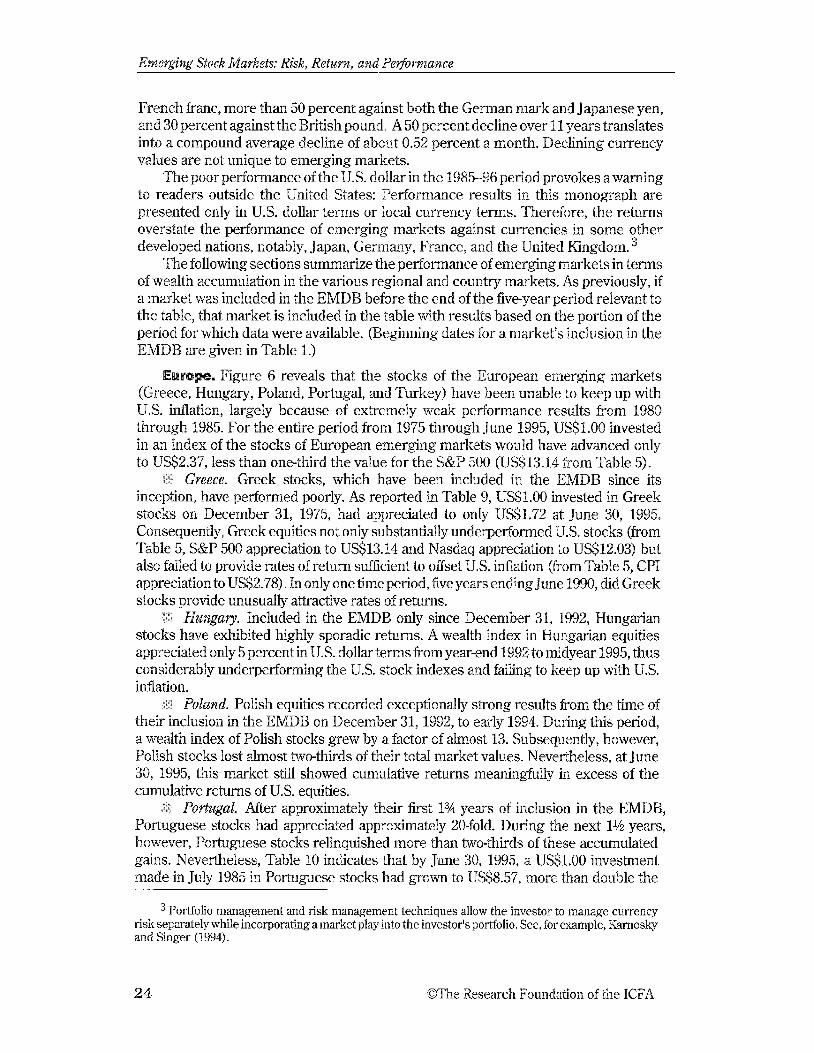


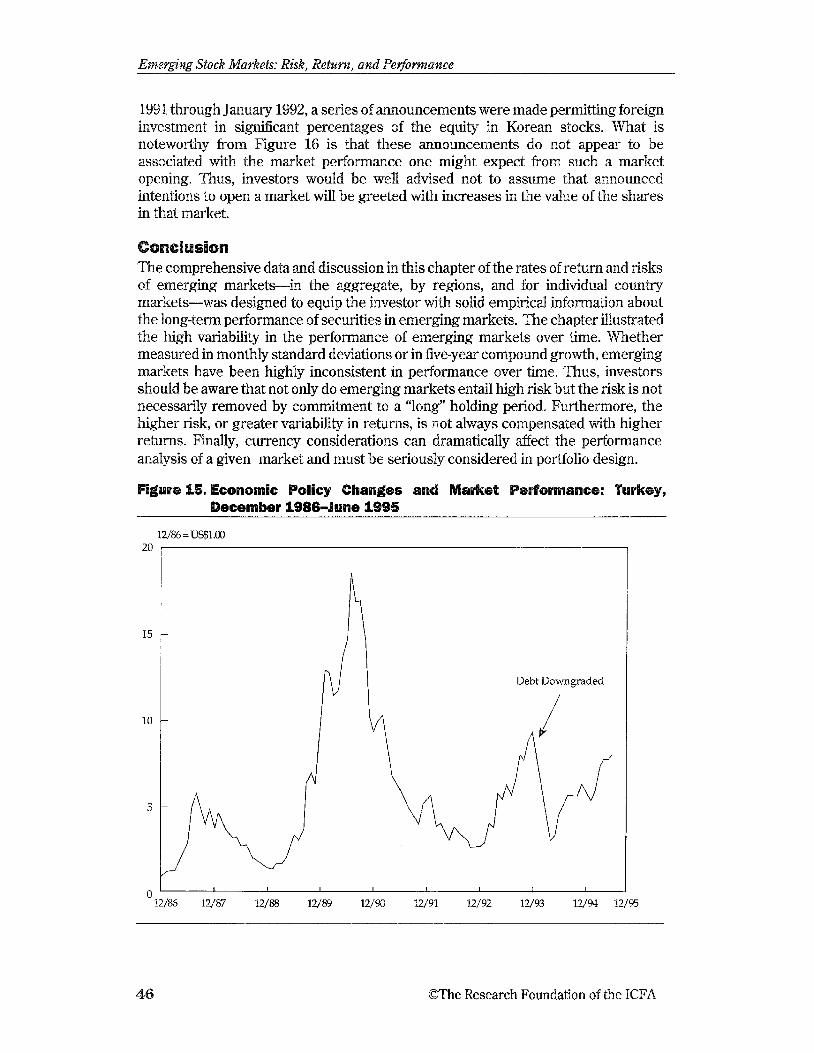


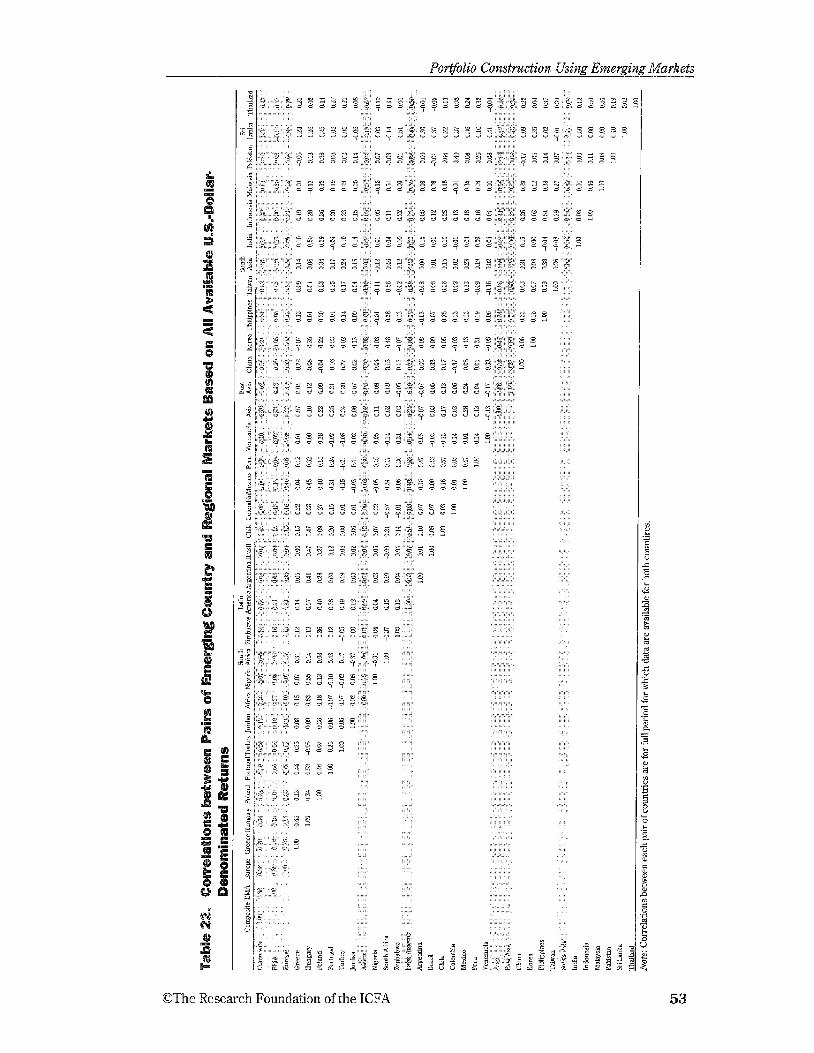
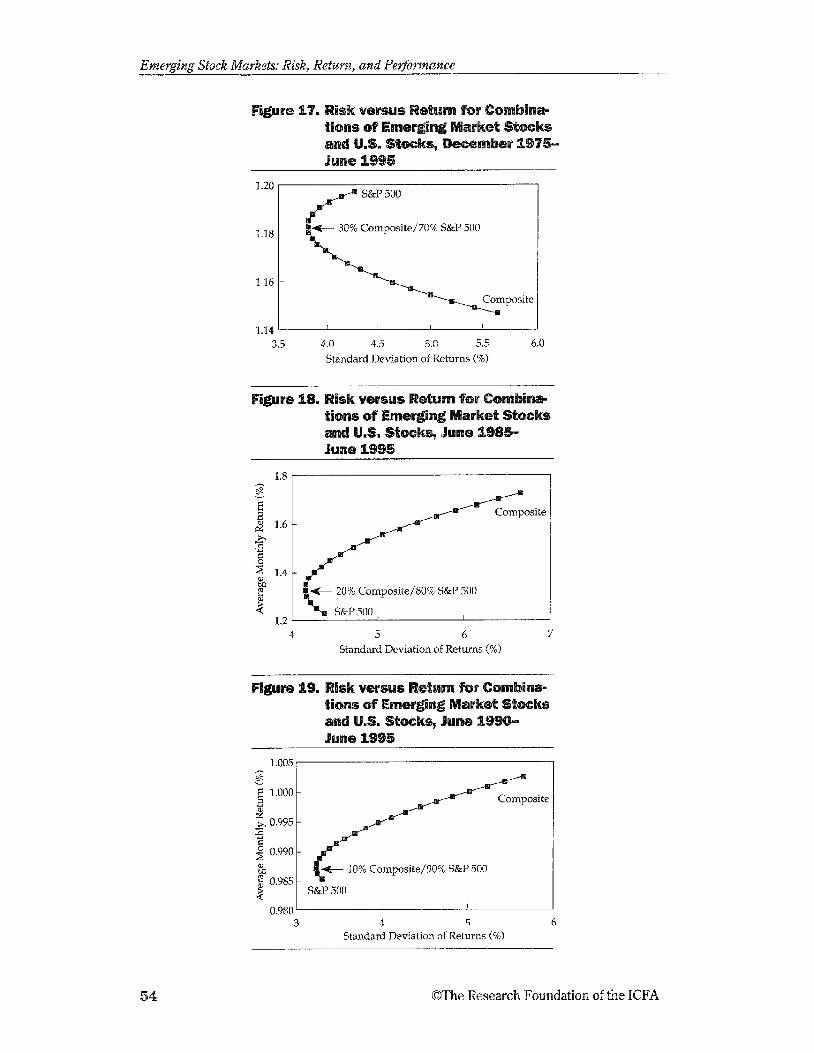
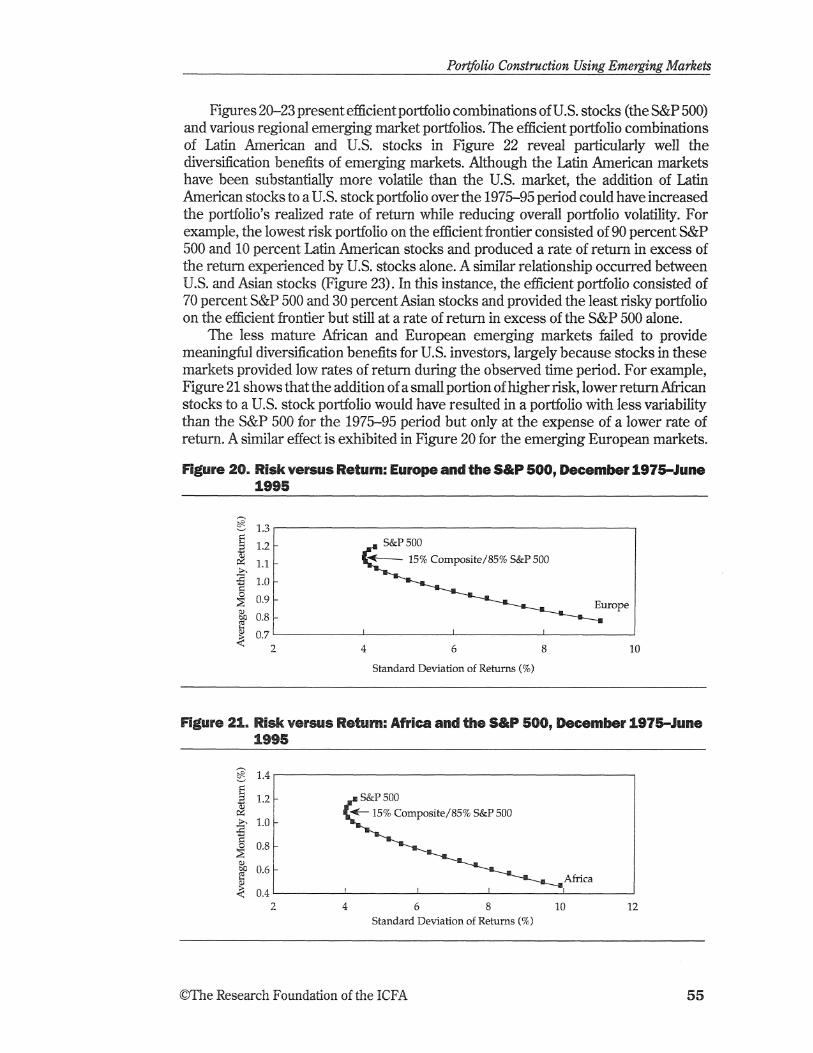


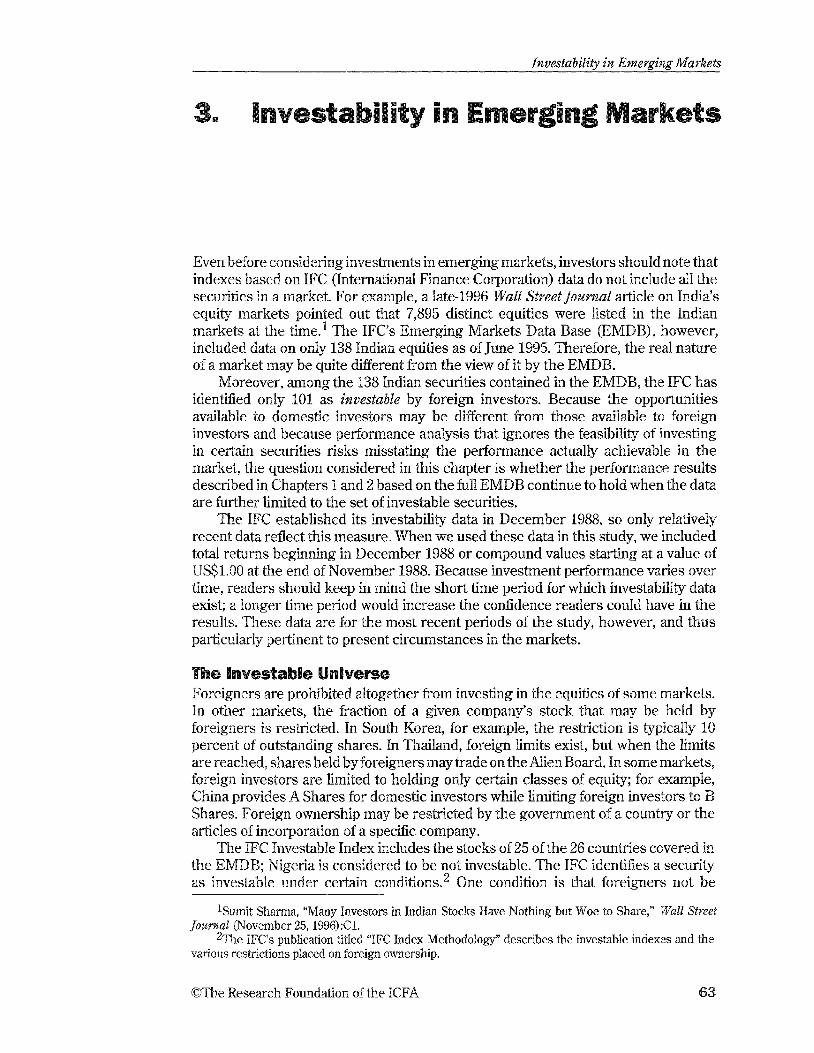


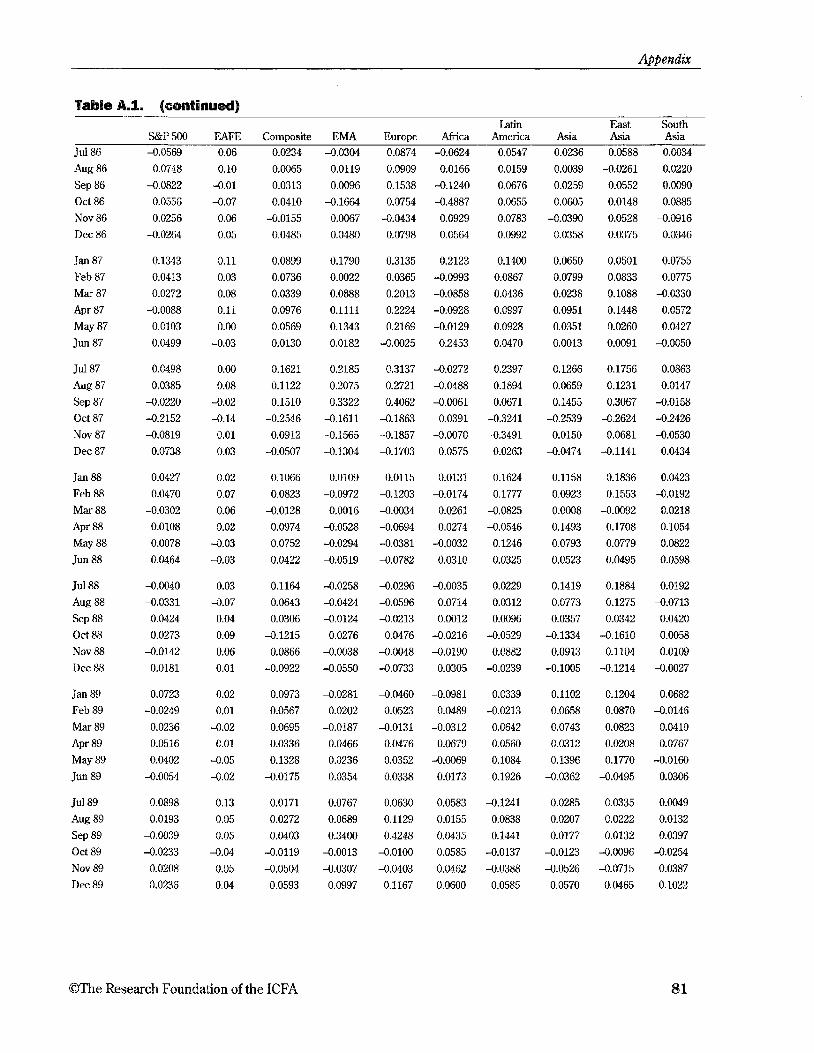


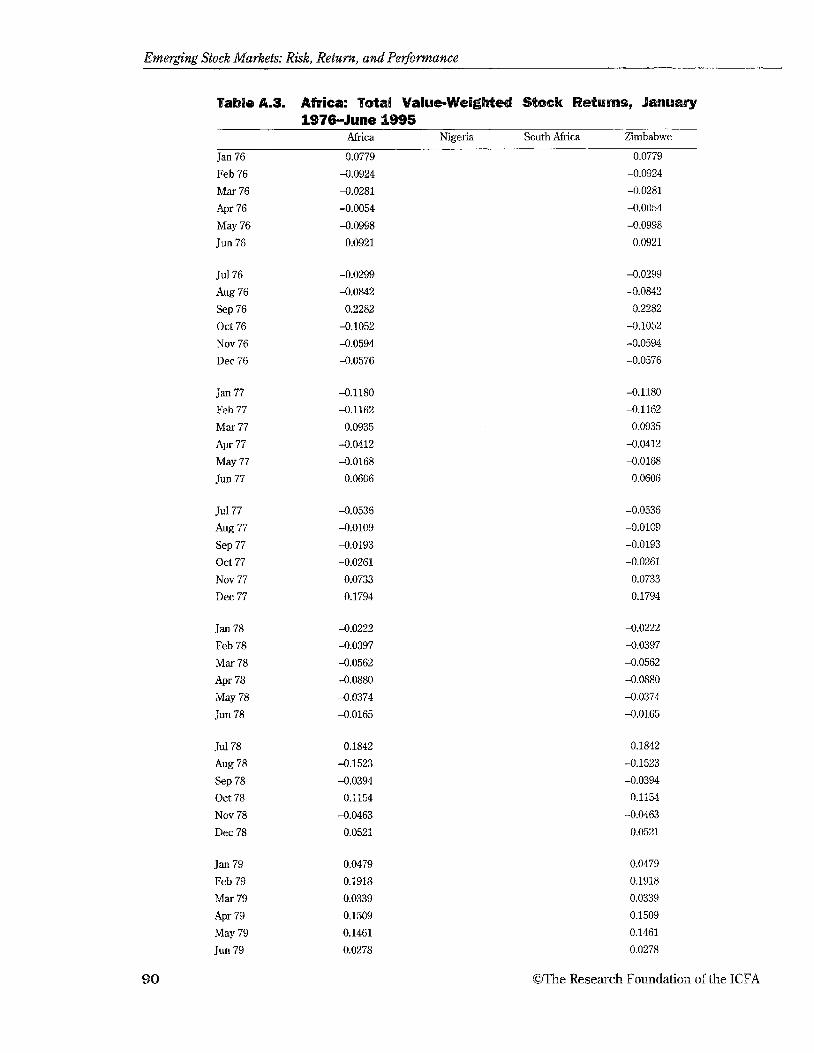
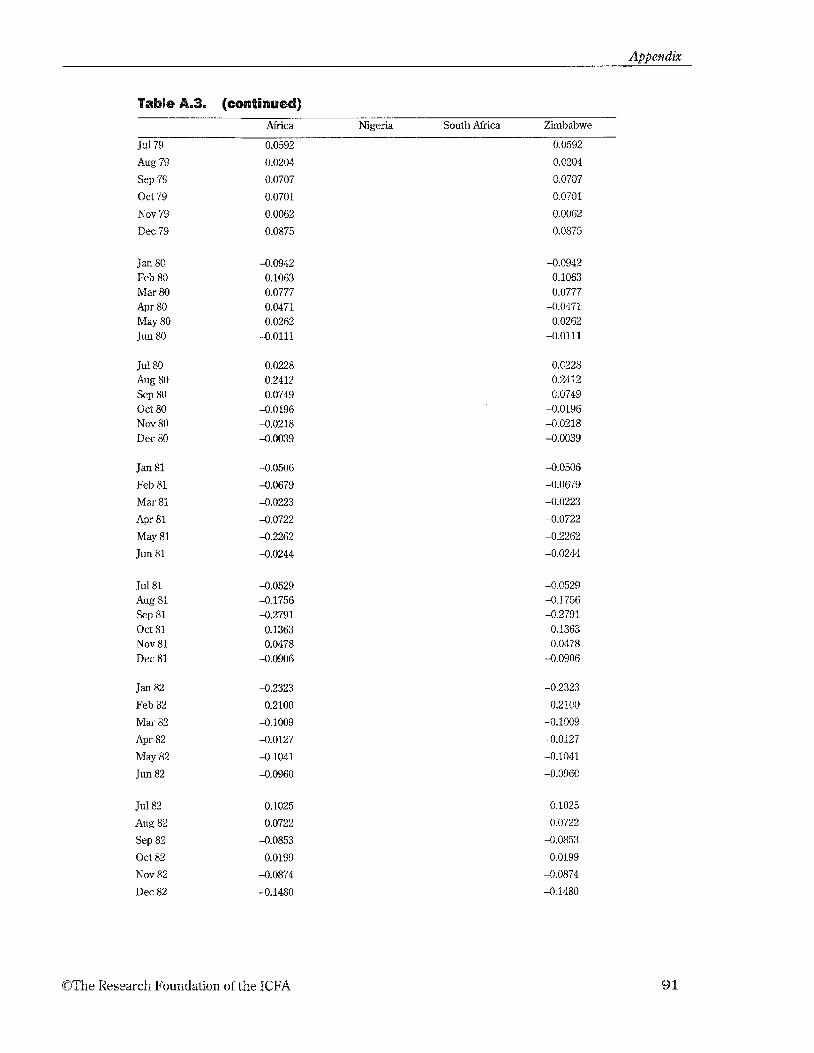

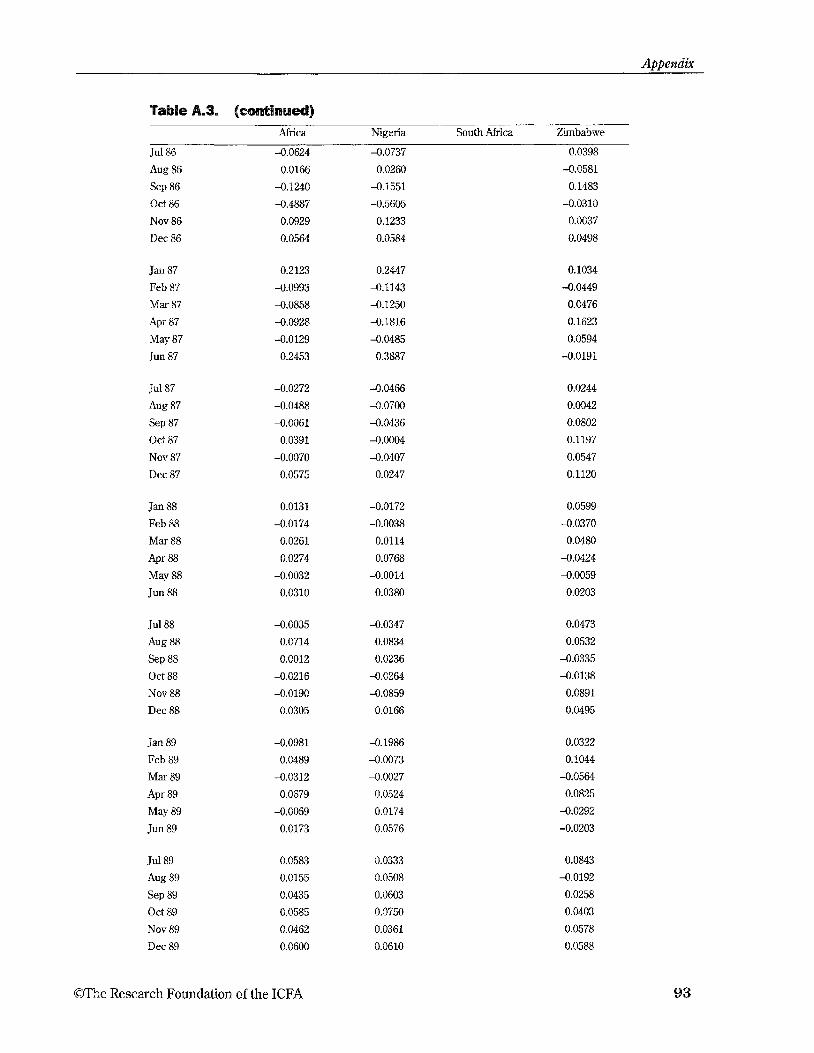


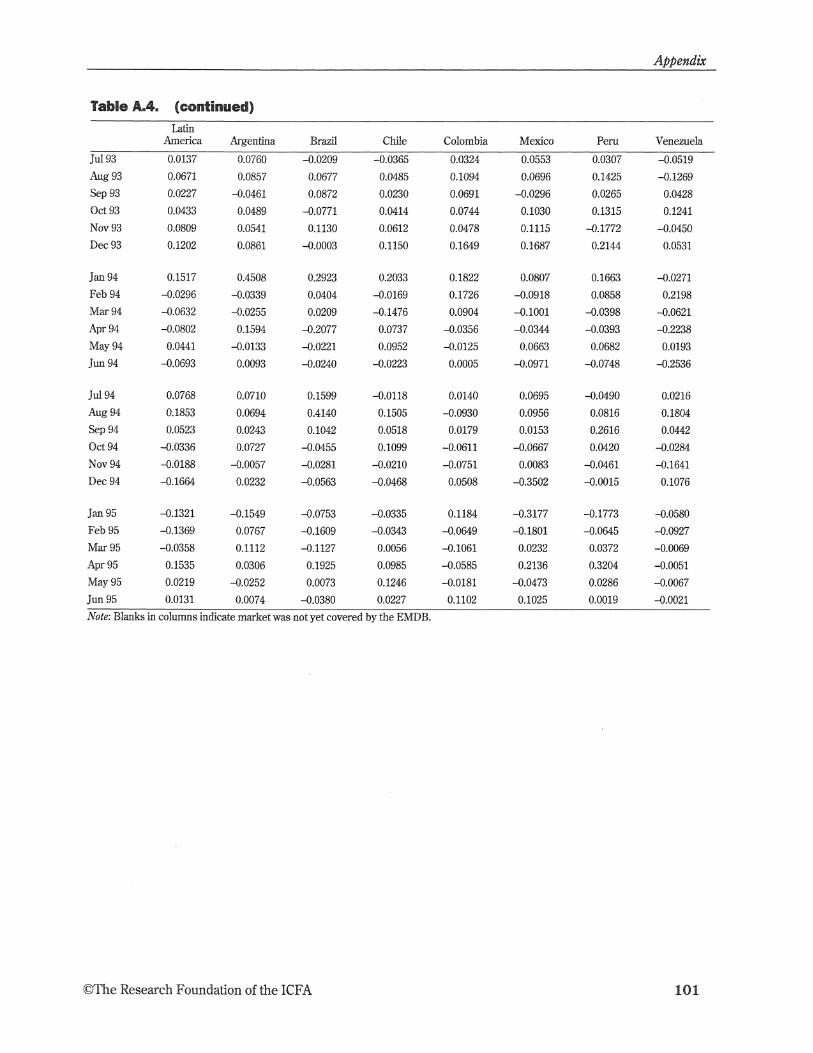


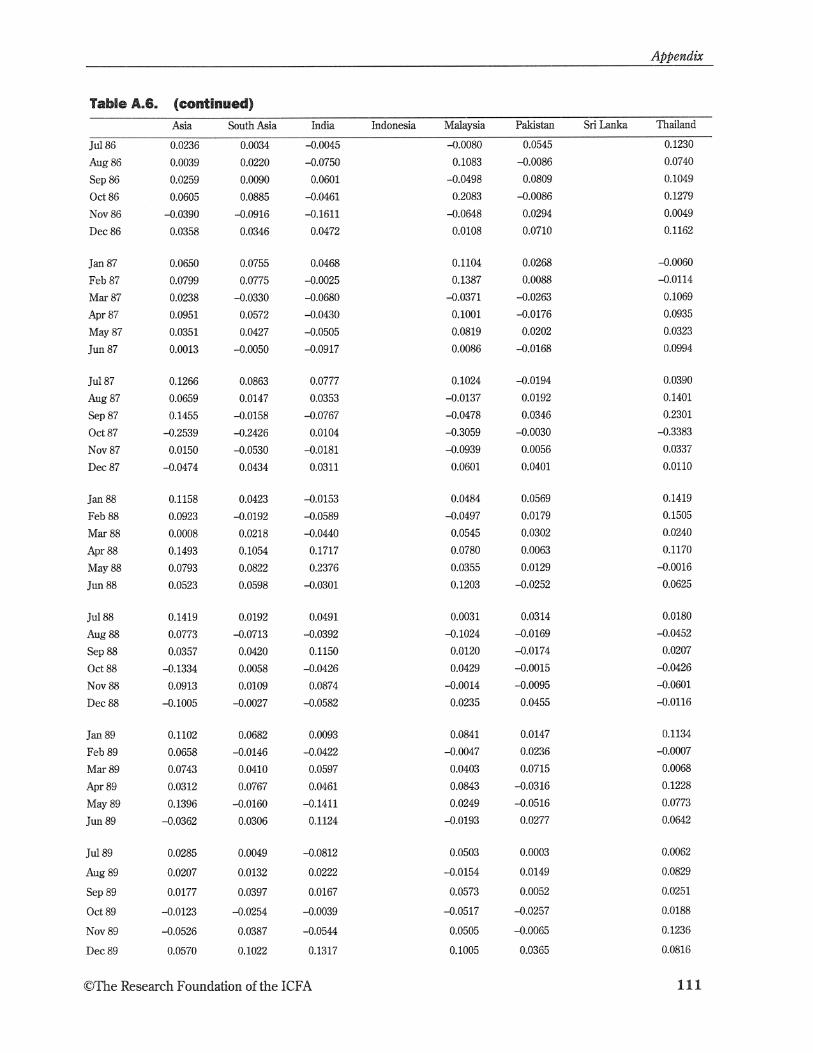

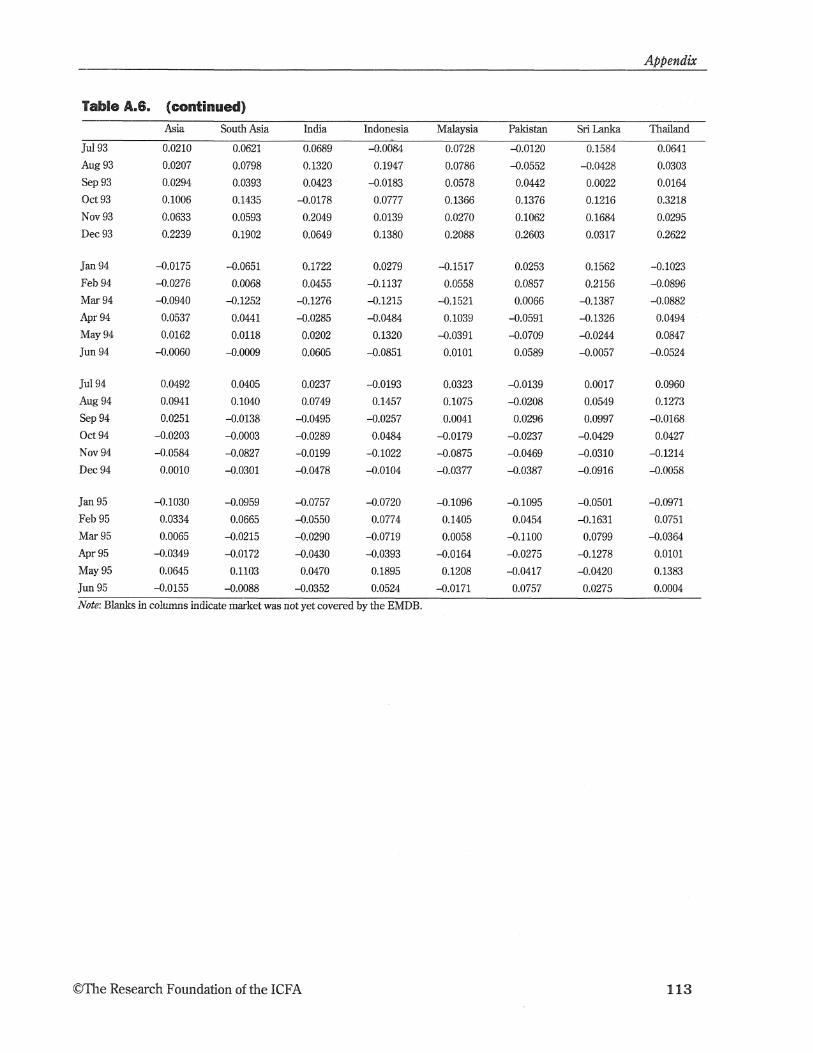


![Emerging Stock Markets_ASEAN (Dic. 2010]](https://static.documents.pub/doc/80x56/577d2a181a28ab4e1ea8a44c/emerging-stock-marketsasean-dic-2010.jpg)


