Demonstration Assessment of Light Emitting Diode (LED)Street Lighting Host Site: City of Oakland, CaliforniaFinal Repo r t pr epar ed in s upport of theU.S. DOE Solid-State LightingTechnology Demonstration Gateway Program and PG&E Emerging Technologies Program Study Participa nts: U.S. Department of EnergyPacific Gas & Electric City of Oakland, California Energy Solutions Beta LED, Inc. January 2008 Prepared for the U.S. Department of Energy and Pacific Gas & Electric by Energy Solutions
This report was prepared by Pacific Gas and Electric Company for exclusive use by itsemployees and agents. Neither Pacific Gas and Electric Company nor any of its employees and
agents:(1) makes any written or oral warranty, expressed or implied, including, but not limited to those
concerning merchantability or fitness for a particular purpose;(2) assumes any legal liability or responsibility for the accuracy, completeness, or usefulness of
any information, apparatus, product, process, method, or policy contained herein; or(3) represents that its use would not infringe any privately owned rights, including, but not
Tab l e o f Co n t e n t s T A B L E O F C O N T E N T S . . . . . . . . . . . . . . . . . . . . . . . . . . . . . . . . . . . . . . . . . . . . . . . . . . . . . . . . . . . . . . . . . . . . . . . . . . . A P R E F A C E . . . . . . . . . . . . . . . . . . . . . . . . . . . . . . . . . . . . . . . . . . . . . . . . . . . . . . . . . . . . . . . . . . . . . . . . . . . . . . . . . . . . . . . . . . . .B
ACKNOWLEDGEMENTS .............................................................................................................................................B E X E C U T I V E S U M M A R Y . . . . . . . . . . . . . . . . . . . . . . . . . . . . . . . . . . . . . . . . . . . . . . . . . . . . . . . . . . . . . . . . . . . . . . . . . . 1 P R O J E C T B A C K G R O U N D . . . . . . . . . . . . . . . . . . . . . . . . . . . . . . . . . . . . . . . . . . . . . . . . . . . . . . . . . . . . . . . . . . . . . . . . 1
PROJECT O VERVIEW ...................................................................................................................................................1 TECHNOLOGICAL O VERVIEW ..................................................................................................................................1 M ARKET O VERVIEW ...................................................................................................................................................1
P R O J E C T O B J E C T I V E S . . . . . . . . . . . . . . . . . . . . . . . . . . . . . . . . . . . . . . . . . . . . . . . . . . . . . . . . . . . . . . . . . . . . . . . . . . 3 M E T H O D O L O G Y . . . . . . . . . . . . . . . . . . . . . . . . . . . . . . . . . . . . . . . . . . . . . . . . . . . . . . . . . . . . . . . . . . . . . . . . . . . . . . . . . . 4
HOST SITE INFORMATION ......................................................................................................................................... 4 MONITORING PLAN ...................................................................................................................................................4
P R O J E C T R E S U L T S A N D D I S C U S S I O N . . . . . . . . . . . . . . . . . . . . . . . . . . . . . . . . . . . . . . . . . . . . . . . . . . . . . . . 6 ELECTRICAL DEMAND AND ENERGY S AVINGS....................................................................................................6 LIGHTING PERFORMANCE........................................................................................................................................ 7 ECONOMIC PERFORMANCE....................................................................................................................................17
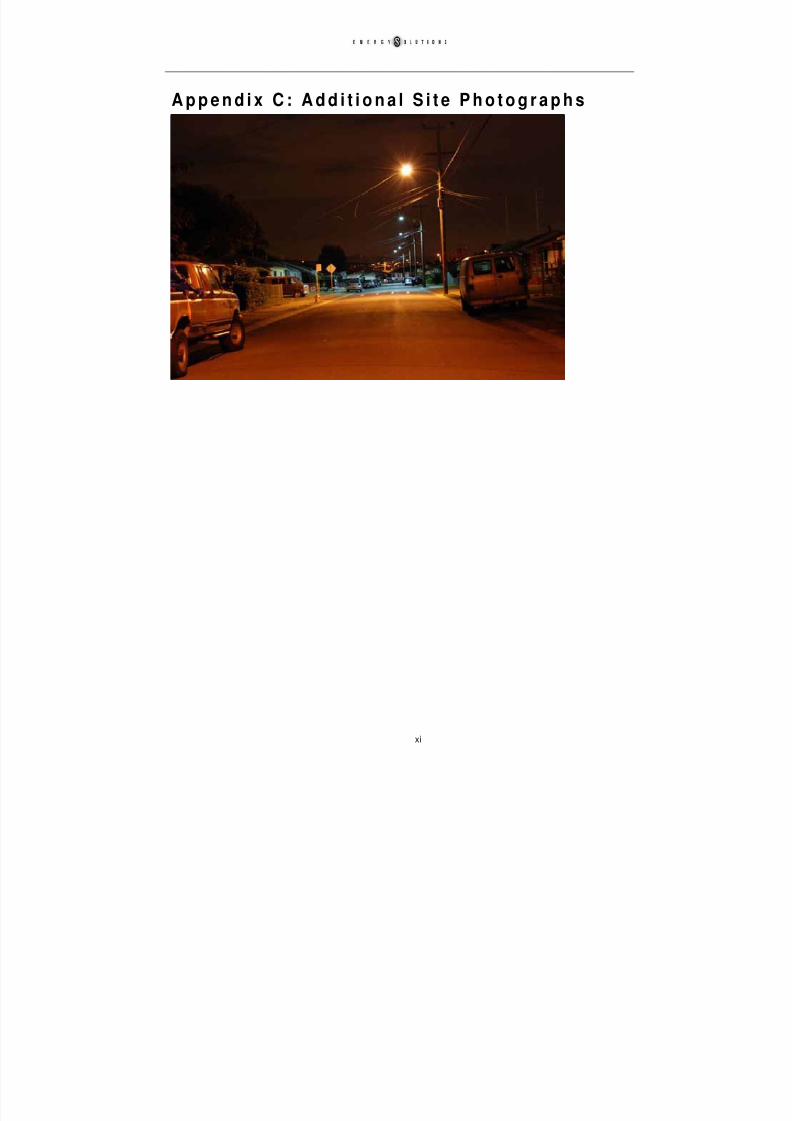
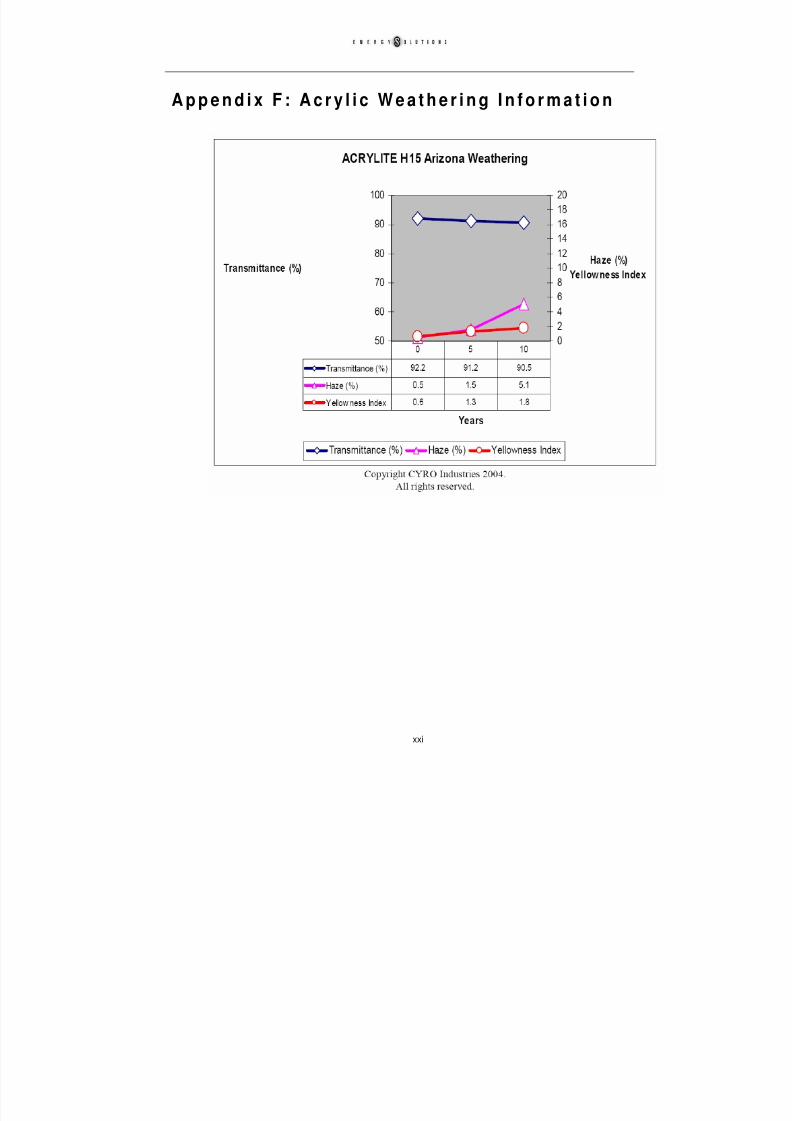
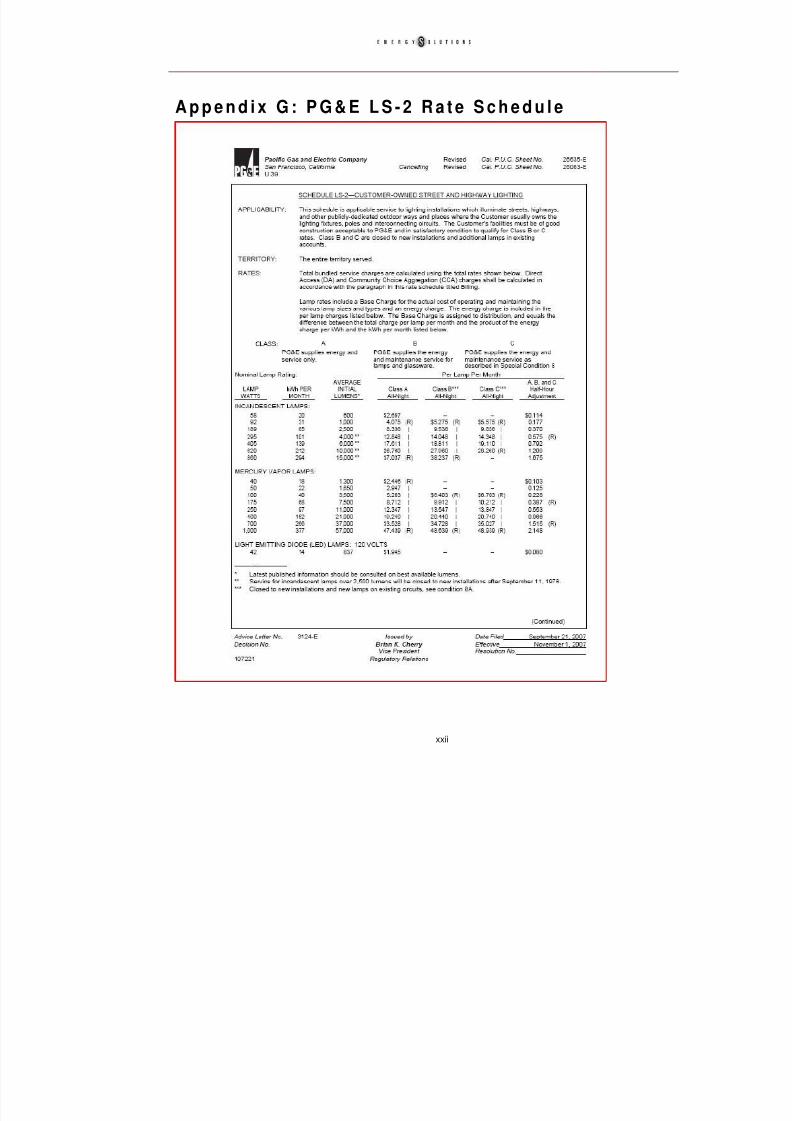
D I S C U S S I O N . . . . . . . . . . . . . . . . . . . . . . . . . . . . . . . . . . . . . . . . . . . . . . . . . . . . . . . . . . . . . . . . . . . . . . . . . . . . . . . . . . . . . 2 1 C O N C L U S I O N . . . . . . . . . . . . . . . . . . . . . . . . . . . . . . . . . . . . . . . . . . . . . . . . . . . . . . . . . . . . . . . . . . . . . . . . . . . . . . . . . . . . 2 3 A P P E N D I X A : P H A S E 2 M O N I T O R I N G D ATA . . . . . . . . . . . . . . . . . . . . . . . . . . . . . . . . . . . . . . . . . . . . . I A P P E N D I X B : M O N I T O R I N G L A Y O U T . . . . . . . . . . . . . . . . . . . . . . . . . . . . . . . . . . . . . . . . . . . . . . . . . . . . I X A P P E N D I X C : A D D I T I O N A L S I T E P H O T O G R A P H S . . . . . . . . . . . . . . . . . . . . . . . . . . . . . . . . . . . . X I A P P E N D I X D : C O N S U M E R S U R V E Y . . . . . . . . . . . . . . . . . . . . . . . . . . . . . . . . . . . . . . . . . . . . . . . . . . . . . . X I I I A P P E N D I X E : A D D I T I O N A L E C O N O M I C D A T A A N D S C E N A R I O S . . . . . . . . . . . . . X V I I I A P P E N D I X F : A C R Y L I C W E A T H E R I N G I N F O R M A T I O N . . . . . . . . . . . . . . . . . . . . . . . . . . . . . X X I A P P E N D I X G : P G & E L S - 2 R A T E S C H E D U L E . . . . . . . . . . . . . . . . . . . . . . . . . . . . . . . . . . . . . . . . X X I I
PrefaceEnergy Solutions provided monitoring, data collection, and data analysis services for an LED StreetLighting Assessment project under contract to the Emerging Technologies Program of Pacific Gasand Electric Company. The project replaced high pressure sodium luminaires in an Oakland, CAneighborhood with new ‘Beta’ LED luminaires from Ruud Lighting.
Acknowledgements
This project was funded by the Emerging Technologies Program of Pacific Gas and ElectricCompany. Energy Solutions would like to gratefully acknowledge the direction and assistance of Pacific Gas and Electric Company, the City of Oakland, Pacific Northwest National Laboratory (representing the United States Department of Energy), and Ruud Lighting for their participationand support of this project.
Ex e c ut i v e Summa r y This report summarizes an LED street lighting assessment project conducted to study theapplicability of LED luminaires in a street lighting application. In the first of two phases, theproject team took pre- and post-installation measurements in a parking lot owned by the City of Oakland to assess the likelihood of any negative safety impacts from the installation of the LEDluminaires on a public street. With no significant concerns so identified, the project progressed tothe second phase involving installation on actual public roadways. Quantitative and qualitative lightand electrical power measurements were taken on all streets, and economic costs estimated andqualitative satisfaction gauged with a resident survey. This report documents the results of thissecond phase1.
In Phase 2 of the project, fifteen 78 watt LED luminaries replaced a like number of 121 watt highpressure sodium (HPS) luminaires (100 nominal watts) on Sextus and Tunis roads between EmpireRd and Coral Rd in a residential area of Oakland. To allow a variety of comparisons, Sextus Rd was illuminated with fresh HPS luminaires on the eastern half and LED luminaires on the westernhalf, and Tunis Rd was illuminated exclusively with LED luminaires, while the adjacent Cairo Rd was entirely relamped with new HPS lamps. All luminaires have heights of 28.5’ above the road
surface, with spacings of approximately 110’, 120’, or 165’ between luminaires.Measured results from the study are tabulated in Table ES-1 below. The metered LED luminairedrew an average of 77.7 watts, roughly 35% (43.3 watts) less than the metered HPS luminaire. With an estimated 4,100 annual hours of operation,2 annual electrical savings are estimated to beapproximately 178 kWh per luminaire replaced.
Table ES-1: Potential Demand and Estimated Energy Savings3
Luminaire Type Average Power (W) Power Savings (W)Annual Energy Savings
(kWh)
High Pressure SodiumLuminaire
121.0 - -
LED Luminaire77.7 43 178
Measured illuminance levels under both the HPS and LED luminaires are shown in Table ES-2. The lighting distribution of HPS luminaires is such that they typically over-light the area directly beneath the luminaires (creating ‘hot spots’) in order to maintain minimum levels further away. This variance is evident in the measured HPS values listed in the table. As a result, the loweraverage illuminance levels measured under the LED luminaires do not denote inferior lightperformance; the LED luminaires maintained minimum light levels across all spacings whilesignificantly reducing uniformity ratios (i.e., increasing overall uniformity) compared to the HPS. The greater uniformity means that overall lighting levels can be reduced from what is required withHPS to achieve significant energy savings. This is even more pronounced when the HPS lamps arenew, as they need to account for lumen depreciation or reduced output over the course of their life.
Lighting guidelines must consider the maintenance of a minimum illumination level even at the
1 It is essential to note that the specific results reported, while perhaps characteristic of LED technology ingeneral, still primarily apply to the specific product tested. Readers are urged to use caution in extrapolating these results to other products or lighting situations.
2 From PG&E LS-2 Rate Schedule, Appendix G.
3 See ‘Electrical Demand and Energy Savings’ section.
light source’s worst point (i.e., its end of life); thus the issue of over-lighting is greatest when theHPS lamps are fresh. LEDs have a much lower lumen depreciation curve over their lifetime incomparison with traditional light sources, so that the need for initial over-lighting is much reduced.
Table ES-2: Photopic Illuminance Levels4
AverageIlluminance (fc)
MinimumIlluminance (fc)
Avg. to Min.Uniformity
Ratio
Max. to Min.Uniformity
Ratio
HPSLuminaires
110’ Spacing 1.00 0.19 5.40:1 19.00:1
120’ Spacing 0.80 0.09 8.66:1 40.00:1
165’ Spacing 0.47 0 >10.16:1 >60.00:1
LED Luminaires
110’ Spacing 0.58 0.19 3.11:1 6.50:1
120’ Spacing 0.53 0.09 5.68:1 16.00:1
165’ Spacing
0.35 0 ≥7.47:1 ≥26.00:1
Due to the as yet undemonstrated useful life of these LED luminaires, economic and reliability claims are based on the best available information from the manufacturer and DOE reports. Thepayback periods in this particular case study are shown in Figure ES-1 using different assumedmaintenance scenarios. In this particular study, the estimated incremental cost for installing LEDluminaires in a new construction scenario was on the order of $500. The detailed economicanalysis is provided in the Economic Performance Section.
While the results of this assessment estimated a relatively long payback period for this specificLED street light product under current conditions, payback periods are sensitive to installation-specific maintenance costs and electrical costs. In addition, other performance attributes combined with operating cost savings may be such that longer payback periods are acceptable. These couldinclude various benefits from improved visibility, as highlighted in the Customer Acceptance
section of the report that documents the resident feedback on the new LED lighting.
The commercial viability of LED luminaires is dependent on a number of factors. Two of themost significant of these are luminaire efficacy and initial cost, and LED technology continues toadvance rapidly in both of these respects. Product costs to consumers can also be expected todecrease both as economies of scale are realized and as competition increases in their manufacture.Both of these aspects are encouraged through sales of existing products. Means of reducing coststo consumers in the short term will serve to promote sales and are thus recommended toorganizations interested in accelerating the potential energy savings realized from this rapidly advancing technology.
The potential for energy savings from LED street lights is very large. It is estimated that 860 GWhof electricity is used annually for roadway lighting in PG&E’s service territory, a large share of
which is made up by cobra-head luminaires similar to those studied here.6
The LED luminairesused in this study reduced energy by over 1/3 compared to the previous luminaires. As LEDtechnology advances and efficacies improve, these savings will likely improve as well.
The LED Street Lighting Assessment project studied the applicability of light-emitting-diode(LED) luminaires on existing street light poles. High pressure sodium (HPS) luminaires werereplaced with new LED luminaires on a street located in Oakland. The applicability of thetechnology was determined by light output, energy and power usage, economic factors, andqualitative satisfaction. The LED Street Lighting Assessment project was conducted as part of theEmerging Technologies Program of Pacific Gas and Electric Company. The Emerging Technologies program “is an information-only program that seeks to accelerate the introduction of innovative energy efficient technologies, applications and analytical tools that are not widely adopted in California…. [The] information includes verified energy savings and demand reductions,market potential and market barriers, incremental cost, and the technology’s life expectancy.”7
Technolog ical Overview
At the time of this assessment, LEDs are beginning to be installed in outdoor settings because of luminaire ability to provide greater control of light dispersion and greater maintenance savingscompared to traditional sources, as well as changing industry perception of higher quality light forexterior use. One corresponding application is street and roadway luminaires. Currently, streets areilluminated with high pressure sodium, and less frequently metal halide, low pressure sodium, orother lights. HPS lights are used primarily because of their long rated life and high efficiency relative to other conventional options, but have low color rendition. LEDs have the potential foreven longer life than HPS, reduced maintenance, high color rendition, and reduced operating costincluding lower energy usage. Currently however, the initial cost of LEDs is much higher thanconventional light sources.
The US Department of Energy reports the technology is changing at a rapid pace. Overall, theperformance of LED luminaires is advancing in efficiency at a rate of approximately 35% annually, with costs decreasing at a rate of 20% annually.8
Market Overview
A report by Navigant Consulting in 2002 estimates that lighting makes up approximately 22% of IOU kWh sales on a national scale. Of that amount roughly 4%, or 1% of total IOU kWh sales,are for roadway lighting.9 Using kWh sales figures from a 2006 study, 10 the total consumption inPG&E’s service territory for lighting is calculated to be on the order of 21,500 GWh in 2002, witha resulting 860 GWh for roadway lighting. Although these figures are not exclusively for the cobra-
7 Pacific Gas and Electric Company (2006). Program Descriptions, Market Integrated Demand SideManagement, Emerging Technologies. PGE2011
8 Navigant Consulting, Inc. (2006). “Solid State Lighting Research and Development Portfolio. Multi-YearDevelopment Plan. FY’07-FY’12.”
Pro je c t Obje c t i v e s The objectives of the project were to examine electrical, lighting, and economic performance of cobra-head HPS luminaires as compared to LED luminaires. The potential electrical demand andenergy savings were measured in terms of average wattage and estimated annual kWh usage.Lighting performance was measured in terms of illuminance, uniformity, correlated colortemperature (in Kelvin), and by the satisfaction and concerns of interested parties. Finally,economic performance was calculated as simple-payback for substitution in new installation orreplacement scenarios, accounting for lamp life-span, maintenance costs, and electrical costs.
Fifteen LED luminaires were installed on Sextus and Tunis roads between Empire Rd and Coral Rdnear the Oakland International Airport in Oakland, California. To allow a variety of comparisons,Sextus Rd was illuminated with fresh HPS luminaires on the eastern half and LED luminaires onthe western half, and Tunis Rd was illuminated exclusively with LED luminaires, while the adjacentCairo Rd was entirely relamped with new HPS lamps. The pre-installation streetlights on TunisRoad were high pressure sodium cobra-head luminaires.
This is a residential neighborhood, where all luminaires have heights of approximately 28.5’ abovethe road surface, with spacings of approximately 110’, 120’, or 165’ between luminaires.
Monitoring Plan
Two similar Monitoring Plans for each phase were developed for this assessment. Each called for
pre-installation and post-installation field visits. In both cases, the monitoring area was set-upduring our first site visit but before taking measurements. In the first phase, the project team took pre- and post-installation measurements in a parking lot owned by the City of Oakland to assessthe likelihood of any negative safety impacts from the installation of the LED luminaires on apublic street. With no significant concerns so identified, the project progressed to the secondphase involving installation on actual public roadways. Therefore, the following describes thePhase 2 Monitoring Plan.
The pre-installation field visit and grid set-up were combined and occurred prior to installation of the LED luminaires. It was intended to document the existing condition of the lighting system. The HPS lamps had been replaced and the luminaires had been cleaned in anticipation of this work. The HPS lamps were burned in for approximately 100 hours prior to installation. All lightmeasurements were taken after dusk.
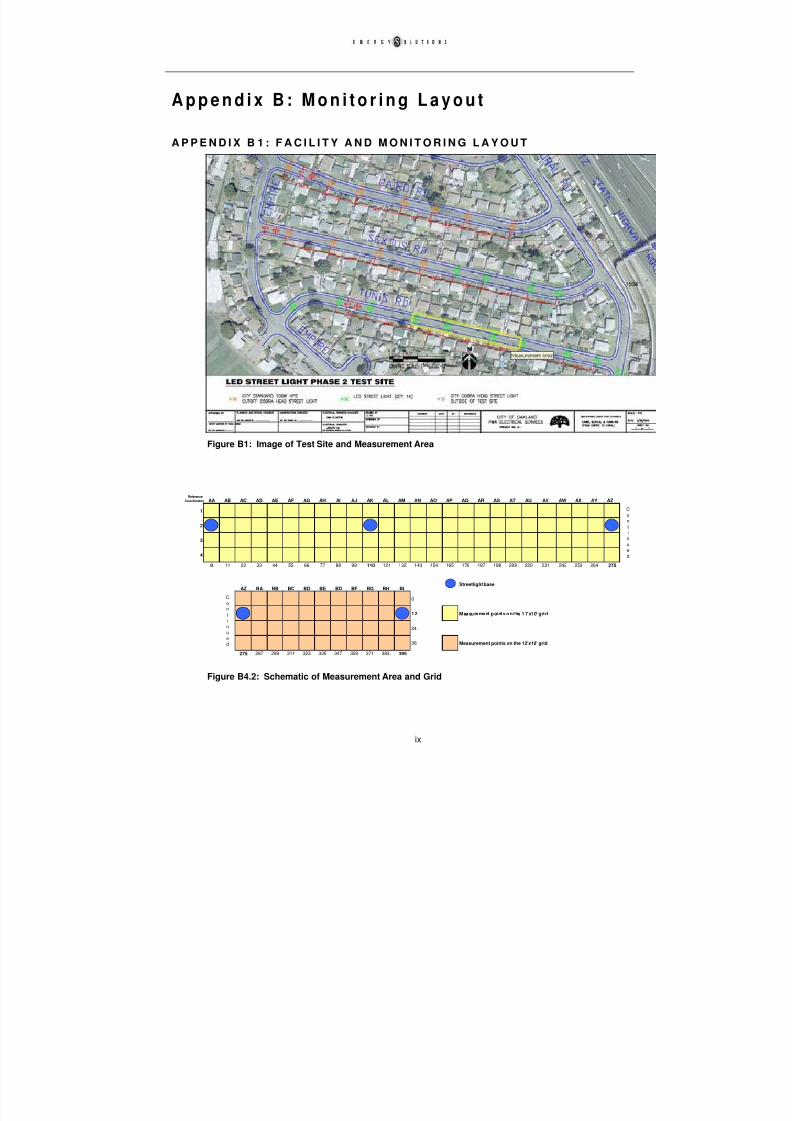
Photopic and scotopic illuminance measurements were taken on a 395’ x 36’ grid over an areacontaining four luminaires. The distance between the first and second luminaires is 110’, thedistance between the second and third luminaires is 165', and finally the distance between the thirdand fourth luminaires is 120'. Ideally, luminaires are spaced equally for lighting uniformity, but inreality, street lights tend to be located at the intersection of property lines so that the street light isnot solely located in one yard. The grid spacing was 12’ north-south over the entire area, modifiedfrom the planned 10' because of the street width. Grid spacing in the area between the luminaireslocated 120' apart was 12’ east-west and 10' apart in the areas between the luminaires located 165’and 110’ apart. The measurement area is visually depicted in Appendix B.
The luminaires were located approximately 28.5' above the finished grade, on 6’ mounting armsfrom wood poles. The illuminance levels were taken with a Solar Light PMA220 meter with
photopic and scotopic detectors at a height of 18” above ground. This meter has a precision of 1lux (0.09 foot-candles).
It should be noted that the measurements taken differ slightly from those defined in the “IESNAGuide for Photometric Measurement of Roadway Lighting Installations.” The Illuminating Engineering Society of North America (IESNA) recommends that the grid be laid out so thatmeasurements are taken beginning at one-half the grid spacing from the spot directly beneath theluminaire. In this study, the measurement grid was laid out such that measurements were taken atthe areas directly underneath luminaires and the midpoints between luminaires, corresponding tothe predicted maximum and minimum illuminance levels in the test area. This was done to capture
the full effect of differing uniformity in the HPS and LED luminaires. IESNA also recommendsthat care be taken to level the detector before each measurement and that the detector be less than6” off the ground. The monitoring team determined that the former recommendation was of greater import, so measurements were taken at 18” – the lowest level that could achieved with thecombination of leveling tripod and detectors.
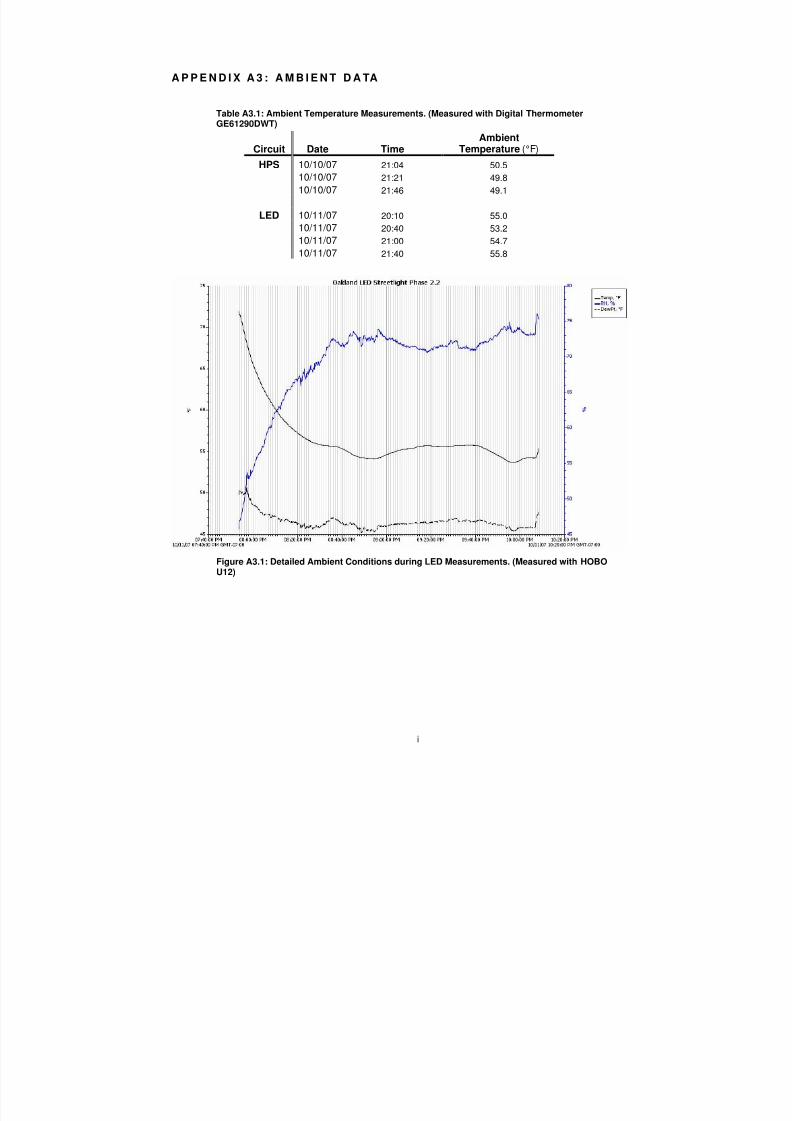
Periodic temperature measurements were also taken throughout the testing period. Thesemeasurements were taken approximately every 20 minutes with a digital thermometer for both theHPS and LED measurements. In addition, during the night of the LED measurements, relativehumidity and additional temperature measurements were taken every 30 second with a HOBOInstruments U12 datalogger.
For measurement locations and geometry, see Appendix B1. Measurements were taken consistent with Appendix B2. The information gathered at each of the HPS and LED field visits was:
1. On-site photographs
2. Power, illumination, correlated color temperature and ambient temperature readings
The following monitoring equipment used in the execution of this Monitoring Plan was obtainedfrom the Pacific Energy Center:
I L L U M I N A N C E M E T E R
Solar Light SnP Meter (PMA220) with Photopic Detector (PMA2130) and Scotopic Detection(PMA2131), last calibrated 10/2007
C O R R E L A T E D C O L O R T E M P E R A T U R E M E T E R
Konica Minolta Chroma Meter, Model CL-200, last calibrated 10/2007
P O W E R M E T E R
Dent ElitePro Datalogger, last calibrated 4/2007
A M B I E N T T E M P E R A T U R E
Digital Thermometer (GE61290DWT)
Hobo Instruments U12 Datalogger, last calibration unknown
P ro je c t R e s u l ts a n d D i s c u s s i o n
Electrical D emand and Energ y Savings
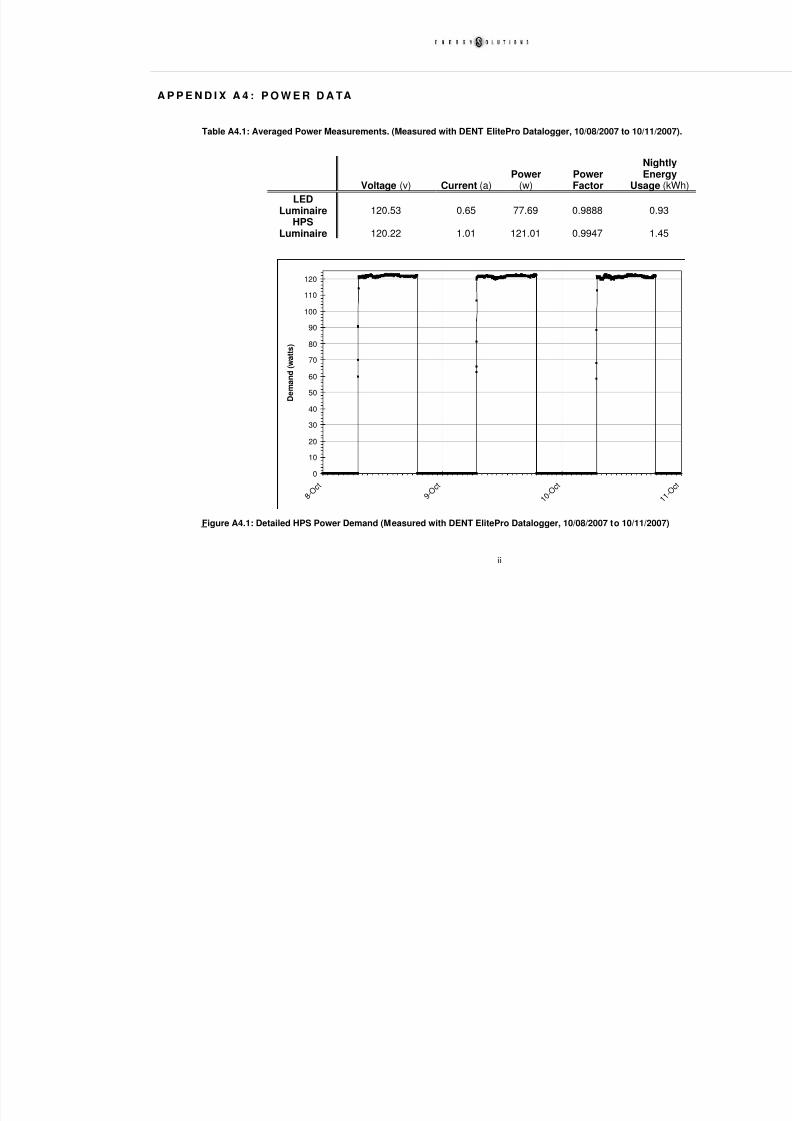
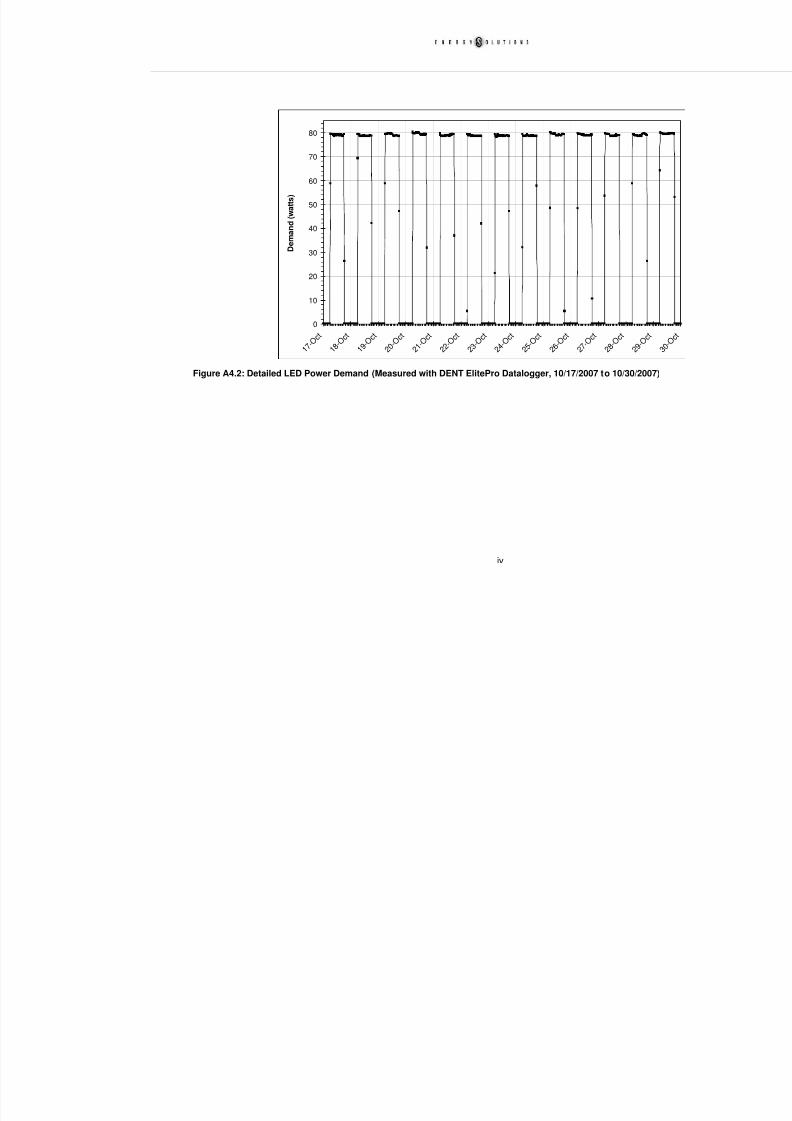
Power data were logged using the DENT ElitePro Datalogger for a single HPS luminaire and asingle LED luminaire. The HPS measurements were taken over the course of three nights, from10/08/2007 to 10/10/2007. This HPS luminaire was then replaced with an LED luminaire, which was measured over the course of 13 nights, from 10/17/2007 to 10/30/2007.
Because the meter was intended to be left over a period of days, it had to be installed at a heightthat was not within reach from the ground. As such, the monitoring team relied upon the City of Oakland and their street lighting maintenance crew to install and remove the meter. The numberof days metered for both the LED and HPS luminaires is a product of when the data meter couldbe installed and removed. No significant variations in power consumption occurred during themeasured period.11
The HPS luminaire consumed an average of 121 watts per luminaire over an average of 11.97hours per day. 12 As a result, the estimated annual power consumption for the luminaire, assuming
4100 hours of operation annually, is 496 kWh.
The LED luminaire consumed an average of 78 watts per luminaire over an average of 12.75 hoursper day.13 As a result, the estimated annual power consumption for the luminaire, assuming 4100hours of operation annually, is 319 kWh.
Table 1: Measured Power Demand and Estimated Energy Usage
LuminaireType Voltage (v) Current (a) Power (w)
PowerFactor
Estimated AnnualConsumption
(kWh)
HPS 120.2 1.0 121.0 0.995 496
LED 120.5 0.7 77.7 0.988 319
Table 2: Potential Demand and Energy Savings
Luminaire Type Power (W) Power Savings (W) Estimated Annual
Energy Savings (kWh)
HPS 121.0 - -
LED 77.7 43.3 178
The variation in hours of operation between the two luminaire types results from the photocellregulation of the on-off cycle. The primary influence on the hours of operation is the amount of time between sunset and sunrise; since the LED luminaire was monitored closer to the wintersolstice than the HPS luminaire, the operating hours were slightly longer.14
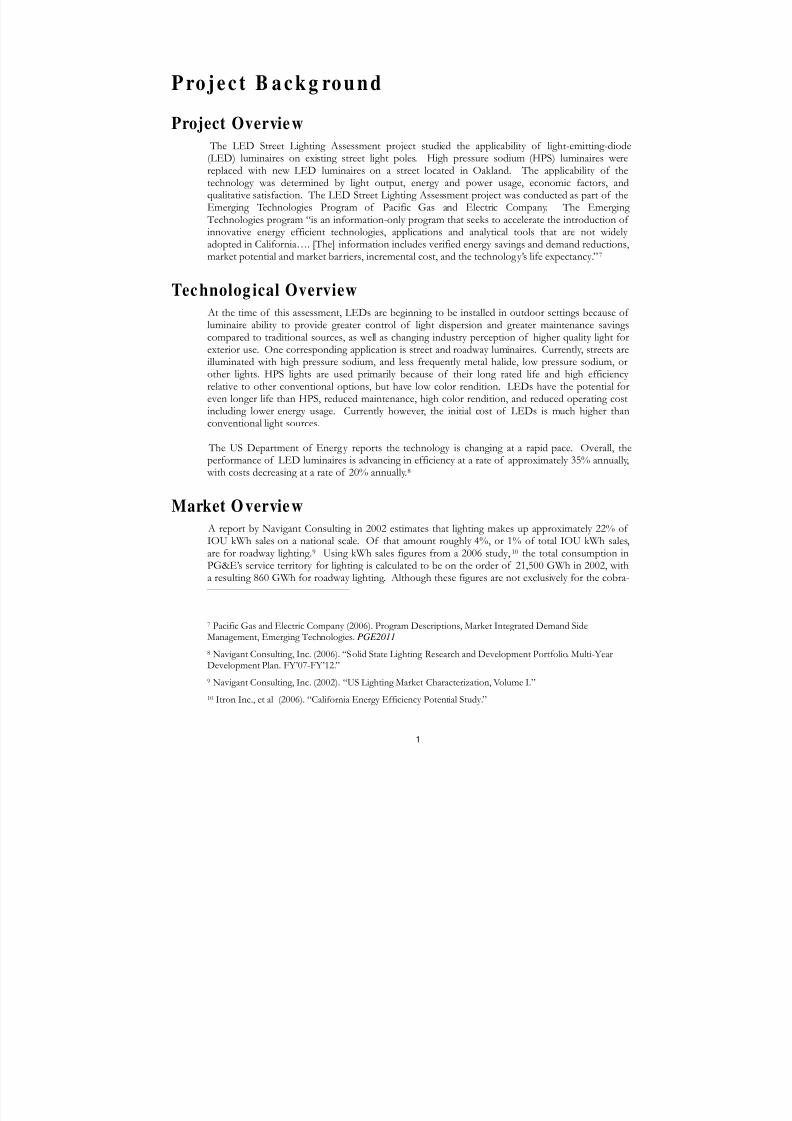
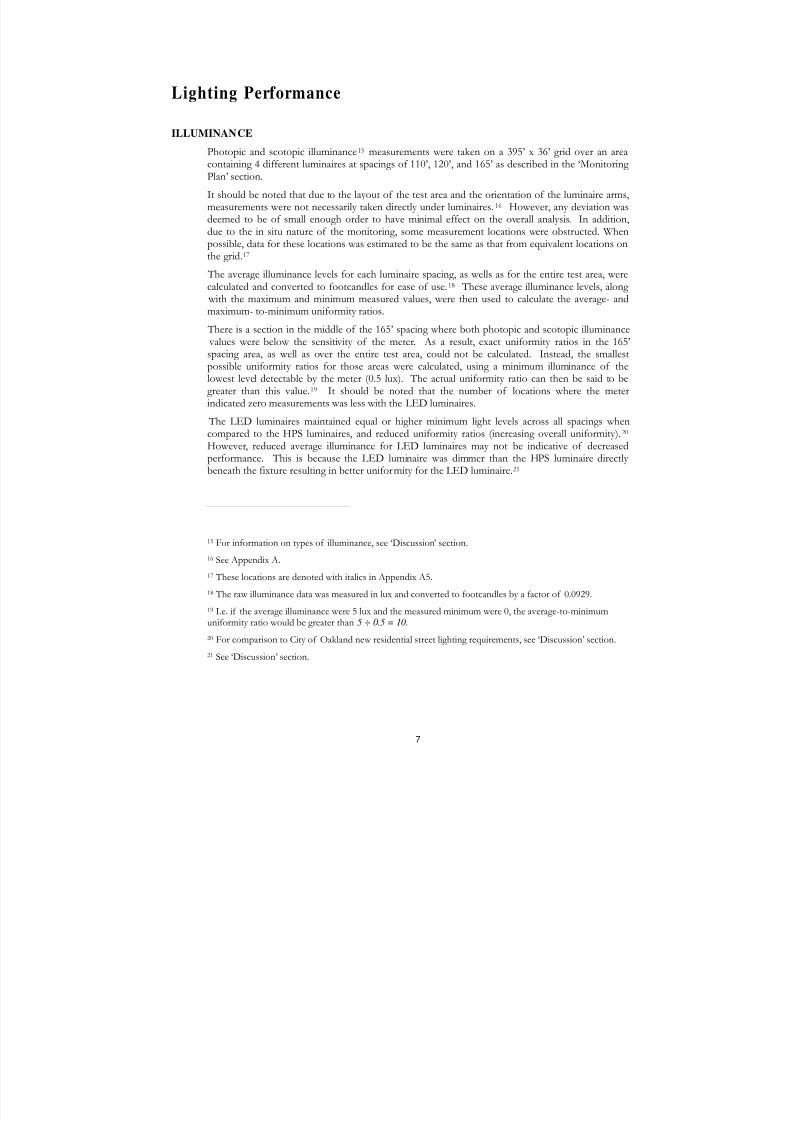
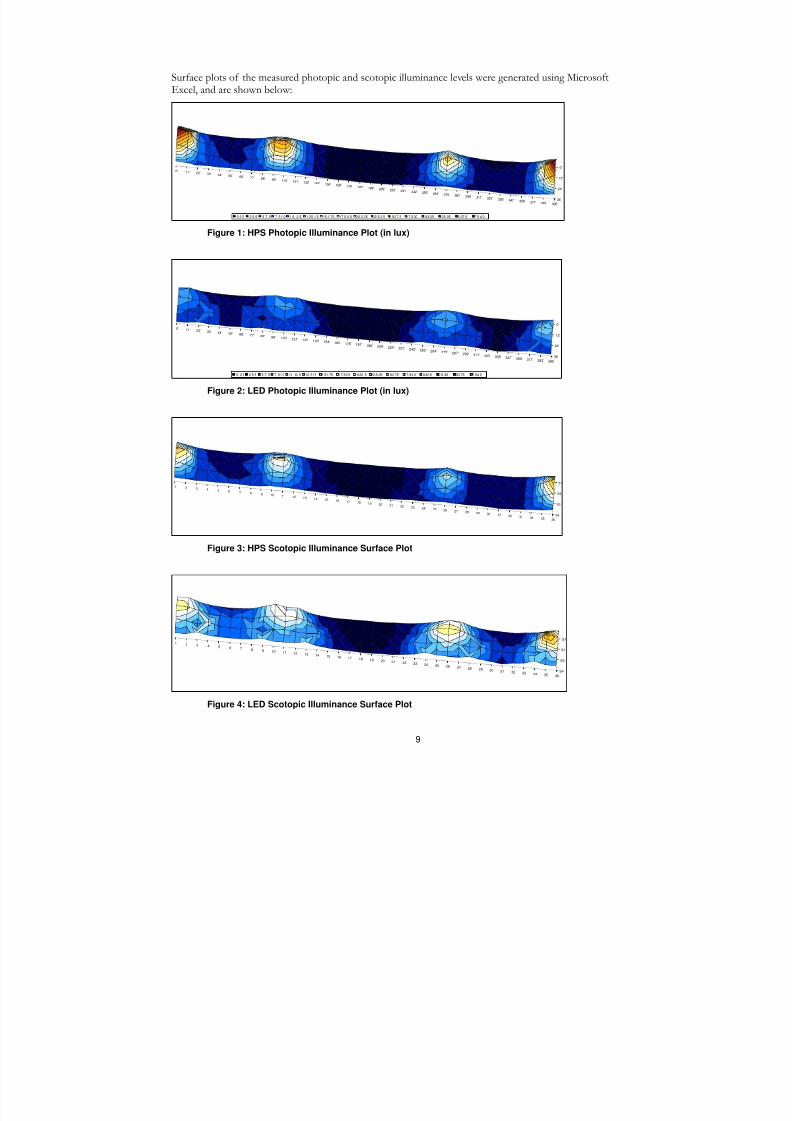
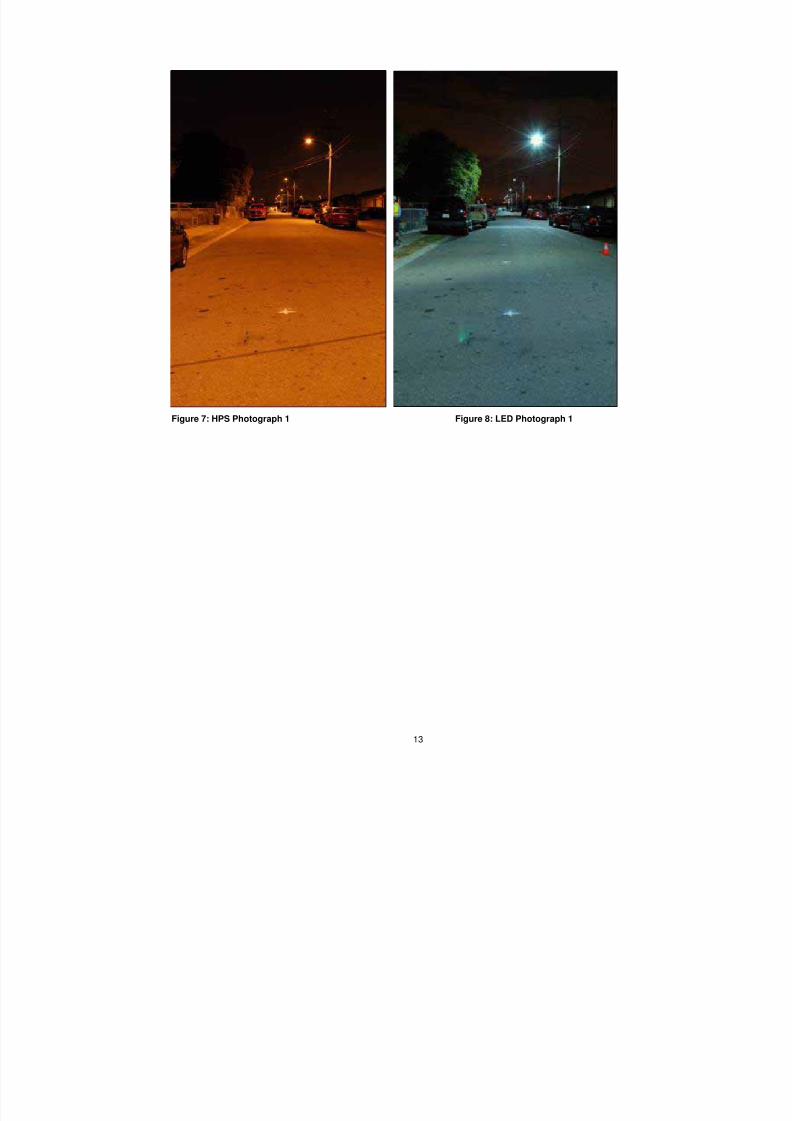
Photopic and scotopic illuminance15 measurements were taken on a 395’ x 36’ grid over an areacontaining 4 different luminaires at spacings of 110’, 120’, and 165’ as described in the ‘Monitoring Plan’ section.
It should be noted that due to the layout of the test area and the orientation of the luminaire arms,measurements were not necessarily taken directly under luminaires.16 However, any deviation wasdeemed to be of small enough order to have minimal effect on the overall analysis. In addition,due to the in situ nature of the monitoring, some measurement locations were obstructed. Whenpossible, data for these locations was estimated to be the same as that from equivalent locations onthe grid.17
The average illuminance levels for each luminaire spacing, as wells as for the entire test area, werecalculated and converted to footcandles for ease of use.18 These average illuminance levels, along
with the maximum and minimum measured values, were then used to calculate the average- andmaximum- to-minimum uniformity ratios.
There is a section in the middle of the 165’ spacing where both photopic and scotopic illuminance values were below the sensitivity of the meter. As a result, exact uniformity ratios in the 165’spacing area, as well as over the entire test area, could not be calculated. Instead, the smallestpossible uniformity ratios for those areas were calculated, using a minimum illuminance of thelowest level detectable by the meter (0.5 lux). The actual uniformity ratio can then be said to begreater than this value.19 It should be noted that the number of locations where the meterindicated zero measurements was less with the LED luminaires.
The LED luminaires maintained equal or higher minimum light levels across all spacings whencompared to the HPS luminaires, and reduced uniformity ratios (increasing overall uniformity).20 However, reduced average illuminance for LED luminaires may not be indicative of decreased
performance. This is because the LED luminaire was dimmer than the HPS luminaire directly beneath the fixture resulting in better uniformity for the LED luminaire.21
15 For information on types of illuminance, see ‘Discussion’ section.
16 See Appendix A.
17 These locations are denoted with italics in Appendix A5.
18 The raw illuminance data was measured in lux and converted to footcandles by a factor of 0.0929.
19 I.e. if the average illuminance were 5 lux and the measured minimum were 0, the average-to-minimumuniformity ratio would be greater than 5 ÷ 0.5 = 10.
20 For comparison to City of Oakland new residential street lighting requirements, see ‘Discussion’ section.
Scotopically, the LED luminaires maintained or increased minimum illuminance levels across allspacings compared to the HPS luminaires. Uniformity ratios were increased with the LEDluminaires in spacings other than 110’, where they were reduced. Average scotopic illuminancelevels were also increased with the LED luminaires in all spacings.
LED manufacturers claim that LED lumen depreciation is minimal compared to conventionallighting sources. The manufacturer of the LED used in this study provided the chart below corresponding to their estimates of lumen maintenance of their product for various ambienttemperatures. It should be noted however, that since the expected average annual nighttimetemperature is below 25 degrees C, and no comparable luminaire has been operated for over100,000 hours (nearly 25 years at 4,100 hours per year), no independent data is available tocorroborate these estimates. In January 2008, the Illuminating Engineering Society of North America (IESNA) plans to publish standards for lumen depreciation testing which will allow measurement of lumen maintenance performance.
The HPS lamp used in this assessment was a nominally-rated 100 watt lamp. The manufacturerprovided the following lumen maintenance graph. The shaded area in the graph represents therange of lumen maintenance found within the manufacturer’s HPS family. It is calculated based onthe average of products (lamp wattage) in the company’s HPS line.
Figure 6: HPS Lumen Maintenance Curve
The rated life of this HPS lamp is 30,000 hours. At 30,000 hours, the HPS lamp would beexpected to provide 75-85% of initial lumens. The LED luminaire, if the manufacturer’spredictions are correct and ambient conditions average 25○C or below, will still be providing morethan 90% of its initial lumens at this point.
Because the bottom surface of the LED luminaire is an acrylic resin, lumen maintenance is also
affected by the yellowing of that resin. The Cyro Acrylite resin used by Ruud Lighting is projectedby the manufacturer to experience a relatively minor yellowing. Under climate conditions similar tothat in Arizona, transmittance (the fraction of incident light that passes through the resin) would,after ten years, decrease by approximately 2%. Further information on the yellowing index of thisresin is available in Appendix F.
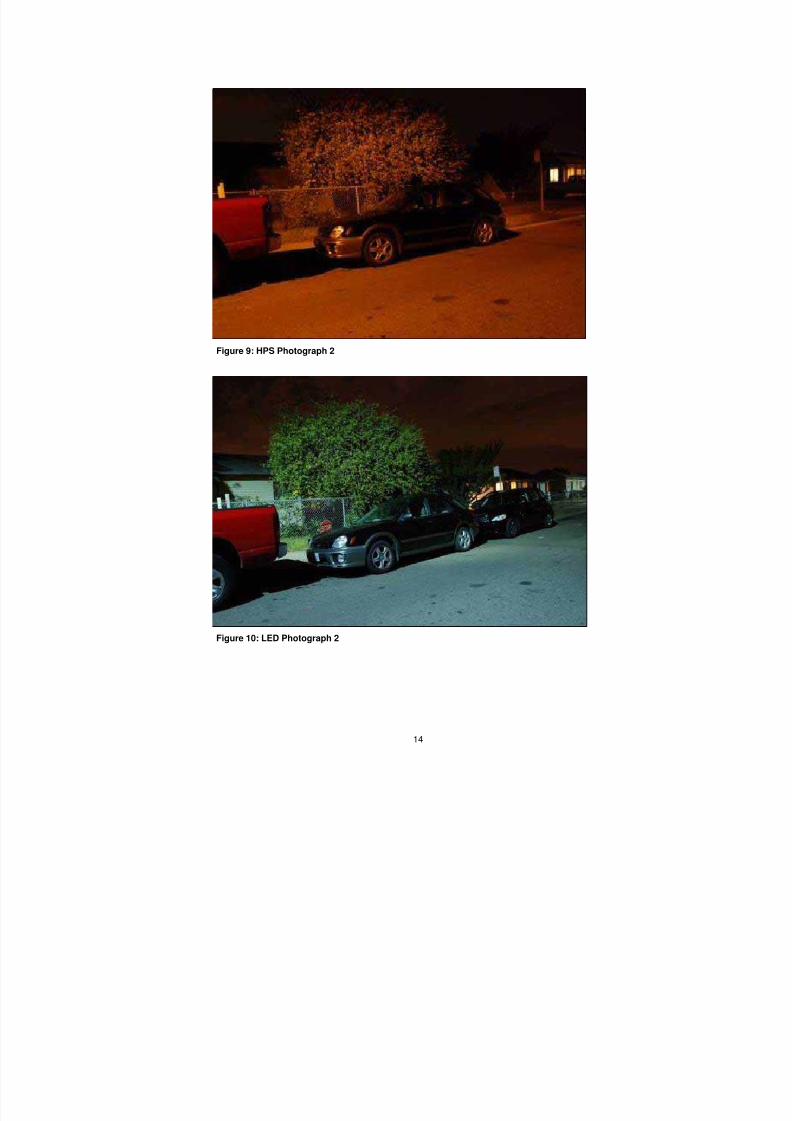
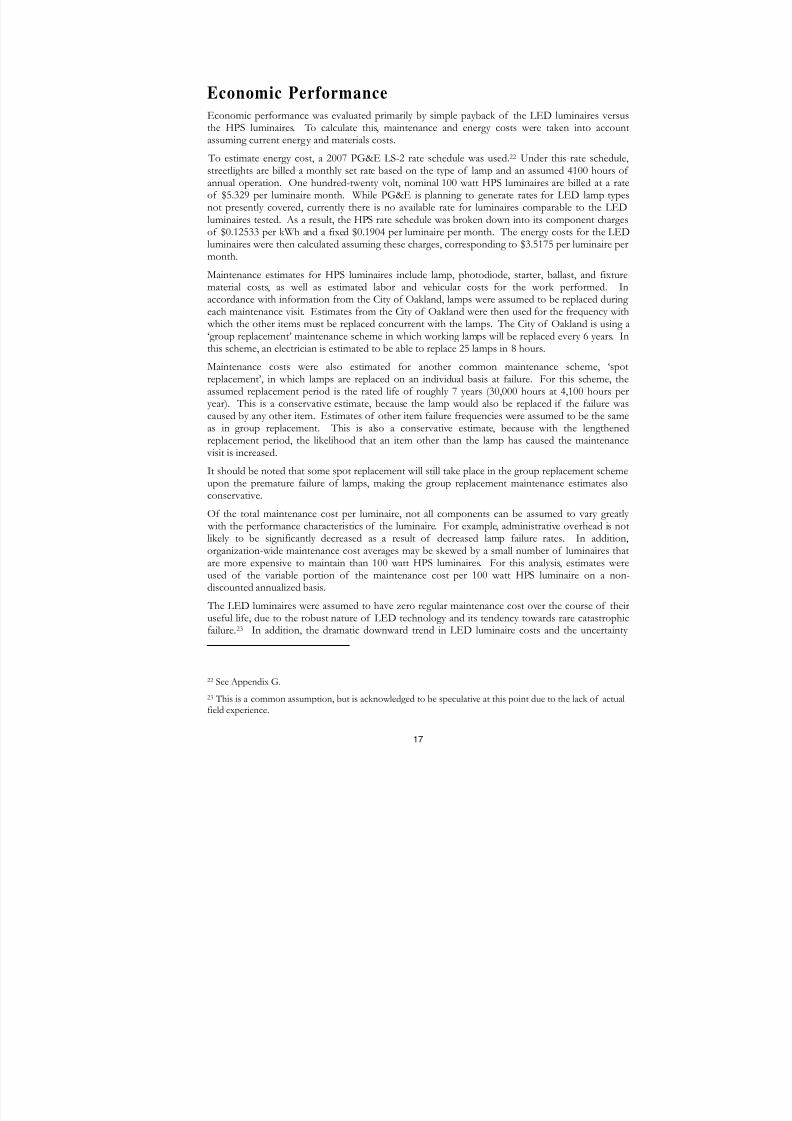
CORRELATED COLOR TEMPERATURE
Color measurements were measured using a Konica Minolta Chromameter under 3 sampleluminaires of each type; LED and HPS. For the LED luminaires, measurements of correlatedcolor temperature were taken directly. For the HPS luminaires, the chromameter was unable tocalculate the correlated color temperature, so tristimulus values were measured and then converted
to correlated color temperature. The average correlated color temperature under the LEDluminaires was 6255 K. The average under the HPS luminaires was 1991 K. Due to difficulties inobtaining the chromameter prior to the installation of the LED luminaires, the HPS colortemperature measurements were not taken under the luminaires used for illuminancemeasurements.
To qualitatively analyze color rendition, photos were taken of each luminaire type. They were taken with a Nikon D80 digital camera, and the white balance was also adjusted from the initial 4000k to4200k for each photo. This value was chosen as the average of the literature values for colortemperature for the HPS lamps (1900k) and the LEDs (6500K).
The camera settings were identical on each photo:
Flash: NoFocal Length: 18 mmF-Number: F/6.3Exposure Time: 5 sec. White Balance: 4000k (adjusted to 4200k)
Two photos for each luminaire type are shown below:
The Pacific Northwest National Laboratory managed the customer opinion survey for thisassessment. A public opinion research firm, Fairbank, Maslin, Maullin & Associates, was engaged tocontact residents of the neighborhood by telephone and obtain their feedback on the new lights.Phone numbers were obtained for 49 of the households on streets with new streetlights on theirblocks, and for 106 of the households elsewhere in the neighborhood. Contact was attemptedduring the period November 30 through December 19, and reached 60 households in total. A copy of the survey, as well as full results, are presented in Appendix D.
The first question asked of residents was if they had in fact noticed the change in street lighting. A“no” to this question meant skipping most of the rest of the questions, other than the finaldemographic questions on age and gender. Ultimately, only 16 residences on the streets directly under the lighting and 4 residences elsewhere in the neighborhood were reached that reportednoticing the new lights. The results below are therefore limited to 20 responses; a numbersufficient to note any overwhelming trends but insufficient to perform any statistical extrapolationto a larger population.
In all, 17 out of the 20 respondents felt that the new streetlights were at least as preferable (i.e.,either had no preference or preferred the new lights outright) as the old streetlights, if not
significantly better. See Table 6 below.
Table 6: Preferences Expressed for the New or the Old Streetlights
PreferenceNumber of
Respondents
Strongly Prefer New Streetlights 12
Somewhat Prefer New Streetlights 2
Total Preferring New Streetlights 14
No Expressed Preference 3
Strongly Prefer Old Streetlights 0
Somewhat Prefer Old Streetlights 3Total Preferring Old Streetlights 3
All respondents that had noticed the new streetlights felt that that the new streetlights at leastmaintained or improved their neighborhood’s overall appearance, nighttime safety and nighttime visibility. See Table 7.
Table 7. Neighborhood Impact of New Streetlights
Aspect of Neighborhood
# Believingthat the NewStreetlights
have
Strongly orSomewhatImproved
# Believingthat the NewStreetlights
haveStrongly or
SomewhatNot
Improved
# Believingthat the NewStreetlightsdo not havea Noticeable
Impact
Overall Appearance 15 0 5
Nighttime Safety 14 0 6
Nighttime Visibility 16 0 4
In three questions regarding different aspects of visibility (visibility as a driver, visibility as apedestrian and recognition of people at night), respondents indicated improvements with the new
streetlights. Fourteen respondents indicated that the new streetlights strongly improved roadway visibility when they were driving, while 13 indicated that the new streetlights strongly improvedtheir ability to see as pedestrians. Additionally, 13 indicated that the new streetlights had made itmuch or somewhat easier to recognize people at night. These results are consistent withrespondents’ overall preference of the new streetlights, given that the primary goal of streetlights isto improve nighttime visibility.
Of respondents that noticed the new streetlights, opinions were somewhat more varied withregards to the other subjective measures of streetlight effectiveness – glare, brightness and shadow creation. While opinions were much more uniformly positive about the new streetlights’ effect on visibility and the overall neighborhood, opinions were a bit more mixed when it came to thepotential secondary effects. Ten respondents felt that the new streetlights reduced glare, while 7 didnot notice a change in glare; 3 respondents indicated that the new streetlights created more glare. The results were somewhat similar for the questions regarding shadow creation, with 12respondents not indicating any change one way or another in terms of the shadow creation by thenew streetlights, suggesting that shadow creation may have not been a problem with the oldstreetlights.
Although this somewhat small sample size does not permit statistical conclusions with much
specificity, the preponderance of those interviewed indicated strong and consistent preference forthe new streetlights. Much of this appears to be attributable to improved visibility for drivers andpedestrians and the overall positive effects of the new streetlights on several aspects of theneighborhood’s overall appearance and nighttime safety. This is consistent with the open-endedresponses of those preferring the new streetlights; half of which indicated that their expressedpreference was based upon improved visibility.
Economic performance was evaluated primarily by simple payback of the LED luminaires versusthe HPS luminaires. To calculate this, maintenance and energy costs were taken into accountassuming current energy and materials costs.
To estimate energy cost, a 2007 PG&E LS-2 rate schedule was used.22 Under this rate schedule,streetlights are billed a monthly set rate based on the type of lamp and an assumed 4100 hours of annual operation. One hundred-twenty volt, nominal 100 watt HPS luminaires are billed at a rateof $5.329 per luminaire month. While PG&E is planning to generate rates for LED lamp typesnot presently covered, currently there is no available rate for luminaires comparable to the LEDluminaires tested. As a result, the HPS rate schedule was broken down into its component chargesof $0.12533 per kWh and a fixed $0.1904 per luminaire per month. The energy costs for the LEDluminaires were then calculated assuming these charges, corresponding to $3.5175 per luminaire permonth.
Maintenance estimates for HPS luminaires include lamp, photodiode, starter, ballast, and fixturematerial costs, as well as estimated labor and vehicular costs for the work performed. In
accordance with information from the City of Oakland, lamps were assumed to be replaced during each maintenance visit. Estimates from the City of Oakland were then used for the frequency with which the other items must be replaced concurrent with the lamps. The City of Oakland is using a‘group replacement’ maintenance scheme in which working lamps will be replaced every 6 years. Inthis scheme, an electrician is estimated to be able to replace 25 lamps in 8 hours.
Maintenance costs were also estimated for another common maintenance scheme, ‘spotreplacement’, in which lamps are replaced on an individual basis at failure. For this scheme, theassumed replacement period is the rated life of roughly 7 years (30,000 hours at 4,100 hours peryear). This is a conservative estimate, because the lamp would also be replaced if the failure wascaused by any other item. Estimates of other item failure frequencies were assumed to be the sameas in group replacement. This is also a conservative estimate, because with the lengthenedreplacement period, the likelihood that an item other than the lamp has caused the maintenance
visit is increased.It should be noted that some spot replacement will still take place in the group replacement schemeupon the premature failure of lamps, making the group replacement maintenance estimates alsoconservative.
Of the total maintenance cost per luminaire, not all components can be assumed to vary greatly with the performance characteristics of the luminaire. For example, administrative overhead is notlikely to be significantly decreased as a result of decreased lamp failure rates. In addition,organization-wide maintenance cost averages may be skewed by a small number of luminaires thatare more expensive to maintain than 100 watt HPS luminaires. For this analysis, estimates wereused of the variable portion of the maintenance cost per 100 watt HPS luminaire on a non-discounted annualized basis.
The LED luminaires were assumed to have zero regular maintenance cost over the course of theiruseful life, due to the robust nature of LED technology and its tendency towards rare catastrophicfailure.23 In addition, the dramatic downward trend in LED luminaire costs and the uncertainty
22 See Appendix G.
23 This is a common assumption, but is acknowledged to be speculative at this point due to the lack of actualfield experience.
regarding the useful life of the luminaires are such that LED luminaire replacement was notincorporated into maintenance estimates. Normally this cost could be annualized, effectively saving money each year toward eventual luminaire replacement. Since this was not done, there were no variable maintenance costs for the LED luminaires.
For the HPS luminaires, maintenance accounted for roughly 25% of the total annual cost under thespot replacement scheme. With the group replacement scheme, maintenance accounted forroughly 15% of the total annual cost. Since variable maintenance costs for the LED luminaires were effectively assumed to be zero, the energy costs accounted for 100% of the annual cost.24
Two economic scenarios were considered: a ‘new construction’ scenario in which LED luminairesare installed in place of planned 100 watt HPS luminaires, and a ‘retrofit’ scenario in which LEDluminaires were assumed to be installed in place of existing and operational 100 watt HPSluminaires. In each scenario, evaluations were conducted with comparisons based on both HPSgroup replacement and HPS spot replacement maintenance schemes. The details of thesescenarios are presented in Appendix E.
Currently, the cost of the LED luminaires is approximately 3.75 times that of the HPS luminaires(including lamp and photocell). In the new construction scenario, the initial investment for HPSinstallation is the HPS luminaire cost plus the cost of installation. Since the cost of installation is
assumed to be the same for both luminaire types, the total incremental cost of installation for LEDluminaires, $487, is the difference in material costs between the LED luminaires and the HPSluminaires. The resulting simple payback periods are 11.6 years in the spot replacement scheme,and 14.9 in the group replacement scheme.
In the retrofit scenario, there is no assumed initial investment in the HPS luminaires. As a result,the incremental cost of LED installation is the full estimated cost of the LED luminaireinstallation, or $833. The resulting simple payback periods are approximately double those for the
If a luminaire has a calculated simple payback period longer than its useful life, it will not haverecouped the initial investment. The payback periods in this particular case study correspond to arange of roughly 50,000 to 100,000 hours of operation. It should be noted that the manufacturerprovides a 5-year warranty with their product (corresponding to 20,500 hours of operation at 4,100hours per year), although a much longer useful life is anticipated.25
It should be noted that the simple payback periods were based on bulk-purchased luminaire costs.Individual luminaire purchases, or purchases in small numbers, would carry increased luminairecost, and thereby lengthen the simple payback period.
In addition, the calculated simple payback periods are sensitive to estimated maintenance savings, which are in turn highly dependent on the specific installation scenario. It is also conceivable thatmaintenance visits may be required for the LED luminaires (such as for cleaning), but this is notincorporated due to lack of information. As a result of these uncertainties and the notedsensitivity, ranges were calculated for each economic scenario considered around the estimatedannual maintenance savings, from $0 per luminaire to $30 per luminaire.
Cost curves were generated showing requisite LED luminaire costs for simple paybacks under 20years, and are shown below.
i n a i r e I n s t a l l a t i o n I n c r e m e n t a l C o s t ( U S D )
$0 per year
$30 p er year
Maintenance
Savings
$10.97 per year
(Group Replacement
Estimate)
$20.40 per year(Spot Replacement
Estimate)
Figure 11: Estimated LED Luminaire Payback
LED luminaire cost is the other key component of the simple payback periods. Currently, themajority of this cost is comprised by the cost of LEDs, which is declining rapidly. Indeed, Haitz’s
Law predicts that the light output of LEDs increases by a factor of 20 every 10 years, while thecost decreases by a factor of 10 over the same period of time. This has held approximately truebeginning with red LEDs in the late 1960’s and continuing with the more recent white LEDs. 26 Atthe same time, the cost per lumen output has declined at a rate of 20% per year.27 The remainderof the luminaire cost includes research and development costs, design, general overhead,manufacturing, and other material costs.
26 Steele, Robert V (2006). “The story of a new light source.” Nature Photonics 1, 25 – 26.10.1038/ nphoton.2006.44
27 Navigant Consulting, Inc. (2006). “Solid State Lighting Research and Development Portfolio. Multi-YearDevelopment Plan. FY’07-FY’12”
D i s c u s s i o nLED luminaires offer potential energy savings in outdoor lighting while maintaining or improving lighting performance. The LED luminaires used in this particular study each drew 43 watts lesspower than the 121 watt HPS luminaires they replaced (100-watt nominal lamp), providing approximately 36% percent electrical savings. If the same savings could be achieved with 1/2 of the estimated electrical usage for roadway lighting in PG&E’s service territory, the resulting savings would be over 150 GWh.
The HPS luminaires used in this study had an estimated maintained efficacy of roughly 60 lumensper watt, based on the rated mean lamp lumens (8550 lumens), average cobra-head downwardefficiency (85%28 ), and measured power usage (121 watts). While the LED luminaires used in thisstudy had an efficacy of 57.5 lumens per watt, slightly less than the HPS luminaires, they enhancedlighting quality such that sufficient lighting performance could be achieved with reduced (photopic)lumen output, and therefore reduced power. There is also potential for further savings as LEDsbecome more efficacious. In addition, the use of LED light sources will allow for advancedoperating procedures such as bi-level operation or dimming in accordance with prescribedconditions.
The LED luminaires provided sufficient illumination to meet the City of Oakland’s street lighting requirements, and proved to be a practicable replacement for the 100 watt HPS luminaires. TheCity of Oakland standards for new residential installations require an average photopic illuminanceof greater than 0.4 footcandles and max to min uniformity ratio of less than 6:1. These standards were generally met by the LED luminaires, with the exception of the uniformity ratio at the largestspacing. It should be noted that these standards apply to new, residential installations, which may not be the same as those that applied at the time that the poles were installed. The full standardsfor new street lighting installations are available at http://www.oaklandpw.com/Asset550.aspx.
While the LED luminaires had decreased average photopic illuminance, this does not necessarily denote inferior light performance. This is because the lighting distribution of HPS luminaires issuch that they must over-light the area directly below (creating ‘hot spots’) in order to maintainminimum levels further away. Indeed, compared to the HPS luminaires, the LED luminaires
maintained minimum photopic light levels across all spacings, while reducing uniformity ratios (i.e.,increasing overall uniformity).
Human perception of light follows two distinct spectral response curves, depending on the lightlevel. The spectral response curve that dominates during typical daytime conditions is the photopicresponse curve, and results from the “cones” in human eyes. During very low light conditions,perception follows the scotopic response curve, which in contrast results from the “rods” in thehuman eye. The peak spectral luminous efficacy of the scotopic response curve (1700 lumens per watt, at 507 nanometers) is significantly greater than that of the photopic response curve (683lumens per watt, at 555 nanometers).
Traditionally, light levels have only been measured in accordance with the photopic response curve.In recent years however, interest has grown in scotopic light due to the human eye’s ability to
perceive objects more clearly from sources with enhanced scotopic quality, particularly at night. Inthis study light levels were measured according to both the photopic and scotopic spectral responsecurves, resulting in two sets of values: ‘photopic illuminance’ and ‘scotopic illuminance’.
28 Lighting Research Center (2004). “Parking Lot and Area Luminaires.” National Lighting ProductInformation Program Specifier Reports, Vol 9, Num 1.
The relative importance of scotopic illuminance and photopic illuminance at low light levels arestill uncertain.29 However, it is reasonable to assume that better lighting performance will result if photopic illuminance is maintained while scotopic illuminance is increased. In this study minimumphotopic levels were maintained, as mentioned above, and scotopic illuminance levels were eithermaintained or increased.
Despite the electrical savings, the present high upfront cost of LED street lighting luminaires may be a barrier to their current adoption. In choosing between an HPS or LED luminaire for new poles, the simple payback of the LED luminaire in this particular study would be on the order of 15 years. Under a scenario in which the customer had the option to replace a fully operational HPSluminaire with a new LED luminaire, the simple payback would be on the order of 26 years. Tomeet a simple payback of 2 years or less, the cost of an LED luminaire would need to be on theorder of $250 in the new construction scenario (not including installation costs, which are assumedto be the same for both LED and HPS luminaires). To meet a simple payback period of 5 years orless, the LED luminaire cost would need to be near $350. Due to installation costs in the givenretrofit scenario, it would be difficult for the LED luminaire to meet a 2 year simple payback period, and the price would have to be below $100 to meet a 5 year simple payback.
However as previously noted, these simple paybacks are sensitive to the maintenance costs
associated in specific circumstances. Group replacement procedures for HPS lamps have thepotential to reduce maintenance costs by replacing lamps slightly before failure, because the largestmaintenance expense is for labor. This would result in a less favorable comparative economicperformance for the LED luminaires. In addition, with the rapid advancements in LED efficacy and a reduction in the cost of semi-conductors, the payback of any LED luminaire installation canbe expected to improve in the future. Various incentive programs could also help bring the pricedown to this level for consumers even sooner.
PG&E uses this and other Emerging Technologies assessments to support development of potential incentives for emerging energy efficient solutions. Because the performance and quality of the LED fixtures are critical to the long-term delivery of energy savings, it is important thatincentive programs include quality control mechanisms. Incentive programs should includeperformance standards for qualifying products that include minimum criteria for warranty, efficacy,
light distribution, and other important criteria.
29 For more information, see mesopic results and discussion in Appendices A1 and A6.
C o n c l u s i o nLED street lighting has great potential for energy savings. While this demonstration providesfurther evidence of the improvements in performance of LED luminaires, the particulars of costsand savings for this demonstration show economics that are still at the outskirts of acceptability forthe majority of commercial customers. Performance of the LED luminaires combined withgrowing industry acceptance of their higher performance vs. high pressure sodium luminaires may provide early adopters the impetus to invest in the emerging technology. Utility or governmentincentive programs could also help to tip the scale towards greater adoption of LED luminaires forstreetlight applications by reducing the initial investment. These utility incentive programs shouldrequire minimum performance standards for qualifying products in order to ensure long-termenergy savings.
A p p e n d i x A : P h a s e 2 M o n i t o r i n g D a t a
A P P E N D I X A 1 : S C O T O P I C A N D M E S O P I C I L L U M I N A N C E L E V E L S
Although it is well established that the scotopic response curve dominates at very low light levels,the extent to which the rods influence our vision at mid-to-low light levels (the ‘mesopic’ range)remains a matter of debate in the lighting community. This is of significant import for roadway lighting, where levels commonly lie within the mesopic range. As a result, one of the competing models was used to calculate ‘mesopic illuminance’ levels despite the controversy.
The model used to calculate mesopic illuminance in this study is the Mesopic Optimization of Visual Efficiency (MOVE) model. The MOVE model is a performance-based model developed atthe Lighting Laboratory at the Helsinki University of Technology for the European Community. It was developed using the results of vision experiments which evaluated subjects’ ability to complete various tasks required for night-time driving.
The MOVE model uses photopic and scotopic luminance values to calculate mesopic luminance
values. The photopic and scotopic illuminance data recorded during the course of this assessment were converted into luminance, assuming that the roadway was a lambertian reflective surface witha reflectance value of 0.07. The conversion formula is as follows: L (luminance) = E (illuminance) *Ρ (reflectance of the surface) / Π. The resulting photopic and scotopic luminance values werethen used to calculate mesopic luminance values, which were then converted to mesopicilluminance values by the same formula.
Mesopically, the LED luminaires maintained or increased minimum light levels and maintained ordecreased uniformity ratios across all spacings compared to the HPS luminaires. With the LEDluminaires, average mesopic illuminance was slightly decreased across the entire test area, resulting from a significant decrease in the 110’ spacing, a slight decrease in the 120’ spacing, and a slightincrease in the 165’ spacing.
PACIFIC NORTHWEST NATIONAL LABORATORY LED STREETLIGHT
QUESTIONNAIREJOB # 320-341
FINAL
UFT N=60
Hello, I'm __________ from FMMA, a public opinion research company. We're conducting ashort public opinion survey about the new streetlights the City of Oakland installed in yourneighborhood this past October. I am not trying to sell you anything and I will not ask youfor a donation or contribution of any kind. May I please briefly speak about these
streetlights with the adult in the household who is 18 years of age or older and that mostrecent celebrated a birthday? (IF NOT AVAILABLE, ASK:) “May I speak to another adultin the household about these streetlights?” (VERIFY THAT THE PERSON LIVES AT THEADDRESS LISTED; OTHERWISE, ASK TO SPEAK TO SOMEONE THAT LIVES AT THEADDRESS LISTED AND RESTATE THE INTRODUCTION.)
1. Have you noticed that new streetlights were installed in your neighborhood this pastOctober?
No ------------------------------------ (SKIP TO Q11) 67%
(DON'T KNOW/NA) ---------------(SKIP TO Q11) 0%
(ASK Q2-Q10 ONLY IF YES IN Q1)
2. Do you feel that the new streetlights installed this past October have improved or notimproved visibility for you as a driver? (IF IMPROVED/NOT IMPROVED, ASK:) "Is thatstrongly or just somewhat?"
3. Do you feel that the new streetlights installed this past October have improved or notimproved visibility for you as a pedestrian? (IF IMPROVED/NOT IMPROVED, ASK:) "Isthat strongly or just somewhat?"
4. Do you feel that the new streetlights installed this past October have made it easier or moredifficult to recognize people at night under the streetlights? (IF EASIER/MOREDIFFICULT, ASK:) "Is that much easier/more difficult or just somewhat easier/more
difficult?"
Much easier --------------------------------------------- 50%
5. Do you feel that the new streetlights installed this past October create less glare or moreglare? (IF MORE/LESS, ASK:) "Is that much or just somewhat less/more glare?"
Much less glare----------------------------------------- 25%
Somewhat less glare---------------------------------- 25%
Somewhat more glare ----------------------------------5%
Much more glare -------------------------------------- 10%
6. Do you feel that the new streetlights installed this past October give off the right amount oflight or are they too bright or too dim? (IF TOO BRIGHT/DIM, ASK:) "Is that much or justsomewhat too bright/dim?"
Right amount of light ---------------------------------- 80%
Much too bright ------------------------------------------0%
Somewhat too bright ------------------------------------0%
7. Do you feel that the new streetlights installed this past October create fewer or moreshadows? (IF FEWER/MORE, ASK:) "Is that many or just somewhat fewer/more?"
Many fewer ------------------------------------------------0%
8. Next, I want to read you some specific ways that the new streetlights installed this pastOctober may have affected different aspects of your neighborhood. In each case, pleasetell me whether you think the new streetlights have improved or not improved each aspect.(IF IMPROVED/NOT IMPROVED, ASK:) "Is that strongly or just somewhat?"
(DON’TS.W. STR. READ) (DON'T
STR. S.W. NOT NOT NO READ)IMP. IMP. IMP. IMP. CHANG DK/NA
9. When all things are considered, do you prefer the new streetlights that were installed thispast October or do you prefer the old streetlights they replaced? (IF PREFER THEOLD/NEW TYPE OF STREETLIGHT, ASK:) "Do you strongly or just somewhat prefer thattype of streetlight?"
Strongly prefer new streetlights--------------------- 60%
Somewhat prefer new streetlights ----------------- 10%
Somewhat prefer old streetlights------------------- 15%
Strongly prefer old streetlights ------------------------0%
Less glare/softer light/does not flicker---------------------------------------------------- 21%
Less energy/servicing --------------------------------------------------------------------------7%
Improved appearance of neighborhood ---------------------------------------------------7%
b. Old streetlights
Old visibility was better----------------------------------------------------------------------- 33%Old was brighter ------------------------------------------------------------------------------- 33%
New ones not changed/costing more money ------------------------------------------ 33%
THESE QUESTIONS ARE FOR CLASSIFICATION PURPOSES ONLY.
11. Do you have any children under the age of 18 living at home?