22
28-29 June 2018 Emerging Trends on Demand & Mode Choice – Belt & Road Initiative (BRI) and Indian Ocean Rim Association (IORA) Nora Nezamuddin
28-29 June 2018
Emerging Trends on Demand & Mode Choice –Belt & Road Initiative (BRI) and Indian Ocean Rim Association (IORA)
Nora Nezamuddin
PPT Presentation
1- KEY POINTS
2- CURRENT TREND
3- EFFECTS OF THE BELT & ROAD INITIATIVE + INDIAN OCEAN RIM ASSOCIATION
4- IMPLICATIONS
5- CONCLUSIONS
3
- The change in economic production to higher value-added goods, population growth, and economic growth in developing countries (China, India, and KSA) is having a number of implications on modal choice and fuel demand.
- Long-term objectives to shift from road to rail can be aided by investment in infrastructure and economic policies that showcase rail as an economically viable option.
- In the short-term, relieving urban air pollution can be done via efficiencies in vehicles and logistics.
Key Points
4
Changing the energy consumption demand and freight demand in ‘fast growing’ economics are caused by:
1) Growth in population
2) Changing production towards ‘higher’ value-added goods has lead to an
2.1) Increase in per capita income (and more demand)
2.2) Leading to demand for higher transport speeds and accessibility
3) Investment in national infrastructure and global connectivity (Belt & Road Initiative + Indian Ocean Rim Association)
4) Advancement in Technologies
Current Trends in Fast Growing Economies
5
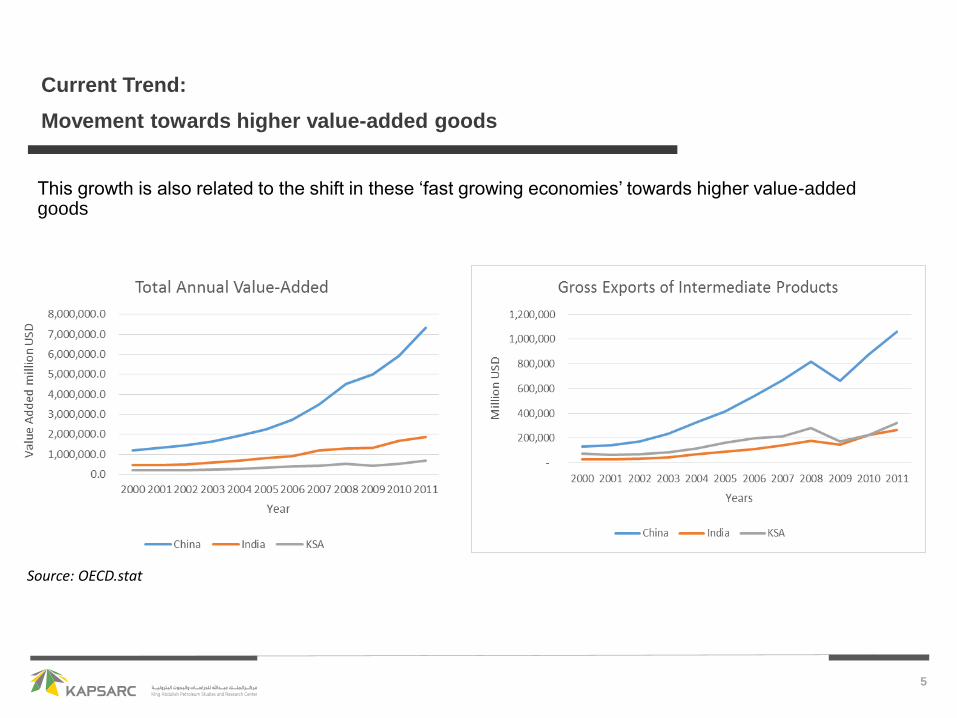
This growth is also related to the shift in these ‘fast growing economies’ towards higher value-added goods
Current Trend:
Movement towards higher value-added goods
Source: OECD.stat
6
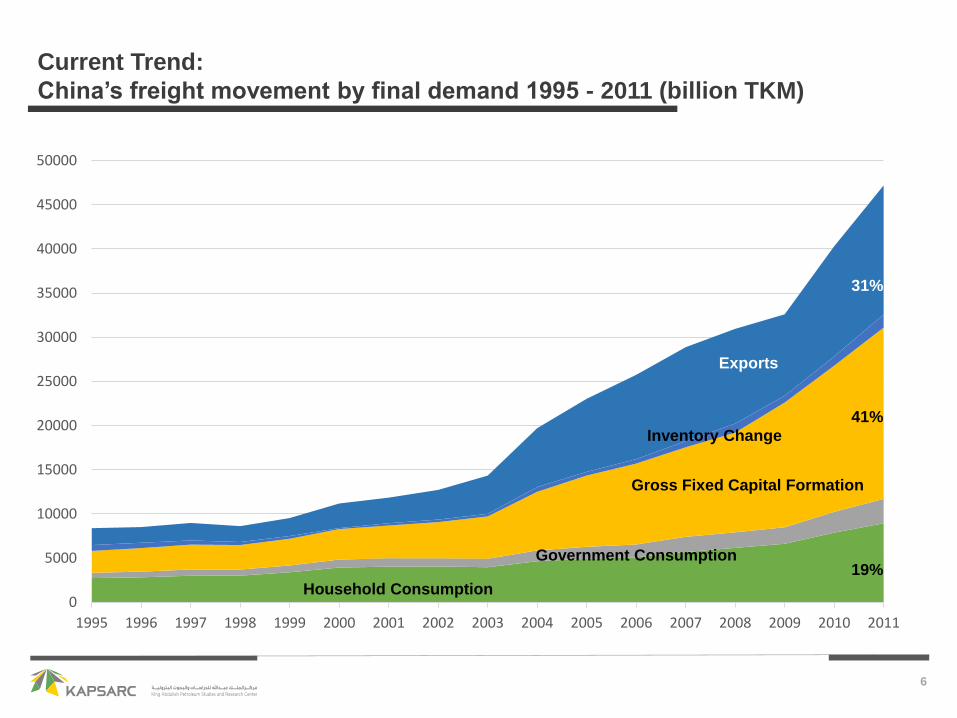
Current Trend:
China’s freight movement by final demand 1995 - 2011 (billion TKM)
66%
0
5000
10000
15000
20000
25000
30000
35000
40000
45000
50000
1995 1996 1997 1998 1999 2000 2001 2002 2003 2004 2005 2006 2007 2008 2009 2010 2011
19%
41%
31%
Household Consumption
Gross Fixed Capital Formation
Exports
Government Consumption
Inventory Change
7
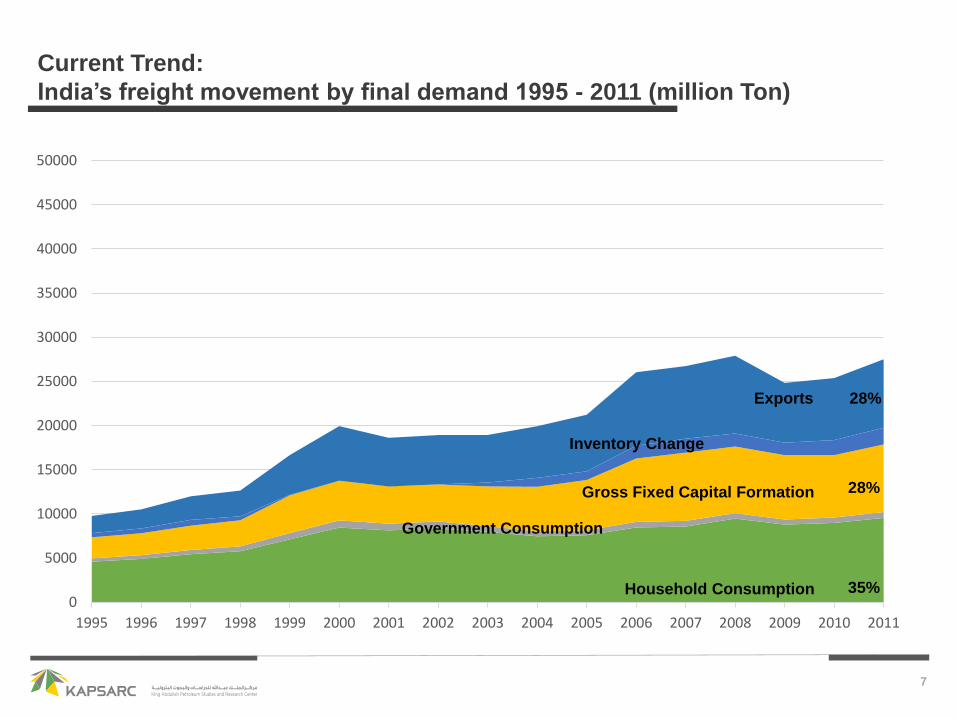
Current Trend:
India’s freight movement by final demand 1995 - 2011 (million Ton)
66%
0
5000
10000
15000
20000
25000
30000
35000
40000
45000
50000
1995 1996 1997 1998 1999 2000 2001 2002 2003 2004 2005 2006 2007 2008 2009 2010 2011
35%
28%
28%
Household Consumption
Gross Fixed Capital Formation
Exports
Government Consumption
Inventory Change
8
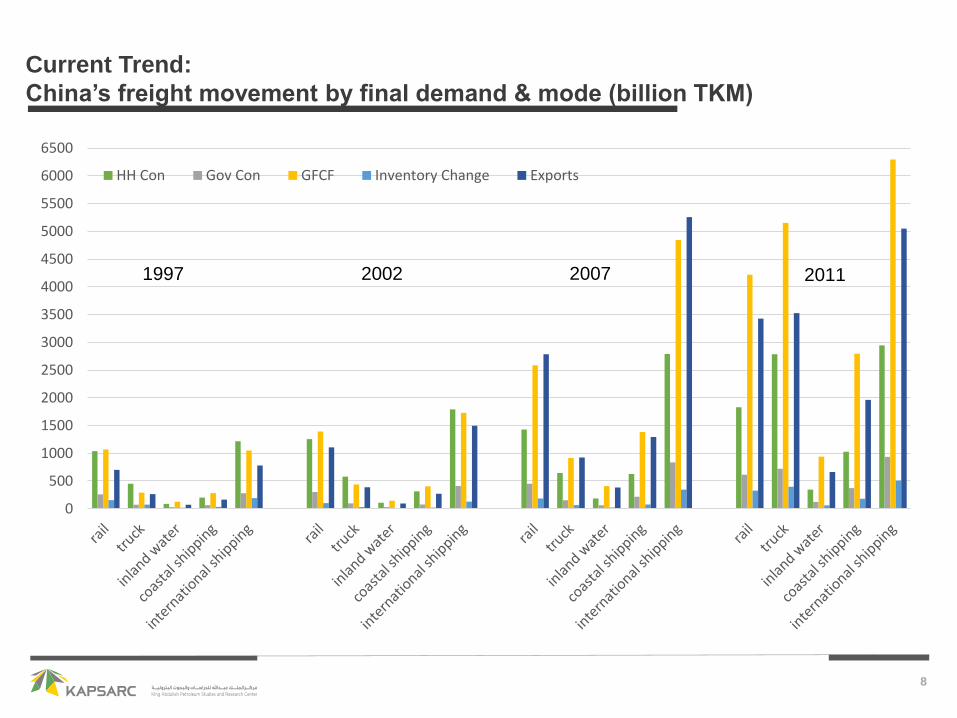
Current Trend:
China’s freight movement by final demand & mode (billion TKM)
66%
0
500
1000
1500
2000
2500
3000
3500
4000
4500
5000
5500
6000
6500
HH Con Gov Con GFCF Inventory Change Exports
1997 2002 2007 2011
9
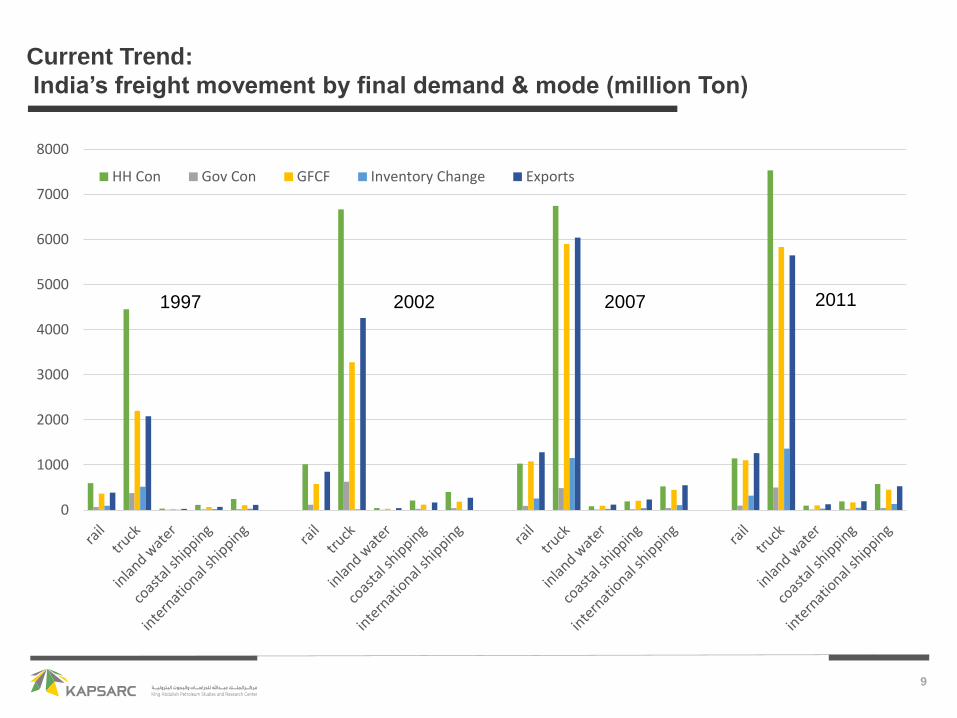
Current Trend:
India’s freight movement by final demand & mode (million Ton)
66%
0
1000
2000
3000
4000
5000
6000
7000
8000
HH Con Gov Con GFCF Inventory Change Exports
1997 2002 2007 2011
10
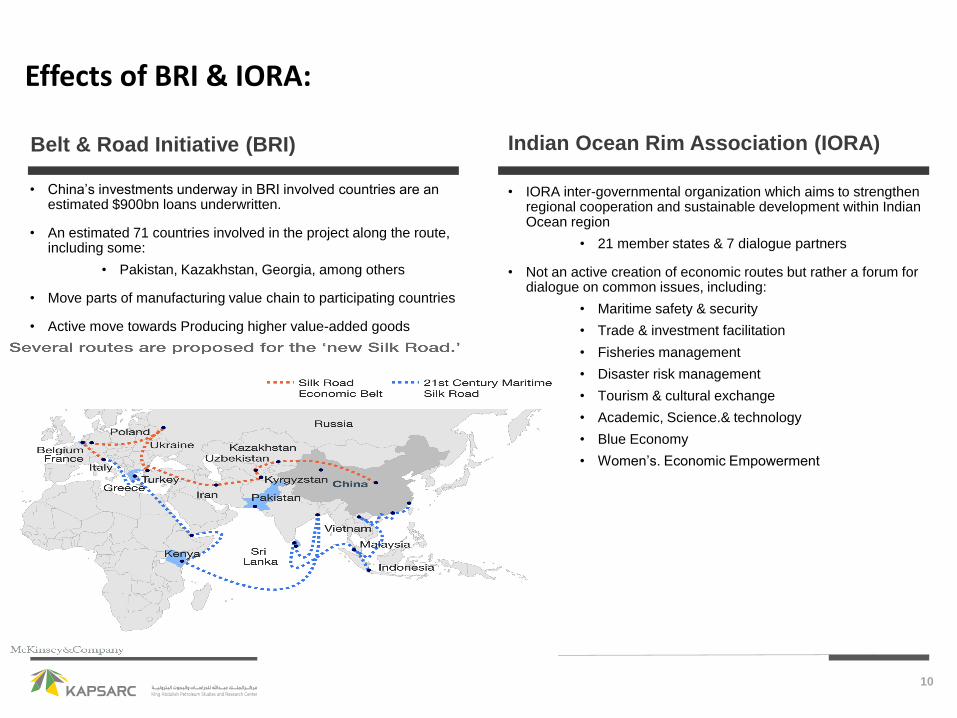
• China’s investments underway in BRI involved countries are an estimated $900bn loans underwritten.
• An estimated 71 countries involved in the project along the route, including some:
• Pakistan, Kazakhstan, Georgia, among others
• Move parts of manufacturing value chain to participating countries
• Active move towards Producing higher value-added goods
Indian Ocean Rim Association (IORA)Belt & Road Initiative (BRI)
• IORA inter-governmental organization which aims to strengthen regional cooperation and sustainable development within Indian Ocean region
• 21 member states & 7 dialogue partners
• Not an active creation of economic routes but rather a forum for dialogue on common issues, including:
• Maritime safety & security
• Trade & investment facilitation
• Fisheries management
• Disaster risk management
• Tourism & cultural exchange
• Academic, Science.& technology
• Blue Economy
• Women’s. Economic Empowerment
Effects of BRI & IORA:
11
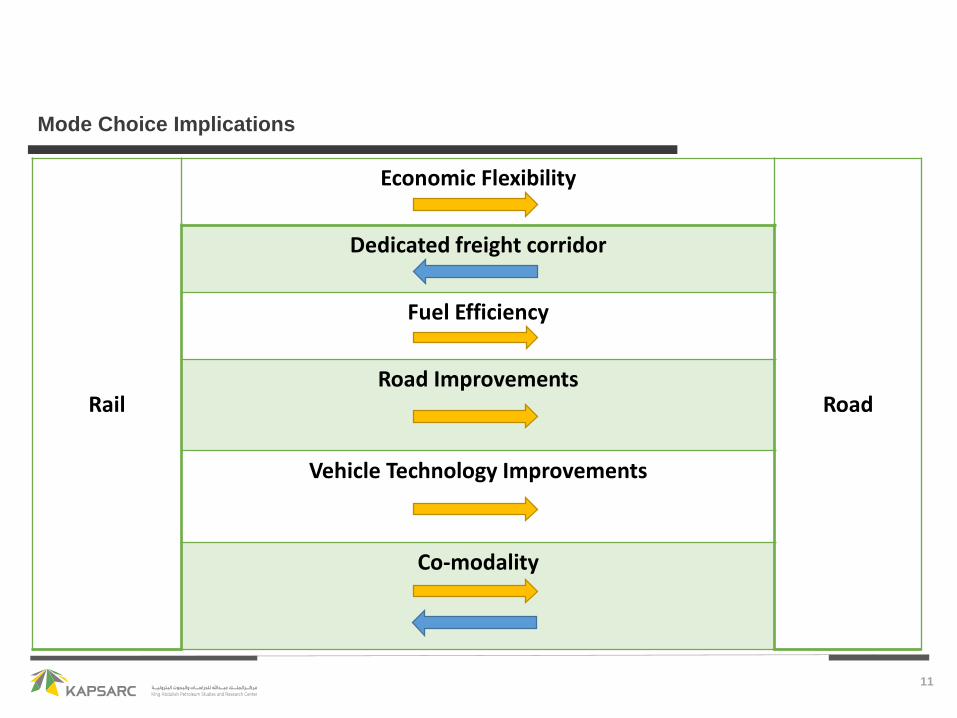
Mode Choice Implications
Rail
Economic Flexibility
Road
Dedicated freight corridor
Fuel Efficiency
Road Improvements
Vehicle Technology Improvements
Co-modality
12
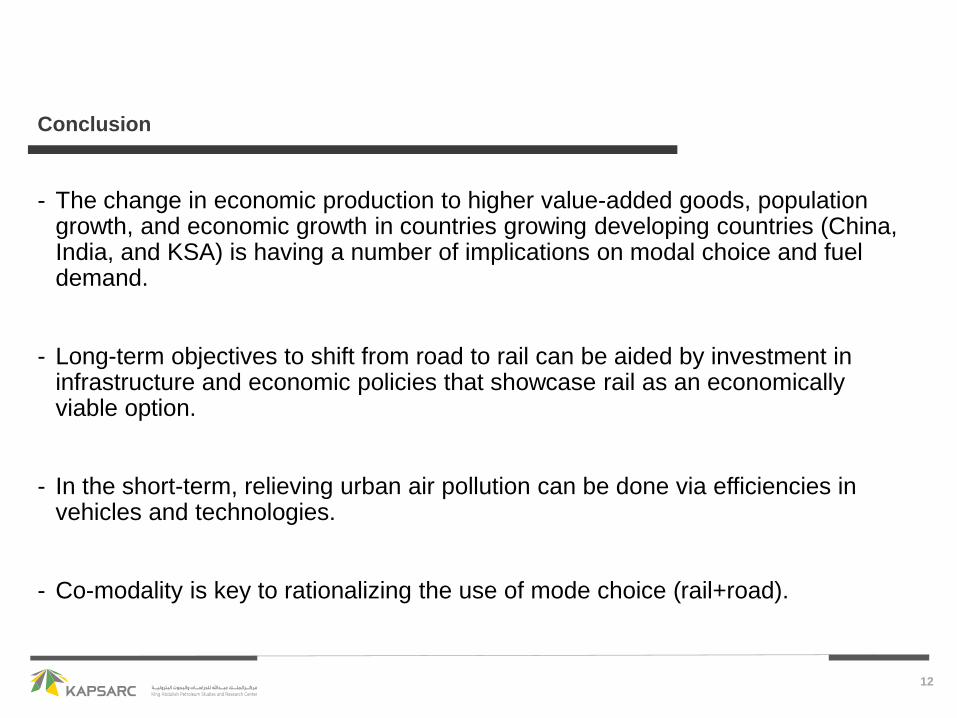
Conclusion
- The change in economic production to higher value-added goods, population growth, and economic growth in countries growing developing countries (China, India, and KSA) is having a number of implications on modal choice and fuel demand.
- Long-term objectives to shift from road to rail can be aided by investment in infrastructure and economic policies that showcase rail as an economically viable option.
- In the short-term, relieving urban air pollution can be done via efficiencies in vehicles and technologies.
- Co-modality is key to rationalizing the use of mode choice (rail+road).
13
Given the difference in regulations and legislation in countries, can China’s BRI create an environment for co-modality?
Will new technologies in road transport continue the reverse modal shift in international trade and local movement?
How will the economic repositioning of Chinese and Indian firms have an effect on global and national movements of goods and will it favor road even more?
Questions
PPT Presentation
Appendix
16
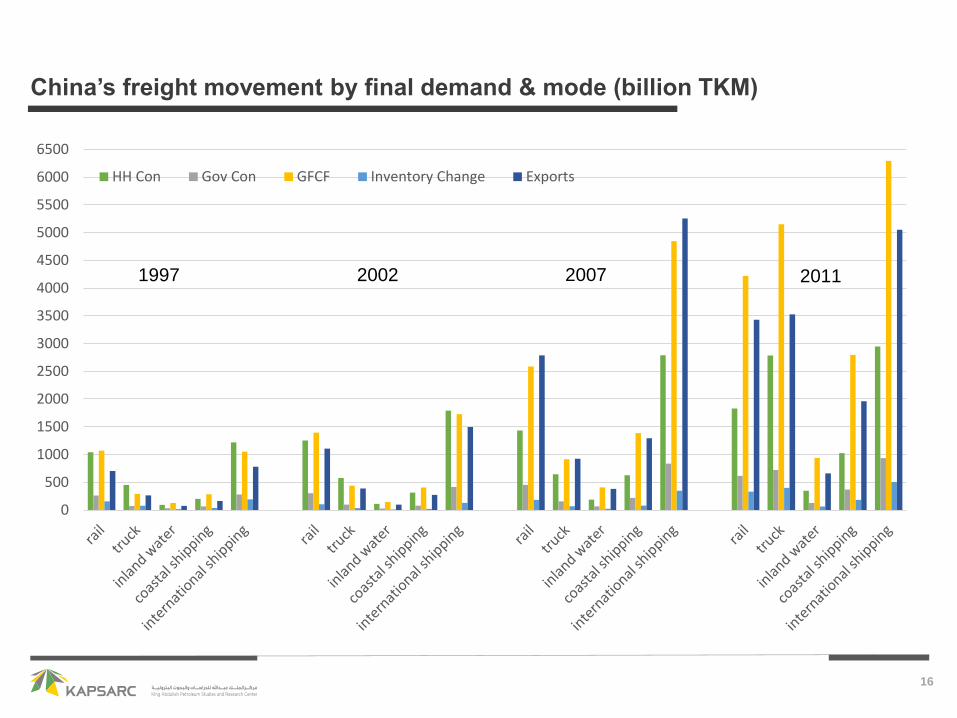
China’s freight movement by final demand & mode (billion TKM)
66%
0
500
1000
1500
2000
2500
3000
3500
4000
4500
5000
5500
6000
6500
HH Con Gov Con GFCF Inventory Change Exports
1997 2002 2007 2011
17
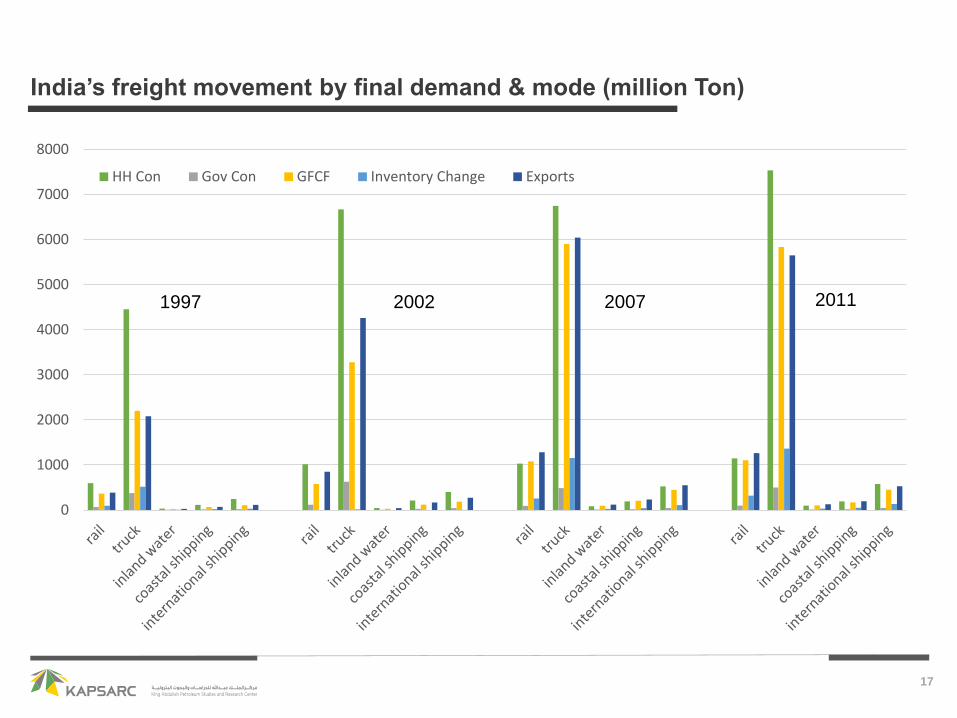
India’s freight movement by final demand & mode (million Ton)
66%
0
1000
2000
3000
4000
5000
6000
7000
8000
HH Con Gov Con GFCF Inventory Change Exports
1997 2002 2007 2011
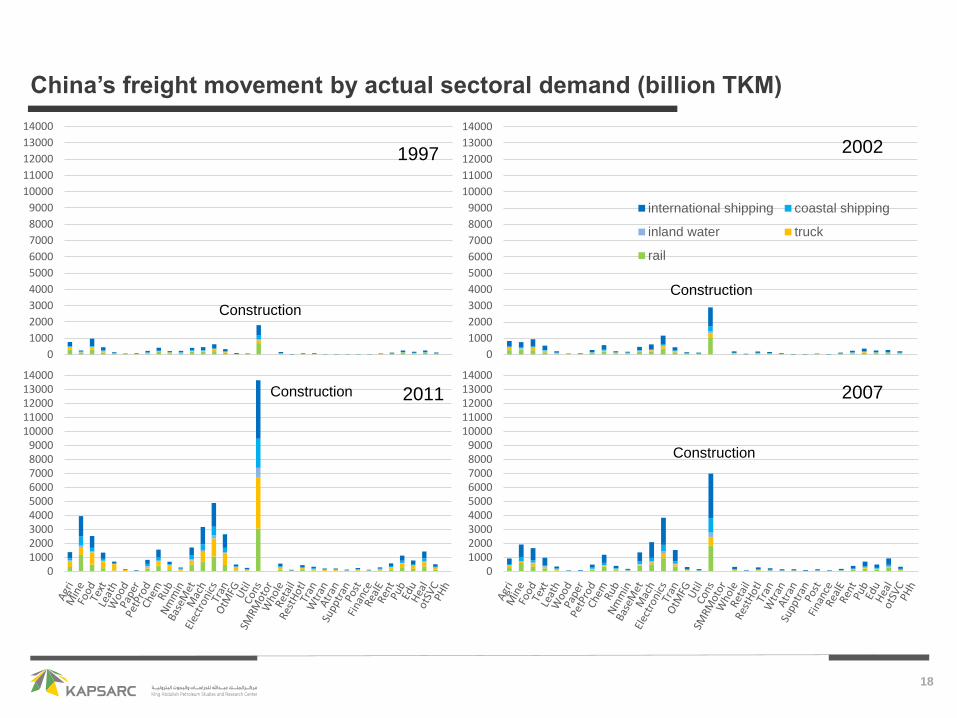
18
China’s freight movement by actual sectoral demand (billion TKM)
66%
0
1000
2000
3000
4000
5000
6000
7000
8000
9000
10000
11000
12000
13000
14000
1997
Construction
0
1000
2000
3000
4000
5000
6000
7000
8000
9000
10000
11000
12000
13000
14000
international shipping coastal shipping
inland water truck
rail
2002
Construction
0100020003000400050006000700080009000
1000011000120001300014000
2007
Construction
0100020003000400050006000700080009000
1000011000120001300014000
2011Construction
19
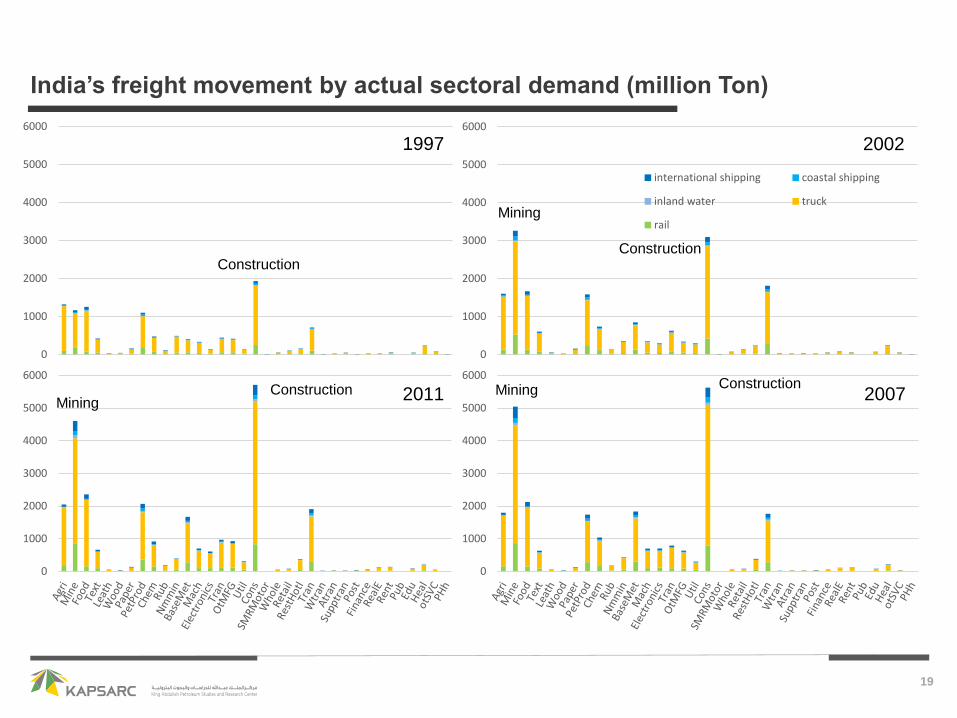
India’s freight movement by actual sectoral demand (million Ton)
66%
0
1000
2000
3000
4000
5000
6000
1997
Construction
0
1000
2000
3000
4000
5000
6000
international shipping coastal shipping
inland water truck
rail
2002
Construction
Mining
0
1000
2000
3000
4000
5000
6000
2007ConstructionMining
0
1000
2000
3000
4000
5000
6000
2011ConstructionMining
20
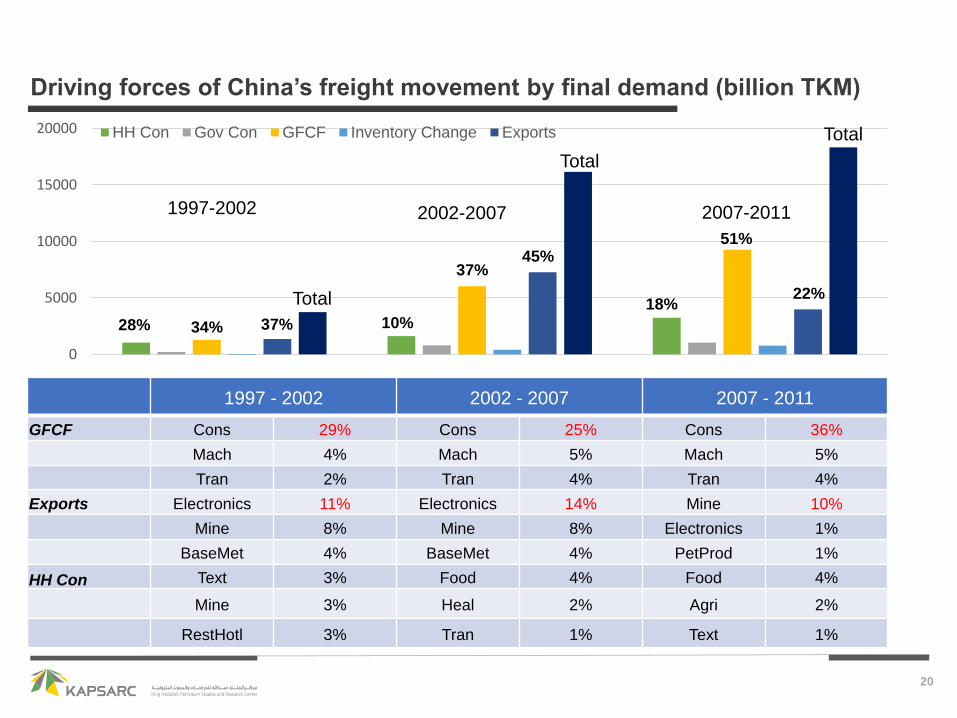
Driving forces of China’s freight movement by final demand (billion TKM)
66%
0
5000
10000
15000
20000 HH Con Gov Con GFCF Inventory Change Exports Total
Total
51%
22%18%
45%
37%
37%
34% 10%28%
1997-2002 2002-2007 2007-2011
Total
1997 - 2002 2002 - 2007 2007 - 2011
GFCF Cons 29% Cons 25% Cons 36%
Mach 4% Mach 5% Mach 5%
Tran 2% Tran 4% Tran 4%
Exports Electronics 11% Electronics 14% Mine 10%
Mine 8% Mine 8% Electronics 1%
BaseMet 4% BaseMet 4% PetProd 1%
HH Con Text 3% Food 4% Food 4%
Mine 3% Heal 2% Agri 2%
RestHotl 3% Tran 1% Text 1%
21
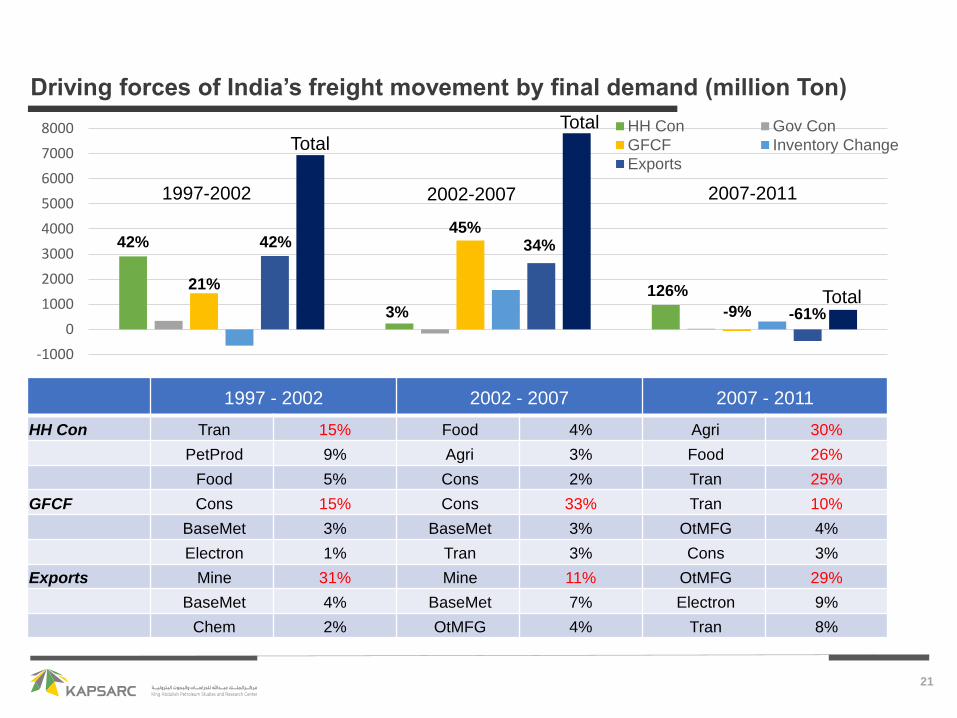
Driving forces of India’s freight movement by final demand (million Ton)
66%
-1000
0
1000
2000
3000
4000
5000
6000
7000
8000 HH Con Gov Con
GFCF Inventory Change
Exports
Total
Total
-9% -61%
126%
34%42%45%
21%
3%
42%
1997-2002 2002-2007 2007-2011
Total
1997 - 2002 2002 - 2007 2007 - 2011
HH Con Tran 15% Food 4% Agri 30%
PetProd 9% Agri 3% Food 26%
Food 5% Cons 2% Tran 25%
GFCF Cons 15% Cons 33% Tran 10%
BaseMet 3% BaseMet 3% OtMFG 4%
Electron 1% Tran 3% Cons 3%
Exports Mine 31% Mine 11% OtMFG 29%
BaseMet 4% BaseMet 7% Electron 9%
Chem 2% OtMFG 4% Tran 8%
22
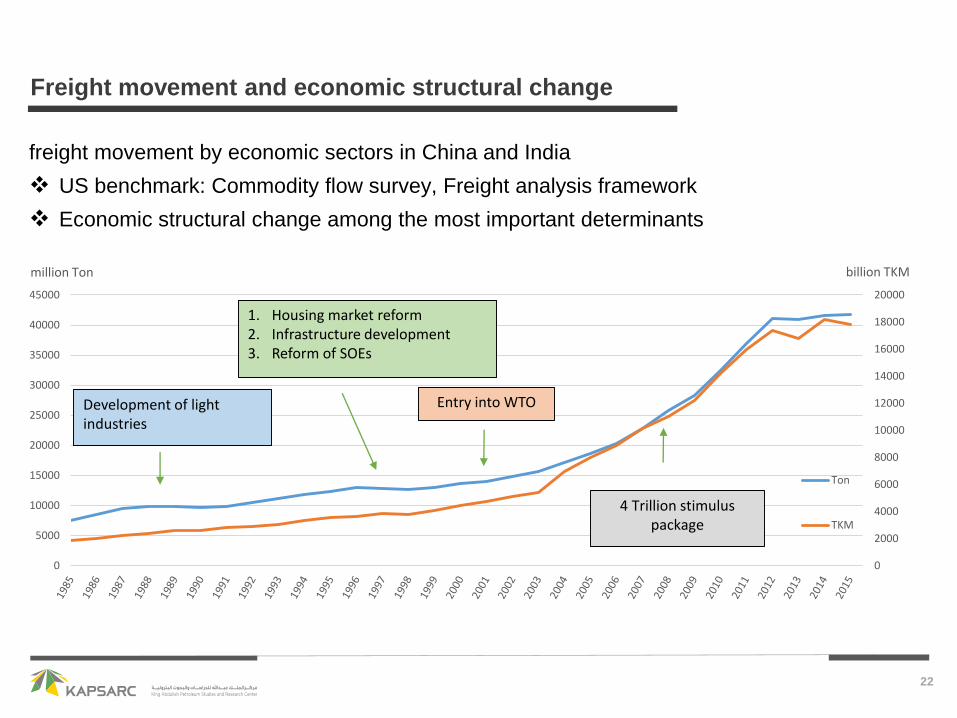
Freight movement and economic structural change
66%
freight movement by economic sectors in China and India
US benchmark: Commodity flow survey, Freight analysis framework
Economic structural change among the most important determinants
0
2000
4000
6000
8000
10000
12000
14000
16000
18000
20000
0
5000
10000
15000
20000
25000
30000
35000
40000
45000
Ton
TKM
Development of light industries
1. Housing market reform2. Infrastructure development3. Reform of SOEs
Entry into WTO
4 Trillion stimulus package
million Ton billion TKM


![Chapter 33 - Aggregate demand and aggregate supply [Compatibility Mode].pdf](https://static.documents.pub/doc/80x56/577cc4821a28aba711998c81/chapter-33-aggregate-demand-and-aggregate-supply-compatibility-modepdf.jpg)


