33
Emissions Monitoring Report Date of publication: October 2021
Emissions Monitoring Report
Date of publication: October 2021
Emissions Monitoring Report

2 Emissions Monitoring Report
Executive summary 3
Introduction 6
UKCS upstream oil and gas emissions 7
Historic industry emissions: 1990 to 2018 7
2018 emission sources and gases breakdown 8
Recent industry emissions: 2018 to present 9
2020 asset level emissions 11
Current progress against emission reduction targets 12
A Note on 2021 year-to-date emissions 13
Methane emissions 14
Methane intensity 15
Baseline projection of UK upstream oil and gas emissions 16
Emissions abatement potential 18
Electrification of oil and gas infrastructure 19
Flaring and venting abatement 21
Electrification and flaring abatement estimate 22
Emissions performance benchmarking 24
Carbon intensity performance metric 24
International benchmarking 25
UK asset level benchmarking 26
Flaring and venting activity 2021 update 28
Flaring 28
Venting 30
Conclusion and next steps 31
Contents

Executive summary
The Oil and Gas Authority (OGA) is fully committed to supporting the UK in achieving its net zero emissions target and is working with government and industry on the vital role the oil and gas sector must play in the energy transition. The UK Continental Shelf (UKCS) is a critical energy resource that holds enormous potential to assist with the decarbonisation of the wider UK economy, and the OGA believes that the industry has the skills, infrastructure and capital necessary to help ensure that the net zero target is achieved.
In 2021, the OGA published its revised Strategy, which introduces a range of net zero obligations for the UK oil and gas industry, including stepping up efforts to reduce production emissions, support carbon capture and storage ('CCS') projects and unlock clean hydrogen production. Since then, OGA has also introduced a suite of new and updated guidance, including our Net Zero Stewardship Expectation and revised flaring and venting guidance, to support implementation of the Strategy.
In addition, the North Sea Transition Deal ('NSTD'), agreed between government and the oil and gas industry in March 2021, sets out an ambitious plan to transform the sector in preparation for a net zero future and catalyse growth throughout the UK economy. Specifically, the Deal includes targets for early reductions in greenhouse gas ('GHG') emissions from offshore production, of 10% by 2025, 25% by 2027, and 50% by 2030, against a 2018 baseline, to meet the aim of creating a net zero basin by 2050.
This OGA Emissions Monitoring Report, which will be updated annually, is part of the OGA’s efforts to monitor, benchmark and hold the industry to account on its progress towards net zero. The report brings together, for the first time in one place, data on UK upstream oil and gas industry overall emissions reductions, methane emissions, emissions abatement potential, emissions performance benchmarking, and flaring and venting activity.

4 Emissions Monitoring Report
The Report includes the following key findings:
• Overall upstream oil and gas GHG emissions fell by 11% between 2018 and 2020
• Two-thirds of offshore installations decreased their emissions between 2019 and 2020, by 36% on average
• Offshore flare volumes fell by 23% between 2019 and 2020 – offshore flaring in summer 2021 was at its lowest ever recorded level
• Flare volumes from onshore terminals fell by 33% between 2019 and 2020
• Methane emissions fell by 20% between 2019 and 2020, with industry having a methane intensity of 0.23%
• Since 2015, carbon intensity has fallen by 9% offshore and 11% in total (includes onshore terminals)
• Over 70% of industry emissions come from burning gas or diesel for fuel, but platform electrification offers abatement potential
• While UK produced gas has less than half the carbon footprint of imported LNG, across the board, the UK generally performs around the 50th percentile internationally for upstream carbon intensity and flaring intensity, showing there is room to improve much further and faster
5Emissions Monitoring Report
The significant fall in overall industry GHG emissions in 2020 was caused by a mixture of proactive emissions abatement initiatives, supported by the OGA's stewardship and regulatory approach, as well as a reduction in industry activity driven by the COVID-19 pandemic and a commodity price crash, and end-of-life shutdown for a handful of large emitters.
While the findings contained in this report are sensitive to underlying assumptions, and emissions may flatten over the short term before decreasing further, the early targets agreed in the NSTD appear to be well within industry’s reach.
The 2030 goal of halving emissions still requires urgent and drastic industry change, and the OGA considers that meeting the near-term 2025 and 2027 NSTD emissions targets is the absolute minimum that the industry must achieve. The sector must ensure recent reductions are sustained, and that OGA Strategy and associated guidance are implemented to ensure further and faster efforts to decarbonise in the 2020s and beyond. This is essential for the UK to realise the benefits of early abatement, and for industry if it is to maintain its social licence to operate.
The OGA will continue to monitor and steward industry’s performance closely through the annual Stewardship Survey, performance benchmarking and tier reviews, and continue to hold industry accountable for emissions reductions through our stewardship activities and regulatory approach.
In 2021 to date, OGA interventions have helped industry avoid producing 993,000 tonnes of lifetime CO2e – the same as taking more than 500,000 cars off the road for a year. With our updated suite of guidance, including the Net Zero Stewardship Expectation which obliges Licensees to demonstrate a firm commitment to reducing GHGs at every stage of a project’s lifecycle, the OGA will continue to both support and hold industry to account in reaching its target to become a net zero basin by 2050. This work will require a range of approaches, including through:
• Making tangible progress on platform electrification
• Reductions in emissions from flaring and venting, for example, through vapour recovery or cold flaring elimination, process improvement or more efficient operations
• Retrofitting platforms with more energy efficient equipment
• Progressing carbon capture and storage projects
• Integration with hydrogen
This publication marks another step on the industry’s net zero path, which will allow the OGA and industry to maintain a clear focus on emissions reductions, to ensure that the UK oil and gas industry plays its part in the energy transition and that its activities remain compatible with wider net zero goals.

6 Emissions Monitoring Report
About the data
The UK National Atmospheric Emissions Inventory ('NAEI') publishes annual UK GHG figures for all sectors of the UK economy. GHG emissions from the UK upstream oil and gas industry can be extracted from this dataset using relevant Intergovernmental Panel on Climate Change ('IPCC') categories (see Annex):
Emissions under these IPCC categories cover the following activities:
• All fuel and non-fuel combustion emissions from offshore facilities and onshore receiving terminals.
• Vented and unintentionally released gases (fugitives) to atmosphere from offshore facilities and onshore receiving terminals.
• Gas flared from mobile drilling rigs during the drilling of exploration and appraisal wells.
And the following GHGs:
• Carbon dioxide (CO2)
• Methane (CH4)
• Nitrous Oxide (N2O)
See Annex for GWP factors.
Introduction
From 1990 to 2018, UK territorial GHG emissions fell by 45%. Over the same timeframe, emissions associated with the UK upstream oil and gas production industry ('the industry' or 'the sector') rose to a peak of 29 Mt CO2e in 1996 before falling by 38% to a low of 18 Mt CO2e in 2014. Between 2014 and 2018, industry emissions increased by 6% to 19 Mt CO2e.
In 1990, the industry accounted for 2% of all UK territorial GHG emissions. This proportion rose to roughly 4% in 1995 and has stayed at that level since – emitting a similar amount of GHGs as the waste management sector.
In 2018 the upstream oil and gas industry emitted a similar amount of GHGs as the waste management sector.
Around 80% of UK total GHG emissions are carbon dioxide (CO2), with methane being the next highest at roughly 15% GHG in CO2 equivalent (CO2e) terms. This composition is broadly similar to emissions from the upstream oil and gas industry (88% and 10% respectively in 2018).
Figure 1: UK GHG emissions by sector, 1990 to 2018
Agriculture
Business
Energy Supply
Industrial processes
Land use, land use change and forestry
Public
Residential
Transport
Upstream Oil and Gas
Waste Management
Source: NAEI

7Emissions Monitoring Report
Historic industry emissions: 1990 to 2018
Historically, CO2 emissions have driven overall GHG emissions trends. Methane emissions have trended differently and fell by over half between 1990 to 2006. Since then, methane emissions have remained relatively constant at around 2 Mt CO2e per year.
The trend of total GHG emissions from the industry is broadly consistent with that of the the UK's oil and gas production, as higher levels of oil and gas production coincide with greater amounts of activity generating more emissions.
The period between 1993 and 2000 saw the construction of more new facilities, raising both production and emissions. When production from these and older installations started to fall from 2000 onwards, emissions also fell, but at a slower rate. This is because on an individual asset level, overall power demand and, therefore, emissions stay relatively stable, even as oil and gas production falls (see annex).
Figure 2: UK upstream oil and gas emissions, 1990 to 2018
UK upstream oil and gas emissions
Source: NAEI

8 Emissions Monitoring Report
2018 emission sources and gases breakdown
Carbon dioxide emissions comprised 88% of all industry GHG emissions in 2018, with three quarters of these originating from fuel combustion, mostly from offshore facilities.
The most recent data (2020) from the UK Department for Business, Energy and Industrial Strategy's ('BEIS's) Environmental Emissions and Monitoring System ('EEMS') show that out of 125 facilities on the UKCS, the majority were powered by gas supplemented with some diesel. Thirty-four facilities were powered fully by diesel fuel. With nearly 70% of industry emissions associated with on-site power generation, electrification of energy intensive equipment offshore and in terminals is a critical mechanism for emissions abatement.
The remainder of the CO2 emissions from the industry are due to flaring at production sites, terminals and from rigs testing exploration and appraisal wells. A very small amount of CO2 is vented from some production facilities.
Methane (CH4) emissions comprise around 10% of industry emissions on a CO2 equivalent basis. Roughly half of these are associated with venting of natural gas. Most of the remaining methane emissions come from flaring, due to combustion inefficiency or cold flaring, where gas passes through the flare without ignition.
Nitrous oxide (N2O) emissions make up 2% of UK upstream oil and gas industry emissions. Like CO2, N2O emissions from the upstream oil and gas industry result from combustion of a hydrocarbon-based fluid. 90% of N2O emissions are from fuel combustion with the remainder due to gas flaring.
In CO2e terms, the composition of these emissions sources has stayed relatively constant over time. Historically, fuel combustion, flaring and venting have accounted for roughly 70%, 25% and 5% of the total respectively.
Figure 3: 2018 UK upstream oil and gas emissions breakdown
Source: NAEI
9Emissions Monitoring Report
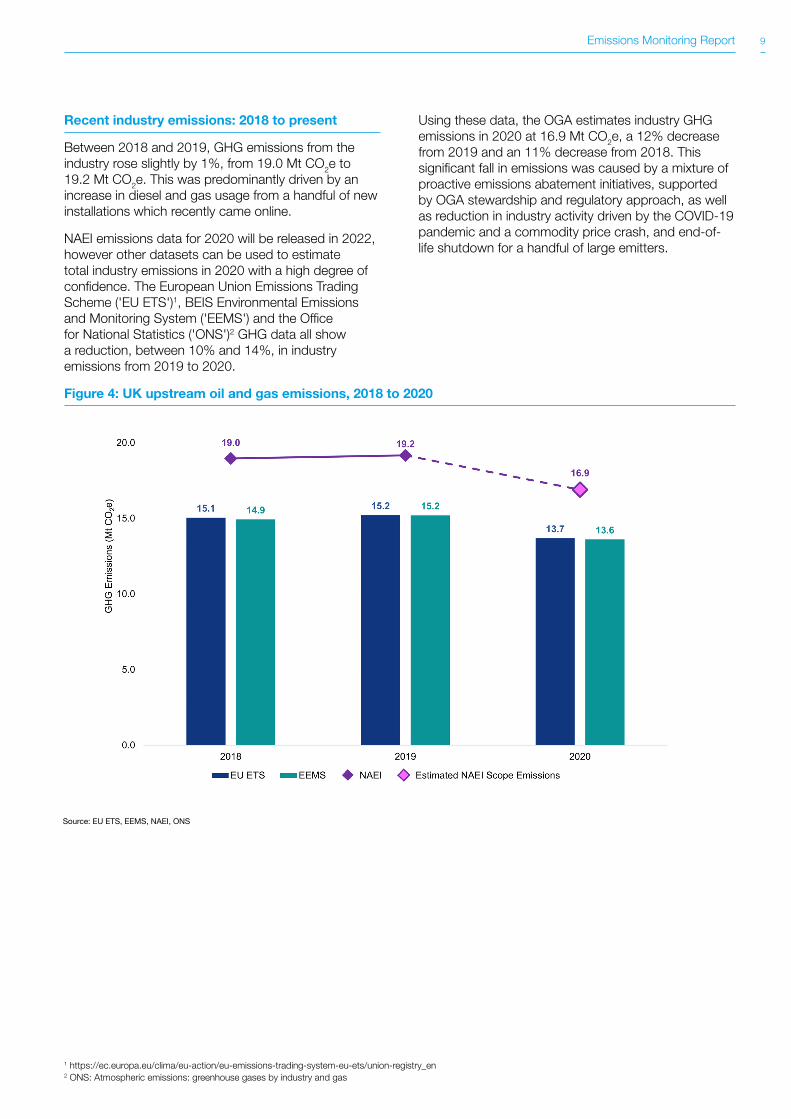
Recent industry emissions: 2018 to present
Between 2018 and 2019, GHG emissions from the industry rose slightly by 1%, from 19.0 Mt CO2e to 19.2 Mt CO2e. This was predominantly driven by an increase in diesel and gas usage from a handful of new installations which recently came online.
NAEI emissions data for 2020 will be released in 2022, however other datasets can be used to estimate total industry emissions in 2020 with a high degree of confidence. The European Union Emissions Trading Scheme ('EU ETS')1, BEIS Environmental Emissions and Monitoring System ('EEMS') and the Office for National Statistics ('ONS')2 GHG data all show a reduction, between 10% and 14%, in industry emissions from 2019 to 2020.
Using these data, the OGA estimates industry GHG emissions in 2020 at 16.9 Mt CO2e, a 12% decrease from 2019 and an 11% decrease from 2018. This significant fall in emissions was caused by a mixture of proactive emissions abatement initiatives, supported by OGA stewardship and regulatory approach, as well as reduction in industry activity driven by the COVID-19 pandemic and a commodity price crash, and end-of-life shutdown for a handful of large emitters.
Figure 4: UK upstream oil and gas emissions, 2018 to 2020
Source: EU ETS, EEMS, NAEI, ONS
1 https://ec.europa.eu/clima/eu-action/eu-emissions-trading-system-eu-ets/union-registry_en2 ONS: Atmospheric emissions: greenhouse gases by industry and gas
10 Emissions Monitoring Report
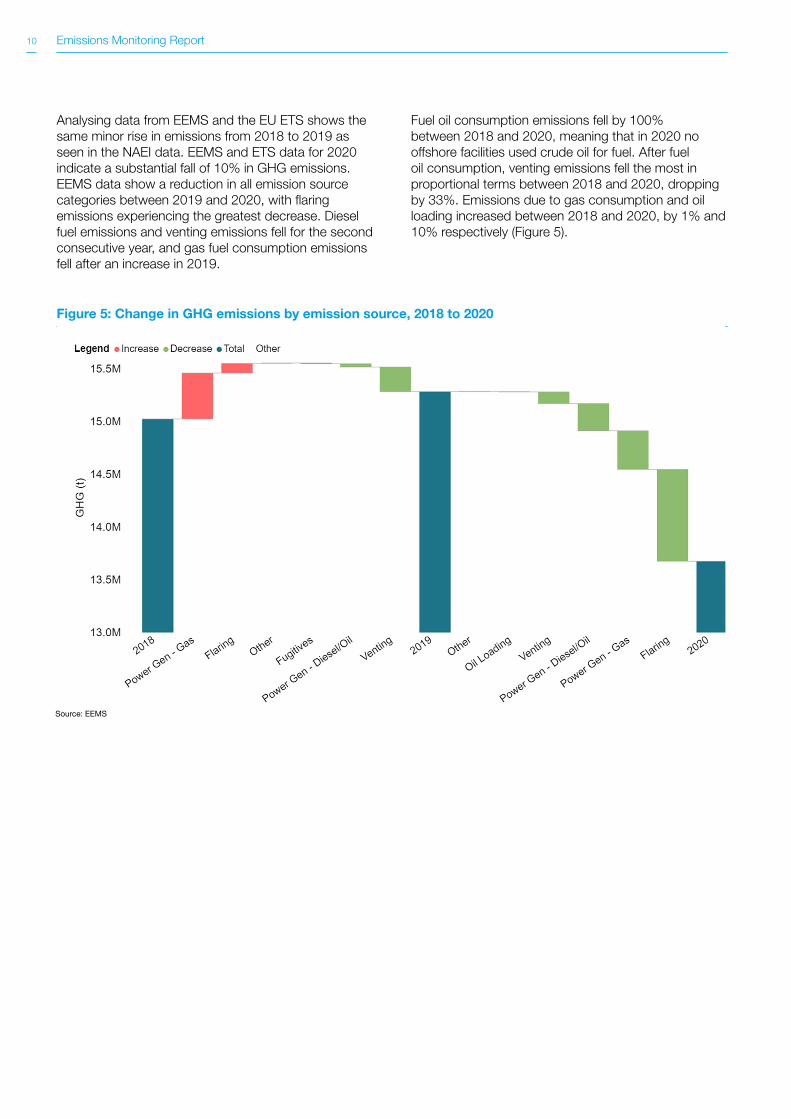
Analysing data from EEMS and the EU ETS shows the same minor rise in emissions from 2018 to 2019 as seen in the NAEI data. EEMS and ETS data for 2020 indicate a substantial fall of 10% in GHG emissions. EEMS data show a reduction in all emission source categories between 2019 and 2020, with flaring emissions experiencing the greatest decrease. Diesel fuel emissions and venting emissions fell for the second consecutive year, and gas fuel consumption emissions fell after an increase in 2019.
Fuel oil consumption emissions fell by 100% between 2018 and 2020, meaning that in 2020 no offshore facilities used crude oil for fuel. After fuel oil consumption, venting emissions fell the most in proportional terms between 2018 and 2020, dropping by 33%. Emissions due to gas consumption and oil loading increased between 2018 and 2020, by 1% and 10% respectively (Figure 5).
Figure 5: Change in GHG emissions by emission source, 2018 to 2020
Source: EEMS
11Emissions Monitoring Report
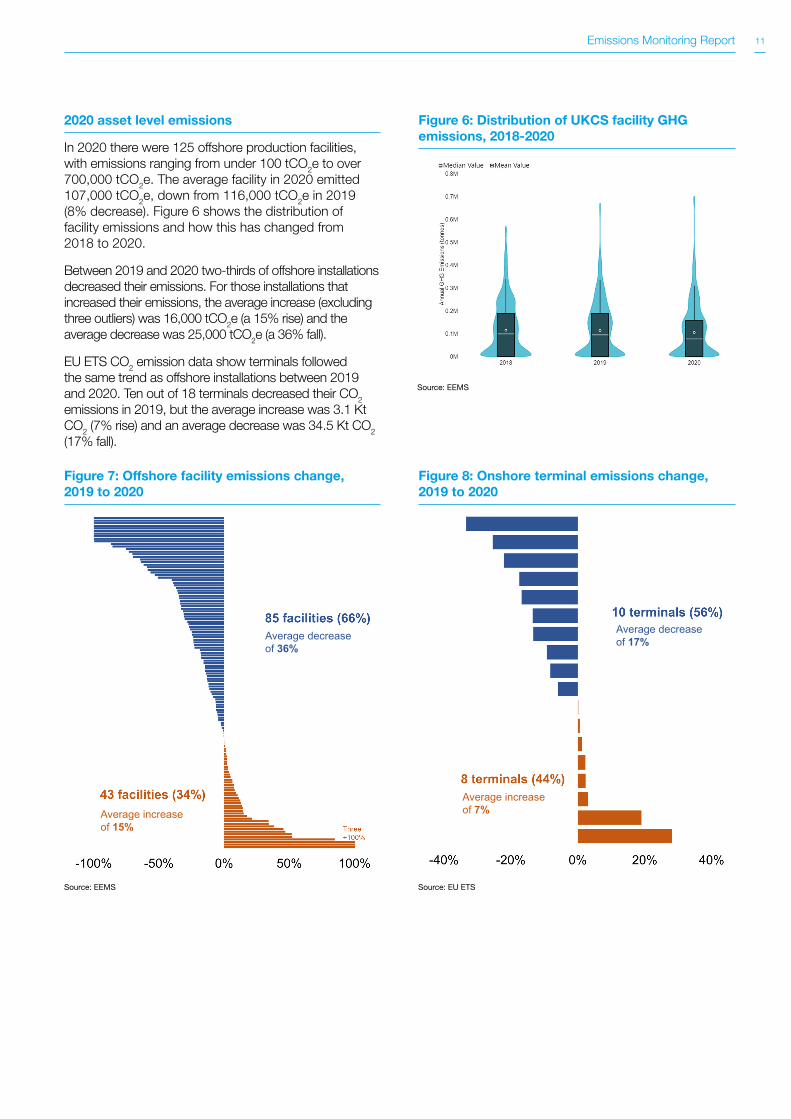
2020 asset level emissions
In 2020 there were 125 offshore production facilities, with emissions ranging from under 100 tCO2e to over 700,000 tCO2e. The average facility in 2020 emitted 107,000 tCO2e, down from 116,000 tCO2e in 2019 (8% decrease). Figure 6 shows the distribution of facility emissions and how this has changed from 2018 to 2020.
Between 2019 and 2020 two-thirds of offshore installations decreased their emissions. For those installations that increased their emissions, the average increase (excluding three outliers) was 16,000 tCO2e (a 15% rise) and the average decrease was 25,000 tCO2e (a 36% fall).
EU ETS CO2 emission data show terminals followed the same trend as offshore installations between 2019 and 2020. Ten out of 18 terminals decreased their CO2
emissions in 2019, but the average increase was 3.1 Kt CO2 (7% rise) and an average decrease was 34.5 Kt CO2
(17% fall).
Figure 6: Distribution of UKCS facility GHG emissions, 2018-2020
Figure 7: Offshore facility emissions change, 2019 to 2020
Figure 8: Onshore terminal emissions change, 2019 to 2020
Source: EU ETSSource: EEMS
Source: EEMS
Average decrease of 36%
Average increase of 15%
Average decrease of 17%
Average increase of 7%

12 Emissions Monitoring Report
Current progress against emission reduction targets
The North Sea Transition Deal ('NSTD')3 – the agreement between the UK upstream oil and gas industry and the UK Government to deliver on the commitments outlined in the Government’s Energy White Paper – sets out supply decarbonisation targets for the industry. The NSTD targets commit the industry to reduce, against a 2018 baseline, its emissions by 10% by 2025, 25% by 2027 and 50% by 2030, with the ultimate aim to be a net-zero basin by 2050.
NAEI data show that UK upstream oil and gas industry emissions increased by 1% from 2018 to 2019, but are estimated to have decreased by 12% from 2019 to 2020. This equates to an overall reduction relative to the 2018 baseline of 11%.
While this reduction would imply that the 2025 emissions reduction target has been met five years early, it should be noted that 2020 was a very unusual year for industry activity with the twin challenges of the COVID-19 pandemic and an oil price crash.
While the OGA recognises the progress made to reduce emissions over the last 22 months, it considers the NSTD targets to be the absolute minimum that the industry must achieve. Given that, the sector must ensure recent reductions are sustained and continued efforts are made to further decarbonise in the 2020s and beyond.
Figure 9: UK upstream oil and gas GHG emissions, progress towards NSTD targets
3 https://assets.publishing.service.gov.uk/government/uploads/system/uploads/attachment_data/file/972520/north-sea-transition-deal_A_FINAL.pdf
Source: NAEI, EU ETS, EEMS, ONS, NSTD
13Emissions Monitoring Report
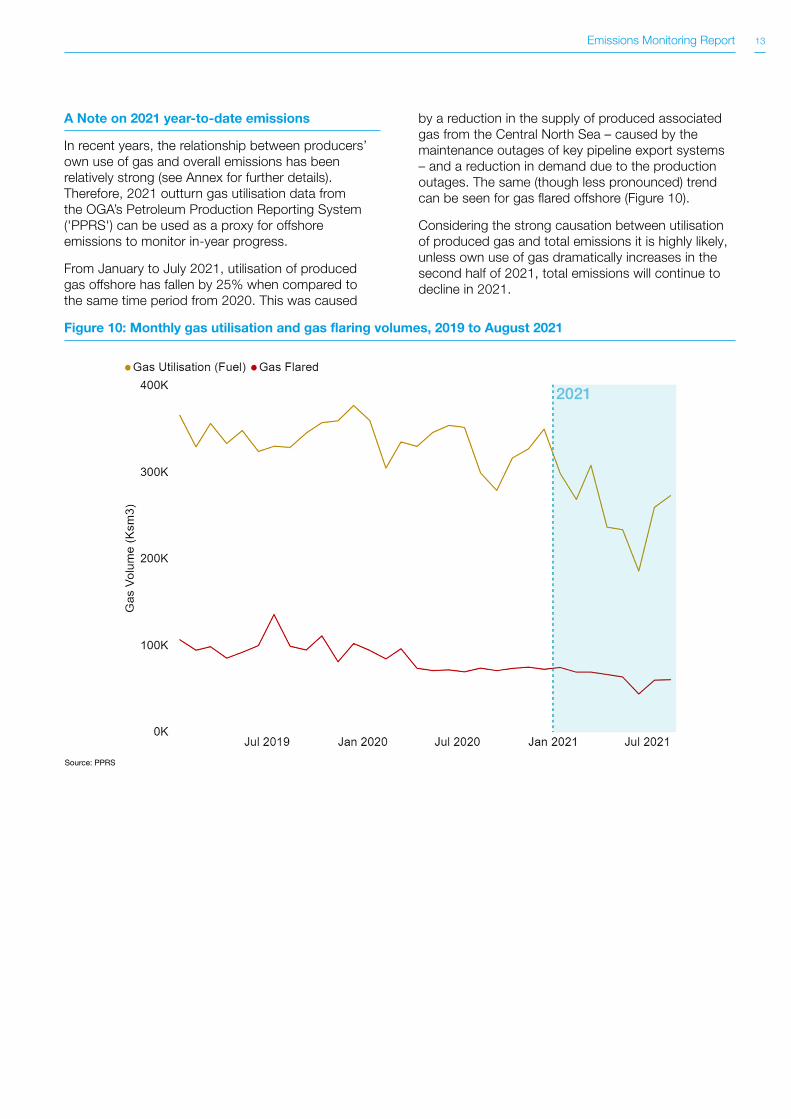
A Note on 2021 year-to-date emissions
In recent years, the relationship between producers’ own use of gas and overall emissions has been relatively strong (see Annex for further details). Therefore, 2021 outturn gas utilisation data from the OGA’s Petroleum Production Reporting System ('PPRS') can be used as a proxy for offshore emissions to monitor in-year progress.
From January to July 2021, utilisation of produced gas offshore has fallen by 25% when compared to the same time period from 2020. This was caused
by a reduction in the supply of produced associated gas from the Central North Sea – caused by the maintenance outages of key pipeline export systems – and a reduction in demand due to the production outages. The same (though less pronounced) trend can be seen for gas flared offshore (Figure 10).
Considering the strong causation between utilisation of produced gas and total emissions it is highly likely, unless own use of gas dramatically increases in the second half of 2021, total emissions will continue to decline in 2021.
Figure 10: Monthly gas utilisation and gas flaring volumes, 2019 to August 2021
Source: PPRS
2021
14 Emissions Monitoring Report
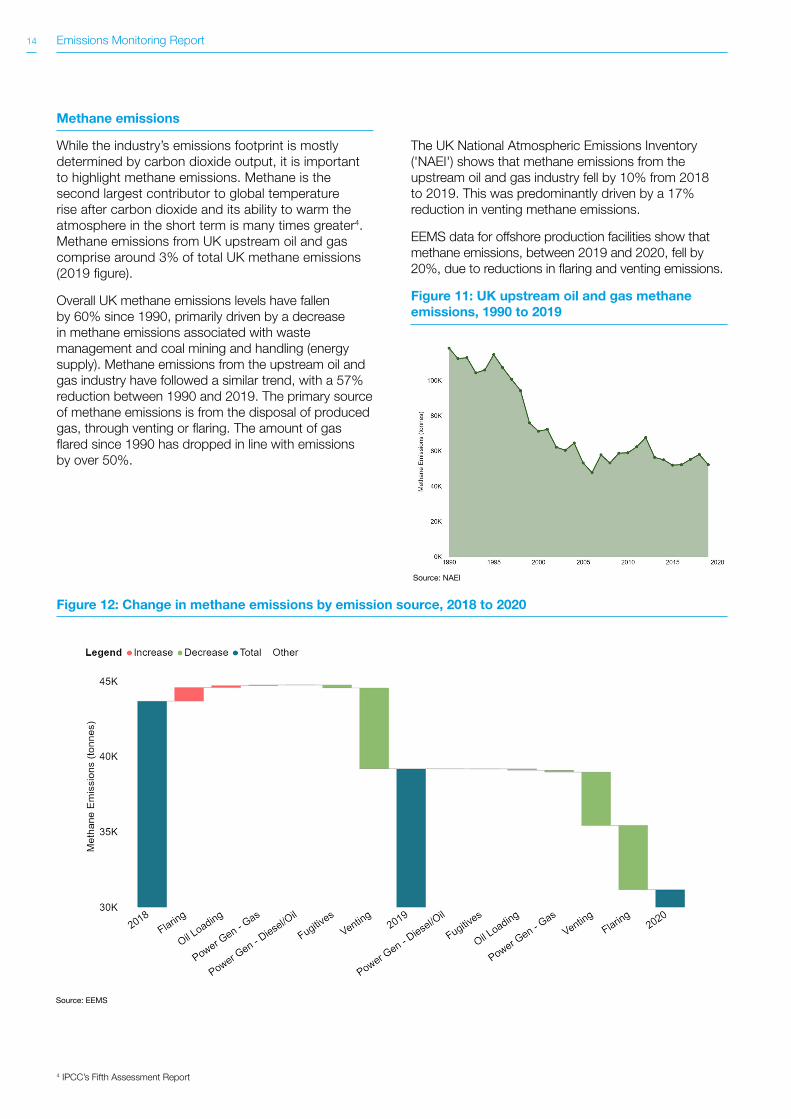
Methane emissions
While the industry’s emissions footprint is mostly determined by carbon dioxide output, it is important to highlight methane emissions. Methane is the second largest contributor to global temperature rise after carbon dioxide and its ability to warm the atmosphere in the short term is many times greater4. Methane emissions from UK upstream oil and gas comprise around 3% of total UK methane emissions (2019 figure).
Overall UK methane emissions levels have fallen by 60% since 1990, primarily driven by a decrease in methane emissions associated with waste management and coal mining and handling (energy supply). Methane emissions from the upstream oil and gas industry have followed a similar trend, with a 57% reduction between 1990 and 2019. The primary source of methane emissions is from the disposal of produced gas, through venting or flaring. The amount of gas flared since 1990 has dropped in line with emissions by over 50%.
The UK National Atmospheric Emissions Inventory ('NAEI') shows that methane emissions from the upstream oil and gas industry fell by 10% from 2018 to 2019. This was predominantly driven by a 17% reduction in venting methane emissions.
EEMS data for offshore production facilities show that methane emissions, between 2019 and 2020, fell by 20%, due to reductions in flaring and venting emissions.
Figure 11: UK upstream oil and gas methane emissions, 1990 to 2019
Figure 12: Change in methane emissions by emission source, 2018 to 2020
Source: EEMS
Source: NAEI
4 IPCC’s Fifth Assessment Report

15Emissions Monitoring Report
The OGA is committed to driving down GHG emissions from the oil and gas sector, including methane emissions associated with flaring and venting (see p.28).
Methane intensity
Methane intensity, the amount of methane emitted per unit of natural gas exported, is a key performance metric. The Oil and Gas Climate Initiative ('OGCI') for instance, has challenged its members to achieve a target methane intensity of below 0.2% by 2025. Data from the NAEI and BEIS show that the UK upstream industry methane intensity was around 0.1% between 2000 and 2006. This rose to a peak of roughly 0.3% in 2013 but has since settled at around 0.23%.
Figure 13: UK net gas production and upstream methane intensity, 2000 to 2019
Source: BEIS, NAEI
16 Emissions Monitoring Report
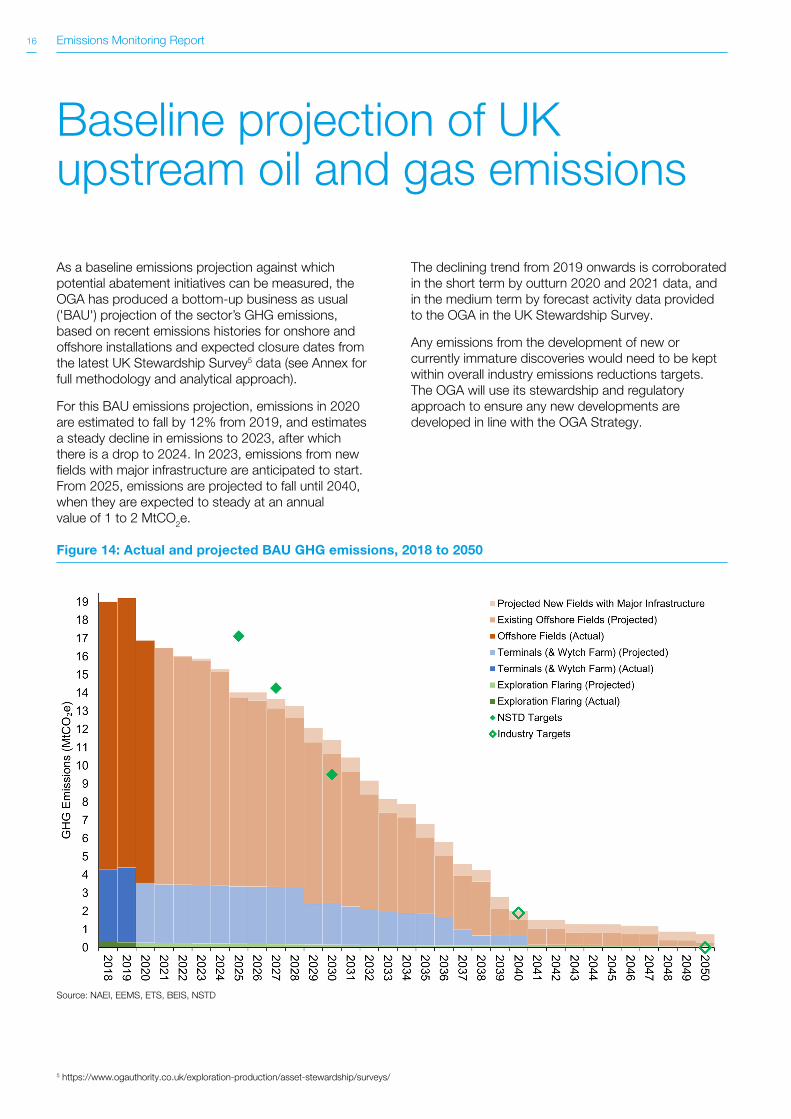
Baseline projection of UK upstream oil and gas emissions
As a baseline emissions projection against which potential abatement initiatives can be measured, the OGA has produced a bottom-up business as usual ('BAU') projection of the sector’s GHG emissions, based on recent emissions histories for onshore and offshore installations and expected closure dates from the latest UK Stewardship Survey5 data (see Annex for full methodology and analytical approach).
For this BAU emissions projection, emissions in 2020 are estimated to fall by 12% from 2019, and estimates a steady decline in emissions to 2023, after which there is a drop to 2024. In 2023, emissions from new fields with major infrastructure are anticipated to start. From 2025, emissions are projected to fall until 2040, when they are expected to steady at an annual value of 1 to 2 MtCO2e.
The declining trend from 2019 onwards is corroborated in the short term by outturn 2020 and 2021 data, and in the medium term by forecast activity data provided to the OGA in the UK Stewardship Survey.
Any emissions from the development of new or currently immature discoveries would need to be kept within overall industry emissions reductions targets. The OGA will use its stewardship and regulatory approach to ensure any new developments are developed in line with the OGA Strategy.
Figure 14: Actual and projected BAU GHG emissions, 2018 to 2050
Source: NAEI, EEMS, ETS, BEIS, NSTD
5 https://www.ogauthority.co.uk/exploration-production/asset-stewardship/surveys/

17Emissions Monitoring Report
The current BAU emissions projection estimates that the NSTD emissions reductions targets for 2025 and 2027 will be met through existing abatement initiatives and installations ceasing production. However, this projection is subject to a range of uncertainty. To meet the 2030 emissions reduction target, more drastic emissions abatement initiatives are required.
Based on the data and projections in this report, the OGA considers the NSTD emissions reductions targets for the 2020s to be a minimum, and expects recent reduction efforts to be sustained and increased over the coming years.
There is, therefore, a real challenge as well as an opportunity over the next decade for industry to proactively reduce its emissions to levels below that of the BAU emissions projection. Industry needs to employ a step change in its approach to decarbonising operations, in order to ensure the 50% emissions reduction target for 2030 can be met.

18 Emissions Monitoring Report
Emissions abatement potential
The UKCS is a critical energy resource for the UK, with enormous potential to reduce emissions from offshore oil and gas operations, and to support the decarbonisation of the wider UK economy.
Innovative partnering between oil and gas, renewables, hydrogen and carbon capture can accelerate energy transition – oil and gas infrastructure and capabilities can be leveraged for carbon capture and storage ('CCS'), and to support renewable energy production and hydrogen generation, transport and storage. Figure 15 shows some of the different types of emissions reduction or sequestration initiatives the industry is currently progressing.
In addition to large capital-intensive decarbonisation projects, there are also smaller-scale abatement opportunities for upstream oil and gas operations. These cover a range of activities in a number of broad areas, including:
• Flaring
– Improved measurement and control of flare combustion efficiency
– Shortening duration of cold flaring episodes
– Installation of vapour recovery units
• Venting
– Installation of vapour recovery units
• Fugitives
– Leakage detection and repair
• Equipment
– Upgrade to more energy efficient equipment for example fluid pumps
Figure 15: Schematic map to show UKCS emission reduction/sequestration projects
Source: OGA
19Emissions Monitoring Report
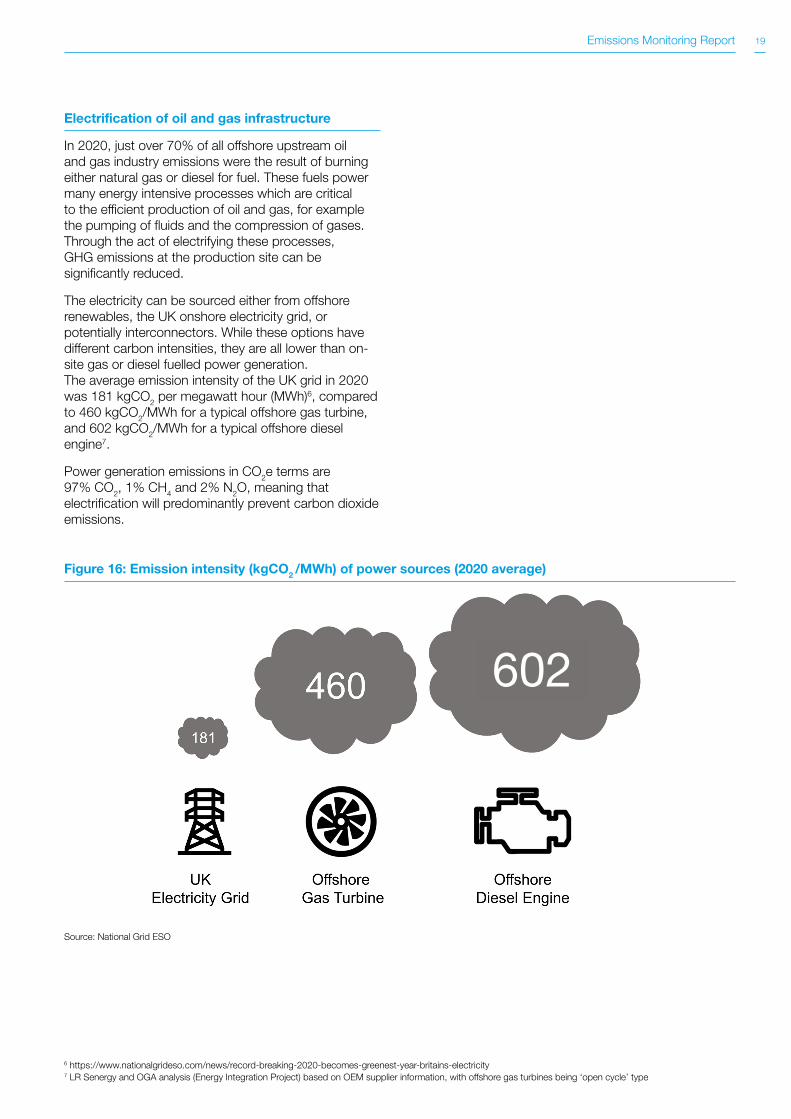
Electrification of oil and gas infrastructure
In 2020, just over 70% of all offshore upstream oil and gas industry emissions were the result of burning either natural gas or diesel for fuel. These fuels power many energy intensive processes which are critical to the efficient production of oil and gas, for example the pumping of fluids and the compression of gases. Through the act of electrifying these processes, GHG emissions at the production site can be significantly reduced.
The electricity can be sourced either from offshore renewables, the UK onshore electricity grid, or potentially interconnectors. While these options have different carbon intensities, they are all lower than on-site gas or diesel fuelled power generation. The average emission intensity of the UK grid in 2020 was 181 kgCO2 per megawatt hour (MWh)6, compared to 460 kgCO2/MWh for a typical offshore gas turbine, and 602 kgCO2/MWh for a typical offshore diesel engine7.
Power generation emissions in CO2e terms are 97% CO2, 1% CH4 and 2% N2O, meaning that electrification will predominantly prevent carbon dioxide emissions.
6 https://www.nationalgrideso.com/news/record-breaking-2020-becomes-greenest-year-britains-electricity7 LR Senergy and OGA analysis (Energy Integration Project) based on OEM supplier information, with offshore gas turbines being ‘open cycle’ type
Figure 16: Emission intensity (kgCO2 /MWh) of power sources (2020 average)
Source: National Grid ESO
602

20 Emissions Monitoring Report
Combining installation data, knowledge of UKCS electrification projects, and certain assumptions (see Annex), the OGA has estimated the technical emissions abatement potential from electrification of offshore assets. These estimates consider cessation of production date variability through economic modelling, but do not consider the commercial viability of any projects.
In the central case, total abatement from 2027 to 2050 is estimated at 11 Mt CO2e. Abatement estimates after 2040 are more uncertain, due to a lack of clarity around greenfield electrification projects. The difference in total range between the minimum and maximum cases is 25 Mt, driven by assumptions around factors such as asset cessation of production dates, degree of electrification, electricity sources, and grid emission intensity projection scenarios.
Figure 17: Annual estimated GHG emissions abatement from electrification of UK upstream oil and gas installations, technical profiles
Source: OGA, BEIS, EEMS, EU ETS
21Emissions Monitoring Report
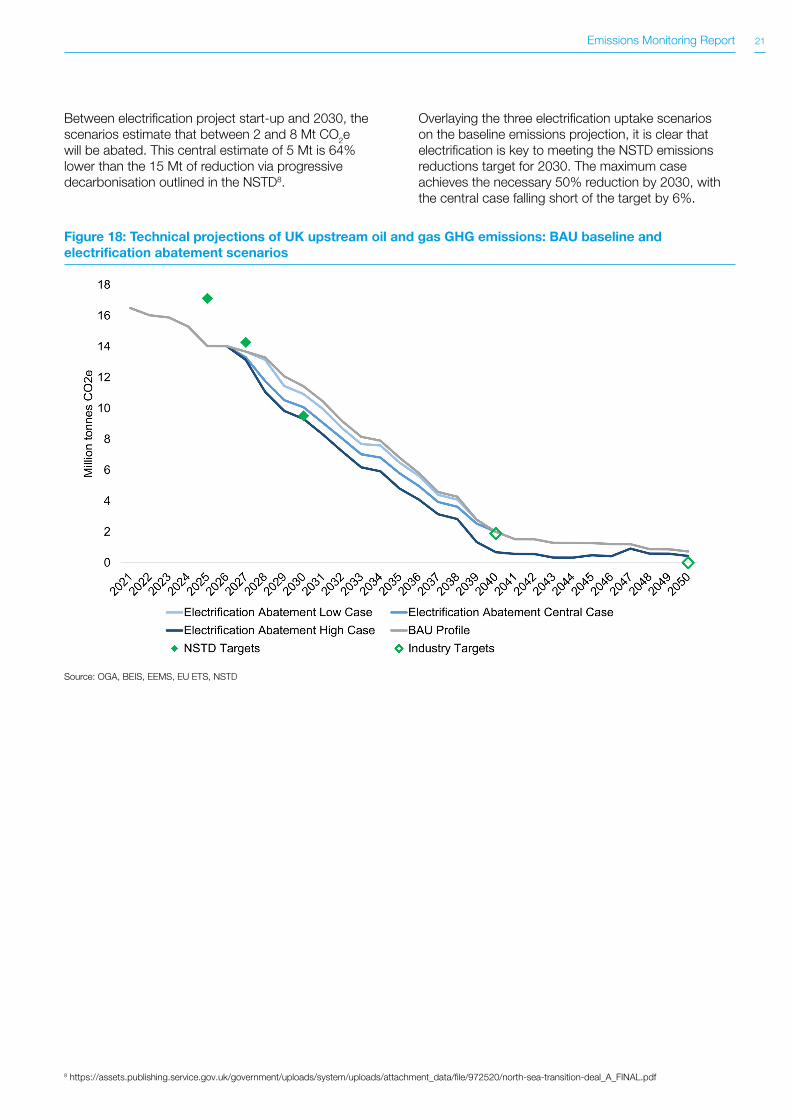
Between electrification project start-up and 2030, the scenarios estimate that between 2 and 8 Mt CO2e will be abated. This central estimate of 5 Mt is 64% lower than the 15 Mt of reduction via progressive decarbonisation outlined in the NSTD8.
Overlaying the three electrification uptake scenarios on the baseline emissions projection, it is clear that electrification is key to meeting the NSTD emissions reductions target for 2030. The maximum case achieves the necessary 50% reduction by 2030, with the central case falling short of the target by 6%.
Figure 18: Technical projections of UK upstream oil and gas GHG emissions: BAU baseline and electrification abatement scenarios
Source: OGA, BEIS, EEMS, EU ETS, NSTD
8 https://assets.publishing.service.gov.uk/government/uploads/system/uploads/attachment_data/file/972520/north-sea-transition-deal_A_FINAL.pdf
22 Emissions Monitoring Report
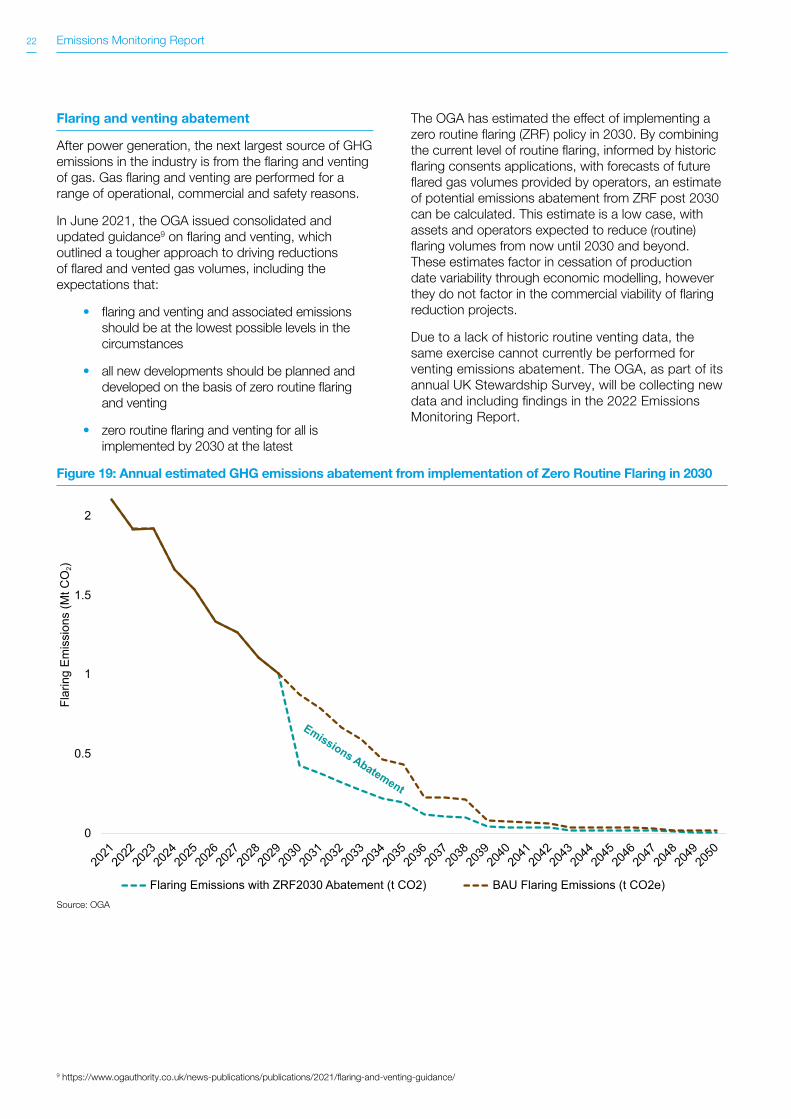
Flaring and venting abatement
After power generation, the next largest source of GHG emissions in the industry is from the flaring and venting of gas. Gas flaring and venting are performed for a range of operational, commercial and safety reasons.
In June 2021, the OGA issued consolidated and updated guidance9 on flaring and venting, which outlined a tougher approach to driving reductions of flared and vented gas volumes, including the expectations that:
• flaring and venting and associated emissions should be at the lowest possible levels in the circumstances
• all new developments should be planned and developed on the basis of zero routine flaring and venting
• zero routine flaring and venting for all is implemented by 2030 at the latest
The OGA has estimated the effect of implementing a zero routine flaring (ZRF) policy in 2030. By combining the current level of routine flaring, informed by historic flaring consents applications, with forecasts of future flared gas volumes provided by operators, an estimate of potential emissions abatement from ZRF post 2030 can be calculated. This estimate is a low case, with assets and operators expected to reduce (routine) flaring volumes from now until 2030 and beyond. These estimates factor in cessation of production date variability through economic modelling, however they do not factor in the commercial viability of flaring reduction projects.
Due to a lack of historic routine venting data, the same exercise cannot currently be performed for venting emissions abatement. The OGA, as part of its annual UK Stewardship Survey, will be collecting new data and including findings in the 2022 Emissions Monitoring Report.
0
0.5
1
1.5
2
2021
2022
2023
2024
2025
2026
2027
2028
2029
2030
2031
2032
2033
2034
2035
2036
2037
2038
2039
2040
2041
2042
2043
2044
2045
2046
2047
2048
2049
2050
Flar
ing
Emis
sion
s (M
t CO
2)
Flaring Emissions with ZRF2030 Abatement (t CO2) BAU Flaring Emissions (t CO2e)
Emissions Abatement
9 https://www.ogauthority.co.uk/news-publications/publications/2021/flaring-and-venting-guidance/
Figure 19: Annual estimated GHG emissions abatement from implementation of Zero Routine Flaring in 2030
Source: OGA
23Emissions Monitoring Report
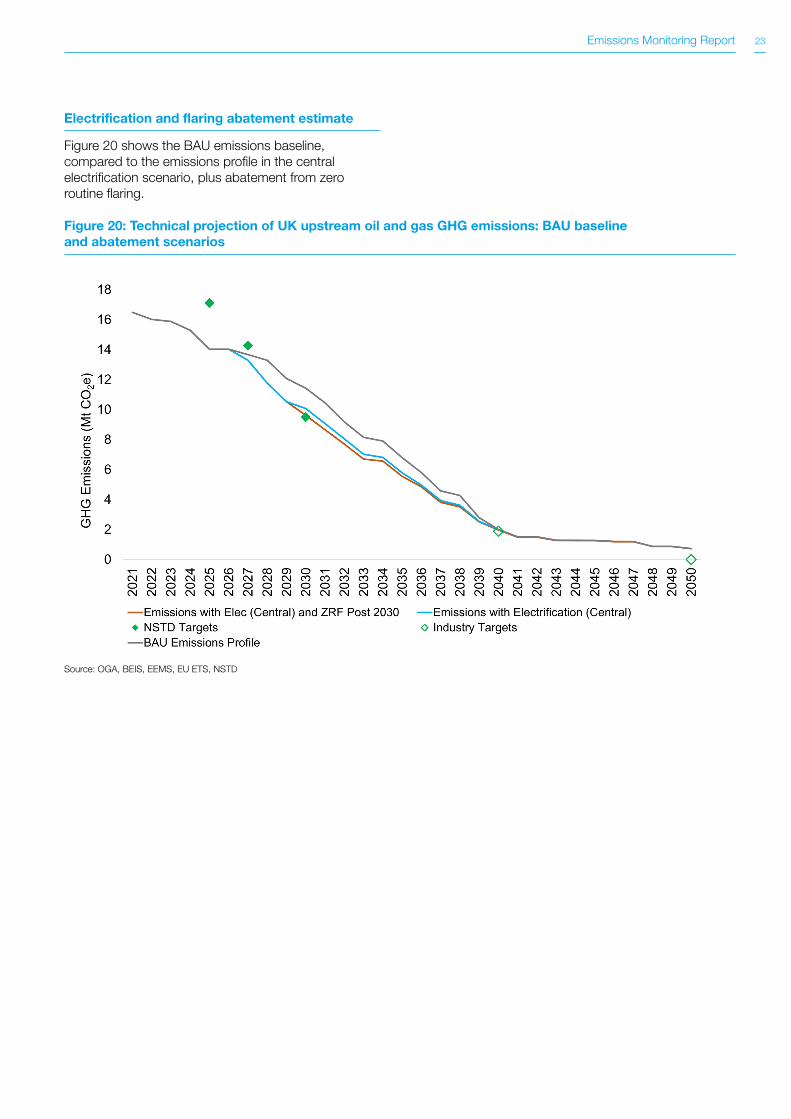
Electrification and flaring abatement estimate
Figure 20 shows the BAU emissions baseline, compared to the emissions profile in the central electrification scenario, plus abatement from zero routine flaring.
Figure 20: Technical projection of UK upstream oil and gas GHG emissions: BAU baseline and abatement scenarios
Source: OGA, BEIS, EEMS, EU ETS, NSTD
24 Emissions Monitoring Report
Emissions performance benchmarking
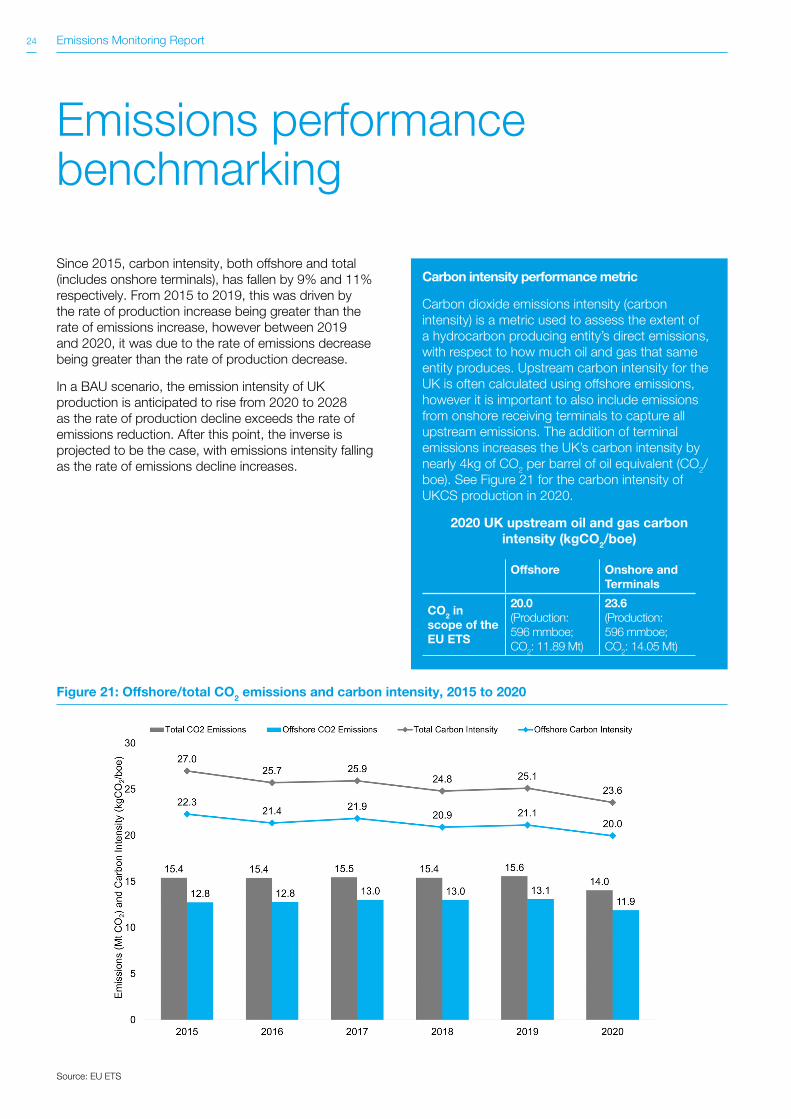
Since 2015, carbon intensity, both offshore and total (includes onshore terminals), has fallen by 9% and 11% respectively. From 2015 to 2019, this was driven by the rate of production increase being greater than the rate of emissions increase, however between 2019 and 2020, it was due to the rate of emissions decrease being greater than the rate of production decrease.
In a BAU scenario, the emission intensity of UK production is anticipated to rise from 2020 to 2028 as the rate of production decline exceeds the rate of emissions reduction. After this point, the inverse is projected to be the case, with emissions intensity falling as the rate of emissions decline increases.
Carbon intensity performance metric
Carbon dioxide emissions intensity (carbon intensity) is a metric used to assess the extent of a hydrocarbon producing entity’s direct emissions, with respect to how much oil and gas that same entity produces. Upstream carbon intensity for the UK is often calculated using offshore emissions, however it is important to also include emissions from onshore receiving terminals to capture all upstream emissions. The addition of terminal emissions increases the UK’s carbon intensity by nearly 4kg of CO2 per barrel of oil equivalent (CO2/boe). See Figure 21 for the carbon intensity of UKCS production in 2020.
2020 UK upstream oil and gas carbon intensity (kgCO2/boe)
Offshore Onshore and Terminals
CO2 in scope of the EU ETS
20.0 (Production: 596 mmboe; CO2: 11.89 Mt)
23.6 (Production: 596 mmboe; CO2: 14.05 Mt)
Figure 21: Offshore/total CO2 emissions and carbon intensity, 2015 to 2020
Source: EU ETS

25Emissions Monitoring Report
International benchmarking
Analysis conducted by the OGA has shown that natural gas consumed in the UK that is also produced in the UK has less than half the carbon footprint of imported LNG gas10.
Looking instead at emissions only at the production stage, there are many different factors affecting carbon intensity, including geology, the operating environment and industry maturity, making robust international comparisons challenging. A high-level comparison of UK performance has been produced by comparing UKCS offshore carbon intensity to country level emissions and production data sourced from Rystad Energy.
Out of 69 countries with hydrocarbon production for 2020, the UK ranks in the second quartile. Filtering the dataset to cover offshore production only, there are 43 hydrocarbon producing countries; again, the UK ranks in the second quartile.
These numbers show there is still scope to significantly reduce the UK's production carbon footprint, and industry must make progress on reducing its own emissions.
Figure 22: 2020 carbon intensity by country, global and peer group comparison
Source: Rystad Energy
10 https://www.ogauthority.co.uk/the-move-to-net-zero/net-zero-benchmarking-and-analysis/natural-gas-carbon-footprint-analysis/
26 Emissions Monitoring Report
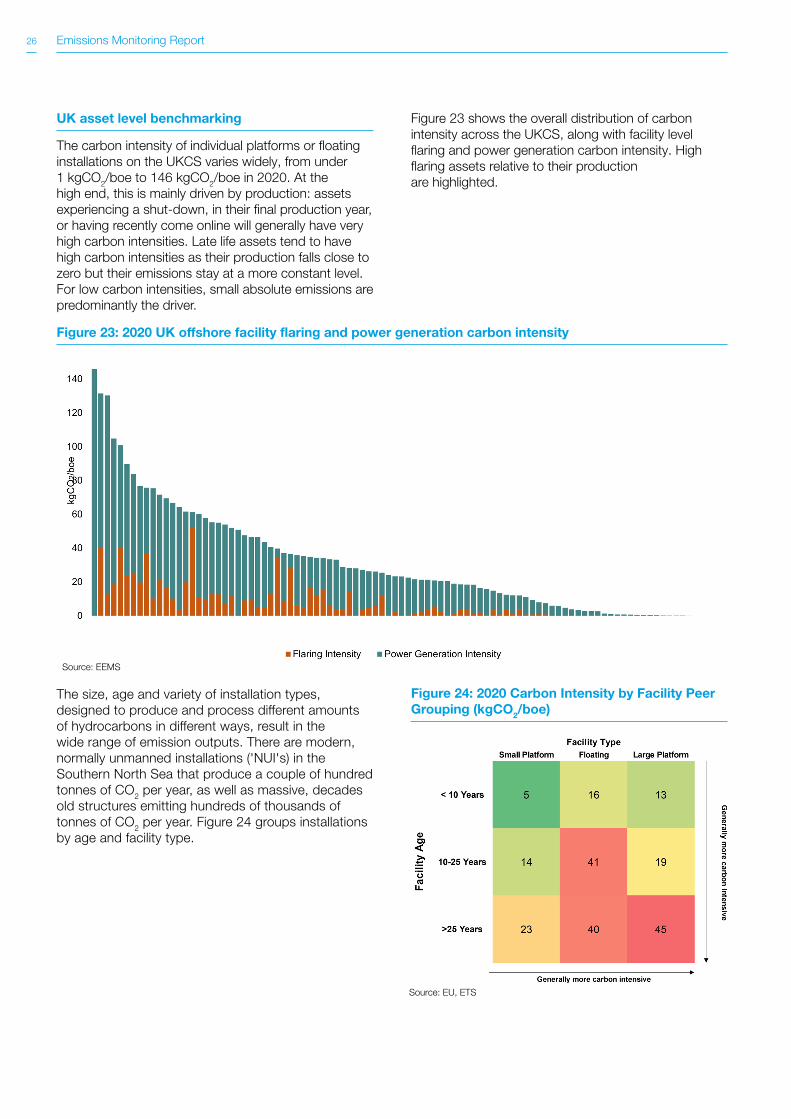
UK asset level benchmarking
The carbon intensity of individual platforms or floating installations on the UKCS varies widely, from under 1 kgCO2/boe to 146 kgCO2/boe in 2020. At the high end, this is mainly driven by production: assets experiencing a shut-down, in their final production year, or having recently come online will generally have very high carbon intensities. Late life assets tend to have high carbon intensities as their production falls close to zero but their emissions stay at a more constant level. For low carbon intensities, small absolute emissions are predominantly the driver.
Figure 23 shows the overall distribution of carbon intensity across the UKCS, along with facility level flaring and power generation carbon intensity. High flaring assets relative to their production are highlighted.
Figure 23: 2020 UK offshore facility flaring and power generation carbon intensity
The size, age and variety of installation types, designed to produce and process different amounts of hydrocarbons in different ways, result in the wide range of emission outputs. There are modern, normally unmanned installations ('NUI's) in the Southern North Sea that produce a couple of hundred tonnes of CO2 per year, as well as massive, decades old structures emitting hundreds of thousands of tonnes of CO2 per year. Figure 24 groups installations by age and facility type.
Figure 24: 2020 Carbon Intensity by Facility Peer Grouping (kgCO2/boe)
Source: EU, ETS
Source: EEMS

27Emissions Monitoring Report
The geographical location of an installation can also influence its carbon intensity (Figure 25). For example, the Southern North Sea, with gaseous resources and shallow water, has smaller installations compared to other areas of the UKCS, which combined with minimal flaring result in low absolute emissions.
More oil-rich and deeper water areas of the UKCS require bigger, more complex infrastructure to produce and process multi-phase fluids. This increased demand for energy and higher levels of flaring result in higher emissions, though higher carbon intensity can be mitigated by high levels of production.
Figure 25: 2020 CO2 emissions and carbon intensity by facility and UKCS region
Source: EU, ETS, OGA
Figure 26 shows examples of more detailed performance benchmarking provided in the OGA’s supplementary Carbon Intensity Performance dashboard11. These bubble plots allow an individual asset to be compared on carbon intensity and absolute CO2 emissions against its peers, including with respect to age and infrastructure type.
Figure 26: 2020 Carbon intensity and Facility Age by Facility Type and Produced Fluid Type
Floating
Small platform
Large platform
Source: EU, ETS, OGA
11 UKCS Offshore Carbon Intensity Interactive Dashboard
28 Emissions Monitoring Report
Flaring and venting activity 2021 update
The OGA published its first assessment of flaring and venting activity in September 2020. In that report, both recent activity levels and resulting GHG emissions were analysed, and benchmarking was employed to outline different performance observed from operations. This section builds on that report by presenting data collected in 2020 and the first half of 2021.
For more detailed analysis and benchmarking, see the OGA’s supplementary Flaring and Venting Dashboard12.
Note that any variations in historic data presented here and in the 2020 report are due to corrections or refinement of previously reported values.
Flaring
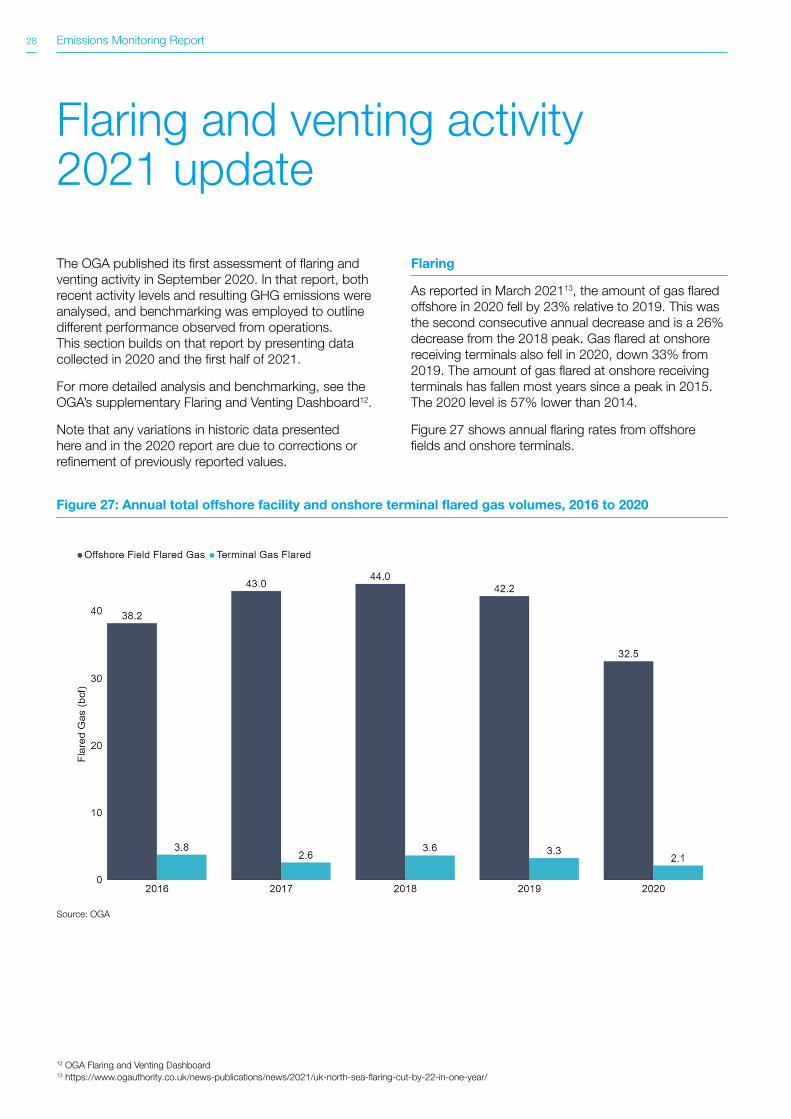
As reported in March 202113, the amount of gas flared offshore in 2020 fell by 23% relative to 2019. This was the second consecutive annual decrease and is a 26% decrease from the 2018 peak. Gas flared at onshore receiving terminals also fell in 2020, down 33% from 2019. The amount of gas flared at onshore receiving terminals has fallen most years since a peak in 2015. The 2020 level is 57% lower than 2014.
Figure 27 shows annual flaring rates from offshore fields and onshore terminals.
Figure 27: Annual total offshore facility and onshore terminal flared gas volumes, 2016 to 2020
Source: OGA
12 OGA Flaring and Venting Dashboard13 https://www.ogauthority.co.uk/news-publications/news/2021/uk-north-sea-flaring-cut-by-22-in-one-year/
29Emissions Monitoring Report
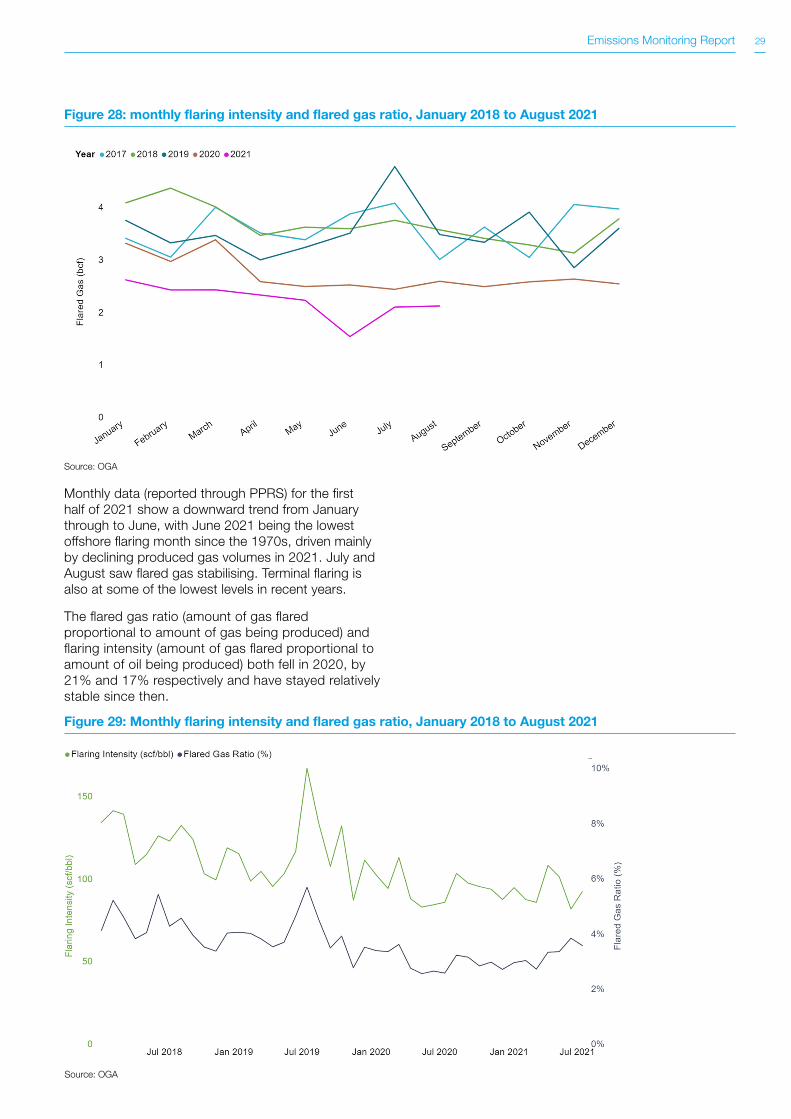
Monthly data (reported through PPRS) for the first half of 2021 show a downward trend from January through to June, with June 2021 being the lowest offshore flaring month since the 1970s, driven mainly by declining produced gas volumes in 2021. July and August saw flared gas stabilising. Terminal flaring is also at some of the lowest levels in recent years.
The flared gas ratio (amount of gas flared proportional to amount of gas being produced) and flaring intensity (amount of gas flared proportional to amount of oil being produced) both fell in 2020, by 21% and 17% respectively and have stayed relatively stable since then.
Source: OGA
Figure 28: monthly flaring intensity and flared gas ratio, January 2018 to August 2021
Figure 29: Monthly flaring intensity and flared gas ratio, January 2018 to August 2021
Source: OGA

30 Emissions Monitoring Report
Venting
As reported in March 2021, the total amount of gas vented offshore in 2020 rose by 12% relative to 2019. The amount of hydrocarbon gas (methane) vented fell by 11%, with the difference comprised of increased vented carbon dioxide. Gas vented at onshore receiving terminals also fell in 2020, down 22% from 2019.
A reduction in offshore vented inert gas has resulted in an overall significant decrease in offshore vented gas volumes throughout 2021. Despite this, venting of hydrocarbon gas (methane) has stayed relatively constant at late 2020 levels.
As total vented gas has decreased in 2021, so too has the vented gas ratio (amount of gas vented proportional to amount of gas being produced). The vented gas ratio has fallen from 0.29% in February, to 0.12% in July. The vented gas ratio for hydrocarbon vented gas has trended upwards throughout 2021, doubling from 0.05% in February to 0.11% in July.
Figure 30: Monthly offshore gas venting, methane and carbon dioxide, January 2019 to August 2021
Source: OGA

31Emissions Monitoring Report
Conclusion and next steps
Since 2018, the UK upstream oil and gas industry has made good progress in the reduction of GHG emissions from operations. The significant fall in overall industry GHG emissions in 2020 was caused by a mixture of proactive emissions abatement initiatives, supported by OGA stewardship and regulatory approach, as well as reduction in industry activity driven by the COVID-19 pandemic and a commodity price crash, and end-of-life shutdown for a handful of large emitters.
While the findings contained in this report are sensitive to underlying assumptions, the early targets agreed in the NSTD appear to be well within industry’s reach. However, it is imperative that this progress continues and is built on in the years to come. The 2030 goal of halving emissions still requires urgent and drastic industry change, and the OGA considers that meeting the near-term 2025 and 2027 NSTD emissions targets is the absolute minimum that the industry must achieve. The sector must ensure recent reductions are sustained, and that OGA Strategy and associated guidance are implemented to ensure further and faster efforts to decarbonise in the 2020s and beyond. This is essential for the UK to realise the benefits of early abatement, and for industry if it is to maintain its social licence to operate.
This work will require a range of approaches, including through:
• making tangible progress on platform electrification
• reductions in emissions from flaring and venting; for example, through vapour recovery or cold flaring elimination, process improvement or more efficient operations
• retrofitting platforms with more energy efficient equipment
• progressing carbon capture and storage projects
• integration with hydrogen
The OGA will continue to monitor and steward industry’s performance closely through the annual Stewardship Survey, performance benchmarking and tier reviews, and continue to hold industry accountable for emissions reductions through its stewardship activities and regulatory approach. In addition to this, the OGA has modified its Standard Economic Template ('SET')14 and the annual UK Stewardship Survey to capture a range of emissions related data. This will allow for an informed assessment of future operations (both new and existing) with respect to both production and emissions data, vital for considering progress towards achieving net zero by 2050.
This publication, which will be updated annually, will help the OGA and industry to maintain a clear focus on the emissions reductions, to ensure that UK oil and gas industry plays its part in the energy transition and its activities remain compatible with wider net zero goals.The OGA will continue to work very closely with government and other regulators, including the Offshore Petroleum Regulator for Environment and Decommissioning (OPRED) as set out in the North Sea Transition Deal to ensure as far as possible consistent reporting structures and frameworks and to minimise the reporting burden on industry and enable clearer monitoring of progress.
14 https://www.ogauthority.co.uk/exploration-production/development/field-development-plans/

www.ogauthority.co.uk
Copyright © Oil and Gas Authority 2021
Oil and Gas Authority is a limited company registered in England and Wales with registered number 09666504 and VAT registered number 249433979. Our registered office is at 21 Bloomsbury Street, London, United Kingdom, WC1B 3HF

33Emissions Monitoring Report


