NATIONAL CENTER FOR REHABILITATIVE AUDITORY RESEARCH NATIONAL CENTER FOR REHABILITATIVE AUDITORY RESEARCH Ototoxicity Monitoring using Otoacoustic Emissions Dawn Konrad-Martin, Ph.D., CCC-A VA RR&D National Center for Rehabilitative Auditory Research Dept. Otolaryngology-HNS, Oregon Health & Science University Laura Dreisbach Hawe, Ph.D., CCC-A School of Speech, Language, and Hearing Sciences SDSU/UCSD Joint Doctoral Program in Audiology, San Diego State University Gayla L. Poling, Ph.D., CCC-A Division of Audiology, Mayo Clinic Rochester Jake Hulswit, B.S. VA RR&D National Center for Rehabilitative Auditory Research Kara Nofstker VA RR&D National Center for Rehabilitative Auditory Research
Transcript
NATIONAL CENTER FOR REHABILITATIVE AUDITORY RESEARCHNATIONAL CENTER FOR REHABILITATIVE AUDITORY RESEARCH
Ototoxicity Monitoring using Otoacoustic EmissionsDawn Konrad-Martin, Ph.D., CCC-AVA RR&D National Center for Rehabilitative Auditory ResearchDept. Otolaryngology-HNS, Oregon Health & Science University
Laura Dreisbach Hawe, Ph.D., CCC-ASchool of Speech, Language, and Hearing SciencesSDSU/UCSD Joint Doctoral Program in Audiology, San Diego State University
Gayla L. Poling, Ph.D., CCC-ADivision of Audiology, Mayo Clinic Rochester
Jake Hulswit, B.S.VA RR&D National Center for Rehabilitative Auditory Research
Kara NofstkerVA RR&D National Center for Rehabilitative Auditory Research
Outline
I. Basic PrinciplesII. Case StudyIII. DPOAE MeasurementIV. DPOAE ProtocolV. DPOAE Change CriteriaVI. Caveats for InterpretationVII. Reference List
• Objective test of outer hair cell (OHC) function• OHCs must be normal for hearing thresholds to be normal• Damage from ototoxins impacts OHCs• OAE changes signal changes in cochlear function• OAE changes can occur prior to PTS• Clinically, a change in OAE level is evidence of cochlear
damage and associated with a change in hearing
Photos courtesy of Dr. Marc Lenoir, from “Promenade around the cochlea” EDU website: http://www.cochlea.org, by Remy Pujol et al., INSERM and University of Montpellier
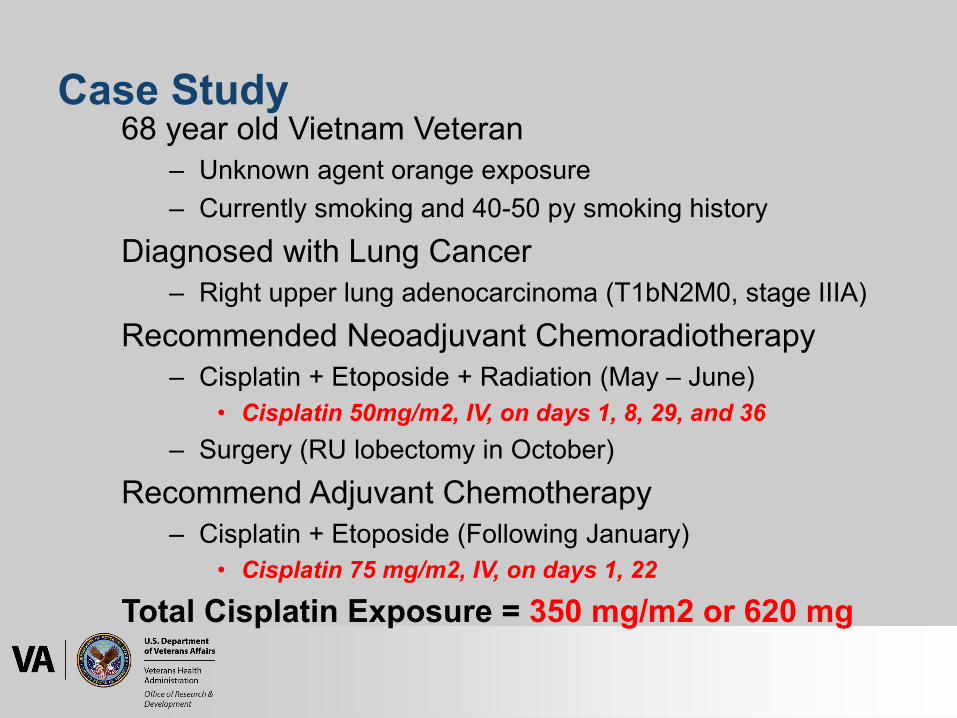
Case Study: Sensitive/Early IndexOAE change appears to have earlier time course than HL from cisplatin
Case illustration of serial measurements obtained in a 68-year-old patient receiving Cisplatin treatment with A, behavioral hearing thresholds as a function of frequency and B, DPOAE level as a function of f2 frequency. Different lines/symbols represent data from eight trials, with the filled circle indicating Trial 1 (baseline).
First Column Second Column
Third Column Fourth Column
Fifth Column
text here text here
text here text here
text here text here text here text here
text here text here
text here text here
text here text here
text here text here text here text here
text here text here
text here text here
text here text here
text here text here text here text here
text here text here
text here text here
text here text here
text here text here text here text here
text here text here
text here text here
text here text here
text here text here text here text here
text here text here
text here text here
text here text here
text here text here text here text here
text here text here
text here text here
text here text here
text here text here text here text here
text here text here
f2/f1 = 1.22 L1/L2 = 65/59 dB SPL
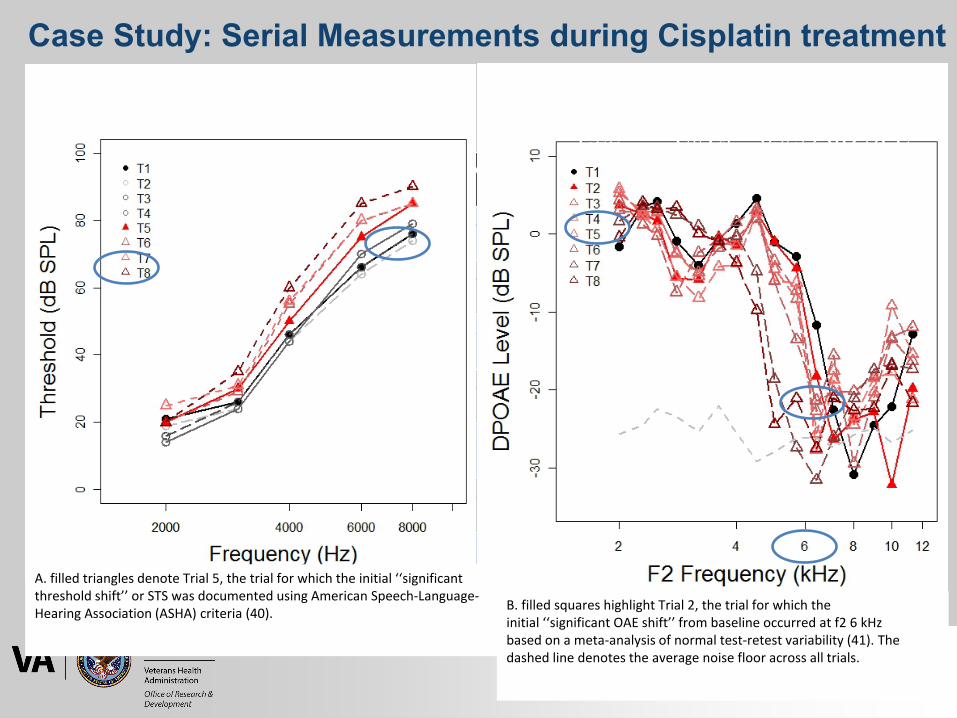
Case Study: Serial Measurements during Cisplatin treatment
A. filled triangles denote Trial 5, the trial for which the initial ‘‘significant threshold shift’’ or STS was documented using American Speech-Language-Hearing Association (ASHA) criteria (40). B. filled squares highlight Trial 2, the trial for which the
initial ‘‘significant OAE shift’’ from baseline occurred at f2 6 kHzbased on a meta-analysis of normal test-retest variability (41). The dashed line denotes the average noise floor across all trials.
DPOAE Measurement
• Acoustic response measured in the ear canal• Evoked using two-tone stimulation (f1<f2)
Konrad-Martin, Dawn., San Diego State University presentation, 2016.
• Factors:– Noise Floor
• average amplitude in several frequency bins above & below 2f1-f2• Worse at low frequencies
– Signal-to-noise ratio (SNR)• dB difference between SPL at 2f1-f2 and the estimated noise• Worse at low stimulus levels and frequencies, & in impaired ears
– System distortion (sometimes called “system noise”)• Distortion/noise from the equipment that occurs at the 2f1-f2
frequency• Greatest at high frequencies and high primary levels
DPOAE Measurement
Ramos JA, et al., Hearing Review, 2013
DPOAE Measurement
• Test-Retest reliability is key– Low noise and distortion generated by system– Normal middle ear function– Quiet test environment, equipment and patient– Consistent probe placement
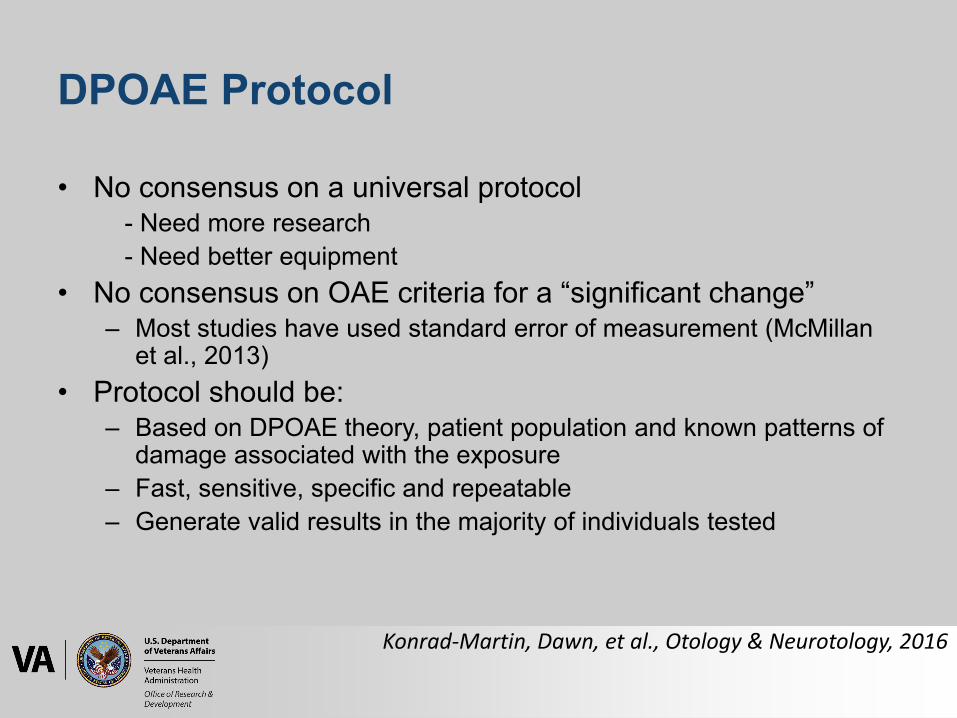
DPOAE Protocol
• No consensus on a universal protocol- Need more research- Need better equipment
• No consensus on OAE criteria for a “significant change” – Most studies have used standard error of measurement (McMillan
et al., 2013)• Protocol should be:
– Based on DPOAE theory, patient population and known patterns of damage associated with the exposure
– Fast, sensitive, specific and repeatable – Generate valid results in the majority of individuals tested
Konrad-Martin, Dawn, et al., Otology & Neurotology, 2016
DPOAE Protocol• Start with whatever canned protocol you have
- Provides gross assessment of broad range of frequencies- Determine which baseline DPOAE measures are valid (e.g., 6
dB SNR or greater; DPOAE response at least -20 dB SPL)• Let knowledge about damage patterns and mechanisms
guide additional in-depth measures - Add a lower level frequency sweep (f2=45 dB SPL)- Using SRO concept, test in fine frequency steps, and/or use
of multiple levels near the highest DPOAE with a robust response
• Examine valid responses for significant changes - Convert to binary, pass-fail outcome based on pre-
determined frequency or frequency range
Konrad-Martin, Dawn, et al., Otology & Neurotology, 2016
DPOAE Protocol (at NCRAR)
• DP-gram search for highest f2 yielding a DPOAE level
• Fine step DP-gram in half octave range for highest DP frequency with 6 dB SNR and a response level of greater than or equal to -20 dB SPL– Helps identify fine structure– Helps define putative lesion site
• DP I/O’s at three highest frequencies tested in 1/3rd octave steps (Kummer et al., 1998)
(1) Fine Step Frequency Sweep (DP-gram)– Helps identify fine structure– Helps define putative lesion site
(2) Level Sweep (I/O function)– Includes the more sensitive lower-level measurements– Can be used to estimate a DPOAE threshold
(3) Ratio Sweep (Group Delay)- Can be used to determine latency
DPOAE Protocol
Reavis, K. M., et al., Ear and hearing, 2015.
DPOAE Protocol• Katbamna et al. (1999) compared different DPOAE paradigms
for purposes of monitoring CF patients and found..• DPOAE group delay and detection threshold values (determined
from I/O functions) were earlier indicators of cochlear ototoxicity compared to conventional and HF hearing thresholds
• Group delay values were reduced or prolonged, dependent on cumulative doses of tobramycin
• Some of the subjects’ demonstrated significant elevations in DPOAE detection thresholds compared to controls
• Common DPOAE level measures obtained from frequency sweeps in a group of children and young adults with cystic fibrosis (CF) receiving tobramycin
• Results suggest that assessment of DPOAE group delay and detection thresholds may be more effective tools for monitoring cochlear ototoxicity than the more traditional DPOAE frequency sweep.
Katbamna, Bharti, et al., Ear and Hearing, 1999
FIG. 2. DPOAE level as a function of f2 frequency for a patient receiving Cisplatin (top panels) or Oxaliplatin (bottom panels). Different lines/symbols represent data from different trials and the thin, dashed line denotes the average noise floor across all trials shown in each plot. (A and C) Broad DPOAE f2-sweep completed in gross frequency steps (three octaves in 1 of 6 octave steps). For each row, the arrow indicates the highest f2 yielding a DPOAE level >6dB above the noise floor and an absolute level >20 dB SPL obtained at baseline. This frequency determined the endpoint of a DPOAE f2-sweep completed in finer frequency steps over a narrower range, shown in panels b and d. (B and D) DPOAE fine f2-sweep (2 of 3 of an octave in 1 of 48 steps).
• For DPOAE interpretation– Should be driven by mechanisms and
damage pattern with agent, and population sampled
– A prior selection during baseline testing of single frequency band or frequency-band-average to monitor
– Use absolute value (decrement or increment)
– Criteria should differ by test (e.g., DPOAE vs TEOAE)
DPOAE Change Criteria
• Normative Reference Limits– Works the same way as confidence intervals for determining
whether an ear is normal or impaired using DPOAEs (from Gorga lab or Vanderbilt lab)
– Use established norms for DPOAE level shifts to determine if OHC function has changed or is stable
• Meta-analyses provides accurate estimate (Reavis et al. 2015)
• Also see Konrad-Martin et al. 2018
– Evaluate your own test-retest reliability while monitoring to ensure your results are comparable to the published data
DPOAE Change Criteria
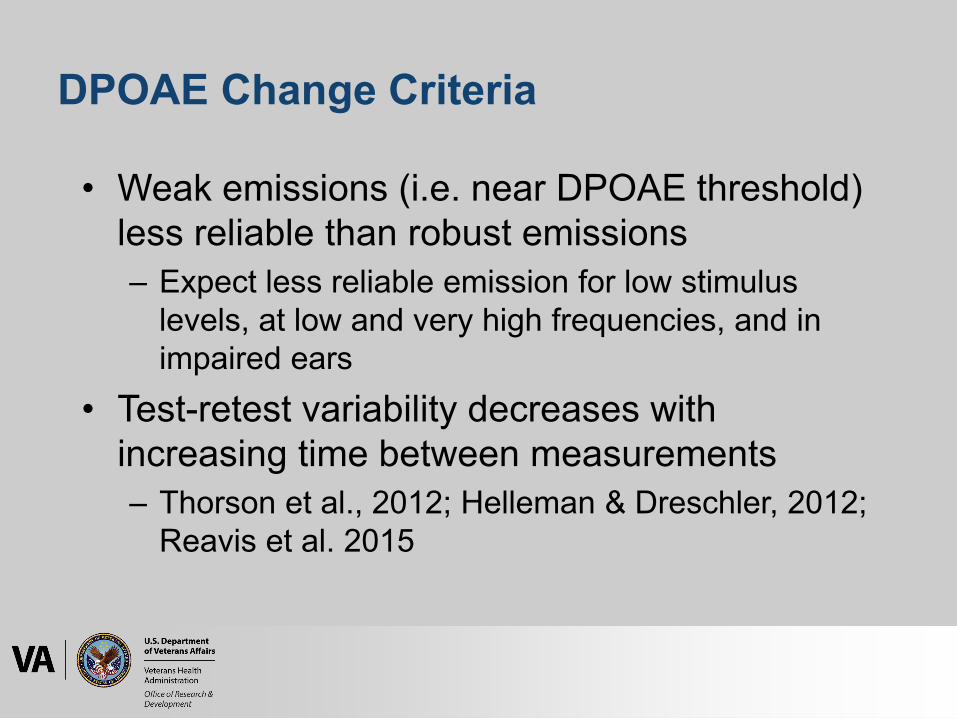
• Weak emissions (i.e. near DPOAE threshold) less reliable than robust emissions – Expect less reliable emission for low stimulus
levels, at low and very high frequencies, and in impaired ears
• Test-retest variability decreases with increasing time between measurements – Thorson et al., 2012; Helleman & Dreschler, 2012;
Reavis et al. 2015
DPOAE Change Criteria
74 subjects, ages 11—76 years. 16 had normal hearing; 58 had hearing loss. DPOAEs obtained at 3 frequencies with L2 ranging from -20 to 80 dB SPL. Figure shows DPOAE level in session 2 as a function of the DPOAE level from session 1.
Note correlations are poorer for low level (and therefore low SNR) recordings. Also note frequency effect.
DPOAE Change Criteria: Test-retest Correlations in Impaired Ears
FIG. 2 from Thorson et al. Ear and Hearing, 2012
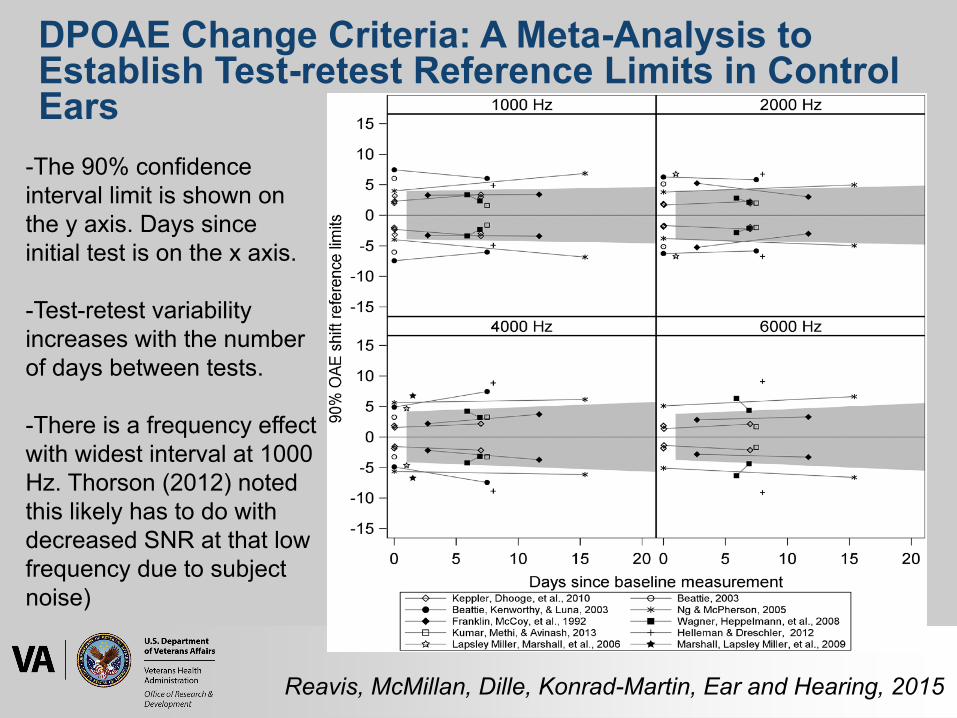
-The 90% confidence interval limit is shown on the y axis. Days since initial test is on the x axis.
-Test-retest variability increases with the number of days between tests.
-There is a frequency effect with widest interval at 1000 Hz. Thorson (2012) noted this likely has to do with decreased SNR at that low frequency due to subject noise)
DPOAE Change Criteria: A Meta-Analysis to Establish Test-retest Reference Limits in Control Ears
Reavis, McMillan, Dille, Konrad-Martin, Ear and Hearing, 2015
Reavis, McMillan, Dille, Konrad-Martin, Ear and Hearing, 2015
DPOAE Change Criteria: A Meta-Analysis to Establish Test-retest Reference Limits in Control Ears
A meta-analysis that compares results across a number of studies to develop robust norms, and norms that cover time span closer to a course of cisplatin.
∆ 8 dB
Ensure your test-retest variability compares to the published data with estimated norms (Reavis et al., 2015)
Caveats for Interpretation• Middle ear function must be normal to interpret results• Hearing loss precluding baseline• OAEs are poor predictors of hearing thresholds when hearing
loss is due to factors other than/in addition to OHC damage• High-frequency measurements limited with current clinical
systems • Multiple stimulus frequencies and test levels used, generating
complex multivariate outcomes• Current calibration techniques, probe placement• “Mixed-source” OAEs challenging to interpret
- Responses may decrease or increase following damage- Basal components” may “fill in” regions of damage
Bramhall, N. F., et al., American Journal of Audiology, 2019
Citation
Reuse/Redistribution of this powerpoint is permitted with proper recognition of VA RR&D NCRAR. Cite the powerpoint as:Konrad-Martin, D; Hawe, L; Poling, G; Hulswit, J; Nofstker, K. (2020). “Ototoxicity Monitoring using Otoacoustic Emissions”VA RR&D National Center for Rehabilitative Auditory Research (NCRAR)
References• Bramhall, N. F., Niemczak, C. E., Kampel, S. D., Billings, C. J., & McMillan, G. P. (2020). Evoked potentials reveal noise exposure–
related central auditory changes despite normal audiograms. American Journal of Audiology. Advance online publication. https://doi.org/10.1044/2019_AJA-19-00060
• D Ress, Bradford., Sridhar, K.S., Balkany, T. J.,, Waxman, G. M., Stagner, B. B., & Lonsbury-Martin, B. L. (1999). Effects of cis-platinum chemotherapy on otoacoustic emissions: The development of an objective screening protocol. Otolaryngology-Head and Neck Surgery, 121(6), 693-701.
• Helleman, H. W., & Dreschler, W. A. (2012). Overall versus individual changes for otoacoustic emissions and audiometry in a noise-exposed cohort. International Journal of Audiology, 51(5), 362-372.
• Katbamna, Bharti; Homnick, Douglas N.; Marks, John H. Effects of Chronic Tobramycin Treatment on Distortion Product Otoacoustic Emissions, Ear and Hearing: October 1999 - Volume 20 - Issue 5 - p 393-402
• Konrad-Martin, Dawn; Poling, Gayla L.; Dreisbach, Laura E.; Reavis, Kelly M.; McMillan, Garnett P.; Lapsley Miller, Judi A.; Marshall, Lynne Serial Monitoring of Otoacoustic Emissions in Clinical Trials, Otology & Neurotology: September 2016 - Volume 37 - Issue 8 - p e286-e294
• Konrad-Martin, D; (2016). Effects of Stimulus Level and Hearing Status on OAE Latencies, presented to San Diego State University• Kumner, P., Janssen, T., & Arnold,W. (1998). The level and growth behavior of the 2 f1-f2 distortion product otoacoustic emission and its
relationship to auditory sensitivity in normal hearing and cochlear hearing loss. The Journal of the Acoustical Society of America, 103(6), 3431-3444.
• Lapsley Miller J.A., & Marshall L. (2007). Otoacoustic Emissions: Reducing and Preventing Noise-Induced Hearing Loss. The ASHA Leader, 12(9), 8-11.
• McMillan GP, Reavis KM, Konrad-Martin D, Dille MF. The• statistical basis for serial monitoring in audiology. Ear Hear• 2013;34:610–8.• Mulheran, M., & Degg, C. (1997). Comparison of distortion product OAE generation between a patient group requiring frequent
gentamicin therapy and control subjects. British journal of audiology, 31(1), 5-9. Reavis et al. 2008• Ramos JA, Kristensen SGB, Beck DL. An overview of OAEs and normative data for DPOAEs. Hearing Review. 2013;20(11):30-33.• Reavis, K. M., McMillan, G. P., Dille, M. F., & Konrad-Martin, D. (2015). Meta-analysis of distortion product otoacoustic emission retest
variability for serial monitoring of cochlear function in adults. Ear and hearing, 36(5), e251.• Reavis, K. M., Phillips, D. S., Fausti, S. A., Gordon, J. S., Helt, W. J., Wilmington, D., ... & Konrad-Martin, D. (2008). Factors affecting
sensitivity of distortion-product otoacoustic emissions to ototoxic hearing loss. Ear and hearing, 29(6), 875-893.• Stavroulaki, P., Apostolopoulos, N., Segas, J., Tsakanikos, M., & Adamopoulos, G. (2001). Evoked otoacoustic emissions—an approach
for monitoring cisplatin induced ototoxicity in children. International journal of pediatric otorhinolaryngology, 59(1), 47-57.• Stavroulaki P, Vossinakis IC, Dinopoulou D, Doudounakis S, Adamopoulos G, Apostolopoulos N. Otoacoustic Emissions for Monitoring
Aminoglycoside-Induced Ototoxicity in Children With Cystic Fibrosis. Arch Otolaryngol Head Neck Surg. 2002;128(2):150–155. doi:10.1001/archotol.128.2.150
• Thorson, M. J., Kopun, J. G., Neely, S. T., Tan, H., & Gorga, M. P. (2012). Reliability of distortion-product otoacoustic emissions and their relation to loudness. The Journal of the Acoustical Society of America, 131(2), 1282-1295.


![individual’s - Home | Aetna Medicaid imaging], magnetic resonance spectroscopy (MRS), PET and SPECT) Neuropsychiatric EEG‐based assessment aid (NEBA) System Otoacoustic emissions](https://static.documents.pub/doc/80x56/5ad2c1137f8b9aff738d1421/individuals-home-aetna-medicaid-imaging-magnetic-resonance-spectroscopy.jpg)


