Empirical analysis of human capital development and economic growth in European regions Hiro Izushi, Robert Huggins In: Descy, P.; Tessaring, M. (eds) Impact of education and training Third report on vocational training research in Europe: background report. Luxembourg: Office for Official Publications of the European Communities, 2004 (Cedefop Reference series, 54) Reproduction is authorised provided the source is acknowledged Additional information on Cedefop’s research reports can be found on: http://www.trainingvillage.gr/etv/Projects_Networks/ResearchLab/ For your information: • the background report to the third report on vocational training research in Europe contains original contributions from researchers. They are regrouped in three volumes published separately in English only. A list of contents is on the next page. • A synthesis report based on these contributions and with additional research findings is being published in English, French and German. Bibliographical reference of the English version: Descy, P.; Tessaring, M. Evaluation and impact of education and training: the value of learning. Third report on vocational training research in Europe: synthesis report. Luxembourg: Office for Official Publications of the European Communities (Cedefop Reference series) • In addition, an executive summary in all EU languages will be available. The background and synthesis reports will be available from national EU sales offices or from Cedefop. For further information contact: Cedefop, PO Box 22427, GR-55102 Thessaloniki Tel.: (30)2310 490 111 Fax: (30)2310 490 102 E-mail: [email protected]Homepage: www.cedefop.eu.int Interactive website: www.trainingvillage.gr
Transcript
Empirical analysis of human capital development and economic growth in European regions
Hiro Izushi, Robert Huggins
In:
Descy, P.; Tessaring, M. (eds)
Impact of education and trainingThird report on vocational training research in Europe: background report.
Luxembourg: Office for Official Publications of the European Communities, 2004(Cedefop Reference series, 54)
Reproduction is authorised provided the source is acknowledged
Additional information on Cedefop’s research reports can be found on:http://www.trainingvillage.gr/etv/Projects_Networks/ResearchLab/
For your information:
• the background report to the third report on vocational training research in Europe contains originalcontributions from researchers. They are regrouped in three volumes published separately in English only.A list of contents is on the next page.
• A synthesis report based on these contributions and with additional research findings is being published inEnglish, French and German.
Bibliographical reference of the English version:Descy, P.; Tessaring, M. Evaluation and impact of education and training: the value of learning. Thirdreport on vocational training research in Europe: synthesis report. Luxembourg: Office for OfficialPublications of the European Communities (Cedefop Reference series)
• In addition, an executive summary in all EU languages will be available.
The background and synthesis reports will be available from national EU sales offices or from Cedefop.
Contributions to the background report of the third research report
Impact of education and training
Preface
The impact of human capital on economic growth: areviewRob A. Wilson, Geoff Briscoe
Empirical analysis of human capital development andeconomic growth in European regionsHiro Izushi, Robert Huggins
Non-material benefits of education, training and skillsat a macro levelAndy Green, John Preston, Lars-Erik Malmberg
Macroeconometric evaluation of active labour-marketpolicy – a case study for GermanyReinhard Hujer, Marco Caliendo, Christopher Zeiss
Active policies and measures: impact on integrationand reintegration in the labour market and social lifeKenneth Walsh and David J. Parsons
The impact of human capital and human capitalinvestments on company performance Evidence fromliterature and European survey resultsBo Hansson, Ulf Johanson, Karl-Heinz Leitner
The benefits of education, training and skills from anindividual life-course perspective with a particularfocus on life-course and biographical researchMaren Heise, Wolfgang Meyer
The foundations of evaluation andimpact research
Preface
Philosophies and types of evaluation researchElliot Stern
Developing standards to evaluate vocational educationand training programmesWolfgang Beywl; Sandra Speer
Methods and limitations of evaluation and impactresearchReinhard Hujer, Marco Caliendo, Dubravko Radic
From project to policy evaluation in vocationaleducation and training – possible concepts and tools.Evidence from countries in transition.Evelyn Viertel, Søren P. Nielsen, David L. Parkes,Søren Poulsen
Look, listen and learn: an international evaluation ofadult learningBeatriz Pont and Patrick Werquin
Measurement and evaluation of competenceGerald A. Straka
An overarching conceptual framework for assessingkey competences. Lessons from an interdisciplinaryand policy-oriented approachDominique Simone Rychen
Evaluation of systems andprogrammes
Preface
Evaluating the impact of reforms of vocationaleducation and training: examples of practiceMike Coles
Evaluating systems’ reform in vocational educationand training. Learning from Danish and Dutch casesLoek Nieuwenhuis, Hanne Shapiro
Evaluation of EU and international programmes andinitiatives promoting mobility – selected case studiesWolfgang Hellwig, Uwe Lauterbach,Hermann-Günter Hesse, Sabine Fabriz
Consultancy for free? Evaluation practice in theEuropean Union and central and eastern EuropeFindings from selected EU programmesBernd Baumgartl, Olga Strietska-Ilina,Gerhard Schaumberger
Quasi-market reforms in employment and trainingservices: first experiences and evaluation resultsLudo Struyven, Geert Steurs
Evaluation activities in the European CommissionJosep Molsosa
AbstractRecent discussion of the knowledge-based economy draws increasingly attention to the role that thecreation and management of knowledge plays in economic development. Development of human capital,the principal mechanism for knowledge creation and management, becomes a central issue forpolicy-makers and practitioners at the regional, as well as national, level. Facing competition both withinand across nations, regional policy-makers view human capital development as a key to strengtheningthe positions of their economies in the global market. Against this background, the aim of this study is togo some way towards answering the question of whether, and how, investment in education and voca-tional training at regional level provides these territorial units with comparative advantages.The study reviews literature in economics and economic geography on economic growth (Chapter 2). Ingrowth model literature, human capital has gained increased recognition as a key production factor alongwith physical capital and labour. Although leaving technical progress as an exogenous factor, neoclas-sical Solow-Swan models have improved their estimates through the inclusion of human capital. Incontrast, endogenous growth models place investment in research at centre stage in accounting fortechnical progress. As a result, they often focus upon research workers, who embody high-order humancapital, as a key variable in their framework. An issue of discussion is how human capital facilitateseconomic growth: is it the level of its stock or its accumulation that influences the rate of growth? Inaddition, these economic models are criticised in economic geography literature for their failure toconsider spatial aspects of economic development, and particularly for their lack of attention to tacitknowledge and urban environments that facilitate the exchange of such knowledge.Our empirical analysis of European regions (Chapter 3) shows that investment by individuals in humancapital formation has distinct patterns. Those regions with a higher level of investment in tertiary educa-tion tend to have a larger concentration of information and communication technology (ICT) sectors(including provision of ICT services and manufacture of ICT devices and equipment) and research func-tions. Not surprisingly, regions with major metropolitan areas where higher education institutions arelocated show a high enrolment rate for tertiary education, suggesting a possible link to the demand fromhigh-order corporate functions located there. Furthermore, the rate of human capital development (at thelevel of vocational type of upper secondary education) appears to have significant association with thelevel of entrepreneurship in emerging industries such as ICT-related services and ICT manufacturing,whereas such association is not found with traditional manufacturing industries.In general, a high level of investment by individuals in tertiary education is found in those regions thataccommodate high-tech industries and high-order corporate functions such as research and develop-ment (R&D). These functions are supported through the urban infrastructure and public science base,facilitating exchange of tacit knowledge. They also enjoy a low unemployment rate.
Empirical analysis of human capitaldevelopment and economic growth
in European regionsHiro Izushi, Robert Huggins
Impact of education and training72
However, the existing stock of human and physical capital in those regions with a high level of urbaninfrastructure does not lead to a high rate of economic growth. Our empirical analysis demonstrates thatthe rate of economic growth is determined by the accumulation of human and physical capital, not bylevel of their existing stocks. We found no significant effects of scale that would favour those regions witha larger stock of human capital.The primary policy implication of our study is that, in order to facilitate economic growth, education andtraining need to supply human capital at a faster pace than simply replenishing it as it disappears fromthe labour market. Given the significant impact of high-order human capital (such as business R&D staffin our case study) as well as the increasingly fast pace of technological change that makes human capitalobsolete, a concerted effort needs to be made to facilitate its continuous development.
Table of contents
1. Introduction 75
1.1. Human capital theory 75
1.2. Regions, states and skills: structure of the report 75
2. Models of economic growth and human capital 77
2.1. Early neoclassical perspectives 77
2.2. Limitations of the Solow-Swan model 78
2.3. Frankel-Romer model: AK approach to endogenous growth 79
2.4. The second Romer model 80
2.5. Schumpeterian growth model 81
2.6. Accumulation or stock? Source of economic growth due to human capital 83
2.7. Regional perspectives 85
2.8. Summary of literature review 88
3. Empirical analysis of regions in Europe 90
3.1. Relationship between investment in education/training and demand for human capital 90
3.1.1. Human capital development and employment patterns 90
3.1.2. Human capital development and public science base 92
3.1.3. Urban/rural settings and human capital development 92
3.1.4. Relationship between human capital development and entrepreneurship 92
3.1.5. Human capital development and unemployment rate 95
3.1.6. Human capital development and economic growth 101
3.2. Formal analysis of the relationship between human capital and economic growth at regional
and national level 101
3.2.1. Estimates at the augmented Solow-Swan model: accumulation of human capital 101
3.2.2. Estimates at the Nelson-Phelps framework: level of human capital stock 104
3.2.3. Human capital and growth: cross-country estimates 106
4. Summary and conclusions 110
4.1. Significance of economic growth models 110
4.2. The regional dimension 110
4.3. Policy implications 111
List of abbreviations 113
Annex 1: Technical difficulty of incorporating increasing returns to a neoclassical 114
model
Annex 2: Growth rate of consumption in Romer (1986) model 115
References 116
List of tables and figures
TablesTable 1: Estimation of the augmented Solow-Swan model with the assumption of a steady state 102
Table 2: Estimation of the augmented Solow-Swan model 103
Table 3: Cross-regional growth accounting results: Human capital in log levels 105
Table 4: Cross-regional growth accounting results: Human capital in levels and in product of levels
and differences from the leading-edge region in labour productivity 107
FiguresFigure 1: A schematic representation of economic activities in the multisector model
(Aghion and Howitt, 1998, p. 86) 82
Figure 2: Interaction between the local education and training system and the locality’s stock
of highly-skilled workers (adopted from Bradley and Taylor, 1996, p. 3) 87
Figure 3: Schematic model of knowledge and production 88
Figure 4: Students in tertiary education as a percentage of working age population
and employment in ICT sectors 91
Figure 5: Students in tertiary education as a percentage of working age population and R&D staff 91
Figure 6: Students in tertiary education as a percentage of population aged 20 to 24 years
and public R&D expenditures 93
Figure 7: Students in tertiary education as a percentage of working age population and population density 93
Figure 8: Students in upper secondary education as a percentage of working age population
and population density 94
Figure 9: Change in students in tertiary education as a percentage of population aged 16 to 19 years
and population density 94
Figure 10: Students in general type of upper secondary education as a percentage
of population aged 16 to 19 years and average firm size in ICT-related services 96
Figure 11: Students in vocational type of upper secondary education as a percentage
of population aged 16 to 19 years and average firm size in ICT-related services 96
Figure 12: Students in general type of upper secondary education as a percentage
of population aged 16 to 19 years and average firm size in ICT manufacturing 97
Figure 13: Students in vocational type of upper secondary education as a percentage
of population aged 16 to 19 years and average firm size in ICT manufacturing 97
Figure 14: Students in tertiary education as a percentage of working age population
and unemployment rate 98
Figure 15: Students in upper secondary education as a percentage of working age population
and unemployment rate 98
Figure 16: Unemployment rate and business R&D staff 99
Figure 17: Per worker GDP growth rate and students in tertiary education as a percentage
of working age population 99
Figure 18: Per worker GDP growth rate and students in general type
of upper secondary education as a percentage of working age population 100
Figure 19: Per worker GDP growth rate and students in vocational type
of upper secondary education as a percentage of working age population 100
1.1. Human capital theory
As the global economy shifts towards moreknowledge-based sectors (e.g. the manufactureof ICT devices, pharmaceuticals, telecommunica-tions and other ICT-based services, R&D), skillsand human capital development becomes acentral issue for policy-makers and practitionersengaged in economic development both at thenational and regional level (OECD, 1996). Yet, theimpact education and vocational training activi-ties exert upon changing national and regionaleconomies remains less than thoroughlyexplained and analysed. Since the introduction ofhuman capital theory in the 1960s, a number ofstudies have attempted to address this andrelated issues.
Human capital theory views schooling andtraining as an investment in skills and compe-tences (Schultz, 1960 and 1961) (Becker, 1964). Itis argued that, based on rational expectations ofreturns on investment, individuals make decisionson the education and training they receive as away of augmenting their productivity. A similarstrand of studies focuses on the interactionbetween the educational/skill levels of the work-force and measurements of technological activity(Nelson and Phelps, 1966). According to thistheory, a more educated/skilled workforce makesit easier for a firm to adopt and implement newtechnologies, thus reinforcing returns on educa-tion and training. Empirical studies provideevidence supporting the aggregate effects ofeducation and training. For example, Griliches(1970) estimated that one third of the Solow(1957) residual (i.e. the portion of the outputgrowth in the US economy that could not beattributed to the growth in labour hours or capitalstock) could be accounted for by the increase inthe labour force’s educational attainments. In thesame vein, Denison (1979) reported the effectupon per capita income in the US, while others –including Baumol et al. (1989), Barro (1991) andMankiw et al. (1992) – have confirmed these posi-tive relationships through a cross-section ofcountries covering all levels of development.
Bartel and Lichtenberg (1987) and Wolff (1996,2001) found that education/skill levels are posi-tively related with technological change in thesectors concerned. Also Crouch et al. (1999)provide a degree of evidence that highlyeducated workers are more likely to be employedin sectors exposed to international competition ina recent period, suggesting close associationbetween education/skill levels of workers andtechnological activity undertaken. Looking atthese impacts upon society as a whole,Abramovitz (1986) argues that education andvocational training is part of a set of key ingredi-ents sustaining society’s growth, which he terms‘social capability’.
1.2. Regions, states and skills:structure of the report
When these impacts of education and vocationaltraining are disaggregated, and their distributionsamong different segments of the society areconsidered, their effects are mixed and hence effec-tive modes for policy intervention are notadequately developed. Unequal effects of skills andhuman capital development are very noticeableamong regions, as well as among nations. A rangeof literature provides empirical evidence concerninginter-regional inequality in labour productivity. Forexample, Dunford (1997) demonstrates persistentdisparities among the UK regions in productivityand economic participation. A recent study we haveundertaken (Huggins and Izushi, 2002) confirms asignificant variation in productivity among advancedregional economies around the globe. This is asource of great concern, since many regions areincreasing their independence as political andeconomic units, and are competing against oneanother. At the same time, powerful multinationalcorporations are becoming evermore footloose,increasingly escaping from the controls of nationstates (Ohmae, 1995).
Hence an important question is whether theinfrastructure and provision of education and
1. Introduction
vocational training at the regional level providesthese territorial units with comparative advan-tages. In order to answer this question satisfacto-rily, it is necessary to understand the manner inwhich skills and human capital developmentexerts its influence on regional and nationaleconomies, as well as the links between the twogeographic layers. The structure of the report isas follows.
Chapter 2 provides an overview of literature oneconomic growth and human capital. As humancapital development and technological progressare inextricably linked, much attention is paid tothe impact of technological progress oneconomic growth. Chapter 2 starts with a reviewof key models of economic growth. This coversan early neoclassical model employed by Solowand Swan, subsequent attempts to account forthe contribution of technological progress toproductivity growth, an endogenous growthmodel developed by Romer, and a Schumpete-rian approach that places innovation at the centreof economic growth. It then looks into an issueraised by Benhabib and Spiegel (1994): howhuman capital affects economic growth. This is
followed by a review of studies that applynational models to regional economies. Thechapter also reviews other models that falloutside the neoclassical framework.
Chapter 3 presents the results of our empiricalanalysis of regions in Europe. The first part looksinto relationships between the supply anddemand of human capital, and between humancapital supply and other economic indicators atregional level. The results show that supply anddemand of human capital development havedistinct patterns relating to educational level aswell as types of regions. The second part ofChapter 3 focuses on the question of whichaffects the economic growth of regions, the rateof accumulation of human capital or the level ofstock of human capital. The empirical analysisdemonstrates that the rate of accumulation ofhuman capital has a clear impact upon economicgrowth at the regional level, while we find nosignificant impact from the level of human capitalstock. This finding provides evidence that refutesBenhabib and Spiegel’s thesis (1994).
Finally, Chapter 4 summarises key findings ofthe study and provides policy recommendations.
Impact of education and training76
2.1. Early neoclassicalperspectives
Although economists have studied economicgrowth for generations, there is still disagreementabout how it is accounted for in a formal model.While some researchers take a Keynesian route andstress the role of demand factors, other researchersfollow the neoclassical route, or more recently aSchumpeterian approach, emphasising the role offactor supplies in growth. In general, supply-sidemodels are designed to uncover production factorsfor economic growth and are hence consideredmore appropriate for the purpose of investigatingthe impact of human capital formation.
Neoclassical growth theory seeks to under-stand the determinant of long-term economicgrowth rate through accumulation of factor inputssuch as physical capital and labour. Studiesreveal a significant contribution from technicalprogress, which is defined as an exogenousfactor. Solow (1957) and Swan (1956) are amongthose who first demonstrated this.
At the heart of the neoclassical model lies anaggregate production function exhibitingconstant returns to scale in labour and repro-ducible capital. This can be written in generalform as follows:
Y = F (K, L)
where Y is output (or income), K is the stock ofcapital, and L is the labour force. The functionexpresses the output Y under a given state ofknowledge, with a given range of available tech-
niques, and a given array of different capital,intermediate goods and consumption goods.With constant returns to scale, output per worker(i.e. labour productivity) y ≡ Y / L will depend onthe capital stock per worker (i.e. capital intensity)k ≡ K / L. Under the assumption of constantreturns to scale, the relationship each unit oflabour has with capital in production does notchange with the quantity of capital or labour inthe economy.
A crucial property of the aggregate productionfunction is that there are diminishing returns onthe accumulation of capital. In other words, eachadditional unit of capital used by a workerproduces a decreasing amount of output (2). Aform called the Cobb-Douglas function usuallyexpresses the relationship:
.
Alternatively the per worker production functioncan be written as:
.
In other words, labour productivity can increaseonly if there is capital deepening (i.e. if capitalintensity increases) (3).
The crucial tenet of the neoclassical model is that,under decreasing returns on capital, output perworker does not increase indefinitely. Assuming:(a) people save a constant fraction s of their
gross income y (4);(b) the constant fraction δ of the capital stock
disappears each year as a result of deprecia-tion;
αkkfy == )(
10,1 <<= − ααα KLY
2. Models of economic growth and human capital (1)
(1) This literature review section owes much to Aghion and Howitt (1998), Armstrong and Taylor (2000), and Richardson (1979) aswell as Harris (2001) and Romer (1986 and 1990).
(2) This is expressed in mathematical terms, F’(K) > 0 and F’’(K) < 0 for all K.
(3) The idea is also expressed in mathematical terms as follows: .
(4) While the assumption of a fixed saving rate is not a bad approximation to long-term data, many argue that people save at arate that varies over their life. The permanent-income and lifecycle hypothesis presumes that people save with a view tosmoothing their consumption over their lifetimes, taking into account their preferences for consumption at different dates andthe rate of return that they can anticipate if they sacrifice current consumption in order to save for the future (Aghion andHowitt, 1998, p. 17-18). A model based on this assumption is the Cass-Koopmans-Ramsey model.
kLKLYydtdk
dtdL
dtdK
dtdL
dtdY
dtdy
αα =
−
=−=
(c) the rate of population growth is n, and popu-lation growth will cause the capital stock perworker k to fall at the annual rate nk;
then the net rate of increase in k can be writtenby the following equation as:
.
While the decline in the capital stock per workerdue to depreciation and population growth isproportional to the capital stock, the growth ofper worker capital through saving is constrainedby decreasing returns on capital in production.When the marginal product of capital per workerfalls to a sufficiently low level, gross investmentwill be just sufficient to maintain the existingstock of capital. Hence, the capital stock perworker will, in the long term, converge asymptot-ically to k* that is defined by:
.
In this steady-state equilibrium, output and thecapital stock will both continue to grow, but onlyat the rate of population growth.
The model’s implication does not account forempirical evidence of long-term growth. Usingthis framework, Solow (1957) demonstrated thatan attempt to account for decades of USeconomic growth produced an astonishingresidual of approximately 85 %. Solow attributedmost of the residual to technological change (5).Accordingly, we can modify the neoclassicalmodel by supposing that there is a productivity(or technology) parameter A in the aggregatefunction that reflects the current state of techno-logical knowledge.
Y = F (A, K, L).
Assuming that productivity increases smoothlyover time at a constant growth rate g (6),
.
From this, it follows that growth in income isdetermined by productivity growth g and thegrowth of capital per worker (7). Hence, even ifthe capital stock and the labour force grow at thesame rate, output per worker will increaseprovided that the rate of technical progress ishigher than zero.
2.2. Limitations of theSolow-Swan model
An obvious limitation of the Solow-Swan model isits failure in accounting for the causes of techno-logical progress. Although the model shows thattechnological progress contributes to economicgrowth, it does not spell out why technologicalprogress takes place. The rate of technologicalprogress is set at g without any theoretical rela-tionships with other variables within the model(i.e. the rate is set exogenously). The justificationnormally given is that technological change origi-nates from knowledge produced by the publicscience base (e.g. universities, public researchinstitutes) outside the domain of the economicsystem the model expresses (Solow, 1957) (Shell,1966 and 1967).
However, there is every reason to believe thattechnological progress itself depends oneconomic decisions, to much the same degree ascapital accumulation. Entrepreneurs look forways to make a profit and one way of doing thisis to produce new ideas. Since there is a profitincentive to produce new knowledge and to inno-vate, knowledge creation and innovation need tobe incorporated into a model of economic growthin such a way that, while they spur economicgrowth, they are in turn further advanced byeconomic growth. In other words, technologicalprogress needs to be endogenised.
Another issue of the Solow-Swan model is itsassumption of constant returns to scale. There issome evidence that suggests increasing returns in
αα −= 10 LKeAY tg
0)( * =+− knsk δα
( ) knskknksfdtdk
)()( δδ α +−=+−=
Impact of education and training78
(5) It is worth noting that neither capital stock K nor labour force L included human capital in Solow’s calculation. The modelassumes that labour is homogeneous.
(6) Namely, .
(7) In mathematical terms, this is expressed as, .k
gLK
gLYy
dtdk
dtdL
dtdK
dtdL
dtdY
dtdy
αα +=
−
+=−=
tgeAA 0=
long-term economic growth. For example,Kendrick (1976) attempted to explain US economicgrowth by adding intangible investments, such ashuman capital (e.g. R&D and education andtraining), to the capital stock that normally consistsof tangible components (i.e. physical capital andlabour). Such intangible investments can becounted as capital stock because they must have alifetime of more than one year, that is, they improvethe quality of the tangible factor over two or moreannual accounting periods. However, he found that,between 1929 and 1969, an annual growth rate inreal total capital (2.4 %) represented only 70 % ofthe 3.4 % average annual growth of real product inthe private domestic business economy (Kendrick,1976, p. 131). Romer (1986, p. 1013) suggests that,given the repeated failure of this kind of growthaccounting exercise, there is no basis in the data forexcluding the possibility that aggregate productionfunctions are best described as exhibitingincreasing returns.
The idea that increasing returns are central to theexplanation of long-term growth is at least as old asAdam Smith’s story of the pin factory (Smith, 1776).Alfred Marshall (1890) introduced the concept ofincreasing returns that are external to a firm butinternal to an industry. Allyn Young furthered theidea with his competitive equilibrium interpretation,though no formal dynamic model embodying thatinsight was developed. Kenneth Arrow (1962)assumed that the productivity of a given firm is anincreasing function of cumulative aggregate invest-ment for the industry. Avoiding issues of specialisa-tion and divisions of labour, Arrow argued thatincreasing returns arise because new knowledge isdiscovered as investment and production takeplace (Romer, 1986, p. 1005).
The failure of neoclassical models to introducetechnological progress in such a way to account forits causes (i.e. endogenise technological progress)is, in large part, due to technical difficulty dealingwith increasing returns in a dynamic general equi-librium framework. Attempts to understand
increasing returns have sought their source in tech-nological progress. However, the approach entailstechnical difficulty if it is to maintain the Walrasianframework of marginal product (8).
Arrow (1962) avoided the problem by assumingthat the growth of productivity A is an unintendedconsequence of the experience of producing newcapital goods, a phenomenon he called ‘learningby doing’. He assumed that an increase in Knecessarily leads to an equiproportionate increasein knowledge through ‘learning by doing’. In hismodel, K and L are paid their marginal productsas those firms that produce capital goods are notcompensated for their learning by doing(i.e. contribution to a growth in A). Yet, the growthof A became endogenous in the sense that itwould increase saving propensity, which would inturn affect output up to an equilibrium point. TheArrow model is fully operational in the case of afixed capital/labour ratio. This implies that themodel does not have enough increasing returns tosustain output growth in the long term withoutgrowth in labour, as in the Solow-Swan model(Aghion and Howitt, 1998, p. 23).
2.3. Frankel-Romer model: AKapproach to endogenousgrowth
More recent attempts to endogenise technolog-ical progress were spurred by Paul Romer’s twoseminal papers (1986 and 1990). Of these, thefirst 1986 paper has its theoretical origin inFrankel’s (1962) AK model (9). Frankel assumedthat each firm j in the economy has a productionfunction expressed as:
where Kj and Lj are the firm’s own employment ofcapital and labour. He then extended this produc-
αα −= 1jjj
LKAY
Empirical analysis of human capital development and economic growth in European regions 79
(8) Aghion and Howitt (1998) put this as follows:... if A is to be endogenized, then the decisions that make A grow must be rewarded, just as K and L must be rewarded. Butbecause F exhibits constant returns in K and L when A is held constant, it must exhibit increasing returns in three ‘factors’ K,L, and A. Euler’s theorem tells us that with increasing returns not all factors can be paid their marginal products. Thus some-thing other than the usual Walrasian theory of competitive equilibrium, in which all factors are paid their marginal products,must be found to underlie the neoclassical model (p. 23).See Annex 1 for technical explanation of this.
(9) Aghion and Howitt, 1998, p. 25.Apparently Romer himself did not realise the theoretical lineage since he did not cite Frankel’s work in his 1986 paper.
tion function to the whole economy, assumingthat all firms face the same technology and thesame factor prices, and will hire factors in thesame proportions, which obtains:
. (1)
To endogenise the productivity parameter A,Frankel assumed that it is a function of the overallcapital/labour ratio:
because in many respects the stock of knowl-edge depends on the amount of capital perworker in the economy. This is based on the ideathat technological knowledge is itself a kind ofdisembodied capital good (10).
Another assumption made in Frankel’s modelis that although A is endogenous to the economy(i.e. related to changes in K and L), it was takenas given by each firm, because the firm wouldonly internalise a negligible amount of the effectthat its own investment decisions have on theaggregate stock of capital.
When α + β = 1, equation (1) becomes Y = AK.This form of model is referred to as the AK model.Diminishing returns on the accumulation ofcapital play a crucial role in limiting growth inneoclassical models like the Solow-Swan model.However, in the Frankel model, output grows inproportion to capital because of the effect ofknowledge creation activities that counteractdiminishing returns.
In his 1986 paper, Romer in effect extendedthe Frankel model by introducing a lifetime utility
function , where c(t) is the
time path of consumption per person, u(.) is aninstantaneous utility function exhibiting positivebut diminishing marginal utility, and ρ is a positiverate of time preference. Romer assumed aproduction function with externalities of the samesort as considered by Frankel, and examined thecase in which labour supply per firm was equal to
unity (i.e. L=1) and the rate of depreciation δ waszero. If it is supposed that the productivityparameter A reflects the total stock of accumu-lated capital NK where N is the number of firms,
.In a steady-state growth, consumption (11) and
output grow at the same rate g, which isexpressed as:
if α + β. This indicates that the larger the numberof firms N, the more externalities there will be inproducing new technological knowledge andtherefore the faster the representative firm andthe economy will grow (12).
As shown above, the AK approach introducesa specific relationship between technologicalprogress and capital accumulation by assumingthat knowledge is a sort of capital good andproductivity increases with capital per labour.However, accumulation of knowledge is stillexternal in the relationship since the approachdoes not explicitly express how knowledgecreation is remunerated.
2.4. The second Romer model
Romer takes a different approach to accounting fortechnological progress in his article published in1990. While he saw knowledge as part of the aggre-gate capital K and related technological progress toan increase in capital/labour ratio in his 1986 article,Romer focused this time on the production ofknowledge by research workers. This modelassumes that technological knowledge islabour-augmented, enhancing their productivity.The production function is expressed as:
(2)
so that AL denotes a knowledge-adjusted work-force. Further, the model assumes that research
( ) αα −= 1ALKY
εραα −=
− ANg
1
β)(NKAA =
( )dttcueW t )(0∫∞ −= ρ
( )βLKAA /=
αα −= 1LKAY
Impact of education and training80
(10) Aghion and Howitt (1998) explains this:It [technological knowledge] can be used in combination with other factors of production to produce final output, it can bestored over time because it does not get completely used up wherever it is put into a production process, and it can be accu-mulated through R&D and other knowledge-creation activities, a process that involves the sacrifice of current resources inexchange for future benefits (p. 25-26).
(11) The growth rate of consumption under the model is given in Annex 2.(12) In his 1986 article, Romer in fact assumed α + β > 1, that is, increasing social returns on capital.
workers create technological knowledge. In asimple form, this is expressed as:
(3)
where HA is human capital of research workers,and δ is a parameter. It is plain to see that themore researchers, the more new ideas arecreated, and the larger the existing stock ofknowledge A, the more new ideas are produced(i.e. effect of externalities).
Equation (3) shows that the rate of technicalprogress will be determined by the stock of humancapital of research workers. In other words, aneconomy with a larger total stock of human capitalwill grow faster (Romer, 1990, p. S99).
It is worth emphasising that unlike his previousmodel, the second Romer model explicitly recog-nises the role human capital plays in economicgrowth. Also the model differs from humancapital models such as the one developed byBecker et al. (1990) that treats all forms of intan-gible knowledge as being analogous to humancapital skills that are rival and excludable. Thesecond Romer model includes two distinct waysin which knowledge enters production. One is thecontribution of new ideas (or designs in Romer’sterm) to producing new goods. Research workersemployed by firms undertake the production ofnew designs. New designs are nonrival butexcludable as their property rights are protectedby patents. At the same time, new designs alsoincrease the total stock of knowledge shared bythe community of research workers and therebyincrease the productivity of human capital in theresearch sector as a whole. Knowledge spilloversimply externalities: knowledge is thus nonexclud-able in this realm (Romer, 1990, p. S84).
2.5. Schumpeterian growth model
Introducing the rival property of knowledgeprotected by property rights, the second Romermodel adopts a Schumpeterian view of innova-tion and explicitly assumes market power. Theidea was furthered in the 1990s by those modelsthat assumed imperfect competition and elabo-rated more on the process of innovation. Amongthose early attempts was that of Segerstromet al. (1990), who modelled sustained growth asarising from a succession of product improve-ments in a fixed number of sectors. However,Segerstrom et al. did not integrate the uncertainnature of innovation in their model. The introduc-tion of uncertainty had to wait for the modelproposed by Aghion and Howitt (1992). Aghionand Howitt assumed the creation of innovationsthrough research as a stochastic process inwhich the innovation quantity is expressed asflow probability. As a specific form of thestochastic process, a Poisson process isnormally adopted (13).
Aghion and Howitt (1998) extended the modelto include more than one economic sector and toconsider technology spillovers across sectors(Figure 1). In the model, there is one final goodthat is produced from a continuum of interme-diate goods. Each intermediate good can beused to produce the final good independently ofthe other intermediate goods, with no comple-mentarities between them. Each intermediatesector is monopolised by the holder of a patentto the latest generation of that intermediate good.Also each intermediate sector has its ownresearch sector in which firms compete todiscover the next generation of that particulargood. Innovations in research sectors all draw onthe same pool of shared technological knowledgethat exist beyond sectoral boundaries. The stateof this knowledge is represented by leading-edge
AHdtdA
Aδ=
Empirical analysis of human capital development and economic growth in European regions 81
(13) Suppose that events of a particular kind occur at random during a particular time. Poisson process has the probability distri-bution that meets the following four conditions:(a) The probability that each event occurs in a very short time interval must be proportional to the length of this time interval.(b) The probability that two or more events of the relevant kind occur in a very short time interval must be so small that it can
be regarded as zero.(c) The probability that a particular number of these events occurs in a particular time interval must not depend on when this
time interval begins.(d) The probability that a particular number of these events occurs in a particular time interval must not depend on the number
of these events that occurred prior to the beginning of this time interval.(Mansfield, 1980).
technology. Each innovation at date t in anysector adds an increment to the level of theleading-edge technology at date t – 1 andpermits the innovator to start producing in hissector using the new level of the leading edgetechnology. The previous incumbent in sector i,whose technology is no longer leading-edge, willbe displaced. Hence the leading-edge technologygrows gradually, at a rate that depends on theaggregate flow of innovations in the economy asa whole.
Aghion and Howitt (1998) also incorporated intheir model horizontal imitation as a source torestrict effects of increasing returns to scale.While the neoclassical theory of Solow and Swanassumes constant returns to scale, R&D modelsof growth no longer have constant returns in allthe factors that are growing: capital, knowledgeand labour. Growth models proposed by Romer(1990), Grossman and Helpman (1991), andAghion and Howitt (1992), for example, predictthat the steady-state growth rate depends on thelevel of resources devoted to R&D – if the level ofR&D resources is doubled, then per capitagrowth in output should also double. Jones
(1995) criticises this, showing the dramaticincrease of scientists and engineers in the USduring the last 40 years contradicting a constantmean of the growth rate of the economy over thesame period. To counter this, Aghion and Howittargue that a source that limits such scale effectsis imitations and a resultant growth of interme-diate goods in the economy without adding tooverall productivity.
The steady-state growth rate of per-workerincome g, which equals the growth rate ofleading-edge technology, is expressed as:
where σ is the size of an average increment ofknowledge that is added to the level ofleading-edge technology at each innovation, λ isthe productivity of R&D, n is the amount of inputin research which is adjusted by the level of theleading-edge technology (14), and φ(·) is a func-tion of the probability with which innovations takeplace (15). In other words, the steady-state growthrate g depends positively upon the productivity ofR&D (λ). Also, the flow probability of innovations
)(ng φλσ=
Impact of education and training82
(14) It is presumed that as technology advances, the resource cost of further advances increases proportionally.(15) The function of innovation probability φ(·) has the property that represents a decreasing marginal product of research input n.
The function’s property is due to research congestion within a product.
Figure 1: A schematic representation of economic activities in the multisector model (Aghion andHowitt, 1998, p. 86)
depends positively on technology-adjusted inputin research (n). Given the same level ofleading-edge technology, the growth ratedepends positively upon research input. Further,as an effect of horizontal imitation, Aghion andHowitt argue that the steady-state growth rate ofper-worker income also depends positively onpopulation growth (16).
2.6. Accumulation or stock?Source of economic growthdue to human capital
The above review shows that models ofeconomic growth vary in the ways they predictproduction factors can cause an economy togrow. According to the Solow-Swan model, thegrowth of per capita income arises from accumu-lation of capital until the economy reaches asteady state. In the steady state, per capitaincome growth relies solely on technologicalprogress that the model does not attempt toexplain. In contrast, endogenous growth modelsset R&D at the centre of their framework. Theypredict that per capita income growth is deter-mined by the amount of resources devoted toR&D. The neoclassical Solow-Swan model seesthe change in the amount of capital (i.e. capitalaccumulation) as the source of economic growth(until the economy reaches a steady state),whereas endogenous growth models assumethat the level of the stock of a particular capital(that is devoted to R&D) decides economicgrowth.
This disagreement about the source of economicgrowth is also found in discussions on humancapital. Broadly, there are two basic frameworkswith which to model and analyse the relationshipbetween human capital formation and economicgrowth (Benhabib and Spiegel, 1994) (Aghion andHowitt, 1998). The first approach has its origin inBecker’s (1964) theory of human capital and hasattracted attention with the 1988 article by Lucas. Itis based on the idea that growth is primarily drivenby the accumulation of human capital. According to
this approach, differences in growth rates of percapita income across economies are in large partaccounted for by differences in the rates at whichthe economies accumulate human capital. Thesecond approach dates back to the seminal paperof Nelson and Phelps (1966) and has recently beenrevived in Schumpeterian growth literature. Itcontends that the stock of human capital deter-mines the economy’s capacity to innovate or catchup with more advanced economies, which in turndrives economic growth. Hence, the level of humancapital stock is, though indirectly, a determinant ofper capita economic growth in this view.
In the economy assumed by Lucas (1988),individuals choose at each date how to allocatetheir time between current production and skillsacquisition (or schooling), taking into accountincreases in productivity and wages in futureperiods that arise from current investment of timein education or training. If h denotes the currenthuman capital stock of the representative person,and u denotes the fraction of the person’s timecurrently allocated to production, the Lucasmodel can be summarised by:
y = kβ (uh)1–β
where k denotes the per capita stock of physicalcapital, and:
, δ > 0.
While the second equation expresses that thegrowth rate of human capital is determined by timespent in education or training, the first equationdescribes the way human capital affects currentproduction. As the first equation’s similarity to theSolow-Swan model suggests, per capita incomegrowth comes from accumulation of human capital(as well as accumulation of physical capital). Inother words, the growth rate of per capita incomedepends positively on the growth rate of humancapital (as well as the growth rate of physicalcapital). Under the assumption of constant returnsto the stock of human capital, the steady-stategrowth is expressed by:
)1( ∗−= ug δ
)1( uhdtdh −= δ
Empirical analysis of human capital development and economic growth in European regions 83
(16) Aghion and Howitt (1998, p. 108) note: This new effect [of imitation] shows that what used to be thought of as an embarrassingscale effect in Schumpeterian growth theory can be seen … as a novel prediction that distinguishes it from the neoclassicaltheory of Solow and Swan. Instead of saying that growth goes up with the level of population, it goes up with the growth rateof population.
where u* is the optimal allocation of individuals’time between production and education/training.
In contrast, Nelson and Phelps (1966)suggested that this standard view of humancapital as an additional input would represent agross misspecification of the production process.They argued that education and training facilitatethe adoption and implementation of new tech-nologies, which are continuously invented at anexogenous rate. In their view, the growth ofproductivity parameter A is expressed by:
where Tt denotes the level of theoretical knowl-edge at date t. It is evident in the specificationthat the growth rate of A depends on the gapbetween its level and the level of T, and the levelof human capital H through the function c(H)
where (17).
Extending the model, Benhabib and Spiegel(1994) substituted technology ‘catch-up’ acrossdifferent economies for the closing of a gapbetween A and T in the Nelson and Phelps frame-work. According to Benhabib and Spiegel, thegrowth rate of productivity parameter A for aneconomy i is written as:
(4)
where the endogenous growth rate g(Hi) and thecatch-up coefficient c(Hi) are non-decreasing func-tions of Hi. In other words, the level of human capitalnot only enhances the ability of an economy todevelop its own technological innovations (as in R&D-based growth models), but also its capacity to adaptand implement technologies developed elsewhere.
There is disagreement in empirical evidence as towhich influences economic growth – accumulationof human capital or level of human capital stock.
In a cross-country study of per capita GDPgrowth during two periods (from 1965 to 1975with 87 countries and from 1975 to 1985 with97 countries), Barro and Sala-i-Martín (1995)obtained the following findings:(a) educational attainment (measured by average
years of schooling) is significantly correlatedwith subsequent growth (with a correlationcoefficient at around 0.05), although if theaggregate measure of educational attainmentis decomposed by level of education, theimpact of primary education remains largelyinsignificant;
(b) public spending on education also has asignificantly positive effect on growth: a 1.5 %increase of the ratio of public educationspending to GDP during the period 1965-75would have raised the average growth rateduring the same period by .3 % per year (18).
Mankiw et al. (1992) also tested the impact ofhuman capital formation using the Solow-Swanmodel. In their test, they assumed a steadystate (19) and used a proxy for the rate of humanti
titjj
ii
ti
dt
dA
A
AAHcHg
A
ti −⋅+=
max)()(
0>dHdc
( )t
ttdtdA
A
ATHc
A
−⋅=
Impact of education and training84
(17) The growth rate of A settles down to the growth rate of T in the long-term.(18) Barro and Sala-i-Martín assume that a function for a country’s per capita growth rate in period t, Dy, as
Dyt = F(yt–1, ht–1; ...),
where yt–1 is initial per capita GDP and ht–1 is initial human capital per person (based on measures of educational attainmentand health). The omitted variables, denoted by ..., comprise an array of control and environmental influences.
(19) Mankiw et al. use an augmented Solow-Swan model that is expressed as:
where H is the stock of human capital. When the fraction of income invested in physical capital is sk, and the fraction of incomeinvested in human capital is sh, the evolution of the economy is determined by:
where y = Y/AL, k = K/AL, h = H/AL, , n is growth rate of L, g is growth rate of A, and δ is depreciation rate. In the steady state,the following equation holds:
.( ) ( ) hktt ssgngtALY log1
log1
log1
loglog 0 βαβ
βααδ
βαβα
−−+
−−+++
−−+−+=
htht
ttkt
kgnysdt
dh
kgnysdt
dk
)(
)(
δ
δ
++−=
++−=
( ) βαβα −−= 1ttttt LAHKY
capital accumulation that measures approxi-mately the percentage of the working age popu-lation that is in secondary school. In the test thatexamined GDP per working age person in 1985for 98 non-oil countries, Mankiw et al. found thatthe coefficient on human capital accumulation issignificant, that is, human capital accumulation,along with physical capital accumulation,accounts for the growth of per capita GDP.
In contrast, Benhabib and Spiegel (1994) esti-mated the stock of human capital and tested theaugmented Solow-Swan model without theassumption of a steady state (20). From the dataof 78 countries during the period of 1965-85,Benhabib and Spiegel found that the log differ-ence in human capital in their specificationalways enters insignificantly, and almost alwayswith a negative coefficient. In other words, humancapital accumulation is found to lead to a nega-tive growth of the economy although this impactis statistically not significant.
Benhabib and Spiegel then undertook testsusing different models that included the stock ofhuman capital instead of the accumulation ofhuman capital. In the model that includes anaverage of human capital stock over the periodunder study, human capital stock enters insignifi-cantly with a negative sign (21). However, wheninitial income levels are introduced in the model,human capital stock enters significantly with thepredicted positive sign. Benhabib and Spiegelsuggest that catch-up remains a significantelement in growth, and countries with highereducation tend to close the technology gap fasterthan others. In the second model that incorpo-rates both endogenous growth and catch-upterms as in equation (4) (22), the catch-up termenters positively and significantly for the entiresample of 78 countries. However, the coefficientestimate on country-specific technological
progress is negative and insignificant. Benhabiband Spiegel tested the same model for subgroupsof their sample, assuming that the relatively strongimpact of the catch-up term may change with therelative position of the country. They found:(a) for the poorest third of their sample, the
catch-up term is positive and significant,whereas the endogenous growth term isnegative and insignificant;
(b) for the middle group, both terms are insignifi-cant;
(c) for the richest third of the sample, theendogenous growth term enters positivelyand significantly with a 6 % level of confi-dence while the catch-up term enters insignif-icantly with a coefficient estimate that is posi-tive but close to zero.
From these results, they argue that humancapital stocks in levels, rather than their growthrates, play a role in determining the growth of percapita income.
2.7. Regional perspectives
These models of economic growth are usuallydeveloped with respect to national-leveleconomic growth and treat nations as spacelessunits. The lack of attention to space attractedstrong criticism from those who study regionaleconomies. The determinants of growth overspace carry certain implications that are not easyto reconcile with the central principles of growthmodels, and particularly neoclassical models.Richardson (1979, p. 142) summarises suchneoclassical principles as:(a) reliance on the price mechanism as the
spatial allocator of resources;(b) emphasis on marginal adjustments, whereas
spatial functions are discontinuous and loca-
Empirical analysis of human capital development and economic growth in European regions 85
(20) They assumed a production function, , and used the following equation to examine the impact of humancapital accumulation:
.
(21) The model’s specification is as follows:
.
(22) The model’s structural specification is as follows:
tion changes usually mean inertia (i.e. nochange) or a long-distance jump;
(c) the assumption that growth can be construc-tively analysed with an aggregate productionfunction and a homogenous capital stock;
(d) the predilection for equilibrium solutions;(e) a greater facility with deterministic rather than
probabilistic solutions.A central weakness of neoclassical models lies
in the assumption that all factors of productionare completely mobile between regions within acountry. The weakness is particularly acute whenneoclassical models are employed to account forlong-term regional disparities in economic devel-opment. The assumption of mobile factors withina country predicts that any differences in thecapital/labour ratio, and thus labour productivity,between regions disappear in the long term ascapital and labour move to the regions that yieldthe highest returns (23).
As for short- or mid-term disparities, theassumption of nonexcludable knowledge posesanother problem. This is because technologicalknowledge is assumed to be perfectly mobilebetween regions and always available to allregions simultaneously. For instance, the partic-ular assumption limits the application of theRomer models to the world economy as a wholebecause technological progress diffuses acrossgeographical space so that even smalleconomies can benefit from it without having torely on knowledge created within their own fron-tiers (Armstrong and Taylor, 2000, p. 79) (24).However, innovations do not diffuse instanta-neously or at an even rate over the economy as awhole. They diffuse irregularly though predictably,reaching some areas very early in the adoptionstage but not being adopted in other areas untilvery late. In some cases (e.g. when a thresholdmarket is required), adoption at a particular loca-tion may never occur (Richardson, 1979,p. 125-126). The pioneering study in this area,Hägerstand (1966), focusing on agricultural inno-
vations, demonstrated the importance of thecommunications network as a determinant of thediffusion path (25). He also showed that the diffu-sion process could be understood by a model ofstochastic process (26).
Another aspect of nonexcludable knowledge isthat some types of knowledge are embodied inindividuals (i.e. tacit) and difficult to transferthrough other means than interpersonal, oftenface-to-face communications. This needs tobring another class into the second Romermodel: tacit knowledge embodied in individualsshould be distinguished from patent-protectedknowledge and shared, codified knowledge. Tacitknowledge also signifies the importance ofhuman capital that represents a carrier of suchknowledge. Some even argue about a region’sinstitutional environment as a key determinant ofits capacity to create technological progress(Rauch, 1993). According to this view, thecreation of technological progress is determinedby a collective learning process within whichmany individuals interact and exchange ideasand information (some of which are tacit). Thereare economies of scale to be gained from thegeographical concentration of highly educatedpeople as this results in a more rapid transfer ofknowledge through their proximity. In addition tothis, some regions are said to possess an institu-tional environment or culture that better facilitatessuch a collective learning process (Saxenian,1994). In addition to universities and researchinstitutes, a vertically-disintegrated industrialstructure, a high mobility of skilled workers, andan abundance of venture capital are often foundin such an environment.
Regarding mobility of human capital betweenregions, Bradley and Taylor (1996) argue thatthere is a sequential interaction between the localeducation and training system and the locality’sstock of highly-skilled workers. This is shown inFigure 2.
The rate of enrolment in education is influ-
Impact of education and training86
(23) This weakness is mitigated when discussing disparities between nations because international mobility of labour is restrictedby immigration regulations.
(24) Based on the assumption, Romer argues that a country’s economic growth is correlated with the degree of its integration intoworldwide markets.
(25) The classic study of the diffusion of hybrid corn by Griliches (1957) looked at inter-state differentials but did not explicitly inves-tigate the spatial spread of the innovation (Richardson, 1979, p.125).
(26) Innovations diffuse over space and time. A common way of representing general spatial diffusion radiating out from the inno-vation source is expressed by a distance-decay function: p(r) = ae-br
enced by the socioeconomic background ofpupils, employment and career prospects in thelocal economy, and the quality of local schooling.Enrolment, in turn, determines the locality’s work-force skills, labour productivity, and economicperformance. Its economic performance thendetermines the volume and occupational mix ofinward migrant workers into the locality.Economic growth also provides employers withmore worker training, facilitating further skillsincrease. A shift in the occupational mix towardsskilled workers will have beneficial effects on thelocality’s human capital formation. While skilledworkers are often keen to invest in education fortheir children, an improved economy alsoprovides better employment opportunities andinduces other pupils to seek for education andtraining. Hence, Bradley and Taylor argue that theeducation and training system interacts with thelocal economy in such a way that spatial dispari-ties in economic well-being are exacerbatedthrough the cumulative causation mechanism.
A summary of our review of regional studies isgiven in Figure 3. While regional studies literature
shares a basic understanding of production witheconomics literature, it pays more attention to theway space affects economic production.
It particularly elaborates more on the effects ofspatial agglomeration of economic activity andattempts to identify causes of spatial agglomera-tion as well as its effects. Distinction betweencodified knowledge and tacit knowledge isemphasised in the attempt. It is argued that tacitknowledge is embodied in skilled workers andless mobile than codified knowledge. Hence, theassumption of frictionless diffusion of technolog-ical knowledge is under attack. Also drawing onmore institutional studies than mainstreameconomics, such as the theories of transactioncosts (Williamson, 1975 and 1985) and socialembeddedness (Granovetter, 1985), the literatureoften examines social aspects of relationsbetween economic agents. These efforts lead tothe conceptualisation of other types of produc-tion factors, such as social capital and networkcapital. Another area of focus is economic dispar-ities between regions that arise from spatial divi-sions of labour. It is often argued that high-order
Empirical analysis of human capital development and economic growth in European regions 87
Figure 2: Interaction between the local education and training system and the locality’s stock ofhighly-skilled workers (adopted from Bradley and Taylor, 1996, p. 3)
Investmentin training
Post-schoolemploymentopportunities
Human capital formationthrough education
Haspirations, goals andmotivation of students
Workforce skills
Labour productivity
Inward migration ofhigh-skill workers
Growth of human capital stock
Growth of local economy
functions that require significant human capitalare concentrated in core regions (due to agglom-eration effects), creating regional disparities.Regional studies and economic studies of growthhence intersect at the issue of convergence.
2.8. Summary of literature review
The literature review shows that human capitalattracts more attention as economic growth
models attempt to account for technologicalprogress in greater detail. In the classicSolow-Swan model, technological progress wasidentified as a residual that is not explained bycapital and labour. Though capital in the modelcan theoretically include both human and phys-ical capital, human capital was, in practice, notconsidered in many empirical studies employingthe model. As a step towards accounting betterfor the role of technological progress in economicgrowth, the Fankel’s AK model related it to an
Impact of education and training88
Figure 3: Schematic model of knowledge and production
Education and trainingLabour mobilityLearning and imitation
DIFFUSION OFKNOWLEDGE
PRODUCTION OFKNOWLEDGE
ResearchLearming by doing
PRODUCTION
Knowledge
General knowledgeAccumulated stock
as public goods
Private knowledgeAppropriated by
businesses
Social Environment
Disposition tosocial interactionHuman Capital
Embodyingknowledge througheducation & training
Network Capital
Knowlefge ofknow-who and
state of economicgovernance
LabourPhysicalCapital
increase in capital per worker, seeing knowledgeas a sort of disembodied capital. Romer (1986)refined the model by incorporating maximisationof lifetime utility with an intertemporal utility func-tion. Yet, both the original Frankel AK model andthe first Romer model did not give any explicitrole to human capital.
In contrast, Romer’s second endogenousgrowth model (1990) recognises human capital asa primary source of technological progress and,therefore, economic growth. Romer viewsresearch workers as the source of new ideas andhence profits. In the model, Romer also distin-guishes patent-protected technology from thestock of knowledge that is shared by the commu-nity of research workers. Other endogenousgrowth models, including the Aghion-Howittmodel, also set R&D at the centre of their frame-works. Such R&D-based growth models produceimplications that are distinct from the neoclas-sical Solow-Swan model. An example of this isprediction of scale effects.
There remains disagreement on how humancapital affects economic growth. While theapproach initiated by Lucas (1988) views accu-mulation of human capital as the source ofeconomic growth, the approach of Nelson and
Phelps (1966) and Benhabib and Spiegel (1994)assumes that stock of human capital determinesthe ability of an economy to develop and assimi-late technologies and thus produce economicgrowth. This difference in their positions mirrorsdifferent treatments of technological progress andR&D in the Solow-Swan model and R&D-basedendogenous growth models.
These economic growth models are, however,criticised for their spaceless analysis. Their weak-ness is said to be acute when accounting fordisparities in economic development betweenregions in which all production factors areassumed to be mobile. The assumption of fric-tionless diffusion of technological knowledge isunder particular attack. It is argued that tacitknowledge is embodied in skilled workers andless mobile than codified knowledge. Further-more, a mechanism of cumulative causation issaid to work in the location of highly-skilledworkers through education and training. Suchdiscussions in spatial studies imply increasingdisparities between regions. This implication is instark contrast to neoclassical models ofeconomic growth predicting convergence due todecreasing returns on capital.
Empirical analysis of human capital development and economic growth in European regions 89
This chapter presents results of an empiricalanalysis of regions in EU Member States. The firstpart looks into relationships among aspects suchas investment in education/training, demand forhuman capital, and economic indicators ofregions. The second part provides empiricalevidence relating to the debate between theLucasian approach and the Benhabib-Spiegelapproach.
Unless otherwise noted, we use data providedby Eurostat that covers regions and countries inthe EU (Belgium, Denmark, Germany, Greece,Spain, France, Ireland, Italy, Luxembourg, theNetherlands, Austria, Portugal, Finland, Sweden,and the UK). We use the EU’s definition ofregional units, NUTS (Nomenclature of territorialunits for statistics) level 1 (27). Because of thedefinition, some nations are included as regions(i.e. Denmark, Ireland, Luxembourg). Regions inSweden, as well as regions in some parts ofPortugal and Finland, are based on NUTS level 2,a lower level of units.
Data availability restricts the majority of theanalysis in the second part to Denmark, Germany(excluding regions in ex-German DemocraticRepublic), France, Ireland, and Italy whereas thefirst part covers a greater proportion of theMember States. Also a majority of data, includingnumbers of students enrolled in education byeducational level, are available at the regionallevel only for short periods in the mid 1990s. Thisconstrained our analysis in the majority of the firstchapter.
3.1. Relationship betweeninvestment ineducation/training anddemand for human capital
3.1.1. Human capital development andemployment patterns
First, we looked at relationships between invest-ment by individuals in education/training andemployment size of sectors/functions that requirehigh-order human capital. We use the numbers ofstudents as a percentage of the working agepopulation (15 to 64 years old) as a proxy forinvestment by individuals in human capital devel-opment (28). We chose ICT-related sectors,including manufacturing of ICT devices and ICTservices, as requiring high order humancapital (29). The two variables are correlated andresults are as follows, quantified by enrolments:(a) for both general and vocational types of
upper secondary education, no significantcorrelation is found between students as apercentage of the working population andemployment in the high-tech sectors;
(b) for tertiary education, correlation betweenstudents as a percentage of the workingpopulation and employment in the high-techsectors is positive (0.41) and significant(0.005) – see Figure 4.
Similarly there is strong association, as shownin Figure 5, between students in tertiary educationas a percentage of working age population andvolume of R&D staff (including business, govern-ment, and higher education institutions). Correla-tion between the two is positive (0.54) and signifi-cant (0.000). We found close association (correla-tion: 0.31; significance: 0.01) between students intertiary education as a percentage of the working
3. Empirical analysis of regions in Europe
(27) The NUTS was set up at the beginning of the 1970s as a single, coherent system for dividing up the EU to produce regionalstatistics. Of its three levels of regions, level 1 is the largest unit that can be compared in size to some smaller member coun-tries of the EU.
(28) Mankiw et al. (1992) used this proxy in their study.(29) NACE 30 (office machinery and computers), 32 (telecommunications equipment), 64 (post and telecommunications), 72
(computer-related services) and 73 (R&D services) are included. In Eurostat, the data for NACE 64, 72 and 73 (and NACE 30and 32 as well) is collated and made available as a single group, not allowing NACE 73 to be separated from the rest.
Empirical analysis of human capital development and economic growth in European regions 91
Figure 4: Students in tertiary education as a percentage of working age population andemployment in ICT sectors
Students in tertiary education as a percentage of working age population,average of 1995-97
Employmentin ICT sectorsas a percentageof totalemployment,average of1996-99
0
2
4
6
8
10
0 2 4 6 8
Figure 5: Students in tertiary education as a percentage of working age population and R&D staff
Students in tertiary education as a percentage of working age population,average of 1995-97
R&D staff(all sectors)as a percentageof totalemployment,average of1995-97
0
1
2
3
4
0 2 4 6 8
population and number of business R&D staff aswell. In contrast, no significant association wasfound between number of R&D staff and studentsin both general and vocational types of uppersecondary education as a percentage of theworking population (not in Figure 5).
The results show the tendency that investmentby individuals in development of high-orderhuman capital (i.e. tertiary education) is strong inthose regions where there is a strong demandfrom activities requiring it (e.g. high-tech indus-tries, R&D departments).
3.1.2. Human capital development and publicscience base
We saw close association between human capitaldevelopment and R&D capacity of private-sectorfirms above. The R&D capacity of regions is alsoinfluenced by public R&D effort from govern-ments and higher education institutions. Anexamination of the relationship is shown inFigure 6.
As expected, students in tertiary education asa percentage of the population aged 20 to24 years and public R&D expenditures have closeassociation, with a positive correlation (0.43) atthe 1 % significance level (0.000). In contrast,there is no significant correlation betweenstudents in upper secondary education as apercentage of the population aged 15 to 19 yearsand public R&D expenditure (30).
3.1.3. Urban/rural settings and human capitaldevelopment
One of the arguments found in regional studies isthat urban areas in which economic activityconcentrates tend to facilitate diffusion of knowl-edge (particularly tacit knowledge) through theease of face-to-face interactions. With agglomer-ation effects, such urban areas hence often hosthigh-order corporate functions (e.g. headquartersand R&D departments) and firms operating inhigh-tech industries as well as universities andresearch institutes (31).
Given this association between investment in
human capital development and high-tech indus-tries/R&D functions, close association is expectedbetween investment in human capital develop-ment and density of economic activity. We usepopulation density as a proxy for economicactivity density. Figure 7 shows the relationship.
It is clear that individuals in regions with largemetropolitan areas, such as Berlin, Bremen,Hamburg, Île de France, and Comunidad deMadrid, heavily invest in tertiary education. Corre-lation between the two variables is positive (0.27)and significant (0.02). Metropolitan areas hostinghigh-order corporate functions have a dispropor-tionate supply of universities which provide suit-able human capital.
In contrast, regions with large metropolitanareas have a relatively small number of studentsin upper secondary education as a percentage ofthe working population. This is shown inFigure 8 (32).
Whereas individuals in regions with largemetropolitan areas heavily invest in higher educa-tion, there is some evidence that gaps betweenregions are closing. Figure 9 shows the relation-ship between population density and change instudents in tertiary education as a percentage ofthe population aged 16 to 19 years from 1995 to1997. Correlation between the two variables isnegative (-0.23) and significant at the 10 % level(0.07). As the period is short, the change in enrol-ment rate is susceptible to short-term shocks.Accordingly, the finding is only suggestive. Thefigure indicates that an increase in enrolment ratein regions with large metropolitan areas is morelikely to be slower while the rate is growing fasterin some non-metropolitan regions (i.e. low popu-lation-density regions) (33).
3.1.4. Relationship between human capitaldevelopment and entrepreneurship
The creation of new businesses is an importantsource of economic dynamism. High-technologyindustries in particular evolve through tech-nology-based start-ups and spin-offs byentrepreneurs who are often supported by venture
Impact of education and training92
(30) The same relationships are found between the numbers of students as a percentage of the working population by level ofenrolment and public R&D expenditure.
(31) Lucas (1988) discusses this, referring to the work of Jane Jacobs.(32) Correlation between the variables is negative (-0.20) at the 10 % significance level (0.09).(33) As might be expected, no significant correlation was found between population density and change in students in upper
secondary education as a percentage of the population aged 16 to 19 years.
Empirical analysis of human capital development and economic growth in European regions 93
Figure 6: Students in tertiary education as a percentage of population aged 20 to 24 years andpublic R&D expenditures
Students in tertiary education as a percentage of population aged 20-24 years,average of 1995-97
R&Dexpenditures bygovernmentand HEs as apercentage ofGDP, averageof 1995-97
0.0
0.5
1.0
1.5
2.0
0 20 40 60 80
Figure 7: Students in tertiary education as a percentage of working age population andpopulation density
Students in tertiary education as a percentage of working age population,average of 1995-97
capital. We examined the relationship betweenhuman capital development and entrepreneurship,using the average size of firms in selected high-techsectors as proxy for the rate of new business forma-tion.
We focused upon ICT-related industries astheir importance in the economy dramaticallyincreased in the 1990s along with the develop-ment of the Internet and related technologies.The industries are divided into ICT-relatedservices and ICT manufacturing (34).
For ICT-related services, we found no signifi-cant association between average firm size andstudents in tertiary education as a percentage ofthe population aged 20 to 24 years. However,general and vocational types of upper secondaryeducation show contrasting relationships withaverage firm size in the sectors. Students ingeneral types of upper secondary education as apercentage of the population aged 16 to 19 yearsshow a tendency to increase with the averagefirm size in ICT-related services (Figure 10). Theircorrelation (0.62) is significant at the 1 % level(0.001). In contrast, negative association is foundbetween students in vocational types of uppersecondary education as a percentage of thepopulation aged 16 to 19 years and the averagefirm size of ICT-related services (Figure 11). Theircorrelation (-0.82) is significant at the 1 % level(0.000) again.
These figures suggest that those regions with ahigh rate of new firm formation in ICT-relatedservices have a high enrolment rate in vocationaltypes of upper secondary education and a lowenrolment rate in general types of uppersecondary education.
We obtained the same findings for ICT manu-facturing, although their significance is weaker.
The correlation between the enrolment rate ofgeneral types of upper secondary education andthe average firm size in ICT manufacturing is 0.34and significant at the 10 % level (0.09). For voca-tional types of upper secondary education, corre-lation is –0.36 and significant at the 10 % level(0.07).
We also examined the same relationship withrespect to traditional manufacturing indus-tries (35). No significant association was found
between average firm size and enrolment rate ofany educational level examined.
In summary, human capital developmentappears to have significant association with therate of entrepreneurship in emerging industriessuch as ICT-related services and ICT manufac-turing, whereas such association is not found intraditional manufacturing industries. The associa-tion with entrepreneurship in ICT sectors is,however, found at the level of vocational types ofupper secondary education. The implications ofthis, along with the lack of significant associationwith higher education, are subject to interpreta-tion and not clear. Does the finding suggest thatgraduates from vocational types of uppersecondary education start new firms withoutobtaining higher education degrees? It is oftenassumed (in the US) that qualified engineers withhigher education degrees start new ICT-relatedbusinesses with support from venture capital. Theabove finding seems to contradict this assump-tion but clarification will require further research.
3.1.5. Human capital development andunemployment rate
Before moving on to the analysis of economicgrowth, we examine the relationship betweenhuman capital development and unemploymentrate. Figure 14 shows the relationship betweenstudents in tertiary education as a percentage ofthe working age population and unemploymentrate. The correlation is positive (0.19) but its levelof significance is slightly over 10 % (0.11). Signif-icant correlation is found between students inupper secondary education as a percentage ofthe working age population and unemploymentrate (Figure 15). The correlation is 0.35 and signif-icant at the 1 % level (0.003). In other words, indi-viduals in regions that have high unemploymentrate are more likely to invest in education andtraining. This fits with the general observation thatindividuals are more likely to invest in educationand training when facing unfavourable employ-ment situations at economic downturns.
Those regions enjoying low unemployment ratetend to have more R&D functions (Figure 16). Thecorrelation between unemployment rate andbusiness R&D staff as a percentage of total
Empirical analysis of human capital development and economic growth in European regions 95
(34) ICT-related services include NACE 64 (post and telecommunications), 72 (computer-related services) and 73 (R&D services).ICT manufacturing includes NACE 30 (office machinery and computers) and 32 (telecommunications equipment).
(35) The industries examined include general, electrical, and transport engineering.
Impact of education and training96
Figure 10: Students in general type of upper secondary education as a percentage of populationaged 16 to 19 years and average firm size in ICT-related services
Students in general type of upper secondary education as a percentage of population aged 16-19 years,average of 1995-97
Averagefirm size inICT-relatedservices,1997
0
10
20
30
40
0 10 20 30 40 50 60 70
Figure 11: Students in vocational type of upper secondary education as a percentage ofpopulation aged 16 to 19 years and average firm size in ICT-related services
Averagefirm size inICT-relatedservices,1997
Students in vocational type of upper secondary education as a percentage of population aged 16-19 years,average of 1995-97
0
10
20
30
40
0 10 20 30 40 50 60 70
Empirical analysis of human capital development and economic growth in European regions 97
Figure 12: Students in general type of upper secondary education as a percentage of populationaged 16 to 19 years and average firm size in ICT manufacturing
Students in general type of upper secondary education as a percentage of population aged 16-19 years,average of 1995-97
Average firmsize in ICTmanufacturing1997
0
50
100
150
200
250
0 10 20 30 40 50 60 70
Figure 13: Students in vocational type of upper secondary education as a percentage ofpopulation aged 16 to 19 years and average firm size in ICT manufacturing
Students in vocational type of upper secondary education as a percentage of population aged 16-19 years old,average of 1995-97
Average firmsize in ICTmanufacturing1997
0
50
100
150
200
250
0 10 20 30 40 50 60 70
Impact of education and training98
Figure 15: Students in upper secondary education as a percentage of working age populationand unemployment rate
Unemployment rate,average of 1991-2000
Students inupper secondaryeducationas a percentageof working agepopulation,average of1995-97
4
6
8
10
12
14
0 5 10 15 20 25 30
Figure 14: Students in tertiary education as a percentage of working age population andunemployment rate
Unemployment rate,average of 1991-2000
Students intertiary educationas a percentageof working agepopulation,average of1995-97
0
2
4
6
8
0 5 10 15 20 25 30
Empirical analysis of human capital development and economic growth in European regions 99
Figure 16: Unemployment rate and business R&D staff
Unemployment rate,average of 1991-2000
Business R&Dstaff as apercentageof totalemployment,average1995-97
0.0
0.5
1.0
1.5
2.0
2.5
0 5 10 15 20 25 30
Figure 17: Per worker GDP growth rate and students in tertiary education as a percentage ofworking age population
Students in tertiary education as a percentage of working age population,average of 1995-97
Per workerGDP growthrate (%),averageof 1991-99
-5
0
5
10
15
20
0 2 4 6 8
Impact of education and training100
Figure 18: Per worker GDP growth rate and students in general type of upper secondaryeducation as a percentage of working age population
Students in general type of upper secondary education as a percentage of working age population,average of 1995-97
Per workerGDP growthrate (%),average of1991-99
-5
0
5
10
15
20
0 1 2 3 4 5 6 7 8
Figure 19: Per worker GDP growth rate and students in vocational type of upper secondaryeducation as a percentage of working age population
Students in vocational type of upper secondary education as a percentage of working age population,average of 1995-97
Per workerGDP growthrate (%),averageof 1991-99
-5
0
5
10
15
20
0 1 2 3 4 5 6 7 8
employment is negative (-0.27) and significant atthe 1 % level (0.01). This, along with the abovefindings, suggests that agglomeration ofhigh-order corporate functions such as R&Ddepartments has a closer association with lowunemployment rate than investment by individ-uals in higher education.
3.1.6. Human capital development andeconomic growth
An initial look at the relationship between humancapital development and economic growth(Figures 17, 18 and 19) shows relationshipsbetween per worker GDP (i.e. labour productivity)growth rate from 1991 to 1999 and students bylevel of education/training as a percentage of theworking age population.
The top five regions in terms of labour produc-tivity growth rate are those in the ex-GermanDemocratic Republic (GDR) (36). Their extraordinarygrowth is due to the opening of their economy tothe West at the beginning of the 1990s, which gaverise to an influx of capital and technology. As canbe seen from the figures, the numbers of studentsas a percentage of working age population in rela-tion to labour productivity growth does not followthe pattern of the rest of our sample. Accordingly,we considered the ex-GDR regions as exceptionalcases and removed them from the ensuing analysisof economic growth.
Results of the analysis of our sample excludingex-GDR regions are as follows:(a) negative association (-0.26) is found between
per worker GDP growth rate and students intertiary education as a percentage of theworking age population. The association issignificant at the 5 % level (0.05);
(b) there is negative association (-0.35) betweenlabour productivity growth and students invocational type of upper secondary education
as a percentage of the working age popula-tion. It is significant at the 1 % level (0.009);
(c) the correlation between labour productivitygrowth and students in general types ofupper secondary education as a percentageof the working age population is positive(0.21). However, the correlation is not signifi-cant at the 10 % level (0.13).
The results contradict the generally assumedassociation between human capital developmentand economic growth. This clearly indicates thata better understanding of the relationshiprequires a more formal analysis that takes intoaccount the impact of physical capital.
3.2. Formal analysis of therelationship between humancapital and economic growthat regional and national level
3.2.1. Estimates at the augmentedSolow-Swan model: accumulation ofhuman capital
Formal analysis based on the Solow-Swan frame-work requires data on stocks of physical andhuman capital (e.g. average schooling years of thelabour force). With respect to regions in Europe,data on average schooling years of labour force isnot available (37). Mankiw et al. (1992) overcomesthis requirement by assuming that countries intheir sample are at a steady state in theSolow-Swan framework (38). We used the samemethod and obtained the results in Table 1.
In both models, the fraction of income investedin physical capital (I/GDP), and (n + g + δ), has awrong sign. Furthermore, the fraction of incomeinvested in human capital (SCHOOL) has a wrong
Empirical analysis of human capital development and economic growth in European regions 101
(36) Namely, Thüringen, Sachsen-Anhalt, Sachsen, Mecklenburg, and Brandenburg in order of labour productivity growth rate.0
(37) We attempted to estimate average schooling years of the labour force at the regional level, following the method used by Kyri-acou (1991). In his cross-country study of the growth effects of human capital, Kyriacou examined relationships betweenschooling years and enrolment rates by educational level and devised the following equation,
,
where H75 represents average years of schooling in the labour force, PRIM60 represents the 1960 enrolment rate of primaryeducation, SEC70 represents the 1970 enrolment rate of secondary education, and HIGH70 represents the 1970 enrolment rateof higher education. We evaluated a similar relationship using data for countries in Europe. However, we found no significantrelationship between average schooling years and enrolment rates, so, we were unable to estimate average schooling yearsfor regions using their enrolment data.
sign in model 2, too. This suggests that theassumption of a steady state is not applicable toour sample.
Accordingly, we decided to use the businessR&D staff numbers as an indicator of humancapital stock (39). This is consistent with the study’spurpose as R&D staff embodies high-order humancapital that is deemed critical to technologicalprogress in endogenous growth literature.
We applied the standard augmentedSolow-Swan model Y = AKα Lβ Hγ to the data ofphysical capital stock, total employment, and
business R&D staff in 1990 and 1997 withdifferent depreciation rates (40).
The period from 1990 to 1997 is adopted forthe following reasons:(a) the EU economy entered a new era of integra-
tion after the full liberalisation of capital move-ments in eight Member States in 1990 as well aspolitical landmarks such as the fall of the BerlinWall in 1989 and unification of Germany in 1990.In tandem with the revolutionary effect of ICTsincluding the Internet, economic integrationspurred movement of money and people within
Impact of education and training102
(39) Because total R&D staff data availability is restricted to a smaller number of regions, we could not undertake the same anal-ysis for total R&D staff (including staff in government institutes and higher education institutions) and compare the results withthose for private R&D staff only.
(40) Stocks of physical capital at the regional level are estimated using the Penn World Tables 5.6. A description of the tables isfound in Summers and Heston (1991). First, based on a standard three-factor neoclassical aggregate production function withconstant returns, Y = Kα Lβ Hγ, we estimated at the national level a model that accounts for GDP of EU nations. We obtaineda model whose coefficients are all significant at the 1 % level. Then using the model, we estimated the stock of physical capitalfor each of the regions in our sample. Finally we adopted the perpetual inventory method to produce physical capital stocksfor 1986 and onwards. (See Barro and Sala-i-Martín, 1995 about the perpetual inventory method.) As a depreciation rate δ, weused 0.04. See footnote 37 above. To see effects of a different depreciation rate, we also tested 0.07, following Benhabib andSpiegel (1994).
Model 1 Model 2
Constant 4.49 (a) 4.59 (a)
(0.36) (0.30)
log (I/GDP) -0.84 (b) -0.91 (a)
(0.32) (0.25)
log (n + g + δ) 0.36 0.0004(0.27) (0.25)
log (SCHOOL) 0.05 -0.67 (a)
(0.16) (0.20)
Observations 32 32
R square 0.28 0.48
F statistic 3.58 8.53
NB: - Dependent variable is log of GDP per worker in 1997.- Standard errors are in parentheses.- I/GDP represents gross fixed capital formation as a percentage of GDP (average of 1987-97).- Figures of GDP and gross fixed capital formation are at constant prices in 1995.- (n + g + δ) represents the sum of growth rate of population, growth rate of technical progress, and rate of depreciation.- (g + δ) is assumed to be 0.06 (1).- SCHOOL is students in tertiary education as a percentage of working age population (average of 1995-97) in model 1
and students in upper secondary education as a percentage of working age population (average of 1995-97) in model 2.- (a) and (b) represent 1 % and 5 % significance levels respectively.- Regressions were run using ordinary least squares method.
(1) For a broad sample of countries, Romer (1989) finds that δ is about 0.03 or 0.04. Mankiw et al. (1992) note that growth inincome per capita averaged 1.7 % in the US and 2.2 % in their sample of intermediate countries, and thus suggest that gis about 0.02.
Table 1: Estimation of the augmented Solow-Swan model with the assumption of a steady state
EU. This, in turn, facilitated the rapid exchangeof information and knowledge, makingleading-edge technology, which firms within aregion aim for in their innovation efforts, moregenerally available. Prevalence of leading-edgeknowledge or technology is often assumed ingrowth model literature;
(b) we used 1985 as the base year to which theperpetual inventory method was applied toestimate physical capital stock in eachregion. This is the earliest year we could useto estimate each region’s capital stock from
the national data. The 1985 capital stock dataat the regional level is subject to estimatingerror. Because of the cumulative calculationof the perpetual inventory method, the laterthe start year of the Solow-Swan analysis, themore reliable the regional capital stock data.At the same time, a reasonably extensiveperiod is necessary for the Solow-Swan anal-ysis to measure long-term growth.
By taking log of the standard augmentedSolow-Swan model, the following equation isobtained:
Empirical analysis of human capital development and economic growth in European regions 103
(41) The equation implies that the first term of the right-hand side of the equation, log AT – log A0, is constant and common for alleconomies under analysis. In other words, technology or knowledge is spread and available to all economies.
.)log(log)log(log
)log(logloglogloglog
00
000
HHLL
KKAAYY
TT
TTT
−+−+
−+−=−
γβα
Estimated coefficients are shown in Table 2 (41).The augmented Solow-Swan model that
includes physical capital, labour, and businessR&D staff accounts for the economic growth
between 1990 and 1997 with R square of 0.71and 0.72 for models 1 and 2 respectively.Although the estimated coefficient for log differ-ence in physical capital is significant only at the
Model 1 Model 2 Model 3 Model 4
Constant -0.04 -0.03 0.72 (a) 0.73 (a)
(0.05) (0.04) (0.16) (0.16)
dK 0.40 (c) 0.42 (c) 0.36 (b) 0.38 (b)
(0.22) (0.21) (0.17) (0.16)
dL 0.53 (a) 0.49 (a) 0.67 (a) 0.63 (a)
(0.16) (0.17) (0.13) (0.04)
dH 0.16 (a) 0.15 (a) 0.08 (b) 0.08 (b)
(0.04) (0.04) (0.03) (0.03)
Y0 -0.16 (a) -0.16 (a)
(0.03) (0.03)
Observations 32 32 32 32
R square 0.71 0.72 0.84 0.84
F statistic 22.8 23.6 36.6 38.3
NB: - Dependent variable is the log difference in GDP.- Standard errors are in parentheses.- dX refers to the log difference in variable X.- The period for comparison is 1990-97.- K, L, H, and Y0 represent stock of physical capital, number of workers, and size of business R&D staff,
and per worker GDP in 1990 respectively.- Figures of physical capital are at 1995 constant prices.- (a), (b), and (c) represent 1 %, 5 %, and 10 % significance levels respectively.- Models 1 and 3 use a depreciation rate of 0.04.- Models 2 and 4 use a depreciation rate of 0.07.- Regressions were run using ordinary least squares method.
Table 2: Estimation of the augmented Solow-Swan model
10 % level (0.08 in model 1 and 0.05 in model 2),log differences in labour and business R&D staffenter highly significantly. The significance of logdifference in labour is 0.003 in model 1 and 0.008in model 2, and the significance of log differencein private R&D staff is 0.001 in both models 1 and2. The results suggest that the change in busi-ness R&D staff during the period varies in a waydistinct from those in physical capital and labourand accounts for a significant part of the variationof the change in GDP. The positive sign for thecoefficient of the log difference in business R&Dstaff means that an increase in business R&Dstaff led to an increase in the region’s per workerGDP (i.e. labour productivity).
We also entered initial income per worker (GDPin 1990 worker), Y0, in the equation (model 3 andmodel 4). In the neoclassical Solow-Swan frame-work that supposes decreasing returns oncapital, the level of per capita GDP will convergetoward its steady state asymptotically. The speedof convergence increases with the distance to thesteady state. In other words, when the determi-nants of the steady state are controlled for, thelower initial values of per capita GDP, the highertransitional growth rates. This is called ‘condi-tional convergence’. As expected from previousempirical studies that support conditional conver-gence, initial per worker GDP in 1990 enters witha negative sign at the 1 % significance level (0.00in both model 3 and model 4). More importantly,the coefficient for log difference in business R&Dstaff remains positive and significant at the 5 %level (0.03 in both model 3 and model 4) althoughits value becomes less than in models 1 and 2.
The results of Table 2 suggest that high-orderhuman capital represented by business R&D staffcontributes to economic growth in the same way asother production factors (i.e. physical capital,
labour). That is, it is the accumulation of the humancapital that affects economic growth. This isconsistent with the neoclassical Becker-Lucasframework predicting that the accumulation ofhuman capital determines the marginal productivityof education and maintains it at a positive level.
3.2.2. Estimates at the Nelson-Phelpsframework: level of human capital stock
Nelson and Phelps, and Benhabib and Spiegelprovide a different framework, according to whichit is the level of human capital stock that affectsan economy’s capacity to develop and implementnew technologies. The level of human capitalstock is positively related to the rate of technicalprogress, or the growth rate of productivityparameter A, in their view.
R&D staff certainly reflects such a capacity in aneconomy. In their cross-country study, Benhabiband Spiegel used average years of schooling inthe labour force as an indicator of human capital,focusing on investment in education as a whole.Unlike schooling years, R&D staff are a smallsegment of the labour force that embodieshigh-order human capital. Though small in size,this sector is considered a good representation ofan economy’s capacity to develop new technolo-gies (i.e. knowledge) as argued in an endogenousgrowth literature. Also, R&D staff are frequentlyinvolved in transferring and implementing newtechnologies developed in other sectors or under-standing new technologies invented by other firmsin their own sectors (e.g. reverse engineering).Hence the framework of Nelson and Phelps maybe applicable to R&D staff.
We tested two equations based on this frame-work. The first equation takes an average of humancapital levels during the period under examination.
Impact of education and training104
.)log1
()log(log
)log(logloglogloglog
00
000
∑+−+
−+−=−T
tT
TTT
HT
LL
KKAAYY
γβ
α
Table 3 shows results of the estimates of coef-ficients.
In model 1, all terms, including log of anaverage of business R&D staff in level from 1990to 1997, enter the equation significantly at the1 % level. However, whereas the coefficients forlog differences in physical capital and labour arepositive (as expected), the coefficient for the
average business R&D staff is estimated as nega-tive. In other words, regions with a higher level ofbusiness R&D staff experienced a slower growthfrom 1990 and 1997.
In model 2, we included initial per worker GDP(labour productivity) in 1990 in the equation tosee the effects of conditional convergence. Logdifferences in physical capital and labour enter
significantly (0.02 and 0.00 respectively), taking aproper positive sign. The term for initial labourproductivity, Y0, also enters significantly at theconventional 5 % level (0.03). Its negative signshows that the lower initial per worker GDP, thefaster an economy grows. In other words, condi-tional convergence took place among theregions. As for the average business R&D staff inlevel, its coefficient takes a negative sign.Furthermore, it fails to enter significantly (0.32).
The failure of business R&D staff to enter the equation significantly in model 2 is due to close asso-ciation between business R&D staff in level and per
worker GDP. As the level of business R&D staff hasclose association with the level of labour produc-tivity (42), the average R&D staff from 1990 to 1997,AH, in model 1 acts as a proxy for the level of labourproductivity and enters the equation with a negativesign, suggesting conditional convergence among theregions. However, when initial labour productivity, Y0,is included in model 2, it accounts for the conver-gence better than level of R&D staff does. Hence levelof R&D staff loses its significance in model 2.
The second equation we tested includes twoterms of human capital that represent its differenteffects.
Empirical analysis of human capital development and economic growth in European regions 105
(42) We examined contributions of physical capital, labour, and business R&D staff in levels to the level of income of regions in1990 and 1997, using a standard three-factor neoclassical aggregate production function with constant returns, Y = Kα Lβ Hγ.The level of business R&D staff enters the equation significantly with a positive sign, suggesting that regions with a higher levelof business R&D staff have a higher level of income per capita (labour productivity).
Model 1 Model 2
Constant -0.16 (a) 0.58 (c)
(0.04) (0.30)
dK 0.92 (a) 0.58 (b)
(0.20) (0.24)
dL 0.50 (a) 0.62 (a)
(0.14) (0.14)
AH -0.06 (a) -0.02
(0.01) (0. 02)
Y0 -0.14 (b)
(0.06)
Observations 32 32
R square 0.78 0.82
F statistic 33.9 30.8
NB: - Dependent variable is the log difference in GDP.- Standard errors are in parentheses.- dX refers to the log difference in variable X.- The period for comparison is 1990-97.- K, L, and Y0 represent stock of physical capital, number of workers, and per worker GDP in 1990 respectively.- AH is an average of business R&D staff during 1990-97.- Figures of physical capital are at 1995 constant prices.- Depreciation rate is 0.04.- (a), (b), and (c) represent 1 %, 5 %, and 10 % significance levels respectively.- Regressions were run using ordinary least squares method.
Table 3: Cross-regional growth accounting results: human capital in log levels
[ ]
( ).)log(log)log(log
)(
)log(log)log(log
/)(loglog
00
max
00
max0
LLKK
YYmHHmgc
LLKK
YYYmHgHcYY
TT
iii
TT
iiiiT
−+−+
+−+=
−+−+
−++=−
βα
βα
The term, gH, represents endogenous develop-ment based on the level of human capital, andthe term, mHi [(Ymax – Yi)/Yi], represents catch-upof region i with the region leading in terms of percapita GDP, Ymax (i.e. the region with the highestlabour productivity in the data set).
Table 4 shows the results.In model 1, both log differences in physical
capital and labour enter the equation at the 1 %significance level (0.001 and 0.009 respectively)with a proper positive sign. The coefficient esti-mate for (g – m) on H is negative and significantat the 10 % level (0.08). The negative signsuggests that regions with a higher level of busi-ness R&D staff in 1990 experienced a slowergrowth from 1990 to 1997. In contrast, thecatch-up term of business R&D staff, H0 (Ymax/Yi),fails to enter the equation significantly (signifi-cance: 0.79) though it takes a positive sign.
In model 2, we added the initial ratio of thelabour productivity of the leading-edge region tothat of region i to see the effects of conditionalconvergence (43). As in model 2 in Table 3, theinitial position of a region in terms of labourproductivity, Ymax/Yi, enters at the 1 % significancelevel (0.002). Its sign is positive, suggesting condi-tional convergence: the larger the initial gap withthe leading region, the faster an economy grows.On the other hand, neither Y0 nor Y0(Ymax/Yi) enterssignificantly (0.62 and 0.34 respectively). In otherwords, conditional convergence that is due to aregion’s initial position in per worker GDP exertsmore significant effects upon its change in GDP.Although the size of business R&D staff, H0, playsthe role of a proxy for labour productivity level, itseffects as an economy’s capacity to develop andimplement new technology in the Nelson-Phelpsframework are found insignificant.
These findings are in stark contrast to those ofBenhabib and Spiegel. In their cross-countrystudy, Benhabib and Spiegel found that thecatch-up term of human capital enters signifi-cantly. The catch-up term maintains its propersign (i.e. positive) and significance (though signif-icance level drops from 1 % to 5 %) even if the
variable for initial position of income Ymax/Yi isincluded. In contrast, our results show thatneither of the human capital terms is found signif-icant, whereas initial position as well as log differ-ences in physical capital and labour enter at anequal or higher level of significance than in thecase of Benhabib and Spiegel (44).
Even if we focus on wealthier economies in thesample of Benhabib and Spiegel, their results aredifferent. In their study, Benhabib and Spiegeldivided their sample into 3 groups (26 countrieseach) according to wealth. For the wealthiest thirdof the sample, they found that the endogenousdevelopment term of human capital H enters signif-icantly while the catch-up term is found insignifi-cant. However, the sign for H is found positive intheir study suggesting that the capacity to developand implement new technology, which H repre-sents, contributes to economic growth positively. Incontrast (as shown in model 1 in Table 4), the sign ofthe term in our results is negative, suggesting thatthe greater the volume of human capital in level(i.e. business R&D staff in our case), the slower aneconomy grows.
Most important, accumulation of human capital(i.e. business R&D staff in our case) accounts foreconomic growth at a significant level along withaccumulation of physical capital. In the study ofBenhabib and Spiegel, accumulation of humancapital fails to enter significantly with respect toall three measures of human capital theytested (45) as well as alternative subsamples ofthe data. In addition, the sign of human capitalaccumulation was found negative in most of thecases they examined.
3.2.3. Human capital and growth:cross-country estimates
An obvious, possible source for the differencebetween the findings is the different types ofhuman capital examined. While Benhabib andSpiegel adopt average schooling years of thelabour force, we use the number of private sectorworkers engaged in R&D which endogenousgrowth literature focuses upon as a source of
Impact of education and training106
(43) This follows the equation adopted by Benhabib and Spiegel. Adding initial labour productivity in 1990 (as in model 2 in Table 3as well as many studies of conditional convergence) produces similar results. In that case, the coefficient for the variable takesa negative sign.
(44) In their estimates, log difference in labour fails to enter the model significantly whereas the coefficient for log difference inphysical capital was found significant at the 1 % level.
(45) Namely, average schooling years used by Kyriacou (1991), the Barro and Lee (1993) estimate of human capital, and literacy.
technical progress. To see if the different type ofhuman capital affects the results, we undertookan analysis based on average schooling years.Since data on schooling for the labour force isnot available at regional level, the analysis is onlyat national level. The figures for persons in the
labour force (25 to 59 years old) who completededucation, given by educational level, are avail-able for 11 countries in the EU for the period from1992 to 2000. From the data, we calculated anestimate of average schooling years (46) andtested the following three models:
Empirical analysis of human capital development and economic growth in European regions 107
(46) We gave 9 years, 12 years and 16 years for those who completed lower secondary education, upper secondary education, andtertiary education respectively.
Model 1 Model 2
Constant -0.11 (b) -0.15 (a)
(0.04) (0.04)
dK 0.88 (a) 0.59 (a)
(0.23) (0.21)
dL 0.41 (a) 0.65 (a)
(0.14) (0.14)
H0 -0.05 (c) 0.01
(0.03) (0.03)
H0 (Ymax/Yi ) 0.006 (0.02)
-0.02 (0.02)
Ymax/Yi 0.04 (a)
(0.01)
Observations 32 32
R square 0.78 0.85
F statistic 23.9 29.5
NB: - Dependent variable is the log difference in GDP.- Standard errors are in parentheses.- dX refers to the log difference in variable X.- The period for comparison is 1990-97.- K and L represent stock of physical capital and number of workers respectively.- H0 is the size of business R&D staff in 1990.- Ymax/Yi represents the ratio of the labour productivity of the leading-edge region to that of region i in 1990.- Figures of physical capital are at 1995 constant prices.- Depreciation rate is 0.04.- (a), (b), and (c) represent 1 %, 5 %, and 10 % significance levels respectively.- Regressions were run using ordinary least squares method.
Table 4: Cross-regional growth accounting results: Human capital in levels and in product oflevels and differences from the leading-edge region in labour productivity
,)log(log)log(log
)log(logloglogloglog
00
000
HHLL
KKAAYY
TT
TTT
−+−+
−+−=−
γβα
,)log1
()log(log
)log(logloglogloglog
00
000
∑+−+
−+−=−T
tT
TTT
HT
LL
KKAAYY
γβ
α
and
Table 5 shows the results.The estimates show lower significance, in large
part due to the small sample size. However, thepatterns of significance are consistent with theresults for business R&D staff except for insignif-icant estimates for labour. In model 1, only logdifference in physical capital enters significantly
(0.014) although all variables take a proper, posi-tive sign. The significance of log difference inschooling years is 0.14, being above the conven-tional maximum cut-off point of 10 %. However,in model 2 that includes initial level of income, logdifference in schooling years and as log differ-ence in physical capital, enter significantly at the
Impact of education and training108
( ).)log(log)log(log
)(loglog
00
max0
LLKK
YYmHHmgcYY
TT
iiiT
−+−+
+−+=−
βα
Model 1 Model 2 Model 3 Model 4
Constant -0.06 -0.15 -0.05 0.01
(0.04) (0.17) (0.09) (0.16)
dK 0.61 (b) 0.75 (b) 0.55 (b) 0.49
(0.19) (0.21) (0.22) (0.28)
dL 0.002 -0.14 0.02 0.06
(0.30) (0.31) (0.36) (0.41)
dH 0.33 0.56 (a)
(0.20) (0.26)
AH 0.0009
(0.006)
H0 0.005
(0.02)
H0 (Ymax/Yi ) -0.008
(0.03)
Y0 -0.05
(0.04)
Observations 11 11 11 11
R square 0.65 0.73 0.52 0.52
F statistic 4.3 4.1 2.5 1.6
NB: - The following 11 countries were included: Belgium, Denmark, Germany, Greece, Spain, France, Ireland, Italy, the Nether-lands, Portugal, and the UK.
- Dependent variable is the log difference in GDP.- Standard errors are in parentheses.- dX refers to the log difference in variable X.- The period for comparison is 1992-2000.- K, L and H represent stock of physical capital, number of workers, and average schooling years of the labour force
respectively.- AH is an average of H during 1992-2000.- H0 is the value in 1992.- Ymax/Yi represents the ratio of the labour productivity of the leading-edge region to that of region i in 1992.- Y0 is per worker GDP in 1992.- Figures of physical capital are at 1995 constant prices.- Depreciation rate is 0.04.- (a), (b), and (c) represent 1 %, 5 %, and 10 % significance levels respectively.- Regressions were run using ordinary least squares method.
levels of 10 % and 5 % (0.07 and 0.011) respec-tively. In other words, an improvement of educa-tional level in the labour force led to highereconomic growth during the period. In contrast,model 3 and model 4, which take schooling yearsin levels, fail to be significant (47). Estimates of thecoefficients for human capital terms in the twomodels are very small relative to standard errors,showing little significance. Though the results arenot conclusive due to the small sample size, theysuggest that, even if schooling years are adopted
as an indicator of human capital (as in the studyof Benhabib and Spiegel), their accumulation, nottheir stock level, accounts for economic growth.
It is most likely that catch-up effects of humancapital Benhabib and Spiegel observed are found inthe case of extremely wide gaps between devel-oped countries and developing countries, includingones in Africa and Latin America. When we focusupon developed economies such as regions in theEU, the effects of human capital upon economicgrowth derives from its accumulation.
Empirical analysis of human capital development and economic growth in European regions 109
(47) The significances of the models gained from analysis of variance (F statistic) are 0.15 and 0.28 respectively.
This report has reviewed literature and empiricallyexamined the way in which human capital devel-opment is associated with economic growth inregions in Europe in the 1990s. While powerfulmultinational corporations are becoming ever-more ‘footloose’ and escaping from the control ofnation states, regions are ‘competing’ againstone another, within and across nations, atattracting investments and supporting local busi-nesses to increase competitiveness in the globalmarket. In this, many regions, and particularlyones in peripheries, are facing the reality ofpersistent regional disparities in productivity andcorporate functions located. By examining therelationship between human capital formationand economic performance in European regions,this study aims to go some way towardsanswering the question whether, and how, humancapital development provides these territorialunits with comparative advantages over others.
In growth model literature, human capital hasgained increased recognition as one of keyproduction factors following physical capital andlabour. The original Solow-Swan model consistedof physical capital and labour alone, failing toaccount for a significant part of income growth asresidual (called the ‘Solow residual’). This residualwas considered to be an exogenous factor thatderives from technical progress taking placewhere there is a public science base. In themeantime, a number of studies, most notably theseminal work of Becker, drew attention to invest-ment in skills and knowledge as another factor ofproduction. As a result, the Solow-Swan modelcame to be augmented with the inclusion of anadditional term of human capital.
4.1. Significance of economicgrowth models
Another development in growth model literatureis endogenous growth models. Whereas theneoclassical Solow-Swan model treats technicalprogress as an exogenous factor, endogenous
growth models take into consideration theprocess of innovation and technology diffusion,making a departure from the assumption ofperfect competition. The mechanism of investingin research takes centre stage in the model. As aresult, R&D workers, who embody high-orderhuman capital, are often included in the models.
An issue identified in growth model literature isthe way human capital development affectseconomic growth. According to the frameworkdeveloped by Lucas on the basis of Becker’shuman capital theory, growth is primarily drivenby the accumulation of human capital. Incontrast, Nelson and Phelps contend that thestock of human capital determines the economy’scapacity to innovate or catch up with moreadvanced economies, which in turn driveseconomic growth. Hence, the level of humancapital stock is, though indirectly, a determinantof per capita economic growth in this view. Whilethe first framework is in agreement with neoclas-sical growth models, the second framework hasrevived in the Schumpeterian growth literature.
4.2. The regional dimension
These economic models are criticised ineconomic geography literature for their failure toconsider spatial aspects of economic develop-ment. Unlike the neoclassical assumption thatfactors of production are completely mobile,knowledge and innovations do not diffuse instan-taneously or at an even rate over the economy asa whole. Tacit knowledge in particular, whosetransfer often relies on interpersonal, oftenface-to-face communications, is argued to beconcentrated in major metropolitan areas, signi-fying the importance of human capital that repre-sents a carrier of such knowledge. Furthermore,there is a view that the position of metropolitanareas is strengthened by the cumulative causationmechanism in which the education and trainingsystem interacts with the local economy to furtherspatial disparities in economic well-being.
Our empirical analysis of European regions
4. Summary and conclusions
shows that investment by individuals in humancapital development has distinct patterns. Thoseregions with a higher level of investment intertiary education tend to have a larger concen-tration of ICT sectors (including provision of ICTservices and manufacture of ICT devices andequipment) and research functions. On the otherhand, there is no significant association betweensuch high-order functions and investment inupper secondary education, both general andvocational types.
In relation to the density of economic activity,those regions that include major metropolitanareas show a high enrolment rate for tertiaryeducation. While this is, to some degree, due to aconcentration of higher education institutions inthose areas, the association also suggests apossibility of link to high-order corporate func-tions that tend to concentrate in high-densitymetropolitan areas. However, some low-densityregions have made progress in take-up of tertiaryeducation at a faster pace, closing a gap in theformation of high-order human capital.
Generation of new firms is an important sourceof economic dynamism. In our empirical analysis,the rate of human capital development appearsto have significant association with the rate ofentrepreneurship in emerging industries such asICT-related services and ICT manufacturing,whereas such association is not found with tradi-tional manufacturing industries. The associationwith entrepreneurship in ICT sectors is, however,found at the level of vocational type of uppersecondary education, not at the level of tertiaryeducation. The implications of this are subject tointerpretation and require further research.
Individuals in regions that suffer from highunemployment rate tend to invest more in educa-tion and training. This fits with the general obser-vation that individuals are more likely to invest ineducation and training when facing withunfavourable employment situations at economicdownturns. Another finding in relation to this isthat individuals in regions with lower unemploy-ment rate tend to have a higher level of R&Dfunctions.
In short, a high level of investment by individ-uals in tertiary education is found in those regionsthat accommodate high-tech industries andhigh-order corporate functions like R&D. Regionssupport such high-order functions through the
urban infrastructure, facilitating exchange of tacitknowledge, as well as through a public sciencebase. They also enjoy a low unemployment rate.
However, the existing stock of human capitaldoes not lead to a high rate of economic growth.We did not find any significant effects of scalethat would favour those regions with a largerstock of human capital. Instead, our empiricalanalysis demonstrates that the rate of economicgrowth is associated with the accumulation ofhuman capital. Furthermore, those regions with alower per worker GDP at the beginning of theperiod of our analysis tend to show a fastergrowth rate.
4.3. Policy implications
The primary policy implication of our study is theneed to support continuous human capital devel-opment. The growth of computers and digitaltechnology has led a number of observers to arenewed enthusiasm for the Schumpeterianvision of capitalist creative destruction (Harris,2001). With the notion of the ‘knowledge-basedeconomy’ they view that creation of knowledgeand its conversion to commercial use plays agreater role than ever in economic development.Knowledge is distinct from natural resources in itsnon-rival nature: its use by one firm or person inno way limits its use by another. Once it iscreated, knowledge is not depleted: it adds to theexisting stock of knowledge.
This non-excludable nature of knowledge inturn allows research workers to share the stockof knowledge and act on it to create new ideas.New ideas will be then embodied in new orimproved products and production processes,bringing about economic growth. A predictiondrawn from this view of the knowledge-basedeconomy is its ever-continuing growth. As aneconomy shifts its primary activities to knowl-edge creation, with its conversion to commercialvalue, the economy is more likely to benefit fromthe existing stock of knowledge that onlycontinues to grow. The view also predicts theadvantage of an economy with a large stock ofresearch workers: the more workers are engagedin research, the more new ideas are likely to becreated. Accordingly, a rosy picture of continued
Empirical analysis of human capital development and economic growth in European regions 111
growth in advanced economies emerged with thelong-term boom in the US economy in the 1990s.
In contrast to the prediction of theknowledge-based economy, our findings showthat there is not any significant associationbetween the existing stock of research workersand economic growth. Instead, economic growthis found to be associated with accumulation ofresearch workers. This suggests that a key toeconomic growth is continuous development ofhigh-order human capital. While there is littledoubt that advanced economies in WesternEurope are becoming more knowledge-based,they cannot rest on the existing research base togrow further. Given the increasingly fast pace oftechnological change that makes human capitalobsolete, a concerted effort needs to be made tofacilitate continuous development of high-orderhuman capital.
The development of high-order human capitaldoes not mean education and training to increaseresearch workers alone but refers to developmentof ‘knowledge workers’ in a broad spectrum ofeconomic activities. As Kline and Rosenberg (1986)demonstrate, knowledge creation has shifted froma traditional linear process of innovation to a morecomplex chain-linked model based on interactionsbetween knowledge workers. In this new mode,creation of new ideas takes place throughout theentire value chain spanning an organisation’sdifferent functions (e.g. R&D, production,marketing, sales) and its external partners (e.g.suppliers, customers, universities, research insti-tutes, government organisations). Development ofsuch an organisation-wide innovation capacity inan economy will require education and trainingpolicy that aims to upgrade continuously a broadrange of human capital to a higher level.
Impact of education and training112
GDR German Democratic Republic
ICT Information and communication technology
NUTS Nomenclature of territorial units for statistics
R&D Research and development
List of abbreviations
Suppose the prices of output F and factors K, L and A be p, wK, wL, and wA respectively. If each factoris paid its marginal product,
Output F can be then written as:
(5)
According to Euler’s Theorem, if f(x1, ..., xn) has continuous first partial derivatives and is positivelyhomogeneous of degree k, then:
... ...
This suggests that equation (5) holds if F(K, L, A) is positively homogeneous of degree 1, that is:
It is easy to see that this would mean constant returns in K, L and A. Hence under increasing returns, allfactors cannot be paid their marginal products.
)( )( ALKFttAtLtKF ,,,, =
)nx,) (n xfkx ,, 1=(i
n
ii xf
xx ,1
1
K∑= ∂
∂
( )A
FA
L
FL
K
FKAwLwKw
pF ALK ∂
∂∂∂
∂∂
++=++=1
AF
pwA ∂∂=
LF
pwL ∂∂=
KF
pw K ∂∂=
Annex 1Technical difficulty of incorporating increasing returns toa neoclassical model
The rate of saving is determined by the owner of the representative (i.e. average) one-worker firm whotries to maximise his lifetime utility W. Thus the problem is expressed as:
subject to (i.e. investment equals net product minus consumption) and .
Assuming a constant intertemporal elasticity of substitution (i.e. ), the above dynamicoptimisation problem yields the Euler equation:
(a )
(because of L = 1, F = A_
Kα in the case of the representative one-worker firm).
ρα −−1KAε
ρ∂∂
ε=
−= 11
K
F
cdtdc
ε
ε
−−=
−
1
1)(
1ccu
0≥dt
dKcKA
dtdK −= α
( ) dtecu tt
ρ−∞
∫ 0max
Annex 2Growth rate of consumption in Romer (1986) model
Abramovitz, M. Catching up, forging ahead, andfalling behind. Journal of Economic History.Cambridge: Cambridge University Press, 1986,Vol. 46, p. 385-406.
Aghion, P.; Howitt, P. A model of growth throughcreative destruction. Econometrica. Oxford:Blackwell Publishing, 1992, Vol. 60, p. 323-351.
Aghion, P.; Howitt, P. Endogenous growth theory.Cambridge, MA: MIT Press, 1998.
Arrow, K. J. The economic implications of learningby doing. Review of Economic Studies. Oxford:Blackwell Publishing, 1962, Vol. 29, issue 3,p. 155-173.
Barro, R. J. Economic growth in a cross section ofcountries. Quarterly Journal of Economics.Cambridge: MIT Press Journals, 1991, Vol. 106,p. 407-443.
Barro, R. J.; Lee, J.-W. International comparisons ofeducational attainment. Journal of MonetaryEconomics. Amsterdam: Elsevier Science B.V.,1993, Vol. 32, issue 3, p. 363-394.
Barro, R. J.; Sala-i-Martín, X. Economic Growth.New York: McGraw-Hill, 1995.
Bartel, A. P.; Lichtenberg, F. R. The comparativeadvantage of educated workers in imple-menting new technology. The Review ofEconomics and Statistics. Cambridge, MA: MITPress Journals, 1987, Vol. 69, issue 1, p. 1-11.
Baumol, W. J.; Blackman, S. A. B.; Wolff, E. N.Productivity and American leadership: the longview. Cambridge, MA: MIT Press, 1989.
Becker, G. S. Human capital: a theoretical andempirical analysis, with special reference toeducation. New York: National Bureau ofEconomic Research, 1964.
Becker, G. S.; Murphy, K. M.; Tamura, R. Humancapital, fertility, and economic growth. Journalof Political Economy. Chicago: University ofChicago Press, 1990, Vol. 9, issue 5,p. S12-S37.
Benhabib, J.; Spiegel, M. M. The role of humancapital in economic development: evidencefrom aggregate cross-country data. Journal of
Bradley, S.; Taylor, J. Human capital formation andlocal economic performance. Regional Studies.Philadelphia: Carfax publishing, 1996, Vol. 30,No 1, p. 1-14.
Crouch, C.; Finegold, D.; Sako, M. Are skills theanswer? The political economy of skill creationin advanced industrial countries. Oxford:Oxford University Press, 1999.
Denison, E. F. Accounting for slower economicgrowth: the United States in the 1970s. Wash-ington, DC: Brookings Institution, 1979.
Dunford, M. Divergence, instability and exclusion:regional dynamics in Great Britain. In: Lee, R.;Wills, J. (eds) Geographies of Economies.London: Hodder Arnold, 1997, p. 259-277.
Frankel, A. The production function in allocationand growth: a synthesis. American EconomicReview. Nashville: American Economic Associ-ation, 1962, Vol. 52, p. 995-1022.
Granovetter, M. Economic action and social struc-ture: the problem of embeddedness. AmericanJournal of Sociology. Chicago: University ofChicago Press, 1985, Vol. 91, issue 3,p. 481-510.
Griliches, Z. Hybrid corn: an exploration in theeconomics of technological change. Econo-metrica. Oxford: Blackwell Publishing, 1957,Vol. 25, p. 501-522.
Griliches, Z. Notes on the role of education inproduction functions and growth accounting.In: Hansen, W. L. (ed.) Education, income, andhuman capital. New York: National Bureau ofEconomic Research, 1970 (Studies in incomeand wealth, Vol. 35).
Grossman, G. M.; Helpman, E. Innovation andgrowth in the global economy. Cambridge, MA:MIT Press, 1991.
Hägerstand, T. Aspects of the spatial structure ofsocial communication and the diffusion of infor-mation. Papers and Proceedings. RegionalScience Association, 1966, Vol. 16, p. 27-42.
Harris, R. G. The knowledge-based economy: intel-lectual origins and new economic perspectives.International Journal of Management Reviews.
References
Oxford: Blackwell Publishing, 2001, Vol. 3,issue 1, p. 21-40.
Huggins, R.; Izushi, H. World knowledge competi-tiveness index 2002: benchmarking the globe’shigh performing regions. Cardiff: RobertHuggins Business & Economic Policy Press,2002.
Jones, C. I. R&D-based models of economicgrowth. Journal of Political Economy. Chicago:University of Chicago Press, 1995, Vol. 103,issue 4, p. 759-784.
Kendrick, J. W. The formation and stocks of totalcapital. New York: National Bureau of EconomicResearch, 1976 (General series, No 100).
Kline, S. J.; Rosenberg, N. An overview of innova-tion. In: Landau, R.; Rosenberg, N. (eds) Thepositive sum strategy: harnessing technologyfor economic growth. Washington, DC:National Academies Press, 1986, p. 275-305.
Kyriacou, G. Level and growth effects of humancapital: a cross-country study of the conver-gence hypothesis. New York, NY: C.V. StarrCenter, 1991 (Working paper, No 91-26).
Lucas, R. E. Jr. On the mechanics of economicdevelopment. Journal of Monetary Economics.Amsterdam: Elsevier Science B.V., 1988,Vol. 22, issue 1, p. 3-42.
Mankiw, N. G.; Romer, D.; Weil, D. N. A contributionto the empirics of economic growth. QuarterlyJournal of Economics. Cambridge: MIT PressJournals, 1992, Vol. 107, issue 2, p. 407-437.
Mansfield, E. Statistics for business andeconomics: methods and applications, 3rd ed.New York: W. W. Norton, 1980.
Marshall, A. Principles of economics. London:Macmillan, 1890.
Nelson, R. R.; Phelps, E. Investment in humans,technological diffusion and economic growth.American Economic Review. Nashville: Amer-ican Economic Association, 1966, Vol. 61, No 2,p. 69-75.
OECD – Organisation for Economic Cooperationand Development. The knowledge-basedeconomy. Paris: OECD, 1996.
Ohmae, K. The end of the nation-state. New York:Free Press, 1995.
Rauch, J. E. Productivity gains from geographicconcentration of human capital: evidence fromthe cities. Journal of Urban Economics. SanDiego, CA: Academic press inc., 1993, Vol. 34,issue 3, p. 380-400.
Richardson, H. W. Regional Economics. Urbana:University of Illinois Press, 1979.
Romer, P. M. Increasing returns and long-rungrowth. Journal of Political Economy. Chicago:University of Chicago Press, 1986, Vol. 94,issue 5, p. 1002-1037.
Romer, P. M. Capital accumulation in the theory oflong run growth. In: Barro, R. J. (ed.) Modernbusiness cycle theory. Cambridge, MA: HarvardUniversity Press, 1989, p. 51-127.
Romer, P. M. Endogenous technological change.Journal of Political Economy. Chicago: Univer-sity of Chicago Press, 1990, Vol. 98, issue 5,p. S71-S102.
Saxenian, A. Regional advantage: culture andcompetition in Silicon Valley and Route 128.Cambridge, MA: Harvard University Press,1994.
Schultz, T. W. Capital formation by education.Journal of Political Economy. Chicago: Univer-sity of Chicago Press, 1960, Vol. 68, p. 571-583.
Schultz, T. W. Investment in human capital. Amer-ican Economic Review. Nashville: AmericanEconomic Association, 1961, Vol. 51, No 1,p. 1-17.
Segerstrom, P. S.; Anant, T.; Dinopoulos, E. ASchumpeterian model of the product life cycle.American Economic Review. Nashville: Amer-ican Economic Association, 1990, Vol. 80,p. 1077-1092.
Shell, K. Toward a theory of inventive activity andcapital accumulation. American EconomicReview. Nashville: American Economic Associ-ation, 1966, Vol. 56, No 2, p. 62-68.
Shell, K. A model of inventive activity and capitalaccumulation. In: Shell, K. (ed.) Essays on thetheory of optimal economic growth.Cambridge, MA: MIT Press, 1967, p. 67-85.
Smith, A. An inquiry into the nature and causes ofthe wealth of nations. Harmondsworth:Penguin, 1776 (reprinted 1970).
Solow, R. M. Technical change and the aggregateproduction function. Review of Economics andStatistics. Cambridge, MA: MIT Press Journals,1957, Vol. 39, p. 312-320.
Summers, R.; Heston, A. The penn world table(mark 5): an expanded set of internationalcomparisons, 1950-1988. Quarterly Journal ofEconomics. Cambridge: MIT Press Journals,1991, Vol. 106, issue 2, p. 327-368.
Empirical analysis of human capital development and economic growth in European regions 117
Swan, T. W. Economic growth and capital accumu-lation. Economic Record. Oxford: BlackwellPublishing, 1956, Vol. 32, p. 334-361.
Williamson, O. E. Markets and hierarchies: analysisand antitrust implications. New York: FreePress, 1975.
Williamson, O. E. The economic institutions of capi-talism. New York: Free Press, 1985.
Wolff, E. N. Technology and the demand for skills.STI – Science, Technology and Industry Review.OECD, 1996, No 18.
Wolff, E. N. The role of education in the postwarproductivity convergence among OECD coun-tries. Industrial and Corporate Change. Oxford:Oxford University Press, 2001, Vol. 10, issue 3,p. 735-759.


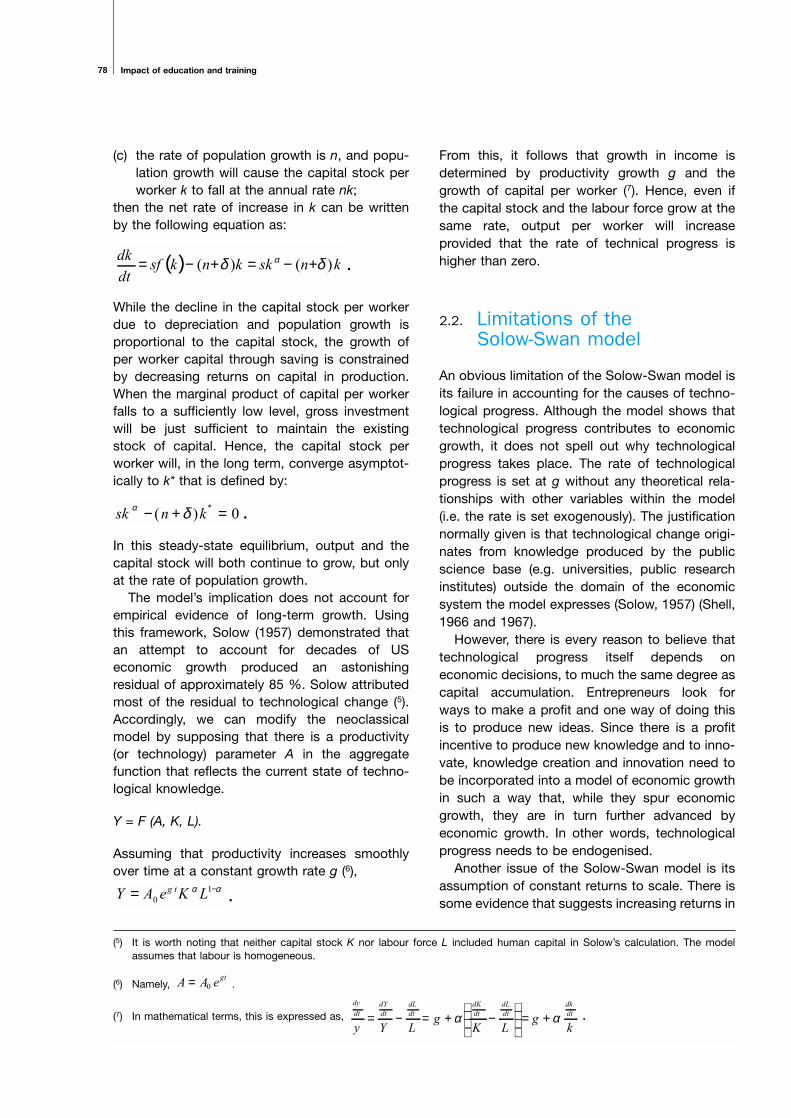

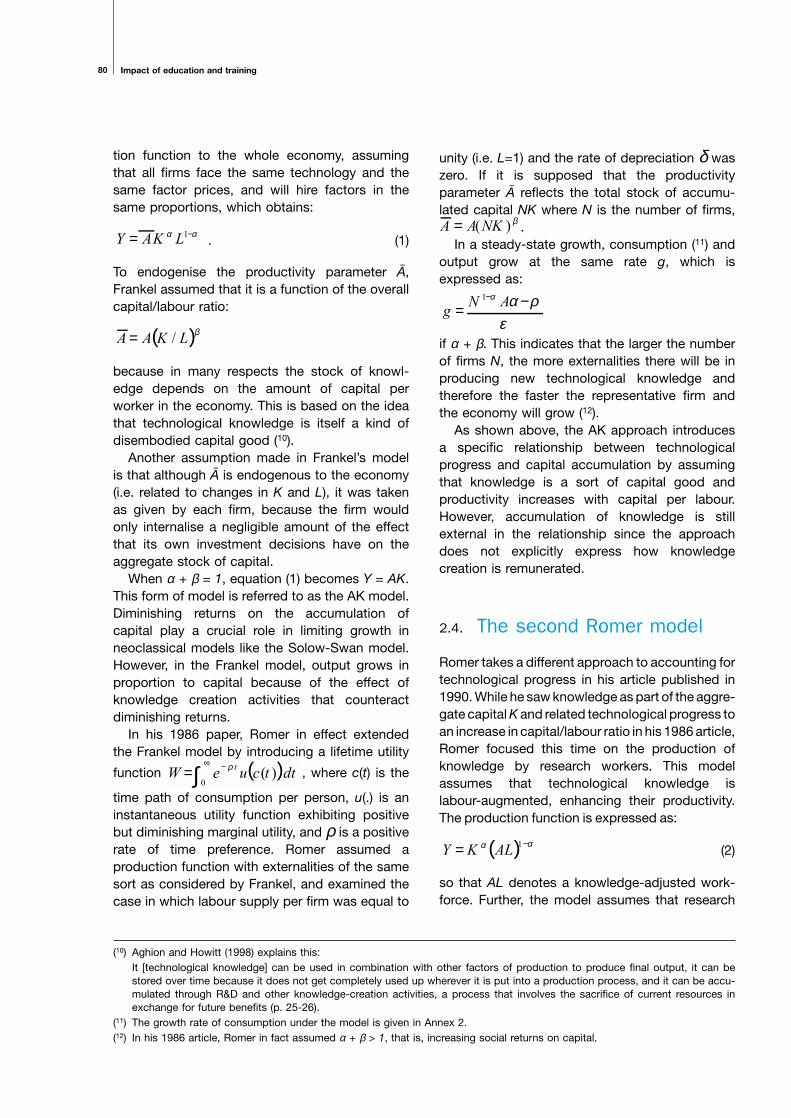


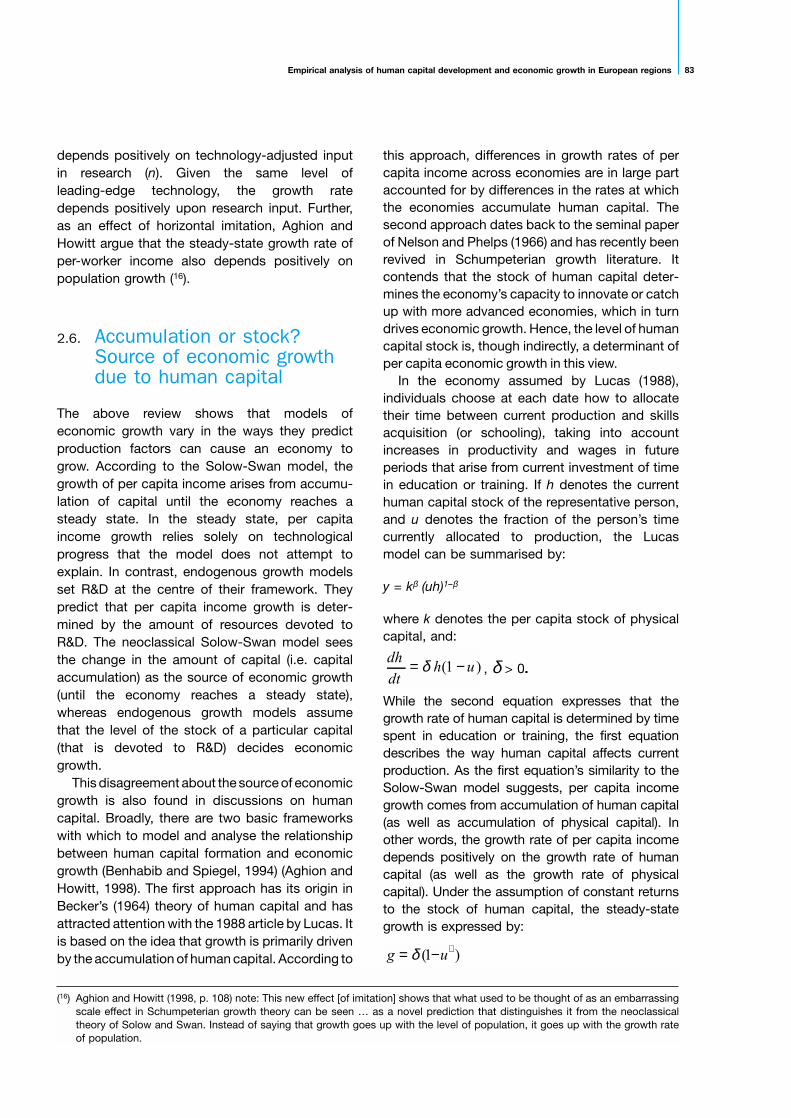


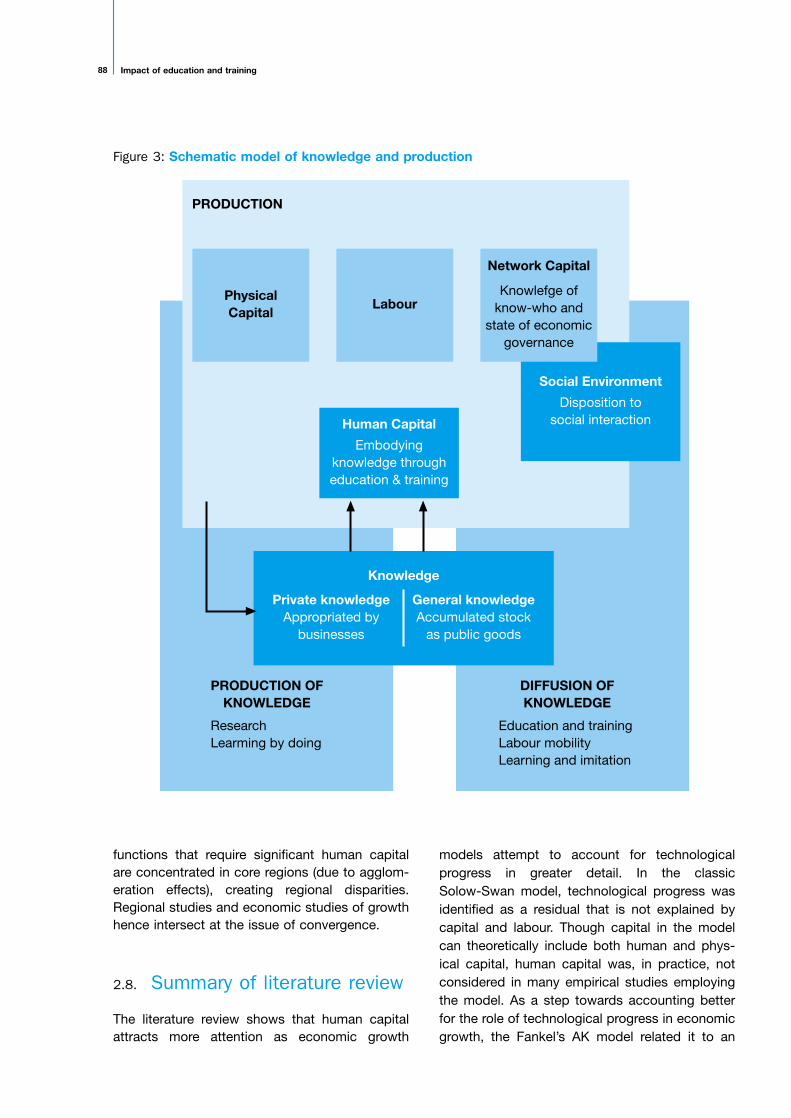


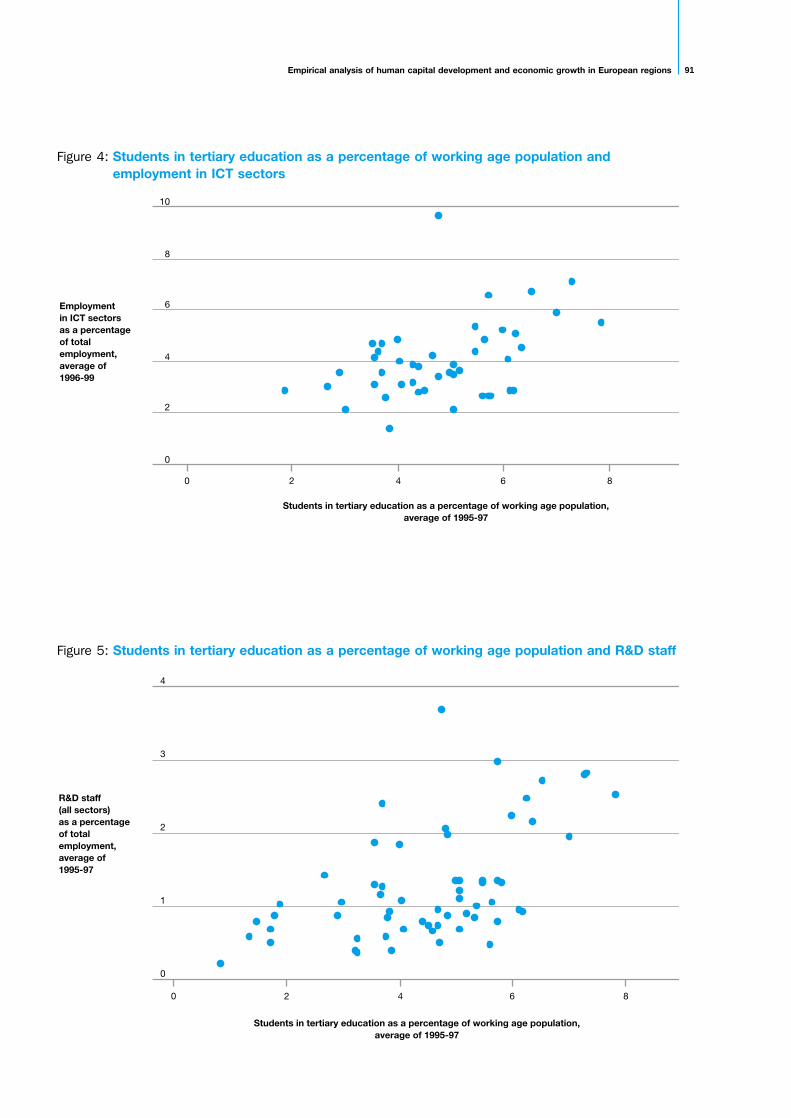


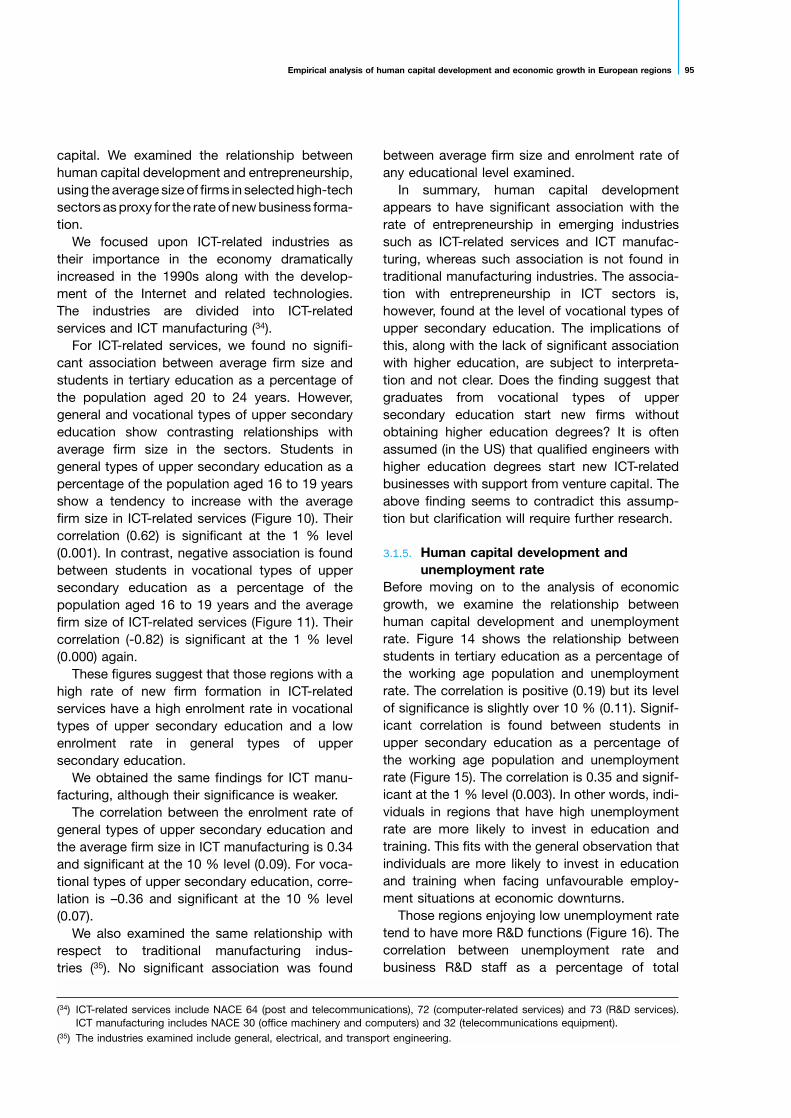
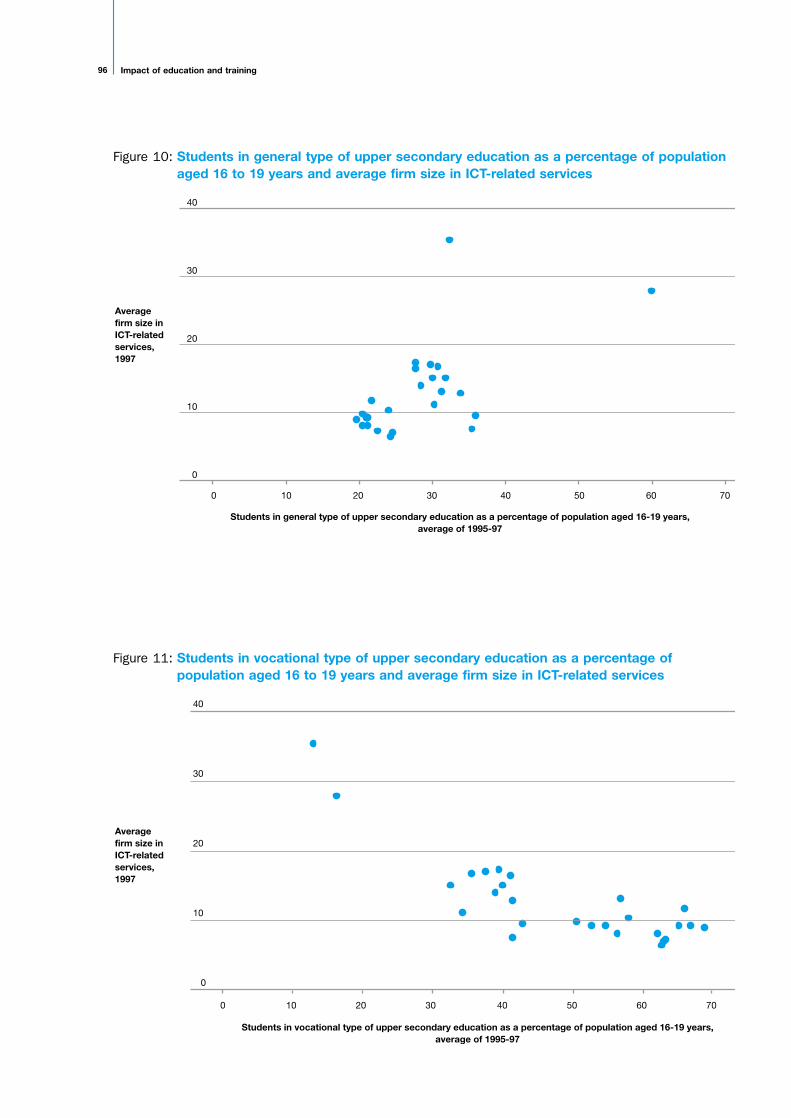

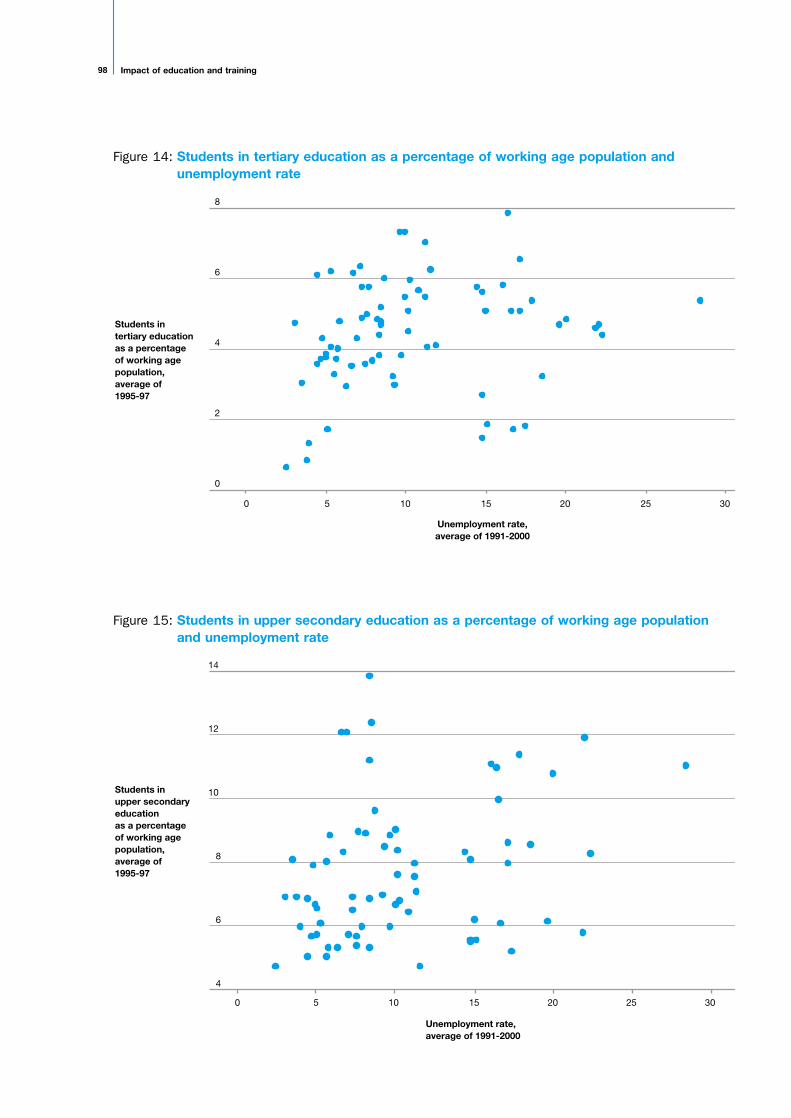


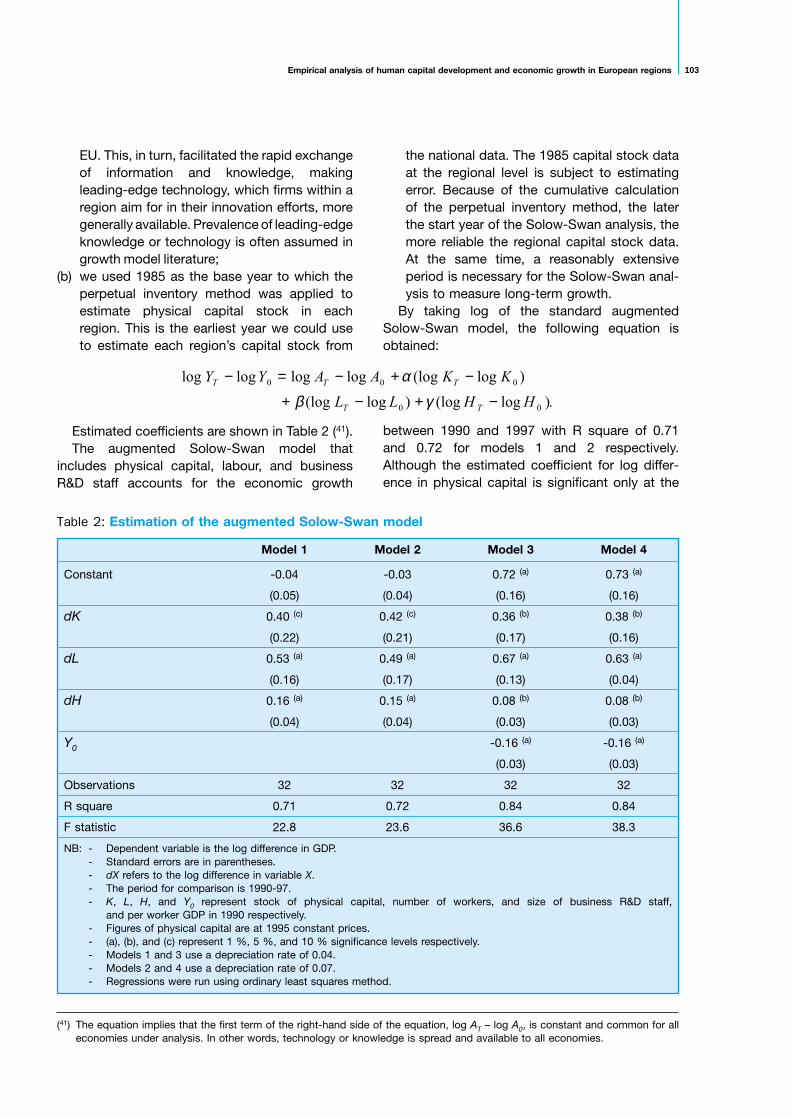
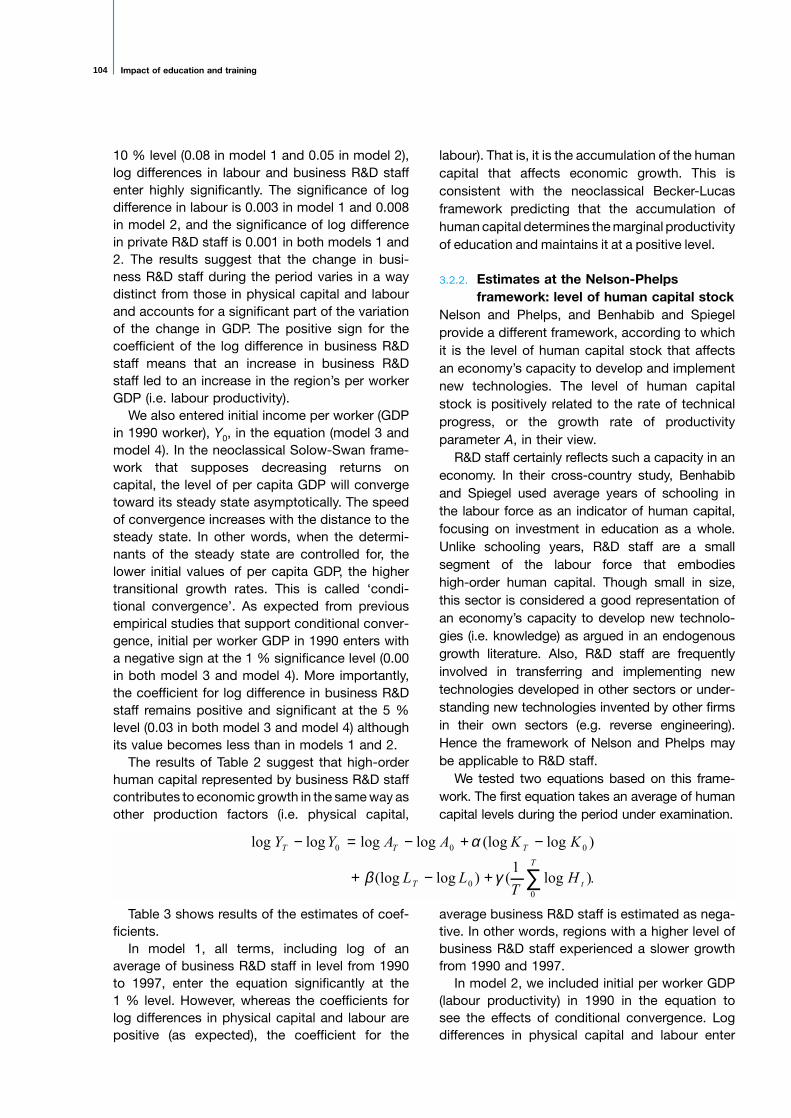


![April 12, 20041 Employee Ownership Legal Update [Executive Summary] David R. Johanson Johanson Berenson LLP 707.226.8997 drj@esop-law.com 18 th Annual.](https://static.documents.pub/doc/80x56/56649d815503460f94a656c5/april-12-20041-employee-ownership-legal-update-executive-summary-david-r.jpg)