13
How to perform and leverage a job-satisfaction survey Employee satisfaction survey guide
E M P L O Y E E S AT I S F A C T I O N S U R V E Y G U I D EZ E N D E S K 1
How to perform and leverage a job-satisfaction survey
Employee satisfaction survey guide
E M P L O Y E E S AT I S F A C T I O N S U R V E Y G U I D EZ E N D E S K 2
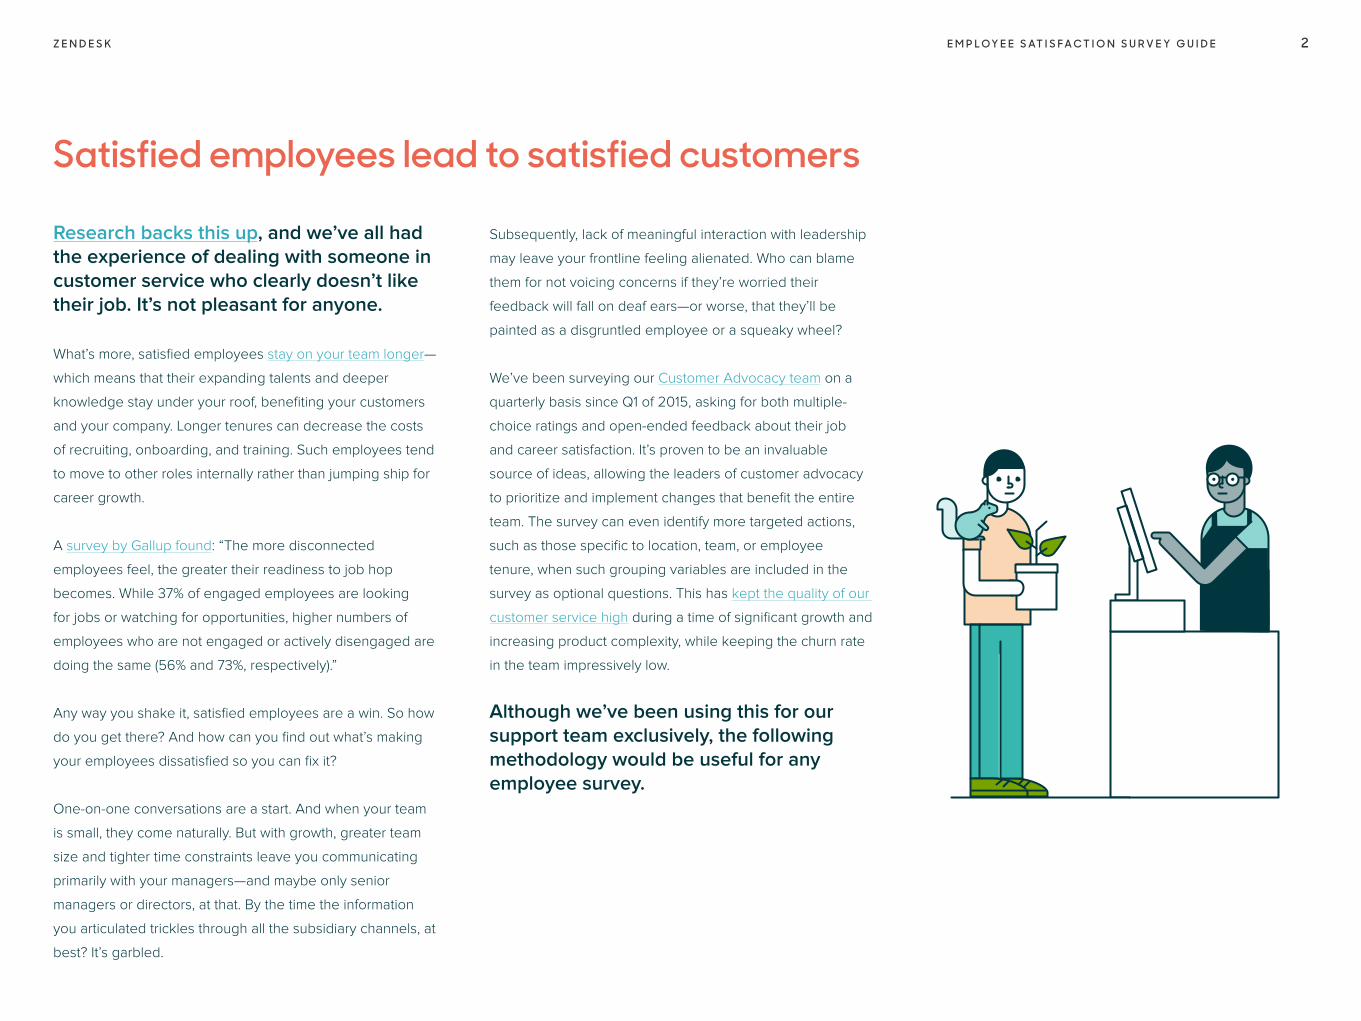
Research backs this up, and we’ve all had the experience of dealing with someone in customer service who clearly doesn’t like their job. It’s not pleasant for anyone.
What’s more, satisfied employees stay on your team longer—
which means that their expanding talents and deeper
knowledge stay under your roof, benefiting your customers
and your company. Longer tenures can decrease the costs
of recruiting, onboarding, and training. Such employees tend
to move to other roles internally rather than jumping ship for
career growth.
A survey by Gallup found: “The more disconnected
employees feel, the greater their readiness to job hop
becomes. While 37% of engaged employees are looking
for jobs or watching for opportunities, higher numbers of
employees who are not engaged or actively disengaged are
doing the same (56% and 73%, respectively).”
Any way you shake it, satisfied employees are a win. So how
do you get there? And how can you find out what’s making
your employees dissatisfied so you can fix it?
One-on-one conversations are a start. And when your team
is small, they come naturally. But with growth, greater team
size and tighter time constraints leave you communicating
primarily with your managers—and maybe only senior
managers or directors, at that. By the time the information
you articulated trickles through all the subsidiary channels, at
best? It’s garbled.
Subsequently, lack of meaningful interaction with leadership
may leave your frontline feeling alienated. Who can blame
them for not voicing concerns if they’re worried their
feedback will fall on deaf ears—or worse, that they’ll be
painted as a disgruntled employee or a squeaky wheel?
We’ve been surveying our Customer Advocacy team on a
quarterly basis since Q1 of 2015, asking for both multiple-
choice ratings and open-ended feedback about their job
and career satisfaction. It’s proven to be an invaluable
source of ideas, allowing the leaders of customer advocacy
to prioritize and implement changes that benefit the entire
team. The survey can even identify more targeted actions,
such as those specific to location, team, or employee
tenure, when such grouping variables are included in the
survey as optional questions. This has kept the quality of our
customer service high during a time of significant growth and
increasing product complexity, while keeping the churn rate
in the team impressively low.
Although we’ve been using this for our support team exclusively, the following methodology would be useful for any employee survey.
Satisfied employees lead to satisfied customers
E M P L O Y E E S AT I S F A C T I O N S U R V E Y G U I D EZ E N D E S K 3
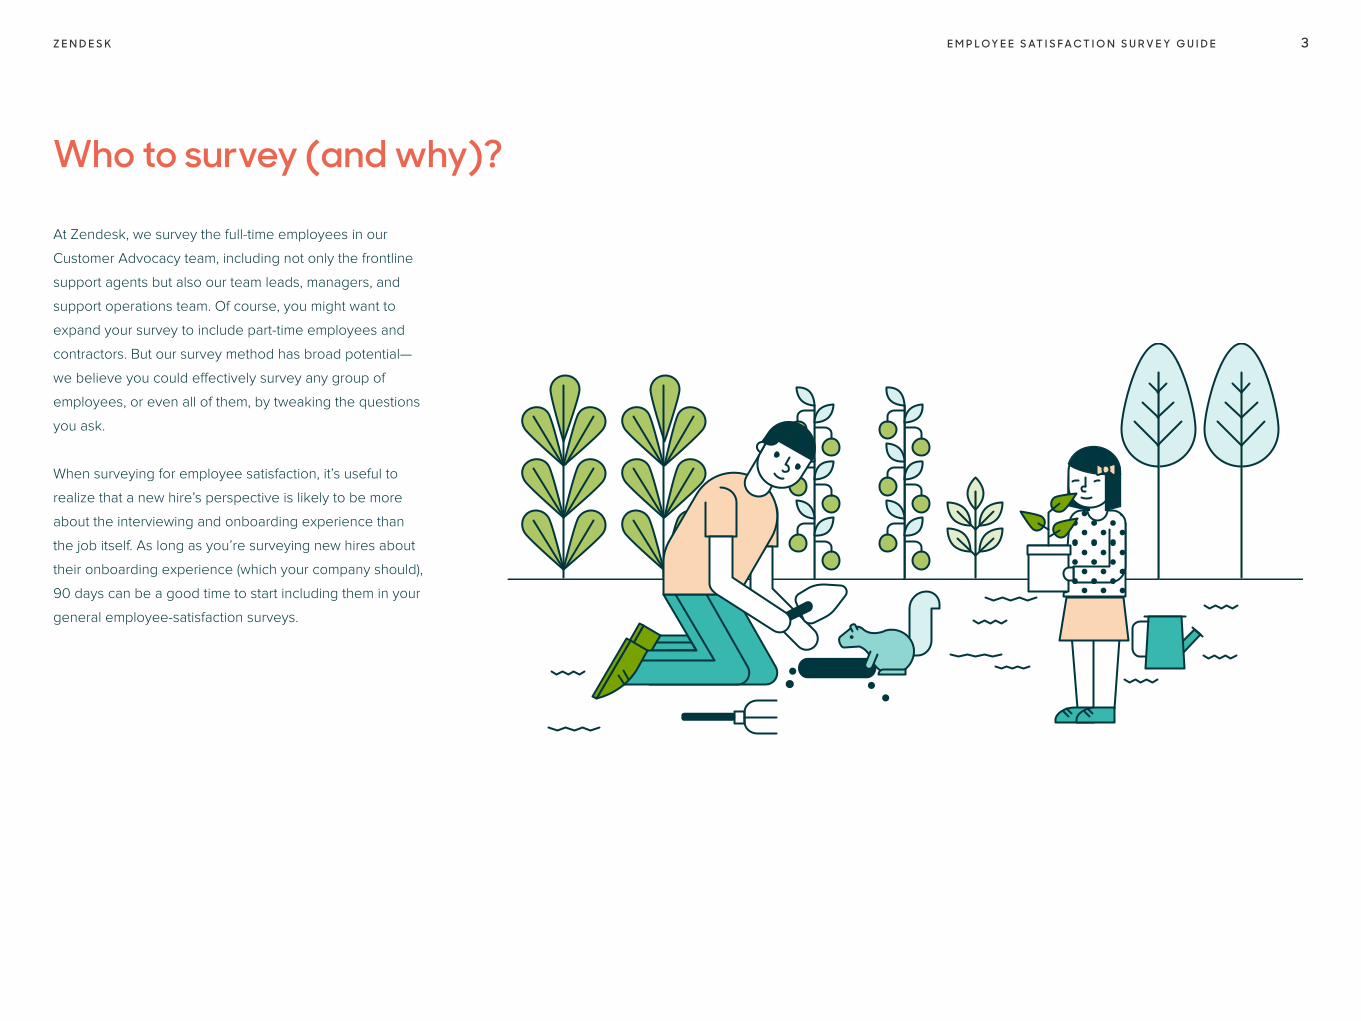
At Zendesk, we survey the full-time employees in our
Customer Advocacy team, including not only the frontline
support agents but also our team leads, managers, and
support operations team. Of course, you might want to
expand your survey to include part-time employees and
contractors. But our survey method has broad potential—
we believe you could effectively survey any group of
employees, or even all of them, by tweaking the questions
you ask.
When surveying for employee satisfaction, it’s useful to
realize that a new hire’s perspective is likely to be more
about the interviewing and onboarding experience than
the job itself. As long as you’re surveying new hires about
their onboarding experience (which your company should),
90 days can be a good time to start including them in your
general employee-satisfaction surveys.
Who to survey (and why)?
E M P L O Y E E S AT I S F A C T I O N S U R V E Y G U I D EZ E N D E S K 4
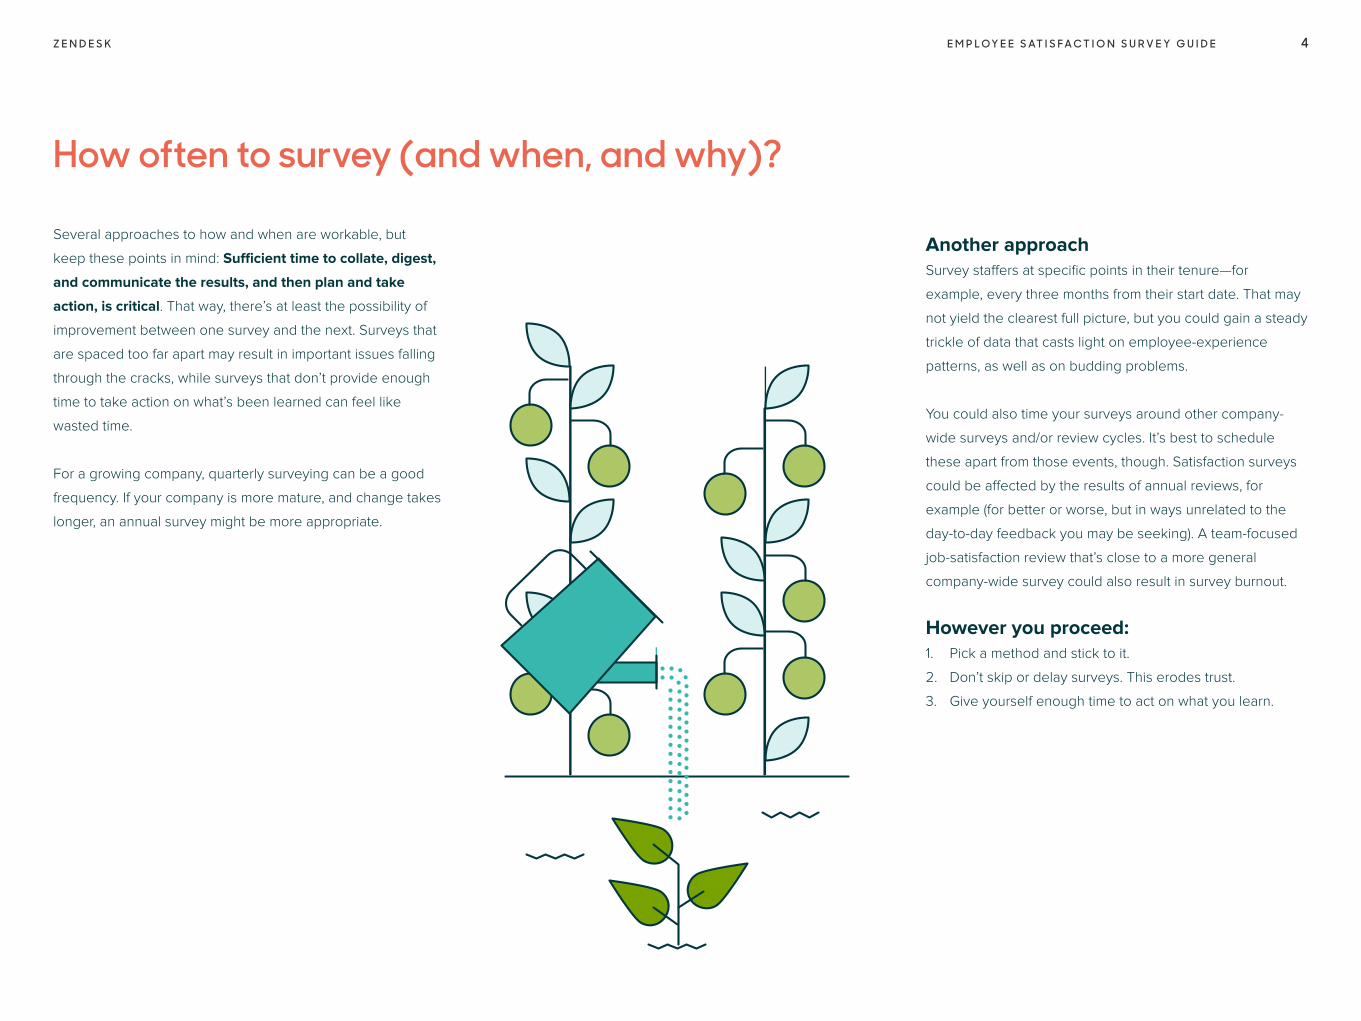
Several approaches to how and when are workable, but
keep these points in mind: Sufficient time to collate, digest,
and communicate the results, and then plan and take
action, is critical. That way, there’s at least the possibility of
improvement between one survey and the next. Surveys that
are spaced too far apart may result in important issues falling
through the cracks, while surveys that don’t provide enough
time to take action on what’s been learned can feel like
wasted time.
For a growing company, quarterly surveying can be a good
frequency. If your company is more mature, and change takes
longer, an annual survey might be more appropriate.
How often to survey (and when, and why)?
Another approachSurvey staffers at specific points in their tenure—for
example, every three months from their start date. That may
not yield the clearest full picture, but you could gain a steady
trickle of data that casts light on employee-experience
patterns, as well as on budding problems.
You could also time your surveys around other company-
wide surveys and/or review cycles. It’s best to schedule
these apart from those events, though. Satisfaction surveys
could be affected by the results of annual reviews, for
example (for better or worse, but in ways unrelated to the
day-to-day feedback you may be seeking). A team-focused
job-satisfaction review that’s close to a more general
company-wide survey could also result in survey burnout.
However you proceed:1. Pick a method and stick to it.
2. Don’t skip or delay surveys. This erodes trust.
3. Give yourself enough time to act on what you learn.
E M P L O Y E E S AT I S F A C T I O N S U R V E Y G U I D EZ E N D E S K 5
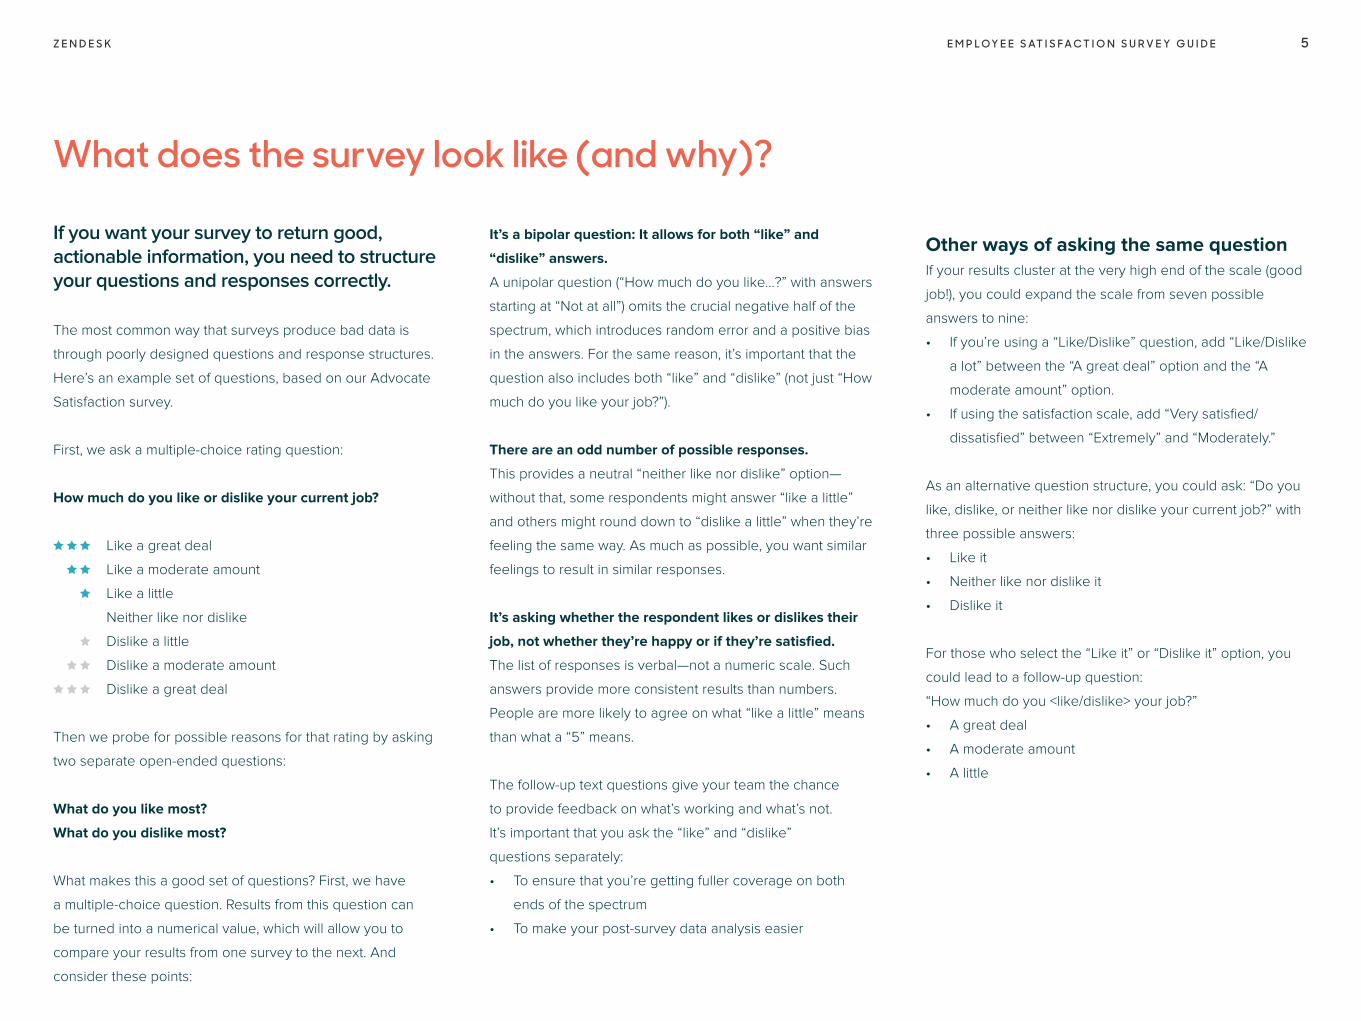
If you want your survey to return good, actionable information, you need to structure your questions and responses correctly.
The most common way that surveys produce bad data is
through poorly designed questions and response structures.
Here’s an example set of questions, based on our Advocate
Satisfaction survey.
First, we ask a multiple-choice rating question:
How much do you like or dislike your current job?
Like a great deal
Like a moderate amount
Like a little
Neither like nor dislike
Dislike a little
Dislike a moderate amount
Dislike a great deal
Then we probe for possible reasons for that rating by asking
two separate open-ended questions:
What do you like most?
What do you dislike most?
What makes this a good set of questions? First, we have
a multiple-choice question. Results from this question can
be turned into a numerical value, which will allow you to
compare your results from one survey to the next. And
consider these points:
What does the survey look like (and why)?
It’s a bipolar question: It allows for both “like” and
“dislike” answers.
A unipolar question (“How much do you like…?” with answers
starting at “Not at all”) omits the crucial negative half of the
spectrum, which introduces random error and a positive bias
in the answers. For the same reason, it’s important that the
question also includes both “like” and “dislike” (not just “How
much do you like your job?”).
There are an odd number of possible responses.
This provides a neutral “neither like nor dislike” option—
without that, some respondents might answer “like a little”
and others might round down to “dislike a little” when they’re
feeling the same way. As much as possible, you want similar
feelings to result in similar responses.
It’s asking whether the respondent likes or dislikes their
job, not whether they’re happy or if they’re satisfied.
The list of responses is verbal—not a numeric scale. Such
answers provide more consistent results than numbers.
People are more likely to agree on what “like a little” means
than what a “5” means.
The follow-up text questions give your team the chance
to provide feedback on what’s working and what’s not.
It’s important that you ask the “like” and “dislike”
questions separately:
• To ensure that you’re getting fuller coverage on both
ends of the spectrum
• To make your post-survey data analysis easier
Other ways of asking the same questionIf your results cluster at the very high end of the scale (good
job!), you could expand the scale from seven possible
answers to nine:
• If you’re using a “Like/Dislike” question, add “Like/Dislike
a lot” between the “A great deal” option and the “A
moderate amount” option.
• If using the satisfaction scale, add “Very satisfied/
dissatisfied” between “Extremely” and “Moderately.”
As an alternative question structure, you could ask: “Do you
like, dislike, or neither like nor dislike your current job?” with
three possible answers:
• Like it
• Neither like nor dislike it
• Dislike it
For those who select the “Like it” or “Dislike it” option, you
could lead to a follow-up question:
“How much do you <like/dislike> your job?”
• A great deal
• A moderate amount
• A little
E M P L O Y E E S AT I S F A C T I O N S U R V E Y G U I D EZ E N D E S K 6
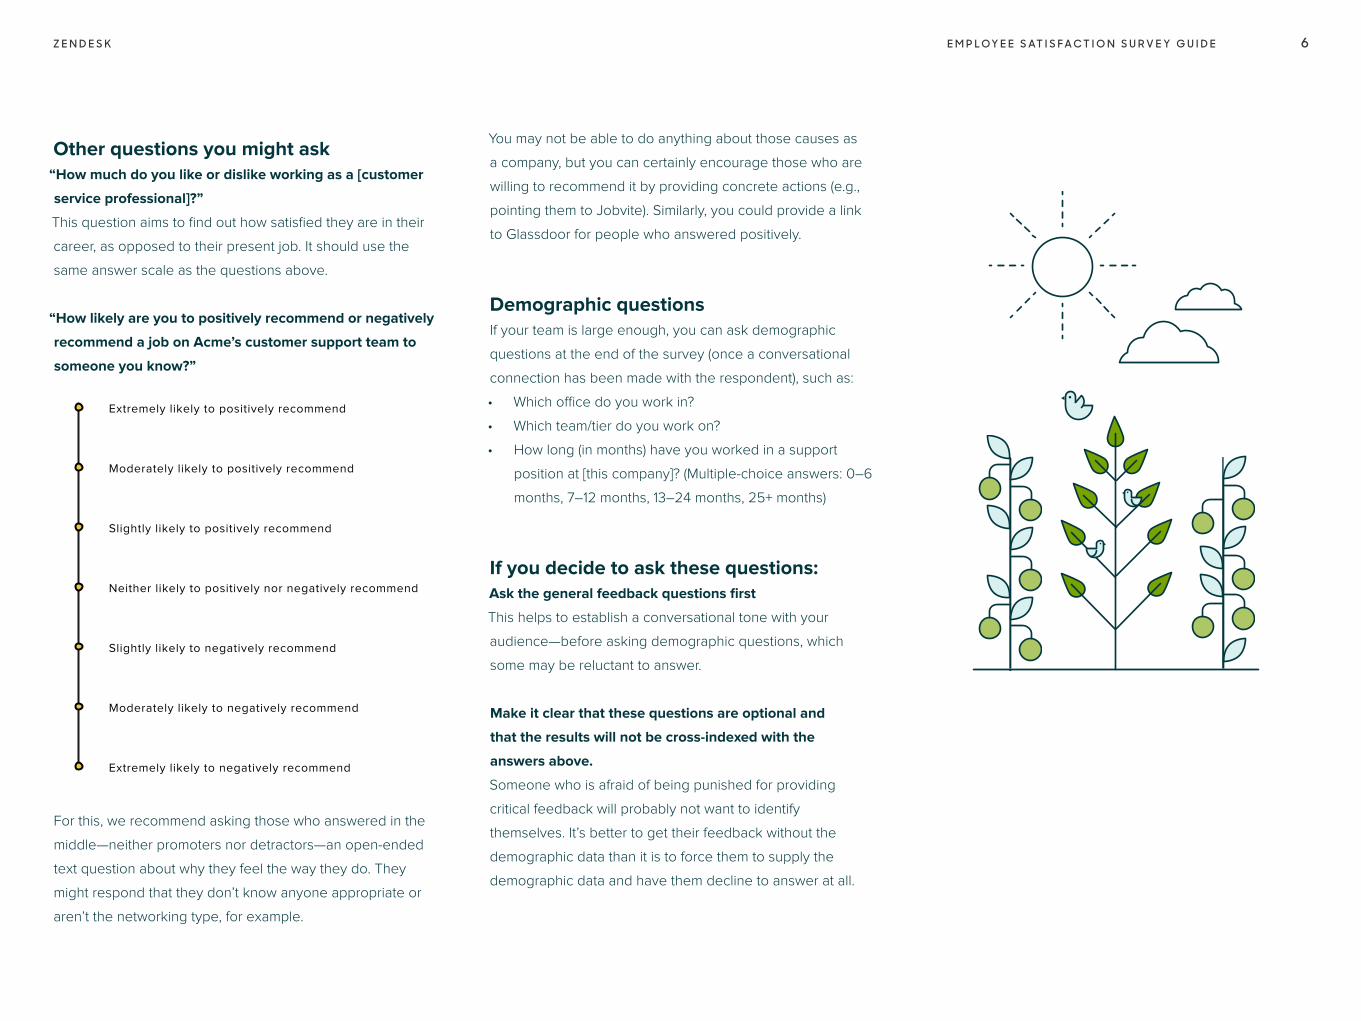
Extremely likely to positively recommend
Moderately likely to positively recommend
Slightly likely to positively recommend
Neither likely to positively nor negatively recommend
Slightly likely to negatively recommend
Moderately likely to negatively recommend
Extremely likely to negatively recommend
Other questions you might ask“How much do you like or dislike working as a [customer
service professional]?”
This question aims to find out how satisfied they are in their
career, as opposed to their present job. It should use the
same answer scale as the questions above.
“How likely are you to positively recommend or negatively
recommend a job on Acme’s customer support team to
someone you know?”
For this, we recommend asking those who answered in the
middle—neither promoters nor detractors—an open-ended
text question about why they feel the way they do. They
might respond that they don’t know anyone appropriate or
aren’t the networking type, for example.
You may not be able to do anything about those causes as
a company, but you can certainly encourage those who are
willing to recommend it by providing concrete actions (e.g.,
pointing them to Jobvite). Similarly, you could provide a link
to Glassdoor for people who answered positively.
Demographic questionsIf your team is large enough, you can ask demographic
questions at the end of the survey (once a conversational
connection has been made with the respondent), such as:
• Which office do you work in?
• Which team/tier do you work on?
• How long (in months) have you worked in a support
position at [this company]? (Multiple-choice answers: 0–6
months, 7–12 months, 13–24 months, 25+ months)
If you decide to ask these questions:Ask the general feedback questions first
This helps to establish a conversational tone with your
audience—before asking demographic questions, which
some may be reluctant to answer.
Make it clear that these questions are optional and
that the results will not be cross-indexed with the
answers above.
Someone who is afraid of being punished for providing
critical feedback will probably not want to identify
themselves. It’s better to get their feedback without the
demographic data than it is to force them to supply the
demographic data and have them decline to answer at all.
E M P L O Y E E S AT I S F A C T I O N S U R V E Y G U I D EZ E N D E S K 7
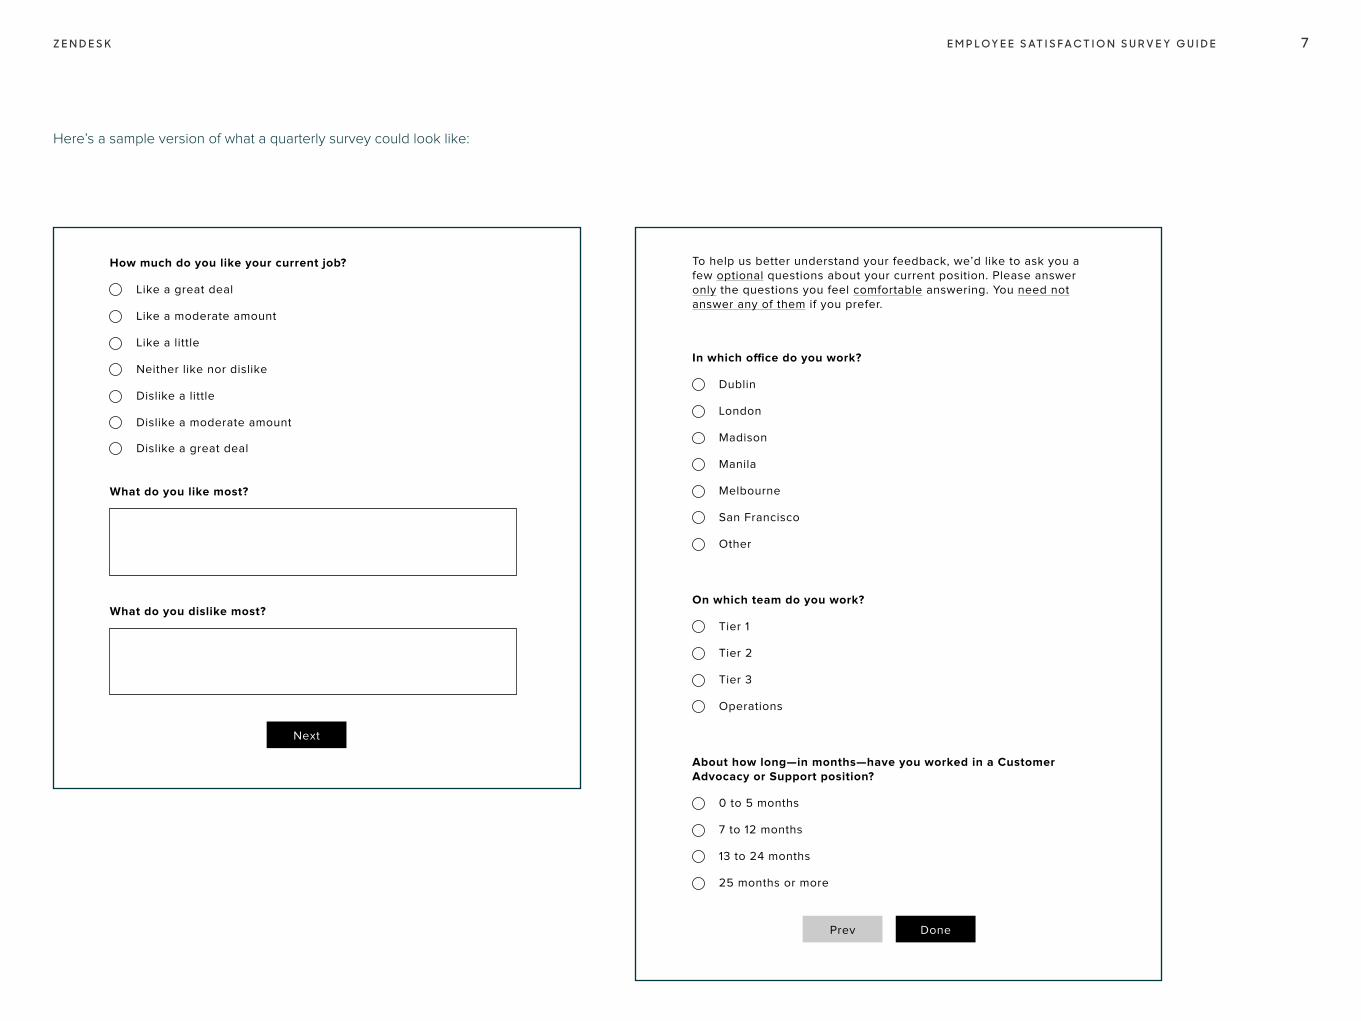
Here’s a sample version of what a quarterly survey could look like:
How much do you like your current job?
What do you like most?
Like a great deal
Like a moderate amount
Like a little
Neither like nor dislike
Dislike a little
Dislike a moderate amount
Next
Dislike a great deal
What do you dislike most?
In which o�ce do you work?
Dublin
London
Madison
Manila
On which team do you work?
Tier 1
Tier 2
Tier 3
Operations
About how long—in months—have you worked in a CustomerAdvocacy or Support position?
0 to 5 months
7 to 12 months
13 to 24 months
25 months or more
Melbourne
San Francisco
Other
Prev Done
To help us better understand your feedback, we’d like to ask you a few optional questions about your current position. Please answer only the questions you feel comfortable answering. You need not answer any of them if you prefer.
E M P L O Y E E S AT I S F A C T I O N S U R V E Y G U I D EZ E N D E S K 8
Someone outside the surveyed group and leadership should always be survey administrator.
Reasons include:
Anonymity versus confidentiality: Confidentiality means
that when you respond to the survey, the administrator
will know who you are but promises to keep your identity
secret. This is probably how you interact with your HR
department—you trust them with sensitive information
because you know they’re not going to share it.
Anonymity is a further level of security: Your identity is
unknown to those reading the survey results. This has value
in a team survey because it helps your people feel more
comfortable voicing critical opinions. Even if, as a leader,
you have no plans to retaliate, a team may struggle to trust
that. Thus, an anonymous survey should result in a higher
response rate, as well as better information.
An anonymous survey must not record names, usernames,
email addresses, IP addresses, geo addresses, referring
URLs, or any other identifying information.
Who administers the survey (and why)?
If your survey includes open-ended text questions, and/or
demographic questions that could be used to deduce the
identity of the respondent, you need a neutral recipient who
can sanitize the text responses of any identifying information
and ensure that demographic responses are not combined.
Ideally, the individual responsible for anonymizing the
data should not be a member of the surveyed team in any
capacity and should not be a member of any team with a
significant stake in results from the survey.
For example, even though someone from your HR
department might seem like a good choice since they’re
well versed in confidentiality, they may have a direct stake in
employee recruitment and retention, which makes them an
improper choice. Other teams may also have stakes—e.g.,
product, sales, and marketing—but the stakes for those
teams tend to be lower than those of HR. If you’re unable
to find someone within your company who fits these
requirements (which would certainly be the case if you’re
surveying the entire company), then you should work with
a third-party researcher or organization that can guarantee
these standards are met.
E M P L O Y E E S AT I S F A C T I O N S U R V E Y G U I D EZ E N D E S K 9
There are some important things to keep in mind when
choosing a tool to administer the survey:
• Make sure the survey program being used is NOT
automatically tracking respondent info. Most are set up
with automatic tracking, IP address recording, device
used, geo-location, and other respondent info. Surveyors
wanting to run anonymous surveys typically must opt out
of automatic tracking. Note that this is often not available
with free versions of freemium products.
• Use secure survey links (https, not http).
• Maintain secure log-in procedures (e.g., separate
device authentication, login behind protected single sign
on, etc.).
• Use secure data servers.
• Non-U.S. respondents should consider using servers
outside the U.S.
• Some vendors make use of the data they collect for
you, so ask for limited or no usage of data by the survey
platform vendor.
• Ensure there is sufficient financial liability coverage by the
vendor when the vendor fails to maintain data security.
• Your company may have other requirements to outside
vendors as well, so be sure to stick to those standards.
How are the results collected (and why)?
Announce the survey in advance of sending it out.
Your team might be skeptical if they’ve been burned—by
previous surveys that weren’t followed through on, or that
resulted in retaliation. Also, don’t they have actual work to
do? Articulate your vision for why the survey matters and
how you intend to act on what you learn. Get buy-in from the
leaders throughout your team, and have them encourage
the team to respond. Set a deadline that gives everyone
some time to think about their responses, but not so long
that the survey is forgotten! A week is good.
Continue to encourage responses throughout the survey period. And remind your team that you’re doing this to better serve them.
E M P L O Y E E S AT I S F A C T I O N S U R V E Y G U I D EZ E N D E S K 1 0
Once your surveyor has the results, several steps must be
taken before the results can be communicated back to you
and your leadership team, and then to the team at large.
S T E P 1
Cleanse the text responses of any personally identifying information.It’s critical that this be done before the results are returned
to the leadership team.
• Verify that no respondent tracking data is included.
Remove if included (and revise procedures in the next
round). Then, create an anonymized data file.
• Create a spreadsheet with all responses to all non-
demographic multiple-choice questions; e.g., for the
multiple-choice questions assessing job satisfaction,
career satisfaction, and likelihood of recommendation.
No other data would be included on this sheet.
• Create separate sheets for all responses to EACH
individual open-ended question; e.g., “Why do you like
your job?” on one sheet and “Why do you dislike your
job?” on another. This is where the responses need to
be anonymized, by removing any names, places, or
other clues to who might have made the comment.
• Create separate sheets with all responses to ALL
multiple-choice questions and ONE demographic
variable; e.g., if you have a single job-satisfaction
question plus three optional demographic questions
(office location, team/tier, and tenure), the file would
include three separate sheets, each of which would
contain the job-satisfaction answers plus one of the
three demographic questions.
What’s done with the results (and why)?
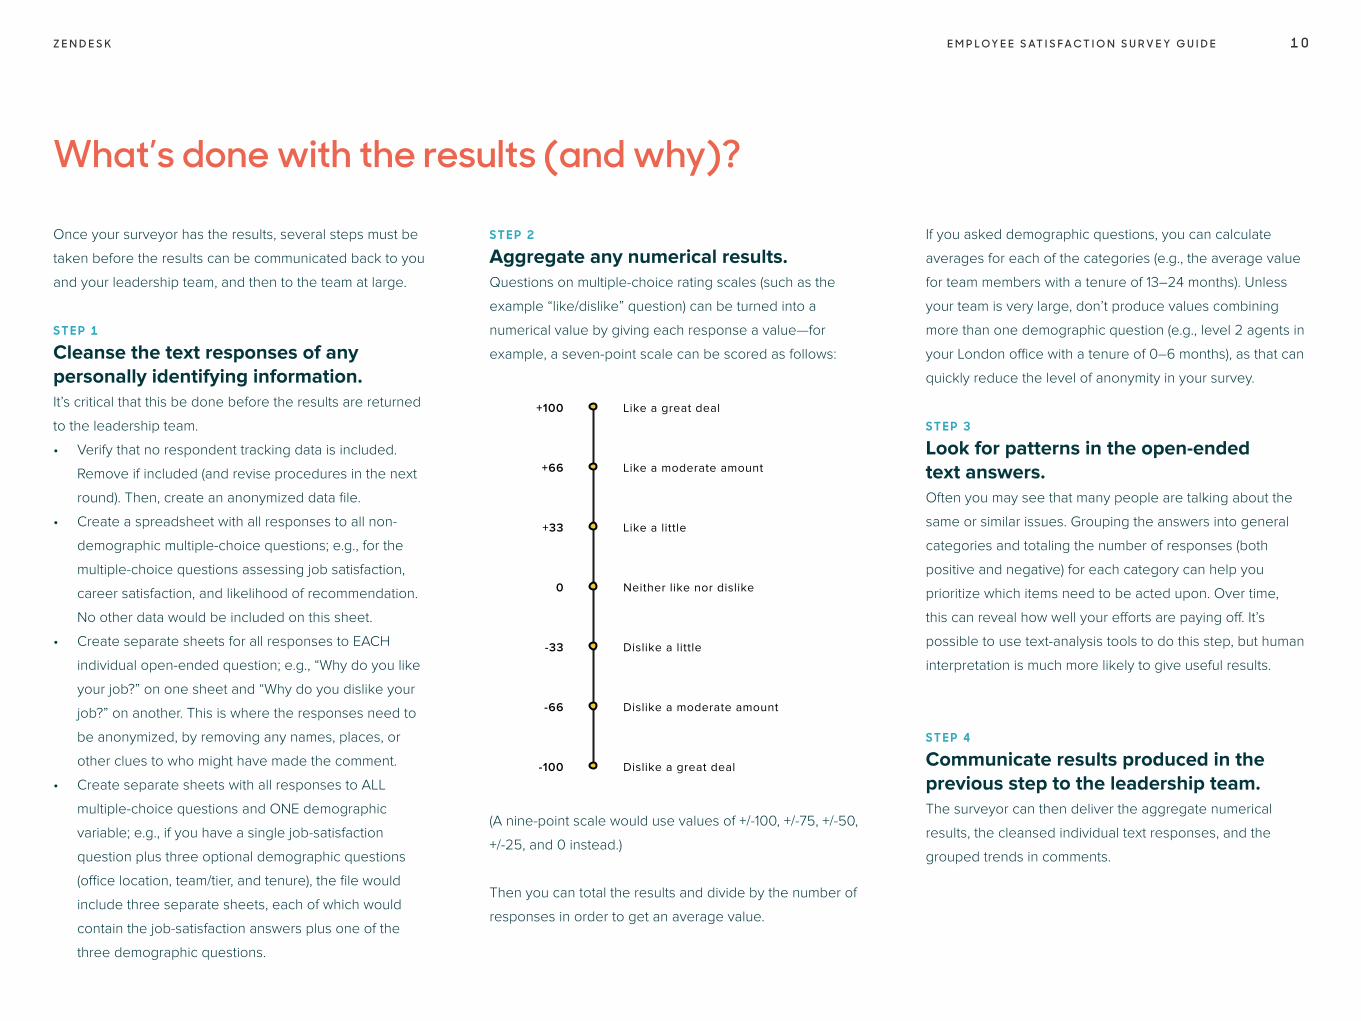
S T E P 2
Aggregate any numerical results.Questions on multiple-choice rating scales (such as the
example “like/dislike” question) can be turned into a
numerical value by giving each response a value—for
example, a seven-point scale can be scored as follows:
(A nine-point scale would use values of +/-100, +/-75, +/-50,
+/-25, and 0 instead.)
Then you can total the results and divide by the number of
responses in order to get an average value.
If you asked demographic questions, you can calculate
averages for each of the categories (e.g., the average value
for team members with a tenure of 13–24 months). Unless
your team is very large, don’t produce values combining
more than one demographic question (e.g., level 2 agents in
your London office with a tenure of 0–6 months), as that can
quickly reduce the level of anonymity in your survey.
S T E P 3
Look for patterns in the open-ended text answers.Often you may see that many people are talking about the
same or similar issues. Grouping the answers into general
categories and totaling the number of responses (both
positive and negative) for each category can help you
prioritize which items need to be acted upon. Over time,
this can reveal how well your efforts are paying off. It’s
possible to use text-analysis tools to do this step, but human
interpretation is much more likely to give useful results.
S T E P 4
Communicate results produced in the previous step to the leadership team.The surveyor can then deliver the aggregate numerical
results, the cleansed individual text responses, and the
grouped trends in comments.
+100 Like a great deal
+66 Like a moderate amount
+33 Like a little
0 Neither like nor dislike
-33 Dislike a little
-66 Dislike a moderate amount
-100 Dislike a great deal
E M P L O Y E E S AT I S F A C T I O N S U R V E Y G U I D EZ E N D E S K 1 1
S T E P 5
Now it’s time for the leadership team to take a hard look at the results and decide which critical issues need to be addressed.A survey that doesn’t produce action is not going to be
treated seriously the next time you give it. If you’re not
planning on doing anything with the answers, then why take
up your team’s time in the first place? If you don’t follow
through, your team will stop talking to you, or, maybe worse,
will just tell you what they think you want to hear.
It may sound counterintuitive, but the negative comments are
a gold mine. Addressing the issues they raise will show that
you took complaints seriously and are willing to spend your
time and energy to make your team’s work lives better.
Set yourself up for success by setting realistic, smart goals.
And by that we mean specific, measurable, agreed upon,
realistic, and time-based. Allocate the necessary resources
and set milestones. Weigh these projects against your other
responsibilities in terms of cost and benefits. Consider the
cost of agent turnover—recruiting, onboarding, training, and
time to mastery—if you ignore the feedback, and the potential
benefits of delivering on that feedback.
S T E P 6
Finally, it’s time to communicate the results back to the team.A slide deck presented live (and recorded, for those not
in attendance) is a good way to deliver results in a visually
compelling way. Ideally, someone from the leadership team
should co-present alongside the surveyor so any questions
can be addressed. Include:
• Charts showing the results and mean value of each
multiple-choice question
• Averages for the categories in any demographic
questions you asked
• A histogram showing the number of positive and
negative comments by category (note that you
don’t need to provide the individual text responses
at this stage)
• Comparisons to previous surveys (if any)
• An explanation of the survey methodology, including
how the values are calculated from the multiple-choice
questions, how you assure anonymity, etc.
E M P L O Y E E S AT I S F A C T I O N S U R V E Y G U I D EZ E N D E S K 1 2
Once you’ve presented the results, it’s time to
communicate what you intend to do about them, such as:
• Progress on commitments made following prior
surveys (if any)
• New commitments based on this survey, with your
plan for achieving them
• If there are significant issues that you’re unable or
unwilling to address, give your reasoning for them
as well
Allow your team some time to ask questions, and encourage them to talk to their supervisor if they have concerns they’d rather not share in a group setting.
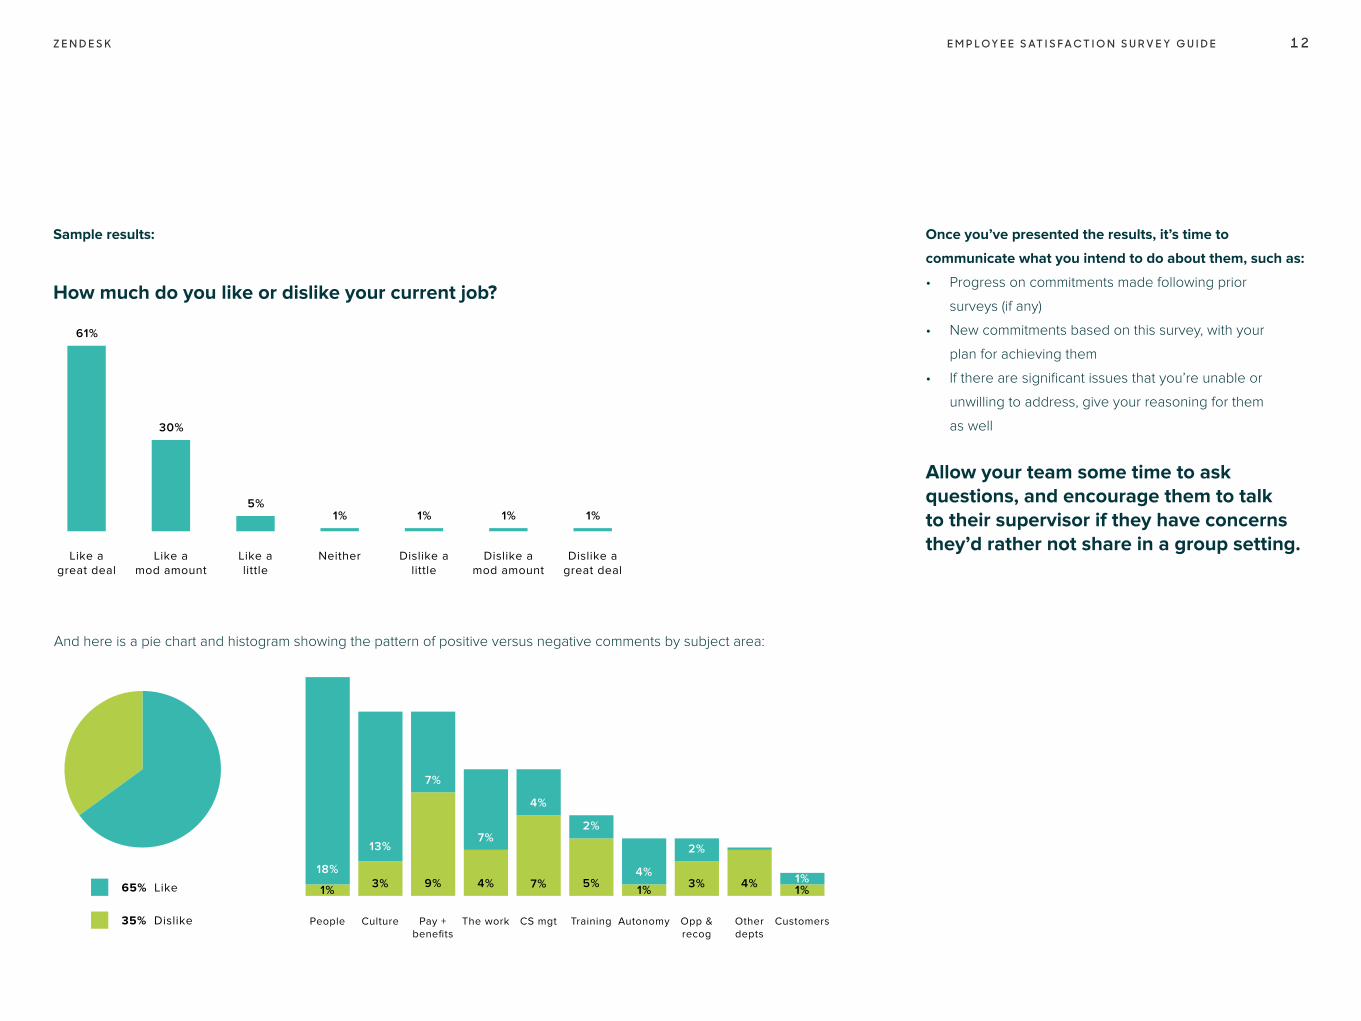
Sample results:
How much do you like or dislike your current job?
And here is a pie chart and histogram showing the pattern of positive versus negative comments by subject area:
Like agreat deal
61%
Like amod amount
30%
Like alittle
5%
Neither
1%
Dislike alittle
1%
Dislike amod amount
1%
Dislike agreat deal
1%
1%
18%
People
3%
13%
Culture
9%
7%
Pay +benefits
4%
7%
The work
7%
4%
CS mgt
5%
2%
Training
1%
4%
Autonomy
3%
2%
Opp &recog
4%
Otherdepts
1%1%
Customers
65% Like
35% Dislike
E M P L O Y E E S AT I S F A C T I O N S U R V E Y G U I D EZ E N D E S K 1 3
Relationships are complicated. But with ongoing communication and a feedback loop built on trust and solid data, they can also be healthy, long-lasting, and rewarding for everyone involved.
This guide was written by Lori Gauthier and Dave Dyson.
Lori is Zendesk’s Director of Marketing Research, where she
conducts research involving employees, customers, and
prospects. Lori holds a PhD in Communication and a PhD
Minor in Psychology from Stanford University, where she
taught the communication research methods course and
conducted survey-focused research.
Dave is a Senior Customer Service Evangelist at Zendesk’s
headquarters in San Francisco. Previously serving as
Customer Advocate, Support Manager, and Senior Support
Manager, he now works to help bring the best-practice
lessons he’s learned to the wider world, writing articles and
best-practice guides, and presenting at events around the
world. Find Dave on Twitter: @dave_dyson.
Conclusion


