+ All Categories
Home > Documents > EMS Industry – Stocks Reflect Seasonality and...

EMS Industry – Stocks Reflect Seasonality and...

Date post: 08-May-2018
Category:
Upload: duongtruc
View: 217 times
Download: 1 times
Share this document with a friend
19
1 2003 New Year Preview IEEE CPMT SCV Chapter Meeting For pertinent disclosure, please see disclosures at end of report. EMS Industry – Stocks Reflect Seasonality and … Better Times? June 11, 2003 J. Keith Dunne (415) 633-8543 [email protected] 1 J. Keith Dunne Phone: (415) 633-8543 keith[email protected] Agenda I. Electronic Manufacturing Services Overview II. EMS Industry Continues To Evolve III. Industry And Demand Indicators IV. Stock Market Considerations
Transcript

1

2003 New Year Preview IEEE CPMT SCV Chapter Meeting

For pertinent disclosure, please see disclosures at end of report.

EMS Industry – Stocks Reflect Seasonality and … Better Times?

June 11, 2003

J. Keith Dunne

(415) 633-8543

[email protected]

1J. Keith Dunne Phone: (415) 633-8543 [email protected]

Agenda

I. Electronic Manufacturing Services Overview

II. EMS Industry Continues To Evolve

III. Industry And Demand Indicators

IV. Stock Market Considerations

2

2003 New Year Preview IEEE CPMT SCV Chapter Meeting

2J. Keith Dunne Phone: (415) 633-8543 [email protected]

I. Electronic Manufacturing Services (EMS) Overview

3J. Keith Dunne Phone: (415) 633-8543 [email protected]

Executive Summary

• Optimistic comments not yet reflected in orders from core customers, yet new wins should shine through.

• Outsourcing trends should continue; it makes financial sense.

• Counter-Cyclical Cash Flows lead to stronger balance sheets.

• Virtual EMS business models provide more downside protection.

• Valuations: Seasonal surge pushes stocks to short-term trading highs.

3

2003 New Year Preview IEEE CPMT SCV Chapter Meeting

4J. Keith Dunne Phone: (415) 633-8543 [email protected]

Vertical EMS Stocks Stocks Surge in Anticipation; Long-Term Virtual Stocks Outperform

Short-Term Risk of Profit-Taking; Long-term Potential Remains

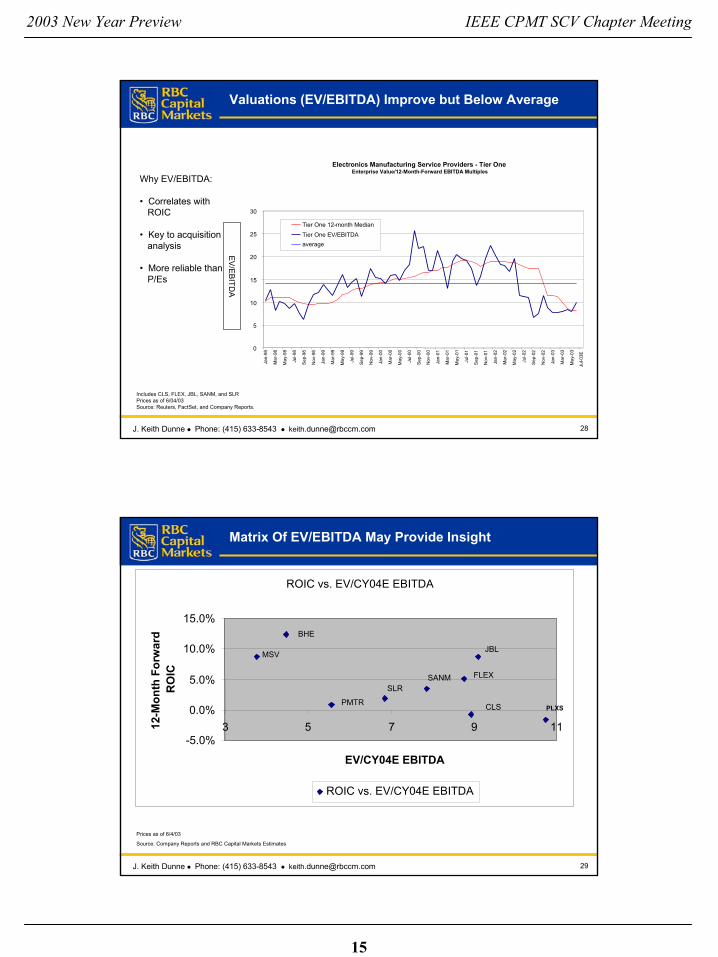
a. All indices are market-cap weighted. b. Includes PLXS, FLEX,JBL, SANM, SLR, CLS, BHE, PMTR, SMTX, MSV c. Includes FLEX, PMTR, SANM, SLR, and SMTX d. Includes BHE, CLS, JBL, MSV, and PLXS e. Not usedf. Includes COMS, ALA, CSCO, ERICY, LU, MOT, NOK , DELL, GTW, HPQ, IBM, SUNW BRCD, CIEN, CORV, EMC, EMLX, EXTR, FDRY, JNPR, ONIS,

QLGC, RBAK, SFA, SCMR, TLAB, AMCC, BRCM, JDSU, VTSS, and PMCS

Note: EMS stocks typically underperform NASDAQ in first quarter, by average of 11% in the past six years.

Source:Factset, Reuters, Company Reports and RBC Capital Markets estimates.

Market 6/4/2003 Calendar Year- CAGRCap. YTD 2002 2001 2000 1999 97-02

Electronic Manufacturing Services (EMS)Virtual EMS Providers-d $9,541 18.9% -48.1% -16.9% -8.6% 167.1% 23.1%Vertical EMS Providers-c $12,839 33.8% -68.6% -44.9% 1.1% 92.2% 3.2% EMS Providers-b $22,380 27.0% -61.7% -39.1% 3.9% 100.5% 7.9%

Original Equipment Manufacturers (OEMs) Composite OEM Index-f $692,306 27.8% -55.8% -48.9% -28.7% 129.4% -2.8%

S&P 500 12.1% -23.4% -13.0% -10.1% 19.5% 2.9%NASDAQ 22.4% -31.5% -21.1% -39.3% 85.6% 0.6%Dow Jones Industrial Average 8.4% -16.8% -7.1% -6.2% 25.2% 4.4%

5J. Keith Dunne Phone: (415) 633-8543 [email protected]

Outsourcing Is Key To Long-Term Growth

Pricing/Terms For OEM Divestitures Have Improved Significantly:• Price to sales multiples at 10%-20%, down from 30%-40%;

• Terms and conditions reduce EMS risk; and

• More flexibility to move programs and/or close plants at OEM cost.

Source: IPC, Micro-Tech Consultants and RBC Capital Markets estimates.

a. Estimated growth reflects unit growth adjusted for anticipated price degradation.

Market Size ($bil.) Long-Term % OutsourcedU.S. World Growth-a Now in 3-5 Yrs

Electronic Mfg Services $20-25 $95-105 10-20% 13-17% 20-30% Original Design Mfg Services $0-4 $30-40 10-20% 4-8% 10-15%

Total $20-$30 $125-$145 10-20% 17-23% 30-45%

4

2003 New Year Preview IEEE CPMT SCV Chapter Meeting

6J. Keith Dunne Phone: (415) 633-8543 [email protected]

II. EMS Industry Continues To Evolve

7J. Keith Dunne Phone: (415) 633-8543 [email protected]

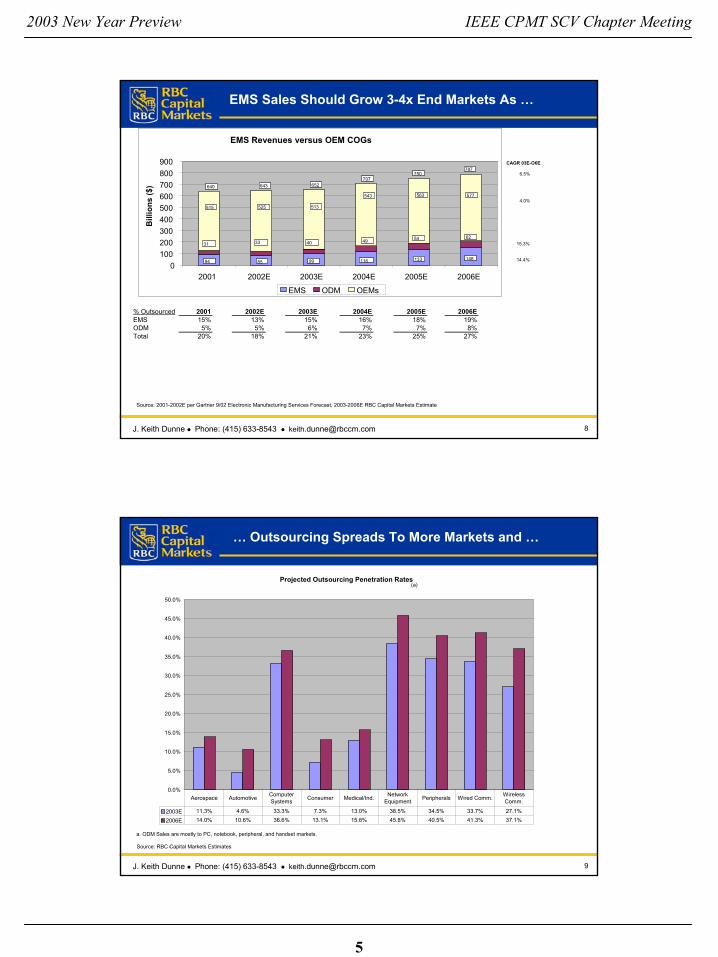
EMS EPS Lagged in Downturn, May Lead in Upturn; Valuations are Better

Key Differences In Virtual EMS versus OEM Business Models:• Lower fixed cost structure• Increased outsourcing and industry consolidations• Minimal technology obsolescence risk• Limited balance sheet risk (inventory & A/R)• Counter-cyclical cash flows

(a) Average CY04 P/E is 21.2x excluding PlexusPrices as of 6/4/03. OEM earnings estimates as of 6/4/03.Note: P/Es greater than 99x are treated as 99x. Outliers in CY04:3Source: First Call, Reuters, Company reports and RBC Capital Markets Estimates

(a)

Total # of CompaniesAvg. P/E Number of with Losses %

EPS Decline CY04E Companies in CY2003E w/ LossesEMSVirtual -29% 28.5x 5 1 20%Vertical -52% 19.2x 5 2 40%Total EMS -52% 27.4x 10 3 30%

OEMs by Sector:OEM Avg./Total -80% 41.5x 47 19 40%

Median CY01

5

2003 New Year Preview IEEE CPMT SCV Chapter Meeting

8J. Keith Dunne Phone: (415) 633-8543 [email protected]

EMS Sales Should Grow 3-4x End Markets As …

Source: 2001-2002E per Gartner 9/02 Electronic Manufacturing Services Forecast, 2003-2006E RBC Capital Markets Estimate

CAGR 03E-O6E

6.5%

4.0%

15.3%

14.4%

EMS Revenues versus OEM COGs

0100200300400500600700800900

2001 2002E 2003E 2004E 2005E 2006E

Bill

ions

($)

EMS ODM OEMs

31 4033

515 525 513

543 563 577

49 54 62

94 85 99 116 133 148

640 643 652707

750787

% OutsourcedEMSODMTotal

200115%5%

20%

2002E13%5%

18%

2003E15%6%

21%

2004E16%7%

23%

2005E18%7%

25%

2006E19%8%

27%

9J. Keith Dunne Phone: (415) 633-8543 [email protected]

… Outsourcing Spreads To More Markets and …

a. ODM Sales are mostly to PC, notebook, peripheral, and handset markets.

Source: RBC Capital Markets Estimates-

(a)Projected Outsourcing Penetration Rates

0.0%

5.0%

10.0%

15.0%

20.0%

25.0%

30.0%

35.0%

40.0%

45.0%

50.0%

2003E 11.3% 4.6% 33.3% 7.3% 13.0% 38.5% 34.5% 33.7% 27.1%

2006E 14.0% 10.6% 36.6% 13.1% 15.8% 45.8% 40.5% 41.3% 37.1%

Aerospace Automotive Computer Systems Consumer Medical/Ind. Network

Equipment Peripherals Wired Comm. Wireless Comm.

6

2003 New Year Preview IEEE CPMT SCV Chapter Meeting

10J. Keith Dunne Phone: (415) 633-8543 [email protected]

… Production Shifts To Lower Cost Locations

Source: Company Reports and RBC Capital Markets Estimates

Sales ($ in billions)

North &

South A

merica

% of Total

Industry Sales by Continent

-

2.0

4.0

6.0

8.0

10.0

12.0M

ar-0

1

Jun-

01

Sep

-01

Dec

-01

Mar

-02

Jun-

02

Sep

-02

Dec

-02

Mar

-03E

Jun-

03E

Sep

-03E

Dec

-03E

0%10%

20%30%

40%50%60%

70%80%

90%100%

Europe North & South America Asia % from N/S. America

11J. Keith Dunne Phone: (415) 633-8543 [email protected]

Differences In Two Emerging Business Models …

Vertical EMS Business Models• One-stop shop - advantageous for high volume/low-cost applications

• Ownership of supply chain

• Greater revenue and mass scale

• Product revenues offer greater operating leverage

Virtual EMS Business Models• Greater focus on core competencies/less obsolescence risk

• Impartial sourcing decisions

• More sustainable margins, greater cash flows, less volatile ROICs

• Lower capital requirements

• Lower risk profile

7

2003 New Year Preview IEEE CPMT SCV Chapter Meeting

12J. Keith Dunne Phone: (415) 633-8543 [email protected]

… Reflected In Financial Performance

a. Based on tax-affected operating income adjusted to exclude non-recurring charges.

Source: Company Reports and RBC Capital Markets Estimates

Virtual: Lower Fixed Costs/Less Acquisition Integration

Virtual Vertical TotalSales (CY02) $15,482 $37,269 $52,751CY02 EBIAT Margin 3.1% 0.6% 1.4%CY03E EBIAT Margin 2.0% 1.6% 1.7%

Free Cash Flow (1Q99-1Q03E) $1,721 $486 $2,207Net Debt/(Cash) Capital -28% 21% -6%

Goodwill Chgs. $384 $5,812 $6,196Rest/Other Chgs. $1,225 $4,126 $5,351Charges as % of Sales (CY00-03E) 2% 6% 5%

Median 2003 ROIC-a 8.8% 2.9% 3.1%

13J. Keith Dunne Phone: (415) 633-8543 [email protected]

Both EMS Models Serve Similar Customers …

FLEX PMTR SANM SLR BHE-a CLS JBL MSV PLXSCalendar Period Q103 Q103 Q103 Q103 Q103 Q103 Q103 Q103 Q103Customer/CompanyTop Customer 12% 19% 20-25%E 12% 45-50%E 13-15%E 15-20%E 31% 15%Top 5 40-45E% 47% 45-50E% Near 45E% 66% 53% 50-55E% 64% 40-45E%Top 10 62% 64% 67% 57% 80-85E% 78% 71% 85% 54%Agilent <5%EAlcatel Near 5E% 5-10%E <5%E 5-10%EApple Near 5%ECasio Near 5%Ciena 5-10E%Cisco 10% 5-10%E 15-20%EDell Near 5E% 5-10%E Near 5E%Echostar <5%EEMC 10-15%E <5%EEmerson Near 5E%Emulex 5-10%EEricsson Near 5% <5%E 5-10%EEricsson-Sony 12%Extreme Networks Near 5%GE 5-10%EHewlett Packard 10% Near 10E% 12% 5-10%E Near 10E% 14%Honeywell <5%E Near 5E%IBM 19% 20-25%E 5-10%E 13-15%E 31%Intel Near 5E%Juniper 5-10%EKodak <5%ELexmark Near 5E%Lucent Near 5%E <5%E 10-15%E 5-10%EMedtronic 5-10%EMicrosoft Near 5E%Motorola Near 5E% 8-10E% 5-10%ENEC < 5%E 5-10%ENokia <5%E <5%E Near 5E%Nortel Near 5E% 11%Oce 5-10%EPatient Line Near 5E%Philips 15-20%E <5E%Rockwell 5-10%EShure <5%ESiemens 5-10%E 15%Sun Microsystems < 5%E 45-50%E 10-15%EUnisys 5-10%EUS Army <5E%Valeo 5-10%EXerox 5-10%EOther Top 10 Customers Fluke Hitachi Abbot Labs Avaya JCI Radisys Intermec

Logitech McData Samsung J & J EthiconProxim NMSQlogic

Seagate

Vertical Virtual

8

2003 New Year Preview IEEE CPMT SCV Chapter Meeting

14J. Keith Dunne Phone: (415) 633-8543 [email protected]

… and End Markets

Market Segment FLEX PMTR SANM SLR BHE CLS JBL MSV PLXSSimple

Avg.Weighted

Avg.

Calendar Period Q103 Q103 Q103 Q103 Q103 Q103 Q103 Q103 Q103

Communications 25% 35% 29% 52% 14% 47% 39% 17% 33% 32% 36%

PCs/Notebooks 26% 36% 32% 16% 8% 36% 11% 18% 19%

Peripherals 20% 8% 26% 6% 6%

Servers/Storage 5% 23% 63% 36% 16% 16% 13%

Industrial/Instruments 17% 12% 3% 14% 6% 17% 16% 9% 5%

Medical 7% 9% 2% 33% 6% 1%

Consumer 42% 5% 3% 21% 8% 14%

Other 7% 0% 0% 6% 0% 9% 10% 2% 7% 5% 5%

CLS: Communications includes Telecommunications (23%) and Enterprise (24%); Servers/Storage includes Servers (22%) and Storage (14%)

FLEX: Consumer includes hand-held devices (29%), PDAs and Other consumer (13%). PCs includes office equipment.

MSV: PCs is mostly point-of sale terminals for IBM. Medical is in Ind/Instr.

SLR: Communications(networking: (24%), non-mobile (19%), mobile: (10%)). Peripheral includes workstations, mainframes, and transportation

JBL: Communications include 25% networking and 14% communications equipment

Vertical VirtualEMS Providers

15J. Keith Dunne Phone: (415) 633-8543 [email protected]

EMS vs. ODM (Original Design Manufacturers)

EMS• Little Product/IP Risk

• Build to Order

• Global

• Flexible Volumes of More Complex Assemblies

• Limited Inventory Risk

• Greater Purchasing Power

• Broad Product Markets

• Low Concentration (Top 10 60-85%)

Design Engineering

Customers/Markets

ODM• Own IP

• Build to Spec

• Asian

• High Volume Commodities

• Inventory Risk (White Box Buffer)

• Faster Inventory Turns

• Mostly PC/Notebook/ Peripherals

• Top Customer can Exceed 50%

Geography

Assembly

Note: Leading ODMs ranked by 2001 sales: Hon Hai, Quanta Computer, Asustek, Compal Electronics, First International Computer, Wistron, Inventec, BenQ, Arima Computer

9

2003 New Year Preview IEEE CPMT SCV Chapter Meeting

16J. Keith Dunne Phone: (415) 633-8543 [email protected]

Current State Of Convergence

Desktop PC Peripherals

Notebook

PrimaryCompetitive Arena

Low-End Servers

Cell Phone

High-End Server Work-stations

Core Telecom Equip-ment

EMS

ODM

Product ComplexitySource: RBC Capital Markets

PDA

Routers

17J. Keith Dunne Phone: (415) 633-8543 [email protected]

Reward/Challenges Of Combining EMS And ODM

EMS• Expand Design and Engineering

Talent to Lower Life Cycle Cost and Accelerate Time to Market

• Opportunity to Retain Mature, High-Volume Business

• Expand Low-Cost Assembly and Material Procurement Relations

• Pricing Expanded R&D Services

• Developing Library of Standard Designs that Don’t Violate OEMs IP

• Limited Precedent Leaves Untested Waters Regarding Structure

Rewards

Challenges

ODM• Access High-End Process

Technologies

• Penetrate non-PC/Peripheral OEMs

• Expand Global Footprint to Increase Market Opportunity

• Increased Complexity of High-Tech High Mix Programs

• Greater Emphasis on Quality vs. Cost

• “Open-Book,” Systems-Linked Integration with Customers is Culturally Different/Expensive

Source: RBC Capital Markets

10

2003 New Year Preview IEEE CPMT SCV Chapter Meeting

18J. Keith Dunne Phone: (415) 633-8543 [email protected]

III. Industry And Demand Indicators

19J. Keith Dunne Phone: (415) 633-8543 [email protected]

Initial Signs That Market Bottom Is Near

• EMS inventory days are near historic trough

• OEM vs. EMS sales indicate end of inventory correction cycle

• Improving PWB order trends stalled in April, May is a little better

• Cost structures are preparing for tepid growth

• Balance sheets have improved

• Reduce costs/shift to lower cost production

• Increase sales and marketing efforts

• Selectively pursue OEM asset divestitures

Our View

Potential Strategies

11

2003 New Year Preview IEEE CPMT SCV Chapter Meeting

20J. Keith Dunne Phone: (415) 633-8543 [email protected]

Trough Inventory Days Supported By …

Note: Data reflects industry actual from 1Q90 – 1Q03

Source: Company Reports and RBC Capital Markets estimates

vs.3/01 Peak, Inventories Fell 57% For EMS And 52% For OEMs

Inventory

Inventory Days

Sales

Ele ctr on ic M anu factu r ing Se r vice Pro vid e r s

0

5000

10000

15000

20000

25000

Dec

-95

Jun-

96

Dec

-96

Jun-

97

Dec

-97

Jun-

98

Dec

-98

Jun-

99

Dec

-99

Jun-

00

Dec

-00

Jun-

01

Dec

-01

Jun-

02

Dec

-02

June

-03E

Dec

-03E

Mill

ions

0

10

20

30

40

50

60

70

80

Inve

ntor

y D

ays

(Wei

ghte

d A

vg)

Inventory Days

Sales

Inventory

21J. Keith Dunne Phone: (415) 633-8543 [email protected]

… Sequential Sales Analysis

EMS production could lead OEMs in upturn, though estimates are more conservative

Note: OEM Data as of 6/4/03

Source: IPC, Reuters, FactSet, and Company Reports

Sep-00A Dec-00A Mar-01A Jun-01A Sep-01A Dec-01A Mar-02AActual ResultsEMS Core Sales Growth 15.2% 8.1% -16.3% -16.8% -14.8% -8.1% -14.0%Composite OEM Sales Growth 2.8% 8.3% -16.8% -10.2% -6.3% 2.3% -12.2%Variance ( EMS vs OEMs) 12.4% -0.2% 0.5% -6.6% -8.5% -10.5% -1.8%Inventory Adj. Index (vs 12/98) 1.55 1.55 1.55 1.45 1.33 1.19 1.17

Jun-02A Sep-02A Dec-02A Mar-03A Jun-03E Sep-03E Dec-03EForecasted ResultsEMS Core Sales Growth -1.8% -2.6% -0.3% -13.5% -0.1% 4.1% 6.4%Composite OEM Sales Growth 2.8% -3.5% 12.2% -10.1% 1.9% 4.5% 8.6%Variance ( EMS vs OEMs) -4.6% 1.0% -12.5% -3.4% -2.0% -0.4% -2.2%Inventory Adj. Index 1.11 1.13 0.98 0.95 0.93 0.93 0.91

12

2003 New Year Preview IEEE CPMT SCV Chapter Meeting

22J. Keith Dunne Phone: (415) 633-8543 [email protected]

2003E Sales Reflect 2H03 Sequential Gains Assuming …

Source: Company Reports and RBC Capital Markets estimates

Sales in 000s

C2002A C2003E C2004E C2002A C2003E C2004E 2001A C2002A C2003E C2004E C2001A C2002A C2003E C2004EBHE $1,630 $1,800 $2,025 28% 10% 13% 0% 8% 8% 0% -25% 20% 3% 13%CLS $8,272 $6,660 $7,600 -17% -19% 14% 14% 23% 1% 0% -11% -40% -21% 14%FLEX $13,615 $13,460 $15,650 5% -1% 16% 30% 26% 4% 0% -14% -20% -5% 16%JBL $3,837 $5,163 $5,482 -3% 35% 6% 5% 17% 41% 0% -9% -20% -6% 6%MSV $854 $785 $930 -44% -8% 18% 16% 1% 2% 0% -29% -45% -10% 18%PMTR $647 $674 $748 -7% 4% 11% 11% 5% 0% 0% 12% -12% 4% 11%PLXS $889 $794 $910 -10% -11% 15% 18% 14% 0% 0% -5% -24% -11% 15%SANM $10,168 $10,638 $11,825 104% 5% 11% 43% 152% 18% 2% -41% -48% -13% 9%SMTX $569 $425 $485 -7% -25% 14% 9% 0% 0% 0% -34% -7% -25% 14%SLR $12,208 $11,333 $11,742 -20% -7% 4% 28% 16% 1% 0% -38% -37% -8% 4%

Avg Vertical (w/SCI) $37,208 $36,530 $40,449Avg Virtual $15,481 $15,202 $16,947

Wghtd Avg./Total $52,690 $51,731 $57,396 -9% -2% 11% 20% 29% 8% 0% -26% -38% -10% 10%

Annual Percentage Change in SalesTotal Sales Total Sales Acquisitions (Est.) Core Sales (est.)

23J. Keith Dunne Phone: (415) 633-8543 [email protected]

… PWB Orders Recover from April

Source: IPC, US Department of Commerce, and RBC Capital Markets Estimates

PWB 3/12 Orders (Thru 4/03) vs Electronic Equipment 3/12 Orders (Thru 4/03)

0.4

0.6

0.8

1

1.2

1.4

1.6

Jan-

96

Apr-

96

Jul-9

6

Oct

-96

Jan-

97

Apr-

97

Jul-9

7

Oct

-97

Jan-

98

Apr-

98

Jul-9

8

Oct

-98

Jan-

99

Apr-

99

Jul-9

9

Oct

-99

Jan-

00

Apr-

00

Jul-0

0

Oct

-00

Jan-

01

Apr-

01

Jul-0

1

Oct

-01

Jan-

02

Apr-

02

Jul-0

2

Oct

-02

Jan-

03

Apr-

03

3/12 Average PWB Booking Grow th Rate

Electronic Equip 3/12 Order Grow th Rate

13

2003 New Year Preview IEEE CPMT SCV Chapter Meeting

24J. Keith Dunne Phone: (415) 633-8543 [email protected]

Orders Typically Improve During 2nd Quarter

Note: Orders Booked data is based on average sequential change in orders from1995-2002

Source: IPC and RBC Capital Markets Estimates

PWB Seasonality AnalysisAverage Monthly Data Since Jan. 1994

-10%

-8%

-6%

-4%

-2%

0%

2%

4%

6%

8%

10%

Jan Feb Mar Apr May Jun Jul Aug Sep Oct Nov Dec

Seq

uent

ial P

erce

nt C

hang

e

0.90

0.92

0.94

0.96

0.98

1.00

1.02

1.04

1.06

PW

B B

ook-

to-B

ill R

atio

Orders Booked

94-02 Avg

03 Bk-to-Bl

25J. Keith Dunne Phone: (415) 633-8543 [email protected]

IV. Stock Market Considerations

14

2003 New Year Preview IEEE CPMT SCV Chapter Meeting

26J. Keith Dunne Phone: (415) 633-8543 [email protected]

A Stronger Book-to-Bill Would Be Positive

Prices as of 6/04/03. PWB Data through April 2003. Correlation Coefficient 53% vs. 80% in CY98-00.

Sources: IPC, Reuters, Factset and Company Reports

PWB Book-to-B

ill

EM

S S

tock Index

3 Mo. Avg. PWB Book-To-Bill Ratio ( Thru 4/03; Leads by 3 months)vs.

% Change EMS Stocks (Indexed to 12/95 )

0.50

0.55

0.60

0.65

0.70

0.75

0.80

0.85

0.90

0.95

1.00

1.05

1.10

1.15

1.20

1.25

1.30

Jan-

96

Apr

-96

Jul-9

6

Oct

-96

Jan-

97

Apr

-97

Jul-9

7

Oct

-97

Jan-

98

Apr

-98

Jul-9

8

Oct

-98

Jan-

99

Apr

-99

Jul-9

9

Oct

-99

Jan-

00

Apr

-00

Jul-0

0

Oct

-00

Jan-

01

Apr

-01

Jul-0

1

Oct

-01

Jan-

02

Apr

-02

Jul-0

2

Oct

-02

Jan-

03

Apr

-03

Jul-0

3E

-100%

0%

100%

200%

300%

400%

500%

600%

700%

800%

900%

1000%

1100%

1200%

1300%

1400%

PWB Book to Bill

EMS Stock Prices

27J. Keith Dunne Phone: (415) 633-8543 [email protected]

Seasonally Strong 2nd Quarter Boosts EMS Stocks

Note: Market Cap Weighted Returns

Sources: Company Reports and FactSet

Stock Price Returns - EMS Providers vs NASDAQ Composite

-40%

-20%

0%

20%

40%

60%

80%

Q1 Q2 Q3 Q4 Year

1992

1993

1994

1995

1996

1997

1998

1999

2000

2001

2002

2003

15

2003 New Year Preview IEEE CPMT SCV Chapter Meeting

28J. Keith Dunne Phone: (415) 633-8543 [email protected]

Valuations (EV/EBITDA) Improve but Below Average

Why EV/EBITDA:

• Correlates with ROIC

• Key to acquisition analysis

• More reliable than P/Es

Includes CLS, FLEX, JBL, SANM, and SLRPrices as of 6/04/03Source: Reuters, FactSet, and Company Reports.

EV

/EB

ITDA

Electronics Manufacturing Service Providers - Tier OneEnterprise Value/12-Month-Forward EBITDA Multiples

0

5

10

15

20

25

30

Jan-

98

Mar

-98

May

-98

Jul-9

8

Sep

-98

Nov

-98

Jan-

99

Mar

-99

May

-99

Jul-9

9

Sep

-99

Nov

-99

Jan-

00

Mar

-00

May

-00

Jul-0

0

Sep

-00

Nov

-00

Jan-

01

Mar

-01

May

-01

Jul-0

1

Sep

-01

Nov

-01

Jan-

02

Mar

-02

May

-02

Jul-0

2

Sep

-02

Nov

-02

Jan-

03

Mar

-03

May

-03

Jul-0

3E

Tier One 12-month Median

Tier One EV/EBITDAaverage

29J. Keith Dunne Phone: (415) 633-8543 [email protected]

Matrix Of EV/EBITDA May Provide Insight

Prices as of 6/4/03

Source: Company Reports and RBC Capital Markets Estimates

JBL

PLXSCLS

PLXS

ROIC vs. EV/CY04E EBITDA

-5.0%

0.0%

5.0%

10.0%

15.0%

3 5 7 9 11

EV/CY04E EBITDA

12-M

onth

For

war

d R

OIC

ROIC vs. EV/CY04E EBITDA

PLXS

BHE

FLEX

MSV

PMTR

SLRSANM

CLS

JBL

16

2003 New Year Preview IEEE CPMT SCV Chapter Meeting

30J. Keith Dunne Phone: (415) 633-8543 [email protected]

P/E Valuations Surge, But Have Been Less Helpful

Source: FactSet, First Call, Reuters, Company Reports, and RBC Capital Markets Estimates

* Includes Celestica, Flextronics, Jabil, and Sanmina-SCI. Based on Consensus Forward First Call GAAP Estimates. Prices as of 6/04/03.

Note: Forward P/E ratios greater than 50 treated as 50

Tier 1 EMS Providers Forward Looking P/E Ratios

5

10

15

20

25

30

35

40

45Ja

n-98

Mar

-98

May

-98

Jul-9

8

Sep-

98

Nov

-98

Jan-

99

Mar

-99

May

-99

Jul-9

9

Sep-

99

Nov

-99

Jan-

00

Mar

-00

May

-00

Jul-0

0

Sep-

00

Nov

-00

Jan-

01

Mar

-01

May

-01

Jul-0

1

Sep-

01

Nov

-01

Jan-

02

Mar

-02

May

-02

Jul-0

2

Sep-

02

Nov

-02

Jan-

03

Mar

-03

May

-03

Abs

olut

e P/

E

Tier 1 Absolute P/E

Tier 1 EMS 12M Avg.

31J. Keith Dunne Phone: (415) 633-8543 [email protected]

Tangible Book Provides Some Protection, Though …

Note: TBV has been changed to reflect $9-$10M in restructuring and operating losses estimated for 2Q and 3Q:03E.

Source: Reuters, Company Reports, and RBC Capital Markets estimates

Virtual EMS: Net Cash, Less Restructuring, Fewer Acquisitions

6/4/03Ticker Company Price TBV Gross TangibleNet (Debt)

Cash/ShareEMS Providers:BHE Benchmark Electronics $29.86 16.57$ 1.4x 1.8x $7.84CLS Celestica $16.00 9.56$ 1.1x 1.7x $4.50FLEX Flextronics Intl $11.56 4.52$ 1.3x 2.6x ($1.32)JBL Jabil Circuit $22.20 6.13$ 2.8x 3.6x $0.17MSV Manufacturers Srvs Ltd. $4.91 2.87$ 1.6x 1.7x $0.43PMTR Pemstar, Inc. $3.50 3.37$ 0.8x 1.0x ($1.59)PLXS Plexus $13.45 8.33$ 1.5x 1.6x $2.05SANM Sanmina-SCI $6.50 2.38$ 1.0x 2.7x ($2.07)SLR Solectron $4.05 2.95$ 0.7x 1.4x ($1.65)

PRODUCT BASED COMPANIES:

PWB Manufacturers:MERX Merix $7.06 8.55$ 0.8x 0.8x $1.39TTMI TTM Technologies, Inc. $4.50 2.27$ 1.1x 2.0x $0.35

Total EMPS Industry 1.3x 1.9xEMS Companies 1.4x 2.0xVertical EMS 1.0x 1.9xVirtual EMS 1.7x 2.1x

PWB Companies 0.9x 1.4x

Price to Book

0J.

Kei

th D

unne

Phon

e: (4

15) 6

33-8

543

keith

.dun

ne@

rbcc

m.c

om

Com

para

ble

Valu

atio

n M

etric

sCa

lEV

/EV

/Pr

ice /

MRQ

Net D

ebt

Price

YTD

2002

Mark

etLT

M20

03E

CY0

3EC

Y04E

Book

/ Boo

kFi

scal

Tick

erCo

mpa

nyRa

ting

Risk

06/04

/03%

Chg

% C

hgCa

pSa

les20

02A

2003

E20

04E

2003

E20

04E

ROIC

EBIT

DAEB

ITDA

Equi

tyNe

t Cap

.M/

EEM

S Pr

ovid

ers:

PLXS

Plex

usSP

AA$1

3.45

53%

-67%

$568

$848

$0.17

($0.2

8)$0

.15NM

58.1

-3.2

%40

.1

10

.71.4

8-2

9.2%

Sep

JBL

Jabil

Circ

uitO

AA$2

2.20

24%

-21%

$4,40

3$4

,053

$0.46

$0.71

$1.00

27.5

20.7

10.5

%11

.4

9.4

2.84

-2.2%

Aug

CLS

Celes

tica

OAA

$16.0

013

%-6

5%$3

,632

$7,70

7$0

.88$0

.05$0

.4532

0.035

.60.

6%15

.1

9.5

0.90

-33.7

%De

cFL

EXFle

xtron

ics In

tl SP

AA$1

1.56

41%

-66%

$6,00

3$1

3,379

$0.61

$0.31

$0.35

38.7

23.1

5.0%

10.8

8.91.3

213

.1%Ma

rSA

NMSa

nmina

-SCI

OAA

$6.50

45%

-77%

$3,31

3$1

0,200

$0.08

$0.06

$0.23

72.2

24.1

2.9%

11.1

8.1

0.9

723

.7%Se

pSL

RSo

lectro

nSP

AA$4

.0514

%-6

9%$3

,352

$12,1

04($

0.11)

($0.0

5)$0

.10NM

NM1.

3%11

.8

7.

5

0.72

22.8%

Aug

PMTR

Pems

tar, In

c.UP

Spec

$3.50

55%

-81%

$131

$668

($0.4

1)($

0.56)

$0.01

NMNM

-0.1

%7.

8

5.8

0.8

224

.2%Ma

rBH

EBe

nchm

ark E

lectro

nics

SPAA

$29.8

64%

51%

$732

$1,74

9$1

.51$1

.75$2

.0517

.114

.612

.6%

5.8

5.

1

1.40

-58.1

%De

cMS

VMa

nufac

turer

s Srvs

Ltd.

SPAA

$4.91

-11%

-11%

$164

$800

$0.27

$0.12

$0.35

40.9

14.0

8.8%

5.8

4.

0

1.57

-15.9

%De

c

PROD

UCT

BASE

D CO

MPAN

IES:

PWB

Manu

fact

urer

s:ME

RXMe

rixUP

AA$7

.06-1

6%-5

1%$1

03$9

4($

0.73)

($0.8

7)($

0.72)

NMNM

-12.

5%N

M60

4.6

0.83

-19.5

%Ma

yTT

MITT

M Te

chno

logies

, Inc.

OAA

$4.50

36%

-67%

$179

$105

($0.0

2)$0

.07$0

.2564

.318

.01.

9%13

.7

7.

0

1.07

-9.0%

Dec

Tota

l Elec

troni

c Man

ufac

turin

g Pr

oduc

ts an

d Se

rvice

s Ind

ustry

:23

%-4

6%$2

,053

$4,70

183

.026

.0

2.5%

13.4

61.9

1.26

-7.6%

E

MS C

ompa

nies

:26

%-4

8%$2

,478

$5,72

386

.127

.2

4.3%

13.3

7.71.3

4

-6

.2%

A

vera

ges La

rge C

ap E

MS:M

kt. C

ap.>

$2,00

027

%-6

0%$4

,141

$9,48

991

.720

.74.1

%12

.08.7

1.35

4.7%

Small

Cap

EMS

: Mkt.

Cap

. >$1

0015

%-9

%$4

88$1

,133

19.3

28.9

6.1%

17.3

6.61.4

8-3

4.4%

Vertic

al EM

S (F

LEX,

PMT

R, S

ANM,

SLR

, SMT

X)39

%-6

4%$3

,200

$9,08

827

.711

.82.3

%10

.47.6

0.96

20.9%

Virtu

al EM

S (B

HE, C

LS, J

BL, M

SV, P

LXS)

17%

-23%

$1,90

0$3

,032

81.1

28.6

5.9%

15.7

7.71.6

4-2

7.8%

Pro

duct

Bas

ed C

ompa

nies

P

WB

Comp

anies

:10

%-5

9%$1

41$9

964

.318

.0-5

.3%13

.730

5.80.9

5-1

4.2%

GS

PCS&

P 50

098

6.212

%-2

3%C

OM

P.Q

NAS

DAQ

16

34.7

22%

-32%

SOX

Phild

elphia

Sem

i Inde

x39

4.036

%-4

5%

a. W

ith th

e ex

cept

ion

of S

LR w

hich

is G

AAP

EPS;

all

othe

r com

pani

es E

PS a

re c

ash

EPS

whi

ch e

xclu

des

amor

tizat

ion

expe

nse

and

non-

recu

rrin

g ch

arge

s.

Ratin

gs/R

isk: T

P=To

p retu

rns w

ithin

secto

r, O=

Retu

rns o

utper

form

secto

r, SP

=Retu

rns i

n line

with

secto

r, U:

Retu

rns b

elow

secto

r. N

R=No

t rate

d. Av

g.=Av

erag

e sec

tor vo

latilit

y, ris

k, re

venu

e and

/or E

PS pr

edict

abilit

y, no

cash

flow

and/o

r fina

ncing

conc

er

A

A: A

bove

aver

age r

isk pa

rame

ters,

Spec

: Risk

is co

nsist

ent w

ith ve

nture

capit

al, lo

w flo

at, ba

lance

shee

t con

cern

s and

/or ris

k of d

elisti

ng.

Sour

ce: C

ompa

ny re

ports

, Firs

t Call

and R

BC C

apita

l Mar

kets

estim

ates.St

ock P

rices

FY C

ash

EPS-

a A

djus

ted

CY C

ash

P/E

17

2003 New Year Preview IEEE CPMT SCV Chapter Meeting

32J. Keith Dunne Phone: (415) 633-8543 [email protected]

… Volatility Remains

Monthly Valuations Fluctuate >15% more than 50% of the Time

Prices Through 6/04/03

Sources: Reuters

EMS Stock Price Monthly Returns

-50%-40%-30%-20%-10%

0%10%20%30%40%50%

Jan-

97M

ar-9

7M

ay-9

7Ju

l-97

Sep

-97

Nov

-97

Jan-

98M

ar-9

8M

ay-9

8Ju

l-98

Sep

-98

Nov

-98

Jan-

99M

ar-9

9M

ay-9

9Ju

l-99

Sep

-99

Nov

-99

Jan-

00M

ar-0

0M

ay-0

0Ju

l-00

Sep

-00

Nov

-00

Jan-

01M

ar-0

1M

ay-0

1Ju

l-01

Sep

-01

Nov

-01

Jan-

02M

ar-0

2M

ay-0

2Ju

l-02

Sep

-02

Nov

-02

Jan-

03M

ar-0

3M

ay-0

3

33J. Keith Dunne Phone: (415) 633-8543 [email protected]

Disclosure

Analyst CertificationAll of the views expressed in this report accurately reflect the personal views of the responsible analyst(s) about any and all of the subject securities or issuers. No part of the compensation of the responsible analyst(s) named herein is, or will be, directly or indirectly, related to the specific recommendations or views expressed by the responsible analyst(s) in this report.

RBC Dominion Securities Inc. makes a market in the securities of Celestica Inc. and may act as principal with regard to sales or purchases of this security. The securities of Celestica Inc. discussed in this report are subordinate voting shares. The author(s) of this report has received (or will receive) compensation based in part upon the investment banking revenues of RBC Capital Markets (including RBC Dain Rauscher, RBC Dominion Securities Inc., and RBC Dominion Securities Corp. or their affiliates). RBC Dain Rauscher Inc. makes a market in the securities of Flextronics International Ltd. and may act as principal with regard to sales or purchases of this security. RBC Dain Rauscher Inc. makes a market in the securities of Merix Corporation and may act as principal with regard to sales or purchases of this security. RBC Dain Rauscher Inc. makes a market in the securities of Plexus Corp. and may act as principal with regard to sales or purchases of this security. RBC Dain Rauscher Inc. makes a market in the securities of PEMSTAR Inc. and may act as principal with regard to sales or purchases of this security. A member company of RBC Capital Markets or one of its affiliates managed or co-managed a public offering of securities for Sanmina-SCI Corporation in the past 12 months. RBC Dain Rauscher Inc. makes a market in the securities of Sanmina-SCI Corporation and may act as principal with regard to sales or purchases of this security. RBC Dain Rauscher Inc. makes a market in the securities of TTM Technologies, Inc. and may act as principal with regard to sales or purchases of this security. The author is employed by RBC Dain Rauscher Inc., a securities broker-dealer with principal offices located in Minnesota, USA.

Data points are not adjusted for stock splits/dividends.

NASD/NYSE rules require member firms to assign all rated stocks to one of three rating categories--Buy, Hold/Neutral, or Sell--regardless of a firm's own rating categories. Although RBCCM does not consider all stocks that its analysts rate as Sector Perform to be equivalent to a Hold/Neutral rating, for purposes of this ratings distribution disclosure, RBCCM automatically treats stocks rated Sector Perform as Hold/Neutral.

In the event that this is a compendium report (covers more than six subject companies) RBC Capital Markets (RBC CM) may choose to provide specific disclosures for the subject companies by reference. To access these disclosures, clients should refer to http://rbc2.bluematrix.com/bluematrix/Disclosure or send a request to RBC CM Research Publishing, 60 South 6th Street, Mail Stop P16, Minneapolis, Minnesota 55402.

18

2003 New Year Preview IEEE CPMT SCV Chapter Meeting

34J. Keith Dunne Phone: (415) 633-8543 [email protected]

Explanation Of RBCCM Rating System

Definitions Of Rating Categories

An analyst's sector is the universe of companies for which the analyst provides research coverage. Accordingly, the rating assigned to a particular stock represents the analyst's view of how that stock will perform over the next 12 months relative to the analyst's sector, but does not attempt to provide the analyst's view of how the stock will perform relative to: (i) all companies that may actually exist in the company's sector, or (ii) any broader market index.

Ratings:Top Pick (TP): Represents analyst's best ideas in Outperform category; expected to significantly outperform sector over 12 months; provides best risk-reward ratio; approximately 10% of analyst's recommendations.

Outperform (O): Expected to materially outperform sector average over 12 months.

Sector Perform (SP): Returns expected to be in line with sector average over 12 months.

Underperform (U): Returns expected to be materially below sector average over 12 months.

Definitions Of Risk Qualifiers

Average Risk (Avg): Volatility and risk expected to be comparable to sector; average revenue and earnings predictability; no significant cash flow/financing concerns over coming 12-24 months; and/or fairly liquid.

Above Average Risk (AA): Volatility and risk expected to be above sector; below average revenue and earnings predictability; may not be suitable for a significant class of individual equity investors; may have negative cash flow; and/or low market cap or float.

Speculative (Spec): Risk consistent with venture capital; low public float; potential balance sheet concerns; and/or risk of being delisted.

Our Research Ratings Legend can be viewed at http://www.rbccmresearch.com/researchratings.

References to a Recommended List in the recommendation history chart may include one or more recommended lists or model portfolios maintained by a member company of RBC Capital Markets or one of its affiliates. RBC Capital Markets recommended lists include the Strategy Focus List and the Fundamental Equity Weightings (FEW) portfolios. RBC Dain Rauscher Inc. recommended lists include the Western Region Focus List (1), the Model Utility Portfolio (2), and the Prime Opportunity List (3) (formerly called the Private Client Selects), Private Client Prime Portfolio (4), a former list called Private Client Portfolio (5), and the Prime Income List (6). RL On: Date a security was placed on a recommended list; RL Off: Date a security was removed from a recommended list.

35J. Keith Dunne Phone: (415) 633-8543 [email protected]

The information contained in this report has been compiled by RBC Capital Markets ("RBC CM") from sources believed to be reliable, but no representation or warranty, express or implied, is made by Royal Bank of Canada, RBC CM, its affiliates or any other person as to its accuracy, completeness or correctness. RBC Capital Markets is a business name used by subsidiaries of the Royal Bank of Canada including RBC Dominion Securities Inc., RBC Dominion Securities Corp., RBC Dain Rauscher Inc., Royal Bank of Canada Europe Limited and Royal Bank of Canada - Sydney Branch. All opinions and estimates contained in this report constitute RBC CM's judgment as of the date of this report, are subject to change without notice and are provided in good faith but without legal responsibility. This report is not an offer to sell or a solicitation of an offer to buy any securities. RBC CM and its affiliates may have an investment banking or other relationship with some or all of the issuers mentioned herein and may trade in any of the securities mentioned herein either for their own account or the accounts of their customers. Accordingly, the entities constituting RBC CM or their affiliates may at any time have a long or short position in any such security or option thereon. Every province in Canada, state in the U.S., and most countries throughout the world have their own laws regulating the types of securities and other investment products which may be offered to their residents, as well as the process for doing so. As a result, the securities discussed in this report may not be eligible for sale in some jurisdictions. This report is not, and under no circumstances should be construed as, a solicitation to act as securities broker or dealer in any jurisdiction by any person or company that is not legally permitted to carry on the business of a securities broker ordealer in that jurisdiction. This material is prepared for general circulation to clients and does not have regard to the particular circumstances or needs of any specific person who may read it. To the full extent permitted by law neither RBC CM or any of its affiliates, nor any other person, accepts any liability whatsoever for any direct or consequential loss arising from any use ofthis report or the information contained herein. No matter contained in this document may be reproduced or copied by any means without the prior consent of RBC CM. The entities comprising RBC Capital Markets are wholly owned subsidiaries of the Royal Bank of Canada and are members of the RBC Financial Group. Additional information is available on request.

To U.S. Residents: This publication has been approved by RBC Dominion Securities Corp. ("RBCDS Corp.") and RBC Dain Rauscher Inc. ("RBC DRI"), both of which are U.S. registered broker-dealers, which accept responsibility for this report and its dissemination in the United States. Any U.S. recipient of this report that is not a registered broker-dealer or a bank acting in a broker or dealer capacity and that wishes further information regarding, or to effect any transaction in, any of the securities discussed in this report, should contact and place orders with RBCDS Corp. or RBC DRI.

To Canadian Residents: This publication has been approved by RBC Dominion Securities Inc. Any Canadian recipient of this report that is not a Designated Institution in Ontario, an Accredited Investor in British Columbia or Alberta or a Sophisticated Purchaser in Quebec (or similar permitted purchaser in any other province) and that wishes further information regarding, or to effect any transaction in, any of the securities discussed in this report should contact and place orders with RBC Dominion Securities Inc., which, without in any way limiting the foregoing, accepts responsibility for this report and its dissemination in Canada.

To U.K. Residents: This publication has been approved by Royal Bank of Canada Europe Limited ("RBCEL") which is regulated by Financial Services Authority ("FSA"), in connection with its distribution in the United Kingdom. This material is not for distribution in the United Kingdom to private customers, as defined under the rules of the FSA. RBCEL accepts responsibility for this report and its dissemination in the United Kingdom.

To Persons Receiving This Advice in Australia: This material has been distributed in Australia by Royal Bank of Canada - Sydney Branch (ABN 86 076 940 880). This material has been prepared for general circulation and does not take into account the objectives, financial situation or needs of any recipient. Accordingly, any recipient should, before acting on this material, consider the appropriateness of this material having regard to their objectives, financial situation and needs. If this material relates to the acquisition or possible acquisition of a particular financial product, a recipient in Australia should obtain any relevant disclosure document prepared in respect of that product and consider that document before making any decision about whether to acquire the product.

Copyright RBC Dain Rauscher Inc. 2003. Copyright RBC Dominion Securities Inc. 2003.

Copyright RBC Dominion Securities Corp. 2003. Copyright RBC (Europe) Limited 2003.

All rights reserved.


Recommended