Page 1
Endangered Southern
Steelhead, Drought and GIS,
Santa Ynez, CA
Timothy H. Robinson
Cachuma Operation and Maintenance Board
2017ESRI User Conference
Applying the Science of Where
SessionDrought Monitoring
Page 2
February 2013
Drought 2012-2016
Page 3
The Cachuma ProjectCachuma Operation and Maintenance Board
(Joint Powers Agency)Objectives:• Water delivery (reservoirs, tunnels, conduit, etc.)• Resource management (water and biological species/habitat)
Santa Ynez ID#1
DISTRICTS
Carpinteria Valley
Goleta
Montecito
Santa Barbara
Page 4
Goleta West Conduit
Goleta Santa Barbara
Carpinteria
Solvang/Santa Ynez Lake
Cachuma
Intake Tower
Jameson
Reservoir
Gibraltar
Reservoir
Montecito
Water Supply
Santa Ynez River Reservoirs
Watershed Area Completed Delivery As-Built Storage* 2015 Storage Max Storage Loss Current Storage** Current Capacity
(mi2) (yr) Tunnel (mi) (acre-feet) (acre-feet) (%) (acre-feet) (%)
Lake Cachuma 417 1953 Tecolote (6.4) 214,200 193,305 9.8% 49,599 25.7% Reclamation
Gibraltar 216 1920 Mission (3.7) 14,500 5,303 63.4% 607 11.4% City of Santa Barbara
Jameson 14 1930 Doulton (2.2) 7,228 5,144 28.8% 985 19.1% City of Montecito
*With 3 feet (9,200 af) of added storage in 2004.
**As of 7/1/15.
Reservoir Owner
Page 5
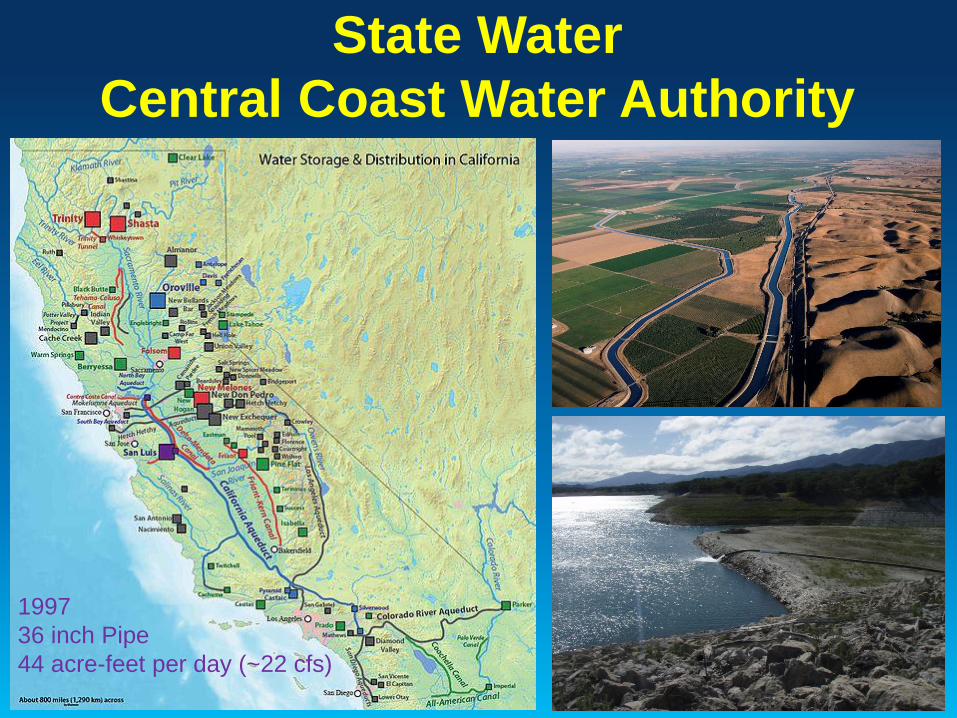
State Water
Central Coast Water Authority
1997
36 inch Pipe
44 acre-feet per day (~22 cfs)
Page 6
Jameson Reservoir
(Juncal Dam)Gibraltar Reservoir
(Gibraltar Dam)
Storage loss: 9.8% 63.4%
Page 7
• Capacity: 193,305 af (7 yrs??)
• Average annual water use: 25,714 af
Lake Cachuma and Bradbury Dam
Storage loss: 9.8%
Page 8
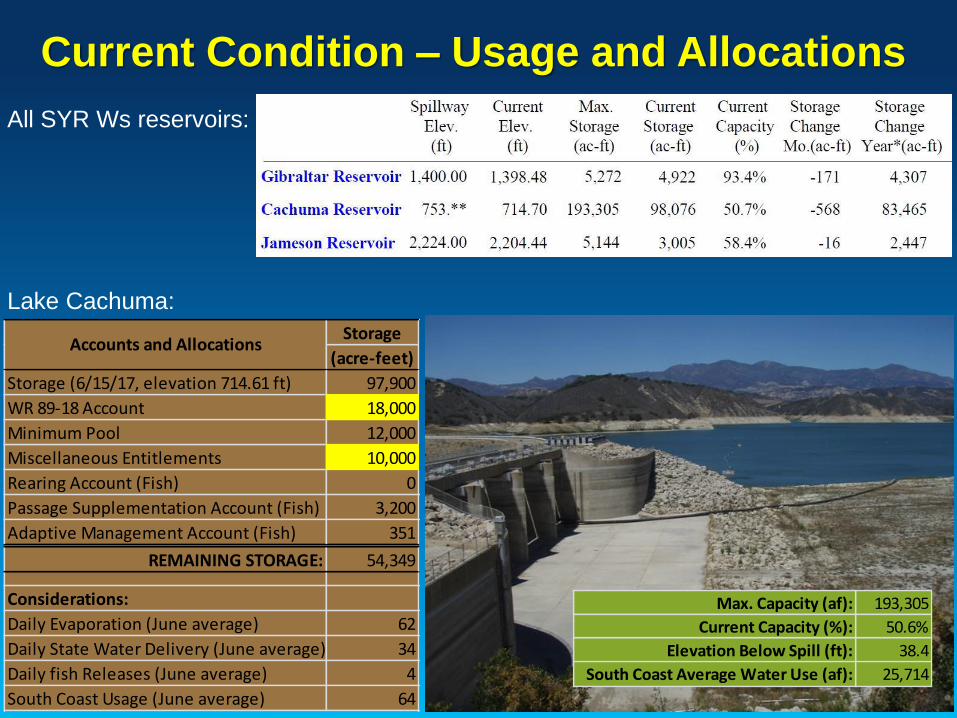
Current Condition – Usage and Allocations
All SYR Ws reservoirs:
Lake Cachuma:
Storage
(acre-feet)
Storage (6/15/17, elevation 714.61 ft) 97,900
WR 89-18 Account 18,000
Minimum Pool 12,000
Miscellaneous Entitlements 10,000
Rearing Account (Fish) 0
Passage Supplementation Account (Fish) 3,200
Adaptive Management Account (Fish) 351
REMAINING STORAGE: 54,349
Considerations:
Daily Evaporation (June average) 62
Daily State Water Delivery (June average) 34
Daily fish Releases (June average) 4
South Coast Usage (June average) 64
Accounts and Allocations
Max. Capacity (af): 193,305
Current Capacity (%): 50.6%
Elevation Below Spill (ft): 38.4
South Coast Average Water Use (af): 25,714
Page 9
Lake Bathymetry
1994: ?
2001: MNS
2008: MNS, Zaca Fire, 3 ft increase in lake capacity, 0.9 % storage loss from last survey
2013: Wallace Group, 1.1% storage loss from last survey
Page 10
Legend
-5 (degradation)
+5 (aggradation)
Loss of Lake Storage (2008 to 2013)
Page 11
County
Park
Intake
Tower
Pumping
Barge
Location 1
$6+ million project
Page 12
Intake Tower
Gate 1
Gate 5
Gate 4
1990
Gate 3
Page 13
Barge Site 1
Barge Site 2
643 ft
Intake Tower
631 ft
663 ft
Site Lake Elevation Lake Volume1 Pipe Length
(ft) (af) (ft)
Lake level (7/17/15) 683.43 48,493 -
Gate 4 - top2 682.00 46,706 -
Barge 1 - bathymetric depth 651.00 16,457 3,200
Barge 1 - minumum pumping depth 663.00 26,832 -
Dead Pool 642.99 12,000 -
Minimum pumping depth at Dead Pool3 630.99 6,587 -
Barge 2 (proposed) 615.00 1,799 9,700
1December 2013 bathymetry.2Possible start of pumping.3Minimum pumping barge operational depth is 12 feet, hence minimum depth to
pump down to Dead Pool is 631 ft (643-12).
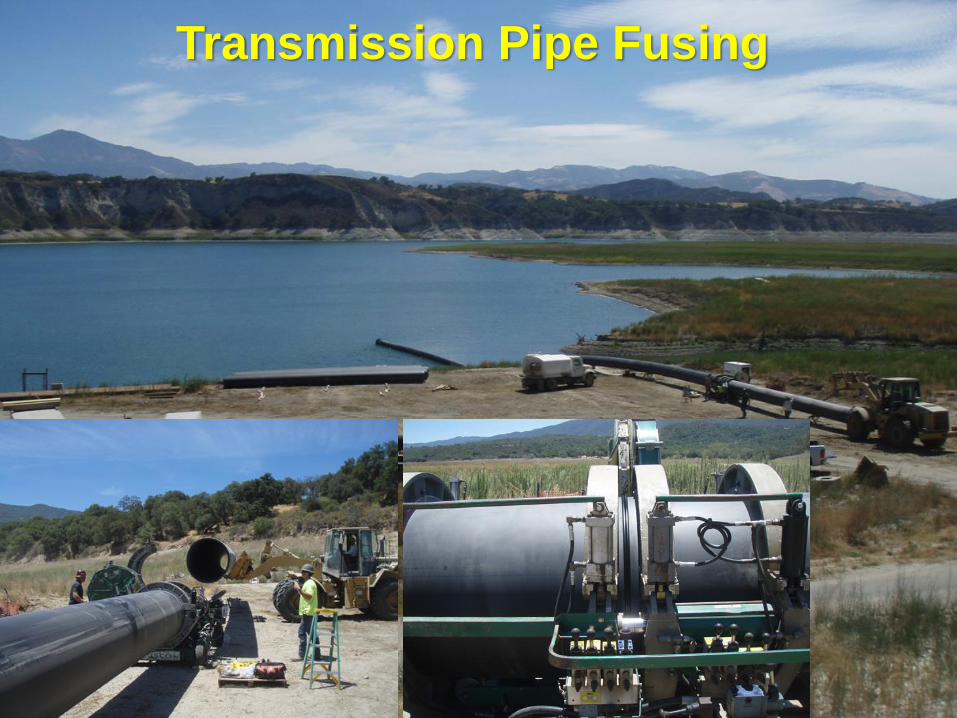
Page 14
Transmission Pipe Fusing
Page 15
Spud
Pile
Pumping Barge
Page 17
Quiota Creek - Crossing 6El Jaro Creek – San Julian
Ranch Fish Ladder
Salsipuedes Creek - Jalama
Bridge Fish Ladder
Habitat Restoration Projects
Hilton Creek – Cascade/
Chute Passage
SYR -
Lake Surcharge
El Jaro Creek – Cross Creek Ranch
Salsipuedes Creek – Hwy
1 Bridge Fish Ladder
El Jaro Creek – Bank
Stabilization
El Jaro Creek –
Culvert Replacement
Project Drainage Timeline
Hilton Creek Watering System Hilton 2000
Hwy 1 Bridge Fish Ladder Salsipuedes 2002
Streambank Restoration El Jaro 2003
Sidedraw Stabilization and Culvert Replacement El Jaro 2003
Jalama Bridge Fish Ladder Salsipuedes 2004
Bradbury Dam Flashboard Installation (Surcharge) Santa Ynez River 2004
Cascade/Chute Project Hilton 2005
Crossing 6 48-foot Bottomless-Arched Culvert Quiota 2008
San Julian Ranch Fish Ladder El Jaro 2008
Cross Creek Ranch Fish Passage Improvement El Jaro 2009
Crossing 2 60-ft Bottomless-Arched Culvert Quiota 2011
Crossing 7 60-ft Bottomless-Arched Culvert Quiota 2012
Crossing 1 60-ft Bottomless-Arched Culvert Quiota 2013
Page 18
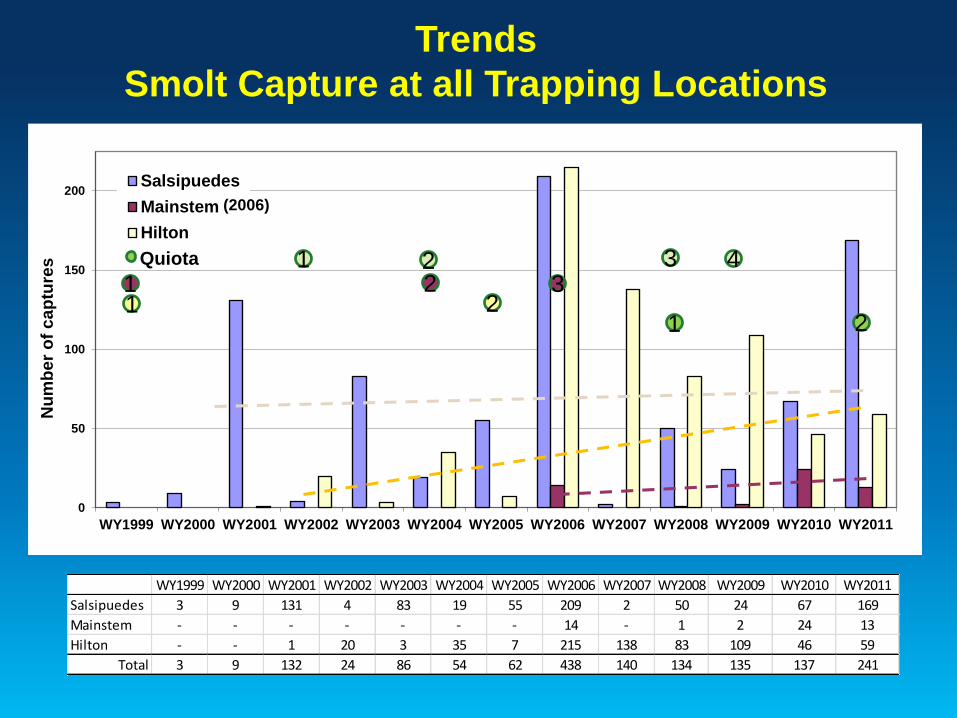
Trends
Smolt Capture at all Trapping Locations
0
50
100
150
200
WY1999 WY2000 WY2001 WY2002 WY2003 WY2004 WY2005 WY2006 WY2007 WY2008 WY2009 WY2010 WY2011
Nu
mb
er
of
ca
ptu
res
Salsipuedes
Mainstem
Hilton
WY1999 WY2000 WY2001 WY2002 WY2003 WY2004 WY2005 WY2006 WY2007 WY2008 WY2009 WY2010 WY2011
Salsipuedes 3 9 131 4 83 19 55 209 2 50 24 67 169
Mainstem - - - - - - - 14 - 1 2 24 13
Hilton - - 1 20 3 35 7 215 138 83 109 46 59
Total 3 9 132 24 86 54 62 438 140 134 135 137 241
1 2 3 421
1 21 2
Quiota
3
(2006)
Page 19
Trends
Anadromous Adult Capture at all Trapping Locations
WY1999 WY2000 WY2001 WY2002 WY2003 WY2004 WY2005 WY2006 WY2007 WY2008 WY2009 WY2010 WY2011*
Salsipuedes 3 0 4 0 1 0 1 1 0 7 0 1 8
Mainstem - - - - - - - 0 0 2 0 0 2
Hilton - - 0 0 0 0 0 0 0 7 1 0 1
Total 3 0 4 0 1 0 1 1 0 16 1 1 11
* Two fish are under question depending genetics analysis.
0
1
2
3
4
5
6
7
8
9
WY1999 WY2000 WY2001 WY2002 WY2003 WY2004 WY2005 WY2006 WY2007 WY2008 WY2009 WY2010 WY2011*
Nu
mb
er
of
cap
ture
s
Salsipuedes
Mainstem
Hilton
1 2 3 421
1 21 2
Quiota
3
(2006)
Page 20
0
200
400
600
800
1000
1200
1400
1600
1800
2000
2000 2001 2002 2003 2004 2005 2006 2007 2008 2009 2010 2011 2012
Tota
l Ob
serv
ed
Hilton
Quiota
Trends - Summer Snorkel Survey Totals at
Hilton and Quiota Creeks
Page 21
El Niño 2015-2016
El Niño conditions are present
90% chance through winter
80% chance through spring
Page 24
0
50,000
100,000
150,000
200,000
250,000
300,000
350,000
400,000
450,000
500,000
19
52-5
3
19
54-5
5
19
56-5
7
19
58-5
9
19
60-6
1
19
62-6
3
19
64-6
5
19
66-6
7
19
68-6
9
19
70-7
1
19
72-7
3
19
74-7
5
19
76-7
7
19
78-7
9
19
80-8
1
19
82-8
3
19
84-8
5
19
86-8
7
19
88-8
9
19
90-9
1
19
92-9
3
19
94-9
5
19
96-9
7
19
98-9
9
20
00-0
1
20
02-0
3
20
04-0
5
20
06-0
7
20
08-0
9
20
10-1
1
20
12-1
3
Spil
l Vo
lum
e (a
f)
1998
1969
2005
2011
Page 25
WY2017
Wet year but no end to the drought
8/22/16
2/18/17
2/21/17
Page 26
Conclusions• Santa Barbara County: boom or bust
hydrologic cycle
• Drought beyond November 2015: bigproblems
• El Niño: looking good but ….
• Climate change: expect extremes(the new norm)
• Human consumption: reduce,update, reclaim and be creative- Desalinization: not sustainable
• Future: conserve and think-act dry
Endangered Santa Ynez River
Southern Steelhead
Page 27
Questions
Thanks for your attention!
Smolts
to
CONSERVE!!
Adults