Consortium on Chicago School Research University of Chicago
Albert L. Bennett Penny Bender Sebring
Roosevelt University University of Chicago
Anthony S. Bryk Mark A. Smylie
University of Chicago University of Illinois
at Chicago
MissionThe Consortium on Chicago School Research aims to con-duct research of high technical quality that can inform andassess policy and practice in the Chicago Public Schools.By broadly engaging local leadership in our work, and pre-senting our findings to diverse audiences, we seek to ex-pand communication between researchers, policy makers,and practitioners. The Consortium encourages the use ofresearch in policy action, but does not argue for particularpolicies or programs. Rather, we believe that good policy ismost likely to result from a genuine competition of ideas in-formed by the best evidence that can be obtained.
Founded in 1990, the Consortium is located at the Universityof Chicago.
Consortium on Chicago School Research
1313 East 60th Street, Chicago, IL 60637
773-702-3364 fax -773-702-2010
www.consortium-chicago.org
C O N S O R T I U M O N C H I C A G O S C H O O L R E S E A R C HC H A R T I N G R E F O R M I N C H I C A G O S E R I E S
Ending Social Promotion:Dropout Rates in Chicago after Implementation of theEighth-Grade Promotion Gate
March 2004
Steering CommitteeJohn Ayers, CochairLeadership for Quality EducationVictoria Chou, CochairUniversity of Illinois at Chicago
INSTITUTIONAL MEMBERSCHICAGO PRINCIPALS AND ADMINISTRATORS ASSOCIATIONCLARICE BERRY
CHICAGO PUBLIC SCHOOLSChristy Carterfor the Chicago Board of Education
Dan BuglerOffice of Research, Evaluation and Accountability
Barbara Eason-Watkinsfor the Chief Executive Officer
ACADEMIC ACCOUNTABILITY COUNCILJorge Oclander
CHICAGO TEACHERS UNIONDeborah Lynch
ILLINOIS STATE BOARD OF EDUCATIONConnie Wisefor the Superintendent
INDIVIDUAL MEMBERSGina BurkhardtNorth Central Regional Educational Laboratory
Louis M. GomezNorthwestern University
Anne C. HallettCross City Campaign for Urban School Reform
G. Alfred Hess, Jr.Northwestern University
Janet KnuppChicago Public Education Fund
James LewisRoosevelt University
Rachel LindseyChicago State University
George LoweryRoosevelt University
Angela Perez MillerUniversity of Illinois at Chicago
Donald R. MooreDesigns for Change
Sharon RansomUniversity of Illinois at Chicago
Barbara A. SizemoreDePaul University
James SpillaneNorthwestern University
Steve ZemelmanLeadership for Quality Education
A B O U T T H E A U T H O RA C K N O W L E D G M E N T S
Elaine Allensworth is the Associate Director for Statistical Analysis and Archives at theConsortium on Chicago School Research. Her research focuses on the structural factorsthat affect school development, as well as policy effects on high school student outcomes.She is currently analyzing system- and school-level factors that affect trends in dropoutrates, and is beginning work on students’ postsecondary outcomes. Elaine is part of theresearch team that is testing and elaborating the Consortium’s Theory of Essential Sup-ports. She holds a Ph.D. in Sociology from Michigan State University.
The author is grateful to the many individuals who provided support and assistance in theproduction of this report. First and foremost, I thank Melissa Roderick who providedencouragement and feedback throughout all stages of this work. I also particularly thankJenny Nagaoka whose work on the companion report, Ending Social Promotion: The effectsof retention, made her the best source for information about the promotion-gate policyand its consequences for students. Consortium directors provided helpful advice on earlydrafts of this report, and I would particularly like to thank John Easton, Penny Sebring,and Stuart Luppescu for their thorough reviews. I would also like to thank the two outsidereviewers, Aaron Pallas and Steve Raudenbush, for their many helpful comments. In addi-tion, members of the Consortium Steering Committee provided useful feedback, and Iparticularly thank G. Alfred Hess for his comments. I am grateful to Melissa Dean for hercareful editing and substantive review, and to Sandra Jennings for the beautiful graphicsand the design of this report. Finally, this report would not have been possible without thework of the Consortium staff in developing and maintaining the necessary data and pro-viding feedback through all stages of the analytic work. This study was made possible bythe grants supporting the core research of the Consortium from the Joyce Foundation, theJohn D. and Catherine T. MacArthur Foundation, and the Spencer Foundation.
Dropout Rates in Chicago after Implementationof the Eighth-Grade Promotion Gate
C O N S O R T I U M O N C H I C A G O S C H O O L R E S E A R C H
John Booz
I N T R O D U C T I O N
1
Beginning with the 1995-96 eighth-grade class, the Chicago PublicSchools (CPS) initiated a high-stakes testing policy that requiredstudents to meet a minimum score on the Iowa Tests of Basic Skills
before being promoted to high school.1 Those who failed either repeatedthe eighth grade or moved into new schools called “transition centers,”which were created for students too old to remain in elementary school.About 1,800 eighth graders were held back from entering ninth grade thatfirst year. Even more students were held back from entering ninth gradeeach of the following three years, with about 3,000 students repeatingeighth grade or entering a transition center in the fall of 1997; 3,900 stu-dents in the fall of 1998; and 3,300 students in the fall of 1999.2
One of the biggest concerns about the implementation of a policy thatholds students back is the increased risk that they will drop out of school.While the effects of system-mandated retention are not known, there is agreat deal of research on grade retention resulting from the individualdecisions of teachers and parents. Consistently, this research on teacher-initiated retention has shown that retained students are much morelikely to drop out than students at the expected grade for their age.3
Moreover, this research shows that retained students appear to be espe-cially vulnerable to dropping out at young ages.4
Before the promotion-gate policy was implemented, Chicago alreadyfaced high dropout rates—about 43 percent of students dropped out ofschool by age 19.5 Based on studies of teacher-initiated retention, therewas substantial concern that because high-stakes testing would cause re-tention rates to rise, the policy would exacerbate the system’s already severedropout rate.
2 CHARTING REFORM IN CHICAGO
However, proponents of the policy believed thethreat of retention would both encourage students towork harder and motivate teachers and schools to ad-dress better the educational needs of the lowest-achiev-ing students. Because higher-achieving students are lesslikely to drop out than lower-achieving students, pro-ponents argued that if the promotion gate broughtabout better achievement, it would, in turn, loweroverall dropout rates.6 The eighth-grade promotiongate, therefore, could have had two contradictory ef-fects on dropout rates: raising the likelihood of drop-ping out by putting more students through theexperience of retention, but lowering the likelihoodof dropping out by improving achievement.
Existing studies on grade retention and droppingout are not sufficient to answer questions about theeffects of a high-stakes promotion gate on dropoutrates. 7 While previous research has shown a strongrelationship between teacher-initiated retention anddropping out of school, this research may not be ap-plicable to the high-stakes testing environment, where
the context of retention is very different. A number ofdifferences could be hypothesized, in terms of boththe social-psychological effects of retention and theinstructional responses of teachers and schools. Forexample, from the students’ perspective, the explicitcriteria for promotion under high-stakes testing mightlead students to internalize failure more when retained,rather than blaming their school or teacher. Alterna-tively, students may be less likely to feel singled out orunfairly punished. If retention is relatively commonin a school, as it is in some of the lowest-performingschools in Chicago, the stigma associated with beingheld back may not be as strong. Teachers may reactdifferently to students retained under high-stakes test-ing than to those that have been singled out for reten-tion. For example, teachers may be more likely to tailorinstruction to a group of retained students than theywould to a student retained alone. They also may bemore likely to view retained students as victims of anexternal policy, rather than seeing deficits in particu-lar students, and may be more sympathetic in their
How the Promotion-Gate Policy WorksBeginning in spring 1996, eighth-grade students were required to meet a minimum score on the Iowa Tests of Basic Skills(ITBS) in both reading and mathematics in order to be promoted to ninth grade. The test-score cutoff for promotion wasset using the grade-equivalent metric, which is based on national norms. Using this metric, a student is considered ongrade level if they obtain a score of their grade plus the number of months in the school year that have passed (e.g., a scoreof 8.8 would be on grade level for an eighth-grade student taking the exam in the eighth month of the school year). Thecutoff score in the first year was two years below grade level, or 6.8 grade equivalents. In spring 1997, the eighth-gradecutoff score was raised to 7.0, and promotion gates were put in place at grades three and six. The district continued toincrease the eighth-grade cutoff score each subsequent year, to 7.2 in 1998, 7.4 in 1999, and 7.7 in 2000. Students whodid not meet the cutoff score in both reading and math were required to participate in a summer-school program calledSummer Bridge, where they received instruction in reading and math aimed at helping them to pass the test. At the end ofthe summer, students took the ITBS again. Those who did not pass the second time either were retained in eighth grade ormoved into a transition center. Transition centers were new schools designed specifically for students who failed theeighth-grade standards, but were too old to remain in elementary school.1 Between 40 to 50 percent of students held backby the eighth-grade gate enrolled in transition centers each year, beginning in the 1997-98 school year.
Two groups of students—those who were in special education, and those who were in bilingual education for three yearsor less—were not held to the promotion criteria in the same ways as other students. The promotion decisions for special-education students were based on criteria outlined in their Individual Education Plans (IEP). At the start of the policy,bilingual students were excluded if they had been enrolled in a bilingual education program for less than three completeyears as of the beginning of the school year. In 1999, the criterion was changed from three years to four years.
DROPOUT RATES IN CHICAGO 3
interactions. There are likely many mechanismsthrough which teacher-initiated retention leads to anelevated risk of dropping out that would differ fromhigh-stakes testing-based retention. Furthermore, stud-ies on teacher-initiated retention have been limited bythe degree to which they could control for factors thatspuriously inflate the relationship between droppingout and retention, such as overall disengagement fromschool, which leads to a greater likelihood of both re-tention and dropping out. These studies likely haveproduced inflated estimates of the effect of retentionon the risk of dropping out. Therefore, the relation-ship of high-stakes testing-based retention to droppingout is very likely not the same as has been found instudies on teacher-initiated retention.
The potentially contradictory effects of high-stakestesting on dropout rates, both through rising reten-tion rates and improving achievement, further com-plicate the question of the effects of high-stakestesting-based retention on dropping out. There are nostudies that have tracked students over a number of
years to determine the effects of this kind of promo-tion gate on the likelihood that students will eventu-ally drop out.8 This study fills the gap in knowledgeabout the consequences of the promotion gate on drop-out rates by comparing dropout rates in Chicago be-fore and after implementation of the eighth-grade gate.The report is organized around five central questions:
1. What happened to dropout rates after implemen-tation of the eighth-grade promotion gate?
2. Did retention at the gate affect students’ likeli-hood of dropping out?
3. Did retention at the gate lead students to dropout at an earlier age than they would have with-out the gate?
4. Did simultaneous improvements in studentachievement lead more students to stay in school?
5. Were dropout trends different for subgroups ofstudents: by race, gender, exclusion from testing,or age at which students encountered the pro-motion gate?
1 Students who will turn 15-years-old by December 1 of the school year are not allowed to enroll in elementary school. Transitioncenters were later renamed “Academic Preparation Centers.”
2 Roderick, et al. (1999).
3 See Nagaoka and Roderick (2004), and Roderick, et al. (1999) for a more detailed description of the waiver patterns.
4 In the companion report, Ending Social Promotion in Chicago: The effects of retention, the policy is described primarily for gradesthree and six. In practice, eighth-grade waivers were implemented slightly differently.
Until spring 2001, the eighth-grade promotion standards only incorporated test-score cutoffs, with no explicit provisionsmade for exceptions. Still, in each year, about one-third of the students who did not meet the cutoff at the end of thesummer were promoted. Latino eighth graders were slightly more likely than African-American students to receive waiv-ers.2 Waiver rates were also highest among students close to the cutoff score, suggesting some hesitancy to use thestrict test-score cutoff. Students’ likelihood of being waived was also largely determined by the region of the city in whichthey lived. Region officers handled principals’ waiver requests, and they varied considerably in their willingness to grantthose waivers.3 Because waivers were largely based on factors that could be statistically controlled (e.g., ethnicity orachievement), or were unrelated to dropping out (e.g., region), waivers had almost no influence on the results of thestatistical analyses.4
4 CHARTING REFORM IN CHICAGO
Methods of AnalysisThe subjects of the study were seven cohorts of CPS students who were 13-years-old on September 1 of each year,from 1992 to 1998;1 a total of 171,471 students across all seven cohorts.2 Three cohorts were classified as prepolicyand four as postpolicy.3 Each cohort was followed for at least four years, until its members were 17-years-old. Allbut the last two cohorts were followed for six years, until age 19. Dropout rates at age 17 were used as the primaryoutcome in this report so that four postpolicy cohorts could be studied. By following four cohorts, policy effectscould be examined during the initial stages of implementation and after adjustments were made in later years.4
Students were classified as dropouts if they were no longer active CPS students as of September 30 of the schoolyear in which they were 17-years-old (or 19-years-old for analyses that traced students to age 19) and their admin-istrative records indicated that they left school for any of the following reasons: lost—could not be located; trans-ferred to an evening school; lost—undeclared; exited IEP (rather than graduated); dropout self-declared; dropoutfor absences; did not arrive at school; entered/finished alternative school program (GED or alternative diploma); orno leave code recorded.5 Students who transferred to another school system were included in the analyses only aslong as they were in CPS (e.g., included in the analysis of 15-year-olds if in the system at age 15, and then notincluded in the analysis for age 16 and 17 if they transferred before reaching age 16). Because students are classi-fied based on their status at a certain point in time, it is possible that students who are classified as dropouts inthese analyses did eventually graduate.6 Likewise, students who are classified as nondropouts may have dropped
1 Students were grouped by age instead of grade because of the very strong relationship between age and dropping out, and toavoid selection bias due to earlier promotion gates.
2 This is the entire population of CPS students meeting the criteria, not a sample. Therefore, the dropout rates that are presentedare actual (not estimated) rates and all differences across cohorts and subgroups are significant. Some specific statisticalanalyses use only a subset of students (e.g., those with eighth-grade test scores), as described below under “Analysis.”
3 Most postpolicy cohort students were subject to the promotion gate. However, a small number of these students had skippedan elementary grade, so they were not subject to the gate. Likewise, some students in the prepolicy cohorts had been held backin elementary school, so they were subject to the eighth-grade gate. Classifying students by whether they were actually subjectto the gate, however, would bias estimates of policy effects, since the lowest-achieving students from prepolicy cohorts wouldbe moved to the postpolicy group, and the highest-achieving students from postpolicy cohorts would be moved to the prepolicygroup. By defining cohorts strictly by age, such selection bias is not introduced.
4 In the first year of the policy, students were held back without any prior changes in programs or instruction, and there weredoubts about whether failing students would be retained. Support structures for failing students were introduced after thesecond year of the policy, with the third cohort through the gate.
5 The most common dropout codes were “lost—not coming to school” and “dropout for absences.” This remained the caseacross the cohorts, although there was one shift with fewer students coded as “lost—undeclared” and more students coded as“dropout—other” in the later cohorts. The percentage of students coded as dropouts who left for alternative school/GED pro-grams varied between 16 and 19 percent across the cohorts, but there was no systematic increase or decline. Between 5 and 7percent of the students classified as dropouts had no leave reason recorded in their administrative records. Over 70 percent ofthese students were classified as dropouts in administrative records one year later. The late classification likely represents adelay in categorizing students for whom status is uncertain. Students under age 16 are over-represented in this group, suggest-ing a hesitancy to classify students under age 16 as dropouts without verification. Over half of the remaining students with noleave reason recorded are classified as active students or graduates the following year. Others remain unclassified, or are codedas transfer or institutionalized students the following year.
6 In each cohort, less than 1 percent of students coded as dropouts at age 17 actually re-enrolled and graduated by age 19, while2 percent had re-enrolled and were still active students.
DROPOUT RATES IN CHICAGO 5
out and then re-enrolled in school. Dropouts may also have left school more than once, but each student is countedonly once in the analyses, based on their status at the age being examined.
DataData were collected from three sources: CPS student administrative data files from each fall semester from 1992 to2002, CPS students’ scores on the Iowa Tests of Basic Skills (ITBS) from May 1990 to May 2001, and 1990 censusSTF3 files on census block groups.
ADMINISTRATIVE DATA. The student administration files provided information on whether a student was enrolled eachsemester and the reason for leaving for students who were no longer enrolled. Student administration files also pro-vided information on each student’s age, gender, race (Asian, African-American, white, Latino, Native American), spe-cial-education classification, and home address. Students’ home addresses were used to link each student to a particularblock group within the city, which could then be linked to census data on the economic conditions of the student’sneighborhood. Two indicators of economic conditions were used: concentration of poverty, which is a compositemeasure based on the percentage of males unemployed in the block group and the percentage of families below thepoverty line; and average social status, which is a composite measure based on the percentage of employed personswho are managers, professionals, or executives and the average level of education among adults age 21 or older.Special-education status was used only to improve the estimation of dropout rates when modeling achievement ef-fects. Special-education status was not included in demographic adjustments of dropout rates across cohorts becauseof the rise in classifications with high-stakes testing.
Student administration files also were used to determine whether students were retained in eighth grade. Studentswere classified as eighth-grade retainees for one of three reasons: they enrolled in eighth grade in the fall after beingenrolled in eighth grade the previous year; they dropped out of school after failing the eighth-grade promotion gate; orthey enrolled from an elementary school into a transition center. The second two conditions applied only to studentswho faced the eighth-grade promotion gate (the postpolicy cohorts).7
TEST SCORES. Students’ elementary school test scores on the ITBS were used to construct measures of students’ achieve-ment. A simple measure of students’ achievement by the end of elementary school would be their eighth-grade springtest score. However, a single test score is not a precise measure of true ability (e.g., a student may experience anespecially bad or good test day). In addition, postpolicy, eighth-grade test scores may have been affected by the high-stakes testing environment. To more accurately represent students’ true achievement levels at the end of eighth grade,a more reliable score was constructed by adjusting students’ scores for especially good or bad performance in eighthgrade, compared to their performance on previous tests. This was done through two-level hierarchical linear models ofstudents’ achievement growth over all of the years that they were enrolled in grades three through eight in CPS.8 Fromthis model, measures of students’ underlying eighth-grade ability were obtained for both reading and math.9 For thecurrent study, math and reading achievement were combined into one measure of overall achievement by averaging
7 Students who dropped out after failing the eighth-grade test are included as retainees because they would have faced eitherretention, summer school, or both as a result of the implementation of high-stakes testing, and these factors may have contributedto their decision to leave school. Students who skipped eighth grade and attended a transition center are included as retaineesbecause, prior to the high-stakes testing policy, they would have moved into high school instead of a transition center.
8The models were set up as observations within individuals. Level one fit students’ achievement growth trajectories withvariables for grade, grade-squared, and repeating a grade. Level two modeled the intercept and each slope without predictorvariables, with the slope for repeating a grade fixed across individuals. Separate models were run for each cohort of first-time eighth-grade students in CPS. Before running the HLM, students’ test scores were equated through Rasch analysis toremove form and level effects.
6 CHARTING REFORM IN CHICAGO
9It was suggested by one reviewer that observed scores should be used, rather than scores obtained from learning-growth models,since the gate should have motivated students to work hard and these learning gains would be “smoothed down” by the model.However, observed scores are not comparable across cohorts because the testing conditions were not the same once the promo-tion gate was put in place. If there were postpolicy learning gains in eighth grade that were smoothed by the model that weresubstantive enough to affect dropout rates, then the effects of those gains should be picked up as a main postpolicy effect. In fact,no main postpolicy effect exists. At the other extreme, another reviewer suggested that eighth-grade scores should not be used tomodel underlying achievement to eliminate any test gains due to the gate from the control for underlying achievement. I believe thatthe model used here to produce the underlying scores, which includes students’ eighth-grade test scores, provides the best esti-mate of students’ actual achievement at the end of eighth grade. Eighth-grade scores that are higher than would be expected givenstudents’ previous performance contribute to the latent score, allowing for some incorporation of the motivation effects on studentachievement in eighth grade, but they are constrained substantially, minimizing score inflation due mostly to test effects.
10 For the hierarchical analyses, students are grouped by the first high school or transition center that they attended in CPS. Beforeever enrolling in a high school or a transition center, 2.3 percent of the students dropped out. These students were assigned to thehigh school most frequently attended by other students from their elementary school so that they could be included in the analyses.
11 Students who were not yet in eighth grade at age 13 are not included because their grade progression and test-taking patternscould not be discretely classified. Students not subject to test reporting are not included because they were not subject to the policyin the same way as other students, and because their participation in testing changed considerably across the years studied.Analyzing only a subgroup of students introduces concern about selection bias. However, the size of this subgroup is similarprepolicy (66 percent) and postpolicy (65 percent), suggesting only minor selection differences. (While increasing numbers ofstudents were excluded from testing with implementation of the promotion gate, most of these late classifications occurred amongstudents already old-for-grade at age 13.) Importantly, it will be shown that the relationships of the control variables with dropoutrates are the same for prepolicy and postpolicy analyses groups, suggesting that any slight selection differences did not introducebias into the statistical analyses. For those comparisons that might be affected by selection bias, adjustments for the potentialselection effects are provided.
the standardized underlying reading and math scores. Test files also were used to determine whether a student wasincluded in test reporting (i.e., included in public reports about CPS student achievement). Students could be excludedfrom public reporting because of bilingual or special-education exemptions. Postpolicy, students excluded from testreporting were held to different promotion standards than other students.
AnalysisThe analysis is based on a matched-samples approach, comparing dropout rates among cohorts of students in CPSbefore and after the promotion gate. Particular attention is paid to changes in the relationship of dropping out with bothretention and achievement after implementation of the promotion gate. These relationships are used to estimate theeffect of high-stakes testing on dropout rates among both retained and nonretained students. Hierarchical linear mod-els (HLM) are used to control for changes in demographics and school enrollment patterns in CPS over the periodstudied.10 Details on the models and results of analyses are available in the Appendix.
All 171,471 CPS students who were 13-years-old between September 1992 and September 1998 were included in theanalyses of dropout-rate trends. However, the analyses that discerned the relationships of retention and achievementwith dropping out were limited to those students who were included in testing and enrolled in eighth grade at age 13—about two-thirds of the students, both prepolicy and postpolicy (113,937 students). Confining these particular analysesto this group allowed for the clearest comparison between cohorts for discerning the relationships of achievement andretention to dropping out.11 All students, however, were used for comparisons of dropout rates across cohorts, withthe last two cohorts included only in analyses up to age 17.
DROPOUT RATES IN CHICAGO 7
Ending Social Promotion: A five-year studyOver the past five years, Consortium researchers have been evaluating the effects of the Chicago Public Schools’ending social promotion initiative, which combined sanctions, such as high-stakes testing-based retention andschool accountability, with supports, such as optional after-school and mandatory summer-school programs. Thisreport is one in a series that began in 1999 with the publication of Ending Social Promotion: Results from the firsttwo years. An update to this report was published in 2000. The first two reports tracked important indicators ofstudent progress, including the proportion of students who met the test-score cutoff at the end of the school year;at the end of the summer; and, for those who were retained, after a second time through the policy. These reportsfound that after institution of the policy, the proportion of students who had very low test scores (test scores belowthe promotion cutoff) declined significantly. Declines in the proportion of students with very low test scores weremuch greater in the sixth and eighth grades than in the third grade. Early data suggested that the Summer Bridgeprogram and the second chance it afforded students to pass the test and avoid retention had been one of the mostsuccessful aspects of the policy, accounting for a large proportion of the improvements in passing rates. At thesame time, early data suggested that retained students were struggling their second time through the promotion-gate grade and that their postretention achievement growth was no different than previously socially promotedyouths.
Subsequent reports and research articles have looked more closely at these initial findings. Two articles, “TheGrasshopper and the Ant: Motivational responses of low achieving students to high stakes testing” and “HighStakes Testing in Chicago: Effects on achievement in promotional gate grades,” looked both qualitatively andquantitatively at the effects of the policy in shaping students’ work effort, experiences in school, and achievement.Another report in the series, Ending Social Promotion: Results from Summer Bridge presents the results of amultiyear evaluation of Summer Bridge. This study examined the short- and long-term effects of Summer Bridgeon student achievement and looked carefully at the nature and quality of Summer Bridge and students’ reports oftheir experiences. An additional report, Ending Social Promotion in Chicago: The response of teachers and stu-dents, used Consortium surveys to examine teachers and students’ assessments of the impact of the policy. Thisreport investigated whether, after implementation of the policy, teachers spent more time on test preparation andaligned the content of their courses to the ITBS. It also examined trends in students’ reports of the academicsupport they received from teachers and parents, their perceptions of the challenge of their coursework, and theirparticipation in after-school programs.
In this final report, Ending Social Promotion: Dropout rates in Chicago after implementation of the eighth-gradepromotion gate, and its companion report, Ending Social Promotion: The effects of retention, we focus on evaluat-ing the effects of retention on student achievement and progress in school and ultimately on dropout rates. Moretechnical presentations of these results can be found in two accompanying research papers: Allensworth (forth-coming) and Roderick and Nagaoka (forthcoming). In addition, Stone and Engel (forthcoming) examined qualita-tively the experience of a group of students who were retained in Chicago, how teachers approached the retentionyear, and the degree to which retained students experienced different educational supports.
8 CHARTING REFORM IN CHICAGO
John Booz
1C H A P T E R
9
What Happened to Dropout Rates after Implemen-tation of the Eighth-Grade Promotion Gate?Dropout Rates Remained at Prepolicy Levels with the FirstTwo Cohorts through the Gate, Then Declined with the NextTwo Cohorts.
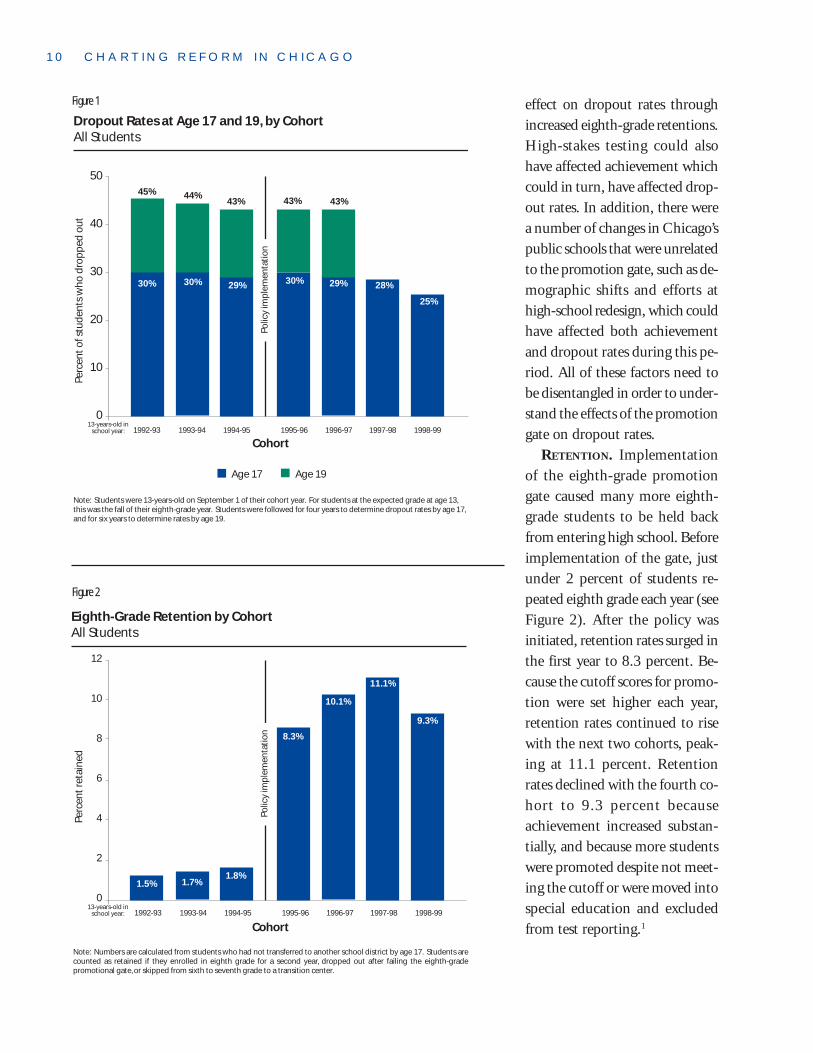
Prior to implementation of the eighth-grade promotion gate, 43 to45 percent of students dropped out of school by age 19 (see Figure1). Dropout rates at age 19 remained at about 43 percent with the
first two cohorts through the promotion gate. Because the third and fourthcohorts through the gate have not yet reached age 19, their dropout ratesat age 19 cannot yet be determined. If students are followed only until age17, four postpolicy cohorts can be examined, including two cohorts thatwent through the mature policy. As with dropout rates at age 19, dropoutrates at age 17 remained at prepolicy levels for the first two cohorts throughthe promotion gate—29 to 30 percent. Dropout rates then declined slightlywith the third cohort through the gate and fell even further with the fourthcohort through the gate, to 25 percent.
Factors That May Have Affected Dropout RatesInitial examination of dropout rates by cohort may suggest that imple-mentation of the promotion gate had no negative consequences for stu-dents’ likelihood of dropping out of school. However, there were a numberof changes that occurred simultaneously in Chicago public schools thatcould have affected dropout rates. High-stakes testing could have had an
10 CHARTING REFORM IN CHICAGO
effect on dropout rates throughincreased eighth-grade retentions.High-stakes testing could alsohave affected achievement whichcould in turn, have affected drop-out rates. In addition, there werea number of changes in Chicago’spublic schools that were unrelatedto the promotion gate, such as de-mographic shifts and efforts athigh-school redesign, which couldhave affected both achievementand dropout rates during this pe-riod. All of these factors need tobe disentangled in order to under-stand the effects of the promotiongate on dropout rates.
RETENTION. Implementationof the eighth-grade promotiongate caused many more eighth-grade students to be held backfrom entering high school. Beforeimplementation of the gate, justunder 2 percent of students re-peated eighth grade each year (seeFigure 2). After the policy wasinitiated, retention rates surged inthe first year to 8.3 percent. Be-cause the cutoff scores for promo-tion were set higher each year,retention rates continued to risewith the next two cohorts, peak-ing at 11.1 percent. Retentionrates declined with the fourth co-hort to 9.3 percent becauseachievement increased substan-tially, and because more studentswere promoted despite not meet-ing the cutoff or were moved intospecial education and excludedfrom test reporting.1
Figure 1
Figure 2
50
40
30
20
10
0
Dropout Rates at Age 17 and 19, by CohortAll Students
Note: Students were 13-years-old on September 1 of their cohort year. For students at the expected grade at age 13, this was the fall of their eighth-grade year. Students were followed for four years to determine dropout rates by age 17, and for six years to determine rates by age 19.
Note: Numbers are calculated from students who had not transferred to another school district by age 17. Students are counted as retained if they enrolled in eighth grade for a second year, dropped out after failing the eighth-grade promotional gate, or skipped from sixth to seventh grade to a transition center.
Cohort
Eighth-Grade Retention by CohortAll Students
12
10
8
6
4
2
0
DROPOUT RATES IN CHICAGO 11
STUDENT ACHIEVEMENT. Achievement improvedsubstantially with the postpolicy cohorts. Figure 3 dis-plays average underlying eighth-grade achievementacross the seven cohorts. Some students in the special-education and bilingual programs were not requiredto take the test. If they took the test, their scores wereexcluded from public reporting (i.e., not included incalculations of school statistics). Postpolicy, these stu-dents were not held to the promotion standards in thesame way as other students.2 Achievement is repre-sented separately for students excluded from test re-porting in Figure 3 because they were not subject tothe same testing environment as other students, andbecause estimates of their average achievement couldbe biased by a number of factors.3
By the 1998 cohort, achievement was more thanone-half of a standard deviation higher than it was inprepolicy cohorts, among included students. In otherwords, the test score of an included student who wasat the 50th percentile in the 1998 cohort would havebeen at the 70th percentile in the 1992 cohort.4 Achieve-
ment was also much higher among students whosescores were excluded from test reporting, even thougha much larger percentage of these students were testedand were used in calculating the averages for excludedstudents, postpolicy (see Figure 3).
The rise in student achievement is consistent withthe policy effects anticipated by proponents of high-stakes testing. However, the degree to which the policyacted as a catalyst for rising achievement is debatable.Much of the rise in achievement could be attributedto other factors, described below under “Factors unre-lated to high-stakes testing.” This study does not at-tempt to discern the degree to which improvementsin achievement were due to the promotion gate versusother factors. Regardless of its source, rising achieve-ment should have reduced dropout rates during thepostpolicy period.
FACTORS UNRELATED TO HIGH-STAKES TESTING. Dur-ing this period, a number of changes occurred in CPSthat were unrelated to high-stakes testing and that mayhave affected dropout rates and student achievement.
Figure 3
Average Achievement by Cohort
0.600
0.400
0.200
0.000
-0.200
-0.400
-0.600
-0.800
-1.000
-1.200
Un
der
lyin
g a
chie
vem
ent
(sta
nd
ard
ized
acr
oss
co
ho
rts)
13-years-old in school year: 1992-93 1993-94 1994-95 1995-96 1996-97 1997-98 1998-99
-1.056 -1.050 -1.020
-0.914-0.843
-0.719
-0.595
-0.104 -0.067-0.093
0.028
0.112
0.269
0.422
* Students excluded from test reporting, because of special education or bilingual exemptions, might take the test and not have their scores included in public reporting statistics, or they might not take the test at all. Students who did not take the test cannot be added into cohort averages. Postpolicy, many more excluded students took the test than in the prepolicy cohorts. Therefore, a larger percentage of students in special education and bilingual programs are added into the postpolicy averages of students excluded from test reporting. It is surprising that average test scores among students excluded from test reporting improved, since the inclusion of more of the students with bilingual/special education exemptions would have been expected to depress average scores. In addition, about 2 percent more students were excluded from test reporting postpolicy because of higher rates of classification into special education. This may have slightly elevated the postpolicy scores for both included and excluded students, especially in the 1998-99 cohort. Excluding a similar proportion of the lowest-performing students in the 1992-93 cohort would raise that average from -.104 to -.034.
Cohort
Students Included in Test Reporting
81% of prepolicy students79% of postpolicy students
Students excluded from test reporting who took the eighth grade test*
Po
licy
12 CHARTING REFORM IN CHICAGO
Some of these factors can be measured and statisti-cally controlled. These include demographic shifts inthe population of students served by CPS, as well asoverall economic improvements across the city.5 In ad-dition, a number of new high schools opened near theend of the decade, and these schools tended to havelower dropout rates than the overall system. The avail-ability of these schools should have helped to lowerdropout rates.6 When demographic changes and schoolenrollment patterns are statistically controlled, thedecline in dropout rates appears slightly smaller—ad-justed from a decline of 4.5 percent with the 1998-99cohort to a decline of 4.1 percent.7
The opening of newschools and the eighth-grade promotion gatewere two components ofdistrict efforts at high-school redesign. Thesecomponents aimed at im-proving the quality of stu-dents entering the highschools. Students with high elementary-school achieve-ment were slightly more likely to remain in CPSfor high school after the new schools opened, andthis should have reduced overall dropout rates andachievement slightly. Other components of high-school redesign also may have affected dropoutrates.8 Beginning in 1997, CPS mandated that stu-dents take more challenging coursework in highschool, and restructured schools to improve personal-ization to help students meet the demands of thesehigher standards (e.g., introducing advisories, junioracademies, and schools within schools). While thereis no evidence that school restructuring had a substan-tial effect, students were more likely to accumulate thecredits needed for graduation after they were requiredto do so.9 This likely helped to improve graduationrates. CPS also began focusing resources and penaltieson very-low-performing schools. School-level account-ability was enacted in the 1995-96 school year, in whichschools faced probation, remediation, and reconstitu-tion if too few of their students’ test scores met na-
tional norms. Over half of the high schools in CPSexperienced these consequences, and while these con-sequences brought additional resources into strugglinghigh schools, they also brought substantial stress anduncertainty.10 Students in the lowest-achievingschools may have been affected by these conse-quences for their schools.
There also were other changes in CPS district policythat occurred before efforts at high-school redesign andimplementation of the promotion gates that shouldhave affected student achievement and dropout ratesduring the latter part of the 1990s. In the early 1990s,Chicago’s elementary schools underwent substantial
changes due to unprec-edented decentralizationreform enacted in 1988.Following the introduc-tion of the reform act, inthe early 1990s, most el-ementary schools showedsignificant improvementson the ITBS. Students
who were in the primary grades during this time ofimproving test scores would have moved into eighthgrade during the latter part of the decade, around thesame time that the promotion gates were put into place.Therefore, at least some of the rise in achievement andthe decline in dropout rates are likely due to earlierschool reforms.11
Furthermore, in 1995, Mayor Daley took over con-trol of the schools and appointed a CEO of schools.For the first time in years, there was stability in CPSleadership—conflict with the teachers union subsided,and there was an influx of money for substantial capi-tal improvements. These changes also should haveimproved conditions for student learning.
Finally, broader societal changes may have reduceddropout rates. Chicago was typical of the national trendin declining births to teenage mothers over this pe-riod.12 Additionally, the introduction of welfare reformsthat required school attendance should have helped toreduce dropout rates among teenage mothers.
. . . at least some of the rise inachievement and the decline indropout rates are likely due to ear-lier school reforms.
DROPOUT RATES IN CHICAGO 13
These societal factors, coupled with the school-sys-tem changes discussed earlier, require caution whenattributing dropout-rate and achievement improve-ments to the implementation of the eighth-gradepromotion gate. While the overall trends in drop-out rates displayed in Figure 1 initially suggest thatthe policy caused no adverse effects, these effects maybe concealed by the numerous other changes that were
occurring in the schools. There was an array of factorsthat potentially had some effect on dropout rates dur-ing the 1990s. To understand the total effect of thepolicy, this analysis picks apart the changes in drop-out rates that could be specifically attributed to thepolicy: the effect of rising retention and the effect ofrising achievement.
14 CHARTING REFORM IN CHICAGO
John Booz
2C H A P T E R
15
Did Retention at the Gate Affect Students’Likelihood of Dropping Out?Retention at the promotion gate increased the likelihood of drop-ping out by age 17 by about 8 percentage points (from 31 percentto 39 percent for a typical retained student), and increased thelikelihood of dropping out by age 19 by about 13 percentage points(from 44 to 57 percent).
Teacher-initiated retention has been tied repeatedly to a high likeli-hood of dropping out, but it is not known if district-mandatedretention affects students’ likelihood of dropping out. If experi-
encing retention at the promotion gate increased a student’s likelihood ofdropping out, we would expect to see more low-achieving students dropout after high-stakes testing was introduced, since so few of these studentswere retained prior to the policy and so many were retained after the policy.We would not expect, however, to see any difference in the pre- to postpolicydropout rates of students whose achievement suggests they were not at riskof retention.
Yet, the simultaneous increases in achievement and retention rates con-found the analysis of the effects of either on dropout rates. If achievementhad not increased dramatically with the policy, it would be possible tocalculate the retention effect by comparing very-low-achieving postpolicystudents to those with similar achievement prepolicy. However, because ofthe increase in achievement, such groupings would not be equivalent. Scoresthat would place students in the bottom quartile of the 1992 cohort wouldplace them in the bottom 5 percent of the 1998 cohort—a very differentgroup of students. It is also not possible to look at the effect of retentionjust by controlling for student achievement. After policy implementation,retention and achievement became strongly correlated.1 Therefore, mak-ing a direct comparison of each to dropout rates becomes problematic.2
16 CHARTING REFORM IN CHICAGO
However, among nonretained eighth-grade stu-dents, the relationship between underlying achieve-ment3 and dropping out was virtually the sameprepolicy and postpolicy.4 It was the same because therewas no retention effect among nonretained students,beyond any motivating effect on achievement, andbecause underlying test scores do not contain the test-ing effects found in raw scores.5 In other words, be-cause these students were not retained by the gate, therelationship between underlying achievement anddropping out remained unchanged postpolicy. Thisdoes not mean that the gate had no effect onnonretained students. The gate could have affectedtheir motivation, and thus, their achievement, result-ing in a lower likelihood of dropping out. This onlymeans that the relationship between underlying achieve-ment and dropout rates did not change. Therefore, byusing information from prepolicy students togetherwith information from postpolicy students, achieve-ment can be controlled across cohorts and thepostpolicy retention effect can be properly estimated.6
Figure 4 shows the percentage of students whodropped out by their underlying achievement level forcohorts prior to and after the institution of the eighth-grade gate, as well as the percentage of students at eachachievement level retained in postpolicy cohorts. Thisgraph provides strong evidence that retention underChicago’s high-stakes testing policy affected students’likelihood of dropping out. As shown, virtually no stu-dents with above-average, underlying-eighth-gradeachievement (those with a score above one) were re-tained in eighth grade. For these students, there is verylittle difference in prepolicy versus postpolicy drop-out rates—the lines representing dropout rates forpostpolicy and prepolicy students are almost on topof each other. This is not true, however, among low-achieving students. As seen in Figure 4, the lower thestudents’ test scores, the higher the probability of re-tention and the greater the discrepancy betweenprepolicy and postpolicy dropout rates. The discrep-ancy between prepolicy and postpolicy rates gets largeras the probability of retention gets larger; for each 10
percent increase in retention, the discrepancy betweenprepolicy and postpolicy dropout rates is about 1 per-cent larger. For example, almost half of the studentswith the lowest underlying-eighth-grade test scores(two standard deviations below the mean) were re-tained postpolicy, and almost 50 percent of these stu-dents dropped out by age 17, compared to 44 percentof students with the same underlying achievement priorto the policy. Note, however, that while this providessubstantial evidence of a retention effect on dropoutrates, it does not show the entire policy effect sincethe distribution of students’ latent achievement washigher postpolicy than prepolicy. That is, while very-low-achieving students’ likelihood of dropping out washigher postpolicy than prepolicy, students were lesslikely to have very low achievement.
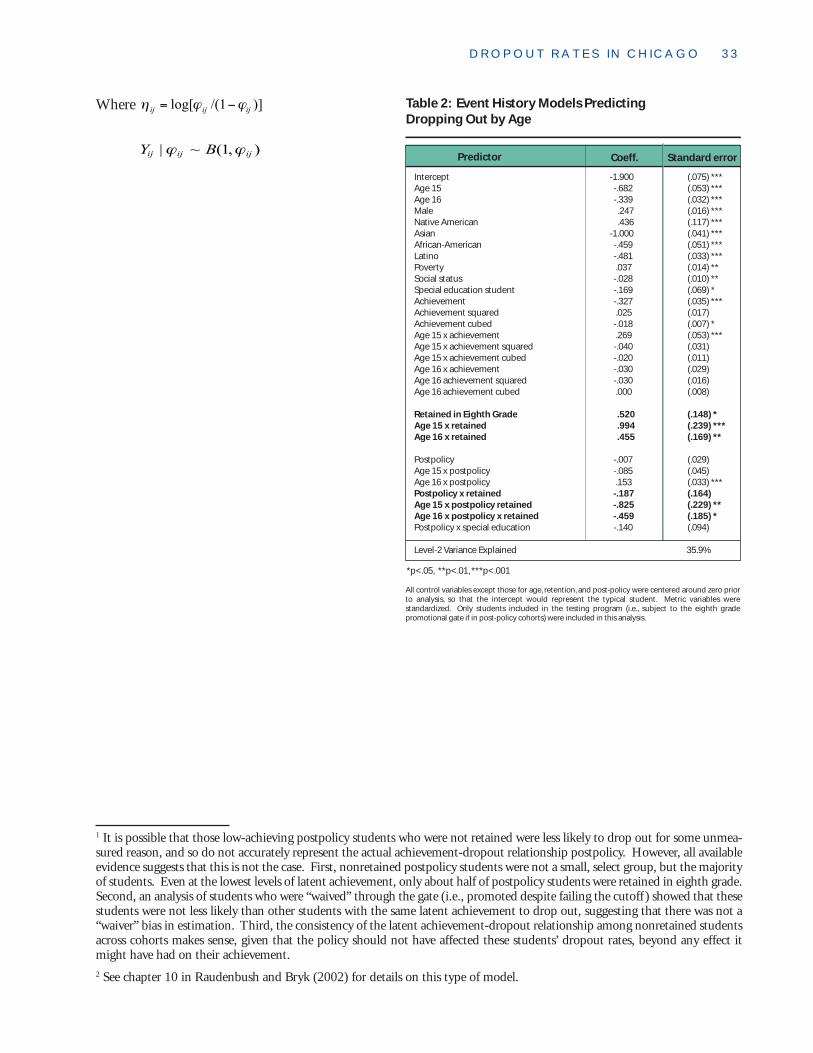
Statistical models that estimate retention effectsusing the prepolicy achievement-dropout relationshipshow a significant postpolicy eighth-grade retentioneffect on dropping out of 9.9 percentage points;postpolicy, 31.1 percent of students who had achieve-ment typical for retained students, but were not re-tained, dropped out of school by age 17.7 Incomparison, 41.0 percent of retained students withthe same demographic and achievement characteris-tics dropped out. (See the Appendix for details.)
Prepolicy, the relationship of eighth-grade retentionto dropping out was much stronger. The same statisti-cal models that estimated the postpolicy effect showthat retained students in prepolicy cohorts had drop-out rates that were 25.3 percentage points larger thannonretained prepolicy students with similar demo-graphic and achievement characteristics (55.7 percent,compared to 30.4 percent).8 However, prepolicy stu-dents retained in eighth grade were a very select groupof students (less than 2 percent of the total). Postpolicystudents retained in eighth grade were less likely todrop out than prepolicy students retained in eighthgrade, but many more postpolicy students were re-tained in eighth grade (see Figure 2). Therefore, whilethe postpolicy retention effect on dropout rates seemsto be much smaller than the prepolicy effect—either
DROPOUT RATES IN CHICAGO 17
50
45
40
35
30
25
20
15
10
5
0
-2 -1 0 1 2 3 4
Perc
ent
Underlying Achievement Scores (in standard deviation units)
Retention and Dropout Rates at Age 17 by Achievement, Postpolicy Students Included in Test Reporting
Percent of postpolicy students whodropped out by age 17
Prepolicy dropout rates* Percent of postpolicy studentsretained in eighth grade
* The prepolicy line is a regression line showing the prepolicy relationship between achievement and dropping out. The prepolicy dropout rates are adjusted for changes in the demographic composition of students postpolicy by applying regression coefficients from models with only prepolicy students to pospolicy students, and plotting their probability of dropping out based on the prepolicy relationships. Only students included in test reporting and in 8th grade at age 13 were used for these calculations to improve precision in estimation. Similar trends are seen if students old-for-grade at age 13 are included, but there is more uncertainty in measurement.
Retained postpolicy
Dropped out postpolicy
Dropped out prepolicy
Difference between the postpolicy dropout rate and the prepolicy rate for students withsimilar levels of achievement (about 10 percent times the percentage of students retained)}
Figure 4
because of the different context of retention or be-cause spurious factors are minimized postpolicy, orboth—its total impact on systemwide dropout rateswas larger than prepolicy retention.
While the vast majority of postpolicy students wereretained because of low test scores, some were retainedfor other reasons, as in prepolicy years. These students’potential for dropping out was likely more similar tothat of prepolicy students held back in eighth grade.Therefore, the postpolicy retention effect must be ad-justed to estimate the effect of retention at the pro-motion gate. If it is assumed that the same percentageof postpolicy students would have been held back with-out high-stakes testing as were held back in prepolicyyears,9 and that the dropout rate for these studentswas the same as prepolicy (because they would have
been retained for similar reasons), then retention fromhigh-stakes testing is estimated to have increased theprobability of dropping out from 30.8 percent to 38.8percent for a typical retained student.10
While 8 percentage points may seem small, it is a26 percent increase in the likelihood of dropping outby age 17. Furthermore, if students are followed untilage 19, the effect is proportionately larger. Modelingdropout rates by age 19, without the last two postpolicycohorts, produces an estimate that dropout rates amongstudents retained by the promotion gate were 13percentage points higher than among similarnonretained students—57 percent, compared to 44percent, which is a 29 percent increase in the likeli-hood of dropping out.
18 CHARTING REFORM IN CHICAGO
John Booz
3C H A P T E R
19
Did Retention at the Gate Lead Students toDrop Out at an Earlier Age Than TheyWould Have without the Gate?Students held back by the promotion gate were not especially likelyto drop out at early ages; instead, their likelihood of dropping outwas elevated for the remainder of their time in school.
To determine whether retention from high-stakes testing affectedthe timing of dropping out, as well as the likelihood of droppingout, a specialized statistical analysis was performed to predict the
hazard of dropping out at each age, from 15 to 17.1 This analysis adjusteddropout rates for changes in achievement, demographic characteristics,and school enrollment, so that the retention-dropout relationship couldbe compared between prepolicy and postpolicy students (see the Appen-dix for details). Figure 5 displays dropout rates for students with averagedemographic and achievement characteristics, calculated from the sta-tistical model. The dropout rates are smaller than those shown earlierbecause these rates are the percentage of students who dropped out ateach age, instead of by age 17. For example, among nonretained stu-dents, 7 percent dropped out by age 15, 10 to 11 percent of the re-maining students dropped out at age 16, and 13 percent of theremaining students dropped out at age 17.2
20 CHARTING REFORM IN CHICAGO
Consistent with studies ofteacher-initiated retention,prepolicy students who were re-tained in eighth grade were notonly much more likely to dropout of school than other students,but they were also more likely todrop out early. Only about 1 per-cent of prepolicy students in-cluded in test reporting and ineighth grade at age 13 were heldback in eighth grade. But 26 per-cent of those students droppedout by age 15, compared to only7 percent of nonretainedprepolicy students. Prepolicy, therelationship between eighth-graderetention and the hazard of drop-ping out was significantly smallerat older ages. In contrast,postpolicy, eighth-grade retentionwas not associated with a greaterlikelihood of dropping out at age15 or 16 than it was at age 17.Instead, postpolicy students’ like-lihood of dropping out was el-evated throughout theirremaining years in school. At eachage, they were about 3 to 4 per-cent more likely to drop out thanother postpolicy students withsimilar demographic and achieve-ment characteristics. It should benoted, however, that whilepostpolicy retained students didnot drop out at earlier ages, theydid drop out at earlier grades.Because their entry into highschool was delayed, students hadless time to accumulate high-schoolcredits before they dropped out.3
Figure 5
John Booz
Perc
ent
of s
tud
ents
wh
o d
rop
ped
ou
t at
eac
h a
ge
Age 15 Age 16 Age 17 Age 15 Age 16 Age 17
Note: Dropout rates have been calculated from event history models with variables controlling for student race, gender, SES, and achievement. Only students included in test reporting who were in eighth grade at age 13 were included in the estimations. Models with old-for-grade students show the same trend.
Dropout Rates at Each Age by Eighth-Grade Retention: Prepolicy and Postpolicy Students Included in Test Reporting
30
25
20
15
10
5
0
Promoted students Students retained in eighth grade
7%
26%
10%
22%
13%
20%
7%
10%11%
15%
13%
17%
Prepolicy(1 percent of students retained)
Postpolicy(8 percent of students retained)
4C H A P T E R
21
Did Simultaneous Improvements inStudent Achievement Lead More Students toStay in School?Rising achievement was associated with a decline in dropout ratesof 1.3 percentage points averaged over the four postpolicy cohorts,and almost 4 percentage points by the fourth postpolicy cohort.This decline in dropout rates among the 90 percent of studentsnot retained by the gate more than balanced the increase in drop-out rates among the 10 percent of students retained.
Retention rates rose with the policy, and postpolicy retention ap-pears to have increased students’ risk of dropping out. Yet, overall dropout rates did not rise with implementation of the policy.
The primary reason for this was a countervailing trend of increasing achieve-ment. While there has been debate about whether the rise in achievementseen after 1995 reflects real learning versus testing effects, the rise in theunderlying achievement measure appears substantive, given that its rela-tionship to dropout rates did not change after policy implementation.Whether it is attributable to the policy is a different question.
Figure 6 demonstrates the relationship between achievement and drop-out rates by taking the 1992 cohort (both retained and promoted stu-dents), and estimating what that cohort’s dropout rate would have beenhad its achievement been the same as seen in subsequent cohorts.1 Theeffect of rising achievement on dropout rates is not large—about 1.3 per-cent fewer students dropped out, on average, over the four postpolicy co-horts than would be expected if achievement remained the same. The 1998
22 CHARTING REFORM IN CHICAGO
Figure 6
cohort, which had the highest achievement, should have had dropout ratesthat were 3 to 4 percentage points higher if achievement had remained at1992 levels. However, while the achievement effect on dropout rates wasnot large, the slight decline in dropout rates among the 90 percent of stu-dents who were not retained by the gate more than balanced the increasein dropout rates among the 10 percent of retained students. As a result,overall dropout rates did not rise with implementation of the promo-tion gate.
What Was the Net Effect of Rising Retention Rates and RisingAchievement for Retained and Nonretained Students?
Improvements in achievement were seen across all students, including thosewith low achievement who were at risk of retention by the promotion gate.Among retained students, the increase in achievement should have low-ered dropout rates by as much as 3.3 percentage points across four cohorts,from 44.0 percent to 40.7 percent.2 Improvements in achievement were
largest in the later cohorts, so theestimates of achievement effectson dropout rates among retainedstudents range from a decline of1.2 percentage points with the1995-96 cohort, to as much as 6.1percentage points with the 1998-99 cohort. These estimates maybe high because of selection bias,however, since more students wereexcluded from test reportingpostpolicy. If adjusted for themaximum potential selection ef-fect, the estimate for the 1998-99cohort drops to 3.5 percentagepoints.3 With either estimate, forstudents retained under high-stakes testing, the adverse effectson dropping out from retention(averaging about 8 percentagepoints of an increased probabil-ity of dropping out) outweighedany potentially beneficial impactof improving achievement.Among promoted students,postpolicy improvements inachievement should have resultedin a decline in dropout rates of1.8 percentage points (24.3 per-cent compared to 22.4 percent),averaged across the postpolicycohorts. The improvements inachievement were largest in thelater cohorts, so estimates of theachievement effect on dropoutrates among promoted studentsrange from a decline of 0.7 per-centage points with the 1995-96cohort, to as much as 3.4 per-centage points with the 1998-99 cohort.4
Perc
ent
dro
pp
ed o
ut
by
age
17
1992-93Actual
dropoutrate
With 1993-94
achievement
With 1994-95
achievement
With 1995-96
achievement
With1996-97
achievement
With1997-98
achievement
With1998-99
achievement
Note: There may be selection bias in these calculations. They are based on the sample of students included in testing and in eighth grade at age 13. Four percent more students were excluded from testing or were old-for-grade with the 1998-99 cohort. This is equivalent to 6 percent of the 67 percent of included on-grade students in the 1992-93 cohort. If the bottom 6 percent of scores are removed from the 1992-93 cohort average, the dropout rate would be 24 percent for the 1992-93 cohort, which would be the maximum possible effect of the bias.
1992-93 Cohort Dropout Rate and Expected Rate if AchievementEqualed the Achievement of Subsequent CohortsStudents Included in Test Reporting and in Eighth Grade at Age 13
30
25
20
15
10
5
0
Estimated dropout rate if achievement equaled achievement of later cohorts
25.8% 25.5% 25.0% 24.1% 23.5%22.4%
21.1%
5C H A P T E R
23
Were Dropout Trends Different forSubgroups of Students?Students already old-for-grade at age 13 were the most adverselyaffected by the policy—one-quarter were held back by the gate,and 78 percent of these retained students dropped out of school byage 19. Racial disparities in dropout rates also grew postpolicy,and this was partially attributable to the promotion gate.
Not all students faced the same likelihood of being retained by thepromotion gate, and improvements in achievement were notthe same among all groups. Therefore, trends in dropout rates
varied across subgroups of students. Only low-achieving students who wereincluded in test reporting were at substantial risk of being held back by thepolicy, and for these students the odds of dropping out grew. For otherstudents, the likelihood of dropping out decreased, on average, as achieve-ment improved.
Students Old-For-Grade before Reaching Eighth GradeIn each cohort, about 15 percent of the students included in test reportinghad not yet made it to eighth grade by the time they were 13-years-old.Most of these students had been retained in grade at an earlier point inschool, so they were in sixth or seventh grade at age 13. Postpolicy, thesestudents were much more likely to be retained by the promotion gate thanstudents who had reached eighth grade by age 13. They were at high riskof failing the gate because their achievement, on average, was very low. Inaddition, some students already old-for-grade at age 13 never even had theopportunity to pass the promotion gate because they were moved intotransition centers before reaching the eighth grade. These students weretoo old to remain in elementary school and they were no longer allowed to
24 CHARTING REFORM IN CHICAGO
move directly into high school. In the transition cen-ters, students received intensive remedial study of read-ing and math, but took few courses that would allowthem to accumulate credits for high school gradua-tion. Prior to the promotion-gate policy, students whowere too old to remain in elementary school moveddirectly into high school. Across the four postpolicycohorts, 24 percent of students old-for-grade at age13 were in some way delayed from entering high schoolbecause of the promotion gate—either they were re-tained in eighth grade, or they enrolled in a transitioncenter instead of a high school. In comparison, lessthan 1 percent of the old-for-grade students in the1992-93 cohort were held back in eighth grade.
Because postpolicy retention rates were very highamong students already old-for-grade at age 13 (24percent, compared to 8 percent of on-grade students),their dropout rates were higher postpolicy thanprepolicy, despite higher achievement, on average, in
postpolicy cohorts.1 Figure 7 shows dropout rates bycohort for students already old-for-grade at age 13.Among these students, dropout rates rose steadilyacross cohorts and then declined to prepolicy levelswith the 1998-99 cohort. This decline may be a selec-tion artifact as more students were excluded from testreporting in this cohort than in others. This cohortwas the first to face the sixth-grade promotion gate,and there is evidence that some students who failedthe sixth-grade gate were reclassified into special edu-cation and excluded from test reporting by the springof their eighth-grade year.2
The increase in the likelihood of dropping outamong students already old-for-grade at age 13 is es-pecially distressing because these students were alreadyvery likely to drop out before being held back an addi-tional year. By age 19, 78 percent of the students old-for-grade at age 13 who were retained by the promotiongate had dropped out of school.
Figure 7
Perc
ent
* All of the old-for-grade students in the 1994-95 cohort were subject to the eighth-grade promotion gate because they had not yet made it to eighth grade before the 1995-96 school year. Some of the members of the 1993-94 cohort were also affected by the gate.
Dropout Rates at Age 17by Inclusion in Test Reporting and Grade at Age 13
45
40
35
30
25
20
15
10
5
0
Prepolicy Postpolicy
40% 39%38%
39%
36%34% 34%
36%37%
39% 39%40% 41%
35%
26% 26% 25%26% 26%
24%
20%
Excluded from test reporting19% of prepolicy students
21% of postpolicy students
Included: old-for-grade at age 13*13% of prepolicy students
12% of postpolicy students
Included: on-grade at age 1368% of prepolicy students
67% of postpolicy students
19
92
-93
Co
ho
rt
19
93
-94
Co
ho
rt
19
94
-95
Co
ho
rt
19
95
-96
Co
ho
rt
19
96
-97
Co
ho
rt
19
97
-98
Co
ho
rt
19
98
-99
Co
ho
rt
19
92
-93
Co
ho
rt
19
93
-94
Co
ho
rt
19
94
-95
Co
ho
rt*
19
95
-96
Co
ho
rt
19
96
-97
Co
ho
rt
19
97
-98
Co
ho
rt
19
98
-99
Co
ho
rt
19
92
-93
Co
ho
rt
19
93
-94
Co
ho
rt
19
94
-95
Co
ho
rt
19
95
-96
Co
ho
rt
19
96
-97
Co
ho
rt
19
97
-98
Co
ho
rt
19
98
-99
Co
ho
rt
DROPOUT RATES IN CHICAGO 25
Students Excluded fromTest ReportingStudents excluded from test re-porting were also more likely tobe held back in eighth grade af-ter implementation of the pro-motion gate. However, thisincrease was much smallerthan among included stu-dents—increasing from 5 to 7percent in the first year of thepolicy, and then declining eachyear to below prepolicy levels bythe fourth year of the policy.3 Atthe same time, while test scoresfor excluded students cannot beprecisely compared across co-horts because of substantialshifts in test taking among ex-cluded students, the available evidence suggests thatachievement improved among excluded students as itdid among students included in test reporting. As aresult, after an initial increase in dropout rates amongexcluded students, dropout rates among excluded stu-dents declined with each postpolicy cohort (see Fig-ure 7). The decline was smallest with the 1998-99cohort, but this may be an artifact of the selection ef-fects discussed above; more students with extremelylow achievement were excluded from test reporting inthis cohort because of higher placement into specialeducation after the sixth-grade promotion gate.
Differences by Race and GenderPrior to implementation of the promotion gate,African-American students were more likely to dropout than students of other races/ethnicities in Chicago,and boys were more likely to drop out than girls. Thesedifferences grew larger postpolicy. Figure 8 shows pre-and postpolicy dropout rates by race and gender, with-
Perc
ent
Female Male Female Male Female Male
Pre- and PostPolicy Dropout Rates by Age 17 by Race and GenderAll Students
40
35
30
25
20
15
10
5
0
Prepolicy Postpolicy
9.7%
6.6%
12.2% 11.9%
26.7% 27.0%
35.7% 35.0%
27.5%
23.6%
30.4%
28.3%26.8%
21.6%
29.8%
27.3%
Female Male
Asian African-American Latino White
out any adjustments for achievement, retention, schoolenrollment, or demographic characteristics. While themajority of students in CPS are African-American, thepostpolicy decline in dropout rates only occurredamong students of other racial-ethnic groups. Amongnon-African-American students, girls showed moreimprovements in dropout rates than boys. Nagaokaand Roderick (2004) provide an analysis of retentionrates by race and gender, and these retention rate dif-ferences explain some of the variability in dropout-rate trends, particularly differences by race.4 There werea number of other factors that also likely contributedto the differences by race and gender, including changesin school-level accountability, which primarily affectedpredominantly African-American high schools, andchanges in welfare policy and teenage birthrates, whichprimarily affected girls.5 While the evidence does notsuggest that the promotion-gate policy was respon-sible for all of the race and gender differences in drop-out-rate trends, the policy did exacerbate thedifferences that existed prepolicy.
Figure 8
26 CHARTING REFORM IN CHICAGO
I N T E R P R E T I V E S U M M A R Y
27
The implementation of an eighth-grade promotion gate in Chi-cago was not accompanied by a massive rise in overall dropoutrates as feared by opponents to the policy. However, overall drop-
out rates also did not decline substantially despite considerable increasesin student achievement. Retention at the promotion gate increased low-achieving students’ likelihood of dropping out. But a slight decline in drop-out rates among the vast majority of students who were not retained by thegate balanced the adverse effect of retention so that, overall, dropout ratesdid not rise.
The effect of high-stakes testing-based retention on students’ risk ofdropping out contrasts sharply with the results from teacher-initiated re-tention studies. While prepolicy retention showed a very strong associa-tion with dropping out similar to that found in studies on teacher-initiatedretention, the effect of retention due to the gate was one-third as much.Likewise, while prepolicy eighth-grade retention was found to be stronglyassociated with dropping out early, as has been found in studies of teacher-initiated retention, retention resulting from the promotion gate was not.These discrepancies may result from the different context of retention underhigh-stakes testing. For example, because large numbers of students wereretained, some of the psychological effects of retention may have beenminimized. Teachers also may have been more responsive to the educa-tional needs of large groups of retained students than they would have
28 CHARTING REFORM IN CHICAGO
been to individuals. Alternatively, the discrepancy mayresult because postpolicy retention was primarily basedon one criterion—low achievement, and that factorcould be statistically controlled when measuring theretention effect. Teacher-initiated retention often oc-curs because a student is behaving in ways indicativethat they are already disengaging from school (e.g.,poor attendance or declining academic performance).1
The prepolicy relationship, and those found in stud-ies of teacher-initiated retention, are likely inflated byspurious factors.
Still, while this analysis found smaller retentioneffects than have been found with teacher-initiatedretention, and the majority of students were not hurtby the policy, for some students it was the decidingfactor that eventually led them to drop out. It likelyhad an immediate effect on students who were alreadyfairly disengaged from school,2 and subsequent effectson other students as they struggled to graduate in lateryears. CPS high school course failure rates are high,3
so a year delay makes it even more difficult for stu-dents to graduate by age 18 or even 19. As studentsweigh the likelihood of graduating with other factors(e.g., if they view the school environment as threaten-ing4 or adult concerns become pressing5) it may notseem worthwhile to continue. In addition, becauseretention delayed students’ entry into high school, stu-dents who were held back by the gate had less time toaccumulate high school credits before dropping out.Therefore, although not studied here, recovery maybe more difficult for those postpolicy dropouts whoeventually attempt to return to school.
Using the threat of retention to motivate studentlearning has negative consequences for students whodo not pass the promotion criteria. It penalizes the
lowest-achieving students in an attempt to motivateall students to perform better. And is the cost equal tothe gain? If all of the growth in achievement is attrib-uted to high-stakes testing, then the gains balance thecosts—overall dropout rates declined despite higherrates of retention. However, even if all of the achieve-ment growth were attributed to the promotion gate,its effect on dropout rates was fairly modest. Whilethe rise in eighth-grade achievement was very large,this rise in achievement was associated with a declinein dropout rates of only 1.3 percentage points, aver-aged over the four postpolicy cohorts, or as much as 4percent by the final cohort. While the relationshipbetween achievement and dropping out is strong, it isfar from deterministic. In Chicago, even high-achiev-ing students drop out at high rates.6 Improving achieve-ment alone, without accompanying school reform willnot drastically lower overall dropout rates. Further-more, if rising achievement resulted mostly from otherpolicies or practices, then the net effect of high-stakestesting on dropout rates was adverse.
It is very likely that some or all of the gains in stu-dents’ test scores were due to factors other than high-stakes testing. Estimates of achievement used here wereadjusted for one-time testing effects, such as motiva-tion to perform well at the gate.7 However, estimateswere not adjusted for real improvements in studentlearning that occurred because of policies other thanhigh-stakes testing. A number of other policies couldhave affected student achievement over this period,including Chicago’s initiative for school accountabil-ity that coincided with implementation of the pro-motion gates and school improvements that occurredwith the decentralization of Chicago’s schools in 1988and mayoral control in 1995. The rise in achievementamong students who did not face the promotion-gatecutoff (i.e., those excluded from test reporting) itselfsuggests that achievement likely rose for reasons otherthan the threat of retention. Furthermore, in Chicago,high-stakes testing did not rely on the threat of reten-tion alone to improve achievement. Beginning in the1996-97 school year, and expanding each of the fol-
. . . for some students [the reten-tion policy] was the deciding factorthat eventually led them to drop out.
DROPOUT RATES IN CHICAGO 29
lowing years, Chicago offered extensive support to low-achieving students through after-school and summer-school programs. Only those cohorts that had accessto these programs, the third and fourth cohorts throughthe gate, showed a decline in dropout rates.8
Regardless of the source of the achievement effect,for students retained by the promotion gate, retentionhad a larger consequence than improving achievementon their odds of remaining in school. As a result, stu-dents with very low achievement were even less likelyto graduate than before the policy was implemented.Students already old-for-grade before reaching theeighth-grade gate were particularly likely to be affectedadversely. Racial gaps in school completion also grewafter implementation of the gate as dropout rates im-proved among all but African-American students. Evenif all of the increases seen in achievement were attrib-uted to the promotion gate, it could not be viewed asan effective tool for reducing dropout rates amongthose groups of students most likely to drop out.
In addition, the very high dropout rates among stu-dents already old-for-grade who failed the eighth-gradetest suggest that the combined effects of the gates atthird, sixth, and eighth grade may be more adversethan that of the single gate in the eighth grade. Moretime is needed before any effects of the third- and sixth-grade promotion gates on dropout rates can be dis-cerned, since students subject to these gates are stilltoo young to be likely to drop out. However, studentswho failed the gates in the early grades are at high riskto fail subsequent gates. Nagaoka and Roderick (2004)found no evidence that retention had a beneficial ef-
fect on their achievement growth, yet the multipledelays in grade progression will make it difficult forthese students to eventually graduate.
While overall dropout rates decreased with the pro-motion gate, the gate had adverse effects on the mostvulnerable students, and, at best, only modest ben-eficial effects on other students’ likelihood of com-pleting high school. This is not strong support forthe policy.
Chicago has begun to address some of the prob-lems of the eighth-grade gate. In the 2003-04 schoolyear, CPS moved some of the former transition cen-ters into high schools, as schools-within-schools, sothat students who are more than two years behindgrade level can begin to accumulate credits towardgraduation, and so that they do not have to makemultiple school transitions. This seems like a promis-ing step, although it affects only students who werealready old-for-grade before failing the gate. A similarstrategy might be considered for students who werenot already behind in school so that they are not pushedbehind by repeating the eighth grade. In their reporton achievement effects of promotion gates, Nagaokaand Roderick (2004) discuss some alternatives to pro-motion gates, including focused interventions to sub-stitute for retention,9 and earlier diagnosis andintervention of learning problems. Until it is knownthat the threat of retention itself was responsible forimprovements in student motivation and achievement,rather than other aspects of the policy and otherchanges in system policies, such alternatives should beconsidered.
30 CHARTING REFORM IN CHICAGO
A P P E N D I X
31
Statistical Models and OutcomesThe HLM models of retention effects are shown below and in Table 1. While not shown here, the achievementcoefficients are the same as from models of pre- and post-policy nonretained students with only demographicand achievement variables. These preliminary models provided evidence that the relationship between latentachievement and dropout was the same across cohorts, once retained students were removed. Analysis of residu-als from the preliminary models showed no difference in the underlying achievement-dropout relationshipbetween prepolicy and postpolicy students, even among students with very low achievement, among studentswho were not retained in eighth grade. This provided substantial evidence that the relationship between under-lying achievement and dropout was not affected by the policy. 1 Coefficients from the model displayed in Table1 were compared to those of the preliminary models, and found to be the same, providing confirmation that theretention and achievement coefficients were not misestimated because of collinearity between those variablespostpolicy. Further details on these analyses are available from the Consortium on Chicago School Research at:www.consortium-chicago.org.
Analyses were run using HGLM.2 The model presented in Table 1 is:
η β β β β
β β β β
β β
β β
dropout ij j j ij j ij j ij
j ij j ij j ij j ij
j ij j ij
j ij j
Male Native American Asian
African American Latino Poverty Social Status
Special Education th Grade Underlying Achievement
Achievement
( ) = + + +
+ + + +
+ +
+ +
0 1 2 3
4 5 6 7
8 9
102
11
8
( ) ( ) ( )
( ) ( ) ( ) ( )
( ) ( )
( ) (
AchievementAchievement Retained In th Grade
Post Policy Cohort Postpolicy Retained In th Grade
Postpolicy Special Education
u
ij j ij
j ij j ij
j ij
j j
j
j
312
13 14
15
0 00 0
1 10
15 15 0
8
8
) ( )
( ) ( )
( )
+
+ + ×
+ ×
= +
=
=
β
β β
β
β γ
β γ
β γ
M
32 CHARTING REFORM IN CHICAGO
Changes in the timing of dropping out were measured with a discrete-time event history analysis, performedwithin HLM. The models, and resulting coefficients, are shown below and in Table 2. The model for Table 2 is:
Where Table 1: Model Predicting Log Odds of Dropping Out by Age 17, Students Who Reached Eighth Grade by Age 13
Postpolicy .030 (.028)Postpolicy x Retained in Eighth Grade -.622 (.136) ***Postpolicy x Special Education Student -.059 (.115)
Level-2 Variance Explained 44.4%
*p<.05, **p<.01, ***p<.001
All control variables except those for retention and post-policy were centered around zero prior to analysis, so that the intercept would represent the typical student. Metric variables were standardized. Only students included in the testing program and on-grade at age 13 were included in this analysis.
(s.e.)( )[ ]
ijijijϕϕη −= 1/log
),1(~| ijijij BY ϕϕ
η β β β β β
β β β β
β β
β
dropout ij j j ij j ij j ij j ij
j ij j ij j ij j ij
j ij j ij
j
Age Age Male Native American
Asian African American Latino Poverty
Social Status Special Education
th Grade
( ) = + + + +
+ + + +
+ +
+
0 1 2 3 4
5 6 7 8
9 10
11
15 16
8
( ) ( ) ( ) ( )
( ) ( ) ( ) ( )
( ) ( )
(
UnderlyingUnderlying Achievement Achievement
Achievement Age x Achievement
Age x Achievement Squared Age x Achievement
Age x Achievement Age x Achievement
Age x
ij j ij
j ij j ij
j ij j ij
j ij j ij
j
) ( )
( ) ( )
( ) ( )
( ) ( )
(
+
+ +
+ +
+ +
+
β
β β
β β
β β
β
122
133
14
15 163
17 182
19
15
15 15
16 16
16 AchievementAchievement Retained In th Grade
Age Retained Age Retained
Post Policy Cohort Age Postpolicy Age Postpolicy
Postpolicy Retained Age
ij j ij
j ij j ij
j ij j ij j ij
j ij j
320
21 22
23 24 25
26 27
8
15 16
15 16
15
) ( )
( ) ( )
( ) ( ) ( )
( ) (
+
+ × + ×
+ + × + ×
+ × + ×
β
β β
β β β
β β
Postpolicy Retained
Age Postpolicy Retained Postpolicy Special Education
u
ij
j ij j ij
j j
j
j
×
+ × × + ×
= +
=
=
)
( ) ( )β β
β γ
β γ
β γ
28 29
0 00 0
1 10
29 29 0
16
M
DROPOUT RATES IN CHICAGO 33
1 It is possible that those low-achieving postpolicy students who were not retained were less likely to drop out for some unmea-sured reason, and so do not accurately represent the actual achievement-dropout relationship postpolicy. However, all availableevidence suggests that this is not the case. First, nonretained postpolicy students were not a small, select group, but the majorityof students. Even at the lowest levels of latent achievement, only about half of postpolicy students were retained in eighth grade.Second, an analysis of students who were “waived” through the gate (i.e., promoted despite failing the cutoff ) showed that thesestudents were not less likely than other students with the same latent achievement to drop out, suggesting that there was not a“waiver” bias in estimation. Third, the consistency of the latent achievement-dropout relationship among nonretained studentsacross cohorts makes sense, given that the policy should not have affected these students’ dropout rates, beyond any effect itmight have had on their achievement.2 See chapter 10 in Raudenbush and Bryk (2002) for details on this type of model.
),1(~| ijijij BY ϕϕ
)]1/(log[ijijijϕϕη −=Where Table 2: Event History Models Predicting
Retained in Eighth Grade .520 (.148) *Age 15 x retained .994 (.239) ***Age 16 x retained .455 (.169) **
Postpolicy -.007 (.029)Age 15 x postpolicy -.085 (.045)Age 16 x postpolicy .153 (.033) ***Postpolicy x retained -.187 (.164)Age 15 x postpolicy retained -.825 (.229) **Age 16 x postpolicy x retained -.459 (.185) *Postpolicy x special education -.140 (.094)
Level-2 Variance Explained 35.9%
*p<.05, **p<.01, ***p<.001
All control variables except those for age, retention, and post-policy were centered around zero prior to analysis, so that the intercept would represent the typical student. Metric variables were standardized. Only students included in the testing program (i.e., subject to the eighth grade promotional gate if in post-policy cohorts) were included in this analysis.
Coeff. Standard error
34 CHARTING REFORM IN CHICAGO
E N D N O T E S
35
Introduction1 For details on the policy, see the sidebar, “How the Policy Works” and also Roderick,et al. (1999).2 These numbers include all students who repeated eighth grade or enrolled in atransition center, including double-retainees and students who entered CPS througha transition center.3 e.g., Alexander, Entwisle, and Kabbani (2001); Barro and Kolstak (1987); Grissomand Shepard (1989); Roderick (1994); and Rumberger (1995).4 Goldschmidt and Wang (1999); Roderick (1994).5 Allensworth and Easton (2001).6 Achievement has been shown consistently to be strongly related to dropout rates(e.g., Alexander, Entwisle, and Kabbani [2001]; Grissom and Shepard [1989]; andPallas [1987]).7 Summaries of the debate over the implications of high-stakes testing on dropoutrates are available from the National Research Council (2001) and Rabiniwitz,Zimmerman, and Sherman (2001). The conclusion of both is that more research isneeded.8 There are studies that have looked at the effects of 12th-grade graduation exams ondropping out (Griffin and Heidorn [1996]) and Kreitzer, Madaus, and Haney [1989].However, these extras affect students at the end of their academic career and shouldhave different effects than those that determine grade promotion.
Chapter I1 Special–education classification increased substantially with enactment of the pro-motion gate, and the grades in which students were classified shifted. Details on thisphenomenon are available in Gladden and Miller (2002).2 Promotion standards for students in special education were determined by their IEP.Administrative records show that retention rates among excluded students did notincrease substantially with implementation of the eighth-grade gate. They rose slightly(from 5 to 7 percent) in the first year, and then declined each following year, reachingbelow prepolicy levels by the 1998-99 cohort.3 Averages for excluded students may have been substantially affected by selectionbias; many more students excluded from reporting were tested in the later cohorts, sopostpolicy averages include many students who would not have been tested in previ-ous years. Furthermore, these students’ scores were excluded from reporting preciselybecause they were not meant to be compared to those of other students. Both in-cluded and excluded averages are also affected by the increasing rates, postpolicy, of
36 CHARTING REFORM IN CHICAGO
exclusion from test reporting, particularly with the 1998 co-hort. In the 1998 cohort (the cohort with the highest exclu-sion rates), 3 percent more students were excluded from testingthan were excluded prepolicy. To find the maximum possiblediscrepancy due to the selection effect, the 1992-93 cohortaverage could be calculated without the lowest-achieving 4percent of students. (Three percent of the entire cohort wouldbe 4 percent of the 80 percent of students included in testreporting.) This would shift the 1992 average for includedstudents from -.104 to -.034.4 The standard deviation of underlying achievement for the1992 cohort alone is very similar to that across all cohorts(.985).5 Over the seven cohorts, relatively more students were Latinoand fewer were African-American or white. Additionally, stu-dents’ average economic status increased. These changes shouldhave lowered dropout rates. On average, students with eco-nomically-advantaged backgrounds tend to have lower drop-out rates than students from economically-disadvantagedbackgrounds. Overall, dropout rates in Chicago are highestamong African-American students, followed by Latino stu-dents, white students, and then Asian students. Once economicstatus and school enrollment are controlled, white studentshave the highest dropout rates, followed by Latino students,African-American students, and Asian students.6 There are substantial school effects on dropout rates (Brykand Thum [1989]; Goldschmidt and Wang [1999]).7 Statistical controls were done through hierarchical linearmodels (HLM), which adjusted dropout rates for changes inthe composition of students based on race, gender, and socio-economic status as measured by economic indicators from cen-sus data of students’ residential block groups. See the Appendixfor a description of the basic models.8 For details on high-school redesign plans, see Chicago PublicSchools (1997).9 For details on high-school redesign and an analysis of its ef-fectiveness, see Hess (2002). For an analysis of trends in creditaccumulation and graduation rates, see Miller, Allensworth,and Kochanek (2002).10 Hess and Cytrynbaum (2002) found that high schools onprobation showed no significant improvements in instructionor improvements in personalism. To the contrary, the focus onreading that came about from probation status resulted in lessattention paid to other curricular topics while not improvingsubstantially the reading ability of high-school students.11 See Bryk (2003) for elaboration on this theory.12 Kidscount (2003).
Chapter 21 The prepolicy relationship between achievement and reten-tion was small (-.05) compared to postpolicy (-.32), amongstudents included in test reporting.2 The issue is complicated by the nonlinear relationship be-tween achievement and the probability of dropping out.
3 “Underlying achievement” is the term used in this report forthe measure of latent achievement obtained from HLM mod-els that adjusted students’ eighth-grade score for exceptionallylow or high performance, based on their scores from earliergrades.4 The achievement-dropout relationship was virtually the sameamong nonretained students pre- and postpolicy (within onestandard error), with linear terms of -.323 (.039) and -.297(.033), respectively. When retained students are included, therelationship appears stronger postpolicy because the retentioneffect is incorporated into the achievement-dropout relation-ship.5 It might have been that those students who remained withlow achievement postpolicy were also those that were mostlikely to drop out (e.g., because they were those most disen-gaged from school). However, if this were the case, the rela-tionship between latent achievement and dropping out shouldhave been stronger postpolicy, especially among students withvery low achievement, and it was not. Analysis of residualsfrom models with only achievement and demographic vari-ables, using students not retained by the gate, shows no differ-ence between prepolicy and postpolicy students in therelationship of latent achievement with dropping out, evenamong students at the lowest levels of achievement. It was alsopossible that those postpolicy students with very low achieve-ment who were not retained were also those who were lesslikely to drop out because of some unmeasured characteristic.This would be especially true if they were a small subset of thetotal number of postpolicy students. However, they are not asmall subset—at even the very lowest levels of achievement,only about half of postpolicy students were retained in eighthgrade. Overall, 90 percent of postpolicy students were not re-tained. Furthermore, if postpolicy students who were not re-tained were a special subset of students who were less likely todrop out than average because of some unmeasured character-istic, they should have been less likely to drop out than prepolicystudents with the same latent achievement. But another analysisshowed that students waived through the gate were as likely todrop out as prepolicy students with the same latent achieve-ment.6 Students not yet in eighth grade when 13-years-old were takenout of these estimates because many had irregular testing andgrade-progression patterns which introduce error into mea-surement of the retention effect. Separate analyses of old-for-grade students show a similar retention effect to that of on-gradestudents.7 This is estimated from the statistical model, with achieve-ment one standard deviation below the mean, which is typicalfor retained students.8 This difference in retention effects may result because reten-tion resulting from high-stakes testing was qualitatively verydifferent than teacher-initiated retention. It also may resultbecause much of the prepolicy relationship is actually attrib-utable to spurious factors. Many of the same factors that causestudents to be held back in school may also contribute to theirdecisions to drop out (e.g., lack of engagement, low schoolattendance). It is unlikely that studies of teacher-initiated re-
DROPOUT RATES IN CHICAGO 37
tention have sufficiently controlled for these spurious factors.One advantage in this study is that postpolicy retention deci-sions were primarily based on one criterion (test scores), whichcould be statistically controlled.9 This is 0.88 percent of the cohort included in testing and on-grade at age 13.10 Postpolicy, 7.8 percent of students included in testing andin eighth grade at age 13 were retained in eighth grade, but0.88 percent of the total cohort (which is 11.3 percent of the7.8 percent held back) would likely have been retained with-out the high-stakes testing policy. If 11.3 percent of thepostpolicy retained students had the same likelihood of drop-ping out as students retained prepolicy, then the retention ef-fect due to high-stakes testing is: [.433 – .113 (1.054)] / .887.
Chapter 31 This was done through a discrete-time-event history analysisusing hierarchical linear models. As with the previous models,the analyses included only students who were not old-for-gradeat age 13 and had test scores included in test reporting. Sepa-rate analyses for students who were old-for-grade at age 13 areavailable from the author.2 Students who dropped out between age 13 and 15 were clas-sified as 15-year-old dropouts because their numbers were sosmall.3 Postpolicy, 21 percent of students who dropped out by age17 never made it to high school. This compares to 15 percentof prepolicy dropouts.
Chapter 41 These calculations were made by comparing differences inthe latent achievement of all students with test scores acrossthe cohorts, adjusted for changes in demographic composi-tion that could have affected achievement. On average, latentscores were .280 standard deviations higher postpolicy thanprepolicy, adjusted for changes in demographic characteristics(.286 without adjustments). The achievement coefficients comefrom models of nonretained students that have only coeffi-cients representing demographic variables and achievement,but they are also equivalent to the coefficients in the full modelin the Appendix. Scores were compared among students withthe same class rank so that differences in achievement gains bylow- and high-achieving students could be discerned. Selec-tion bias was an issue in these calculations because only stu-dents included in test reporting and in eighth grade at age 13were included as they were based on test-score data analysis.Therefore, the figure includes a note with an estimate of themaximum extent to which this bias could exist.2 The estimate of the achievement effect varies across studentsaccording to: 1) their overall probability of dropping out givenother factors; and 2) the extent to which achievement improvedacross the cohorts among students with similar class rank. (Be-cause the gate should have had the largest effects on achieve-
ment among students at risk of failing the gate, achievementgrowth was compared among students with similar class rank.)This estimate is for students on-grade at age 13. For studentsold-for-grade at age 13 and retained by the gate, the combinedeffect of retention and achievement may be more adverse be-cause many of these students had extremely low achievement,and achievement gains were smallest among very-low- and very-high-performing students.3 The 3.5 percent figure assumes that the lowest-achievingprepolicy students would have been excluded if part of the1998-99 cohort.4 Adjusted for selection bias, the 1998-99 estimate is as smallas 2.7 percentage points.
Chapter 51 Underlying achievement scores showed the same improve-ments among students old-for-grade at age 13 as among stu-dents in eighth grade at age 13, with the exception of the 1998cohort. The 1998 cohort of old-for-grade students showed asmaller increase in achievement over the 1997 cohort than seenamong on-grade students. This was likely an artifact of thesixth-grade promotion gate, which made the lowest-achievingstudents in the cohort old-for-grade by age 13.2 See Miller and Gladden (2002) for details on increases inspecial-education placements at the promotion gates.3 See Miller and Gladden (2002) for a description of thesetrends.4 Differences in eighth-grade retention rates and achievementgrowth by race explain about one-third of the difference be-tween African-American and white students in postpolicy im-provements in dropout rates. The remaining differences likelyresult from school differences (see the next endnote).5 The high dropout rates among African-American studentsare explained largely by higher rates of attendance in schoolswith very high dropout rates. Because Chicago’s schools arehighly segregated by race, it is difficult to disentangle schooleffects from race effects. However, schools that were predomi-nantly (over 85 percent) African-American were much morelikely than other schools to be put on probation during theperiod studied, and this may have been related to the lack ofimprovement in dropout rates among African-American stu-dents. Schools on probation received assistance to improve theirtest scores, but faculty experienced substantial stress and un-certainty, which may have affected the climate of the schoolsin ways that were not conducive to retaining students. Furtherresearch is needed on this. Gender differences in dropout trendsare largely not explained by different retention rates or changesin achievement, particularly among white and Asian students.These gender differences may partially reflect the decline inbirths to teenage mothers that has occurred over the last sev-eral years, and changes in welfare reform that required schoolattendance.
38 CHARTING REFORM IN CHICAGO
Interpretive Summary1 In particular, the very strong relationship between middle-grade retention and dropping out (e.g., seen in Alexander,Entwisle, and Kabbani [2001] and Roderick [1994]) likely re-sults from being commonly related to disengagement fromschool. Students retained in the middle-school years tend notto have been the lowest-performing students in the early grades.Instead, their performance declined over the elementary years(see Frank and Bryk [1991]), suggesting stressors in students’lives that may have made them more likely to disengage fromschool.2 Research on teacher-initiated retention suggests it can havenegative psychological consequences, such as lowering students’self-efficacy, and increasing feelings of failure and negative at-titudes towards school that might encourage students to leaveschool (e.g., Byrnes [1989]; Campbell [1993]).3 Only about half of first-time high-school students in CPSreceive enough credits in their first year to be on-track to gradu-ate in four years (Miller, Allensworth, and Kochanek [2002]).4 Conflicts with other students and with teachers and con-cerns about safety are related to students’ decisions to dropout (Caterall [1998]; DeLuca and Rosenbaum [2000]). Manystudents in CPS schools report poor relationships with teach-ers and problems with safety in school (Sporte 2003).5 For example, family or financial responsibilities6 For example, 13 percent of the prepolicy students with testscores in the top quarter of their class dropped out of schoolby age 17, and 20 percent dropped out by age 19.7 Jacob (2002) estimated that most of the improvements intest scores after high-stakes testing in Chicago were a result ofmotivational and test-specific factors. Likewise, in their studyof the TAAS in Texas, Klein et al. (2001) found that gains onthe high-stakes test were not mirrored in the NAEP, suggest-ing that basing judgments of student achievement on high-stakes tests may be misleading. Because underlying test scoreswere used in these analyses, rather than actual eighth-gradescores, motivational factors may have been minimized in theseanalyses. Still, some of the improvements in test scores werelikely due to better preparation for the tests.
8 Unfortunately, there is little evidence on the long-term ef-fects of these programs with eighth graders. In general, eighth-grade students had very positive reports about theirsummer-school experiences, and they showed substantial short-term gains. Evidence at the third- and sixth-grade levels sug-gests that short-term gains in summer school were not sustainedover two years, but eighth-grade two-year gains could not becalculated because students no longer take the ITBS after eighthgrade. The short-term summer school eighth-grade gains werelarger than those seen in the earlier grades (Roderick, Engel,and Nagaoka, [2003]).9 For example, they note that school systems in Boston andNorth Carolina have used high-stakes tests to identify studentswho are not progressing and focus interventions on them, ratherthan retaining them.
Appendix1 It is possible that those low-achieving postpolicy studentswho were not retained were less likely to drop out for someunmeasured reason, and so do not accurately represent theactual achievement-dropout relationship postpolicy. However,all available evidence suggests that this is not the case. First,nonretained postpolicy students were not a small, select group,but the majority of students. Even at the lowest levels of latentachievement, only about half of postpolicy students were re-tained in eighth grade. Second, an analysis of students whowere “waived” through the gate (i.e., promoted despite failingthe cutoff ) showed that these students were not less likely thanother students with the same latent achievement to drop out,suggesting that there was not a “waiver” bias in estimation.Third, the consistency of the latent achievement-dropout re-lationship among nonretained students across cohorts makessense, given that the policy should not have affected these stu-dents’ dropout rates, beyond any effect it might have had ontheir achievement.2 See chapter 10 in Raudenbush and Bryk (2002) for detailson this type of model.
W O R K S C I T E D
39
Alexander, Karl L., Doris R. Entwisle, and Carrie S. Horsey. 1997. Fromfirst grade forward: Early foundations of high school dropout. Sociologyof Education, 70(2):87-107.
Alexander, Karl L., Doris R. Entwisle, and Nader S. Kabbani. 2001. Thedropout process in life course perspective: Early risk factors at homeand school. Teachers College Record, 103(5):760-822.
Allensworth, Elaine M. and John Easton. 2001. Calculating a cohort drop-out rate for the Chicago Public Schools. Chicago: Consortium on ChicagoSchool Research.
Allensworth, Elaine M. and Shazia Rafiullah Miller. 2002. Declining highschool enrollment: An exploration of causes. Chicago: Consortium onChicago School Research.
The Annie E. Casey Foundation. 2003. Teen childbearing in America’slargest cities, A KidsCount working paper. http://www.aecf.org/kidscount/childbear/cb-changes.htm.
Bryk, Anthony S. 2003. No child left behind, Chicago style. In No childleft behind? The politics and practice of school accountability, eds. Paul E.Peterson and Martin R. West. Washington DC: Brookings Institution.
Bryk, Anthony S. and Yeow Meng Thum. 1989. The effects of high schoolorganization on dropping out: An exploratory investigation. AmercianEducational Research Journal, 26(3):353-83.
Bryk, Anthony S., Yeow Meng Thum, John Q. Easton, and Stuart Luppescu.1998. Academic productivity of Chicago public elementary schools: A tech-nical report. Chicago: Consortium on Chicago School Research.
Catterall, James S. 1998. Risk and resilience in student transition to highschools. American Journal of Education, 106:302-33.
Chicago Public Schools. 1997. Design for high schools.
40 CHARTING REFORM IN CHICAGO
Dworkin, Anthony Gary, Jon Lorence, Laurence A.Toenjes, Antwanette N. Hill, Noe Perez, andMichael Thomas. 1999. Elementary school reten-tion and social promotion in Texas: An assessmentof students who failed the reading section of theTAAS. The Sociology of Education Research Group,University of Houston.
Finn, Jeremy D. 1989. Withdrawing from school. Re-view of Educational Research, 59(2):117-42.
Gladden, Robert M. and Shazia Rafiullah Miller. 2002.Changing special education enrollments: Causes anddistribution among schools. Chicago: Consortium onChicago School Research.
Gleason and Dynarski. 2002. Do we know whom toserve? Issues in using risk factors to identify drop-outs. Journal of Education for Students Placed at Risk,7(1):25-42.
Goldschmidt, Pete and Jia Wang. 1999. When canschools affect dropout behavior? A longitudinalmultilevel analysis. American Educational ResearchJournal, 36(4):715-38.
Griffin, Bryan W. and Mark H. Heidorn. 1996. Anexamination of the relationship between minimumcompetency test performance and dropping out ofhigh school. Education Evaluation and Policy Analy-sis, 18(3):243-52.
Grissom, James B. and Lorrie A. Shepard. 1989. Re-peating and dropping out of school. In Flunkinggrades: Research and policies on retention, eds. LorrieA. Shepard and M. L. Smith. New York: The FalmerPress, 34-63.
Hess, G. Alfred and Solomon Cytrynbaum. 2002. Theeffort to redesign Chicago high schools: Effects onschools and achievement. In Reforming Chicago’s highschools: Research perspectives on school and system levelchange, ed. Valerie Lee. Consortium on ChicagoSchool Research, 19-49.
Holmes, Charles Thomas and Janice Saturday. 2000.Promoting the end of retention. Journal of Curricu-lum and Supervision, 15(4):300-14.
Holmes, Charles Thomas. 1989. Grade level retentioneffects: A meta-analysis of research studies. In Flunk-ing grades: Research and policies on retention, eds.Lorrie A. Shepard and M. L. Smith. New York:Falmer Press, 16-63.
House, Ernest R. 1998. The predictable failure ofChicago’s student retention program. Boulder, CO:University of Colorado School of Education.
Jacob, Brian A. 2002. Accountability, incentives andbehavior: The impact of high-stakes testing in theChicago Public Schools, working paper 8968. Cam-bridge, MA: National Bureau of Economic Re-search.
Kaufman, Philip, Martha Naomi Alt, and ChristopherD. Chapman. Dropout rates in the United States:2000. 2001. NCES 2002-114. Washington DC:U.S. Department of Education, National Center forEducation Statistics.
Klein, Stephen P., Laura S. Hamilton, Daniel F.McCaffrey, and Brian M. Stecher. 2000. What dotest scores in Texas tell us? Rand Education Issue Pa-per, http://www.rand.org/publications/IP/IP202/
Kreitzer, Amelia E., George F. Madaus, and WaltHaney. 1989. Competency testing and dropouts.In Dropouts from school: Issues, dilemmas, and solu-tions, eds. L. Weis, E. Farrar and H. G. Petrie. Al-bany, NY: State University of New York Press, 129-52.
Miller, Shazia Rafiullah, Elaine M. Allensworth, andJulie R, Kochanek. 2002. Student performance:Course taking, test scores and outcomes. Chicago:Consortium on Chicago School Research.
Nagaoka, Jenny and Melissa Roderick. 2004. Endingsocial promotion: The effects of retention. Chicago:Consortium on Chicago School Research.
National Research Council. 2001. Understandingdropouts: Statistics, strategies, and high-stakes test-ing, eds. Alexandra Beatty, Ulric Neisser, WilliamT. Trent, and Jay P. Heubert. Board on Testing andAssessment, Center for Education. Washington,DC: National Academy Press.
DROPOUT RATES IN CHICAGO 41
Pallas, Aaron M. 1987. School dropouts in the UnitedStates. Center for Education Statistics, Washington,DC.
Rabinowitz, Stanley, Joy Zimmerman, and KerrySherman. 2001. Do high stakes tests drive up studentdropout rates? Myths versus reality. San Francisco,West Ed.
Raudenbush, Stephen W. and Anthony S. Bryk. 2002.Hierarchical linear models: Applications and dataanalysis methods, 2nd Edition. Thousand Oaks, CA:Sage Publications.
Reynolds, Arthur J. 1992. Grade retention and schooladjustment: An explanatory analysis. EducationalEvaluation and Policy Analysis, 14(2):101-21.
Roderick, Melissa. 1994. Grade retention and schooldropout: Investigating the association. AmericanEducational Research Journal 31(4):729-59.
Roderick, Melissa, Anthony S. Bryk, Brian A. Jacob,John Q. Easton, and Elaine M. Allensworth. 1999.Ending social promotion: Results from the first twoyears. Chicago: Consortium on Chicago SchoolResearch.
Roderick, Melissa and Mimi Engel. 2001. The grass-hopper and the ant: Motivational responses of lowachieving students to high-stakes testing. Journal ofEducational Evaluation and Policy Analysis, 23(3):197-227.
Roderick, Melissa, Brian A. Jacob, and Anthony S.Bryk. 2002. High stakes testing in Chicago: Effectson achievement in promotional gate grades. Educa-tional Evaluation and Policy Analysis. 24: 333-58.
Roderick, Melissa, Mimi Engel, and Jenny Nagaoka.2003. Ending social promotion: Results from SummerBridge. Chicago: Consortium on Chicago SchoolResearch.
Rosenkranz, Todd. 2002. 2001 CPS test trend review:Iowa Tests of Basic Skills. Chicago: Consortium onChicago School Research.
Rumberger, Russel W. 1995. Dropping out of middleschool: A multilevel analysis of students and schools.American Educational Research Journal, 32(3):583-625.
Sporte, Sue. 2003. Key Measures of School Development.Chicago: Consortium on Chicago School Research.
This report reflects the interpretations of its authors. Although the Consortium’s Steering Committeeprovided technical advice and reviewed an earlier version of this report, no formal endorsement bythese individuals, their organizations, or the full Consortium should be assumed.
42 CHARTING REFORM IN CHICAGO
A B O U T T H E A U T H O RA C K N O W L E D G M E N T S
Elaine Allensworth is the Associate Director for Statistical Analysis and Archives at theConsortium on Chicago School Research. Her research focuses on the structural factorsthat affect school development, as well as policy effects on high school student outcomes.She is currently analyzing system- and school-level factors that affect trends in dropoutrates, and is beginning work on students’ postsecondary outcomes. Elaine is part of theresearch team that is testing and elaborating the Consortium’s Theory of Essential Sup-ports. She holds a Ph.D. in Sociology from Michigan State University.
The author is grateful to the many individuals who provided support and assistance in theproduction of this report. First and foremost, I thank Melissa Roderick who providedencouragement and feedback throughout all stages of this work. I also particularly thankJenny Nagaoka whose work on the companion report, Ending Social Promotion: The effectsof retention, made her the best source for information about the promotion-gate policyand its consequences for students. Consortium directors provided helpful advice on earlydrafts of this report, and I would particularly like to thank John Easton, Penny Sebring,and Stuart Luppescu for their thorough reviews. I would also like to thank the two outsidereviewers, Aaron Pallas and Steve Raudenbush, for their many helpful comments. In addi-tion, members of the Consortium Steering Committee provided useful feedback, and Iparticularly thank G. Alfred Hess for his comments. I am grateful to Melissa Dean for hercareful editing and substantive review, and to Sandra Jennings for the beautiful graphicsand the design of this report. Finally, this report would not have been possible without thework of the Consortium staff in developing and maintaining the necessary data and pro-viding feedback through all stages of the analytic work. This study was made possible bythe grants supporting the core research of the Consortium from the Joyce Foundation, theJohn D. and Catherine T. MacArthur Foundation, and the Spencer Foundation.
Consortium on Chicago School Research
DirectorsJohn Q. Easton Melissa Roderick
Consortium on Chicago School Research University of Chicago
Albert L. Bennett Penny Bender Sebring
Roosevelt University University of Chicago
Anthony S. Bryk Mark A. Smylie
University of Chicago University of Illinois
at Chicago
MissionThe Consortium on Chicago School Research aims to con-duct research of high technical quality that can inform andassess policy and practice in the Chicago Public Schools.By broadly engaging local leadership in our work, and pre-senting our findings to diverse audiences, we seek to ex-pand communication between researchers, policy makers,and practitioners. The Consortium encourages the use ofresearch in policy action, but does not argue for particularpolicies or programs. Rather, we believe that good policy ismost likely to result from a genuine competition of ideas in-formed by the best evidence that can be obtained.
Founded in 1990, the Consortium is located at the Universityof Chicago.
Consortium on Chicago School Research
1313 East 60th Street, Chicago, IL 60637
773-702-3364 fax -773-702-2010
www.consortium-chicago.org
C O N S O R T I U M O N C H I C A G O S C H O O L R E S E A R C HC H A R T I N G R E F O R M I N C H I C A G O S E R I E S