17
SAFER, SMARTER, GREENER DNV GL © 2016 Advanced Energy Storage Use Cases ENERGY 1 Nellie Tong, Consultant RMCP Committee– March 15, 2017

DNV GL © 2016 SAFER, SMARTER, GREENERDNV GL © 2016
Advanced Energy Storage Use Cases ENERGY
1
Nellie Tong, Consultant
RMCP Committee– March 15, 2017

DNV GL © 2016 2
About DNV GL
DNV GL © 2016
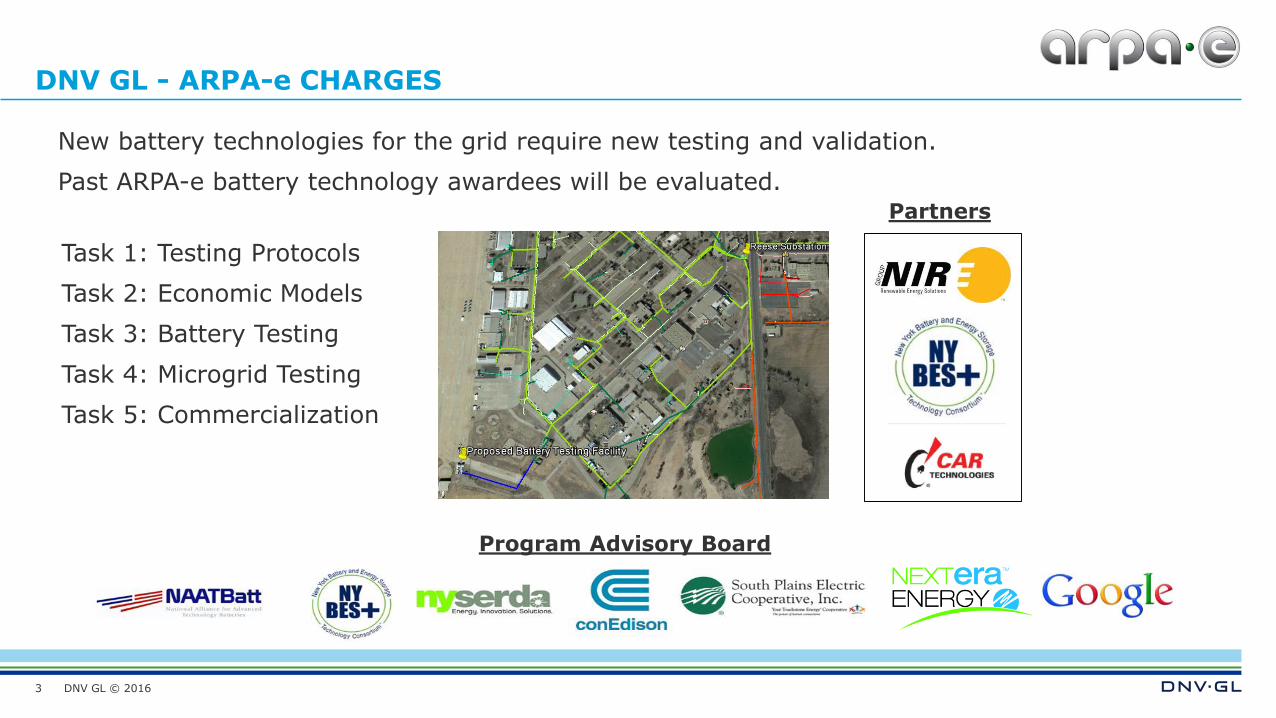
DNV GL - ARPA-e CHARGES
3
New battery technologies for the grid require new testing and validation.
Past ARPA-e battery technology awardees will be evaluated.
Task 1: Testing Protocols
Task 2: Economic Models
Task 3: Battery Testing
Task 4: Microgrid Testing
Task 5: Commercialization
Partners
Program Advisory Board

DNV GL © 2016
Zero Net Energy
What is Zero Net Energy building?
– Building with net energy consumption of zero over a typical year
Policy Drivers
– Climate goals
– Governor’s goals
– CPUC’s strategic plan
Consumer drivers
– Environmental awareness
– Bill reduction (Net energy metering)
4

DNV GL © 2016
Challenges
Excessive PV penetration and production is
creating grid and system issues
– Circuit back-feed, excessive ramping.
5
Net-metering is replaced by:
– Self supply (solar + storage)
– Expedited interconnection
– Energy sell-back to grid is forbidden and
not compensated
– Grid supply
– Limited sell-back to grid is allowed at
highly reduced rates
Similar situations expected to arise as
distribution installed renewable penetration
increases, e.g. CA, NY

DNV GL © 2016 SAFER, SMARTER, GREENERDNV GL © 20166
Advanced Application Modeling
Solar Self-Supply

DNV GL © 2016
Solar Self-Supply – Storage Dispatch Strategy
7
Battery is charged whenever PV production is greater than load
– excess solar is curtailed
Key challenge is to appropriately size solar+storage w.r.t. customer load such that:
– Maximize solar utilization
– Maximize energy storage throughput

DNV GL © 2016
Residential Self-Supply Operational Example
8
Example residential customer
– Peak demand: 6.25 kW-1min
4.84 kW-15min
DER Installed:
– PV: 6kW-dc
– Storage: 3.3 kW, 4 hours
Grid supply is required only
between midnight and 8 am
– Without storage: 48.1% PV
curtailment over 24 hours
– With storage: 7.5% PV is
curtailment15-min operations shown for clarity

DNV GL © 2016
Residential Self-Supply Resource Sizing Optimization - Financial
9
20 year cash-flow analysis
considering O&M costs, ITC
rebates, battery replacement
on 10th year.
PV cost $3,200 per kW
Storage cost:
– $460/kWh for battery
– $450/kW for inverter
– $1500 for installation
Above 6 kW-dc PV,
Solar + Storage is more
cost-effective than
stand-alone Solar
Solar + Storage is cost-
effective till 12 kW PV
(BCR > 100%)
Stand-alone PV cost-
effective up to 8 kW
DNV GL © 2016 SAFER, SMARTER, GREENERDNV GL © 2016
Advanced Application Modeling
Demand Charge Reduction + Fast Regulation
10

DNV GL © 2016
Demand Charge Reduction + Regulation
11
Nearest term application for behind-the-meter storage to participate in wholesale
markets
Pilot projects recently funded in CA, NY and NJ.
Proceedings underway in CA and NY to provide (generation side) wholesale market
access to behind-the-meter resources.
FERC recently opened Docket No. AD16-25 to investigate storage compensation for
bundling applications in wholesale, transmission and BTM markets
– “…FERC's announcement also recognizes the importance of distributed energy storage in wholesale
markets. The Commission is seeking input on how distributed and customer-sited storage systems are
able to provide local benefits while simultaneously providing competitive wholesale market services,
which is currently possible to a limited degree in California.”
- Newswire, Oct 3rd, 2016
DNV GL © 2016
DCR + Fast Regulation – Storage Dispatch Strategy
12
Customer bill management application is assigned priority
Available capacity after bill management is then committed to regulation
Regulation participation performed while minimizing impact on customer quality of
service
– Controls need to manage SoC so regulation participation does not impact bill management
– SoC offsets result from lack of a net-zero regulation signal

DNV GL © 2016
Demand Charge Reduction Operation – Secondary School
13
Example day – July 14
Charges are low:
– 6.3 /kWh, $7.15/kW.
Storage compensates PV
intermittency and flattens load

DNV GL © 2016
Storage Setpoints and Regulation Commitment
14
Regulation commitment is
based on capacity availability
after bill management.
Reg-D set-points calculated
every 15-mins based on energy
compensation requirements
Actual operation shows energy
transaction while following RegD
signal during the 15-min
interval from set-point.
DNV GL © 2016
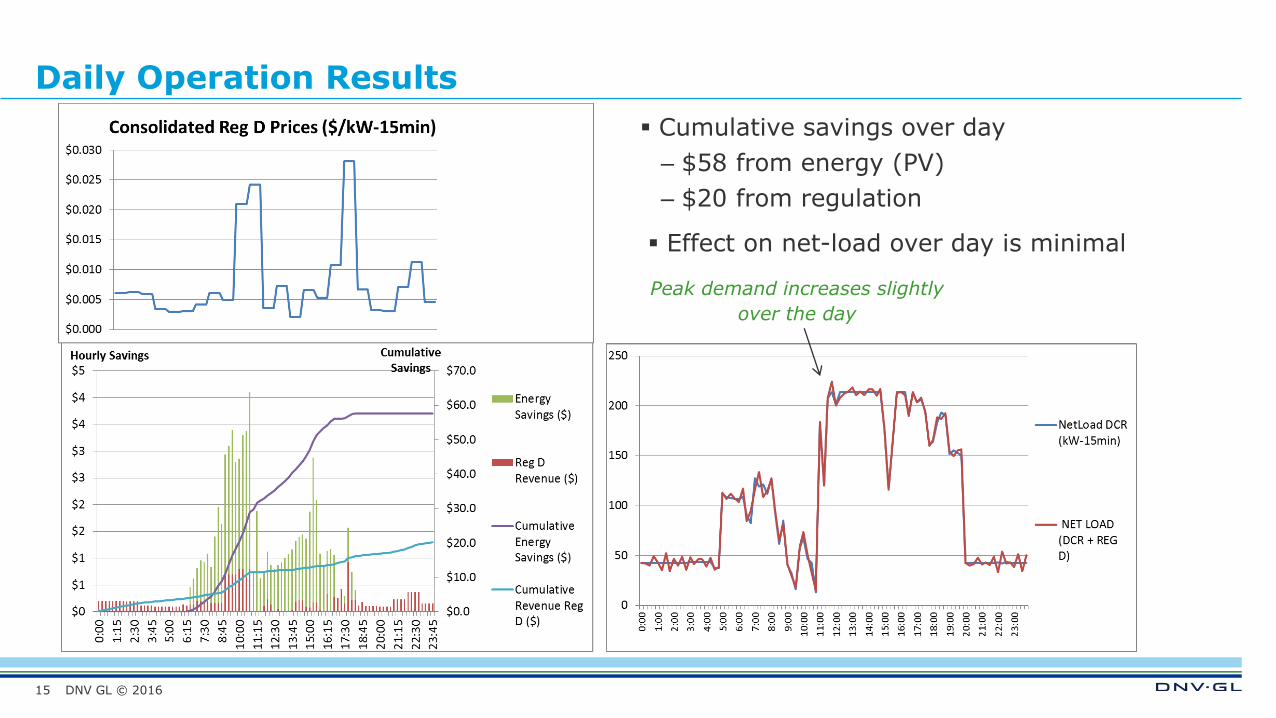
Daily Operation Results
15
Cumulative savings over day
– $58 from energy (PV)
– $20 from regulation
Effect on net-load over day is minimal
Peak demand increases slightly
over the day
DNV GL © 2016
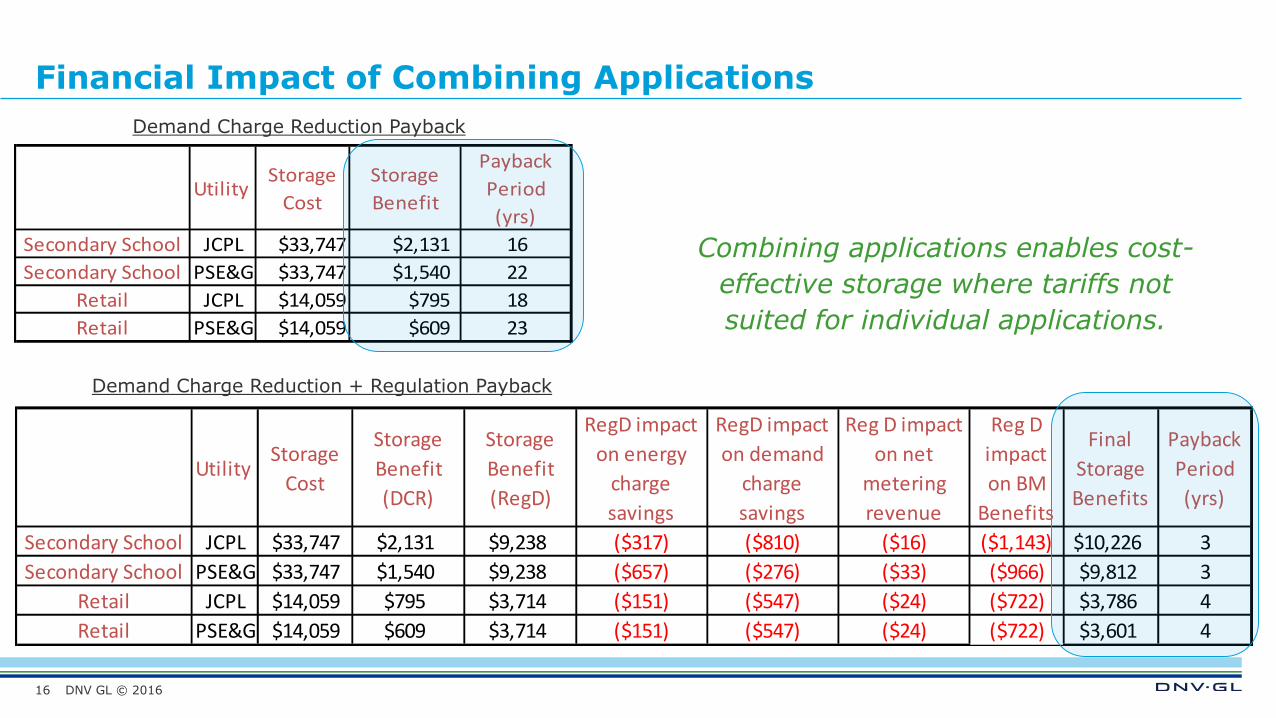
Financial Impact of Combining Applications
16
Combining applications enables cost-
effective storage where tariffs not
suited for individual applications.
UtilityStorage
Cost
Storage
Benefit
(DCR)
Storage
Benefit
(RegD)
RegD impact
on energy
charge
savings
RegD impact
on demand
charge
savings
Reg D impact
on net
metering
revenue
Reg D
impact
on BM
Benefits
Final
Storage
Benefits
Payback
Period
(yrs)
Secondary School JCPL $33,747 $2,131 $9,238 ($317) ($810) ($16) ($1,143) $10,226 3
Secondary School PSE&G $33,747 $1,540 $9,238 ($657) ($276) ($33) ($966) $9,812 3
Retail JCPL $14,059 $795 $3,714 ($151) ($547) ($24) ($722) $3,786 4
Retail PSE&G $14,059 $609 $3,714 ($151) ($547) ($24) ($722) $3,601 4
UtilityStorage
Cost
Storage
Benefit
Payback
Period
(yrs)
Secondary School JCPL $33,747 $2,131 16
Secondary School PSE&G $33,747 $1,540 22
Retail JCPL $14,059 $795 18
Retail PSE&G $14,059 $609 23
Demand Charge Reduction Payback
Demand Charge Reduction + Regulation Payback

DNV GL © 2016
SAFER, SMARTER, GREENER
www.dnvgl.com
Thank You!
17
Nellie Tong
+1 650 554 0824


