In This Issue ESRI • Winter 2009 GIS for Energy ESRI News p2 ESRI on the Road p2 EGUG News p4 Tools of the Trade ArcGIS and Microsoft Tools Enable Spatial Business Intelligence p5 Tech Corner Data Dissemination and Visualization with Flex API p6 Q&A The Role of GIS in Renewable Energy Development p8 Is Renewable Energy the Impossible Dream? p10 Map Gallery New Mexico Renewable Energy Resource Potential Map p12 Enhanced Oil Recovery Revives Petroleum Fields and Reduces Greenhouse Gas Emissions p14 Stewards of the Snake River p16 Ethanol Buzz Fuels Planning by Colonial Pipeline Company p18 Brazilian Utilities Sign Enterprise License Agreement with ESRI p22 Full Range of GIS Benefits Provided to Small Utilities through ESRI’s Enterprise License Agreement Program p23 Energy Currents In 2007, Boston mayor Thomas Menino issued an executive order on climate change that set greenhouse gas reduction goals and outlined city strategies for recycling and renewable en- ergy. That order was decisive in the formation of Solar Boston, a two-year, $550,000 proj- ect designed to expand the use of solar power throughout the city. Solar Boston is part of the Solar America Initiative, a campaign launched by the U.S. Department of Energy (DOE) to make solar electricity cost competitive with traditional electricity production by 2015. To help meet the city’s greenhouse gas reduction targets and support the goals of DOE, Menino Boston Showcases Solar Power Potential with Web GIS By Matthew DeMeritt, ESRI Writer set a target of 25 megawatts of solar power to be installed by 2015. To support the Solar Boston program, Boston is using Web geographic in- formation system (GIS) technology to map cur- rent solar installations, track progress toward the mayor’s goal, and allow Bostonians to ana- lyze their rooftop solar energy potential. Solar Boston builds on the City of Boston’s leadership in promoting green buildings, which is the practice of maximizing the use of a build- ing’s resources while reducing the environmen- tal impact throughout its life cycle. In 2004, Menino created the Green Building Task Force, Continued on page 9 ArcGIS Cadastral Editor calculates coordinates and creates a cadastral fabric for the best-fit representation of the parcel layers.
Transcript
In This IssueESRI • Winter 2009 GIS for Energy
ESRI News p2
ESRI on the Road p2
EGUG News p4
Tools of the TradeArcGIS and Microsoft Tools Enable Spatial Business Intelligence
p5
Tech CornerData Dissemination and Visualization with Flex API
p6
Q&AThe Role of GIS in Renewable Energy Development
p8
Is Renewable Energy the Impossible Dream? p10
Map GalleryNew Mexico Renewable Energy Resource Potential Map
p12
Enhanced Oil Recovery Revives Petroleum Fields and Reduces Greenhouse Gas Emissions
p14
Stewards of the Snake River p16
Ethanol Buzz Fuels Planning by Colonial Pipeline Company
p18
Brazilian Utilities Sign Enterprise License Agreement with ESRI
p22
Full Range of GIS Benefits Provided to Small Utilities through ESRI’s Enterprise License Agreement Program
p23
Energy Currents
In 2007, Boston mayor Thomas Menino issued
an executive order on climate change that set
greenhouse gas reduction goals and outlined
city strategies for recycling and renewable en-
ergy. That order was decisive in the formation
of Solar Boston, a two-year, $550,000 proj-
ect designed to expand the use of solar power
throughout the city. Solar Boston is part of the
Solar America Initiative, a campaign launched
by the U.S. Department of Energy (DOE) to
make solar electricity cost competitive with
traditional electricity production by 2015. To
help meet the city’s greenhouse gas reduction
targets and support the goals of DOE, Menino
Boston Showcases Solar Power Potential with Web GISBy Matthew DeMeritt, ESRI Writer
set a target of 25 megawatts of solar power to be
installed by 2015. To support the Solar Boston
program, Boston is using Web geographic in-
formation system (GIS) technology to map cur-
rent solar installations, track progress toward
the mayor’s goal, and allow Bostonians to ana-
lyze their rooftop solar energy potential.
Solar Boston builds on the City of Boston’s
leadership in promoting green buildings, which
is the practice of maximizing the use of a build-
ing’s resources while reducing the environmen-
tal impact throughout its life cycle. In 2004,
Menino created the Green Building Task Force,
Continued on page 9
ArcGIS Cadastral Editor calculates coordinates and creates a cadastral fabric for the best-fit representation of the parcel layers.
2 Energy Currents www.esri.com/electricgas
ESRI News
Are you looking for a career where you can apply your industry expertise in a new, exciting way?
Join ESRI’s utility team of sales, marketing, consulting, and project management experts. We are
looking for talented professionals to share their industry knowledge, experience, and perspectives
utility industry solutions, has produced a valuable
text covering a range of case studies from the elec-
tric and gas sectors of the utility industry, demon-
strating how application of enterprise-wide GIS
can increase efficiency and improve safety.
This is a well written, easy-to-read book present-
ing a convincing business case for employing en-
terprise-wide GIS in the gas and electric utility sec-
tor in an engaging, narrative, well-illustrated style.
Although it is difficult to imagine any modern util-
ity company not already using GIS, if you know of
one, make sure its directors read this book.
Toorderacopyofthebook,visitwww.esri.com/
esripress.
Review provided by www.geoconnexion.com.
Leading GeospatialPublication Reviews ESRI Book
ArcGIS 9.3 offers a complete suite of soft-
ware that improves organizational work-
flows. With ArcGIS 9.3, users get the
benefits of an established and active user
community, instructor-led and online train-
ing, and new online resource centers. The
resource centers offer a unified location
from which users can access online help,
documentation, support pages, user forums,
blogs, maps, and more.
ArcGIS 9.3 comes with more tools to ac-
cess data within an organization including
support for Microsoft SQL Server 2008 and
PostgreSQL.ArcGIS9.3alsomakesiteasi-
er to connect to and manage data from other
systems via direct backward compatibil-
ity and includes new version management
features, enhancements to geodatabase
replication, and better geocoding. A new
image service within ArcGIS Server ad-
vances an organization’s data management
capabilities.
ArcGIS 9.3 makes dissemination of geo-
graphic information much easier. ArcGIS
Server users can now selectively build a
map cache for the areas that are the most
popular, and ArcGIS Server enables on-
demand caching to let the map cache
grow as end users access the map service.
ArcGIS Server 9.3 also includes a series of
JavaScriptAPIsformashup-styledevelop-
ment.TheArcGISAPIsforJavaScripttake
advantage of the new REST interface.
In ArcGIS 9.3, many modeling tools have
been enhanced and some entirely new tools
have been added. In addition, a new vehicle
routing problem (VRP) solver in ArcGIS
Network Analyst generates routes for fleets
of vehicles.
To learn more about ArcGIS 9.3, visit
www.esri.com/whatsnew.
What’s New in ArcGIS 9.3
NRECA TechAdvantage
February 13–16, 2009
New Orleans, Louisiana
www.techadvantage.org
UEDA Winter Forum
February 23–26, 2009
St. Petersburg, Florida
www.utilityeda.com/Conferences.asp
GITA
April 19–22, 2009
Tampa, Florida
www.gita.org
WindPower 2009
May 4–7, 2009
Chicago, Illinois
www.windpowerexpo.org
ESRI on the Road
Energy Currents 3www.esri.com/electricgas
ESRI News
ESRI Canada Limited’s Award of Excellence Recognizes Saint John EnergyBy Amanda Graff, ESRI Canada Limited
ESRI Canada Limited, ESRI’s distributor
in Canada, recognized Saint John Energy of
Fredericton, New Brunswick, with the Award
of Excellence at the 2008 Regional User
Conference. The utility was honored for its in-
novative and integrated approach to application
deployment, which has dramatically improved
efficiencies across the utility.
“Saint John Energy has proactively taken an
enterprise approach to GIS that has resulted in
more efficient management processes and con-
sistency throughout the company,” said Eric
Melanson, ESRI Canada Limited’s Atlantic re-
gional manager. “The company has successful-
ly transitioned from a paper-based environment
and has implemented key business applications
built on GIS that automate and streamline its
operations.”
Saint John Energy is an electricity distribu-
tion utility that serves 36,000 customers with
a network of 13 substations and 84 feeders
within its service area of 130 square miles. For
six consecutive years, Saint John Energy was
rated one of the top five utilities in Canada for
its health and safety record in the fewer-than-
500-employees category as monitored by the
Canadian Electricity Association.
In 2001, the utility embarked on an ambitious
enterpriseapplicationproject (EAP) to imple-
ment three core technologies—management,
customer, and geographic information systems.
The completion of this project resulted in a
seamless transition from paper-based systems
to an era of digital spatial data. As a first step,
Saint John Energy worked with ESRI Canada
Limited to create a data collection tool that
would enable the utility to survey its vast infra-
structure. Within one year, Saint John Energy
had captured approximately 200,000 attributed
submeter GPS locations. This data collection
tool was used for everything from siting sub-
stations, assessing insurance claims, planning
new infrastructure, and locating existing under-
ground infrastructure.
In 2006, Saint John Energy initiated a pilot
project to implement automated metering infra-
structure (AMI) systems that detect when a me-
ter has experienced an outage. Upon rollout of
this project, AMI data was integrated with data
from the customer information system (CIS) so
that customer information could be accessed
with the click of a button using ArcMap.
As part of its integration strategy from the
EAP, Saint John Energy recently selected
Telvent Miner & Miner’s Designer application
to automate the generation of cost estimates
and bills for materials. Designer automatically
determines the inventory that is required and
performs a series of engineering calculations
based on standard construction practices.
“Designer provides us with a streamlined
information flow from the field to our opera-
tions, engineering, finance, and store depart-
ments,” explained Bob Bernard, GIS admin-
istrator, Saint John Energy. “This will enable
our field employees to perform their jobs more
effectively while delivering a high-quality and
consistent level of service to our customers.”
For more information, visit www.esricanada
.com.
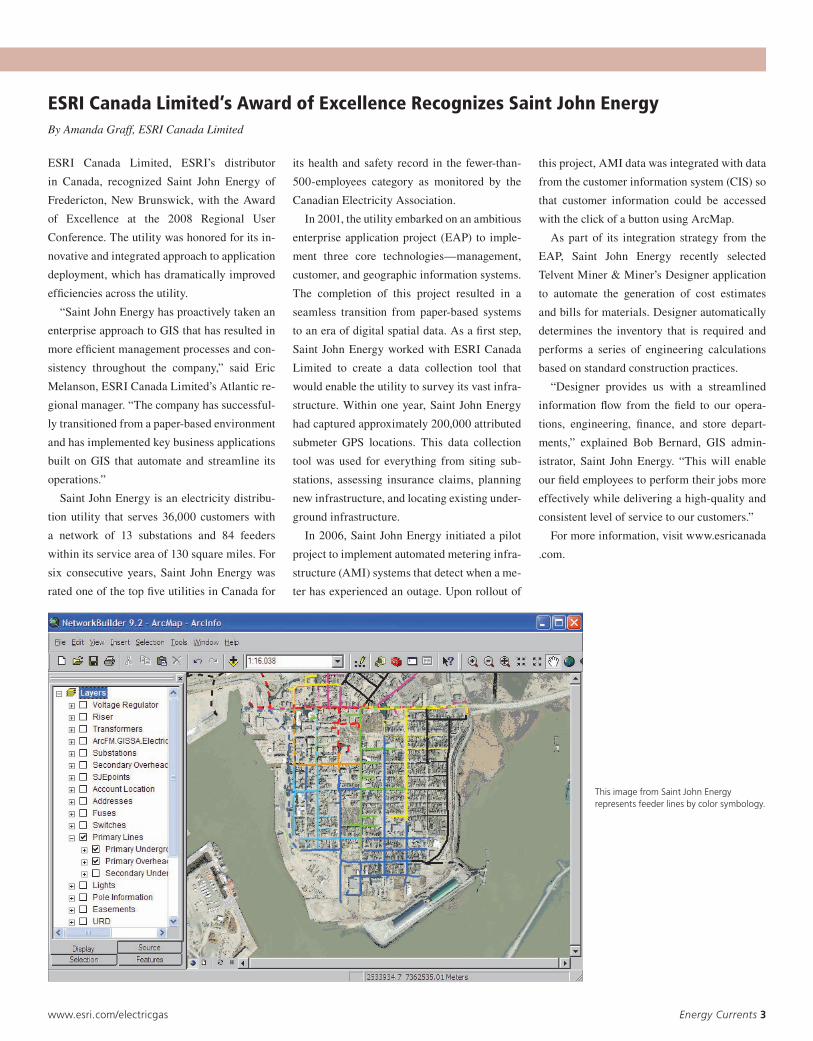
This image from Saint John Energy represents feeder lines by color symbology.
4 Energy Currents www.esri.com/electricgas
Seminars, speeches, and hallway conversations
devoted to smart grid technology, renewable
energy, and the Web at ESRI’s 2008 Electric
& Gas User Group (EGUG) Conference signify
that utilities are preparing for big changes.
The conference, held October 19–23 in
Indian Wells, California, brought together rep-
resentatives from 100 utilities with ESRI indus-
try experts and business partners. The theme,
Riding the Winds of Change, embraced indus-
try challenges ranging from increased regula-
tion and renewable initiatives to outage man-
agement and online customer service. Through
workshops and sessions, attendees explored
how GIS technology benefits utilities in crucial
2008 EGUG Conference in Review: Utilities Charged Up to Deal with Change
EGUG News
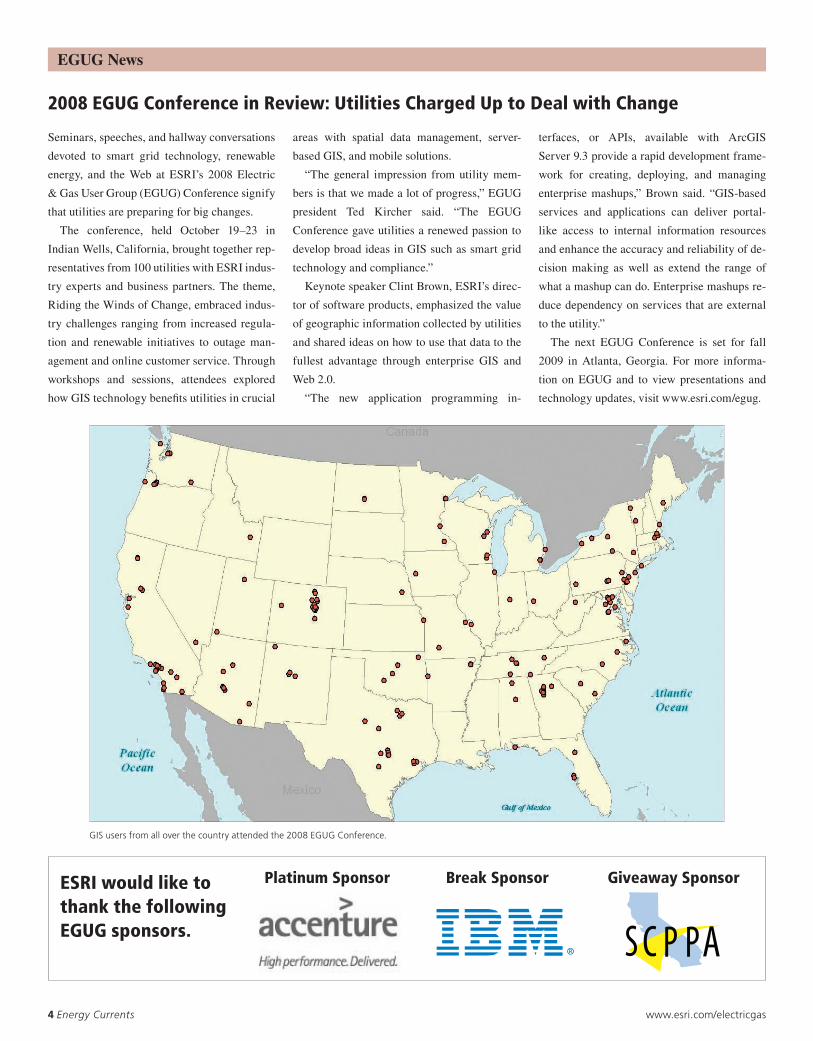
GIS users from all over the country attended the 2008 EGUG Conference.
ESRI would like tothank the followingEGUG sponsors.
areas with spatial data management, server-
based GIS, and mobile solutions.
“The general impression from utility mem-
bers is that we made a lot of progress,” EGUG
president Ted Kircher said. “The EGUG
Conference gave utilities a renewed passion to
develop broad ideas in GIS such as smart grid
technology and compliance.”
Keynote speaker Clint Brown, ESRI’s direc-
tor of software products, emphasized the value
of geographic information collected by utilities
and shared ideas on how to use that data to the
fullest advantage through enterprise GIS and
Web 2.0.
“The new application programming in-
terfaces, or APIs, available with ArcGIS
Server 9.3 provide a rapid development frame-
work for creating, deploying, and managing
enterprise mashups,” Brown said. “GIS-based
services and applications can deliver portal-
like access to internal information resources
and enhance the accuracy and reliability of de-
cision making as well as extend the range of
what a mashup can do. Enterprise mashups re-
duce dependency on services that are external
to the utility.”
The next EGUG Conference is set for fall
2009 in Atlanta, Georgia. For more informa-
tion on EGUG and to view presentations and
technologyupdates,visitwww.esri.com/egug.
Platinum Sponsor Break Sponsor Giveaway Sponsor
Energy Currents 5www.esri.com/electricgas
Enspiria Solutions recently announced its
ESIntial Solution, a spatially enabled busi-
ness intelligence (BI) solution that integrates
ESRI’s market-leading ArcGIS Server solu-
tion with key elements of Microsoft’s BI tools,
PerformancePoint Server and SharePoint.
ESIntial was developed to provide utilities with
an intelligent portal to enterprise information
with a cost-effective tool that can be rapidly
deployed and includes spatial information. The
solution integrates and analyzes data from oper-
ations, maintenance, engineering, and financial
systems with respect to key performance indi-
cators and other relevant information needs.
The most notable benefit of ESIntial is the
ability to integrate a wide variety of data sourc-
es and generate any number of perspectives of
the business, saving significant IT resources
and costs. Utilities can use existing Microsoft
and ESRI investments for improved scalability,
security, Web-based interfaces, and end-user
convenience.
“ESIntial has been designed to help utilities
respond quickly and cost-effectively to today’s
The basic software requirements needed to
implement ESIntial include ESRI ArcSDE 9.2,
ESRIArcGISServer9.3,MicrosoftSharePoint
(MOSS 2007 or WSS 3.0), Microsoft
PerformancePointServer2007,andMicrosoft
SQL Server 2005 with Analysis Services and
Integration Services.
Enspiria has developed a four-step rapid de-
ployment process for ESIntial, which can be
achieved in a matter of weeks by taking advan-
tage of its predefined, utility-specific applica-
tions and cubes. The architecture of ESIntial
features a secure, scalable, functional, and sta-
ble environment that is designed to allow you to
expand the solution based on the growing needs
and requirements of your organization.
AnESRI2008BusinessPartneroftheYear,
Enspiria Solutions is a leading provider of con-
sulting and systems integration services to the
utility, cable, and government sectors.
For more information about Enspiria
Solution’s ESIntial, visit www.ESIntial.com.
For more information about ESRI’s ArcGIS
Server,visitwww.esri.com/arcgis.
asset, vegetation, and outage management; field
force automation; and maintenance practices.”
For utilities with stand-alone deployments,
ESIntial creates an environment for reporting
and tracking the system usage and associated
keyperformanceindicators(KPIs).Information
is delivered using a geographic view in a single,
stable,nonproprietarySharePointportal envi-
ronment. As utilities establish data marts and
data warehouses for asset optimization, the so-
lution provides a nonproprietary environment
to aggregate large amounts of data from sepa-
rate systems, often from different departments,
for an overall view of the utility.
As utilities move to a near real-time environ-
ment made possible with the implementation
of a smart grid system, ESIntial enables a geo-
graphic view of current, real-time issues, out-
ages, and load and switching data. The solution
is a set of components that works to combine
GIS and performance data to form a seamless
view of the utility’s system, accessible through
a Web interface that is easy to use, query, and
understand.
ArcGIS and Microsoft Tools Enable Spatial Business IntelligenceEnspiria Introduces ESIntial Solution for Critical Analysis and Decision Making
Tools of the Trade
With ArcGIS technology and Enspiria’s ESIntial Solution, utilities can highlight the potential impact that maintenance and asset management planning have on reliability, showing historical data from both systems in a single view.
changing market condi-
tions. We approached the
design with the intention
to allow easy expansion,
configuration, and custom-
ization with minimal effort
as utilities seek to grow
their solutions and better
align them with their busi-
ness needs,” said Mehrdod
Mohseni, senior vice presi-
dent and general manager
at Enspiria Solutions. “This
solution can be readily de-
ployed by utilities large
and small to integrate and
display a range of utility-
specific subjects and per-
formance metrics as they
relate to smart metering;
6 Energy Currents www.esri.com/electricgas
Tech Corner focuses on technical issues
that address GIS data management, dis-
semination, visualization, and spatial
analysis for the utility industry. The in-
augural topic for this section is data dis-
semination and visualization.
Today, many utility companies are looking at streamlining the way
in which they disseminate and visualize GIS data to internal and exter-
nal customers in an effort to achieve greater operational awareness. The
release of the ArcGIS 9.3 Flex and JavaScript software development kit
(SDK) offers utility companies a way to develop and deploy rich Internet
applications (RIAs) on top of ArcGIS Server 9.3 to meet these goals.
To help utilities jump-start these efforts, ESRI has released Sample
Flex Viewer and JavaScript Viewer. These applications are freely avail-
able and are designed to showcase some of the core capabilities of the
ArcGIS platform through a simple, modern, Web 2.0-style user interface.
These applications may be used in compiled form with simple modifica-
tions to its configuration file, or its source code may be used by applica-
tion developers to further explore and understand some of the best prac-
tices and programming patterns of the ArcGIS 9.3 Flex and JavaScript
SDKs. This article will focus on how to access, install, and configure the
Sample Flex Viewer without having to write any code.
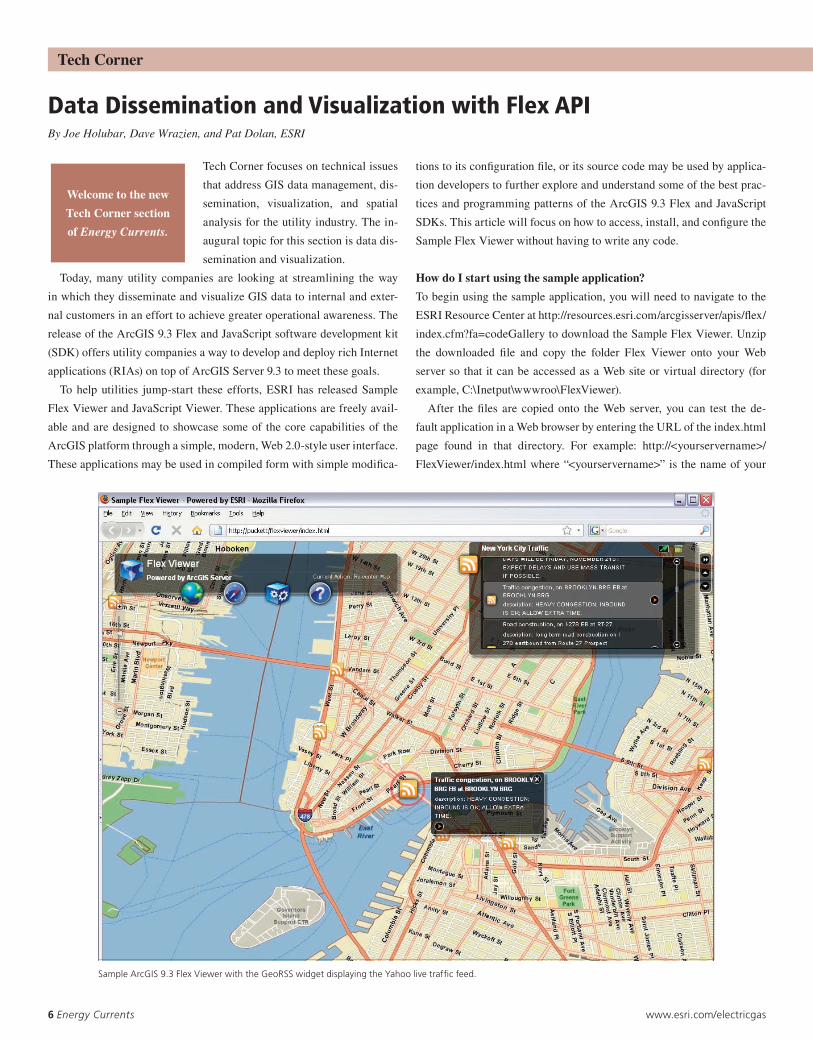
How do I start using the sample application?
To begin using the sample application, you will need to navigate to the
For training offered outside the United States, contact your local ESRI distributor. See
www.esri.com/distributors.
Mitch GarnettElectric Industry Manager
Energy Currents 9www.esri.com/electricgas
and in 2007, based on the task force’s recom-
mendations, Boston became the first major city
in the United States to require all large, private-
sector buildings to conform to the Leadership
in Energy and Environmental Design (LEED)
green building standards. Outfitting Boston’s
largest residential and corporate structures
with solar panels is in keeping with the city’s
green building and energy conservation
objectives.
Renewable energy is a solution for reduc-
ing the demand on and air pollution from tra-
ditional energy systems. As on-site sources of
clean power, solar energy systems can reduce
greenhouse gas emissions and air pollution,
increasing energy security and creating local
jobs. Additionally, solar electricity systems
(also called photovoltaics [PV]) have the po-
tential to generate power when it is needed
most—on hot summer days—thereby reliev-
ing strain on the electricity system and reduc-
ing the risk of blackouts. By encouraging the
use of solar energy, Boston hopes to not only
capture these benefits but also prepare for the
market explosion likely to occur when solar
power becomes competitive with fossil fuels.
TopromotetheuseofPVtoinvestors,Boston
Redevelopment Authority (BRA) needed a
system to showcase solar energy potential in
Continued from page 1
Boston Showcases Solar Power Potential with Web GIS
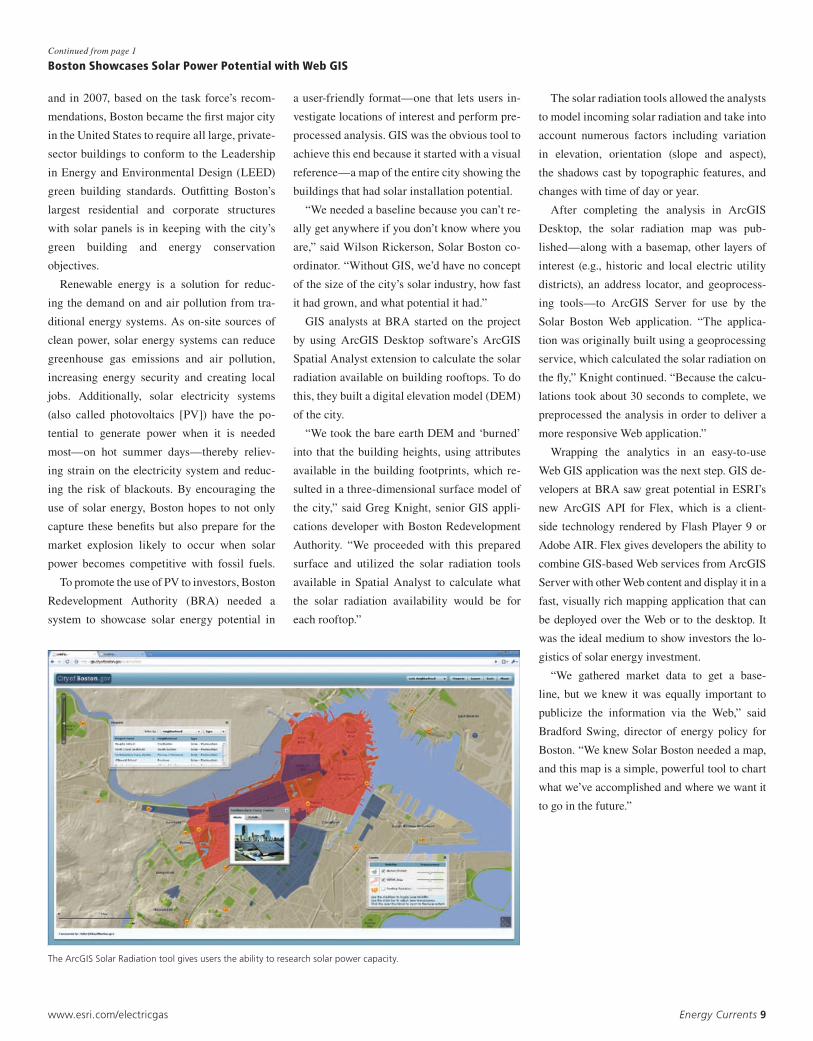
auser-friendlyformat—onethat letsusers in-
vestigate locations of interest and perform pre-
processed analysis. GIS was the obvious tool to
achieve this end because it started with a visual
reference—amapoftheentirecityshowingthe
buildings that had solar installation potential.
“We needed a baseline because you can’t re-
ally get anywhere if you don’t know where you
are,” said Wilson Rickerson, Solar Boston co-
ordinator. “Without GIS, we’d have no concept
of the size of the city’s solar industry, how fast
it had grown, and what potential it had.”
GIS analysts at BRA started on the project
by using ArcGIS Desktop software’s ArcGIS
Spatial Analyst extension to calculate the solar
radiation available on building rooftops. To do
this, they built a digital elevation model (DEM)
of the city.
“We took the bare earth DEM and ‘burned’
into that the building heights, using attributes
available in the building footprints, which re-
sulted in a three-dimensional surface model of
the city,” said Greg Knight, senior GIS appli-
cations developer with Boston Redevelopment
Authority. “We proceeded with this prepared
surface and utilized the solar radiation tools
available in Spatial Analyst to calculate what
the solar radiation availability would be for
each rooftop.”
The solar radiation tools allowed the analysts
to model incoming solar radiation and take into
account numerous factors including variation
in elevation, orientation (slope and aspect),
the shadows cast by topographic features, and
changes with time of day or year.
After completing the analysis in ArcGIS
Desktop, the solar radiation map was pub-
lished—alongwithabasemap,otherlayersof
interest (e.g., historic and local electric utility
districts), an address locator, and geoprocess-
ing tools—to ArcGIS Server for use by the
Solar Boston Web application. “The applica-
tion was originally built using a geoprocessing
service, which calculated the solar radiation on
the fly,” Knight continued. “Because the calcu-
lations took about 30 seconds to complete, we
preprocessed the analysis in order to deliver a
more responsive Web application.”
Wrapping the analytics in an easy-to-use
Web GIS application was the next step. GIS de-
velopers at BRA saw great potential in ESRI’s
new ArcGIS API for Flex, which is a client-
side technology renderedbyFlashPlayer9or
Adobe AIR. Flex gives developers the ability to
combine GIS-based Web services from ArcGIS
Server with other Web content and display it in a
fast, visually rich mapping application that can
be deployed over the Web or to the desktop. It
was the ideal medium to show investors the lo-
gistics of solar energy investment.
“We gathered market data to get a base-
line, but we knew it was equally important to
publicize the information via the Web,” said
Bradford Swing, director of energy policy for
Boston. “We knew Solar Boston needed a map,
and this map is a simple, powerful tool to chart
what we’ve accomplished and where we want it
to go in the future.”
The ArcGIS Solar Radiation tool gives users the ability to research solar power capacity.
10 Energy Currents www.esri.com/electricgas
“Just then, they came in sight of 30 or 40 wind-
mills that rise from that plain. And no sooner
did Don Quixote see them that he said to his
squire, ‘Fortune is guiding our affairs better
than we ourselves could have wished. Do you
see over yonder, friend Sancho, 30 or 40 hulk-
ing giants? I intend to do battle with them…
With their spoils we shall begin to be rich…’”
When Miguel de Cervantes wrote of the
impetuous and noble hero Don Quixote
400 years ago, he could not have imagined that
one day environmental scientists and energy
analysts would dream the impossible dream
of stocking the electric grid with the power
of the wind. Nor could he have envisioned the
hulking giants that now line many a horizon,
the 400-foot-tall wind turbines, each wield-
ing three 130-foot steel blades and weighing
8.5 tons. When he wrote of tilting at windmills,
the Spanish literary master would not have
guessed that public utilities, private companies,
and investors would someday look to the wind
to beat the unbeatable foes of waning fossil fuel
supply and deleterious carbon emissions.
Wind energy now accounts for 1 percent of
the nation’s power supply, and forecasts from
the U.S. Department of Energy say that figure
could reach 20 percent by 2030. While wind
farms crop up across the country’s windiest ter-
rains, critics point to the need for new transmis-
sion lines and the variability of the wind. Many
citizens support the idea as long as it’s “not in
my backyard.”
Despite criticism, wind power is touted as
one of the cleanest, most reliable renewable
resources dreamed up so far. But is harness-
ing wind power on a wide scale as quixotic as
“dreaming the impossible dream”?
In 2008, the United States surpassed
Germany as the world’s biggest generator by
volume of wind energy. The amount of wind
power the United States generates has doubled
in the last two years, according to the American
Wind Energy Association (AWEA), a trade
group for wind power developers and equip-
ment manufacturers. An investigation into the
solid science of wind power facility develop-
ment clarifies the potential and reliability of
this blustery resource.
Twenty-eight states have set renewable ener-
gy mandates and are determined to woo wind
developers. A Nebraska utility brochure boasts,
“Nebraska has wind. In fact, the state ranks
sixth in America for wind development.” An
energy company in Minnesota is announcing
plans to buy an interstate transmission line and
develop wind energy to replace coal-generated
electricity. One county in Montana is distribut-
ing a wind map book compilation of all the data
necessary to entice investors.
Harnessing the Wind
Wind turbines convert the kinetic energy in
moving air into rotational energy, which in turn
is converted to electricity. Humans have used
wind power for centuries to move boats, grind
grain, and pump water. Timeless and simple
as it may seem, development of a wind power
facility is much more complex than staking a
pinwheel in the breeze.
“Our development teams include meteorolo-
gists, engineers, environmental permitting staff,
and land agents,” said Tyler Hoffbuhr, a GIS an-
alyst with IBERDROLA RENEWABLES, the
largest developer of wind power in the world.
IBERDROLA RENEWABLES has a flurry
of wind power projects in the works as utilities
aim to reduce dependence on nonrenewable
energy. Modeling the feasibility of these proj-
Is Renewable Energy the Impossible Dream?The Science behind Tapping Wind Power Offers Insight on the Resource’s FeasibilityBy Jessica Wyland, ESRI Writer
The Elk River Wind Project is a 150-megawatt wind energy project located in Butler County, Kansas. Primarily used to graze cattle, the total site consists of 7,907 acres and is owned by five local landowners. Empire District Electric Company selected Elk River and entered into a 20-year agreement with IBERDROLA RENEWABLES to purchase wind energy from the facility. Empire anticipates it will purchase enough energy to meet the annual needs of about 42,000 homes. The Missouri-based utility chose to add wind energy to its portfolio for its price stability, environmental friendliness, and the economical cost for the company’s customers.
Energy Currents 11www.esri.com/electricgas
ects requires studying location, wind speed,
environmental concerns, and other variables.
Wind power researchers are using technology
from leading GIS developer ESRI to organize
and analyze data based on geographic location.
GIS is a familiar platform for engineers in the
electric and gas industry as well as conserva-
tion groups, which use the technology to make
decisions. Developers use GIS to organize their
work as a series of layers or themes. One layer
may have wind density information, while an-
other layer will have land suitability, and an-
other will show bird migration patterns. The
layers of information, visible as colorful “smart
maps,” clarify for developers the best and most
efficient location for a wind farm.
“GIS enables developers of wind power fa-
cilities to reach their goal of finding the best
wind areas while causing as little impact as pos-
sible to wildlife and the environment,” said Bill
Meehan, director of utility solutions at ESRI.
“Locating the right site can be done quickly
and accurately with publicly available data and
GIS technology. This fact alone speaks well for
the future of wind power and green energy.”
Smart Layers for Smart Maps
The life of a wind farm project starts with a
look at potential plots of land. Most developers
require land within a prescribed distance of a
transmission line to tie in power to the grid. If
the wind is strong and steady, developers may
decide to build their own transmission line. By
loading utility data into the GIS, researchers
can quickly see existing transmission routes
and estimate the benefits of accessing existing
electric lines.
Another important consideration for devel-
opers is landownership. State and county land-
use data in the GIS identifies areas under de-
velopment restrictions from the Bureau of Land
Management and those requiring right-of-way
grants. If land is privately owned, developers
will have to obtain consent from individual
landowners.
A layer of constraints is added to the GIS,
marking areas that are environmentally pro-
tected for migratory flight paths or other animal
activity. Other site restrictions apply to military
bases and airports, where developers must con-
sider radar interference and FAA regulations.
Wind data is equally crucial to researchers,
who add a resource layer to the GIS detailing
wind speed and reliability. Meteorological data
is continuously collected during a one- to five-
year period using tower-based anemometers
and vanes mounted at several height levels up
to 60 meters aboveground. Wind power can be
classified into density classes ranging from one
(poor) to seven (excellent). For example, a wind
power class of four has an average wind speed
from 15.7 to 16.8 mph at a height of 50 meters
aboveground. In addition to site research, me-
teorologists use wind data stored in the GIS to
help design the layout of a wind farm by identi-
fying wind direction, strength, and location.
Site Scouting Field Trip
“Almost all the wind power facility layouts can
be done in the GIS, with maybe one or two vis-
its to the field,” Hoffbuhr said. “Before GIS,
meteorologists only had paper maps to work
from, which didn’t show property ownership,
wetlands, county- or state-required safety set-
backs, rights-of-way, or environmental and cul-
tural resource sites. Now we can stock the GIS
with U.S. Geological Survey maps, property
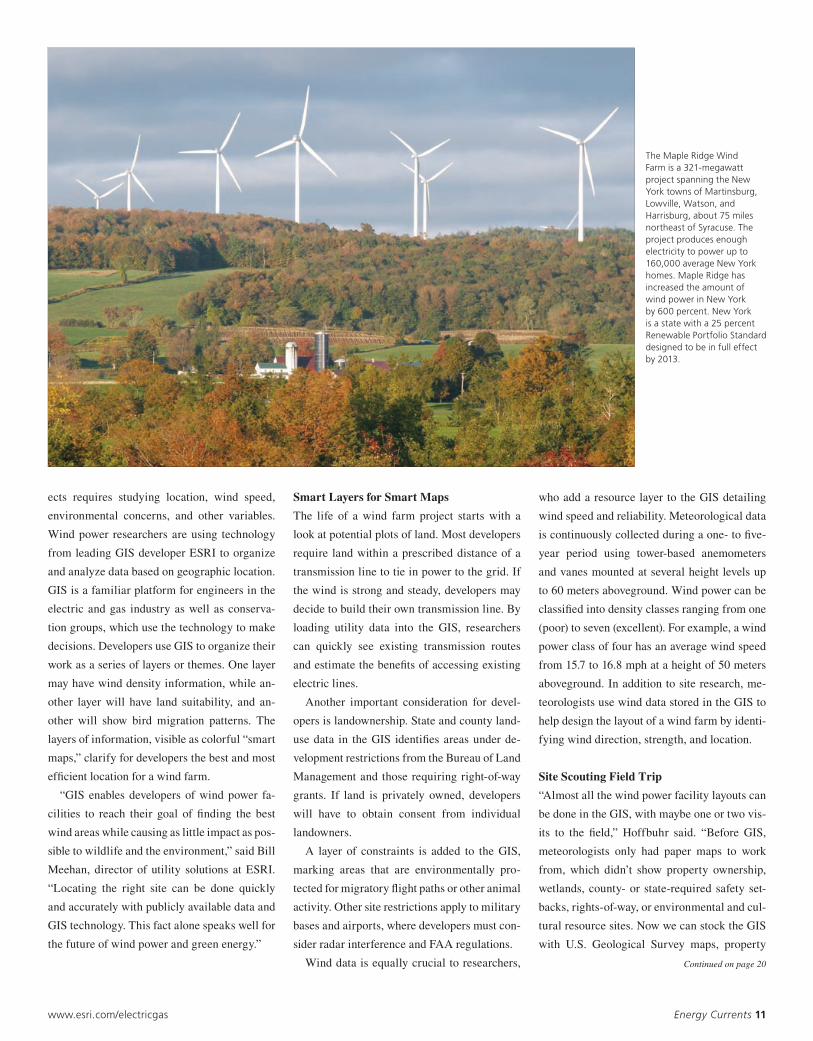
The Maple Ridge Wind Farm is a 321-megawatt project spanning the New York towns of Martinsburg, Lowville, Watson, and Harrisburg, about 75 miles northeast of Syracuse. The project produces enough electricity to power up to 160,000 average New York homes. Maple Ridge has increased the amount of wind power in New York by 600 percent. New York is a state with a 25 percent Renewable Portfolio Standard designed to be in full effect by 2013.
Continued on page 20
12 Energy Currents www.esri.com/electricgas
Map Gallery
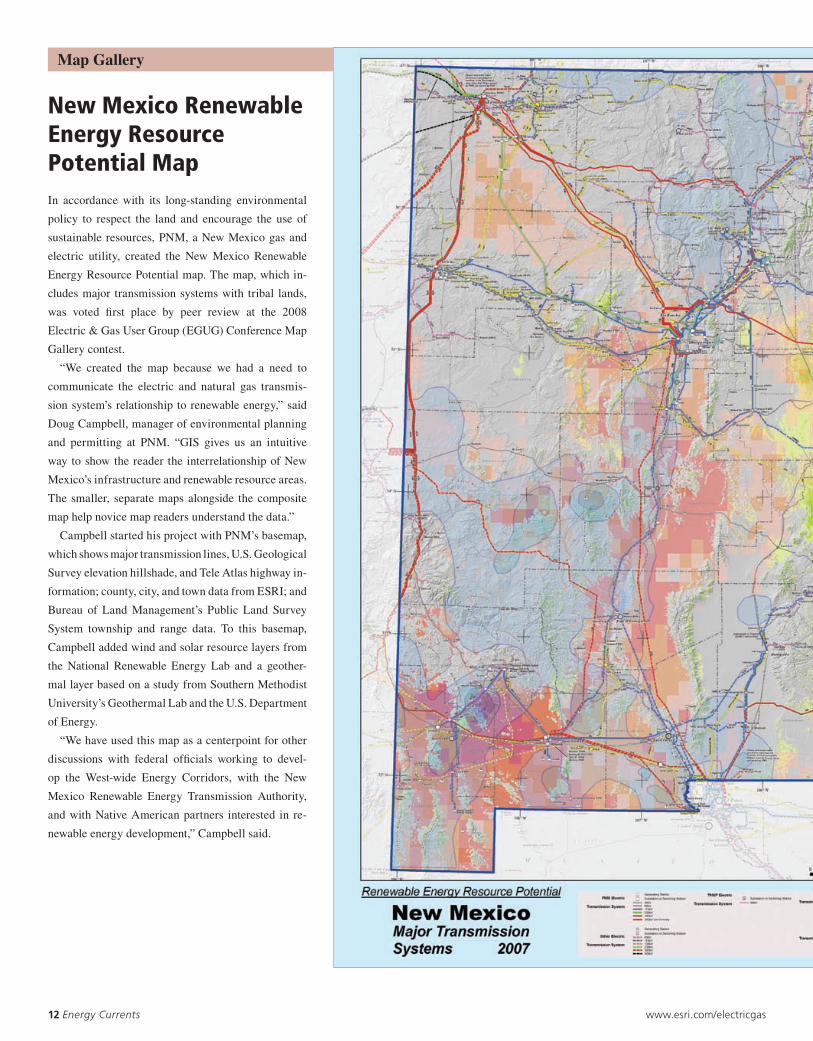
In accordance with its long-standing environmental
policy to respect the land and encourage the use of
sustainableresources,PNM,aNewMexicogasand
electric utility, created the New Mexico Renewable
EnergyResourcePotentialmap.Themap,whichin-
cludes major transmission systems with tribal lands,
was voted first place by peer review at the 2008
Electric & Gas User Group (EGUG) Conference Map
Gallery contest.
“We created the map because we had a need to
communicate the electric and natural gas transmis-
sion system’s relationship to renewable energy,” said
Doug Campbell, manager of environmental planning
and permitting at PNM. “GIS gives us an intuitive
way to show the reader the interrelationship of New
Mexico’s infrastructure and renewable resource areas.
The smaller, separate maps alongside the composite
map help novice map readers understand the data.”
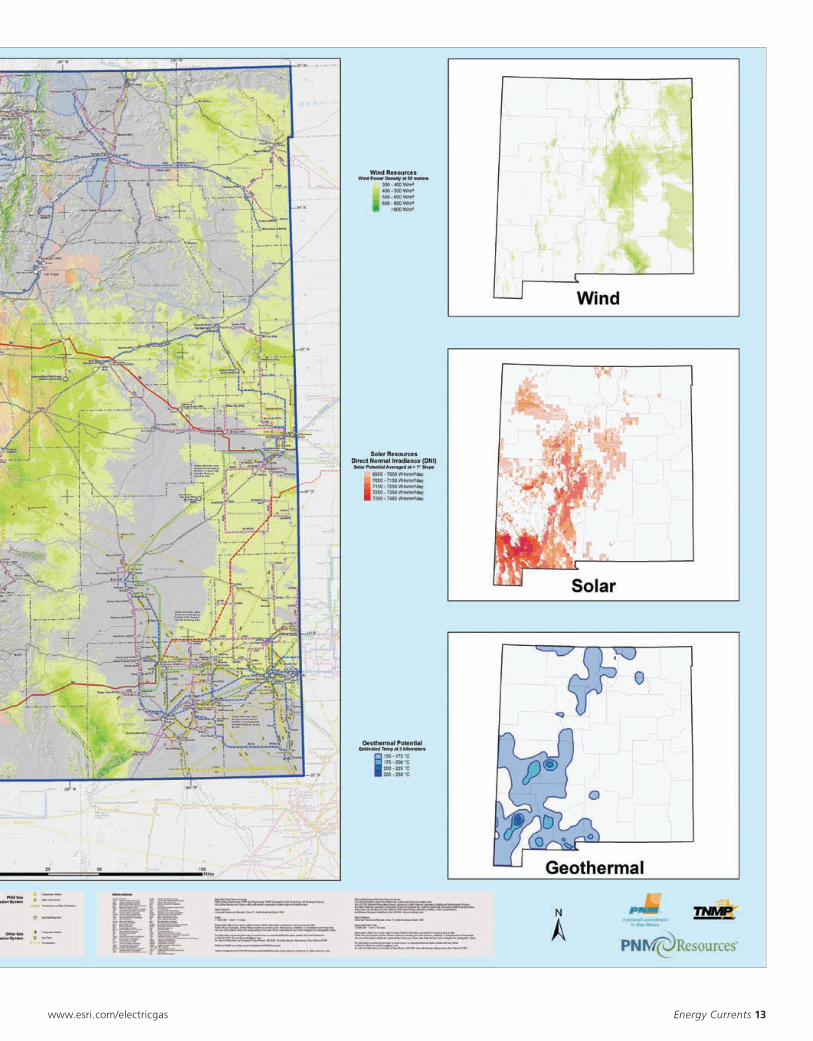
CampbellstartedhisprojectwithPNM’sbasemap,
which shows major transmission lines, U.S. Geological
Survey elevation hillshade, and Tele Atlas highway in-
formation; county, city, and town data from ESRI; and
Bureau of LandManagement’s Public Land Survey
System township and range data. To this basemap,
Campbell added wind and solar resource layers from
the National Renewable Energy Lab and a geother-
mal layer based on a study from Southern Methodist
University’s Geothermal Lab and the U.S. Department
of Energy.
“We have used this map as a centerpoint for other
discussions with federal officials working to devel-
op the West-wide Energy Corridors, with the New
Mexico Renewable Energy Transmission Authority,
and with Native American partners interested in re-
newable energy development,” Campbell said.
New Mexico RenewableEnergy ResourcePotential Map
Energy Currents 13www.esri.com/electricgas
Map Gallery
14 Energy Currents www.esri.com/electricgas
Carbon dioxide is not always a villain. It can
actually be quite beneficial for companies
like Houston-based Anadarko Petroleum
Corporation, which is using the greenhouse
gas for enhanced oil recovery (EOR), a process
that involves injecting otherwise tapped-out
wells with CO2 to produce additional oil. CO
2
emissions that would normally be released into
the atmosphere are captured, compressed, and
purchased from a natural gas processing plant,
then shipped via pipeline to oil fields. The CO2
is recycled over the lifetime of these EOR proj-
ects to continue generating production from
these fields.
CO2 has breathed new life into Anadarko’s
Salt Creek field, a site 45 miles north of Casper,
Wyoming, that invokes the kind of nostalgia
associated with boomtown times in the United
States. Oil was first struck at Salt Creek in the
early 1900s and, at 9 miles x 5 miles, it is one
of the largest oil fields in the Rocky Mountains.
With more than 4,000 wells, the rich swatch of
Wyoming ground has yielded about 655 million
barrelsofoilinitstenure.Productionbycon-
ventional drilling has dwindled, but Anadarko
hopes to draw at least another 150 million bar-
rels of oil out of the field by injecting CO2 into
the ground. This pushes the oil toward predom-
inantly previously drilled wells in the field that
The Salt Creek field was discovered north of Casper, Wyoming, in the early 1900s and celebrated its 100th year of production in 2008.
Energy Currents 15www.esri.com/electricgas
For more than 40 years, the Salt Creek field has been producing oil through floodwater recovery technology that utilizes pumping units, or pump jacks, to pump oil out of the ground.
gas industry for 35 years. With the evolution of
related science and technology, EOR has be-
come an increasingly efficient, safe, and practi-
cal investment.
In the United States, there are more than
13,000 EOR wells and 3,500 miles of high-
pressure CO2 pipelines, according to a 2007
report by the American Petroleum Institute
(API).Thereportestimatesthat,throughEOR
projects, 600 million tons of CO2 have been in-
jected into the ground to produce about 245,000
barrels of oil per day.
The life cycle of a producing oil field, such
as Salt Creek, includes several stages. Initially,
oil flows naturally to the surface with existing
reservoir pressure. As natural pressure drops,
the reservoir is flooded with water to push out
more oil. In the final stage, any remaining oil
is recovered by CO2 injection, miscible natural
gas injection, or steam recovery.
“We expect CO2 injection to keep Salt Creek
Reservoir in oil production for at least 30 more
years,” Michie said.
The Technology Tool
Oil companies undertaking EOR projects look
forward to considerable return after great in-
vestment. Required infrastructure includes
natural gas treatment facilities for CO2 capture,
pipelines, compression equipment, transporta-
tion, distribution lines, flow lines, and wells for
injection. The oil, natural gas, and pipeline in-
dustries manage infrastructure and operations
as meticulously as possible by using geographic
information system technology. GIS links cru-
cial data to physical locations. This gives op-
erators an up-to-date picture for site and route
planning, asset management, field crew deploy-
ment, and decision making.
“The ability to manage, correlate, predict,
model, and share volumes of data in an interac-
tive digital map makes GIS an essential ana-
lytic tool,” said Robert Brook, pipeline and gas
industry manager, ESRI.
Since 1969, ESRI has worked to advance
GIS technology by developing a suite of GIS
software for desktop, mobile, server, and Web
applications. The California-based company
has more than 1 billion users around the world,
touching virtually every industry, from govern-
ment and business to health and conservation.
Anadarko uses GIS from ESRI to track pipe-
line maintenance, view land reclamation, and
keep up with revegetation of native grasses. By
calling up layers on a GIS-based map, design-
ers can look at wildlife habitat, protected spe-
cies development, and archaeological sites.
“We use GIS to map every piece of infra-
structure, from the flow lines and pipelines
we use to move the CO2 to our buildings and
wells,” Michie said. “These wells are so old,
and the survey techniques have evolved so sig-
nificantly, that a lot of the old locations didn’t
match. We’ve used GIS to remap those wells
along with our pipes, so we know the exact lo-
cations of our pieces of infrastructure.”
Low-rise wellheads replace pump jacks in the portions of the 100-year-old Salt Creek field, where Anadarko has implemented enhanced oil recovery technology that utilizes CO2 to stimulate oil production. The CO2 injected into the ground increases domestic oil production and prevents the greenhouse gas from being emitted into the atmosphere. As a benefit of these EOR operations, the Salt Creek field will be one of the largest CO2 oil recovery and geologic-sequestration projects of its kind in the world.
16 Energy Currents www.esri.com/electricgas
For much of Idaho the Snake River is the life-
blood. The 1,040-mile tributary of the Columbia
River provides water for drinking, irrigating,
and generating approximately 50 percent of
the state’s energy through hydropower. The
SnakeRiverflows fromYellowstoneNational
Parkthroughaseriesofmountainranges,can-
yons, and plains in Wyoming, Oregon, Idaho,
andWashington. For Idaho Power Company,
owner and operator of 17 hydroelectric power
plants, preservation of the river is of utmost
importance.
Idaho Power is involved in the generation,
purchase, transmission, distribution, and sale
of electric energy in a 24,000-square-mile area
in southern Idaho and eastern Oregon with an
estimated population of 982,000. It is one of
the nation’s few investor-owned utilities with a
predominantly hydroelectric generating base in
addition to two gas-fired plants and shared own-
ership of three coal-fired generating plants.
If Idaho Power restricted operations of its
Snake River Dam, the utility could potentially
lose substantial revenues and would need to
seek costly alternative sources of energy to
meet the needs of its customers. Instead, Idaho
Powertakesaproactiveapproachtorelicensing
its dams by employing a large staff of experts in
biology, engineering, and GIS technology. The
team primarily studies and monitors hydraulic,
recreational, aquatic, and terrestrial resources
within the utility’s service territory as defined
by FERC.
Looking at Impact on Bliss Rapids Snails
In2004,IdahoPowerbeganitsfive-yearstudy
of the Bliss Rapids snail. The gastropod may
be considered an indicator species, one that
defines the overall health of its habitat and the
river system. Invertebrate biologists and hy-
draulic engineers at IdahoPower are charged
with trying to locate and study habitats includ-
ing the hydraulic environments of threatened or
endangered snail colonies in the middle Snake
River reach.
“We want to learn where and under what
hydraulic and environmental conditions do we
find listed snails,” Butler said. “We need to be
able to answer questions related to snail reac-
tions as the water levels change during seasonal
river flows and normal flow fluctuation from
power generation.”
IdahoPower’steamofexpertshadtoanswer
“Since we use the river system for power
generation and public recreation, we are com-
mitted to being good stewards of our natural
resources and environment,” said Mike Butler,
GISexpertwithIdahoPower.
Eachof the17dams IdahoPoweroperates
along the Snake River is subject to a federal li-
cense through the Federal Energy Regulatory
Commission (FERC). Each license is for a
specified term and must be renewed over time.
Idaho Power is in the process of relicensing
dams throughout its system and complying
with new licenses received in 2004 for Bliss
Dam and Lower Salmon Dam, where a study
is under way to ensure the viability of the Bliss
Rapids snail, a species listed as threatened un-
der the Endangered Species Act.
When an action is likely to adversely affect
any listed species, FERC is not allowed to grant
licenses without a formal consultation with the
U.S. Fish and Wildlife Service (USFWS).
Stewards of the Snake RiverIdaho Power Company Studies Potential Effects of Dams on Snail PopulationBy Jessica Wyland, ESRI Writer
Multibeam sonar data is received inside the boat with other integrated equipment.
The Bliss Rapids snail is listed as a threatened species under the Endangered Species Act.
Energy Currents 17www.esri.com/electricgas
important questions. What are the habitats the
snails occupy and what environmental condi-
tions do they need? What hydraulic variables
impact the snails? If the water level goes up or
down, are the snails able to migrate to the new
environment? Does the utility’s operation cause
harm to the snails? If so, how will the utility
alter operations to minimize its impact?
“Our mission is to collect the data neces-
sary to accurately model the river flows and
locate snail habitats,” Butler said. “From
there, we will be able to determine how
best to minimize possible operating im-
pact to the snails—if any impact is found.”
Determining Data Layers
The utility’s GIS houses a comprehensive set of
layers for studying the river. A substrate layer
Spatial Analyst extension help determine plac-
es on the ground within the river system where
temperature changes need to be understood and
monitored.
Since Bliss Rapids snails are approximately
the size of a pinhead (2 to 3 mm) and, there-
fore, difficult to spot, the team uses Global
PositioningSystem(GPS)technologytolocate
thepopulations.Populationlocationsarestored
in the enterprise geodatabase along with data
for substrate layers, channel classification, wa-
ter temperature, and water velocity.
“GIS allows us to look at the potential area
of impact by flow and even duration of wetting
and drying so we can try to minimize that area
and simultaneously maximize operating poten-
tial,” Butler said. “This is essential to our com-
pany not only during the relicensing process
but also as we continue to produce affordable,
renewable energy for the rate payers.”
Mapping and Modeling the Snake River
By linking GIS-based 3D terrain models with
results from Danish Hydraulic Institute (DHI)
1Dhydraulicmodels,theIdahoPowerteamis
able to simulate through animation and por-
tray with maps all flow regimes the company
may encounter through normal operations.
Researchers are able to overlay inundation
polygons with known snail locations, mapped
habitats, and channel classification polygons
to quantify how much area of preferred snail
habitats are wetted or dewatered at different
operational flows.
With ESRI’s ArcGIS Spatial Analyst and 3D
Analyst extensions, the team created a series of
triangulated irregular networks (TIN) and sur-
face grids that combine underwater topography,
aerial photogrammetry, and various ground
surveys into a seamless physical representa-
tion of the riverbed. Sonar devices are used to
collect underwater topography, or bathymetry.
Ground surveys are conducted by engineers
who map the bed and water surface elevations
using sonar, real-time kinematic (RTK)GPS,
A detailed map of the Snake River shows the effect of solar radiation on water temperature for this stretch of the river.
This flood simulation shows the water flow potential at a low stage of 4,500 cubic feet per second (cfs) versus a flood stage at 20,000 cfs.
identifies changes in the riv-
erbed surface from boulders,
cobbles, gravels, sand, silt, and
muck. A channel classification
layer distinguishes each re-
gion of the river as a bar, pool,
riffle, glide, or rapid. Water
temperature is tracked with a
temperature data logger. Solar
radiation tools in the ArcGIS
Continued on page 23
kj
kj
#**
D
D
D
D
D
Site # 7
Site # 6
568.8
568.7
568.6
568.5
568.4
D River Miles#** Survey Control
kj SolarPoints
1D Model Chainage1D Model Cross Section8000 cfs3500 cfsSlopes < 10%
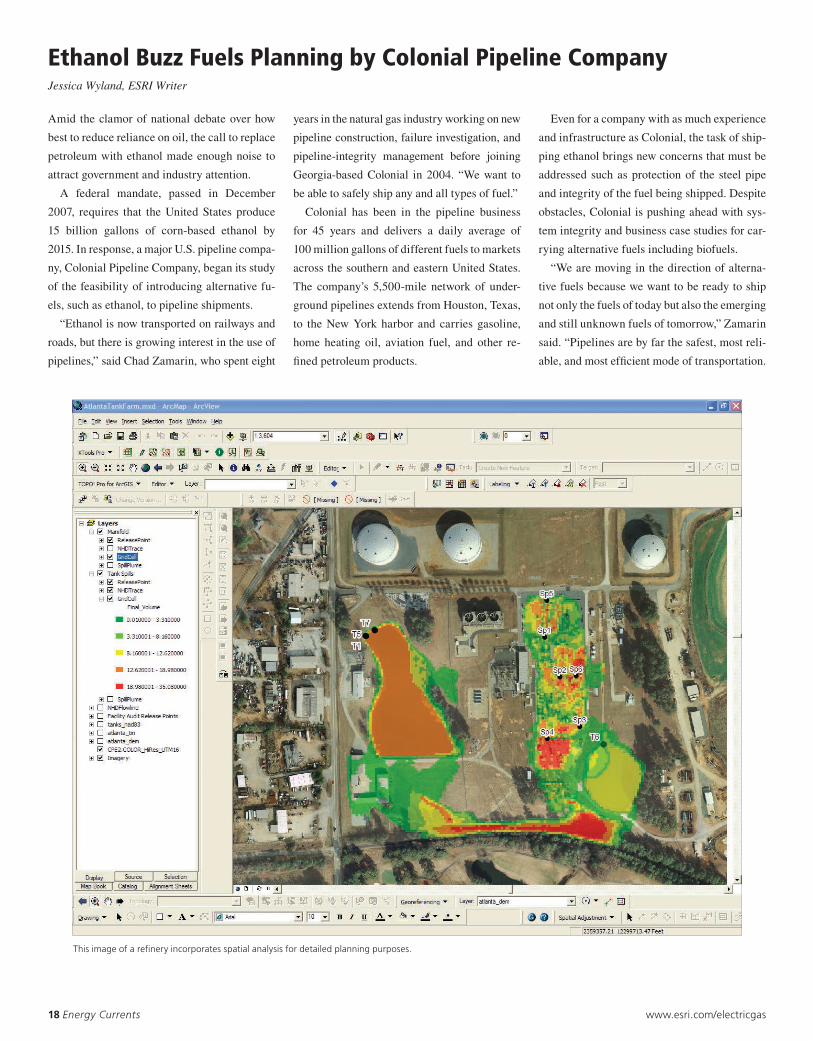
This image of a refinery incorporates spatial analysis for detailed planning purposes.
Energy Currents 19www.esri.com/electricgas
We are trying to figure out how to use our infra-
structure and technology to address the nation’s
energy needs.”
The Challenge of Moving Ethanol
“The first step in addressing the ethanol issue
was to perform an analysis of our existing pipe-
line system to see if we are capable of shipping
ethanol,” Zamarin said.
Colonial and other pipeline industry experts
have learned that ethanol is not directly com-
patible with existing systems. Ethanol is water
soluble and prone to absorbing moisture that
may accumulate in a pipeline. The addition of
water to ethanol can render the ethanol unus-
able as fuel. Additionally, ethanol differs from
petroleum-based fuels in that, in the presence
of certain impurities, it can potentially cause
cracking of steel pipelines. Ethanol can also
have a damaging effect on a steel pipeline’s
equipment and seals.
A second consideration to the idea of ship-
ping ethanol through existing pipelines is loca-
tion. Ethanol production centers are mostly in
theMidwest—far from consumers and not in
direct reach of many existing pipelines. Ethanol
would still have to be shipped to a pipeline in-
jection facility by train, barge, or truck.
To manage the large and growing number
of contingencies and considerations, Colonial
uses geographic information system technol-
ogy. GIS software by ESRI provides a frame-
work for understanding every element of a par-
ticular situation based on geographic location
and relationships. In the pipeline industry, GIS
is used to find the best opportunities for tying
producers to pipelines to terminals and, eventu-
ally, retail gas stations.
“In today’s complex regulatory and opera-
tional environment, it is impossible to effec-
tively manage a pipeline system without the
use of GIS,” said Rob Brook, ESRI’s pipeline
and gas industry manager. “With GIS, you can
reference and integrate limitless amounts of
information and arrive at the type of informed
decisions necessary to ensure public safety.”
Using GIS, pipeline companies layer infra-
structure data with natural resources and popu-
lation information. For Colonial, GIS provides
an integrated account of the company’s assets
and infrastructure. The system tracks the loca-
tion of pipelines, tanks, equipment, and other
components. With the modern geospatial tools
found in ESRI’s ArcGIS software, Colonial can
analyze its infrastructure to quickly identify lo-
cations that may not be compatible with etha-
nol. By building a computer model of proposed
plans, Colonial is able to identify risks and
analyze the use or modification of its pipeline
system for potential ethanol service.
Working with GIS technology, Colonial
has been able to build business models for
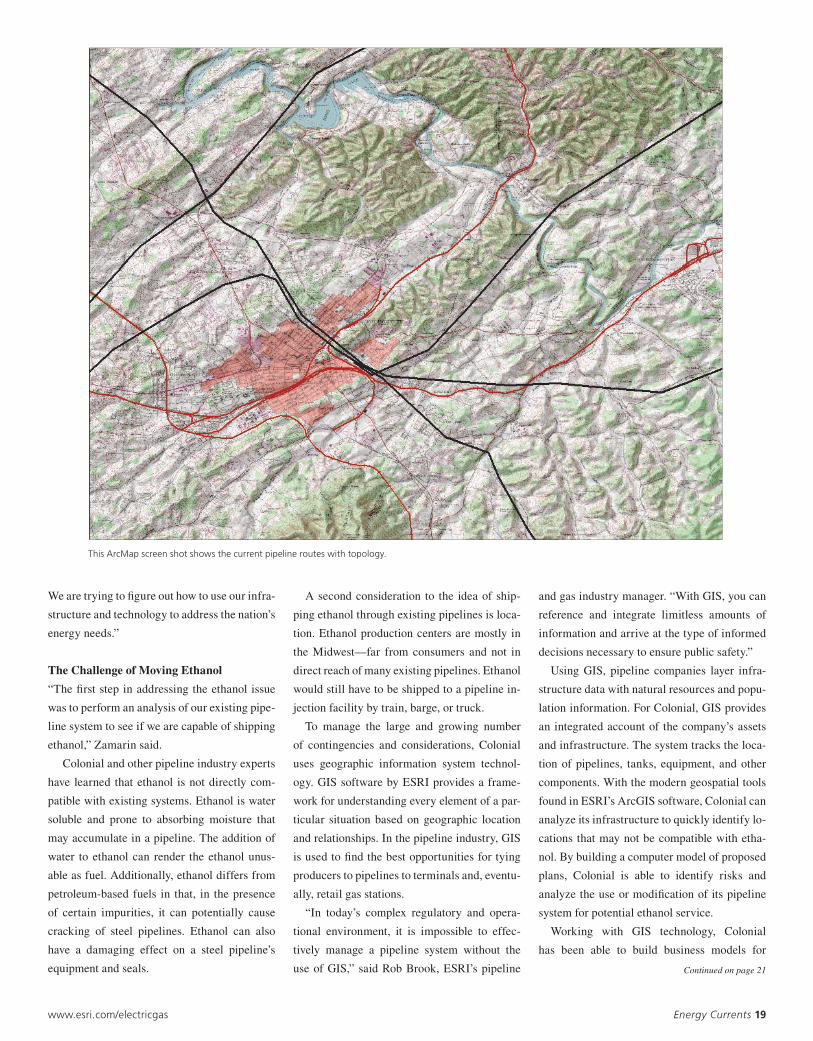
This ArcMap screen shot shows the current pipeline routes with topology.
Continued on page 21
20 Energy Currents www.esri.com/electricgas
lines, aerial photography, and detailed topogra-
phy data to see how the buildable area matches
up with the wind data.”
When development teams visit a proposed
location, they collect site-based data to com-
pare with digital information and maps within
the GIS. Using a mobile device equipped with a
GlobalPositioningSystem(GPS)andGIS,the
team is able to update data from the site and
make any necessary adjustments to the facility
layout.
In total, wind power facility development is
about a four-year process that involves the site
research and data collection as well as procure-
ment of government permits, landowner per-
mission, funding, and the physical resources.
When the plans are ready, developers hand over
the project to the construction team.
“Once all the initial research is done, con-
struction of the wind power complex happens
quickly, sometimes in four to six months,” said
Continued from page 11
Is Renewable Energy the Impossible Dream?
Laurie Jodziewicz, manager of siting policy at
windenergytradegroupAWEA.“Projectsun-
der construction right now will be online and
delivering energy within a year or less.”
Once a wind farm is up and running, opera-
tors continue to use GIS to help gather inspec-
tion and operational data. Since wind energy is
variable, utility companies have to figure out
what to do when the wind does not blow. With
GIS technology, operators can model and pre-
dict how well the wind will perform in the next
few hours or days and accurately match energy
production with demand.
But Will It Work?
Healthy government incentives are driving
much of the wind power development in the
country. A report led by the Department of
Energy’s National Renewable Technology
Laboratory in Golden, Colorado, reiterated pre-
dictions that wind energy will claim a 20 per-
cent share of electricity production in the next
10 years. The report called the forecast “ambi-
tious” but “feasible.”
The energy industry is already on board with
more than 9,000 new wind farms under con-
struction in the United States and nearly 20,000
existing.
“With sophisticated site development tech-
nology and incredible wind resources, wind en-
ergy is becoming increasingly valuable,” said
ESRI’s utility industry expert Meehan. “We are
now seeing utilities integrate wind power into
the electric system to supplement fossil fuels.
Wind is a cost-effective, nonpolluting energy
source that will continue to be one answer to
international energy concerns.”
For more information on utility GIS solu-
tions,visitwww.esri.com/electric.
Turbine blades, loaded on giant flatbed trucks, are driven to IBERDROLA’s Shiloh Wind Power Plant, a 150-megawatt facility near Rio Vista, California, in Solano County. Approximately 100 turbines are spread across about 6,800 acres of active grazing land leased from 26 local landowners. The Renewable Portfolio Standard, adopted in 2002, requires California utilities to procure 20 percent of their energy supply from renewable sources by 2017. The power from Shiloh goes to California customers through power purchase agreements to City of Palo Alto Utilities, Modesto Irrigation District, and Pacific Gas & Electric.
Energy Currents 21www.esri.com/electricgas
shipping ethanol via pipelines. Within the busi-
ness model, Colonial can weigh the costs as-
sociated with various railroads, the production
capacity for each ethanol plant, and the various
transit times from producer to pipeline. Colonial
engineers map and model possible scenarios of
transporting ethanol from producer via trains,
barges, or trucks to pipelines, then terminals,
and back to trucks. Concurrently, the company
can analyze population data within the GIS to
determine where the greatest demand for etha-
nol exists.
As opportunities are emerging, pipeline com-
panies, such as Colonial, have begun route se-
lection and planning for new pipelines. Routing
of new pipelines requires consideration for
property owners, water bodies, environmental
issues, impact to other utilities, types of vegeta-
tion, fault lines, and topography. All this infor-
mation can be represented as layers in a GIS.
“If I want to know what ethanol producers
are closest to Colonial pipelines or what rail-
way systems connect us, I’d have to use a lot
of maps and I still might not figure out which
combination of producer and railroad is best,”
Zamarin said. “The tedious process of shuffling
through paper maps and relying on manual in-
terpretation has become an efficient process of
spatial analysis when we put all the information
into the GIS. We run spatial queries to identify
which ethanol producers connect to railroads
and then in turn connect to our pipeline and in-
tegrate that analysis into our business models to
identify the best opportunity.”
The Debate over Ethanol
While Colonial prepares to respond to the de-
mand for biofuels—ethanol or others—the
discussion of U.S. ethanol policy is intensify-
ing. For decades, the U.S. oil and natural gas
industry has blended ethanol with petroleum to
add octane and oxygen, which reduces certain
kinds of fuel emissions.
“Without ethanol blended into gasoline, gas
today would cost 50 to 60 cents more per gal-
lon, which in turn would raise fuel costs in-
corporated into the price of food,” Renewable
Fuels Association spokesperson Matt Hartwig
Continued from page 19
Ethanol Buzz Fuels Planning by Colonial Pipeline Company
told U.S. News & World Report.
In 2007, U.S. farmers harvested a little more
than 13 billion bushels of corn, according to
reports by the United States Department of
Agriculture (USDA). Before floods overran
much of the Corn Belt, this year’s projected
yield was a record 14.6 billion bushels, with
3.2 billion bushels designated for ethanol and
2.35 billion bushels for export. More recent es-
timates lower total projected yield to 11 billion,
while corn used for ethanol is expected to jump
30 percent.
New questions abound regarding the use of
corn crops. Should corn be consumed, convert-
ed into fuel, fed to animals, or exported? How
much of the corn now being used for ethanol is
affecting food prices?
The biofuels industry faces many complex
issues, but most revolve around geospatial
questions, according to Brook, who sees GIS
technology as a means to solving the nation’s
energy problems.
“Whether you are analyzing regional or na-
tional supply and demand, the impact of natural
disasters, or transportation issues, a geographic
approach to problem solving can provide many
advantages,” Brook said. “Since most of the in-
dustry’s problems are geographic in nature, it
seems that biofuels and GIS are beginning what
should be a long and intimate relationship.”
For more information on GIS for the gas and
pipelineindustry,visitwww.esri.com/pipeline.
The efficiency of pipeline distribution with GIS makes new cross-country lines a viable investment.
22 Energy Currents www.esri.com/electricgas
Two major Brazilian electric distribution
companies, AES Sul and AES Eletropaulo,
signed an enterprise license agreement (ELA)
with ESRI’s Brazilian distributor Imagem
Geosistemas e Comercio Ltda. The ELA will
provide deployments of current ESRI GIS
software for the desktop and server as well as
support, training, and maintenance. Both utili-
ties are taking advantage of this program that
allows them to expand GIS technology across
each company while keeping costs low.
AES Sul recently integrated its accounting
datafromSAPwiththephysicaldatainitsGIS.
ESRI’s ArcGIS platform enables the develop-
ment of GIS visualization and geoprocess-
ing services that can easily be used by other
platforms, such as SAPNetWeaver, to create
composite applications specifically for utilities.
Using ArcGIS Mobile and ArcGIS Server tech-
nologies, AES Sul field crews keep data fresh
with real-time updates of work orders and cus-
tomer information.
“With the integrated platform, AES Sul has
the guarantee of automatic updates that in the
portfolio of generation and distribution busi-
nesses with the capacity to serve 100 million
people worldwide. AES Eletropaulo serves
6 million customers in 24 municipal districts
ofthemetropolitanareaofSãoPaulo.AESSul
serves 1 million consumers in the metropoli-
tanregionofPortoAlegre,theRioPardoand
Taquari valleys, and the Central and Western
Frontier regions.
“We are pleased to support AES Sul and
Eletropaulo with this new agreement,” said
Gustavo Dias, a GIS expert with Imagem.
“This ELA will save the time and money typi-
cally expended on updating GIS technology.
Instead, the utilities will be able to focus on as-
set management, customer service, and expan-
sion of networks.”
The core technology for the ELA is ESRI’s
ArcGIS software, a complete system to author,
serve, and use geographic information. The
technology provides geographic information to
those who need it, including analysts, decision
makers, and field staff, through its support of
mobile, Web, and desktop clients.
past were manual and not completely reliable,”
said Sandra Heck, GIS coordinator for AES
Sul. “Asset management is conducted through
a unique channel that involves access to data
throughtheSAPandGISenvironments.”
AES Eletropaulo uses GIS to meet and keep
its company-wide goal of more rapid response
to work orders and outages. The utility recently
updated its distribution maps and customer da-
tabase within an ArcGIS platform.
“Since implementation of enterprise GIS,
we have seen marked success in the produc-
tivity and quality in our work as well as a
significant reduction in operating costs,” said
Silvio Baldan, a business analyst with AES
Eletropaulo. “We are a company with the high-
est level of technology related to the electric
assets. It is essential for us to be aligned with
international best practices, and this includes
the use of GIS from ESRI.”
AES Sul and AES Eletropaulo are divisions
of major international power company AES.
As one of the world’s largest power companies,
AES owns and operates a diverse and growing
Brazilian Utilities Sign Enterprise License Agreement with ESRIContract Ensures Access to GIS Software, Updates, Maintenance, and Support
Example of AES Sul Electric Distribution Network in ArcGIS Desktop
Energy Currents 23www.esri.com/electricgas
Software plays an increasingly vital role in how
businesses complete their daily mission-critical
activities. While software providers continue
to use traditional licensing models such as the
single-user license or multiple-user shared li-
censes, in some cases, these models no longer
fully satisfy the business issues faced by many
enterprises. ESRI has been working with cli-
ents to address these issues. An example of this
is the new Small Utilities Enterprise License
Agreement (SU-ELA) program.
The SU-ELA option is an affordable, fixed-
cost licensing program that provides IT, busi-
ness, and supply-
chain benefits to
utilities in the United
States with 100,000
customers or fewer.
The program of-
fers unlimited de-
ployments of core
ArcGIS products,
related maintenance, and technical support for
ESRI software. In addition, it includes access
to essential materials such as template solutions
and standard data models.
This type of license provides significant ad-
vantages to a small utility. It allows the IT de-
partment to use standard protocols and technol-
ogy to establish organization-wide standards
and consistent workflows without the costs as-
sociated with additional licenses. It facilitates
the implementation of mission-critical business
solutions. GIS can revolutionize more than
70 different utility processes ranging from asset
and vegetation management and as-built data
integration to spill assessment, outage man-
agement, and risk assessment. It removes the
handcuffs most departments feel are preventing
them from implementing effective solutions.
Lastly, this license option streamlines ad-
ministrative requirements. The SU-ELA pro-
gram simplifies the contract and budgeting
process, saving utili-
ties time and money.
Procurement costs
are reduced because
ELAs require only one
payment per year for
the three-year term.
Administrative costs
shrink as a result of
centralized coordination and management of
software distribution, support, and services.
This new type of licensing is changing the
way GIS is used by small utilities and allowing
them to implement true enterprise systems. For
more information on the SU-ELA program, vis-
itwww.esri.com/suelaorcall1-800-447-9778,
extension 2990.
Full Range of GIS Benefits Provided to Small Utilities through ESRI’s Enterprise License Agreement ProgramBy Robert Brook, ESRI Pipeline and Gas Industry Manager
GIS can revolutionize more than
70 different utility processes ranging
from asset and vegetation manage-
ment and as-built data integration
to spill assessment, outage manage-
ment, and risk assessment.
andtraditionalsurveytechniques.Pressure
transducers were also installed in the river
to log water surface elevations related to
discharge. The river stage data was used to
calibrate several one-dimensional hydraulic
models that are ultimately used to simulate
water flows.
“Now we have the physical environment
mapped in GIS and modeled with hydraulic
modeling software,” Butler said. “We im-
port results from our modeling work into
our GIS to create inundation flood maps for
specific dam discharges.”
GISanalystsatIdahoPowerdevelopeda
series of Visual Basic models to streamline
the flood-mapping process and geodatabase
design and implementation. When the in-
undation polygons are compared with the
channel classification and substrate layers,
suitable and unsuitable snail habitats are
identified for each operating flow.
“We are now able to visualize the inun-
dation area versus discharge relationships
for the entire river reach and how they relate
to snail habitats,” Butler said. “Laboratory
studies have determined that the snails
being studied have high mortality above
certain temperatures and under freezing
conditions. So if we can alter operations to
minimize exposing critical snail habitats to
ambient air temperature and solar radiation,
we can benefit the snail populations by re-
ducing potentially harmful conditions, im-
prove our stewardship in the river system,
and still generate electricity at some of the
lowest energy rates in the country.”
For more information on ESRI’s ArcGIS
Spatial Analyst and 3D Analyst extensions,
visitwww.esri.com/spatialanalyst.
Continued from page 17
Stewards of the Snake River
“
”
Attend the Twenty-ninth AnnualESRI International User Conference
To submit articles for publication in Energy Currents, contact the editor, Jessica Wyland, at [email protected].
Advertisers can contact [email protected]. To subscribe to ESRI publications, visit www.esri.com/subscribe. To unsubscribe from ESRI publications, visit www.esri.com/unsubscribe.
Back issues, missed issues, and other circulation services may also be requested by e-mailing [email protected]; by calling 909-793-2853, extension 1-2778; or by faxing to 909-307-3051.
To update your mailing address, visit www.esri.com/coa or use any e-mail, phone, or fax option.
If you are from outside the United States, please contact your international distributor to subscribe, unsubscribe, or change your address. For a directory of distributors, visit www.esri.com/distributors.
Electric and Gas Solutions GroupBill Meehan, Director Laurence Litrico, CoordinatorE-mail: [email protected] E-mail: [email protected].: 909-793-2853, ext. 1-2135 Tel.: 909-793-2853, ext. 1-2904
Mitchell Garnett, Electric Industry Manager Robert Brook, Gas Industry ManagerE-mail: [email protected] E-mail: [email protected].: 425-445-3500 Tel.: 909-793-2853, ext. 1-3536