221
Energy Efficiency: A Worldwide Review Indicators, Policies, Evaluation A Report of the World Energy Council in Collaboration with ADEME July 2004
Energy Efficiency: A Worldwide Review
Indicators, Policies, Evaluation
A Report of the World Energy Council in Collaboration with ADEME
July 2004

World Energy Council Energy Efficiency Policies and Indicators
ii
Energy Efficiency: A Worldwide Review – Indicators, Policies, Evaluation Copyright 2004 World Energy Council and French Environment and Energy
Management Agency (ADEME) All rights reserved. No part of this publication may be reproduced, stored in a retrieval system or transmitted in any form or by any means electronic, electrostatic, magnetic, mechanical, photocopy, recording or otherwise, without prior permission of the copyright holder.
Published July 2004 by: World Energy Council 5th Floor, Regency House 1-4 Warwick Street London W1B 5LT United Kingdom www.worldenergy.org WEC ISBN 0 946121 17 6 ADEME ISBN 2 86817 775 1
World Energy Council Energy Efficiency Policies and Indicators
iii
ACKNOWLEDGEMENTS
Remerciements This Report has been produced under the guidance of the World Energy Council's Programme Committee. More than 60 WEC Member Committees and other contributors have enthusiastically participated in the collaborative process of this study, particularly by providing information for a questionnaire on energy efficiency policies and measures. We would like to express our thanks to all the experts without whom the work would not have been completed.
This study has been carried out with the support of APERC and OLADE. This international co-operation has added much value to the report by expanding its geographical coverage and thus providing a new dimension to the data collection and its interpretation. We greatly appreciate contributions from ENERDATA experts for the technical co-ordination, in particular that of Bruno Lapillonne, the rapporteur of this report, Nathalie Desbrosses-Quercia in charge of developing the energy efficiency indicators, and Nathalie Malige, for her assistance in the production of the report.
We would also like to thank the authors of the six cases studies included in this report for their expertise in the field of international comparison of energy efficiency policies assessment: Oleg Sinyugin, (Moscow University and formerly with APERC), Philippe Menanteau (LEPI-EPE), Wolfgang Eichhammer (FhG/ISI), José Lopez and Eliane Metreau, ICE, and Bertrand Chateau (ENERDATA).
Finally, we extend our thanks to Elena Nekhaev from the WEC London office who encouraged and advised us throughout.
Ce rapport a été effectué sous le patronage du Comité des Programmes du Conseil Mondial de l’Energie. Plus de 60 comités nationaux et équipes économiques ont participé efficacement et activement au bon déroulement de cette étude, particulièrement en répondant au questionnaire sur les politiques et mesures nationales d’efficacité énergétique. Nous voudrions adresser nos remerciements à tous les experts sans qui le travail n’aurait pu être accompli.
Cette étude a été organisé dans le cadre d’une étroite collaboration de et l’APERC, avec un support de l’OLADE. Cette collaboration a certainement contribué à fournir une valeur ajoutée par rapport aux études précédentes, en étendant la couverture géographique, mais surtout en apportant une nouvelle légitimité à la collecte de données et à son interprétation.
Nous tenons à remercier l’équipe de coordination technique d’ENERDATA qui nous a aidé à élaborer des indicateurs homogènes pour le rapport et à synthétiser l’enquête, et plus particulièrement B. Lapillonne, rédacteur du rapport, Nathalie Desbrosses, responsable des indicateurs, et Nathalie Malige pour son assistance dans la préparation du rapport.
Nous voudrions également remercier les auteurs des études de cas incluses dans ce rapport pour leur grande expertise sur la comparaison internationale de l’évaluation des politiques d’efficacité énergétique : Oleg Sinyugin, (Moscow University, auparavant à APERC), Philippe Menanteau (LEPI-EPE), Wolfgang Eichhammer (FhG/ISI), José Lopez et Eliane Metreau (ICE), et Bertrand Chateau (ENERDATA).
Notre remerciement va aussi à Elena Nekhaev qui nous a beaucoup encouragés et conseillés dans notre travail. Didier Bosseboeuf François Moisan General Secretary of the WEC service Chairman of the WEC service on Energy Efficiency Policy on Energy Efficiency Policy Secrétaire général du service WEC Président du service CME politique d’efficacité énergétique politique d’efficacité énergétique

World Energy Council Energy Efficiency Policies and Indicators
iv
Officers of the World Energy Council Antonio del Rosario Norberto de Franco Medeiros Chair World Energy Council Chair Programme Committee Philip Aiken Shige-etsu Miyahara Vice Chair Sydney 2004 Vice Chair Asia François Ailleret Kieran O’Brien Chair Studies Committee Vice Chair Europe Asger Bundgaard-Jensen Fred Phaswana Vice Chair Finance Vice Chair Africa John Derrick Carlos Pierro Vice Chair North America Vice Chair Latin America/Caribbean Alioune Fall Gerald Doucet Vice Chair GEIS Initiative Secretary General
Member Committees of the World Energy Council Algeria Angola Argentina Australia Austria Bangladesh Belarus Belgium Bolivia Botswana Brazil Bulgaria Cameroon Canada China Congo (Dem. Rep.) Côte d’Ivoire Croatia Czech Republic Denmark Ecuador Egypt (Arab Rep.) El Salvador Estonia Ethiopia Finland France Gabon Georgia Germany Ghana Greece
Guinea Hong Kong, China Hungary Iceland India Indonesia Iran (Islamic Rep.) Ireland Israel Italy Japan Jordan Kenya Korea (Rep.) Latvia Lebanon Libya/GSPLAJ Lithuania Luxembourg Macedonia (Rep.) Mali Mexico Monaco Mongolia Morocco Namibia Nepal Netherlands New Zealand Niger Nigeria Pakistan
Paraguay Peru Philippines Poland Portugal Romania Russian Federation Saudi Arabia Senegal Serbia & Montenegro Singapore Slovakia Slovenia South Africa Spain Sri Lanka Swaziland Sweden Switzerland Syria (Arab Rep.) Taiwan, China Tanzania Thailand Trinidad & Tobago Tunisia Turkey Ukraine United Kingdom United States Uruguay Venezuela Yemen

World Energy Council Energy Efficiency Policies and Indicators
v
TABLE OF CONTENTS
Acknowledgements / Remerciements.....................................................................................iii WEC Officers & Member Committees .................................................................................iv Foreword .................................................................................................................................vii Summary ................................................................................................................................viii Résumé......................................................................................................................................ix
1 Introduction ...............................................................................................1 1.1 Definition and Scope of Energy Efficiency................................................................2 1.2 Energy Efficiency Policies and Measures ..................................................................3 1.3 Energy Efficiency Policies Evaluation .......................................................................5
2 Energy Efficiency Trends .........................................................................7 2.1 Introduction.................................................................................................................7 2.2 Energy Efficiency Indicators ......................................................................................8 2.3 Overall Energy Efficiency Performance.....................................................................9 2.4 Industry .....................................................................................................................17 2.5 Transport...................................................................................................................20 2.6 Household and Service Sectors ................................................................................22 2.7 CO2 Emissions from Energy Combustion ................................................................24 2.8 Conclusions...............................................................................................................26
3 Evaluation of Energy Efficiency Policies and Measures .....................29 3.1 Introduction...............................................................................................................29
3.1.1 The survey ........................................................................................................29 3.1.2 The case studies ................................................................................................32 3.1.3 Content of the evaluation of policy measures...................................................32
3.2 Energy Pricing ..........................................................................................................32 3.3 Institutions and Programmes ....................................................................................37 3.4 Labelling and Efficiency Standards for Household Electrical Appliances ..............39
3.4.1 Description of measures and their deployment ................................................40 3.4.2 Impact of labelling and standards programmes ................................................42 3.4.3 Conclusions and recommendations ..................................................................46
3.5 Innovative Energy Efficiency Funds ........................................................................48 3.5.1 Equity participation and indirect investment through ESCOs..........................49 3.5.2 Carbon Fund based on venture and seed capital ..............................................50 3.5.3 Energy performance contracting.......................................................................52 3.5.4 Guarantee funds ................................................................................................53 3.5.5 Revolving funds................................................................................................54 3.5.6 Synthesis and recommendations.......................................................................56
3.6 Voluntary / Negotiated Agreements .........................................................................59 3.6.1 Introduction.......................................................................................................59 3.6.2 Selection of case studies ...................................................................................60 3.6.3 Impact of VAs/NAs ..........................................................................................62 3.6.4 From Voluntary/Negotiated Agreements to emissions trading ........................66 3.6.5 Conclusions.......................................................................................................67
3.7 Regulations ...............................................................................................................68

World Energy Council Energy Efficiency Policies and Indicators
vi
3.7.1 Efficiency Standards for New Dwellings and Buildings..................................68 3.7.2 Other regulations ..............................................................................................71
3.8 Economic and Fiscal Incentives ...............................................................................72 3.8.1 Economic Incentives.........................................................................................72 3.8.2 Fiscal Incentives ...............................................................................................74 3.8.3 Energy service companies ................................................................................75
3.9 Information ...............................................................................................................75 3.9.1 Energy audits ....................................................................................................75 3.9.2 Local energy information centres .....................................................................77
3.10 Packaging Energy Efficiency Policy Measures ........................................................78 3.10.1 Introduction.......................................................................................................78 3.10.2 Packaging alternative measures to lowering the transaction costs ...................79 3.10.3 Packaging “push-pull” measures to increase the effectiveness of the policy...80 3.10.4 Complementary measures against rebound effects...........................................81 3.10.5 Conditional policy measures to fulfil policy commitments..............................83
4 Conclusions and Recommendations ......................................................85 4.1 Energy efficiency and CO2 trends ............................................................................85 4.2 Evaluation of energy efficiency policies and measures............................................86
4.2.1 Institutional setting ...........................................................................................87 4.2.2 Labelling and standards for electrical appliances .............................................87 4.2.3 Voluntary / negotiated agreements ...................................................................88 4.2.4 Energy efficiency funds....................................................................................89 4.2.5 Impact of liberalisation on energy efficiency: the experience of Latin American
countries ............................................................................................................90 4.2.6 Other measures .................................................................................................91
4.3 Energy efficiency policy monitoring ........................................................................93 4.4 General Conclusions and Recommendations: Energy Efficiency Policies in the New
Decade......................................................................................................................95 Annex A: Energy Efficiency Workgroup………………………………………………….. 97 Annex B: List of Figures, Boxes and Tables………………………………………………. 98 Annex C: List of Acronyms & Abbreviations……………………………………………...99 Bibliography.......................................................................................................................... 101 Annex 1: Case Studies on Energy Efficiency Policy and Measures ................................1-81 Annex 2: Overview of Energy Efficiency Policy Measures Synthesis of the 2003 Survey ..............................................................................1-23

World Energy Council Energy Efficiency Policies and Indicators
vii
FOREWORD The WEC technical service on Energy Efficiency Policies and Indicators is a joint project between the World Energy Council and ADEME and has been running for more than a decade under the chairmanship of Francois Moisan. As the Chairman of the Programme Committee which oversees this service, I have been closely following it over the past three years. The service is focused on the evaluation of energy efficiency trends around the world and the interaction between energy efficiency policies and energy efficiency performance of economies. The main long-term drivers of energy efficiency policies are security of energy supply, efficiency of national economies, environmental concerns, including global warming and, in developing countries, investment constraints on the energy supply side. The enormous potential of energy efficiency improvements at all stages of energy production and use is widely recognised, but realising this potential remains an almost world-wide challenge. I would like to thank the Committee Chair Francois Moisan and his colleagues from ADEME and ENERDATA for their dedication and hard work, and the participating WEC Member Committees, and also the international partner organisations APERC and OLADE for supporting this important project. Development of a more energy efficient global economy is a first step on the path towards sustainable energy development, and like all first steps, is not easy to take. The experience the World Energy Council has accumulated in this area can help make this step a little bit easier. Norberto de Franco Medeiros Chairman of the WEC Programme Committee
World Energy Council Energy Efficiency Policies and Indicators
viii
SUMMARY This study aims at describing energy efficiency trends and evaluating energy efficiency policies. ADEME coordinated the project in association with APERC, (Asia Pacific Energy Research Centre), and OLADE, the Latin American Energy Organisation. This study was carried out over three years with an active contribution of more than 60 countries and the technical assistance of ENERDATA. The first objective of the study is to describe and explain the recent trends in energy efficiency performance in selected countries and regions at macro and sectoral levels. For that purpose a selection of indicators is analysed and compared. The methodology used is directly adapted from the European Commission project on energy efficiency indicators, ODYSSEE (ADEME/EnR/SAVE Project). The second objective is to describe and evaluate energy efficiency policies carried out in a sample of countries all over the world. For that purpose, a survey was carried out in 63 countries. The survey focused on five policy measures, whose evaluation was completed by detailed case studies prepared by selected experts. Beyond a world panorama of energy efficiency measures that have been implemented, the survey aimed to pinpoint the most interesting experiences and to draw some conclusions on their advantages and drawbacks. In particular, the study aims at identifying the policy measures that have proven to be most effective, so as to make recommendations for countries that are newly embarking on energy demand management policies. The Kyoto Protocol objectives and, more recently, the constraints on energy supply have enhanced the priority given to energy efficiency policies. Almost all OECD countries are implementing new instruments adapted to their national circumstances. Given its broad geographical coverage, the report provides a comprehensive and valuable source of information. The association of indicators to policy measures represents an original approach to energy efficiency evaluation. Non-OECD countries are implementing regulations to prevent too fast an increase in their electricity demand: beside the pre-eminent role of market instruments (voluntary agreements, labels, information dissemination), regulatory measures are still effective where the market fails to give the right signals (buildings, appliances). The acquired experience of recent years in the context of low energy prices should be of great interest for the design of new, efficient policies. Transport remains the sector where experience is the weakest. Air quality in cities is a strong argument for developing new technologies and instruments but technology cannot be a definitive solution if infrastructures are not designed for sustainable mobility. This project contributes to the information exchange necessary to remove barriers to energy efficiency improvements, but also to increase the transparency of policy and measures between countries, so as to better consider coordinated policy actions among countries.

World Energy Council Energy Efficiency Policies and Indicators
ix
Résumé Pour les trois derniers congrès du Conseil Mondiale de l’Energie (CME) (Tokyo, Houston, et Buenos Aires), l’ADEME a été chargée de coordonner une étude intitulée “Politiques d’efficacité énergétique”. Cette étude avait pour but de décrire les tendances de l’efficacité énergétique au travers de multiples indicateurs et d’évaluer les politiques d’efficacité énergétique mises en oeuvre. Pour le congrès de Sydney, cette étude a été actualisée et étendue à un échantillon plus large de pays. Pour ce faire, l’ADEME s’est associée à l’APERC, Asia and Pacific Energy Research Centre, et plus récemment avec l’OLADE, Organisation Latino Américaine de l’Energie. Cette étude a été menée durant les trois dernières années avec l’assistance technique d’ENERDATA s.a. et les contributions de plus de 60 pays. Le premier objectif de cette étude est de décrire et expliquer les tendances des performances d’efficacité énergétique dans ces pays. Dans ce but une sélection d’indicateurs sont analysés et comparés. La méthodologie utilisée est directement adaptée du projet européen sur les indicateurs d’efficacité énergétique, ODYSSEE (projet ADEME/EnR/SAVE). Le second objectif est de décrire et évaluer les politiques d’efficacité énergétique mises en oeuvre dans un échantillon de pays au niveau mondial. Dans ce but, une enquête a été effectuée dans 60 pays, représentatifs de toutes les régions du monde. L’enquête s’est concentrée sur 5 types de mesures, dont l’évaluation a été complétée par des études de cas détaillées préparées par des experts. Au-delà d’une description des mesures mises en oeuvre, le but de l’enquête est de repérer les expériences les plus intéressantes et d’en tirer des conclusions sur leurs avantages et limites. En particulier, l’étude vise à identifier les mesures qui se sont révélées les plus efficaces pour faire des recommandations pour les pays les moins avancés dans les politiques de maîtrise de leur consommation. Les objectifs du protocole de Kyoto et, plus récemment, les contraintes sur l’offre ont renforcé la priorité donnée aux politiques d’efficacité énergétique. Presque tous les pays de l’OCDE ont mis en œuvre de nouveaux instruments adaptés à leurs caractéristiques nationales. Ce rapport, avec sa couverture très large des pays et son niveau de mise à jour, fournit une source d’information exhaustive et de haute qualité. La tentative d’associer les indicateurs aux politiques constitue une approche originale d’évaluation de l’efficacité énergétique. Les pays non OCDE sont en train d’instaurer un certain nombre de réglementations pour prévenir une augmentation trop forte de leur demande d’électricité : malgré un rôle croissant des instruments dits de marché (accords volontaires, label, information, dissémination), les mesures réglementaires sont toujours utilisées quand les mécanismes de marché sont insuffisants pour donner le “bon” signal aux consommateurs (bâtiments, équipements électroménagers). L’expérience acquise ces dernières années dans un contexte de bas prix de l’énergie devrait être particulièrement intéressante pour concevoir de nouvelles politiques efficaces. Les transports demeurent le secteur où l’expérience est la moins importante. La qualité de l’air dans les villes est un argument fort pour développer de nouvelles technologies, même si la prévention locale de la pollution est parfois en conflit avec les objectifs d’émissions de CO2 (par exemple, au niveau de la conception des véhicules).

World Energy Council Energy Efficiency Policies and Indicators
x
World Energy Council Energy Efficiency Policies and Indicators
1
1 Introduction For the last three Congresses of the World Energy Council (WEC) - Tokyo, Houston and Buenos Aires - ADEME has led a WEC study project called “Energy Efficiency Policies”. This study aimed at tracing energy efficiency trends through various indicators and at evaluating efficiency policies. For the 2004 World Energy Congress in Sydney, the study has been updated and expanded to include a wider range of countries. For that purpose, ADEME collaborated with APERC, (Asia Pacific Energy Research Centre) and with OLADE (Latin American Energy Organisation). This three-year study was carried out with the technical assistance of ENERDATA S.A., France and the active contributions of more than 60 countries. The first objective of the study was to identify and explain the trends in energy efficiency performance in selected countries and regions. For that purpose a selection of indicators was analysed and compared. The methodology used is directly adapted from the European project on energy efficiency indicators, ODYSSEE (Ademe/EnR/SAVE Project). The second objective was to describe and evaluate energy efficiency policies carried out in a sample of countries all over the world. For that purpose, a survey was carried out in 62 countries. The survey focused on five policy measures, whose evaluation was completed by detailed case studies prepared by selected experts. Beyond a description of measures that have been implemented, the survey aimed to pinpoint the most interesting experiences and to draw some conclusions on their advantages and drawbacks. In particular, this study aims at identifying the policy measures that have proven to be most effective, so as to make recommendations for countries that are newly embarking on energy demand management policies. This report presents the results, conclusions and recommendations of the study. It consists of two main parts: a review of the energy efficiency progress achieved (Chapter 2) and the evaluation of policies and measures (Chapter 3). Finally, in the last chapter (chapter 4) certain recommendations are made, especially for countries that want to learn from the experience of the most advanced countries in terms of energy efficiency policies. Two annexes complement this evaluation. Annex 1 presents country case studies on selected policy measures: minimum energy efficiency standards for household electrical appliances, innovative energy efficiency funds, voluntary/negotiated agreements on energy efficiency/CO2 emissions, and local energy information centres. Annex 2 presents a synthesis of the questionnaire results. In introduction, it is useful to recall the overall framework of energy efficiency policies, to clarify the definition used throughout this report and, finally, to explain why the evaluation of energy efficiency is important. The Kyoto Protocol objectives and, more recently, the constraints on energy supply have enhanced the priority given to energy efficiency policies. Almost all OECD countries and an increasing number of non-OECD countries are implementing new or renewed instruments adapted to their national circumstances. Beside a pre-eminent role of market instruments (voluntary agreements, labels, information dissemination), regulatory measures are very effective where the market fails to give the right signals (buildings, appliances). In less developed countries, energy efficiency is an important issue but often with different driving forces compared to industrialised countries. In these countries, the need to reduce greenhouse gas emissions and local pollution is probably less of a priority: reducing energy

World Energy Council Energy Efficiency Policies and Indicators
2
investments requirement and making the best use of existing supply capacities often rank first. Improving energy efficiency, for instance in electricity use, will have two benefits:
••••
Supply more consumers with the same electricity production capacity, which is often the main constraint in many countries of Africa and Asia;
••••
Slow down the electricity demand growth, and reduce the investment needed for the expansion of the electricity sector; this is especially important in countries with high growth of the electricity demand, such as China and many South East Asian countries.
Given its broad geographical coverage, the report is a comprehensive and valuable source of information. Its objective to relate energy efficiency indicators to energy efficiency policy measures represents an original approach to the evaluation of these policies. 1.1 Definition and Scope of Energy Efficiency The focus of this report is on the evaluation of energy efficiency policies and trends. More precisely, what is meant by “energy efficiency”? Insulating a house makes it obviously more energy efficient from an engineering point of view: less energy is consumed for the same comfort. But this technical improvement at the micro-level may be not visible at the macro-level - the whole stock of dwellings - if, at the same time, more houses are built and/or if the comfort factor is improved. The same can be said for industry: each factory individually can decrease its energy consumption per unit of output with more energy efficient technologies, but this may not be visible at the level of the overall industrial sector, because of an increase in the production or because of a larger share of energy intensive industries in the production. Energy efficiency is not just a technical matter, it is also a matter of efficient services: making a phone call instead of a physical visit, recycling bottles, reducing heat at night, using timber instead of concrete for house construction, all result in a decrease in energy consumption for identical or very similar services. Again, such improvements may exist at the micro-level but may not be directly visible at the macro-level. Assessing energy efficiency also means measuring the overall impact of all the improvements at the micro-level on the evolution of the energy consumption. In some cases, because of financial constraints due to high energy prices, consumers may decrease their energy consumption through a reduction in their energy services (e.g. reduction of comfort temperature; of car mileage). Such reductions do not necessarily result in increased overall energy efficiency of the economy, and are highly reversible. They should not be associated with energy efficiency. Of course, assessing energy efficiency from a policy view point does not mean reviewing each particular dwelling or factory; but certainly it means estimating, or measuring, how far all these improvements at the micro-level did contribute to the actual evolution of the energy consumption in the various sectors, and for the whole country. To economists, energy efficiency has a broader sense than that usually understood by engineers who think in terms of technological efficiency only. In economic terms, it encompasses all changes that result in decreasing the amount of energy used to produce one unit of economic activity (e.g. the energy used per unit of GDP or value added) or to meet the energy requirements for a given level of comfort. Energy efficiency is then associated with economic efficiency and includes technological, behavioural and economic changes.
World Energy Council Energy Efficiency Policies and Indicators
3
Energy efficiency improvements refer to a reduction in the energy used for a given energy service (heating, lighting, etc.) or level of activity. This reduction in the energy consumption is not necessarily associated with technological changes, since it can also result from better organisation and management or improved economic efficiency in the sector (e.g. overall gains of productivity). 1.2 Energy Efficiency Policies and Measures In market economies, energy efficiency is first of all a matter of individual behaviour and reflects the rationale of energy consumers. Avoiding unnecessary consumption of energy, or choosing the most appropriate equipment to reduce the cost of the energy contributes to decrease individual energy consumption without decreasing individual welfare; it also contributes to increase the overall energy efficiency of the national economy. Avoiding unnecessary consumption is certainly a matter of individual behaviour, but it is also, often, a matter of appropriate equipment: thermal regulation of room temperature, or automatic switch off of lights in unoccupied hotel rooms, are good examples of how equipment can reduce the influence of individual behaviour. Making the “good” investment decision, for domestic appliances or industrial devices, from the energy efficiency viewpoint, certainly relies on a sound economic rationale. Good price signals are necessary: Energy efficiency and energy pricing In market economies, where most energy prices to final consumers are deregulated, prices normally reflect fairly accurately the supply costs and thus contribute to macro-economic optimisation. However, for several reasons, prices often reflect only a part of the overall costs, a part which is supported by suppliers. It includes none, or just a few, environmental externalities; none, or only a part of long run marginal development costs, cross subsidies among consumers, etc. As a result, decisions made by final consumers when purchasing equipment or making an energy efficient investment (e.g. retrofitting of dwelling) often do not reflect the drive towards global economic optimisation, creating a gap between the actual achievements in energy efficiency and what could be achieved through an accurate price system accounting for all costs involved. Taxation is the usual means used by governments to reduce or suppress such price distortions at the consumer level. In that sense, taxation is always complementary to energy efficiency policies and measures. It is hardly just a component of these policies and measures because of its much broader socio-economic aspects, but it certainly determines the effectiveness of such policies measures. Energy efficiency and non-price measures Clear price signals alone are not enough to lead to a rationalisation of energy use. Indeed certain conditions are required to remove the usual barriers to energy efficiency and to develop and structure the market for efficient equipment and devices: ••••
The availability of efficient appliances and production devices;

World Energy Council Energy Efficiency Policies and Indicators
4
••••
The availability of good information for consumers about such equipment and devices; and,
••••
The availability of technical, commercial and financial services when necessary.
Any cost related decision concerning energy efficiency, at the individual level, is based, more or less, on a trade-off between the immediate cost and the future decrease in energy expenses expected from increased efficiency. The higher the energy price, observed or expected, the more attractive are the energy efficient solutions. Financial constraints, desire for immediate profit or uneasy attitudes to uncertainty, often lead the final consumers to over-emphasise the immediate cost of equipment and devices in their economic appraisal, which usually does not benefit the selection of efficient equipment or devices. Policy measures are therefore necessary in market economies to reinforce the role of energy prices, firstly to create the appropriate market conditions for efficient equipment, secondly to drive consumer choice towards the most cost effective solutions. They also aim at alleviating the recognised failures in market mechanisms. Three major sources of failures in market mechanisms are often pinpointed to justify the implementation of policy measures: ••••
The information is either missing or partial, and cannot be improved at acceptable cost; ••••
Decision-makers for energy efficiency investments (in buildings, appliances, equipment, etc.) are not always the final users who have to pay the heating or cooling bills: the overall cost of energy service is not transparent to the market;
••••
Financial constraints faced by individual consumers are often much more severe than what are actually revealed by national discount rates or long term interest rates, resulting in a preference for short term profitability. Implicit discount rates in industry are over 20% compared to less than 10% for public discount rates, and 4-6% for long-term interest rates.
Non-price measures are therefore necessary to complement the role of prices. Their main objective is to create the necessary conditions to speed up the development and the deployment of market efficient equipment, through: ••••
Information for and communication with final consumers; ••••
Risk sharing with producers and distributors; ••••
R&D and dissemination in the field of energy efficiency; ••••
Deployment of specific financing mechanisms.
Energy efficiency policy is therefore considered here in a broad sense. It includes all public interventions (“policy measures”) aiming at improving the energy efficiency of a country, through adequate pricing, institutional setting, regulation and economic or fiscal incentives. Information and communication measures have two main targets: ••••
To increase the awareness of final consumers about the individual and national benefits of energy efficiency;
••••
To open the range of possibilities for the technical decisions to be made by the final consumers and reveal the overall costs of all possibilities.
Sharing the economic risk with the producers and distributors of efficient equipment and devices can take several forms: loan, subsidy, tax credit, etc. The main target is to overcome
World Energy Council Energy Efficiency Policies and Indicators
5
the commercial barrier raised by the initial developer of efficient equipment and devices, as compared to less efficient ones. Supporting R&D and dissemination costs from public funds, and channelling valorisation through advanced energy efficient technologies, equipment and devices to private interests, aims at speeding up the penetration of efficient equipment and devices and at decreasing their costs on the market. Implementing specific financing mechanisms has two targets:
••••
For consumers, to reduce the market imbalance (due to financial constraints) between cost- effective solutions with high investment / low operating costs (energy efficient), on the one side, and low investment / high operating costs (less efficient) on the other side;
••••
For suppliers, to help implement production or distribution activities in the field of energy efficient products and services.
Chapter 3 proposes a classification of the various types of non-price-based measures and discusses their conditions of implementation, as well as their use in the various world regions. 1.3 Energy Efficiency Policies Evaluation Energy efficiency policies and measures are not free. Whatever the organisation and implementation scheme of the policy, whatever the measures taken, there is a cost for the taxpayer. As a general rule, energy efficiency policies and measures are economically sound if the macro-economic benefits of increased energy efficiency due to these policies and measures outweigh the overall cost for the taxpayers. The bigger the difference between the benefit and the cost, the more attractive and effective are the policies and measures. Evaluating energy efficiency policies and measures is therefore necessary for two basic reasons: prudent management of the public budget, and the cost-effectiveness of achieving energy efficiency goals. Assuming that micro-decisions related to energy efficiency are usually cost-effective at the consumer level, the question of energy efficiency policy evaluation can be raised at two levels: ••••
From the taxpayer viewpoint: what is the public cost involved in the policies and measures?
••••
From the macro-economic viewpoint: what is the benefit resulting from the actual progress in energy efficiency achieved through the policies and measures?
Several difficulties rapidly emerge when one attempts to assess energy efficiency progress. First of all, from a conceptual viewpoint, energy efficiency is at the same time both a pure economic concept (similar to that of productivity) and a political concept (the result of energy efficiency policy); the boundary between these two concepts is never clear. Secondly, from a methodological viewpoint, it is difficult to separate out the various causes behind observed actual energy efficiency improvement: more energy efficient socio-economic structures, price setting, results of sectoral policy measures; etc. A good illustration is the example of cars. How to measure the energy efficiency of cars: in terms of technology, of drivers’ behaviour, of pattern of use?

World Energy Council Energy Efficiency Policies and Indicators
6
Energy efficiency indicators designed and calculated in this project aim at developing solutions to these difficulties, in three ways:
• Overall macro-economic indicators tend to reconcile the macro-economic and political concepts of energy efficiency, measuring separately the main components of the overall energy intensity of the GDP: those linked to the structure of the economy and those linked to sectoral energy efficiencies;
• Sectoral indicators aim first at reconciling the economic appraisal of energy efficiency in the sectors with the technical appraisal of efficiency improvements in dwellings, vehicles, industrial processes, etc., and second at relating these technical appraisals to the evaluation of actual energy savings, from which economic benefits can be estimated;
• Comparative indicators across countries, based on a comparable data set, aim at allowing comparison across countries in order to mark out, in energy efficiency achievements, what could be due to differences in policies and measures and to taxation and pricing policies.

World Energy Council Energy Efficiency Policies and Indicators
7
2 Energy Efficiency Trends 2.1 Introduction This chapter reviews recent energy efficiency trends by world region on the basis of a set of homogeneous indicators covering twelve years (1990-2002). Our previous assessment from the 2001 report was based on energy consumption trends that excluded biomass and other traditional fuels. In this report, the energy indicator includes biomass, as many OECD countries are now promoting the use of biomass as a way to reduce emissions of greenhouse gases. Therefore, the trends presented in this report cannot be directly compared to the results of the previous report. The data used for the calculation of the energy efficiency indicators were taken from the world energy database of ENERDATA1. This database relies on harmonised data from international organisations (International Energy Agency-IEA, EUROSTAT, World Bank, Asian Development Bank, IMF), from specialised bodies (CEDIGAZ, for instance), as well as from national agencies and organisations (electricity utilities, energy ministries). It provides a consistent coverage of the world energy consumption, split by main regions, and is kept up-to-date to take into account the most recent trends. Some more detailed indicators were taken for European Union (EU) countries from the ODYSSEE database2. The indicator trends are shown for various world regions. The world is divided into seven main regions. Europe and Asia, because of their size and heterogeneity, are split into sub-regions and main countries: three sub-regions for Europe; two countries and three sub-regions for Asia (Box 1). Box 1: Breakdown of the world by region /countries
Europe: - Western Europe3 - CIS - Central and Eastern European countries (CEECs)4
North America: US, Canada
Latin America: Mexico, Central America, Caribbean, South America
Asia: - China - Japan - Newly industrialised economies (NICs)5 - South Asia (India, Pakistan) - Other Asian countries
Africa Middle East Oceania: Australia, New Zealand, other Pacific Islands 1 For more information, see www.enerdata.fr 2 The ODYSSEE data base has been developed since 1990 at the EU level within a joint project between ADEME (coordinator), the SAVE programme of the European Commission and all EU energy efficiency agencies; it is also supported by EnR, the network of energy efficiency agencies. For more information, see www.odyssee-indicators.org. 3 EU15, Norway, Switzerland and Turkey 4 This includes 8 of the new EU members, plus two candidates to the EU accession (Bulgaria and Romania), Albania, as well as the other former Yugoslavian countries 5 Republic of Korea; Singapore; Taiwan, China; Hong Kong, China.

World Energy Council Energy Efficiency Policies and Indicators
8
This chapter is introduced by a presentation of the indicators proposed at the level of the whole economy and at the level of economic sectors. Then a comparison of energy efficiency trends across the various world regions under consideration is presented: first the overall energy efficiency trends, then the trends by sector (industry, transport, households, and services). Particular attention is given to the relationship between, on the one hand, energy efficiency achievements (as assessed from the indicators) and, on the other hand, economic development (in particular the role of structural changes in the economy) and energy efficiency policies. 2.2 Energy Efficiency Indicators The energy efficiency indicators considered here are designed to monitor changes in energy efficiency and to allow cross-country comparisons of various energy efficiency situations. Two types of indicators are considered for the description of energy efficiency: economic ratios, and techno-economic ratios. Economic ratios are used each time energy efficiency is measured at a high level of aggregation, i.e. at the level of the whole economy or of a sector. Indeed, at such a level it is not possible to present the activity using technical or physical indicators. These economic ratios, referred to as energy intensities, are defined as ratios between energy consumption, measured in energy units - tonnes of oil equivalent/(toe) - and indicators of economic activity, measured in monetary units at constant prices (gross domestic product (GDP), value added, etc. To make these energy intensities more comparable, they are all converted to purchasing power parities at 1995 prices and parities, unless otherwise specified (see Box 2). Box 2: Energy intensities at purchasing power parities (PPPs)
GDP and value added data for all regions are converted at purchasing power parities to reflect differences in general price levels.6
Using purchasing power parities rates instead of exchange rates increases the value of GDP in regions with a low cost of living (most countries in Central and Eastern Europe), and therefore decreases their energy intensities. On average, for non-OECD countries the GDP at purchasing power parties is 2-7 times higher than if it is expressed at exchange rates (factor 3 for CIS and 2.3 for China).
The use of purchasing power parities in measuring energy intensities greatly improves the comparability between regions with different levels of economic development, as it narrows the gap between regions, compared to what would be shown with exchange rates. The intensities are measured at 1995 prices and exchange rates: therefore, the use of purchasing power parities changes the magnitude of the indicators but does not affect the trends. Techno-economic ratios are calculated at a disaggregated level (by sub-sector or end-use) by relating energy consumption to an indicator of activity measured in physical terms (tonnes of steel, number of passenger-kilometres, etc.) or to a consumption unit (e.g. per vehicle, dwelling, etc.). These techno-economic ratios are called unit consumption. For a better comparison of energy efficiency performance between countries, some indicators are adjusted to a reference structure. However, even if the comparison is improved, not all structural differences can be taken into account.
6 The purchasing power parities by country come from the World Bank. The GDP of each region at purchasing power parities is then calculated as the sum of countries in the region.

World Energy Council Energy Efficiency Policies and Indicators
9
The indicators calculated in this study are available by country on the WEC web site (www.worldenergy.org). To allow a meaningful comparison of energy efficiency between countries, these indicators need to be based on common definitions; in particular the definition of energy consumption needs to be the same for all countries. The definition used in this report is given in Box 3. Box 3: Definitions and measurement of energy consumption
The following definitions are adopted in this report: Nuclear, hydro, wind and geothermal electricity is converted to tonnes of oil equivalent (toe) according to the IEA methodology: 0.26 toe/MWh (10.9 GJ) for nuclear, 0.086 toe/MWh (3.6 GJ) for hydro and wind, and 0.86 toe/MWh (36 GJ) for geothermal. Final consumption of electricity is converted to toe according to its calorific value, i.e. 0.086 toe/MWh (3.6 GJ). Biomass is included in energy consumption figures, unless otherwise specified. Non-energy uses (or feedstocks) are excluded from final energy consumption, since the objective is to monitor efficiency of energy use, which by definition does not include the use of energy products as raw materials. 2.3 Overall Energy Efficiency Performance A general indication of energy efficiency performance is given by the primary energy intensity (or total energy intensity), which relates the total energy consumption of the region or country to its GDP. Primary energy intensity measures how much energy is required by each country or region to generate one unit of GDP. It is therefore more an indicator of “energy productivity” than a true indicator of efficiency from a technical viewpoint. Its value reflects the nature of the economic activity of the country (the “economic structure”) and the structure of the energy mix, as well as the technical energy efficiency. As a very long-term trend, energy intensities follow a “bell curve”, generally with developing countries to the left, with increasing intensities, and developed countries on the right side, with decreasing values. The energy intensity is generally considered to be a reliable indicator as it is calculated using basic statistics. However, its interpretation is sometimes questionable for countries where part of their economic activity is informal (i.e. not accounted in the GDP) and where the use of traditional fuels is important, as the consumption of these fuels is usually not well monitored. Energy intensity is widely used to evaluate how efficiently energy is used, and it can provide signals to decision-makers about energy efficiency trends. However, energy intensity is influenced by many factors, among which energy efficiency is only one component. Changes in the structure of a country’s national economy (the “economic structure”) or in its energy mix can have a strong impact on the energy intensity indicators. The ODYSSEE project is using an alternative indicator, calculated from an evaluation by end-use (bottom up approach); this new indicator replaces the overall energy intensity to monitor energy efficiency trends in the EU157. 7 See www.odyssee-indicators.org.

World Energy Council Energy Efficiency Policies and Indicators
10
Higher GDP for less energy resulting in large energy savings at the world level: average annual energy intensity improvement of 1.5%, rising to 1.8% since 1996
At world level, there has been a continuous decline in the primary energy intensity8, by approx. 1.5% p.a. between 1990 and 2002 (1.4% since 1980). This reduction in the energy intensity resulted in large energy savings: 4.0 Gtoe since 1980 (37% of the total consumption in 2002), and 2.1 Gtoe since 1990 (or 20% of the total consumption).
Acceleration of the overall energy efficiency improvement since 1996 Until 1996, the trend had been rather regular (around 1.3% p.a.). Since 1996, there has been a net acceleration, with a decrease of 2% per year on average.
Energy intensity levels and trends are different between the regions The CIS requires twice more energy per unit of GDP than the world average (Figure 2.1). On the other hand, Japan, Western Europe, Latin America and South Asia require only two third of the world average. Among OECD countries, the performance levels are quite diverse: Japan and Western Europe have similar levels of intensity whereas North America and Oceania (Australia and New Zealand) have much higher energy intensity (45% higher for North America and 40% for Oceania). In former centrally planned economies or regions (CIS, CEECs), energy intensity levels are much higher than the world average. This situation can be explained by various factors: lower energy efficiency, dominant role of energy intensive industries, underestimation of the GDP, and lower general price levels, not fully corrected by the use of purchasing power parities.
Figure 2.1: Primary energy intensity by world region
Intensité énergétique primaire par région du monde
0 .0
0 .1
0 .2
0 .3
0 .4
0 .5
0 .6
0 .7
0 .8
0 .9
W e s te rnE u ro p e
C IS C E E C 's N o rthA m e ric a
L a tinA m e ric a
C h in a J a p a n A s ia(N IC 's )
S o u thA s ia
O th e rA s ia
A fr ic a M id d leE a s t
O c e a n ia W o rld
koe/
$95p
pp
1 9 8 0 1 9 9 0 1 9 9 5 2 0 0 2 Source: ENERDATA.
8 The primary energy intensity (or total energy intensity) relates the total consumption of a region (including biomass) to its GDP. This indicator measures how much energy is required to generate one unit of GDP. This widely used indicator reflects the influence of many factors: the nature of the economic activity of the country, the structure of the energy mix, and finally energy efficiency, as targeted by energy efficiency policy measures, which is only one component.
World Energy Council Energy Efficiency Policies and Indicators
11
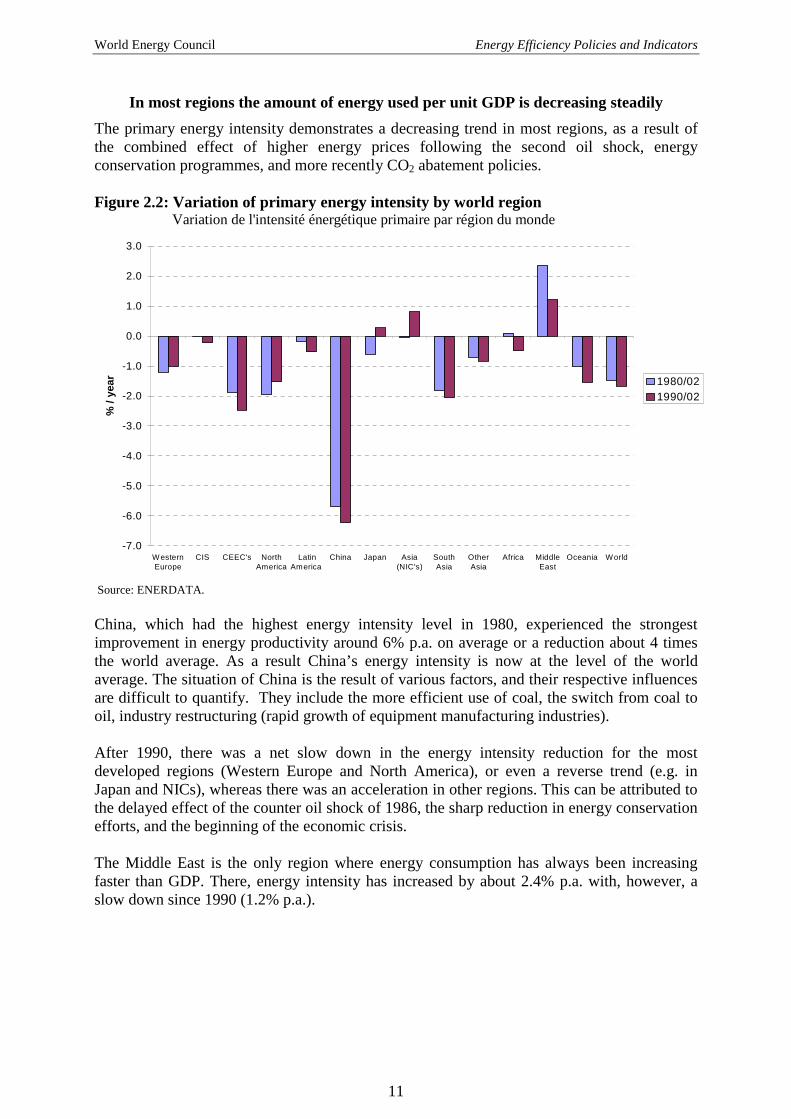
In most regions the amount of energy used per unit GDP is decreasing steadily
The primary energy intensity demonstrates a decreasing trend in most regions, as a result of the combined effect of higher energy prices following the second oil shock, energy conservation programmes, and more recently CO2 abatement policies. Figure 2.2: Variation of primary energy intensity by world region
Variation de l'intensité énergétique primaire par région du monde
-7.0
-6.0
-5.0
-4.0
-3.0
-2.0
-1.0
0.0
1.0
2.0
3.0
WesternEurope
CIS CEEC's NorthAmerica
LatinAmerica
China Japan Asia(NIC's)
SouthAsia
OtherAsia
Africa MiddleEast
Oceania World
% /
year 1980/02
1990/02
Source: ENERDATA. China, which had the highest energy intensity level in 1980, experienced the strongest improvement in energy productivity around 6% p.a. on average or a reduction about 4 times the world average. As a result China’s energy intensity is now at the level of the world average. The situation of China is the result of various factors, and their respective influences are difficult to quantify. They include the more efficient use of coal, the switch from coal to oil, industry restructuring (rapid growth of equipment manufacturing industries). After 1990, there was a net slow down in the energy intensity reduction for the most developed regions (Western Europe and North America), or even a reverse trend (e.g. in Japan and NICs), whereas there was an acceleration in other regions. This can be attributed to the delayed effect of the counter oil shock of 1986, the sharp reduction in energy conservation efforts, and the beginning of the economic crisis. The Middle East is the only region where energy consumption has always been increasing faster than GDP. There, energy intensity has increased by about 2.4% p.a. with, however, a slow down since 1990 (1.2% p.a.).
World Energy Council Energy Efficiency Policies and Indicators
12
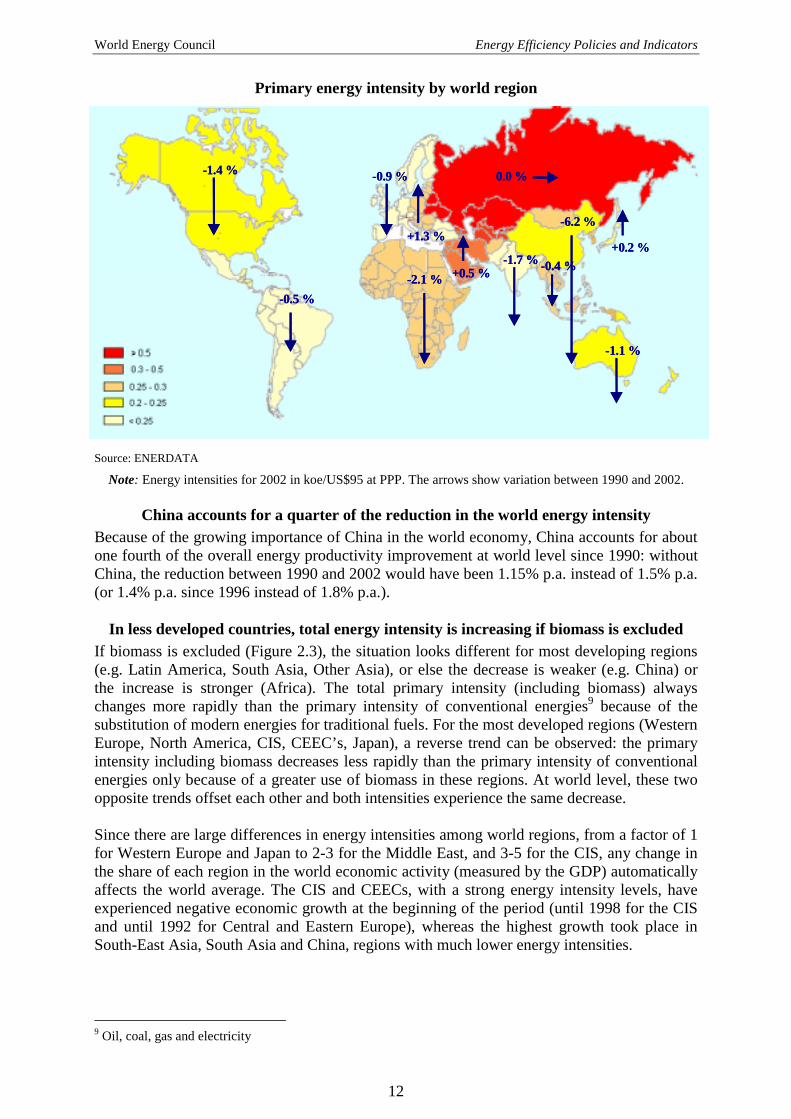
Primary energy intensity by world region
Source: ENERDATA
Note: Energy intensities for 2002 in koe/US$95 at PPP. The arrows show variation between 1990 and 2002.
China accounts for a quarter of the reduction in the world energy intensity Because of the growing importance of China in the world economy, China accounts for about one fourth of the overall energy productivity improvement at world level since 1990: without China, the reduction between 1990 and 2002 would have been 1.15% p.a. instead of 1.5% p.a. (or 1.4% p.a. since 1996 instead of 1.8% p.a.).
In less developed countries, total energy intensity is increasing if biomass is excluded If biomass is excluded (Figure 2.3), the situation looks different for most developing regions (e.g. Latin America, South Asia, Other Asia), or else the decrease is weaker (e.g. China) or the increase is stronger (Africa). The total primary intensity (including biomass) always changes more rapidly than the primary intensity of conventional energies9 because of the substitution of modern energies for traditional fuels. For the most developed regions (Western Europe, North America, CIS, CEEC’s, Japan), a reverse trend can be observed: the primary intensity including biomass decreases less rapidly than the primary intensity of conventional energies only because of a greater use of biomass in these regions. At world level, these two opposite trends offset each other and both intensities experience the same decrease. Since there are large differences in energy intensities among world regions, from a factor of 1 for Western Europe and Japan to 2-3 for the Middle East, and 3-5 for the CIS, any change in the share of each region in the world economic activity (measured by the GDP) automatically affects the world average. The CIS and CEECs, with a strong energy intensity levels, have experienced negative economic growth at the beginning of the period (until 1998 for the CIS and until 1992 for Central and Eastern Europe), whereas the highest growth took place in South-East Asia, South Asia and China, regions with much lower energy intensities.
9 Oil, coal, gas and electricity
+0.2 %
-0.9 %
- 0.5 %
-1.7 %
- 6.2 %
- 1.1 %
- 1.4 %
-0.4 %
+1.3 %
-2.1 % +0.5 %
0.0 %
+0.2 %
-0.9 %
- 0.5 %
-1.7 %
- 6.2 %
- 1.1 %
- 1.4 %
-0.4 %
+1.3 %
-2.1 % +0.5 %
0.0 %
+0.2 %
-0.9 %
- 0.5 %
-1.7 %
- 6.2 %
- 1.1 %
- 1.4 %
-0.4 %
+1.3 %
-2.1 % +0.5 %
0.0 %

World Energy Council Energy Efficiency Policies and Indicators
13
Figure 2.3: Primary energy intensity (with and without biomass) (1980-2002) Intensité énergétique primaire (avec et sans biomasse)
-6,0
-5,0
-4,0
-3,0
-2,0
-1,0
0,0
1,0
2,0
3,0
W esternEurope
C IS CEEC 's N orthAm erica
LatinAm erica
C hina Japan As ia(N IC 's)
SouthAsia
O therAs ia
A frica M iddleEast
O ceania W orld
% /
year
W ith biom ass W ithout b iom ass
Source: ENERDATA
Part of the reduction in the total energy intensity of the world economy comes from a more rapid growth in regions with a low energy intensity
To assess the influence of this structural factor, a fictive energy intensity can be calculated assuming a constant share of each region in the world GDP (e.g. 1990 shares). Since 1990, the decrease of the world energy intensity at constant GDP structure is lower: 1.1% per year against 1.5% per year. This means that about ¼ of the reduction was due to the differences in the pace of economic development across regions. The influence is more important if traditional fuels are excluded: reduction of 1.0% per year for the intensity at constant structure, which in that case means that about 35% of the reduction comes from changes in the world GDP structure by region (Figure 2.4).
Figure 2.4: Variation of the world energy intensity (1990-2002) Variation de l'intensité énergétique du monde
-1.8
-1.6
-1.4
-1.2
-1.0
-0.8
-0.6
-0.4
-0.2
0.0
Excluding Biom ass
%/ y
ear
actual at 1990 GDP m ix change in GDP m ix by region Source: WEC study from ENERDATA
World Energy Council Energy Efficiency Policies and Indicators
14
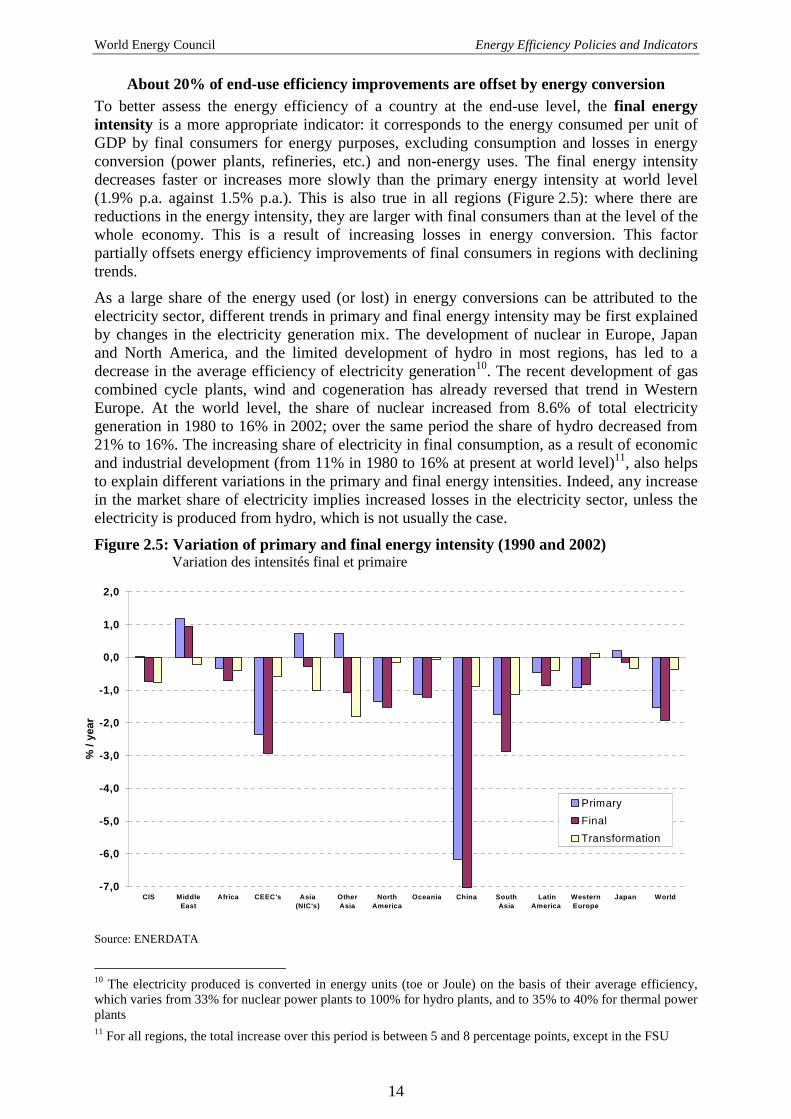
About 20% of end-use efficiency improvements are offset by energy conversion To better assess the energy efficiency of a country at the end-use level, the final energy intensity is a more appropriate indicator: it corresponds to the energy consumed per unit of GDP by final consumers for energy purposes, excluding consumption and losses in energy conversion (power plants, refineries, etc.) and non-energy uses. The final energy intensity decreases faster or increases more slowly than the primary energy intensity at world level (1.9% p.a. against 1.5% p.a.). This is also true in all regions (Figure 2.5): where there are reductions in the energy intensity, they are larger with final consumers than at the level of the whole economy. This is a result of increasing losses in energy conversion. This factor partially offsets energy efficiency improvements of final consumers in regions with declining trends.
As a large share of the energy used (or lost) in energy conversions can be attributed to the electricity sector, different trends in primary and final energy intensity may be first explained by changes in the electricity generation mix. The development of nuclear in Europe, Japan and North America, and the limited development of hydro in most regions, has led to a decrease in the average efficiency of electricity generation10. The recent development of gas combined cycle plants, wind and cogeneration has already reversed that trend in Western Europe. At the world level, the share of nuclear increased from 8.6% of total electricity generation in 1980 to 16% in 2002; over the same period the share of hydro decreased from 21% to 16%. The increasing share of electricity in final consumption, as a result of economic and industrial development (from 11% in 1980 to 16% at present at world level)11, also helps to explain different variations in the primary and final energy intensities. Indeed, any increase in the market share of electricity implies increased losses in the electricity sector, unless the electricity is produced from hydro, which is not usually the case.
Figure 2.5: Variation of primary and final energy intensity (1990 and 2002) Variation des intensités final et primaire
Source: ENERDATA
10 The electricity produced is converted in energy units (toe or Joule) on the basis of their average efficiency, which varies from 33% for nuclear power plants to 100% for hydro plants, and to 35% to 40% for thermal power plants 11 For all regions, the total increase over this period is between 5 and 8 percentage points, except in the FSU
-7,0
-6,0
-5,0
-4,0
-3,0
-2,0
-1,0
0,0
1,0
2,0
CIS MiddleEast
Africa CEEC's Asia(NIC's)
OtherAsia
NorthAmerica
Oceania China SouthAsia
LatinAmerica
WesternEurope
Japan World
% /
year
PrimaryFinalTransformation

World Energy Council Energy Efficiency Policies and Indicators
15
Most of the decrease in the primary energy intensity can be attributed to the industrial sector
Evaluation of the primary intensity by sector (industry, transport, household and services, and transformation) shows how each sector contributed to the variation in primary intensity (Figure 2.6). The sum of the three first sectors corresponds to the final energy intensity; the transformation sector represents the difference between the primary and the final intensity (i.e. it is mostly energy used in energy conversion, as well as non-energy uses). The energy intensity reduction in the industrial sector is clearly visible for all countries where the primary energy intensity is decreasing. At world level, the reduction of the energy intensity of industry was 2.7% p.a., i.e. almost twice as quickly as for the whole economy. This trend was very regular over the period 1980-2002. The increasing role of transport is another striking trend: the increase in the intensity of transport, around 1% p.a. at world level, has slowed down the decrease in total energy intensities.
As described above, the share of the conversion sector in the primary energy intensity is increasing everywhere.
Figure 2.6: Primary energy intensity by sector (1980 and 2002) Intensité primaire par secteur
0 .0
0 .1
0 .2
0 .3
0 .4
0 .5
0 .6
C IS M id d leE a s t
A fr ica C E E C 's A s ia(N IC 's )
O th e rA s ia
N o rthA m e ric a
O ce an ia C h in a S ou thA s ia
La tinA m e rica
W e s te rnE u ro p e
Ja p an W o rld
koe/
$95p
pp
tra ns fo rm a tion ho u se h o lds tran spo rt in du s try
C IS M id d le A fr ica C E E C 's A s ia O th e r N o rth O ce a n ia C h in a S o u th L a tin W e s te rn Ja p a n W o rld E a s t (N IC 's ) A s ia A m e ric a A s ia A m e rica E u ro p e
0 .8 5
Source: ENERDATA Changes in economic structure also influence energy intensities: services require 7 times
less energy inputs per unit of value added than industry Overall energy intensities, whether primary or final, capture all the factors that contribute to changes in the amount of energy required to produce one unit of GDP, including technical, managerial and economic factors. In this sense, changes in the economic structure contribute to variations in overall energy intensities, although this phenomenon is not generally the result of energy efficiency policies. For example, all things being equal, the tertiarisation of the economy will decrease total energy intensities. Indeed, the energy intensity of industry is 7 times higher than that of the service sector at world level. In other words, it requires seven times as much energy to produce one unit of activity in industry compared to the service sector. In OECD countries, the difference in these intensities is around 4 to 6.5, depending on the region. In non-OECD countries it is even higher, above a factor of 10. The effect of

World Energy Council Energy Efficiency Policies and Indicators
16
structural changes is especially important in countries with rapid economic growth. The share of industry in the GDP varies from 25% in Western Europe and North America, to 30% for the world average and around 50% in China. The share of services is in a range of 30% in China, and from 60-70% in OECD countries, with a world average of around 50%. In order to monitor better energy efficiency trends in relation to energy pricing and energy management policies, it is necessary to exclude the influence of structural changes. This is achieved by calculating an energy intensity at constant GDP structure, i.e. assuming a constant share of GDP for agriculture, industry and services (see Box 4) as well as a constant structure of the industrial value added by major sub-sectors of industry. In this study, however, because of a lack of data on energy consumption and value added by industrial sub-sectors for most countries, the constant GDP structure was calculated on the basis of the three main sectors only (i.e. agriculture, industry, services)
Box 4: Final energy intensity at constant GDP structure
The final energy intensity at constant GDP structure is a fictive value of the final energy intensity calculated assuming that the GDP structure by sector is unchanged from the base year, only taking into account the actual variation in the energy intensity of each sector.
This intensity calculation provides an assessment of energy efficiency trends without the influence of changes in GDP structure. The difference in the variations of final energy intensity and final energy intensity at constant GDP structure over time shows the influence of structural changes.
It is calculated in one of the two ways: constant structure between the three main sectors (agriculture, industry, services), as in the case of this study; constant structure between 10 main industrial sub-sectors, and agriculture and services, as in the ODYSSEE project12.
Figure 2.7 compares the actual evolution of the final energy intensity with that at constant economic structure. The difference between these intensities shows the influence of structural changes in the economy. The intensity at constant GDP structure can be considered as a better macro-economic indicator to capture energy efficiency trends than the usual energy intensity.
Figure 2.7: Role of structural changes in the GDP (1990-2002) Rôle des changements structurels dans le PIB
-60
-50
-40
-30
-20
-10
0
10
20
M idd leE a st
Afric a As ia(N IC 's )
N o rthA m e rica
O ce an ia C h in a S o u thAs ia
La tinAm e ric a
W es te rnE u ro pe
J ap a n W o rld
%
ac tua l a t cons tan t s truc tu re s truc tu ra l change
12 See www.odyssee-indicators.org or a similar project on Central and Eastern European Countries www.ceec-indicators.org.
World Energy Council Energy Efficiency Policies and Indicators
17
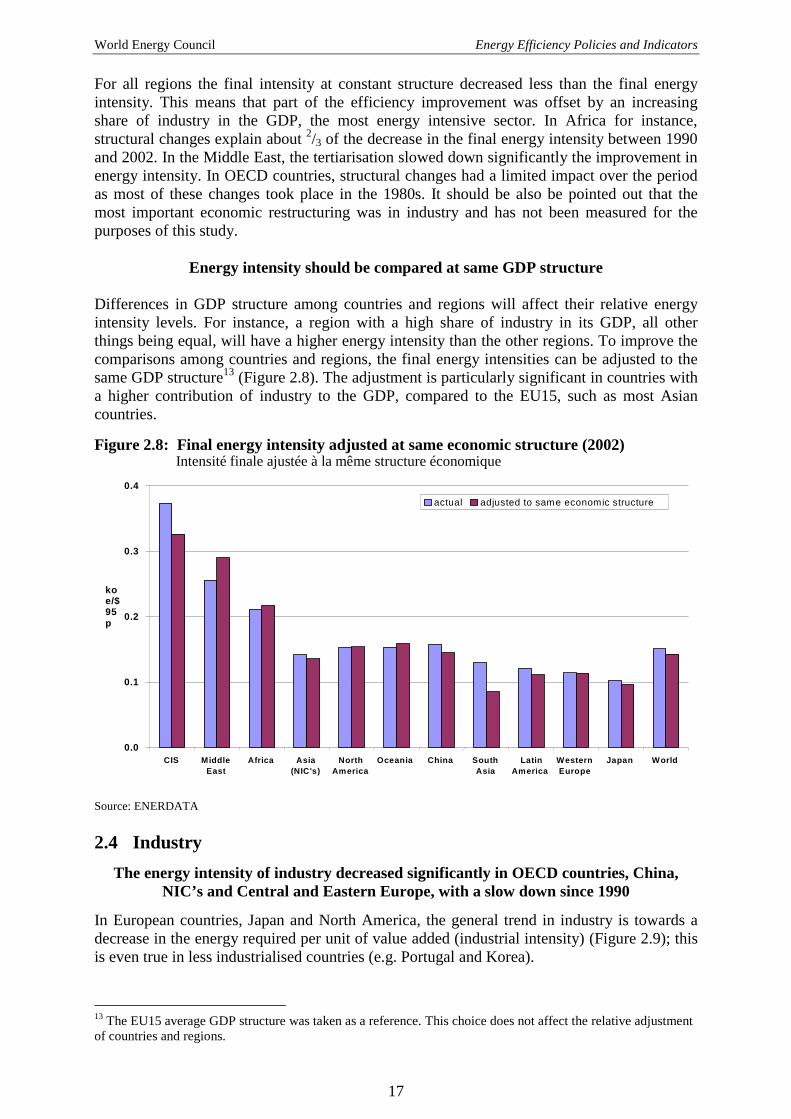
For all regions the final intensity at constant structure decreased less than the final energy intensity. This means that part of the efficiency improvement was offset by an increasing share of industry in the GDP, the most energy intensive sector. In Africa for instance, structural changes explain about 2/3 of the decrease in the final energy intensity between 1990 and 2002. In the Middle East, the tertiarisation slowed down significantly the improvement in energy intensity. In OECD countries, structural changes had a limited impact over the period as most of these changes took place in the 1980s. It should be also be pointed out that the most important economic restructuring was in industry and has not been measured for the purposes of this study.
Energy intensity should be compared at same GDP structure Differences in GDP structure among countries and regions will affect their relative energy intensity levels. For instance, a region with a high share of industry in its GDP, all other things being equal, will have a higher energy intensity than the other regions. To improve the comparisons among countries and regions, the final energy intensities can be adjusted to the same GDP structure13 (Figure 2.8). The adjustment is particularly significant in countries with a higher contribution of industry to the GDP, compared to the EU15, such as most Asian countries.
Figure 2.8: Final energy intensity adjusted at same economic structure (2002) Intensité finale ajustée à la même structure économique
0.0
0.1
0.2
0.3
0.4
CIS Middle East
Africa Asia (NIC's)
NorthAmerica
Oceania China SouthAsia
LatinAmerica
Western Europe
Japan World
koe/$95p
actual adjusted to same economic structure
Source: ENERDATA 2.4 Industry
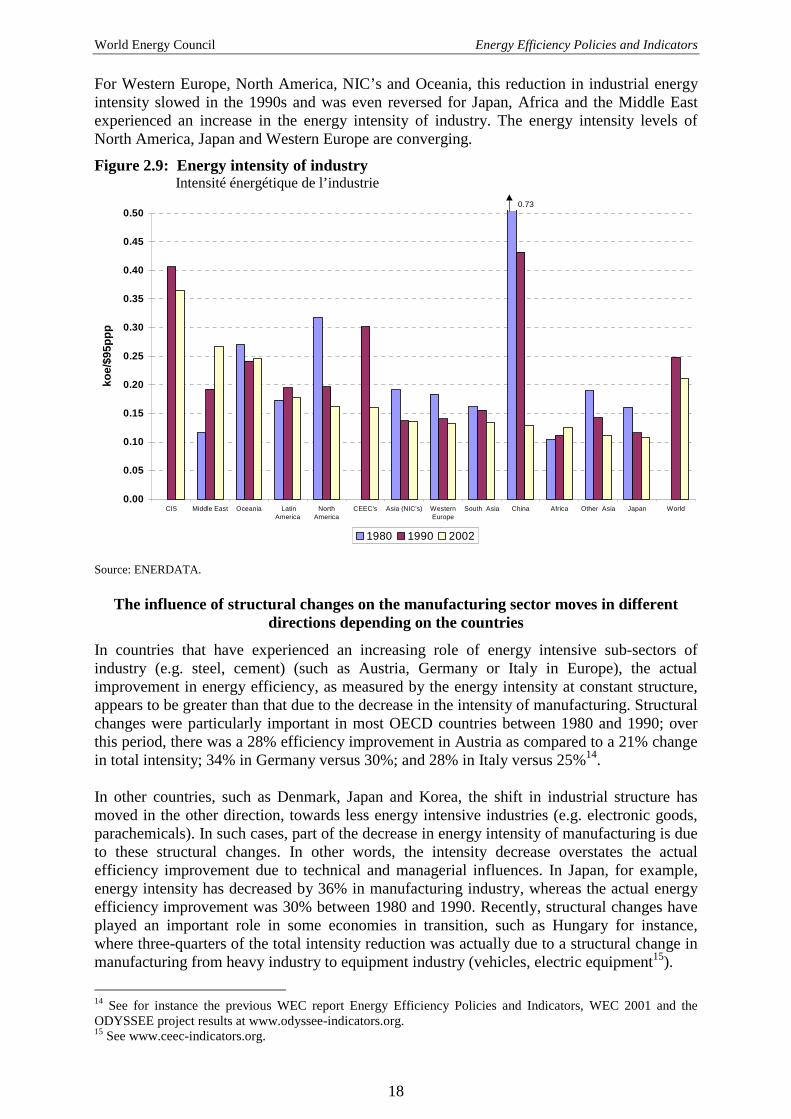
The energy intensity of industry decreased significantly in OECD countries, China, NIC’s and Central and Eastern Europe, with a slow down since 1990
In European countries, Japan and North America, the general trend in industry is towards a decrease in the energy required per unit of value added (industrial intensity) (Figure 2.9); this is even true in less industrialised countries (e.g. Portugal and Korea).
13 The EU15 average GDP structure was taken as a reference. This choice does not affect the relative adjustment of countries and regions.
World Energy Council Energy Efficiency Policies and Indicators
18
For Western Europe, North America, NIC’s and Oceania, this reduction in industrial energy intensity slowed in the 1990s and was even reversed for Japan, Africa and the Middle East experienced an increase in the energy intensity of industry. The energy intensity levels of North America, Japan and Western Europe are converging.
Figure 2.9: Energy intensity of industry Intensité énergétique de l’industrie
0.00
0.05
0.10
0.15
0.20
0.25
0.30
0.35
0.40
0.45
0.50
CIS Middle East Oceania LatinAmerica
NorthAmerica
CEEC's Asia (NIC's) WesternEurope
South Asia China Africa Other Asia Japan World
koe/
$95p
pp
1980 1990 2002
0.73
Source: ENERDATA.
The influence of structural changes on the manufacturing sector moves in different directions depending on the countries
In countries that have experienced an increasing role of energy intensive sub-sectors of industry (e.g. steel, cement) (such as Austria, Germany or Italy in Europe), the actual improvement in energy efficiency, as measured by the energy intensity at constant structure, appears to be greater than that due to the decrease in the intensity of manufacturing. Structural changes were particularly important in most OECD countries between 1980 and 1990; over this period, there was a 28% efficiency improvement in Austria as compared to a 21% change in total intensity; 34% in Germany versus 30%; and 28% in Italy versus 25%14. In other countries, such as Denmark, Japan and Korea, the shift in industrial structure has moved in the other direction, towards less energy intensive industries (e.g. electronic goods, parachemicals). In such cases, part of the decrease in energy intensity of manufacturing is due to these structural changes. In other words, the intensity decrease overstates the actual efficiency improvement due to technical and managerial influences. In Japan, for example, energy intensity has decreased by 36% in manufacturing industry, whereas the actual energy efficiency improvement was 30% between 1980 and 1990. Recently, structural changes have played an important role in some economies in transition, such as Hungary for instance, where three-quarters of the total intensity reduction was actually due to a structural change in manufacturing from heavy industry to equipment industry (vehicles, electric equipment15).
14 See for instance the previous WEC report Energy Efficiency Policies and Indicators, WEC 2001 and the ODYSSEE project results at www.odyssee-indicators.org. 15 See www.ceec-indicators.org.

World Energy Council Energy Efficiency Policies and Indicators
19
Convergence in energy consumption for energy intensive products
In energy intensive industries, the general trend points toward a reduction in the energy consumption per tonne of output, as observed for steel (Figure 2.10). This explains the overall energy efficiency improvement outlined above. There is a convergence in the most developed countries, whereas, in other countries, the situation is more diverse, due to differences in production processes and products. In some countries, negotiated agreements between industry associations and the government on targets for energy efficiency improvements explain part of the results achieved16.
Figure 2.10a: Energy consumption per ton of steel Consommation unitaire moyenne de l’acier.
0.0
0.2
0.4
0.6
0.8
1.0
Other Asia South Asia China LatinAm erica
Africa CEEC's CIS Oceania Japan W esterneurope
NorthAmerica
Asia(N IC 's)
W orld
toe/
t
1980 1990 2002
1.5
Source: Data from ISII and ENERDATA
Figure 2.10b: Unit energy consumption of cement Consommation unitaire de ciment
0 .00
0 .02
0 .04
0 .06
0 .08
0 .10
0 .12
S lo vak ia F rance H u n g ary P o lan d U K C zech R ep S pain G erm an y Ita ly
toe/
t
1995 2001 Source: Odyssee
16 See below 3.6 below on voluntary/negotiated agreements.

World Energy Council Energy Efficiency Policies and Indicators
20
2.5 Transport
Great disparities exist between the most developed regions in the energy intensity of transport
The energy intensity of the transport sector17 appears to be quite similar among European countries and Japan, while North America and Oceania stand at much higher levels: twice higher than Japan, for instance (Figure 2.11). However, only part of these differences in overall energy intensities between these regions can be explained by the differences in the transport sector (about 40% of the difference between North America and Western Europe).
There is hardly any energy efficiency improvement in transport in developed countries, except for North America, where the improvement starts from a very high
level of intensity
North America and Oceania are among the few regions to have experienced a drastic and continuous improvement in the overall energy efficiency of the transport sector since 1973. In North America, this situation can be mainly explained by a huge improvement in the efficiency of cars following the implementation of the CAFE standards for the fuel economy of new cars in the US. The average specific fuel consumption of cars decreased by almost 40% in the US between 1973 and 1993 (starting from a level double that of Europe). Western European countries did not experience any significant improvement in the overall energy efficiency of the transport sector until 1990. Only limited energy efficiency programmes were implemented in that sector and, despite the fact that technical improvements in the fuel efficiency of vehicles were significant (25-30% since 1973), they have been offset, in most cases, by worsening traffic conditions and behavioural factors (e.g. a shift to bigger cars, use of air conditioning). In addition, the transport of goods has been continuously shifting to road transport. As a result, in the 1980s the energy intensity of transport increased rapidly in Western Europe. Since 1990, however, the energy intensity of transport has decreased. This results from the combined effect of energy efficiency improvements, the continuous increase in motor fuel prices, new priorities given to energy efficiency measures in the transport sector (especially urban transport in relation to environmental protection), and the level of saturation in car ownership. Some countries demonstrate in recent years a slow down in the energy consumption of the transport sector (e.g. Japan) or a stabilisation (France, Germany, UK and Italy since 2000, with a decrease in 2003 in UK and France). In Latin America, Africa and South-East Asia, the energy intensity of transport is increasing rapidly, because of the increasing ownership of cars and motorcycles, and also the use of roads to transport goods in preference to water or rail. Poor economic conditions in Latin America have, however, reversed that trend in recent years. In China and South Asia, the growth of the energy consumption of transport is slower than the GDP because of a slower increase in car ownership and the dominant role of rail transport for the transport of goods.
17 There is no good indicator to reflect the overall efficiency trends in the transport sector, mainly because of the difficulty of separating out the energy used by different modes of transport, especially road transport. The indicator usually considered to provide the best overall picture is the energy consumed in transport per unit of GDP, as transport activities take place in all sectors and it is not possible to define a macro-economic indicator of activity that is characteristic of the sector.

World Energy Council Energy Efficiency Policies and Indicators
21
Figure 2.11a: Energy intensity of transport Intensité énergétique du transport
Source: ENERDATA
Figure 2.11b: Specific fuel consumption of new cars (litres/100 km) Consommation des automobiles neuves18
18 Test values
0.00
0.01
0.02
0.03
0.04
0.05
0.06
0.07
0.08
0.09
MiddleEast
NorthAmerica
Oceania Asia(NIC's)
CIS OtherAsia
LatinAmerica
WesternEurope
Africa CEEC's Japan SouthAsia
China World
koe/
$95p
pp
1980 1990 2002
5
6
7
8
9
10
11
1975 1977 1979 1981 1983 1985 1987 1989 1991 1993 1995 1997 1999 2001 2003
Germany UK Italy Spain France Netherlands EUR15

World Energy Council Energy Efficiency Policies and Indicators
22
2.6 Household and Service Sectors The diverse patterns among world regions of energy consumption for thermal uses (cooking, space and water heating) make any comparison between regions fairly meaningless. The following evaluation of energy trends in these sectors will therefore focus on electricity only.
The household electricity consumption per capita is rising and showing diverse trends The average consumption of electricity per capita in the household sector is very diverse in developed regions depending on the level of ownership of electrical appliances and the importance of electric space heating (Figure 2.12). It varies from a value of around 800 kWh/capita for Central and Eastern European countries, to around 1500-2000 kWh in Western Europe, Japan and Oceania, and is above 4000 kWh in North America. Such a comparison would be more relevant if it only included captive uses (i.e. without space heating and other thermal uses, such as cooking or water heating). However, the poor availability of data on the consumption of electricity by end-use limits the possibilities for such comparisons.
Figure 2.12: Household electricity consumption per capita Consommation unitaire d’électricité des ménages
0
500
1000
1500
2000
2500
3000
3500
4000
4500
NorthAmerica
Japan Oceania WesternEurope
Asia(NIC's)
MiddleEast
CEEC's CIS LatinAmerica
OtherAsia
China Africa SouthAsia
World
kwh/
cap
1980 1990 2002
Source: ENERDATA
In all the regions, consumption per capita is increasing, even in CEECs which are undergoing economic transition. The increase is especially rapid in developing countries with high economic growth (e.g. Asian countries) and it is accelerating. Since 1990, however, this general progression has been slowing down for all regions except in the CIS and Other Asia (Figure 2.13). This development is particularly significant in OECD countries, which implemented policies to improve the energy efficiency performance of electrical appliances (labelling, efficiency standards)19.
19 See below 3.4

World Energy Council Energy Efficiency Policies and Indicators
23
Figure 2.13: Variation of the household unit electricity consumption Consommation unitaire d’électricité des ménages
0%
2%
4%
6%
8%
10%
12%
14%
16%
W esternEurope
CIS CEEC's NorthAmerica
LatinAm erica
China Japan Asia(NIC's)
SouthAsia
OtherAsia
Africa MiddleEast
Oceania W orld
%/y
ear
1980-90 1990-2002 Source: ENERDATA
The electricity intensity of the service sector is increasing In developing countries, the main source of energy used in the service sector (public administration, commerce and other service activities) is electricity. Therefore, as for the household sector, the indicators considered here focus on electricity. The quantity of electricity required to generate one unit of value added (the electricity intensity) is increasing in most regions, especially in less industrialised regions in which the service sector is expanding rapidly, and in countries with air conditioning requirements (NICs’ and Other Asia) (Figure 2.14). In North America and Oceania, with high energy intensity levels, the ratio is rather stable. Figure 2.14: Electricity intensity in the service sector
Intensité électrique des services
0
2 0
4 0
6 0
8 0
1 0 0
1 2 0
1 4 0
1 6 0
1 8 0
2 0 0
2 2 0
M id d leE a s t
N o rthA m e ric a
A s ia(N IC 's )
C E E C 's O c e a n ia J a p a n W e s te rnE u ro p e
O th e r A s ia L a t inA m e ric a
A fr ic a C h in a S o u thA s ia
W o rld
kwh/
$95p
pp
1 9 8 0 1 9 9 0 2 0 0 2 Source: ENERDATA
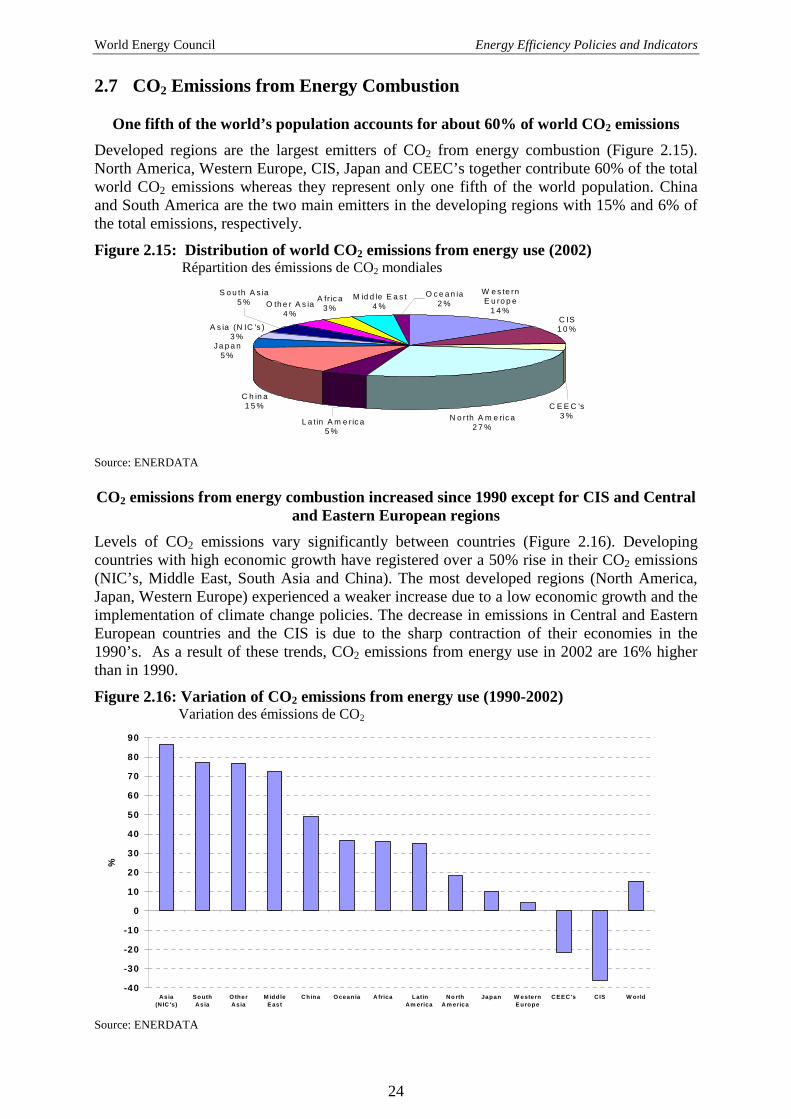
World Energy Council Energy Efficiency Policies and Indicators
24
2.7 CO2 Emissions from Energy Combustion
One fifth of the world’s population accounts for about 60% of world CO2 emissions Developed regions are the largest emitters of CO2 from energy combustion (Figure 2.15). North America, Western Europe, CIS, Japan and CEEC’s together contribute 60% of the total world CO2 emissions whereas they represent only one fifth of the world population. China and South America are the two main emitters in the developing regions with 15% and 6% of the total emissions, respectively.
Figure 2.15: Distribution of world CO2 emissions from energy use (2002) Répartition des émissions de CO2 mondiales
W e s te rn E u ro p e
1 4 %
C h in a1 5 %
C IS1 0 %
C E E C 's3 %
M id d le E a s t4 %O th e r A s ia
4 %
N o rth A m e ric a2 7 %
J a p a n5 %
A s ia (N IC 's )3 %
S o u th A s ia5 % A fr ic a
3 %
O c e a n ia2 %
L a tin A m e r ic a5 %
Source: ENERDATA CO2 emissions from energy combustion increased since 1990 except for CIS and Central
and Eastern European regions Levels of CO2 emissions vary significantly between countries (Figure 2.16). Developing countries with high economic growth have registered over a 50% rise in their CO2 emissions (NIC’s, Middle East, South Asia and China). The most developed regions (North America, Japan, Western Europe) experienced a weaker increase due to a low economic growth and the implementation of climate change policies. The decrease in emissions in Central and Eastern European countries and the CIS is due to the sharp contraction of their economies in the 1990’s. As a result of these trends, CO2 emissions from energy use in 2002 are 16% higher than in 1990.
Figure 2.16: Variation of CO2 emissions from energy use (1990-2002) Variation des émissions de CO2
-40
-30
-20
-10
0
10
20
30
40
50
60
70
80
90
Asia(N IC 's)
SouthAsia
O therAsia
M iddleE ast
C hina O ceania A frica LatinAm erica
No rthA m erica
Japan W esternE urope
C EEC 's CIS W orld
%
Source: ENERDATA

World Energy Council Energy Efficiency Policies and Indicators
25
CO2 emissions per capita vary by a factor 1 to 7 among world regions At world level, CO2 emissions per capita are fairly stable. This is the result of two opposite trends: a rise of CO2 emissions per capita in most regions, on the one hand and a decrease in Western Europe, CIS and Central and Eastern European countries, on the other hand.
The levels of CO2 emissions per capita are very diverse. They are under 2t CO2/cap in the less developed regions (Africa, NICs, other Asia); about 8-13t CO2/cap for Western Europe, CIS, Japan, South Asia, Oceania and near 19t CO2/cap in North America (Figure 2.17). Figure 2.17: CO2 emissions per capita (2002)
Emissions de CO2 par habitant
Source: ENERDATA
CO2 emissions increase less rapidly than the economic activity CO2 emissions from energy use increase more slowly than economic activity in all regions, except for the Middle East. At the world level, the CO2 intensity in relation to GDP decreased by 1.8% p.a. between 1990 and 2002, with most of the reduction due to energy efficiency improvements and only a small part due to changes in the fuel mix (13%).
North America Japan CEEC's Latin America South Asia
Oceania CIS Middle East Other Asia
NIC's Western Europe China Africa
0
3
6
9
12
15
18
21
0 2000 4000 6000
tCo2
0
3
6
9
12
15
18
21
0 2000 4000 6000
tCo2
0
3
6
9
12
15
18
21
0 2000 4000 6000
tCo2

World Energy Council Energy Efficiency Policies and Indicators
26
Figure 2.18: CO2 intensity (1990-2002) Intensité en CO2
Source: ENERDATA 2.8 Conclusions Energy consumption is growing less rapidly than the economic activity in most regions. This long-term trend has accelerated since 1990, and grown even more since 1996: the energy consumption per unit of GDP has decreased by about 1.5% per year at world level between 1990 and 2003 (compared to 1.4% since 1980), and by 1.8% p.a. since 1996. This reduction in the energy intensity of the GDP represents an impressive energy saving of 2.1 Gtoe since 1990. Large differences exist between world regions, both in the level of their energy intensity (intensity more than twice the world average in the CIS but about 30% lower in Western Europe and Japan), and in the trends of their energy intensity (very rapid reduction in China, increase in the Middle East and in the most developed regions of Asia). About a quarter of the reduction in the world energy intensity has come from a more rapid growth in regions with the lowest energy intensity. The actual progress in energy productivity was only 1.1% per year. This regular progress is mostly the result of the energy efficiency policies and measures implemented over that period of time. Indeed, until 2000, price signals were in general very weak, and change in the structure of the economic activity had a marginal influence. Energy efficiency gains are greater at the level of final energy consumption than at the overall level: increasing losses in energy conversion have offset about 25% of the gains achieved by
Other Asia
South Asia
Asia (NIC's)
Latin America Africa
Middle East
World
Western Europe
CEEC's
CIS
China
0
0,2
0,4
0,6
0,8
1
1,2
1,4
1,6
1,8
0 5000 10000 15000 20000 25000 30000 35000
GUS$95ppp
kco2
/us$
Oceania North America
Japan

World Energy Council Energy Efficiency Policies and Indicators
27
final consumers. The increasing use of electricity by final consumers is the main explanation for such a trend20. In general, the industrial sector has contributed most to the decrease in the overall energy intensity. On average, at world level, the energy intensity of industry has decreased by 2.7% p.a., which is almost twice as fast as for all economic sectors together. Since 1990, however, there has been a slow down in energy productivity gains in industry. This reduction concerns almost all world regions, not only OECD countries. This means that the transfer of industrial activities from OECD countries to other parts of the world does not explain the trends observed. The energy efficiency of energy intensive industries (e.g. steel, cement, paper) is converging and improving rapidly. North America and Oceania are among the few regions to have experienced a drastic and continuous improvement in the overall energy efficiency of the transport sector since 1973. In North America, this situation can be mainly explained by the dramatic improvement in the efficiency of cars, following the implementation of the CAFE standards for the fuel economy of new cars. The overall performance of the transport sector has improved more since 1990 than in the 1980s. The economic slowdown in some developing regions, the technical improvements of vehicles and the saturation in transport demand in OECD countries explains most of this new trend. However, part of the technical improvements by new vehicles has been offset by non-technical factors (e.g. congestion, larger and more powerful cars). In recent years (since 2000), the energy consumption of transport has remained relatively stable, or its growth has significantly slowed down in several European countries and Japan. In the household sector, the electricity demand for electrical appliances and lighting has stopped increasing in several OECD countries. This is probably the result of policy measures implemented in that sector (e.g. labelling, efficiency standards), as well as of saturation in the diffusion of large electrical appliances. CO2 emissions from energy use have increased for all regions since 1990 (they were 16% higher in 2002 than in 1990), except for the CIS and Central and Eastern European countries, which experienced negative economic growth for part of the period. Climate change policies have helped to reduce the increase in CO2 emissions in the most developed countries (particularly in Western Europe and Japan). However, CO2 emissions grow much less than the economic activity and the CO2 emissions per unit of GDP are decreasing in all regions (except the Middle East). World CO2 emissions per capita in 2002 remain at the same level as in 1990.
20 Electricity is the most intensive source in terms of primary energy (unless it is produced from hydro or wind).

World Energy Council Energy Efficiency Policies and Indicators
28

World Energy Council Energy Efficiency Policies and Indicators
29
3 Evaluation of Energy Efficiency Policies and Measures
3.1 Introduction This evaluation covers the impact of selected energy efficiency policy measures around the world to find answers to the following questions. What is the importance of energy efficiency measures? What are the priorities? What are the trends? What measures are being favoured? What are the innovative measures? What are the results?
Based on a comprehensive global survey, the evaluation also draws on five in-depth case studies prepared by experts. The following measures were selected as they are widely implemented and are known to be effective (and also complement the set of measures already evaluated in the previous report published in 2001): • Efficiency standards and labelling for household electrical appliances; • Innovative financing schemes for energy efficiency; • Voluntary/negotiated agreements with large energy consumers or equipment
manufacturers; • Local energy information centres; • Packages of measures (e.g. audits + financing schemes). 3.1.1 The Survey The survey21 of energy efficiency policy measures was conducted throughout the year 2003 and covered a total of 63 countries, representative of all world regions (Figure 3.1): • 27 from Europe: 21 countries from the European Union (EU), of which 7 were
countries22 that joined the EU in May 2004 (“EU Accession countries”), 2 countries that will join the EU in 2006 (Romania and Bulgaria), and, finally, Russia, Norway, Switzerland and Turkey;
• 8 from the US (Canada; Chile; Colombia; Costa Rica; Peru; Mexico; the United States); • 11 from Asia and the Pacific (Australia; China; Hong Kong, China; Indonesia; Japan;
Malaysia; Philippines; Republic of Korea; Taiwan, China; Vietnam); • 12 from Africa (Algeria; Botswana, Cote d’Ivoire; Egypt; Ghana; Kenya; Mali;
Mauritania; Morocco; South Africa; Tanzania; Tunisia); • 5 from the Middle East (Iran; Israel; Jordan; Lebanon; Syria). The surveyed countries represent altogether 83% of the world energy consumption (100% for North America and Western Europe, 88% for all Central and Eastern European including CIS countries, 68% of Latin America, 77% of Asia, 54% of Africa and 44% of the Middle East) The countries/economies considered belong to different economic or political associations and organisations23: • 27 countries belong to the OECD; this sample therefore gives a good representation of
non-OECD countries; • 21 countries belong to the enlarged European Union (of which 14 are from the EU15); • 16 belong to Asia Pacific Economic Cooperation (APEC); • 6 belong to the Latin American Energy Organisation (OLADE); • 5 belong to the Association of South East Asian Nations (ASEAN). 21 The survey is based on a questionnaire designed by ADEME. It was sent to the ADEME network of energy efficiency agencies in the EU 25 and North Africa, to the APERC network for APEC economies, and to WEC national committees for the other countries (in particular Sub-Saharan Africa). The survey was spread over 2003 and 2004, with the synthesis given in Annex 2 updated up to June 2004. 22 Czech Republic; Hungary; Latvia; Lithuania; Poland; Slovenia and Slovakia 23 The sum of countries below is higher than the number of countries surveyed as some countries belong to several associations or organisations.

World Energy Council Energy Efficiency Policies and Indicators
30
Figure 3.1: Countries covered by the WEC Survey on Energy Efficiency Policies
The results of the survey are summarised in this report in various tables in Annex 2, which show the degree of implementation of the measures in the different countries and economies. They are presented by main world geographical regions: Europe, America, Asia (including Oceania), Africa and Middle East. The survey covered institutional aspects, as well as general questions about existing regulations and fiscal or financial incentives. It also covered with a greater focus the selected energy efficiency policy measures mentioned above. Fuel substitution policies and measures to promote renewable energies were not included. R&D activities, although important in the long term, are also excluded from the survey, as they are less important in developing countries. The survey mainly concentrates on the years following the signature of the Kyoto Protocol, i.e. 1998-2000. The objective is to see which measures and policies have been implemented to meet the commitments of the Kyoto Protocol and what have been the different behaviours of countries and economies in such a context. However, the survey includes measures implemented earlier, which are still valid (e.g. regulation). The survey includes a brief overview of other energy efficiency measures. They are organised into two main categories: regulations, and fiscal or economic incentives. A further category, information and sectoral agreements, was added to include other measures that do not fall directly into either of the two main categories. The measures considered in the survey are shown in Table 1.

World Energy Council Energy Efficiency Policies and Indicators
31
Table 1: Energy efficiency measures covered by the WEC Survey
Institutions and programmes Voluntary agreements Local energy efficiency centres New financial schemes Minimum efficiency standards for household electrical appliances Other measures Audits Regulations (by sector): Efficiency standards for new buildings Mandatory energy managers Mandatory energy consumption reporting Mandatory energy saving / DSM plans Mandatory maintenance Mandatory efficiency labels Economic incentives and fiscal measures (by sector) Investments subsidies Soft loans Tax credit or tax deduction Accelerate depreciation Tax reduction on energy saving equipment
Regulation is usually introduced when it is recognised that market failures would not allow economic instruments alone to reach the objective of the energy or environmental policy. In general, regulations aim either to impose minimum efficiency standards by law and/or governmental decree, or to impose energy efficient practices (technical and behavioural/managerial), as well as to provide systematic information to consumers (e.g. energy audits, labels).
Regulations can be set at the national level, at the level of a group of countries (e.g. the case of SAVE Directives in the EU), or at the level of a sub-national region inside a federal country (e.g. US). There are also other regulations which are not specifically targeted at energy efficiency, but which can nonetheless influence energy efficiency (e.g. speed limits, maximum weight of trucks).
Economic instruments include economic incentives to promote energy efficiency (e.g. energy audits or investment subsidies, soft loans), as well as fiscal measures. Annex 2 presents a synthesis of the survey. The measures are presented as follows: • Institutions and programmes; • Regulations:
- Thermal efficiency standards for new buildings; - Labelling, efficiency standards and target values for household electrical appliances; - Other regulations;
• Fiscal and economic measures; • Information and voluntary agreements:
- Thermal efficiency standards for new buildings; - Energy audits; - Local energy information centres; - Voluntary agreements.

World Energy Council Energy Efficiency Policies and Indicators
32
3.1.2 The case studies Three experts were requested to write a more comprehensive evaluation of four types of instruments: ••••
Efficiency standards and labelling for household electrical appliances; ••••
New financing schemes (e.g. guarantee funds, innovative funds); ••••
Voluntary/negotiated agreements with large energy consumers or equipment manufacturers.
Each of the experts prepared a core report of between 10 and 20 pages, complete with concrete examples of country experiences or, in the case of efficiency funds, of innovative financial instruments (“country case studies”). These reports have been harmonised and shortened to be included in this chapter in the review of the different measures24. An additional set of country case studies was prepared on local energy information centres. The full set of country case studies is included in Annex 1 of this report. To complete these case studies, a fifth analysis was done to look at the effect of the coordination of measures. Indeed, instead of considering each measure independently, we can consider, as this is more and more the case, a coordinated package of measures. 3.1.3 Content of the evaluation of policy measures To be comprehensive, this evaluation of energy policies needs to be completed by an analysis of price changes since 1986. Of course, prices are not only dependent on energy policies (through taxation), but are also influenced by the level of oil prices in the international market. The higher the level of taxation, such as in Europe for motor fuels, the lower is the sensitivity to crude oil price variations. This part of the report is organised in different sections as follows: • Energy pricing; • Institutions and programmes; • Efficiency standards for household electrical appliances; • Innovative energy efficiency funds; • Voluntary agreements; • Local energy information centres; • Other measures. 3.2 Energy Pricing Adequate pricing is a necessary condition for promoting energy efficiency. The first step of any energy efficiency policy should be to adjust energy prices in order to give correct signals to consumers, whilst maintaining incentives for them to change their behaviour or to acquire energy efficient equipment and technology. Although most energy decision makers agree with this objective, they often have to take into account other factors, such as provision of service for low-income households when the price becomes unaffordable, public opposition and limitation of impact on the consumer price index. 24 The full reports of the experts are available on the WEC web site: http://www.worldenergy.org/wec-geis/wec_info/work_programme2004/tech/seep/reports.asp
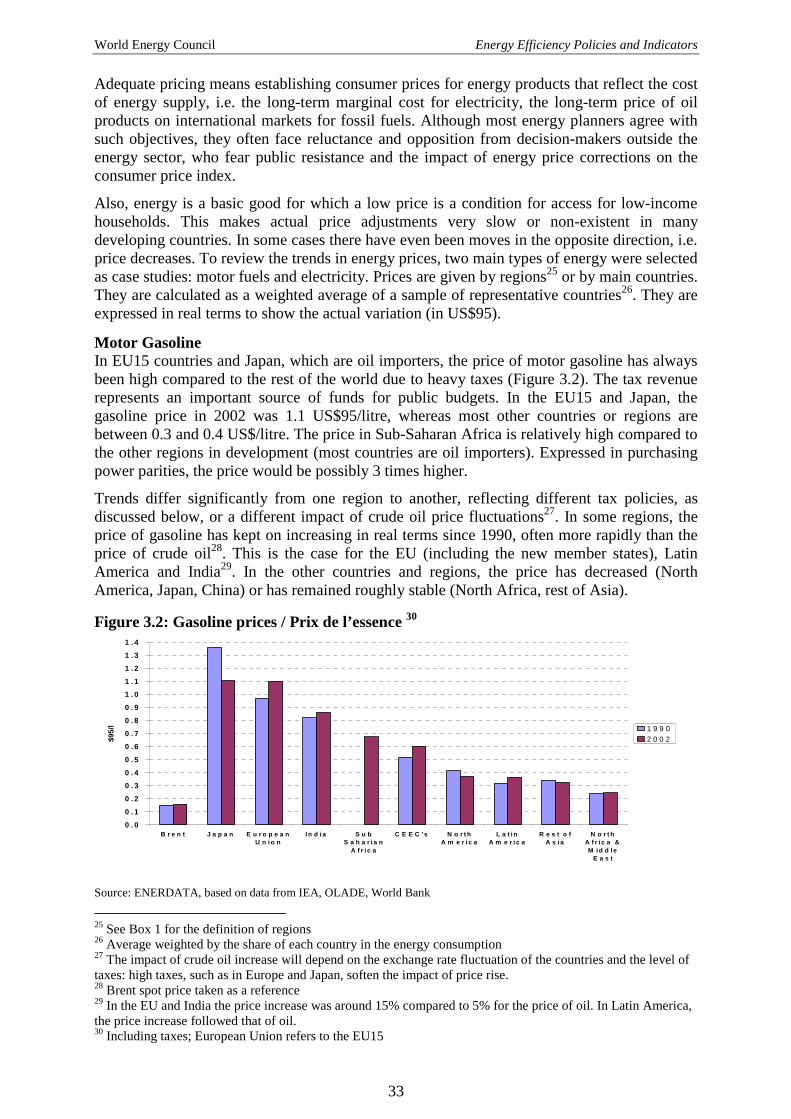
World Energy Council Energy Efficiency Policies and Indicators
33
Adequate pricing means establishing consumer prices for energy products that reflect the cost of energy supply, i.e. the long-term marginal cost for electricity, the long-term price of oil products on international markets for fossil fuels. Although most energy planners agree with such objectives, they often face reluctance and opposition from decision-makers outside the energy sector, who fear public resistance and the impact of energy price corrections on the consumer price index.
Also, energy is a basic good for which a low price is a condition for access for low-income households. This makes actual price adjustments very slow or non-existent in many developing countries. In some cases there have even been moves in the opposite direction, i.e. price decreases. To review the trends in energy prices, two main types of energy were selected as case studies: motor fuels and electricity. Prices are given by regions25 or by main countries. They are calculated as a weighted average of a sample of representative countries26. They are expressed in real terms to show the actual variation (in US$95).
Motor Gasoline In EU15 countries and Japan, which are oil importers, the price of motor gasoline has always been high compared to the rest of the world due to heavy taxes (Figure 3.2). The tax revenue represents an important source of funds for public budgets. In the EU15 and Japan, the gasoline price in 2002 was 1.1 US$95/litre, whereas most other countries or regions are between 0.3 and 0.4 US$/litre. The price in Sub-Saharan Africa is relatively high compared to the other regions in development (most countries are oil importers). Expressed in purchasing power parities, the price would be possibly 3 times higher.
Trends differ significantly from one region to another, reflecting different tax policies, as discussed below, or a different impact of crude oil price fluctuations27. In some regions, the price of gasoline has kept on increasing in real terms since 1990, often more rapidly than the price of crude oil28. This is the case for the EU (including the new member states), Latin America and India29. In the other countries and regions, the price has decreased (North America, Japan, China) or has remained roughly stable (North Africa, rest of Asia).
Figure 3.2: Gasoline prices / Prix de l’essence 30
0 . 0
0 . 1
0 . 2
0 . 30 . 4
0 . 5
0 . 60 . 7
0 . 8
0 . 9
1 . 01 . 1
1 . 2
1 . 31 . 4
B r e n t J a p a n E u r o p e a nU n i o n
I n d i a S u bS a h a r i a n
A f r i c a
C E E C 's N o r t hA m e r i c a
L a t i nA m e r i c a
R e s t o fA s i a
N o r t hA f r i c a &M i d d le
E a s t
$95/
l 1 9 9 02 0 0 2
Source: ENERDATA, based on data from IEA, OLADE, World Bank
25 See Box 1 for the definition of regions 26 Average weighted by the share of each country in the energy consumption 27 The impact of crude oil increase will depend on the exchange rate fluctuation of the countries and the level of taxes: high taxes, such as in Europe and Japan, soften the impact of price rise. 28 Brent spot price taken as a reference 29 In the EU and India the price increase was around 15% compared to 5% for the price of oil. In Latin America, the price increase followed that of oil. 30 Including taxes; European Union refers to the EU15

World Energy Council Energy Efficiency Policies and Indicators
34
Although governments in an increasing number of countries no longer regulate the price of gasoline, there is still a strong but indirect state influence through taxation (excise tax and value added tax). In most countries, the share of tax in the consumer price is increasing. The tax rate is the highest in EU15 countries (around 75% in 2002, with a range of 60-80%) (Figure 3.3). Several EU countries have even planned a regular increase of the excise tax (e.g. Germany or UK) or have set up carbon or environmental taxes (e.g. Denmark, Norway or Sweden). Figure 3.3: Share of taxes in the price of gasoline
Part des taxes dans le prix de l’essence
0
1 0
2 0
3 0
4 0
5 0
6 0
7 0
8 0
9 0
1 0 0
u k d e u * f r a it a h u n p o l e s p jp n a u s n d e r u s t w n t h a z a f * u s a m e x
% 1 9 9 02 0 0 2
* d e u = G e r m a n y ; z a f = S o u th A f r ic a Source: ENERDATA, based on data from IEA Automotive Diesel In the EU15 and Japan, the diesel price is around 0.9 US$95/l for non-commercial uses (Figure 3.4). The price of diesel is around 0.3- 0.4 $95/l for the other regions, except in the Middle East and North Africa, where the price is much lower due to the existence of many oil producers. Since 1990, the price of diesel has increased everywhere, except for North America and Japan, where the price is particularly high. The progression has been more rapid than for the crude oil price.
Figure 3.4: Average diesel prices Prix moyen du gazole 31
0.0
0.2
0.4
0.6
0.8
1.0
Brent Japan EuropeanUnion
SubSaharian
Africa
CEEC's India LatinAm erica
Rest ofAsia
NorthAm erica
NorthAfrica &M iddle
East
$95/
l 19902002
Source: ENERDATA, based on data from IEA , OLADE, World Bank 31 Non commercial use; all taxes included; European Union refers to the EU15

World Energy Council Energy Efficiency Policies and Indicators
35
The share of taxes in the diesel price is also increasing in most countries. In the EU15, there is a convergence of around 55-65% (Figure 3.5). Most of the other countries have a tax rate of between 35 - 45%. Taxes increased significantly in several countries, e.g. Hungary, Mexico, Japan and India. Indeed, the objective is to narrow the gap between gasoline and diesel.
Figure 3.5: Share of taxes in the price of diesel / Part des taxes dans le prix du gazole
0
10
20
30
40
50
60
70
80
90
100
uk deu fra ita hun nde esp m ex pol aus rus jpn tw n usa zaf tha
%
19902002
Source: ENERDATA, based on data from IEA
Electricity The price of electricity for households varies significantly in OECD countries (Figure 3.6). Japan has by far the highest price, followed by the EU15 (around 14 US cents/kWh, at 1995 prices); North America (Canada and the US) stands at the bottom (around 8 US cents/kWh). Sub-Saharan Africa has a very high price compared to its average income. This can be explained by its strong dependence on oil for electricity production and the age of the power plants. Expressed in purchasing power parities, the average price is quite high in Sub-Saharan Africa and India, particularly compared to European countries. In real terms, the average electricity price for households is continuously decreasing, except in countries that have implemented aggressive demand-side management (DSM) programmes (e.g. Denmark or Sweden) or removed subsidies (Eastern European Countries).
Figure 3.6a: Average electricity price (households) 32 / Prix moyen de l’électricité (ménages)
02468
1012141618202224262830
Ja p an E u ro p ea nU n ion
S u bS a h a ria n
A fric a
N o rthAm e ric a
L a tinAm e ric a
C E E C 's R es t o fA s ia
In d ia N orthA fric a &M id d le
E a st
c95/
kWh
199 0200 2
32 Including taxes; European Union refers to EU15

World Energy Council Energy Efficiency Policies and Indicators
36
Figure 3.6b: At purchasing power parities / à parités de pouvoir d’achat
0
5
10
15
20
25
30
35
Ja p a n E u ro p e a nU n io n
S u bS ah a ria n
Africa
N o rthA m e ric a
L a tinAm e ric a
C E E C 's R e s t o fA sia
In d ia N orthA fric a &M id d le
E a st
c95p
/kW
h
19 9020 02
Source: ENERDATA, based on data from IEA , OLADE, World Bank With respect to the electricity price for industry (Figure 3.7), there are three distinct groups of countries: Japan with the highest prices; Mexico, Canada and the US with the lowest prices (around 4 US cents/kWh); and European countries and Korea somewhere in between. The average price has been decreasing in almost all regions. The reduction was larger in countries/regions with the highest price (Japan and EU), resulting in a narrower range in 2002 than in 1990. In Europe, in general, the declining trend in the electricity price for industry is the result of the deregulation of the electricity sector.
Figure 3.7: Average electricity price (industry) Prix moyen de l’électricité (industrie)
0
2
4
6
8
10
12
14
16
18
20
22
Japan SubSaharian
Africa
India NorthAfrica &Middle
East
Rest ofAsia
EuropeanUnion
CEEC's LatinAm erica
NorthAmerica
c95/
kWh
19902002
Source ENERDATA, based on data from IEA , OLADE, World Bank
The share of taxes in the electricity price for households (Figure 3.8) is usually low (5 to 15% in most countries), except in a few countries that use price signals as a strong incentive for energy efficiency improvements / CO2 reduction, such as Denmark or the Netherlands.
For industry, most countries do not impose taxes. Only a few countries have an excise tax: Denmark (environmental tax), Japan and Italy.

World Energy Council Energy Efficiency Policies and Indicators
37
Figure 3.8: Share of taxes in the price of electricity (households) Part des taxes dans le prix de l’électricité (ménages)
0
1 0
2 0
3 0
4 0
5 0
6 0
d n k n ld it a f r a p o l e s p a u s m e x d e u h u n jp n tw n u k
% 1 9 9 02 0 0 2
Source: ENERDATA, based on data from IEA 3.3 Institutions and Programmes There are two main questions related to institutional aspects of energy efficiency policies and their implementation. Firstly, are public energy efficiency agencies necessary to sustain national efforts to improve energy efficiency? Secondly, is it necessary to have strong institutionalisation of energy efficiency measures, through an energy efficiency law or a national programme approved by the parliament? Energy efficiency agency An energy efficiency agency is defined here as a body with strong technical skills, dedicated to implementing the national energy efficiency policy, as well as in some cases the environmental policy (see Annex 2). Such agencies are usually separate from ministries, but may be part of a Ministry, as in Denmark, Canada, the US or the Philippines. Energy efficiency programmes almost always require a dedicated technical body able to reach scattered and multiple energy consumers. Some measures, such as energy pricing or transposing international standards may be implemented without a specific energy efficiency institution.
Two thirds of the surveyed countries have set up a national energy efficiency agency Energy efficiency agencies have the mission and capabilities, first of all, to design, implement and evaluate programmes and measures, to contract a range of stakeholders, such as companies, local authorities, or NGOs and, finally, to ensure coordination with higher or lower levels of authorities (international, national, regional and local). In countries with a federal or decentralised structure, energy agencies have been set up by regional administrations. In addition, many countries have set up local or regional agencies. Such agencies provide more targeted measures, as they are closer to consumers and can better appreciate specific regional circumstances (climate, energy resources, etc.). In Europe, most of the countries have a national energy efficiency agency (23 out of 27) and several countries have created a new agency since 2000, such as Germany, Norway and the Netherlands33. In some countries, these agencies also cover environmental issues (e.g. France, the Netherlands). Energy efficiency agencies are increasingly recognised in the EU as
33 In the Netherlands, a second agency was created to supervise the industrial sectoral agreements (Senter)
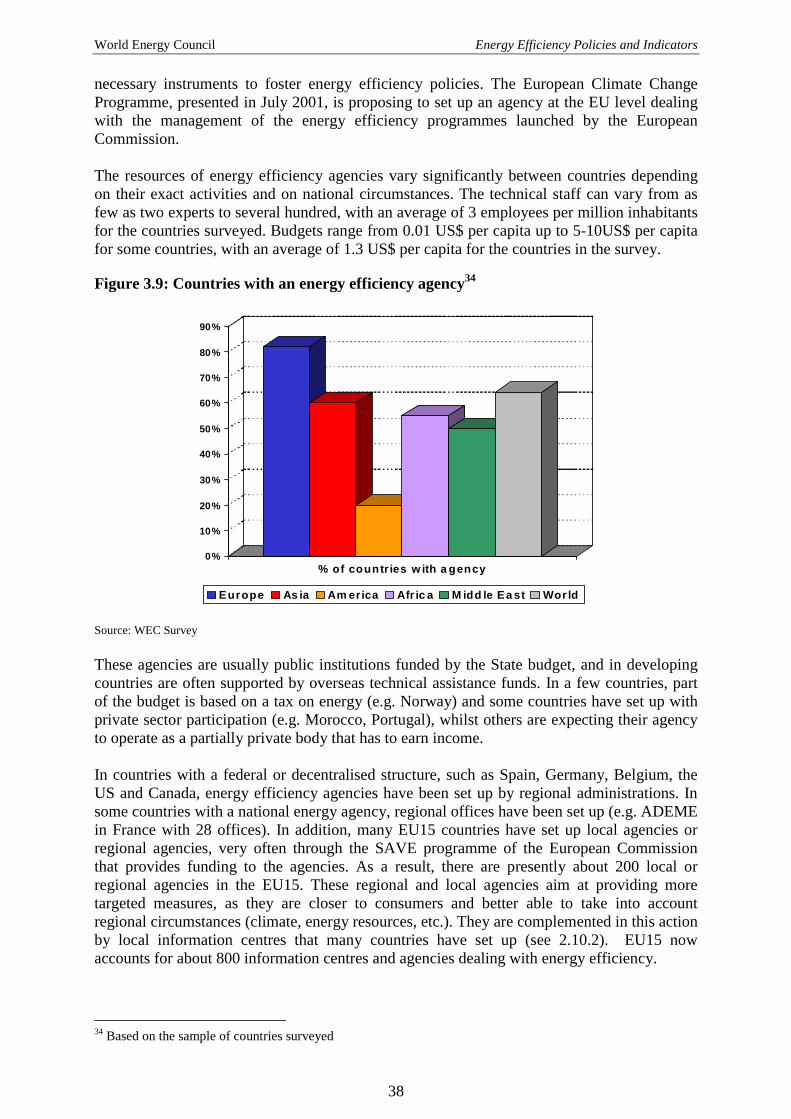
World Energy Council Energy Efficiency Policies and Indicators
38
necessary instruments to foster energy efficiency policies. The European Climate Change Programme, presented in July 2001, is proposing to set up an agency at the EU level dealing with the management of the energy efficiency programmes launched by the European Commission. The resources of energy efficiency agencies vary significantly between countries depending on their exact activities and on national circumstances. The technical staff can vary from as few as two experts to several hundred, with an average of 3 employees per million inhabitants for the countries surveyed. Budgets range from 0.01 US$ per capita up to 5-10US$ per capita for some countries, with an average of 1.3 US$ per capita for the countries in the survey.
Figure 3.9: Countries with an energy efficiency agency34
Source: WEC Survey These agencies are usually public institutions funded by the State budget, and in developing countries are often supported by overseas technical assistance funds. In a few countries, part of the budget is based on a tax on energy (e.g. Norway) and some countries have set up with private sector participation (e.g. Morocco, Portugal), whilst others are expecting their agency to operate as a partially private body that has to earn income. In countries with a federal or decentralised structure, such as Spain, Germany, Belgium, the US and Canada, energy efficiency agencies have been set up by regional administrations. In some countries with a national energy agency, regional offices have been set up (e.g. ADEME in France with 28 offices). In addition, many EU15 countries have set up local agencies or regional agencies, very often through the SAVE programme of the European Commission that provides funding to the agencies. As a result, there are presently about 200 local or regional agencies in the EU15. These regional and local agencies aim at providing more targeted measures, as they are closer to consumers and better able to take into account regional circumstances (climate, energy resources, etc.). They are complemented in this action by local information centres that many countries have set up (see 2.10.2). EU15 now accounts for about 800 information centres and agencies dealing with energy efficiency.
34 Based on the sample of countries surveyed
0%
10%
20%
30%
40%
50%
60%
70%
80%
90%
% of countr ies w ith a gency
Europe As ia Am erica Afr ic a M idd le Ea st Wor ld

World Energy Council Energy Efficiency Policies and Indicators
39
The primary objective of all these institutions is to provide technical expertise to governments and consumers, something that cannot always be found in existing institutions. Government ministries do not, in general, have the required expertise to carry out all the activities of energy agencies. Another important function of energy efficiency agencies is to act as a promoter of energy efficiency in front of energy companies. Electric utilities, although very active in some countries, remain above all in the business of selling electricity and thus do not necessarily have a strong enough interest in energy efficiency over the long-term, especially in the context of a growing competition. There is, therefore, a need for agencies to deal with energy efficiency on a long-term basis. Yet another function of energy efficiency agencies is to act as a coordinator of all governmental initiatives in the field of energy efficiency to avoid scattered and uncoordinated actions by different ministries. In particular, the existence of such agencies has proved very useful in negotiating sectoral agreements with groups of consumers or equipment producers to reach specific targets for efficiency improvements. In countries that receive aid from international development assistance programmes, such agencies can in addition act as the national counterpart with whom donors negotiate the implementation of financial packages for energy efficiency. More generally, such agencies can be the counterpart to financial institutions to develop new funding schemes (see 3.5). The fact that most countries have set up an energy efficiency agency is in a way an empirical justification of their usefulness.
National energy efficiency programmes and laws with concrete energy efficiency targets/CO2
Most countries have an official national energy efficiency programme with concrete targets of energy or CO2 savings (three quarters of the surveyed countries). These programmes are either purely devoted to energy efficiency or combined with a national programme of greenhouse gas reduction or promotion of renewables (especially for most EU countries)35. In some countries, such as Brazil, Colombia, India, the Philippines and Peru, an energy efficiency law has been adopted only recently (since 2000). Such laws and programmes ensure a certain continuity of public efforts and a better co-ordination of the various actions and measures taken. 3.4 Labelling and Efficiency Standards for Household Electrical
Appliances36
Although these measures were already covered in the previous report, they are again included here as they offer a promising potential for energy efficiency gains and are increasingly spreading all over the world. Due to of the increase in the use of lighting and the rising ownership of household appliances and electronic equipment, household electricity consumption in industrialised countries has increased dramatically over the last twenty years. Moreover, demand will probably continue to grow at a steady rate despite the expected
35 See Annex 2 for the content and target of the programmes by country. 36. This section is based on a case study prepared for the project by P Menanteau from IEPE. This case study is available as a separate document on the WEC web site: “Labelling programmes and efficiency standards to control the energy consumption of household appliances: an update”, ADEME and IEPE, April 2003.

World Energy Council Energy Efficiency Policies and Indicators
40
saturation in ownership levels of certain appliances37. According to IEA, household appliances are the second greatest source of electricity consumption in the OECD countries (and the third greatest source of greenhouse gas emissions). Their consumption is expected to increase by 25% between 2000 and 2020 despite the energy management policies already introduced (an increase of 60% without any kind of energy policies). In developing countries, the growth in domestic electricity consumption is expected to be even higher, given the rapid increase in ownership levels of domestic appliances, particularly amongst urban households38. Despite the efforts that have been made, there are still significant differences in the energy efficiency between available appliances in developing countries and those sold in the industrialised countries. These differences suggest that there is significant technical potential for energy savings in the sector of domestic appliances in the developing countries also. To slow down and reverse this trend, many countries have introduced energy efficiency programmes. Among the different available instruments, labelling programmes and minimum energy performance standards (MEPS) have proved to be effective. Most countries first focused on refrigerators, along with air conditioners in certain countries, since they account for a large part of the household electricity consumption (in Europe, 20-30% depending on the country). Labelling programmes are designed to modify the selection criteria of consumers by drawing their attention to the energy consumption of household appliances. Energy labels provide consumers with information, which enables them to compare the energy efficiency of the different appliances on sale. The aim of performance standards is to improve the energy efficiency of new appliances either by imposing a minimum energy efficiency rating to remove the least efficient products from the market - Minimum Energy Performance Standards (MEPS) - or by requiring sales-weighted average energy efficiency improvements. 3.4.1 Description of measures and their deployment The industrialised countries (US, Canada, Europe, Australia, etc.) started by introducing special programmes aimed at improving energy efficiency to control the rise in electricity consumption for specific uses. Numerous developing countries (China, Brazil, Iran, Mexico etc.) followed later. The United States, Canada and Australia are the countries where comparative labelling is the most widespread, with about fifteen different types of appliances involved. The US and Canada are the countries where efficiency standards are applied to the most products (about twenty). In the developing countries, labelling programmes and standards are generally more limited, with the notable exception of China, Costa Rica and Mexico, which have introduced programmes comparable to those in the industrialised countries. Generally speaking, labelling programmes and performance standards concern cold appliances, lighting equipment (lamps and lamp ballasts), washing machines and dryers, water heaters and, in developing countries, room air conditioners. 37 IEA, Cool appliances: Policy strategies for energy-efficient homes, Paris, 2003. 38 In China, as an example, the ownership level of domestic appliances is increasing rapidly among urban households. In 2001, it was 121% for televisions, 92% for washing machines, 82% for refrigerators and 36% for room air conditioners. As a result, the average annual electricity consumption of households has increased by an average of 16% p.a. since 1980 ( in Lin, J., Made for China: Energy efficiency standards and labels for households appliances, LBNL, China Energy Group, Sinosphere, Nov. 2002).
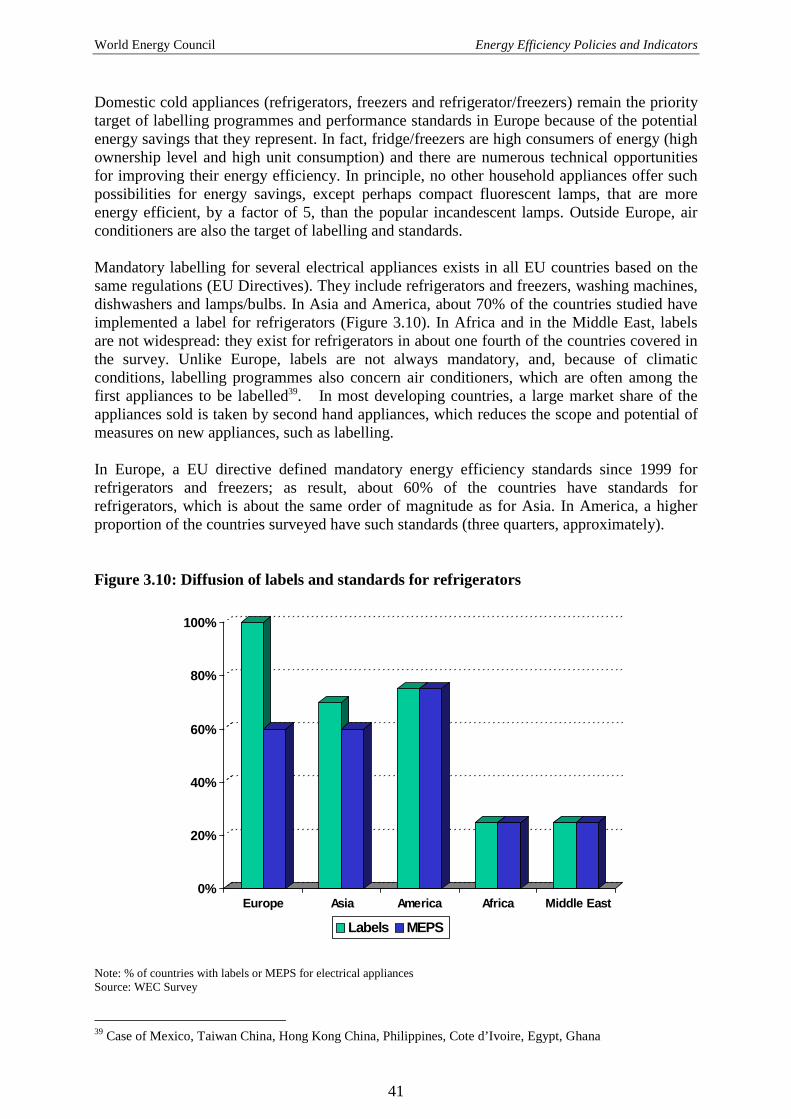
World Energy Council Energy Efficiency Policies and Indicators
41
Domestic cold appliances (refrigerators, freezers and refrigerator/freezers) remain the priority target of labelling programmes and performance standards in Europe because of the potential energy savings that they represent. In fact, fridge/freezers are high consumers of energy (high ownership level and high unit consumption) and there are numerous technical opportunities for improving their energy efficiency. In principle, no other household appliances offer such possibilities for energy savings, except perhaps compact fluorescent lamps, that are more energy efficient, by a factor of 5, than the popular incandescent lamps. Outside Europe, air conditioners are also the target of labelling and standards. Mandatory labelling for several electrical appliances exists in all EU countries based on the same regulations (EU Directives). They include refrigerators and freezers, washing machines, dishwashers and lamps/bulbs. In Asia and America, about 70% of the countries studied have implemented a label for refrigerators (Figure 3.10). In Africa and in the Middle East, labels are not widespread: they exist for refrigerators in about one fourth of the countries covered in the survey. Unlike Europe, labels are not always mandatory, and, because of climatic conditions, labelling programmes also concern air conditioners, which are often among the first appliances to be labelled39. In most developing countries, a large market share of the appliances sold is taken by second hand appliances, which reduces the scope and potential of measures on new appliances, such as labelling. In Europe, a EU directive defined mandatory energy efficiency standards since 1999 for refrigerators and freezers; as result, about 60% of the countries have standards for refrigerators, which is about the same order of magnitude as for Asia. In America, a higher proportion of the countries surveyed have such standards (three quarters, approximately). Figure 3.10: Diffusion of labels and standards for refrigerators
Note: % of countries with labels or MEPS for electrical appliances Source: WEC Survey
39 Case of Mexico, Taiwan China, Hong Kong China, Philippines, Cote d’Ivoire, Egypt, Ghana
0%
20%
40%
60%
80%
100%
Europe Asia America Africa Middle East
Labels MEPS

World Energy Council Energy Efficiency Policies and Indicators
42
Minimum energy performance standards/ target values The aim of performance standards is to improve the energy efficiency of new appliances by imposing a minimum energy efficiency rating for all the products in a given category. Depending on the programme, standards may simply be aimed at removing the least efficient products from the market or they might concern a larger proportion of appliances available on the market. As in the case of labelling, consumption is measured according to a standardized procedure and the minimum energy performance requirement differs according to the service provided by the appliance. The levels to be set are generally announced several years ahead of time so that manufacturers will have time to adapt their models to the new requirements. Examples of such standards are the MEPS programmes in Canada, US, Europe, Rep. of Korea, Mexico, and the Philippines. Certain programmes are less demanding in that they impose a sales-weighted average energy efficiency requirement. Examples are the "target values" in Switzerland or the "Top Runner Programme" in Japan. In such cases, the regulations allow the sale of less efficient equipment provided other models with a higher efficiency rating are also offered for sale. Mandatory standards/Voluntary agreements As an alternative to the regulatory process, manufacturers may propose voluntary agreements, which also aim to remove the least energy-efficient appliances from the market but allow more flexibility than minimum energy performance standards. In Europe, agreements of this kind have been signed with washing machine manufacturers. The least efficient models will be withdrawn from the market, as they are in the case of regulations, but this will be done gradually according to a schedule of different dates and conditions depending on the country. This solution is therefore more flexible than that of introducing efficiency standards. The advantage of voluntary agreements for manufacturers is that they can limit the cost of adapting to regulations as it is possible to step up the introduction of energy efficient appliances on certain markets (Northern Europe), while continuing to sell less efficient products in markets where consumers are less sensitive to this particular criterion (Southern Europe). To make up for this, voluntary agreements can supposedly be implemented much faster than restrictive regulations. 3.4.2 Impact of labelling and standards programmes Generally speaking, experience has shown that labelling programmes and performance standards are effective instruments, which enable authorities to benefit from low-cost energy savings, consumers to spend less on electricity, and manufacturers to improve their products and become more competitive against imported, less efficient products. Transfer of labelling programmes The results of the first American labelling experience (EnergyGuide programme) were not entirely convincing. The label contained too much information that was difficult for the consumer to interpret, and in practice was rarely used at the time of purchase. It was simplified in 1994. The difficulties in interpreting the EnergyGuide label have served as a lesson for recent programmes, in Europe and Australia in particular: label format and content are no longer determined by engineers alone but also by marketing experts, thereby ensuring that the label is appropriate for the target public. The consumer not only has to recognise the label but also be able to interpret it. Programmes introduced recently in the developing countries are based on these early experiences and use models that have already been proven: the European label has been used as a model in Brazil and Iran, while labels introduced in

World Energy Council Energy Efficiency Policies and Indicators
43
Indonesia and Mexico are based on the American model and those in Thailand and the Korean Republic on the Australian model (see below).
Examples of energy labels (Thailand, Brazil, Iran).
Comparison versus endorsement labelling Comparison labels enable consumers to compare the energy efficiency of all the products in a particular category (refrigerator/freezers, dryers, washing machines, etc). Examples of this type of programme are the European Label40 and EnergyGuide in US. Endorsement labels simply identify appliances that are particularly energy efficient: e.g. Energy Star in US. The former concept applies generally - though not systematically - to all the products on the market and is known as a mandatory programme, while the latter are implemented on a voluntary basis by manufacturers. Comparison and endorsement labels can both play a part in market transformation. By helping consumers identify the most energy efficient products or choose more efficient models, these labels encourage manufacturers to focus on improving energy performance. The advantage of endorsement labels is that they are easy for the consumer to recognize and interpret, but on the other hand they concern only a small proportion of equipment on the market, compared with comparison labels, which cover all appliances in a given category. Comparison and endorsement labels can, however, be complementary, with endorsement labels indicating the most energy efficient models when this information is not immediately identifiable on the comparison label. In the US, the Energy Star label is given to the 15-20% most energy-efficient refrigerators, as a complement to the Energy Guide comparison label. In Europe, this dual labelling is of less interest since the comparison label itself can be used to identify the most energy efficient models (models in class A). Mandatory versus voluntary labelling Voluntary comparison labelling programmes do exist, but in general regulations have proven more effective since they require manufacturers to put labels on all appliances and not just on the most energy efficient ones. Impact of labelling programmes It is not always easy to measure the effects of comparison labelling programmes, which can be difficult to distinguish from the effects of market transformation due to the introduction of energy efficiency standards. The European and Australian programmes are nevertheless
40 The EU labels give each appliance a grade between A and G (with A most efficient), a corresponding easy-to-read colour code (red for G, green for A), and the average specific consumption in kWh/year.
World Energy Council Energy Efficiency Policies and Indicators
44
considered successful. Between 1995 and 1999, following the introduction of labelling programmes but prior to the introduction of standards in Europe, there was a distinct change in the distribution of sales of appliances: sales of cold appliances in Class A (the most energy efficient) increased from less than 5% of total sales in 1995 to over 15 % in 199941 and 42% in 2003. Labelling has resulted in market transformation that can be attributed both to the increased interest of consumers in energy efficiency, to changes in the models made available by manufacturers, as well as to other accompanying measures (rebates, information campaigns42). In anticipation of standards, manufacturers withdrew their less efficient models that had become hard to sell and introduced new more efficient models to meet new demand and to differentiate themselves from their direct competitors. The experience has been very similar in Australia, in that benefits have been over and above just the direct electricity savings attributable to labelling. The impact of endorsement labelling programmes is also difficult to assess. The US Energy Star programme has apparently yielded positive results for certain types of equipment, since 80 to 99% of computers, monitors and printers sold in the US in 1999 were given the Energy Star label, as well as 45 to 95% of televisions, VCRs and DVDs in 200243. But the proportion of dishwashers, air conditioners and refrigerators that were given the Energy Star endorsement remained below 20%. In China, cumulative energy savings over the next 10 years resulting from labelling requirements for refrigerators and room air conditioners are expected to be of the order of 24 TWh and 13 TWh respectively, but these forecasts are based on assumptions about the introduction of the Energy Star label and it remains to be seen how they will work in the Chinese context. Labelling and standards: complementary tools Labelling programmes cannot completely transform the market and, for this reason, are completed by minimum performance standards in the great majority of countries. Standards are necessary to remove certain inefficient but inexpensive products from the market, which labelling programmes alone cannot do. They are also needed in areas where the selection criteria of consumers totally exclude energy efficiency (television sets for example), or when the economic stakes for the consumer are very limited. Basically, labelling stimulates technological innovation and the introduction of new more efficient products, while standards organise the gradual removal from the market of the least energy efficient appliances. Design of standards Efficiency standards may be drawn up in a number of different ways. In Europe, a statistical approach is used: the minimum energy performance has been defined so as to obtain an improvement of 10 to 15% in the average energy efficiency of new appliances. In the US, a techno-economic approach has been adopted: regulations require an improvement in the energy efficiency of appliances up to a certain level, which corresponds to a maximum return on investment of 3 years for the consumer. In China, standards have been drawn up in consultation with manufacturers.
41 CEC (Commission of the European Communities), 2000, COLD II, The revision of energy labelling and minimum energy efficiency standards for domestic refrigeration appliances, contract DGTREN, SAVE. 42 The different penetration of level A appliances in the EU is to a large extent due to the existence of accompanying measures, with the Netherlands recording a penetration twice as high as the EU average. 43 Nadel S., 2003, Appliance & equipment efficiency standards in the US: Accomplishments, next steps and lessons learned, ECEEE 2003 Summer Study, St Raphael.

World Energy Council Energy Efficiency Policies and Indicators
45
Impact of standards Standards have a variable impact depending on the efficiency level imposed. In China, the consensus approach had a very limited effect on the market, since 95% of the models were already compatible with the regulation of 198944. The revised standards of 1999 should have a greater impact, with expected reductions in energy consumption of the order of 10 to 15%45. In Europe, despite the heterogeneity of national markets, fairly rigorous standards have been drawn up: 40% of appliances on sale in 1996 did not comply with the standards to be introduced in 1999. In the US, the standards were more ambitious in their goal: none of the refrigerators on the US market at the end of the 1980’s met the efficiency standards planned for 1993. The drop in the average electricity consumption of refrigerators in the US confirms the positive impact of minimum performance standards on the energy efficiency of household appliances. Average consumption for cold appliances has decreased from 1726 kWh/year in 1972 to 490 kWh today, although this decline has not followed a steady curve: the periods during which energy efficiency ratings improved the most correspond to periods when new or reinforced standards were introduced (1978-81, 1986-87, 1992-93, 2000-01) while little or no improvement was observed for the periods in between46. Energy savings attributable to the introduction of standards were estimated at 2.5% of electricity use in 2000 (88 TWh)47. In Europe, progress has been less spectacular, since appliances were more energy efficient at the outset and regulations are more recent. Even so, the average energy consumption of refrigerators fell from 450 kWh/year in 1992 to around 310 kWh/yr in 200348. “Target Values”, “Top Runner”, voluntary agreements
“Target value” programmes and voluntary agreements are grouped together because of their common characteristic of giving manufacturers greater flexibility in adapting to requirements. In the case of “target value” programmes, efficiency ratings do not apply to all appliances individually but require an improvement in the sales-weighted average energy efficiency of all the products. In the case of voluntary agreements, objectives are negotiated between public authorities and manufacturers and often include flexibility margins not permitted in regulations. The best-known examples of “target value” programmes are those introduced in Switzerland and Japan. The first assessments of the Swiss programme showed that significant improvements were made in terms of energy efficiency, but in fact none of the target values was reached. Although no cause/effect relationship was clearly established, Switzerland decided in 2002 to abandon this programme in favour of the European energy label and minimum efficiency standards. In Japan, the results of the programme seem to be more in line with expectations, since the programme was extended to new appliances in June 2002. The “voluntary” nature of the programme is however not clear, in that the effect of non-compliance on sales of equipment is potentially very negative for manufacturers (the names of manufacturers who do not meet the targets are published by the METI).
44 Egan, K., and Du Pont, P., Asia's New Standard for Success: energy efficiency standards and labelling programmes in 12 Asian countries, IIEC report, July 1998, Washington. 45 Lin, 2002, "Appliances efficiency standards and labelling programmes in China", Annual Review of Energy and Environment, vol 27. 46 Nadel, S., 2002, Appliance and equipment efficiency standards, Annual Review of Energy and Environment, vol 27. 47 Nadel, 2003, Ibid. 48 Souce ISIS, E-Grids project www.e-grids.com

World Energy Council Energy Efficiency Policies and Indicators
46
In the case of voluntary agreements, the results obtained in Europe by washing machine manufacturers are in line with the commitment. The objective of a 20% improvement in average energy efficiency agreed upon by manufacturers for the period 1994-2000 (equal to a reduction in average consumption from 0.30 kWh/kg in 1994 to 0.24 kWh/kg in 2000) was reached ahead of time (average energy efficiency observed in 1999 was 0.228 kWh/kg)49. Other similar agreements have since been signed at the European level for dishwashers, electric water heaters and the electricity consumption of TVs and VCRs in standby mode. On the other hand, the results of voluntary agreements in Brazil have been far less positive: the first agreements signed in 1994 had a limited impact with only some of the least efficient models disappearing from the market, and new agreements in 1998 did not lead to any significant improvement in energy performance50. Finally, Brazilian Congress recently passed a law to replace voluntary agreements with minimum energy efficiency standards. The effectiveness of voluntary agreements depends on the commitment of manufacturers, who must make a genuine additional effort to achieve progress beyond the instant improvement in the energy efficiency of new appliances. It is also a question of discouraging “free riding”, which can happen in the case of voluntary agreements. To avoid this type of behaviour, the European Commission seeks widespread participation from manufacturers before entering into any voluntary agreement. 3.4.3 Conclusions and recommendations Labelling programmes and efficiency standards are an effective method of transforming the market and slowing the growth in electricity demand. However, none of the programmes introduced has been able to reverse or put on hold the increase in electricity consumption in the domestic appliance sector, essentially because of changes in ownership levels, introduction of new equipment and the emergence of new needs. For such progress to be made, stricter minimum efficiency standards would have to be introduced51. To be effective, labelling programmes and performance standards must be open-ended, i.e. regularly revised and upgraded. In the US, changes in the energy efficiency of cold appliances clearly show that energy efficiency improves as a result of new standards but then stabilizes. Faced with new standards, manufacturers adapt the appliances available on the market so that they meet the new minimum requirements, but there are no incentives for them to go beyond what is required if no stricter standards have been planned for the future. For this type of programme, where labels play a secondary role, it is essential to reinforce standards at regular intervals as a way of stimulating technical progress and ensuring a steady improvement in energy efficiency. In the case of the European and Australian programmes, the complementarity of energy labels and standards has played a vital role. The requirements are not as strict as they are in the US, but labelling acts as an incentive for manufacturers to differentiate themselves from their competitors and stimulates the introduction of new, more efficient models. However, there is no longer any incentive to innovate when all the models are in the best efficiency classes (of Australian experience) or when most of the models on the market have been endorsed with a label (Energy Star programme in the US).
49 CECED, 2000, CECED Voluntary Commitment on reducing energy consumption of domestic washing machines, 3rd annual report to the CEC, Aug 2000. 50 S. Nadel, 2002, Ibid 51 See in particular Cool Appliances: policy strategies for energy efficient homes, OECD/IEA, 2003.

World Energy Council Energy Efficiency Policies and Indicators
47
In this respect, the "Top Runner" programme has the particular advantage of making easier the definition of new targets. As the most efficient appliances on the market at a given time are used to set the future standards, there is no need for extensive market or techno-economic analysis to set the minimum energy efficiency standards. With this type of approach, the preparatory work may be shortened and the negotiations between manufacturers and public authorities facilitated as the target corresponds to existing appliances that are already available on the market.
The European example shows that redefining the energy efficiency classes is not simply an administrative decision. The introduction of standards in 1999 has progressively led the authorised models (cold appliances) to group together into the three remaining classes A, B and C, but redistributing them into new efficiency classes proved conflictual afterwards. Logically, the appliances on the market should have been distributed among the 7 energy-efficiency classes (A to G), as in 1995, but manufacturers were opposed to this idea on the grounds that it would confuse consumers: a particular model could have initially been in class A and then downgraded to class D. The solution of creating two new classes (A+ & A++) was chosen so as to avoid this problem, but clearly this is a temporary solution and the same situation will have to be dealt with again in the short term. Note that the Australians were faced with exactly the same problem in 2000 and opted for maintaining the labelling system: manufacturers, consumer associations and legislators agreed that 5-star refrigerators would only be given 2 stars in the new system52.
Generally speaking, manufacturers are opposed to anything that can disrupt market operation, which means efficiency standards in particular, but also labelling systems in certain contexts. Among the arguments frequently advanced by manufacturers is the risk of higher production costs in a context where the possibilities of increasing prices are limited by fierce competition, innovation focused on areas of little importance to consumers, and a less diverse range of products. Experience has shown that such fears are largely unfounded: the turnover and profit levels of manufacturers are not adversely affected by the introduction of standards, nor do the standards compel them to eliminate certain functions to reduce energy consumption53. The process of negotiating the introduction of new standards or reinforcing existing ones remains nevertheless conflicting and uncertain.
In the US, the process to step up standards at the federal level has received the support of manufacturers who were particularly concerned about differing decisions made between the states. In Europe, this risk of reducing markets as a result of divergent standards does not exist since it is prohibited under European law. Consequently, manufacturers do not have the same incentive to adopt a single European standard as a way of avoiding a multiplicity of national regulations. This undoubtedly explains why, after cold appliances and lamp ballasts, no new performance standards for domestic appliances have been adopted at the European level. Today, the process seems to be at a standstill under pressure from industry, pressure that is created by several Member States that favour a voluntary approach.
In certain conditions, voluntary agreements can be an effective alternative to minimum energy efficiency standards. Since they have the support of manufacturers, they can be implemented more rapidly than regulations. Nevertheless, their effectiveness is still dependent on the possibility of imposing precise requirements corresponding to genuine additional efforts from industry. To achieve this, the free flow of information should be ensured. Above all, the regulations must remain credible if negotiating power is to stay in the hands of the public authorities.
52 Holt S. and Harrington L., 2003, "Lessons from Australia's standards and labelling programme", ECEEE 2003 Summer Study, St Raphael. 53 Nadel, 2003, Ibid.

World Energy Council Energy Efficiency Policies and Indicators
48
3.5 Innovative Energy Efficiency Funds54 The difficulty of obtaining the necessary financing is too often a major barrier to energy conservation projects. Many governments have already implemented energy efficiency funds mostly in the form of subsidies. More recently, because of the need of governments to reduce the public debt, new “innovative” financial schemes have been designed. These “innovative Funds” use tools traditionally dedicated to private sector investments (loans, equity participation, venture capital, etc.) and seek the participation of private investors, such as banks or private companies (ESCOs). In addition, their long-term objective is to develop a market for energy efficiency that would be “self-sustaining”. Finally, their short-term objective is to obtain a good return on investments. The main difference between a “subsidies fund” and an “innovative fund” is that the latter seeks a potential return on investment for the private investor involved in the scheme. The fund sponsors need the guarantee that they will be reimbursed of the money they have put into the project in one way or another depending on the type of financial instrument used (loan, equity participation, convertible debt, energy performance contracting, etc.). Whereas public funds inject money into the system without searching for direct financial benefits, the private or public-private fund seeks direct profitability, at least for the private partners. Of course, innovative funds alone are not sufficient to ensure a great increase in the market as most of them require a wide range of projects; whose financial profitability or size are not attractive enough. In fact, the best solution often appears to be a mix of innovative and classic funds. Moreover, innovative funds promoting energy efficiency require legislative or financial public support and most of the funds presented below involve partial public funding. Finally, the increased use and interest in these innovative funds can also be seen as the expression of a worldwide trend to share management and to transfer public objectives to the market. Usually banks are not so familiar with energy efficiency (small projects, lack of expertise, low return on investments). The idea that cash flow is generated from energy savings rather than physical sales is not a usual financial concept. Banks tend to be conservative but less so if they have already had experience of this type of scheme and understand the profitability of such projects. The primary objective of innovative funds is the participation of banks. One can wonder why the fund designer decides to bring funds through financial intermediaries when it can finance the designated beneficiaries itself. Yet the purpose of innovative funds is to develop, on the middle term, a market for energy efficiency that would be “self-functioning” and “self-financing”. Introducing banks into energy efficiency programmes is a first step in this goal. Besides, it permits to transfer to the financial sector of know-how on financing specific energy efficiency projects and to overcome the traditional reluctance characterising financial institutions on this type of project. At this first stage of the scheme, participating banks carry very low financial risks, indeed only that of interest rates non-recovery. Developing countries and emerging economies tend to be higher risk market environments for project investments, and it may make it more difficult to raise finance or secure profitable investments. These countries face several barriers to the development of energy efficiency that also exist in developed countries, but to a lesser extent: 54 This section is based on a case study prepared for the project by J Lopez and E Metreau from ICE. This case study is available as a separate document on the WEC web site: “Comparison of best practices in developing and managing financial mechanisms that support energy efficiency projects”, ADEME and ICE, January 2004
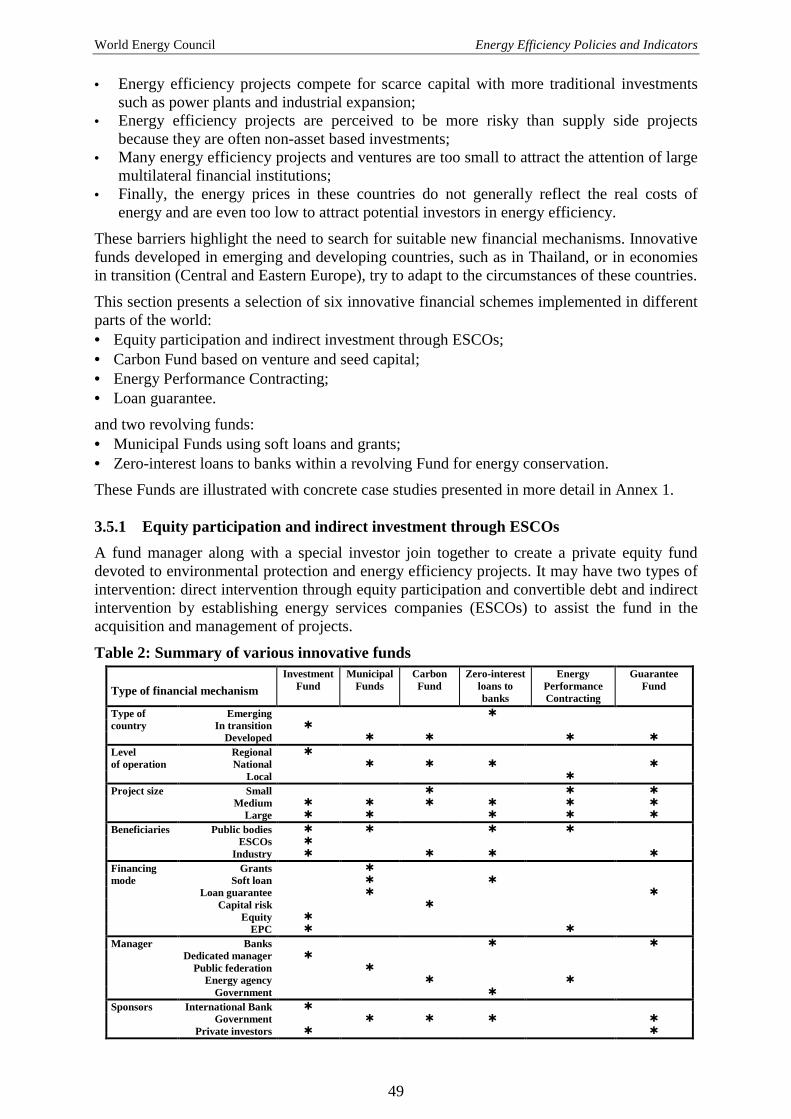
World Energy Council Energy Efficiency Policies and Indicators
49
• Energy efficiency projects compete for scarce capital with more traditional investments such as power plants and industrial expansion;
• Energy efficiency projects are perceived to be more risky than supply side projects because they are often non-asset based investments;
• Many energy efficiency projects and ventures are too small to attract the attention of large multilateral financial institutions;
• Finally, the energy prices in these countries do not generally reflect the real costs of energy and are even too low to attract potential investors in energy efficiency.
These barriers highlight the need to search for suitable new financial mechanisms. Innovative funds developed in emerging and developing countries, such as in Thailand, or in economies in transition (Central and Eastern Europe), try to adapt to the circumstances of these countries.
This section presents a selection of six innovative financial schemes implemented in different parts of the world: • Equity participation and indirect investment through ESCOs; • Carbon Fund based on venture and seed capital; • Energy Performance Contracting; • Loan guarantee. and two revolving funds: • Municipal Funds using soft loans and grants; • Zero-interest loans to banks within a revolving Fund for energy conservation. These Funds are illustrated with concrete case studies presented in more detail in Annex 1. 3.5.1 Equity participation and indirect investment through ESCOs A fund manager along with a special investor join together to create a private equity fund devoted to environmental protection and energy efficiency projects. It may have two types of intervention: direct intervention through equity participation and convertible debt and indirect intervention by establishing energy services companies (ESCOs) to assist the fund in the acquisition and management of projects.
Table 2: Summary of various innovative funds
Type of financial mechanism Investment
Fund Municipal
Funds Carbon Fund
Zero-interest loans to banks
Energy Performance Contracting
Guarantee Fund
Type of Emerging � country In transition � Developed � � � � Level Regional � of operation National � � � � Local � Project size Small � � � Medium � � � � � � Large � � � � � Beneficiaries Public bodies � � � � ESCOs � Industry � � � � Financing Grants � mode Soft loan � � Loan guarantee � � Capital risk � Equity � EPC � � Manager Banks � � Dedicated manager � Public federation � Energy agency � � Government � Sponsors International Bank � Government � � � � Private investors � �

World Energy Council Energy Efficiency Policies and Indicators
50
This type of fund appears to be relevant for economies in transition, where energy efficiency and ESCOs are still very new issues. It is a very recent type of application, only developed to date by the private equity investment firm, Fondelec. Annex 1 presents the activities of the DEXIA- Fondelec Fund in Central and Eastern Europe Countries. Created in 2000, the Fund brings in to companies the capital of a set of institutional investors (among them DEXIA and the European Bank for Reconstruction and Development). For the term of the investment, 40 M€ was already earmarked for the financing of nine projects. Fondelec is also establishing a similar fund in South America, called the Latin American Clean Energy Services Fund.
To increase the capacity of such Funds to significantly stimulate the creation of an energy efficiency market, it is necessary to have a 100% equity participation for the first projects developed in the targeted region. As no bank is at first willing to bring money into an innovative project with no capital and no balance sheet, thus no guarantee of refunding, the Fund takes the risk by bringing a 100% equity into the first projects. Once the project has proven to be successful, banks agree to lend money to new projects and the fund can reduce its equity participation to 50%, then to 30%. In doing so, the fund develops a market for ESCOs and energy efficiency.
Figure 3.11: Equity participation and investments through ESCOs
3.5.2 Carbon Fund based on venture and seed capital 55 Another type of innovative fund is that of the equity participation of the fund in organisations developing innovative low carbon technologies. The Fund acts as a venture capital company but it seeks a return in terms of CO2 emission reduction rather than a simple financial return on commercial results. Correlatively, the Fund can provide seed capital, by providing expertise to technology promoters wishing to create a company specialised in low carbon technologies. Experience of public Funds acting as a “Venture Capital Company” is still extremely limited, and for the moment, there are no private Funds specialising in venture capital operation, as the
55 Venture capital, also called risk capital, refers here to capital invested in new and innovative activities.
Company that implements EE or EnR operations
Company that implements EE or EnR operations
Company that implements EE or EnR operations
Support to creation
Direct intervention
SPONSORS � International
investors � National or
International Banks
� National or international
Indirect intervention
FUND MANAGER
Convertible debt

World Energy Council Energy Efficiency Policies and Indicators
51
energy efficiency field is still too risky and too unfamiliar to private investors. An example of a Fund acting as a venture capital company is the Carbon Trust in the United Kingdom. Financed by the Climate Change Levy, the Carbon Trust (CT) was established in April 2001 as a non-profit organisation to lead on business and public sector energy efficiency and to support the creation of a low carbon economy in the UK. The Low Carbon Initiative Programme of the CT has four principal areas of activity: R&D, demonstration, carbon finance and market diffusion. The objective of such an instrument is to create or drive a market for low carbon technologies developed by companies that do not have the financial strength to market them. By the classical means of financing (equity participation or debts), these companies cannot find investors and financial institutions willing to participate as the projects are too risky. This Fund differs from the commercial venture capital market by targeting low carbon and energy efficient technologies, as well as providing a suite of financial instruments to assist innovation towards commercial viability. By doing so, the Fund maximises leverage of its own funds with public and private investments. This type of activity has specific consequences for the beneficiaries and for the Fund itself. Figure 3.12: Fund based on venture and seed capital (British Carbon Trust)
The main advantage of this scheme is that a public institution secures part of the investment. Raising capital from private investors is still a challenge for new, relatively risky and pioneering fields of investment. However, the public security is likely to provide an incentive for other private investors to participate in this type of project.
This Fund is well adapted to knowledge-based, young or start-up companies in the field of energy and environment. These companies, particularly at their beginning, have typically few fixed assets suitable to serve as a guarantee for possible lenders. Lenders are generally not easily inclined to grant loans to starting or young, as yet unproven companies, because their cash inflows are not easily forecast.
Tax on energy consumption
Very innovative projects using low carbon technologies
Advice on the project proposals from independent experts
Research and development
Carbon Finance
Demonstration
Market diffusion
Seed Capital
Venture Capital
Other programmes
Low Carbon Initiative Programme
FUND
Part of the tax income

World Energy Council Energy Efficiency Policies and Indicators
52
3.5.3 Energy performance contracting Energy Performance Contracting (EPC)56 is a contract on energy performance between a consumer and an Energy Service Company (ESCO) that uses cost savings from reduced energy consumption to repay the cost of implementing energy conservation measures. The ESCO, which is basically a supplier for building techniques, an engineering company or a utility, carries out a cluster of services and carries the risks of performance and operation. In this scheme, an energy agency can intervene to assist the public body in the collection of energy data, in the negotiations with ESCOs (tendering process) and in the follow-up of the project.
Figure 3.13: Example of an EPC scheme developed in the public sector
Certain countries, such as Germany, Switzerland or Austria, are quite advanced in using these schemes. In Germany, a large-scale project of Energy Performance Contracting is being developed in Berlin. From 1995 to 2001, 318 public buildings in Berlin, grouped in 12 pools, were contracted to private investors to implement energy savings improvements. The average energy saving guarantee is of about 23% of the energy consumption.57
56 The contract guarantees the client the achievement of a certain fixed reduction in energy consumption (on costs). Normally offered by Energy Service Companies (ESCOs), this financing technique allows the capture of benefits from energy savings without up front capital expenses on the part of the client, since the costs of the energy improvements (energy audits, feasibility study and investment) are borne by the performance contractor and paid back out of the energy savings. This mechanism offers to the client the opportunity to deal with single contractors that will be responsible for the definition, financing, implementation and following-up of the energy efficiency measures. 57 The yearly cost savings amount to 1.7 M€/year for the budget of public bodies, whereas the contractor is already paid from the total energy cost savings which amount to 5.9 M€/year. The Berlin Energy Agency plays a role of coordination between the public administrations and the ESCO, assists the municipalities in the whole procedure from the tendering process to the contract’s supervision.
Project manager
Guaranteed savings
BUILDING POOL Public building 1(ex: hospital) Public building 2 (ex: school) Public building 3 Etc
ENERGY SAVING PARTNER
Payment
Energy supplier
District heating
Gas ElectricityOilAgreement covering technology and supply
Municipality
Payment
ESCO 1 ESCO 4ESCO 3ESCO 2
Assistance for the procurement process
ESCO selected by the building pool after the tendering process
payment
Negotiation, final recommendation and assignment of the contract
Assistance: � on the
preparation of the basic data on the building
� on the whole

World Energy Council Energy Efficiency Policies and Indicators
53
Similar projects, on even a smaller scale, were developed in other German cities.58 Austria is also very active in the field of EPC in the public sector.59 At present, these experiences in the public sector have proven to be positive and are being introduced in other countries of the European Union.60 3.5.4 Guarantee funds Guarantee funds consist of a mutual guarantee provided by specific institutions to banks granting loans in the medium and long term. If a national guarantee fund not specific to energy efficiency and renewable energy projects is already established, the Fund can reinforce the loan guarantee for borrowers that invest in these fields by offering an additional guarantee to the national Guarantee Fund: for instance, 30% in addition to 40%. Guarantee funds exist in many countries. However, these funds are not adequate for the purpose of financing energy efficiency projects and most of them have ceilings reducing the guarantee amount to a very low level. International experience with guarantee funds for energy efficiency is limited. Apart from France, there are examples in China, Hungary and recently in Brazil. Initiatives are less advanced in other countries. However, there is widespread interest in developing this kind of mechanism. In France, the Guarantee Fund for Energy Conservation – the FOGIME - was set up by ADEME in partnership with the Bank for the Development of SMEs (BDPME) through its subsidiary company SOFARIS, EDF and the French Coal Board. It is a mutual guarantee provided by BDPME-SOFARIS and ADEME to banks granting loans in the medium and long term. The FOGIME reinforces the loan guarantee for SMEs that invest in energy efficiency or renewable energy: 70% against 40% provided by the national Guarantee Fund for the development of SME, the 30% additional being financed by ADEME (see Annex 1). Figure 3.14: Guarantee funds61
58 For instance, in Frankfurt for the Church of Saint-Paul, the town hall and the Art museum or in Heidelberg for energy efficiency projects in schools. 59 Projects have been developed in the schools of various cities (Feldbach in the area of Styria, Grossraming in the North of Austria, Zistersdorf). In Vienna, the municipal authority had selected ESCOs for energy efficiency works in ten municipal buildings. 60 For instance in Finland, in Greece, in Slovenia, as well as in other new EU member countries through the project “Clearinghouse for Third Party Financing in Eastern Europe” which is supported under the SAVE-Programme. 61 In France, there is no commission to get the guarantee
Bank Bank Bank
Application for loan
Energy Agency
Demand for technical advice Guarantee of 30%
Demand for guarantee
Fund managerGuarantee of 70%
SMEs which invest in energy efficiency or renewable energy
Commission to beneficiate from the guarantee

World Energy Council Energy Efficiency Policies and Indicators
54
To maximise the efficiency of such a fund, it is necessary to have a good assessment of the potential benefits: the guarantee covers the credit risks. To mitigate this risk, high quality and bankable projects should be selected from the beginning. For instance, in the frame of FOGIME, the fact that 1/3 of the SMEs benefiting from the guarantee had first received support from ADEME to finance energy audits, ensuring that these firms have experience in environmental and energy efficiency issues.
In the French model, the administration fee paid to the FOGIME has been in line with the fee paid to the national guarantee fund in order not to discriminate against energy efficiency and renewable energy projects.
3.5.5 Revolving funds There are an increasing number of experiences of revolving funds throughout the world62, mostly implemented at national level, but also at local level. Yet, because they are framed by the specific legislation in force in a country, they cannot be implemented at regional level like an Equity Fund. Moreover, all of them imply the intervention of a public and national body, in a way or another (as sponsor or fund manager). Case of municipal revolving funds Two examples of revolving funds that offer very favourable loans to municipalities are the Canadian Green Municipal Investment Fund and the Hungary Energy Efficiency Co-Financing Scheme (EEFS) created in 1998.63 The Canadian Municipal Green Fund is described below. It provides loans with very favourable terms to municipalities that wish to invest in energy efficiency and renewable energy. The Funds can also be opened to private companies if they are partners of the local communities in the project. This statute of partnership must be clearly established either by the participation of the municipality in the “input" of the project (land provision for the installation of a wind farm for example), in its "output" (long-term repurchase contract of wind electricity) or by its participation in the financing of the project. The Fund can also finance projects ("Project Finance"). The loans are granted at a rate of a few points below the bond rate (the lowest of the country) for the municipalities and at a rate of a few points over the bond rate for their private partners. The Fund can also provide a guarantee on loans applied to commercial banks. This scheme has three main advantages. First of all, it is a very cost-effective public funding tool. As the borrowers repay the loans, the only costs the sponsor supports are the administration costs but these costs are covered by the interest rate. Moreover, the municipalities that borrow capital for energy efficiency projects can recover their financing costs through the energy savings these investments achieve. Secondly, the public sector is a reliable borrower: it is not perceived as a risky sector (very low commercial and political risks); the cost of financing (the interest rates) can therefore be very low. Finally, such a scheme encourages public and private cooperation.
62 Revolving means that the reimbursement of the loans is recycled into the fund to support new projects. 63 The Federation of Canadian Municipalities (FCM) manages the first, while the second is managed jointly by the Hungarian Energy Centre for the technical and economical issues (in particular the selection of projects) and the national banks for financial issues. The Federal Government finances the Canadian Fund while three institutions sponsor the EEFS (the European Union, the Hungarian Ministry of Economic Affairs and the National bank).

World Energy Council Energy Efficiency Policies and Indicators
55
The nature of the Fund Manager should be well adapted to the type of clients. A federation of municipalities – such in the Canadian model - has the advantage of having regular and numerous contacts with municipalities. It has a good reputation and is known as competent on financial but also environmental issues, on which they often lack knowledge. But in many countries (especially in Asia), soft loans can only be delivered by financial institutions. This can constitute a limit as banks have not necessarily the required skills in the field of environmental or energy efficiency projects. This formula would require staff training or the hire of new experts highly experienced in environmental and financial issues.
Figure 3.15: Municipal revolving funds
Revolving fund with zero-interest loans to banks Such a Fund is replenished by the State budget or by income from an energy tax to provide specific banks with a revolving budget (zero-interest rate loans) that they will use to offer soft loans64 to public bodies and industries undertaking energy efficiency works. These banks have signed an agreement with the Fund manager to participate in the scheme. They lend at an interest rate that covers the transaction costs and a minimum profit. There is a worldwide tendency for national energy efficiency strategies to involve the banking sector on lending State and public finance resources to small, medium or large energy efficiency projects. Yet the ways in which these banks will be involved, and the targeted sectors, are slightly different from country to country. The EU commission, in particular through its funding programme PHARE oriented towards East European Countries, co-finances (in general with the State concerned) specific programme or Funds that will rely on the participation of commercial banks. The Fund will finance the subsidy on the interest rate or the loss of banks caused by the acceptance of favourable terms (such as a long repayment term). The Latvia Energy Efficiency Fund or the Hungarian Energy Efficiency Credit Fund are examples of such a scheme. Such Funds are particularly well developed in the United States where the subsidies on the rates are financed by the State Governments. Several similar schemes exist in the European Union: the German Bank for Reconstruction and Development (KfW), in collaboration with the Federal government, proposes soft loans to households wishing to undertake energy efficiency measures in their dwelling. The Spanish Official Institute for Credit (ICO) offer similar products co-financed by the Spanish Energy Management Agency, IDEA.
64 Money lent on favourable terms, which the borrower could not get in the commercial market. The lender could be a government or government organisation making a subsidised loan to encourage a particular activity. The borrower could be an entity undertaking specific works designated as priorities by public authorities
Funds
Sponsor: - Govern
ment - Nationa
l banks
Fund manager
Green Municipal
Investment Fund
Management agreement
Municipalities
Private organisationsLoans
Projects
Average interest rate of 1,5% above the bond rate
Loan guarantees
Interest rate of 1,5% below the bond rate
Repayment
Loan provided by private financial institution
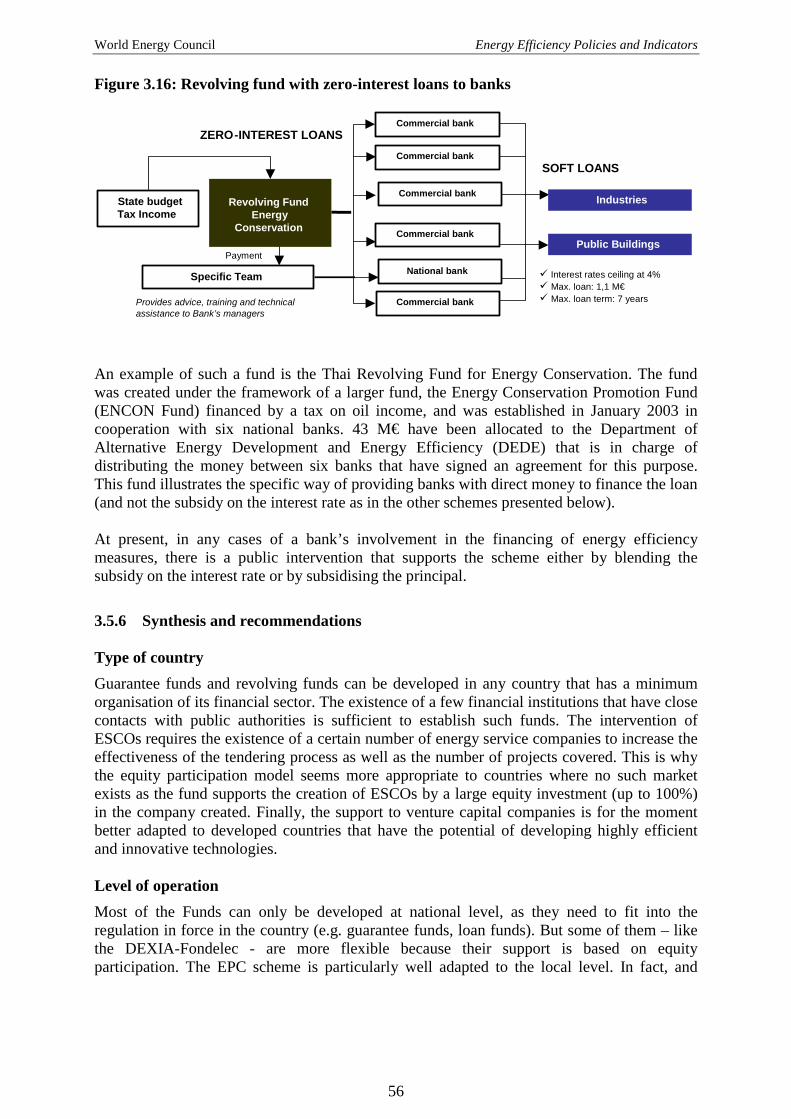
World Energy Council Energy Efficiency Policies and Indicators
56
Figure 3.16: Revolving fund with zero-interest loans to banks
An example of such a fund is the Thai Revolving Fund for Energy Conservation. The fund was created under the framework of a larger fund, the Energy Conservation Promotion Fund (ENCON Fund) financed by a tax on oil income, and was established in January 2003 in cooperation with six national banks. 43 M€ have been allocated to the Department of Alternative Energy Development and Energy Efficiency (DEDE) that is in charge of distributing the money between six banks that have signed an agreement for this purpose. This fund illustrates the specific way of providing banks with direct money to finance the loan (and not the subsidy on the interest rate as in the other schemes presented below). At present, in any cases of a bank’s involvement in the financing of energy efficiency measures, there is a public intervention that supports the scheme either by blending the subsidy on the interest rate or by subsidising the principal.
3.5.6 Synthesis and recommendations Type of country Guarantee funds and revolving funds can be developed in any country that has a minimum organisation of its financial sector. The existence of a few financial institutions that have close contacts with public authorities is sufficient to establish such funds. The intervention of ESCOs requires the existence of a certain number of energy service companies to increase the effectiveness of the tendering process as well as the number of projects covered. This is why the equity participation model seems more appropriate to countries where no such market exists as the fund supports the creation of ESCOs by a large equity investment (up to 100%) in the company created. Finally, the support to venture capital companies is for the moment better adapted to developed countries that have the potential of developing highly efficient and innovative technologies. Level of operation Most of the Funds can only be developed at national level, as they need to fit into the regulation in force in the country (e.g. guarantee funds, loan funds). But some of them – like the DEXIA-Fondelec - are more flexible because their support is based on equity participation. The EPC scheme is particularly well adapted to the local level. In fact, and
State budget Tax Income
� Interest rates ceiling at 4%� Max. loan: 1,1 M€ � Max. loan term: 7 years Provides advice, training and technical
assistance to Bank’s managers
Specific Team
Commercial bank
SOFT LOANS
Payment Commercial bank
Commercial bank
Commercial bank
National bank
Industries
Public Buildings
Commercial bank
Revolving Fund
Energy Conservation
ZERO-INTEREST LOANS
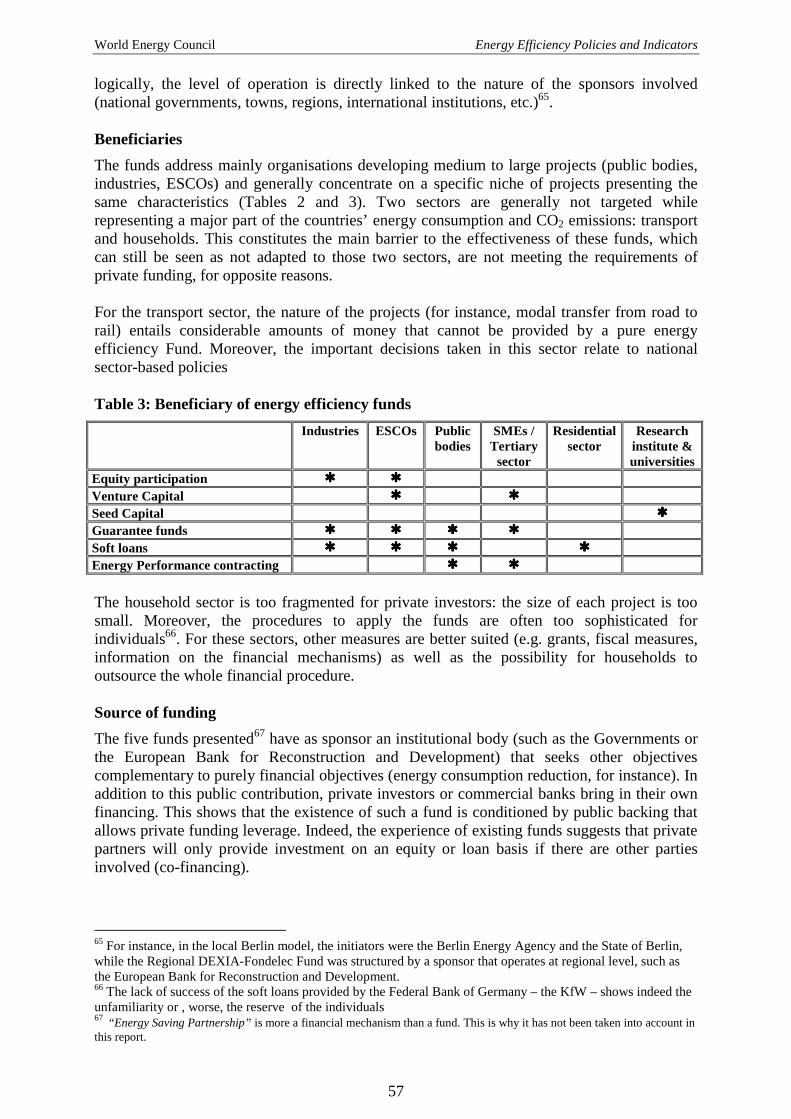
World Energy Council Energy Efficiency Policies and Indicators
57
logically, the level of operation is directly linked to the nature of the sponsors involved (national governments, towns, regions, international institutions, etc.)65. Beneficiaries The funds address mainly organisations developing medium to large projects (public bodies, industries, ESCOs) and generally concentrate on a specific niche of projects presenting the same characteristics (Tables 2 and 3). Two sectors are generally not targeted while representing a major part of the countries’ energy consumption and CO2 emissions: transport and households. This constitutes the main barrier to the effectiveness of these funds, which can still be seen as not adapted to those two sectors, are not meeting the requirements of private funding, for opposite reasons. For the transport sector, the nature of the projects (for instance, modal transfer from road to rail) entails considerable amounts of money that cannot be provided by a pure energy efficiency Fund. Moreover, the important decisions taken in this sector relate to national sector-based policies Table 3: Beneficiary of energy efficiency funds Industries ESCOs Public
bodies SMEs /
Tertiary sector
Residential sector
Research institute & universities
Equity participation ���� ���� Venture Capital ���� ���� Seed Capital ���� Guarantee funds ���� ���� ���� ���� Soft loans ���� ���� ���� ���� Energy Performance contracting ���� ���� The household sector is too fragmented for private investors: the size of each project is too small. Moreover, the procedures to apply the funds are often too sophisticated for individuals66. For these sectors, other measures are better suited (e.g. grants, fiscal measures, information on the financial mechanisms) as well as the possibility for households to outsource the whole financial procedure. Source of funding The five funds presented67 have as sponsor an institutional body (such as the Governments or the European Bank for Reconstruction and Development) that seeks other objectives complementary to purely financial objectives (energy consumption reduction, for instance). In addition to this public contribution, private investors or commercial banks bring in their own financing. This shows that the existence of such a fund is conditioned by public backing that allows private funding leverage. Indeed, the experience of existing funds suggests that private partners will only provide investment on an equity or loan basis if there are other parties involved (co-financing). 65 For instance, in the local Berlin model, the initiators were the Berlin Energy Agency and the State of Berlin, while the Regional DEXIA-Fondelec Fund was structured by a sponsor that operates at regional level, such as the European Bank for Reconstruction and Development. 66 The lack of success of the soft loans provided by the Federal Bank of Germany – the KfW – shows indeed the unfamiliarity or , worse, the reserve of the individuals 67 “Energy Saving Partnership” is more a financial mechanism than a fund. This is why it has not been taken into account in this report.

World Energy Council Energy Efficiency Policies and Indicators
58
Link with carbon credit trading systems Some funds seek to use the carbon emission reductions resulting from the financed project to obtain carbon credits allowing an increase of the projects’ profitability as well as a mitigation of the projects’ associated risks. This is the case of the DEXIA-Fondelec Fund or the Canadian Green Municipal Investment Fund (GIMF). The DEXIA-Fondelec Fund has signed an agreement with the Prototype Carbon Fund (PCF) on this subject but unless the projects have been endorsed by the government concerned, the carbon emission reductions cannot be turned into credits. The GMIF has created an experimental tool called the “Emission Reduction Rights based financing”. In the frame of this new tool, loans will be reimbursed not in terms of financial flow but by transferring to the Green Fund the carbon credits gained as a result of the project’s emission reductions. In a second stage, it is the intention of the Fund to sell these credits to cover the loans and the interest rate provided through this tool. The remaining proceeds from the sale of the credits will be to the benefit of the project sponsor. In the two cases, the development of such schemes is at an experimental and discussion stage for the major reason that nothing can be done without knowing the clear standing of governments on the carbon credit trading systems. Carbon credit trading systems remain, nevertheless, a positive perspective for project promoters in the field of environment and energy efficiency. Recommendations on the fund management The success of any financial mechanism for energy efficiency depends on the degree to which it meets and completes several key tasks, including a thorough analysis of the country’s specific circumstances, favouring the creation of a market for energy efficiency especially by establishing strategic alliances with private partners and financial institutions, reducing transaction costs and minimising project risks. The funds presented in this report are in an early stage of development and while identifying projects can be a slow process, there are clear prospects that the number of opportunities will grow in the future. The primary objective of an innovative fund is to create a market for energy efficiency and ESCOs. For this, several requirements should be fulfilled. A clear differentiation is necessary between market creation and market performance. When no market for energy efficiency exists, special tools need to be developed to create it. Those tools would be withdrawn progressively once the market performs. At the first stage, greater support should be provided to starting projects as no financial institution is willing to provide funds, reducing noticeably the possibilities of co-financing. For instance, 100% equity participation or venture capital strengthens the financial capability of starting companies. The Fund start-up time-frame should be clearly defined: this period is risky.
The involvement of financial institutions should be increased. Governments should find means to introduce national banks and specialised investors into the market. The first hurdle is the bank’s ignorance and their reservations about what is still seen as a new, risky and pioneering field of investment. Knowledge, then know-how transfer to this sector, is essential. It is important that at the first stage of the scheme, participating banks should take on low financial risks: in the Thai model, they carry only the interest rates non-recovery risk. Later, once they have gained experience, this gives them incentives to provide capital.
Another way to increase know-how of energy efficiency at the financial institution level is to give possibilities to private sponsors to be strongly involved in the projects: as in the DEXIA-Fondelec model, they should be drawn into project assessment and selection.
Small size projects should be pooled together. The volume of investment generally needed to obtain financing from financial institutions is not adapted to the relatively limited size of energy efficiency projects. A way to overcome this barrier is to pool projects: it increases the

World Energy Council Energy Efficiency Policies and Indicators
59
project volume making it attractive and could minimise transaction costs. But it is necessary to pool projects that are very similar and to designate a team, organisation or company in charge of the pooled projects management. A more feasible method would be to define a relevant size for project eligibility, which would not ignore small yet very profitable projects. This entails meeting a certain target in terms of quantity of projects financed. 3.6 Voluntary / Negotiated Agreements68
3.6.1 Introduction Voluntary/negotiated agreements (VAs/NAs) were developed in the 1990s to address the prevailing view that environmental regulation, in particular in respect to climate change, had reached its limits, and at the same time economic instruments seemed too costly (subsidies) or too unpopular (energy/CO2 taxes). At present, several countries are introducing new VAs schemes using previous experience (e.g. France) or implementing VAs for the first time (e.g. Austria and Ireland). The most advanced country in this field, the Netherlands, has left the traditional VAs concept and moved onto another type of agreement based on benchmark values.
There are three main types (see Table 4) of VAs/NAs in the field of energy efficiency/climate change: unilateral commitments made by industrial companies; negotiated agreements (NA) between industrial companies and public authorities (typical of most of the existing agreements); and voluntary programmes developed by public authorities to which companies are invited to participate.
Table 4: Examples of the different types of VAs/NAs69
Type of voluntary or negotiated agreements
Examples in the field of energy efficiency/ climate change
1 Unilateral commitments Nippon Keidanren Voluntary Action Plan for the Environment
2 Negotiated agreements
Dutch Long-Term Agreements, German climate change agreements, Dutch and Flemish Benchmarking Covenants, Negotiated agreements with industry in Brazil
3 Voluntary programmes developed by public authorities
EU GreenLight / MotorChallenge Programmes, US and EU Energy Star
One important issue concerns the future of VAs/NAs. Each policy instrument might have a time when its use is expanding, especially if it fits into the general philosophy of policy making. Its growth might also rapidly encounter difficulties in providing clear evidence for its effectiveness or if new policy instruments are coming up that are supposed to better achieve a given target. Figure 3.17 indicates that in Europe, the interest in this new instrument is at the very least stagnating, if not diminishing70. One reason could be the upcoming emissions trading system that is currently being developed in Europe with the establishment of National Allocation Plans for the players involved.
68 This section is based on a case study prepared for the project by Wolfgang Eichhammer and Joachim Schleich from Fraunhofer ISI. This case study is available as a separate document on the WEC web site: “Voluntary / Negotiated Agreements to Improve Energy Efficiency and to Protect the Climate “, ADEME and FhG-ISI, April 2004 69 The expression VA/NA is used in the following to designate all types of agreements 1-3 mentioned in the table. Sometimes, for simplicity, the expression "Voluntary agreements" is used. 70 The interpretation of this figure is quite complex: First of all, the number of VAs/NAs indicated in the figure does not refer to individual agreements with single industrial sectors but rather to “rounds” of agreements in a given country that concerned many sectors at the same time. A variety of countries that had agreements in the middle of the nineties, went through a second wave of agreements towards the beginning of this decade. Second, although the figure clearly indicates the rising interest in many EU countries in the middle of the nineties in this policy tool, the decrease in 1998/99 (which is simply due to the duration of the agreements) and in 2002/03, does not yet indicate that the interest in the instrument has begun to dwindle in Europe.

World Energy Council Energy Efficiency Policies and Indicators
60
Figure 3.17: Frequency of Voluntary Agreements in the EU since 1990
0
1
2
3
4
5
6
7
1 9 9 0 /9 1 1 9 9 2 /9 3 1 9 9 4 /9 5 1 9 9 6 /9 7 1 9 9 8 /9 9 2 0 0 0 /0 1 2 0 0 2 /0 3
F irs t w a v e o f n a tio n a l V A s in th e E U S e c o n d w a v e o f n a t io n a l V A s in th e E U a n d E U w id e V A s
Source: MURE Database on Energy Efficiency Measures in the EU (www.mure2.com)
3.6.2 Selection of case studies The evaluation of VA/NAs in this chapter is based on a literature review as well as on the WEC Survey. It has been complemented with country case studies that demonstrate differences in the implementation of VAs/NAs and provide a suitable basis for the conclusions drawn on their effectiveness. Although the country case studies have also been chosen to ensure a certain geographical coverage, it must be said that the spread of this instrument is rather heterogeneous: while it has found large support in Europe and certain other parts of the Western world, including Japan as well as some Asian countries, its use in Northern Africa and Latin America is not so widespread and it is nearly completely absent in EU Accession countries, and Russia and Southern Africa (Table 5).
Table 5: Regional distribution of VAs/NAs from WEC questionnaire
Region
Countries with
VAs/NAs
Countries responding to questionnaires
EU 15 + Switzerland and Norway 10 16 EU Accession Countries , Bulgaria, Romania and Russia 0 11 Other Western World (North-America, Japan, Australia) 4 4 Northern Africa , Middle East and Turkey 4 10 Southern Africa 0 7 Asia 7 9 South and Central America incl. Mexico 3 6
Total 28 62
Source: WEC Survey
The absence of VAs/NAs in Eastern European countries (mainly EU Accession Countries) can, in general, be explained by the fact that the command and control instruments were more familiar to the previously centrally planned economies than this newer type of instrument. In recent years some of the EU accession countries have initiated more concrete steps to implement VAs/NAs, still, however, fairly limited. In total less than half of the 63 countries

World Energy Council Energy Efficiency Policies and Indicators
61
participating in the survey have implemented the instrument so far. The case studies considered in this evaluation cover, as far as possible, the different regions of the world, in particular developing countries, and demonstrate a variety of characteristics of VAs/NAs: 1. Australia: Greenhouse Challenge: NA with a quite considerable public implementation
effort and accompanying measures. 2. Germany: Voluntary agreement of industry on the reduction of CO2 emissions and
specific energy consumption: weak NA with nearly all elements missing for a successful implementation.
3. Netherlands: Long-term Agreements: strong and demanding agreement with the Dutch industrial sector; large industries, good monitoring and target setting process, good evaluation of impacts, transition to future emission trading scheme.
4. Netherlands: Benchmarking Covenants: New type of agreements which implicitly are very demanding as they require companies to be "among the 10% world best" in terms of energy efficiency.
5. EU: Voluntary Labelling of Electric Motors (CEMEP/EU Agreement): NA targeting industrial cost-cutting technology, aiming at products rather than processes.
6. Finland: Conservation Agreements for Industry, Municipalities, Residential Sector: coverage of a larger number of sectors, in particular also the residential sector through building associations from the tertiary sector; strong link to accompanying measures such as energy audits.
7. Japan: Keidanren Voluntary Action Plan on the Environment: unilateral plan with a large sector coverage; target in CO2 emissions.
8. Brazil electric motors: example of an agreement in a developing country. 9. US / EU: GreenLight Programmes: publicly initiated programmes with private parties
invited to participate. 10. UK: OFGEM: Strong commitment already assimilated to a regulation. Obligation on
energy sector to carry out energy efficiency measures for their customers. 11. ACEA/JAMA/KAMA - EU agreements for CO2 reduction from new cars: one of the
comparatively few agreements covering the transport sector, with potentially large impact.
Case studies 1 to 7 are briefly presented in Table 6 according to a list of various criteria71 that were also used to describe them in detail in Annex 1: • Target group and sectors concerned: large energy consumers in industry, the tertiary
sector and professional organisations (associations and large building companies); equipment producers (e.g. cars, large electric household appliances, electric motors); and utilities (e.g. OFGEM in UK);
• Target setting: degree of quantification; absolute/relative targets; energy/CO2 targets; • Ex-ante evaluation before target setting: existence of an ex-ante Business As Usual
(BAU) determination of autonomous energy efficiency/CO2 improvement + structural change;
• Monitoring: who is involved in the monitoring process, monitoring at company level or statistical level/sector level; consideration of autonomous energy efficiency/CO2 improvement and structural change;
• Verification: independent verification of data and results; consideration of net effects; taking into account the possible overlap of different VAs as well as indirect effects;
• Sanctions: sanctions in case of non-compliance; • Legal obligations: Degree of legal binding (most VAs are not legally binding); • Third party participation: involvement of environmental groups in the negotiation
process (if so, targets are supposed to be more binding, more ambitious);
71 This list of criteria is derived mainly from the complete implementation chain of VAs (target group, target setting, implementation, monitoring and verification, evaluation), as described for example in CEC (1996).

World Energy Council Energy Efficiency Policies and Indicators
62
• Independent ex-post evaluation: Existence of an ex-post evaluation and evaluation criteria considered, in particular environmental effectiveness (ability of a voluntary approach to reduce environmental impacts); economic efficiency (costs as compared for example to regulation); equity (distributional effects of voluntary initiatives); openness/transparency (ability of external parties to observe the implementation process and results); effects on firm and regulator behaviour.
3.6.3 Impact of VAs/NAs The impact of VAs/NAs implemented so far in the field of energy efficiency improvement or CO2 reduction is certainly the most central one, when analysing this comparatively new policy instrument.
OECD72 maintains a rather sceptical view of the effectiveness of VAs/NAs and underlines that the regulator has apparently been significantly “captured”73, and points to other instruments, in particular economic instruments, as better options: • While the environmental targets of most – but not all – voluntary approaches seem to have
been met, there are only a few cases where such approaches have been found to significantly contribute to environmental improvements beyond what would have happened anyway;
• Whilst some of the approaches – in general incorporating credible “threats” if targets were not met – have contributed significantly to target achievement, other approaches have not been nearly so effective. This is most evident in a number of cases where a large part of agreed emission reductions took place between the base year used for the agreement and the time of signing of the given agreement. As companies generally will to some extent also have planned process changes, investment projects, etc. well in advance, even reductions that take place in the first 1-2 years (at least) after the signing of an agreement could often represent a “Business-as-Usual” scenario to the company;
• The broadening use of voluntary approaches seems to reflect the fact that policy-makers have tried to find an instrument through which one could avoid having to make trade-offs. It is, however, unlikely that difficult trade-offs can be avoided if more ambitious environmental targets are to be met in the future;
• The results of many voluntary approaches would be improved if there were a real threat of other instruments being used if targets are not met. However, if it is likely that the alternative policy would entail significant negative social impacts, the credibility of such threats may not be great.
72 OECD “Voluntary Approaches for Environmental Policy – Effectiveness, Efficiency and uses in Policy Mixes”, Paris, OECD, 2003 73 "Regulatory capture" means that the regulator (the State), which negotiates with industries for an agreement, is "captured" into the negotiations. While it is negotiating and during the lifetime of the agreement, it is bound and cannot opt for other instruments. Hence the importance to negotiate sufficiently ambitious targets as well as suitable sanctions for non-compliance.

Table 6: Special features of selected VA/NAs on energy efficiency and climate protection Country 1
Australia 2
Germany 3/4
Netherlands 5
EU 6
Finland 7
Japan 8
Brazil 9
EU/US 10 UK
11 EU
Type NA NA Strong NA NA NA unilateral VA (VA1)
NA VA3 NA NA
Sectors covered Industry Industry, Energy supply
Industry Industry (product)
Industry, Municipal., Residential
Industry, Energy supply,
Housing
Industry Tertiary, Industry
Buildings/ Appliances (via energy suppliers
Transport
Target Qualitative quantitative (specific)
quantitative quantitative (Market shares)
Qualitative quantitative (absolute)
unknown Qualitative quantitative quantitative (specific)
BAU ex-ante evaluation before target setting (no) no unknown no no unknown no no unknown no
Monitoring: - Company/sector level - consideration of autonomous progress / structural change74
Company
no
Sector
(no)
Company
yes
Sector
no
Company
no
Sector
(no)
-
no
-
no
Company
yes
Sector
yes
Independent verification of data and measures
On few participants no yes no no (no) no no no no
Sanctions no no yes “blame” no no no no yes "Threat" Degree of bindingness of agreement “moral” weak strong medium weak “moral” weak weak strong medium
Third party participation no no no no no no no no no no Independent ex-post evaluation considering criteria as: - Environmental effectiveness - Economic efficiency - Equity - Openness/transparency - Soft factors
yes
+ - - - +
(no)
+ - - - -
yes
+ - - - -
no no no (manufacturer
reporting)
no no yes
+ - - - -
no (manufacturer
reporting)
74 In some agreements a business-as-usual figure is established, however often by making use of a frozen efficiency approach. In this case a "no" placed in brackets was used.
63

World Energy Council Energy Efficiency Policies and Indicators
64
Administrative and transaction costs vary greatly between different voluntary approaches. If too few resources are spent on their preparation, negotiation and enforcement, their environmental impact is likely to be very modest.
Economy-wide economic instruments in many cases can be a better policy option than voluntary approaches, both from the point of view of environmental effectiveness and economic efficiency. A broader application of economic instruments is, however, frequently hampered by a fear of losing international competitiveness of the most affected sectors, which to the sectors in question in return for “voluntary” abatement commitments can be one way to overcome “the competitiveness obstacle”. However, the environmental and/or economic costs of applying this option could be high. Increased international co-operation to facilitate the use of economic instruments would seem to be a better option.
The target setting is the primary objective: everything afterwards is secondary if the target is set too low
With respect to the targets to be achieved in negotiated agreements or benchmarking covenants, it is interesting to look at some figures from the past, e.g. for energy intensity of the manufacturing industry (which is commonly taken as a measure for energy efficiency improvement, though it may be influenced considerably by structural changes within industry). Although the absolute CO2 reduction in German industry is impressive, more detailed studies show that a 20 % decrease in industrial energy intensity between 1990 and 2005 is mainly a reflection of the progress achieved by autonomous technical progress and structural shift towards lighter industries (see Figure 3.18). In other words, the impact of VAs was rather limited.
Figure 3.18: Structural changes and autonomous energy efficiency in the voluntary agreements for CO2 reduction in Germany
0
20
40
60
80
100
120
140
160
180
200
1970 1975 1980 1985 1990 1995 2000 2005 2010 2015 2020
Indu
stri
al E
nerg
y In
tens
ity In
dex
(199
0=10
0)
West Germany (Index)
Germany (Index)
Target Germany for 2005: -20%
Structural change and autonomous energyefficiency progress
0.5%/y
1.0%/y Trend West Germany
Source: Eichhammer and Jochem (1999)

World Energy Council Energy Efficiency Policies and Indicators
65
Thus, one of the main differences compared to the Dutch agreements is that the Dutch energy efficiency index monitoring progress is base on a bottom-up approach, excluding at least the structural changes, while they are still contained in the energy intensity measure used in the German context. Transaction Costs The amount of data necessary to control the outcome of the agreement and their related cost is another important issue. These costs would in general increase with the commitment of the regulator. Rietbergen et al.75 point to the trade-off between the efforts on all sides to monitor and verify the results and the possible weakness of the outcome if control is insufficient (see Figure 3.19). On the side of the public bodies involved, the first round of VAs/NAs in the Netherlands with the industry sector that ran from 1989-2000 incurred costs of €159 million. The agreement itself is not a costly process. However, subsidies devoted to raising awareness and the transfer of knowledge are extremely important for the establishment and the progress of the VAs/NAs. This is less the case with investment-subsidies. In particular, the subsidies for CHP (until 1995, the Dutch government spent around €24 million a year) make the total of energy savings policy rather expensive. The benchmarking covenant will run from 1999-2012 and yearly implementation costs are expected to be €2.3 million. An additional budget of €13.6 million is available for the training of staff in provinces and municipalities with respect to the application of the Benchmarking covenant in the environmental permits. On the other hand, the Danish experience shows that the administrative costs of entering into an agreement are between 10 and 20% of the tax subsidy, even in the case of Denmark where there are relatively high monitoring and compliance requirements. Figure 3.19: Trade-off between implementation effort and impact of VAs/NAs
Source: Kornelis Blok and Martijn Rietbergen (2001); complemented by FhG-ISI
75 M.G. Rietbergen et al: Do Agreements Enhance Energy Efficiency Improvement? Analysing the Actual Outcome of Long-Term Agreements on Industrial Energy Efficiency Improvement in the Netherlands, Faculty of Chemistry, Department of Science, Technology and Society, Utrecht University, 2001.
Problems with energy/CO2 tax
exemptions for industry (indirect subsidies)

World Energy Council Energy Efficiency Policies and Indicators
66
However, there is another issue to be considered: if the agreements are “too soft”, as is arguably the case of Germany, it may be difficult to get an exemption or reduction for either national or possibly European wide energy/CO2 taxes. A soft target might be considered to be an indirect subsidy by the European Commission.76 Double benefits of negotiated agreements? There is some debate on whether the current generation of agreements/programmes has served primarily as “process” tools that induce desirable changes in practices (e.g., increased management interest) and promote policy learning. Such process changes could lead to significant longer-term ancillary benefits attributable to government-industry co-operation. However, this long-term impact alone might not be sufficient to justify the preference for negotiated agreements rather than for regulatory or economic instruments. In order to serve as a credible alternative or complement to regulation, voluntary approaches must demonstrate direct energy savings and emission reductions, hence double benefits indeed. Imperfect voluntary agreements versus imperfect alternative instruments? Some argue that the criticism with respect to the environmental effectiveness of VAs/NAs ("dressing-up") is not justified, given the fact that one compares an imperfect voluntary agreement with a perfect regulation and a perfect regulator, which, in reality, is not the case. The following example illustrates this issue of imperfect regulation with thermal building regulation in Germany. Theoretically, new dwellings should consume 70% less energy than dwellings built before the first building regulations. In reality, the impact of the building regulation is twice as low, due to lifestyle changes (such as indoor temperature). One important conclusion to be drawn from this therefore is that, while in the past some attention has been paid to the performance of VAs/NAs, less attention has been given to the performance of other policy instruments, assuming implicitly that they are efficient. Nevertheless, there are quite substantial differences in the example given as compared to obviously unsuccessful NAs/VAs: while for thermal building regulation in Germany a larger part of the technical progress spurred by the regulation was compensated for by social developments and only a comparatively small part by non-compliance (hence imperfect regulation), in the case of "business-of-usual" VAs/NAs there is no progress at all. A different case would occur if the supposed improvement (in addition to autonomous changes!) of the specific energy consumption or CO2 emissions in consequence of VAs/NAs were compensated to a large degree by a strong growth in the output of the industries. 3.6.4 From Voluntary/Negotiated Agreements to emissions trading What are the perspectives for VAs/NAs in conjunction with the forthcoming CO2 emissions trading scheme in Europe? In other parts of the world, such trading schemes have not yet been implemented. Nevertheless, if the Kyoto Protocol is ratified, this could change rapidly. According to the EU-Directive on Greenhouse Gas Emissions Trading (EU 2003), large installations from the energy industry and most other carbon-intensive industries will be part of a EU-wide CO2 trading system (EU-ETS) starting in 2005. The EU-ETS is a mandatory cap-and-trade allowance trading system and requires companies to submit for cancellation a
76 In the German case, the VA actually serves as a justification for exemptions from national energy taxes. Without the VA the European Commission would perceive those exemptions as undue subsidies.

World Energy Council Energy Efficiency Policies and Indicators
67
number of allowances that correspond to their actual annual CO2-emissions. In several Member States, such as in The Netherlands, Germany, Finland, etc. these installations are already covered to a large degree by negotiated agreements77. In principle, voluntary/negotiated agreements may be integrated with emission trading systems in two ways: • First, the trading system can serve as a vehicle to meet their commitments in an industry-
wide negotiated agreement (a pool). While this may be a cost-efficient way to fulfil the commitments, it is rarely used in practice;
• Second, primary allocation of emission allowances could be based on emission targets agreed to under voluntary agreements.
3.6.5 Conclusions Conclusions on the past performance of Voluntary/Negotiated Agreements ••••
Independent post-evaluations or verification of VAs/NAs are rarely carried out. Results of existing evaluation studies conclude that the effectiveness of this instrument is in many cases uncertain. Even for the Dutch voluntary agreements, an independent evaluation concluded that they accounted for about 25-50% of the observed decrease in the industrial energy intensity. This, in itself a good result, was achieved by a combination of a large public and private effort. Most other agreements probably achieved considerably less impact;
••••
VAs appear efficient from an economic perspective, to the extent that they help overcome some barriers to energy efficiency and result in the realisation of the so-called “no regret potential”;
• VAs may be more suited as complementary to other existing regulations, rather than being the prime policy instrument to address energy efficiency and climate change. In the latter case, demands on the design of a VA have to be much higher for a VA to be effective (and possibly even efficient);
• Targets are seldom derived from ex-ante considerations on the business-as-usual development, trying to evaluate the impacts of structural change and autonomous progress in order to determine "additional effort";
• Verification of data and measures by an independent body is relatively seldom carried out. Sometimes, as for example in the case of the Nippon Keidanren Voluntary Plan for the Environment, the body in charge of the verification is at least partially composed of industry representatives;
• Monitoring is often carried out, but in many cases only at the sectoral level. The results observed therefore include the influence of structural changes and autonomous efficiency progress, generally without correction for such effects;
• Independent ex-post evaluations are rarely carried out, and generally, they are limited to considerations of environmental effectiveness. Economic efficiency of VAs/NAs is implicitly assumed. Published evaluations on the sectoral level often use a frozen-efficiency approach as the counterfactual, which – by definition – does not account for
77 For The Netherlands see, for example Sijm, J. and A. van Dril (2003): The interaction between the EU Emissions Trading Scheme and National Energy Policy Instruments in The Netherlands, working paper, ECN-C-03-060, November 2003. For the interaction of the EU-ETS with existing trading systems in France and the UK, which in turn are based on negotiated agreements, see Boemare, Quirion and Sorrell (2004): The evolution of emissions trading in the EU: Tensions between national trading schemes and the proposed EU directive) Climate Policy (forthcoming).
World Energy Council Energy Efficiency Policies and Indicators
68
structural changes and autonomous efficiency progress. Such studies usually find large amounts of energy/CO2 savings;
• Transparency/Openness: Participation of independent third parties such as NGOs is never included. The information disseminated to the public via reports and the internet seldom allows the efforts of the participants to be followed in detail;
• Soft factors such as increased awareness of energy efficiency issues in the companies are quite rarely considered in the evaluations;
• More "scientific" harmonised evaluation of voluntary approaches, especially with respect to baseline considerations, such as the evaluation of the Dutch agreement, is necessary. In-depth investigations should be made on whether the conclusions derived from general studies on VAs/NAs in the field of environment can be transposed to agreements on greenhouse gas emissions or energy consumption;
• OECD countries mainly use VA’s, while other countries in general have so far quite rarely made use of this tool for various reasons. Given the above-mentioned limitations to the instruments it appears difficult, at the current stage, to recommend a massive use of VAs/NAs in those regions.
Conclusions in the context of the EU emissions trading scheme • The EU-ETS system increases overall cost efficiency compared to existing VAs since cost
savings may be used across sectors and – depending on the actual design of the VA – also across companies;
• Bargaining costs under a trading system should be lower than under a VA (if each company bargains individually with the government, or if the VA of a sector is the result of an internal bargaining process within the sector);
• Apart from existing different system boundaries, incentive and moral hazard problems are major barriers to base future primary allocation on negotiated agreements;
• The current examples of National Allocation Plans published indicate that countries that have VAs/NAs running try to configure their Allocation Plans in such a way that provisions from the agreements are taken up to a large degree in the Plan. Clearly, such a procedure also reduces the costs to overcome political obstacles towards a new instrument. Some provisions (e.g. concerning indirect emissions might lead to a modification of the agreements). It can be expected that the current round of agreements will go on until their end (some up to 2012), but it is unlikely that by then another generation of agreements will arise if the trading scheme has been taken up at full speed.
3.7 Regulations 3.7.1 Efficiency Standards for New Dwellings and Buildings All European countries and most other OECD countries have set up energy efficiency standards for new dwellings and service sector buildings. Some non-OECD countries outside Europe have recently established mandatory or voluntary standards for service buildings: Singapore and the Philippines were among the first, followed by Algeria, Malaysia, Egypt or Syria for instance. In most countries, standards exist for both dwellings and service sector buildings, except in Africa and in Asia where most often standards only apply to non-

World Energy Council Energy Efficiency Policies and Indicators
69
residential buildings78. The situation in these two regions is explained by the fact that commercial buildings account for the largest share of energy consumption. Altogether, about 60% of the countries surveyed (Figure 3.20) had mandatory or voluntary standards for new non-residential buildings.
Figure 3.20: Countries with building regulations Pays ayant des règlements de bâtiment
Source: WEC Survey From component-based to overall performance-based thermal building codes Thermal building codes have been changing over time from simple standards on building components to more complex standards, including for the most advanced countries energy performance standard. Building standards can be basically classified in four categories79: • Envelope component approach, that specifies a mandatory maximum heat transfer (heat
losses) through individual components of the building shell, such as external walls, roof, windows, etc. ( k or U values in terms of W/m2K);
• Overall envelope approach, that sets a limit on the overall heat transfer through the building envelope, but leaves flexibility as to how to obtain it (mean k or U-value of the building shell);
• Limitation of heating/cooling demand, that in addition takes into account the contribution from ventilation losses, passive solar gains and internal heat sources (maximum demand per m3 or m2);
• Energy performance standard, that considers the whole building as a system and integrates also building equipment such as heating and air conditioning systems, ventilation, water heaters, and even in some countries pumps and elevators (maximum
78 There are of course some exceptions, such as China, Egypt and Algeria, which have also have implemented standards for dwellings. 79This classification follows that proposed by W Eichhammer in the previous report in 2001 (see WEC web site)
0%
20%
40%
60%
80%
100%
Europe Asia NorthAmerica
LatinAmerica
Africa MiddleEast
Dwellings Buildings (services)

World Energy Council Energy Efficiency Policies and Indicators
70
energy consumption per m3 or m2/year; present standards in California, Germany and France, and the EU building Directive are examples of such performance standards.
Most building codes now belong to the two last categories and are performance based. These types of standards can be implemented jointly with standards on specific equipment or materials (insulation, windows, boilers), in order to ensure the dissemination of the most efficient equipment in the retrofitting of existing buildings (e.g. France). Towards a regular reinforcement of building codes Revisions in thermal building codes have become increasingly regular. For instance, over the past 30 years, standards have been reinforced three to four times in most EU15 countries, including some very recent revisions, and independent from the oil price level. The effort is not yet finished, as seven EU countries have reinforced their standards since the year 2000. In addition, the new EU building directive has for the first time provided for a revision every five years. Significant savings targeted through revisions of standards The cumulative energy saving achieved for new dwellings, compared to dwellings built before the first oil shock, is about 60% on average in the EU80. The additional savings that are targeted with future revisions in the standards are still impressive, at 20-30%. Actual savings are however below the theoretical savings. Relatively few countries have carried out evaluations of their building codes, in particular by comparing the actual energy performance of new buildings with their theoretical performance as resulting from the standards. A recent survey81 reports that, in Germany, according to the thermal standards, new dwellings should consume 70% less energy than the dwellings built before the first building regulations. In reality, the actual savings are only half of it (35%). Such a situation results from the combined effect of behavioural factors (such as higher heating temperatures, more rooms heated, or longer heating period over the year), and of a non-compliance with the building regulation. Similar results have been observed in France and Belgium82. Buildings certificates for existing building: a complementary measure The introduction of sophisticated calculation procedures and the move towards performance-based standards has made it easier to introduce building certificates, for example, in the form of “number certificates” (Germany) or a star system (Australia). Building certificates enable the buyer to access information on the energy consumption of the dwelling he is going to buy or to rent. These certificates have some similarities with the labelling of electrical appliances, but are more complex.
Stricter standards do not increase significantly the cost of construction Only a few countries have estimated the additional costs that each round of new building codes has caused. Nevertheless, from the few results available, it can be estimated that the additional costs were limited to a few percentage points, if any at all, as quite a few countries have taken the precaution of limiting the standards to the economic potential of energy efficiency in buildings. 80 Source Odyssee project www.odyssee-indicators.org 81 The full case study is available on the WEC web site 82 Ministry of Economic Affairs, Gestion de la demande d’énergie, 2003 (report in English prepared by FhG-ISI, pages 65-79).

World Energy Council Energy Efficiency Policies and Indicators
71
3.7.2 Other regulations Some selected regulations are covered in this section: mandatory energy consumption reporting, mandatory energy managers, mandatory energy saving plans and, finally, mandatory maintenance. Some very new measures that impose on utilities a volume (“quota”) of energy savings (also called “white certificates” or “energy commitment” in the UK) are not covered, although their scope is promising for the future. Some other regulation, not directly linked to energy efficiency, and that can also have a significant impact on the energy use (e.g. speed limit), are not included in this review. Energy consumption reporting Some countries have set up regulations requiring designated or large consumers to report their energy consumption, either directly to the government or in their annual report. This measure is seen as an incentive to companies to monitor closely their energy performance. Such measures exist in about 25% of the surveyed countries and are more frequent in Europe than in the other regions. More recently these measures have also been extend to CO2 emissions. In the case of India, for example, companies in selected energy intensive sectors in their annual reports to company shareholders provide data on their overall consumption and on the specific energy consumption of manufactured products (e.g. cement, pulp, sugar). They also have to provide information on energy saving actions undertaken over the previous year. In Switzerland this measure applies to the building of large public enterprises. In the UK, this measure is part of the climate change policy: energy intensive industry in Climate change agreements and participants in the UK emissions trading scheme (industry and services) must report their emissions. Mandatory energy managers In some countries, there is a regulation requiring the nomination of an energy manager in companies above a certain size. This concerns about a quarter of the countries covered by the survey. This measure usually applies to large consumers in industry. In some countries, transport companies are also included (e.g. Italy, Portugal, Taiwan and Israel). In Denmark, energy mangers are mandatory in the public sector.
Figure 3.21 Countries with various types of regulations
Source: WEC Survey
0%
10%
20%
30%
40%
50%
re porting manage rs sav ing p lan mainte nanceEurope O ther regions

World Energy Council Energy Efficiency Policies and Indicators
72
Mandatory energy saving or DSM plans Around a third of the surveyed countries have set up regulations on the preparation of energy savings plans or Demand Side Management plans (DSM). This measure is for instance included in the new Energy Efficiency Strategy for Spain (E4) of 2003. It also exists for several sectors, including in some countries utilities and municipalities (e.g. Portugal, Italy, the Czech Republic, Indonesia, Taiwan, Thailand and Iran83). Maintenance Maintenance of energy-consuming equipment is another important field of regulation. The concern is that without a proper maintenance of energy consumers’ equipment (e.g. boilers, vehicles), their efficiency will decrease over time: the objective of the regulation is to maintain as long as possible the initial efficiency of the equipment. However, this concerns only a few countries, mainly in Europe. For example, Denmark, Italy and Germany have regulations on the maintenance of heating boilers. In a few countries (Austria, Italy and the Netherlands) there are regulations controlling the specific consumption of cars. 3.8 Economic and Fiscal Incentives Financial incentives can be aimed at encouraging investment in energy efficient equipment and processes by reducing the investment cost, either directly (economic incentives) or indirectly (fiscal incentives). 3.8.1 Economic Incentives Economic incentives fall into two broad categories: investment subsidies and soft loans. In about one fourth of the surveyed countries, the economic incentives are related to energy or environment funds with financing mechanisms that tend to depend increasingly upon the banking system rather than coming from the public budget (see section 3.5 on innovative funds). Investment subsidies Economic incentives to consumers were among the first measures to be implemented in the 1970s and early 1980s. Most countries developed various ambitious schemes, mainly to retrofit existing buildings or dwellings, as well as industrial equipment. The objective was to reduce the investment cost for consumers. In principle, these incentives apply to actions that are cost effective from the collective point of view, but which would not otherwise be undertaken by consumers. The most widespread incentive used is a grant or direct subsidy. Grants can be defined as a fixed amount, as a percentage of the investment (with a ceiling), or as a sum proportional to the amount of energy saved. Economic incentives may also be given to equipment producers to encourage the development and marketing of energy efficient equipment. Ex-post evaluation of grant schemes showed several drawbacks: • The schemes often attracted consumers who would have carried out the investments even
without the incentive, the so-called “free riders” (e.g. high income households or energy intensive industries);
83 See Annex 2

World Energy Council Energy Efficiency Policies and Indicators
73
• Many consumers who could use the subsidy and were targets of the scheme (small to medium industries, and low income households) did not take advantage of it because they were unaware of its existence. This demonstrates the challenges of informing a multitude of consumers adequately about the existence of the incentives;
• Procedures for grants applications were often found to be too bureaucratic, with complex forms to be completed and long delays in obtaining the agreement; this turned away many potential customers;
• The grants were expensive in terms of operating costs (large staff necessary to process the forms).
Figure 3.22: Countries with economic incentives
Source: WEC Survey These drawbacks did not prevent the use of subsidies, but led to their more careful utilisation, taking into account their real effectiveness. Grants are now better targeted to limit the number of beneficiaries (e.g. low income households84, tenants). They are also restricted to certain types of investments (from a selected list of equipment), with a long payback time but high efficiency gains (e.g. renewables, co-generation), or to innovative technologies (demonstrative or exemplary investments). The approach used in Thailand is innovative, as the selection is not based on a list of equipment but on a criterion of cost-effectiveness (grants apply to investments that have an internal rate of return above 9%). Subsidies are increasingly viewed as a temporary measure to mobilise consumers, to prepare for new regulations, or to promote energy efficient technologies by creating a larger market than would otherwise exist, with the objective of a cost reduction for the subsidised energy efficient technologies. In the surveyed countries, investment subsidies were mostly used in Europe: 80% of countries with a subsidy scheme against around 20% for the other regions. Industry was the main sector receiving subsidies (about one third of all countries, 50% of which are European countries), closely followed by services (about 40% of all countries, of which 50% are European countries). Soft loans Soft loans are loans offered at subsidised interest rates (i.e. lower than the market rate) to consumers who invest in energy efficient technologies and equipment. Soft loans have the
84 UK has had for several years a very strong programme targeted towards low income households.
0%
10%
20%
30%
40%
50%
60%
70%
Subsidies Soft loans Funds ESCO's
Europe Other regions

World Energy Council Energy Efficiency Policies and Indicators
74
advantage of being easily implemented by banking institutions. They are often used by innovative funds (see 3.5). Nevertheless, due to the current low level of interest rates, such measures are often not attractive to industrial companies. Soft loans are less popular than subsidies as shown by the survey (Figure 3.22). Slightly less than 40% of all surveyed countries had such schemes (about half of them European countries). In Europe, soft loans are almost equally used for all sectors, whereas in the other regions, industry is the main sector targeted. 3.8.2 Fiscal Incentives Fiscal incentives include measures to reduce the tax paid by consumers who invest in energy efficiency. They comprise accelerated depreciation (industry, commercial sector), tax credits and tax deductions (households). More recently, tax reductions on energy efficient equipment (on VAT or on import duties) or on energy efficiency investments (reduction in VAT rate) have been introduced in many countries. Fiscal measures usually require specific provision in the legislation. Tax credits, tax reductions and accelerated depreciation are considered better than subsidies, as they are less costly. They can work well if the tax collection rate is sufficiently high. They usually have a poor performance in an economy in recession or in transition. They are more adapted to well developed countries: mainly OECD countries have such fiscal measures. Reductions on import tax or VAT on efficient equipment have been introduced in many countries and almost equally in all regions: they exist in about 30% of the surveyed countries85. The compact fluorescent lamp is the most common equipment to which this measure applies outside the OECD (e.g. Ghana, Morocco, Israel). In European countries, VAT concessions also exist on labour costs to reduce the investment cost in building renovation (e.g. France, Sweden, Switzerland). Tax concessions for companies that make concrete commitments to energy efficiency gains/ CO2 reduction and meet their target are also another innovative way to promote investment in energy efficiency and CO2 reduction (e.g. Denmark).
Figure 3.23: Countries with fiscal incentives
Source: WEC Survey 85 Further detail can be found in Annex 2
0 %
1 0 %
2 0 %
3 0 %
4 0 %
5 0 %
T a x c re d it Ac c e le ra ted e p re c ia tio n
T a x re d u ct io n
E u r o p e O th e r r e g io n s All c o u n t r ie s

World Energy Council Energy Efficiency Policies and Indicators
75
3.8.3 Energy service companies The most dynamic factor in the creation of a market for energy efficiency services is the emergence of ESCO activities, i.e. companies that provide technical expertise and financing for energy efficiency investments, with a guarantee of reductions in energy costs. This type of financing is an example of third party financing: the ESCO makes the investment and receives in return a portion of the savings (around 50%) as its compensation. A well managed ESCO industry can operate in the private sector with limited government support, producing significant energy savings.86 About 60% of the surveyed countries reported having ESCO activities, with an average turnover around 0.4 M US$/year for most countries (Figure 3.23). Economic and fiscal incentives can create the environment necessary to ensure profitable business schemes for ESCOs. To be effective, ESCOs need to operate in a market economy with no subsidy for energy and with a sound legal framework. ESCOs invest primarily in CHP, in industry, in fuel substitution, and in small hydro. As savings are shared, ESCOs tend to mainly invest in only the most cost-effective measures. If they were to operate independently, rather than together, the overall energy saving achieved might be greater. ESCOs might also be reluctant to propose investments in advanced but risky technologies. At the same time, if the ESCO industry did not exist, many firms would not even consider energy efficiency investments. The allocation of benefits and/or risks between the ESCO and the beneficiary company is an important issue. 3.9 Information This review of policy measures on information is based on the WEC survey results, a case study on audits carried out from 2001 report, as well as on a specific case study prepared for this report (see Annex 1). 3.9.1 Energy audits An energy audit is a detailed survey by an expert of the energy use in an industrial firm, in a transport company, or in a building. The objective is to provide technical and financial information to consumers about what actions can be taken to reduce their energy bills and at what costs. The auditor will develop a suggested list of improvements that can be made. These actions cover reduction of consumption, shifts to other fuels, and selection of tariff (e.g. load management). Audits schemes are mainly developed in industry and in non-residential buildings: about 60% of surveyed countries reported audit activities in these two sectors. Audits in industry are however more frequent outside Europe (two-thirds of the countries against half for Europe). Audits for dwellings exist mainly in Europe, in about half of the countries (less than 20% outside Europe) (Figure 3.24). Energy audits are usually totally or partially funded by public agencies or by utilities. In Europe, audits are partly subsidised in buildings (residential and non-residential) and in industry in three quarters of the countries87 (50% subsidy on average). In the other regions, to encourage participation, audits are more often provided free of charge (in half of the countries for buildings and 60% for industry)88.
86 Examples of financing through ESCOs are given in section 3.5 on innovative energy efficiency funds. 87 which means that they are free in one fourth of the countries. 88 See Annex 2 for the detailed characteristics of the audit schemes by country (including the number of audits and the savings obtained)
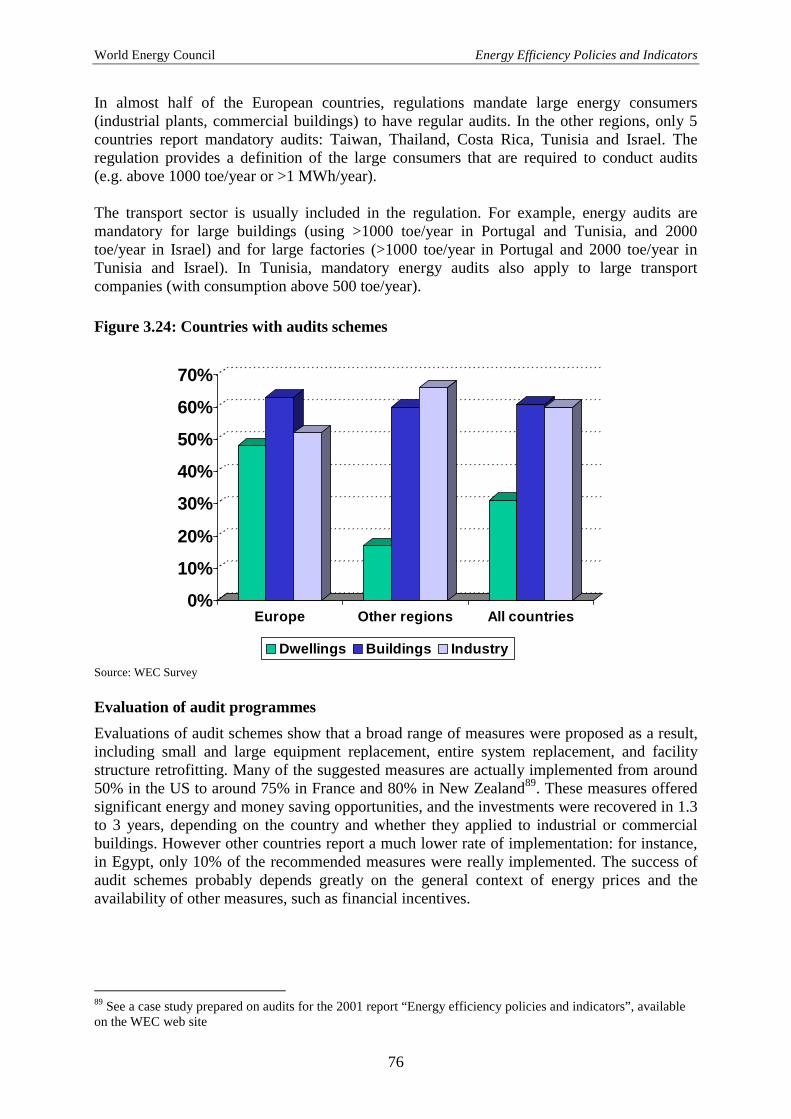
World Energy Council Energy Efficiency Policies and Indicators
76
In almost half of the European countries, regulations mandate large energy consumers (industrial plants, commercial buildings) to have regular audits. In the other regions, only 5 countries report mandatory audits: Taiwan, Thailand, Costa Rica, Tunisia and Israel. The regulation provides a definition of the large consumers that are required to conduct audits (e.g. above 1000 toe/year or >1 MWh/year). The transport sector is usually included in the regulation. For example, energy audits are mandatory for large buildings (using >1000 toe/year in Portugal and Tunisia, and 2000 toe/year in Israel) and for large factories (>1000 toe/year in Portugal and 2000 toe/year in Tunisia and Israel). In Tunisia, mandatory energy audits also apply to large transport companies (with consumption above 500 toe/year).
Figure 3.24: Countries with audits schemes
Source: WEC Survey Evaluation of audit programmes Evaluations of audit schemes show that a broad range of measures were proposed as a result, including small and large equipment replacement, entire system replacement, and facility structure retrofitting. Many of the suggested measures are actually implemented from around 50% in the US to around 75% in France and 80% in New Zealand89. These measures offered significant energy and money saving opportunities, and the investments were recovered in 1.3 to 3 years, depending on the country and whether they applied to industrial or commercial buildings. However other countries report a much lower rate of implementation: for instance, in Egypt, only 10% of the recommended measures were really implemented. The success of audit schemes probably depends greatly on the general context of energy prices and the availability of other measures, such as financial incentives.
89 See a case study prepared on audits for the 2001 report “Energy efficiency policies and indicators”, available on the WEC web site
0%
10%
20%
30%
40%
50%
60%
70%
Europe Other regions All countries
Dwellings Buildings Industry

World Energy Council Energy Efficiency Policies and Indicators
77
3.9.2 Local energy information centres One of the main barriers to energy efficiency is the lack of consumer information. To address this issue, a wide range of information activities has been designed, including media campaigns, technical publications, training, education, and energy efficiency awards. However, these activities often fail to create enough consumer awareness and concern to remain effective beyond the time of the campaigns. A relatively new approach is local energy information centres set up close to consumers. These centres offer impartial information on energy conservation and, usually, renewable energy services to the general public and specific target groups (e.g. housing associations, citizen groups, local institutions, small business, farmers, politicians, schools, etc), including advice on useful contacts (project developers, equipment manufacturers, relevant authorities, funding agencies, etc.). The survey demonstrates that 14 countries in Europe (of which 9 are from EU15) have established such local information centres, 4 in Asia (Australia, China, the Philippines and Vietnam), 3 in Africa (Kenya, Mali and Morocco) and 1 in the Middle East (Iran). Europe, the most active region in that field, has 750 centres with about 1600 advisers90. (Figure 3.25)
Figure 3.25: Number of local information centres and advisers per capita 91
0
10
20
30
40
50
60
Centers/M. Advisers/M
Sweden Slovenia Denmark Czech rep Austria MoroccoHungary France Belgium Finland UK AustraliaRomania Vietnam Kenya Mali Iran
Source: WEC Survey The average staff per centre is around two persons. Staff should to be competent and well trained both in energy technology, and marketing and communications, which, in some cases, is ensured by the network or parent organisation.
An EEIC usually has a public status or, if it is private, is a non-profit association. It is independent from energy utilities, project developers, manufacturers, funds, but does
90 See Annex 2 for more detail about the number of centres by country, their staff, and budget 91 Number of centres and adviser per million inhabitant (M)
World Energy Council Energy Efficiency Policies and Indicators
78
cooperate with them. It is often part of a regional or national network with common objectives that is used for exchange of knowledge and experience.
The number of centres or advisers and the budget of the centres depend on the size of the country. Figure 3.25 relates the number of centres and advisers to the population of each country. Seven countries have put a relatively high focus on local energy centres: Hungary, Sweden, Slovenia, the Czech republic, Morocco, France and Austria. Morocco is the only country outside Europe to rely in a significant way on local centres to promote energy efficiency: 100 centres have been set up in villages (rural “energy house”) and 500 more centres are under creation both in cities and in villages.
Basic funding for providing free information to the general public may come from various institutions at national, regional, local or multilateral level (e.g. European Union)92.
Box 5: Evaluation of local energy information centres: the case of France
In France, 155 local info centres were created by ADEME from 2001 to 2003, with 275 advisers (180 centres with 300 advisers planned for the end of 2004). A recent evaluation shows the following impact: - 80 000 contacts, of which 84% from households; - 90% rate of satisfaction; - 25% of recommended investments were actually implemented (including large investments); - the average investment by adviser was 730 000 €. 3.10 Packaging Energy Efficiency Policy Measures 3.10.1 Introduction The acceptance of energy efficiency policy measures differs widely according to the type of measure and the targeted consumers, involving transaction costs that can be very high. Policy makers can then be tempted either to avoid “difficult” measures, although they might be very effective, if policy makers consider the transaction costs to be too high, or to enter slowly into a long and costly process for their practical application. The idea then is to try to lower the transaction costs of the measures by packaging alternative measures dealing with the same energy efficiency target, and offering the consumers a choice of alternative measures according to their preference. The effectiveness of energy efficiency policy measures is very often dependent on the other measures taken simultaneously: for example, people would react more positively to measures aimed at reducing the use of private cars if at the same time they benefited from good public transport facilities. The second main idea in packaging policy measures is to co-ordinate precisely measures to “push” consumers away from energy intensive practices and to “pull” them towards energy efficient ones. Another common problem that policy makers have to face is the so-called “rebound effect” of energy efficiency measures: for example, improved thermal standards for buildings do decrease the amount of energy consumed for a given temperature inside the new houses, and therefore the energy bill in these houses, which in turn results in new opportunities for increasing internal temperature. In order to avoid such rebound effects, it is necessary to
92 A typical budget for a European country is 0.1M US$ per adviser.

World Energy Council Energy Efficiency Policies and Indicators
79
package complementary measures addressing simultaneously both the technological and economic contexts. Once quantitative targets have been set for the energy efficiency policy (for instance reduction in GHG emissions in the Kyoto Protocol), the challenge is to minimise the implementation costs needed to reach these targets. The idea in packaging conditional measures is to implement first the less costly measures, and afterwards to decide on reinforcement and to apply more costly measures only to the extent that the first ones failed in reaching the target - e.g. voluntary agreement first, regulation or taxation second if the voluntary agreement does not work. A more detailed review of these various types of packages of policy measures, with examples taken from the survey carried out in the study, is presented below: 3.10.2 Packaging alternative measures to lowering the transaction costs Objectives and rationale Transaction costs of policy measures increase with the unwillingness of targeted users to accept and apply the measures. Measures not socially accepted can still be implemented but not really applied; in some cases, they can provoke public outcry, demonstrations and even strikes. The reason is often not because people are “bad” citizens, but just because they are not well enough informed, or because they disagree. In particular, consumers prove to be rather reluctant to any form of mandatory constraints if they do not fully understand and support the ultimate objectives of these constraints. To avoid such reactions, it is therefore necessary to fulfil two pre-conditions before implementing such measures: ••••
first, to reach some kind of consensus on the global objectives of the energy efficiency policy;
••••
second, to enhance the social and economic acceptability of policy measures. The first condition is a matter of democratic debate around the objectives of the energy efficiency policy. The second one is more a question of good presentation of the measures and a question of flexibility in their implementation: instead of imposing one particular measure, to propose a basket of alternative measures. The consumer is therefore both involved in the decision concerning the measure which he accepts, and thus takes on the responsibility for the actual implementation of the measure. An example Denmark demonstrates the interest and effectiveness of the concept of a “package of alternative measures” with its “Green Tax Package” in industry. The main components of the package are:
First, a set of fiscal measures are implemented as the basic rule for everybody: these encompass93: • An energy tax; • A CO2 tax; • A SO2 tax.
93 See Denmark questionnaire for more details on these measures at www.worldenergy.org

World Energy Council Energy Efficiency Policies and Indicators
80
Second, anlternative package of measures is proposed to industrial consumers, combining audits and voluntary agreements. The “deal” then proposed to industrial consumers is that they would benefit from significant reductions in tax levels if: • they submit to the Danish Energy Authority (DEA) an implementation plan including an
audit, an action plan for energy efficiency and precise energy efficiency target; • the implementation plan is accepted by the DEA.
In case the targets are not fulfilled, the consumer will have to reimburse the tax difference. The results of this package are rather promising: in 2001, more than 300 enterprises, with more than 60% of industry energy consumption have signed agreements. 3.10.3 Packaging “push-pull” measures to increase the effectiveness of the policy Objectives and rationale To be really effective, a policy measure requires that the consumers are well informed on the meaning and modalities of the measure, that solutions fostered by the measure are actually available, and that all the professionals involved in the implementation of the measure have the appropriate skills. Moreover, consumers have to be supported consistently at all steps, from information to decision. In other words, the effectiveness of a measure depends on the context of implementation, which is shaped by other measures taken simultaneously. Some measures may have very disappointing results despite high implementation costs, just because other measures are missing or contradictory.
Packages of “push-pull” measures aim precisely to create such conditions, playing simultaneously and consistently on two levers: • Enhancing consumer awareness about procedures and intentions to improve energy-
efficiency, and raising constraints to avoid energy intensive devices and practices (push) • Creating appropriate supply and knowledge for energy efficiency devices and solutions to
be attractive (pull). Examples in various fields One example of a package of “push-pull” measures taken from the survey carried out in the study is the combination of audits + financial incentives in industry: audits raise awareness, financial incentives help to undertake audits and to overcome the long pay back time of investments. A good experience reviewed in the study is that of Belgium (grants)94.
Another example is in the field of urban transport: restrictions on the use of cars in the city and support for public transport. The restrictions make the use of cars more expensive and time consuming, while increasing the speed and frequency of public transport, and providing better information on their availability makes this option more attractive. Paris, London, Stockholm, Singapore are leading cities in this field.
A third example, the most widely experienced in Europe, concerns electrical appliances: labelling informs the consumers and gives incentives to manufacturers, while implementing minimum efficiency standards discourages very cheap, inefficient appliances.
94 see questionnaire of Belgium for more details

World Energy Council Energy Efficiency Policies and Indicators
81
Push/pull measures for more efficient electrical appliances: a key concept in the EU and the US As shown in section 3.4, implementing regulatory standards for minimum performance of electrical appliances is considered in Europe as a necessary “push” to force manufacturers to improve the performance up to a certain threshold, but it is not an incentive for them to improve the performance of their appliances beyond this threshold.
On the contrary, labels appear to be incentives for manufacturers to improve their performance further since consumers are “pulled” by these labels. The main programmes at date are: • EU: Energy Star, Energy +; • US: Energy Guide. Finland demonstrates the concept of “package of push/pull measures” for energy efficiency in professional buildings In order to improve the energy efficiency in professional buildings, Finland has adopted a package of “push-pull” measures based on the following coordinated components: ••••
A subsidy scheme for energy audits: - since 1994 with subsidies up to 40% to private companies and 50% to
municipalities; - objective: 80 % of all service sector buildings by 2010;
••••
Subsidies for investments: - 10% of investment (1997-2001), 15 -25 % (2002);
••••
Voluntary agreements objectives: - Heat : –10% (2005) and –15% (2010); - Electricity: stop the growth and turn the trend downwards by 2005, both in
heat and in specific energy consumptions. 3.10.4 Complementary measures against rebound effects Objectives and rationale Cross-country comparisons and historical analysis show that budget coefficients of consumers (the share of energy expenses in their income) remain rather stable over time, with limited fluctuations when energy prices change. This demonstrates that part of the financial savings due to better technology is used first by consumers to increase their comfort or their mobility, and to pay less attention to energy matters, if energy prices allow them to do so.
This is what is called the “rebound effect”. The objective of the package of complementary measures is to avoid these rebound effects, in order: ••••
To get the maximum impact from technical regulation and legislation on energy consumption;
••••
To pass the economic benefit of improved technology from individual consumers to the whole society.
The rationale behind this type of package of measures is to link regulatory and technology measures to changes in economic conditions, so that the expenses of the final consumers

World Energy Council Energy Efficiency Policies and Indicators
82
remain more or less constant. Creating changes in economic conditions includes increases in taxes, implementation of tolls (road for example), tradable permits, white certificates, etc.
Examples in various fields In industry, the package combining voluntary agreements and tradable emission permits is being implemented in most European countries. Voluntary agreements signed by industrial companies are supposed to lead to reductions in specific energy consumption and specific CO2 emissions per production unit. Tradable emission permits would result in extra cost for the industrial company if its voluntary agreement targets are not fulfilled. Another example in the transport sector is the combination of the European Car Manufacturers Agreement (ACEA) with CO2 tax and feebates. The ACEA agreement targets an average reduction of 35% of the specific CO2 emission per km of new European cars to be sold from 2008 (140 g CO2/km). Implementing feebates aims to prevent people taking advantage of the reduction in motor fuel expenses, due to more efficient vehicles, to purchase bigger cars; CO2 tax aims to avoid an increase in unnecessary use of cars which might also result from the higher efficiency and lower running costs of cars. Among the countries reviewed in the study, Denmark appears to be one of the most advanced in this field95. Another example of such packages of measures refers to space heating: a combination of insulation standards and energy tax. Insulation standards result in the construction of new buildings that consume less energy per m² for the same indoor temperature; energy tax is intended to prevent people from taking advantage of the reduction in heating/cooling expenses to upgrade their heating/cooling requirements, and to make daily heating/cooling management more financially attractive. Investigating the rebound effect to the ACEA agreement to identify complementary measures: the case of France In the framework of the preparation of the third National Communication on climate change in France96, the question of the rebound effect to the ACEA agreement has been investigated, in order to highlight which complementary measures should be considered. Research has shown that, without any complementary measures, the rebound effect to the ACEA agreement would be 1.5 MtC/year in 2010 (5% of car motor fuel consumption in 2010), and therefore the actual reduction of CO2 emissions would be limited to 2.3 MtC/year instead of the 3.8 MtC/year initially expected. An increase of the excise tax on diesel (0.75€/litre in 7 years) would limit the rebound effect to 1.1 MtC; the same increase of the excise tax on diesel plus the implementation of a 80€/t C carbon tax would limit the rebound effect to 0.7 MtC and contribute therefore to a 3.1 MtC/year reduction of CO2 emissions in 2010.
95 see questionnaire of Denmark 96 MIES, Third National Communication under the UNFCC, Paris, 2001,200p
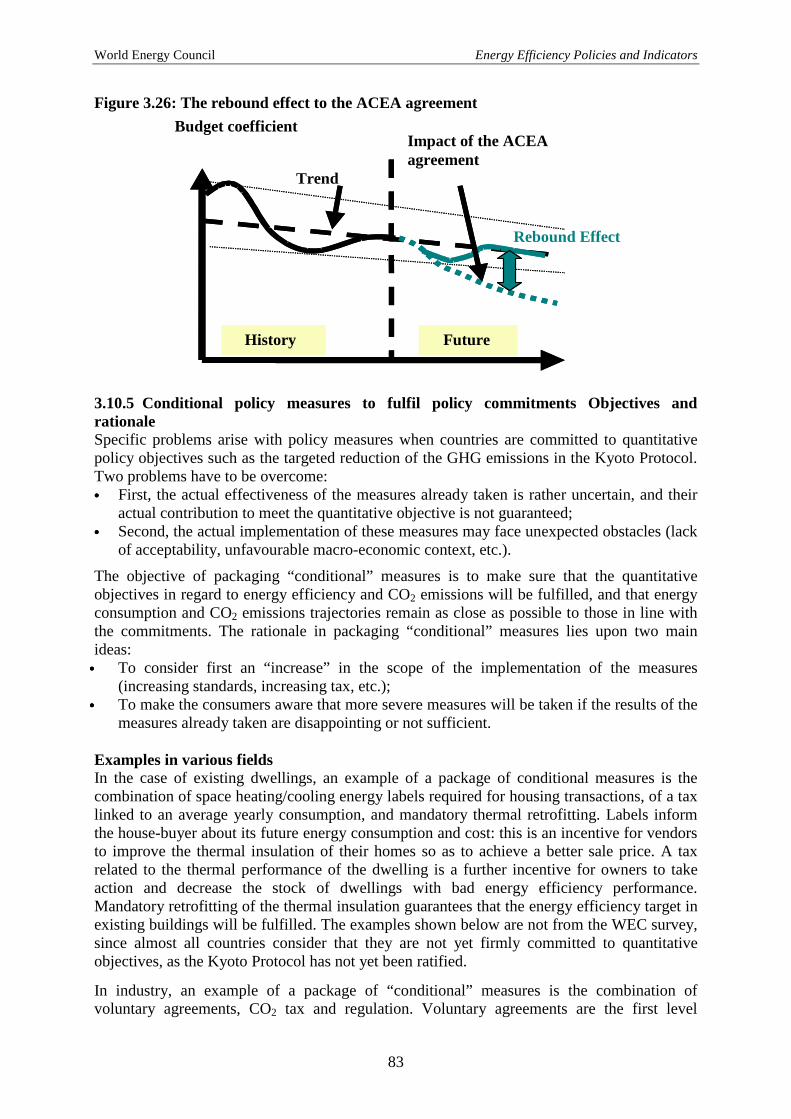
World Energy Council Energy Efficiency Policies and Indicators
83
Figure 3.26: The rebound effect to the ACEA agreement
History Future
Budget coefficient Impact of the ACEA agreement
Rebound Effect
Trend
History Future
3.10.5 Conditional policy measures to fulfil policy commitments Objectives and rationale Specific problems arise with policy measures when countries are committed to quantitative policy objectives such as the targeted reduction of the GHG emissions in the Kyoto Protocol. Two problems have to be overcome: ••••
First, the actual effectiveness of the measures already taken is rather uncertain, and their actual contribution to meet the quantitative objective is not guaranteed;
••••
Second, the actual implementation of these measures may face unexpected obstacles (lack of acceptability, unfavourable macro-economic context, etc.).
The objective of packaging “conditional” measures is to make sure that the quantitative objectives in regard to energy efficiency and CO2 emissions will be fulfilled, and that energy consumption and CO2 emissions trajectories remain as close as possible to those in line with the commitments. The rationale in packaging “conditional” measures lies upon two main ideas:
••••
To consider first an “increase” in the scope of the implementation of the measures (increasing standards, increasing tax, etc.);
••••
To make the consumers aware that more severe measures will be taken if the results of the measures already taken are disappointing or not sufficient.
Examples in various fields In the case of existing dwellings, an example of a package of conditional measures is the combination of space heating/cooling energy labels required for housing transactions, of a tax linked to an average yearly consumption, and mandatory thermal retrofitting. Labels inform the house-buyer about its future energy consumption and cost: this is an incentive for vendors to improve the thermal insulation of their homes so as to achieve a better sale price. A tax related to the thermal performance of the dwelling is a further incentive for owners to take action and decrease the stock of dwellings with bad energy efficiency performance. Mandatory retrofitting of the thermal insulation guarantees that the energy efficiency target in existing buildings will be fulfilled. The examples shown below are not from the WEC survey, since almost all countries consider that they are not yet firmly committed to quantitative objectives, as the Kyoto Protocol has not yet been ratified.
In industry, an example of a package of “conditional” measures is the combination of voluntary agreements, CO2 tax and regulation. Voluntary agreements are the first level
World Energy Council Energy Efficiency Policies and Indicators
84
measures to be taken: consumers commit themselves to reducing their consumption/emissions per unit of production; the second level measure, a CO2 tax, is announced to be levied in case the reduction target is not reached in due time; Regulations are announced as a third level measures to be taken to force industries to fulfil their commitments if CO2 tax is still not enough.
In the case of transport, another example of conditional measures is the combination of car manufacturers agreements, financial penalties and regulatory standards. At the first level, car manufacturers commit themselves to reduce the specific consumption/CO2 emissions of new cars; at second level, if the commitment is not fulfilled, the car manufacturer will be made liable to financial penalties. If penalties are still not enough to meet the objective, mandatory standards on specific consumption/emission will be imposed as a third level of measures.
A third example is for electrical appliances: a combination of labels, penalties and regulatory standards. At first level, manufacturers are required to give information about efficiency performance and retailers are obliged to inform consumers with labels; at second level, financial penalties will be levied on retailers not respecting both first measure obligations; and at the third level, mandatory standards will be imposed on minimum efficiency of electrical appliances to be manufactured or imported if manufacturers fail to deliver appliances efficient enough to reach the efficiency targets. 3.10.6 Conclusions and recommendations The implementation and evaluation of individual energy efficiency policy measures face two types of challenge:
••••
Ex-ante, the scope of a measure and assessment of its cost effectiveness requires a sound evaluation of its likely impact on future energy consumption, which to a large extent depends on other measures taken at the same time;
••••
Assessing ex-post the actual impact of a specific measure in regard to its implementation cost is almost impossible if other measures have been taken simultaneously, because of the interactions among the measures and the great chance of double counting the impacts97.
The interaction between the measures can been split into four categories: ••••
Interactions in terms of social and economic acceptability and related transaction and implementation costs;
••••
Synergies versus drawbacks among measures that either reinforce each other or create a conflict (overlapping between subsidies and tax reduction, for example);
••••
Interactions affecting the overall costs to consumers; ••••
Interactions affecting the achievement of the efficiency target.
Depending on the mix of measures taken at the same time, the final result of energy efficiency might be well below the overall target, even if, in theory, the sum of all the individual measures taken separately would have been sufficient to reach the target. Packaging the measures is the right approach to ensure that the mix of implemented measures comes close to the set efficiency target. The package must consider the four types of interaction outlined above to ensure a proper balance between minimising the overall cost of implementation of all the measures on the one hand, and maximising the potential for achieving the overall target, on the other hand. 97 On this topic, reference can be made to the work of ECN; see for instance Boonekamp P.G.M. (2003): “Interaction between Policy Measures on Savings – Analysis for Past Household Energy Consumption in the Netherlands”, ECN Policy Studies, 23p

World Energy Council Energy Efficiency Policies and Indicators
85
4. Conclusions and Recommendations The development of an energy efficient economy is a tough challenge for all countries. The climate change issue, the lack of public resources for investment in energy supply and the prospective depletion of fossil energy resources in the long term provide strong incentives for the exchange of experiences on policies for improving energy efficiency. The World Energy Council is a unique forum which can assist countries in overcoming this challenge.
The main reason for the introduction of energy efficiency policies related to long-term issues is global warming, but also, to some extent, the looming depletion of oil and gas resources around 2030-2050. In non-OECD countries, energy efficiency is also a way to alleviate the investment constraints on the supply side. Since 2000, with the sharp increase in the price of oil, many countries, especially the less developed ones, are again facing macro economic constraints.
The liberalisation of the energy sector and the globalisation of economies make the intervention of governments much more difficult as unilateral measures (such as energy taxes) could weaken domestic industries facing international competition. However, the climate change issue will impose a constraint on energy consumption, even if flexibility mechanisms were able to alleviate this for a while. The CO2 emissions tradable permits may allow the Annex 1 countries to avoid strong constraints on their industries in the short-term but in the long-term, the prices of permits would increase, making energy more and more costly.
Co-ordination of certain policies and measures at the international level would help to overcome the obstacles to implementation of both standards and pricing signals.
At the domestic level, governments should incorporate energy efficiency into all main public sector policies (land planning, transport infrastructure, social housing policy, urban planning). The infrastructure investment decisions should accommodate the possibility of rising energy prices and constraints on CO2 emissions. The mitigation of the transport sector’s CO2 emissions is highly important, and could be done by including a cost of carbon in public decisions to direct consumer choices toward energy efficient solutions (a low initial value but growing regularly).
The WEC’s Energy Efficiency project aims to facilitate the exchange of information and share experiences on energy efficiency measures among different countries around the world. This forum can help governments select appropriate and cost effective sets of measures for each sector, taking into account their national circumstances. Energy efficiency indicators are a unique tool allowing the global impact of a mix of measures implemented in each sector to be quantified.
4.1 Energy Efficiency and CO2 Trends Energy consumption is progressing less rapidly than economic activity in most regions. This long-term trend has even accelerated since 1990 (reduction of the energy consumption per unit of GDP by about 1.5% per year at world level between 1990 and 2003 and 1.8% p.a. since 1996, compared to 1.4% p.a. since 1980). This resulted in an impressive energy saving of 2.1 Gtoe since 1990. Large differences exist between world regions in the trends observed: very rapid reduction of the energy intensity in China, increase in the Middle East and in the most developed regions of Asia. About a quarter of the reduction in the world energy intensity has come from a more rapid growth in regions with the lowest energy intensity: the actual progress in energy productivity

World Energy Council Energy Efficiency Policies and Indicators
86
was only 1.1% per year. This regular progress is mostly the result of energy efficiency policies and measures implemented over the period. Indeed, until 2000, price signals were in general very weak, and change in the structure of the economic activity had a marginal influence. Energy efficiency gains are greater at the level of final energy consumers. However, 25% of the gains achieved by final consumers are offset by increasing losses in energy conversion, because of the increasing use of electricity by final consumers. The industrial sector has contributed most to the decrease in the overall energy intensity. On average, at world level, the energy intensity of industry has decreased by 2.7% p.a., i.e. almost twice as fast as for the total energy intensity. The energy performances of energy intensive industries (e.g. steel, cement, paper) are converging and improving rapidly. The overall energy performance of the transport sector has improved more since 1990 than it did during the 1980s. The economic slowdown in some developing regions, the technical improvements of vehicles and the saturation in transport demand in OECD countries explain most of this new trend. However, part of the technical improvement of new vehicles is offset by non-technical factors (e.g. congestion, larger and more powerful cars). In the household sector, the electricity consumption for electrical appliances and lighting has stopped increasing in several OECD countries. This is probably the result of policy measures implemented in that sector (e.g. labelling, efficiency standards), as well as of saturation in the ownership of large electrical appliances. CO2 emissions from energy use have increased for all regions since 1990 except for the CIS and Central and Eastern European countries, which experienced negative economic growth over part of the period. Global CO2 emissions were 16% higher in 2002 than in 199098 All these trends in the energy and CO2 indicators are the results of various factors, which include changes in energy prices and the implemented policy measures. The report also presents a comparison of the countries experiences in the evaluation of energy efficiency policy measures. This evaluation helps draw conclusions and make recommendations from three main viewpoints: i) The effectiveness of the policy measures implemented; ii) The use of energy efficiency indicators for monitoring; iii) The link between the various measures and the influence of the policy context. 4.2 Evaluation of Energy Efficiency Policies and Measures Although some convergence can be observed in the policy measures across countries, many differences still exist. They reveal that there is not a single model measure, or mix of measures, that can be considered as the most effective one in all circumstances. The energy prices and taxation, the degree of market development for energy efficient devices and services and the level of integration between energy efficiency policy and other sectoral policies (transport, building, etc.) are the primary factors behind such differences. More
98 On a per capita basis, in 2002 they are at the same level as in 1990
World Energy Council Energy Efficiency Policies and Indicators
87
general differences in countries’ circumstances certainly play a role too, such as demography (age of population, size of households, growth rate of the dwelling stock), the climate, the level of economic development and the structure of economic activities, the degree of decentralisation of public administration, and, finally, the strategies of the energy producers and distributors. All these factors explain why different sets of measures have to be adopted in different countries, and why, in the same country, new measures and new combinations of measures have to be designed to accompany market change. Although many differences exist in the implementation of measures, a greater role is now given to the coordination of policies, especially in Europe with the various EU Directives that also affect non-EU countries. The analysis of energy efficiency indicators has shown that the best results in terms of energy efficiency progress were generally obtained in the industry sector. This sector is first of all the most sensitive to market forces. It has also been the target of multiple types of measures, ranging from financial and economic incentives, to various regulations (e.g. mandatory energy managers, mandatory energy consumption reporting, mandatory audits) and, more recently, to voluntary / negotiated agreements. On the other hand, passenger transport and households record lower achievements, as increased income and lifestyle changes have offset part of the technical energy efficiency gains. The following conclusions can be drawn from the review of the policy measures on which this report focused. 4.2.1 Institutional setting Almost all countries under review have set up energy efficiency agencies, either at the national level, or at regional levels or both, and more recently at local level. There is even a growing number of local agencies or local focal points of national agencies (local information centres) with the task of bringing information directly to the consumers and adapting it to local/regional circumstances. Although the legal status of these agencies is different from one country to another, their establishment almost everywhere, sometimes quite recently, clearly indicates that all countries concerned with energy efficiency perceive such agencies as useful and that there is no contradiction between such an institutional arrangement and the market. 4.2.2 Labelling and standards for electrical appliances Labelling programmes and efficiency standards are an effective method of transforming the market and slowing the growth of electricity demand. However, none of the programmes introduced has been able to reverse or stop the increase in electricity consumption in the domestic appliances sector, essentially because of changes in ownership levels and the introduction of new equipment. To be effective, labelling programmes and performance standards must be regularly upgraded. Faced with new standards, manufacturers adapt the appliances available on the market so that they meet the new minimum requirements, but there are no incentives for them to go beyond what is required if no stricter standards have been planned for the future. It is therefore essential to review and reinforce standards at regular intervals as a way to stimulate technical progress and to ensure a steady improvement in energy efficiency. In the case of the European and Australian programmes, energy labels and standards have played a complementary and vital role. The requirements are not as strict as they are in the

World Energy Council Energy Efficiency Policies and Indicators
88
US, but labelling acts as an incentive for manufacturers to differentiate themselves from their competitors and stimulates the introduction of new, more efficient models. However, there is no longer any incentive to innovate when all the models are in the best efficiency classes or when most of the models on the market have been endorsed with a label. In this respect, the "Top Runner" programme has the particular advantage of making easier the definition of new targets. As the most efficient appliances on the market at a given time are used to set the future standards, there is no need for extensive market or techno-economic analysis to set the minimum energy efficiency standards. With this type of approach, the preparatory work may be shortened and the negotiations between manufacturers and public authorities facilitated, since the target corresponds to existing appliances that are already available on the market. The European example shows that redefining energy efficiency classes is not simply a technical or administrative decision. Regrouping them into new efficiency classes proved difficult. The solution of creating two new classes (A+ & A++) is clearly a temporary solution and the same situation will have to be dealt with again in the near future. Appliance manufacturers are generally opposed to efficiency standards. However, experience has shown that such fears are largely unfounded. The turnover and profit levels of manufacturers are not adversely affected by the introduction of standards, nor do the standards lead them to eliminate certain functions. The process of negotiating the introduction of new standards or reinforcing existing ones remains nevertheless a source of conflict and uncertainty. In certain conditions, voluntary agreements can be an effective alternative to mandatory minimum energy efficiency standards. Since they have the support of manufacturers, they can be implemented more rapidly than regulations. Nevertheless, their effectiveness is still conditioned by the possibility of imposing performance requirements corresponding to genuine additional efforts from industry. 4.2.3 Voluntary / negotiated agreements Voluntary / negotiated agreements (VAs/NAs) have been a very popular policy tool in recent years in most EU countries to improve energy efficiency and reduce CO2 emissions of large energy consumers. Most of the evaluation studies of such agreements conclude that the effectiveness of this instrument is in many cases doubtful. Even for the Dutch voluntary agreements, which can be considered as the most carefully designed VAs/NAs in the world, an independent ex-post evaluation concluded that this instrument might have caused about 25-50% of the observed decrease in the industrial energy intensity. This is quite a good score but it was achieved with a large public and private effort. It can be concluded that most other agreements, which are less well followed by public bodies, achieved considerably less impact. VAs appear efficient from an economic perspective to the extent that they help overcome some barriers to energy efficiency and result in the realisation of the so-called “no regret potential”. VAs may be more suited as complementary instruments to other measures, rather than being the prime policy instrument to address energy efficiency and climate change. Independent ex-post evaluations or verification of VAs/NAs are rarely carried out. Moreover, the impact is often only monitored at the sectoral level: this means that the results observed include not only the influence of the agreement, but also the effect of changes in the structure of the activity, and of efficiency progress on its own.

World Energy Council Energy Efficiency Policies and Indicators
89
OECD countries mainly use VA’s, while other countries in general have so far only rarely made use of this tool for various reasons. Given the above mentioned limitations, it appears difficult to recommend a massive use of VAs/NAs in those regions. 4.2.4 Energy efficiency funds The difficulty of obtaining the necessary financing is too often a major barrier to energy conservation projects. Many governments have already implemented energy efficiency funds, mostly in the form of subsidies. More recently, because of the pressures on public finance, new innovative financial schemes have been designed to attract private funds into energy efficiency programmes. These “innovative funds” use tools traditionally used for the private sector (loans, equity participation, venture capital, etc.) and seek a partnership between public institutions and private investors, such as banks or private companies (ESCOs). In addition, they have the long-term objective to develop a market for energy efficiency that would be “self-sustaining”, without public intervention. The main difference between a subsidies fund and an innovative fund is that the latter seeks a potential return on investment. The fund sponsors need the guarantee that they will be reimbursed for the money they have invested on the project. The perspective is therefore completely different. Whereas the public funds inject money into the system without being sure of getting financial benefits, the private or public-private funds seek direct profits, at least for the private partners. Increased interest in these innovative funds can be seen as an expression of a worldwide trend to share management and to transfer public objectives to the market. Innovative funds alone are not sufficient to ensure a great penetration of the market, as most of them require a wide range of projects whose financial profitability is not attractive enough. They address mainly organisations developing medium to large projects (public bodies, industries, ESCOs) and generally concentrate on a specific niche of projects presenting the same characteristics, mainly in the industrial and service sectors. Most of the funds have an institutional body as sponsor (e.g. governments or international bank), which seeks other objectives complementary to purely financial objectives (energy consumption reduction, for instance). In addition to this public contribution, private investors or commercial banks bring in their own financing. Such funds therefore require public backing, which would allow private funding leverage. Indeed, the experience of existing funds suggests that private partners will only provide investment on an equity or loan basis if there are other parties involved (co-financing). Some funds seek to use the carbon emission reductions resulting from the financed project to obtain carbon credits, which leads to an increase of the projects’ profitability as well as a mitigation of the associated project risks. The designing of such schemes is at the experimental and discussion stage, because the position of governments on the carbon credit trading systems is still unclear. The success of any financial schemes for energy efficiency depends on how it meets and completes several key tasks, including analysing thoroughly the country’s circumstances, favouring the creation of a market for energy efficiency especially by entering into strategic alliances with private partners and financial institutions, reducing transaction costs and minimising project risks.

World Energy Council Energy Efficiency Policies and Indicators
90
Guarantee funds and revolving funds can be developed in any part of the world where there is a minimal financial sector. The other fund model, based on the intervention of ESCOs, requires a certain number of energy service companies to increase the effectiveness of the tendering process as well as the number of projects covered. 4.2.5 Impact of liberalisation on energy efficiency: the experience of Latin American countries Numerous countries are currently engaged in a liberalisation of their energy markets. This trend may be seen at first as diverting the energy companies’ attention from energy efficiency to cost reduction and competition. In some countries however, the liberalisation process has been partly justified as a way to promote energy efficiency by ensuring that utilities could not only compete on prices, but also on energy services. Several industrialised countries among the first to have liberalised their markets are now tackling this issue and introducing the so called “white certificates”, i.e. energy saving quotas allocated to distribution utilities. For instance, the UK regulator is managing such a programme on behalf of the government, the ”Energy Efficiency Commitment”99. The EU Commission is also proposing an “Energy Service Directive”, which should stimulate the market for energy efficiency services and lead to a wider use of white certificates. The situation in less developed countries is different with respect to the consequences of liberalisation of the energy markets on energy efficiency. Very few assessments exist, but the experience of Latin American countries can be taken as a good example100. The liberalisation of electricity markets and the vertical separation that has been taking place in the sector have had various consequences for the development of energy efficiency in the 26 member countries of OLADE. The first consequence observed in the region’s countries is the impact on energy prices. Generally speaking, it can be noted that subsidies tend to disappear and consumers therefore receive the correct price signals. Nevertheless, even if these price signals make efficiency measures profitable, it is not enough for the large majority of consumers who are not in a position to conduct an economic analysis justifying these measures. The sector’s new structure is characterized by a rise in the number of players. As a result of this, the responsibilities for developing energy efficiency currently are too widely spread out among at least all of the following: power generation, transmission and distribution utilities, and in certain cases another player, the marketer. The benefits for a vertically integrated utility do not seem to be obvious for some of the new players. The assessment of efficiency programmes for an integrated utility permitted the benefits for power generation to be quantified by the reduction in operating costs and the possible delay in the need for new investments. In the new structure, the improvement in energy efficiency of the power plants as a whole, which cover the entire supply, does not turn out to be the same as for individual players. The distribution utility can only see the decline of its income due to a possible reduction in sales as a result of an efficiency programme. There are few executives from these utilities who are willing to admit that they would be able to enhance their marketing thanks to the value added by efficiency programmes. Over the long 99 See for more information www.ofgem.uk 100 The following assessment has been done in the context of OLADE economies and adapted from a contribution prepared by OLADE
World Energy Council Energy Efficiency Policies and Indicators
91
term, they would help more efficient clients and ensure that they remain in the system because of better competitiveness. In the Latin American region, the situation is made even more difficult since utilities that have only recently consolidated their position in the countries have to tackle urgent programmes for their shareholders. This included improved billing/collection, reduction of technical and non- technical losses, outsourcing of various functions, integration of local staff to business strategies etc. This situation makes energy efficiency a very low priority in power utilities’ plans. 4.2.6 Other measures Regulations
• Buildings standards All European countries and most other OECD countries have set up energy efficiency standards for new dwellings and service sector buildings. Some non-OECD countries outside Europe have recently established standards for service buildings. Altogether, about 60% of the countries surveyed had mandatory or voluntary standards for new non-residential buildings. Such a broad spread of this measure among countries indicates that it is considered by policy makers as one of the most cost effective to tap the larger potential for energy savings in all countries. It also indicates that the market signals are not considered to be clear enough to foster the right decisions by individuals, professionals or developers regarding the thermal quality of buildings. Thermal building codes have been changing over time from simple standards on building components to more complex standards, including for the most advanced countries, energy performance standards which cover the whole building system, including the equipment integrated: heating/cooling; warm water; lighting; energy for motors/pumps; elevators, etc. Revisions in thermal building codes have become increasingly regular. For instance, over the past 30 years, standards have been reinforced three to four times in most EU countries, including some very recent revisions: standards have been continuously tightened independently of the oil price level. The effort is not yet finished, as seven EU countries have reinforced their standards since 2000. In addition, the new EU building directive has for the first time included provisions for a revision every five years. The few evaluations of the real energy conservation achievement due to building codes show that the actual savings for new buildings are lower than the theoretical savings resulting from the standards. This situation is explained by non-compliance of part of the buildings and also the behavioural changes of people who can and do, at the same cost, increase their comfort. The introduction of sophisticated calculation procedures and the move towards performance-based standards has made it easier to introduce building certificates. These certificates enable the buyer to obtain information about the energy consumption of the dwelling they are going to buy or rent. Few countries have estimated the additional costs that each round of new building codes has caused. Nevertheless, from the few results available it can be estimated that the additional

World Energy Council Energy Efficiency Policies and Indicators
92
costs of the building were limited to a few percentages. Standards for new buildings may also impact on the technologies, material and practices used in retrofitting old buildings. • Other regulations
In almost half of the European countries, regulations require large energy consumers (industrial plants, commercial buildings) to have regular audits. In the other regions, only 5 countries report mandatory audits. The effectiveness of such a measure remains to be demonstrated but at least it aims at turning the attention of consumers to their energy use and can be a start for other measures. Financial incentives Traditional incentives of financial support for energy efficiency investments through subsidies remain popular. As they have often been considered as costly and inefficient101, they are now better targeted to limit the consumer population that can benefit from them (e.g. low income households, tenants); in addition, they are also restricted to certain types of investment (from a selected list of equipment), with a long payback time but high efficiency gains (e.g. renewables, co-generation) or to innovative technologies (demonstration or pilot investments). Subsidies are viewed as a temporary measure to mobilise consumers, to prepare for new regulations, or to promote energy efficient technologies by creating a larger market than would exist otherwise, with the objective of a cost reduction for the subsidised energy efficient technologies. Traditional subsidy schemes tend to be progressively replaced with new financial schemes bringing in private capital, as a way to cope with the limitations of public budgets. Fiscal incentives for the public budget, such as tax credits, tax reductions and accelerated depreciation, are usually considered as less costly than subsidies. They can work well if the tax collection rate is sufficiently high. Such measures usually have a poor performance in an economy in recession or in transition. They are more adapted to well-developed countries: in fact it is mainly OECD countries that have such fiscal measures. Tax reductions for efficient equipment have been introduced in many countries and almost equally in all regions: they exist in about 30% of the countries102 surveyed. The compact fluorescent lamp is the most common equipment to which this measure applies outside the OECD. In some European countries, VAT concessions exist on labour costs to reduce the investment costs of buildings renovation (e.g. France, Sweden, Switzerland). Another innovative way to promote investment in energy efficiency and CO2 reduction is to offer tax concessions to companies that make concrete commitments on energy efficiency gains/CO2 reduction, and meet their target. Information One of the main barriers to energy efficiency is the lack of information to consumers about what they can do to achieve it. To address this issue, a large range of educational tools have been designed. The most efficient of them are considered to be audits and, more recently, the creation of local energy information centres.
101 They did not always reach the targeted consumers and benefited those consumers who would have made the investment in any case, even without subsidies (“free riders” problem). 102 More detail about the countries affected by these measures can be found in Annex 2

World Energy Council Energy Efficiency Policies and Indicators
93
Audit schemes are mainly developed in industry and in non-residential buildings. Energy audits are usually partially funded by public agencies or by utilities in European countries and are more often free for consumers in the other regions to encourage participation. Evaluation of audits schemes shows that the degree of implementation of the suggested measures varies considerably, depending on the country103. One relatively new approach to reach the multitude of consumers in a regular way, beyond the reach of traditional information campaigns in the media, is to set up local energy information centres to be as close as possible to the consumer. These local centres are focal points that offer impartial and personalised information on energy conservation and, usually, renewable energy, to the general public and specific target groups, including advice on useful contacts in the field. 4.3 Energy Efficiency Policy Monitoring The study presents indicators mostly at the regional level, often using graphs that are easy to read. These indicators are often aggregated, as the data available for world regions are limited. Some additional indicators have been produced at the level of selected countries for the project and made available on the WEC web site (www.worldenergy.org). More detailed indicators exits for EU15 countries and Norway in the ODYSSEE database104 and for 10 Central Eastern European Countries105. EUROSTAT has recently developed for EU member countries a set of so-called priority energy efficiency indicators106. IEA has also published a report containing a variety of energy efficiency indicators. All these experiences with indicators clearly show that energy efficiency indicators are useful tools to assess the countries’ situations and developments with respect to energy efficiency. Macro-economic indicators help identify the respective impacts of economic structures and sectoral efficiencies on the overall energy efficiency progress of a country, and make it possible to assess individual country situations. Sectoral indicators allow the assessment of how end-use efficiency impacts on aggregate sectoral efficiency, and relate partly to the technological evolution and the resulting energy savings. From this point of view, cross-country comparisons can be made, both in levels and in trends. All these indicators are increasingly used to monitor targets of energy efficiency gains or CO2 abatement. Indeed, most governments and the European Commission, are setting quantitative targets for a certain time period and monitor the progress on a yearly basis. This is also true at the sectoral level in the framework of voluntary/negotiated agreements. Indicators allow first to verify whether the objectives have been fulfilled and secondly to identify, through a set of more detailed indicators, why the objectives may not have been reached. The benchmarking approach, which is often used at the sectoral level, can also be useful at the country level to
103 The degree of implementation was quite high n some OECD countries: from around 50% in the US to around 75% in France and 80% in New Zealand. However other countries report a much lower level of implementation: for instance, in Egypt, only 10% of the recommended measures were really implemented. 104 For more information: www.odyssee-indicators.org 105 For more information: www.ceec-indicators.org 106 Eurostat (2003)

World Energy Council Energy Efficiency Policies and Indicators
94
compare the relative performance of different countries, starting from indicators well adjusted for national circumstances.107 In this respect physical indicators should be used whenever possible, as economic indicators, even corrected for differences in purchasing power parities, always have a bias. Nevertheless, more progress in data collection still needs to be achieved in many countries. As a matter of fact, energy and economic statistics remain limited in assessing energy demand trends. The experience of the EU and Norway with the ODYSSEE database should be extended to other regions and APERC’s first experience for the member economies within the industrial sector needs to be consolidated and extended to other sectors. For Latin America, OLADE’s SIEE is a comprehensive energy database. The data coverage, however, remains insufficient for an evaluation in terms of energy efficiency indicators. The additional data on the economic and technical determinants necessary for more in depth analysis of energy use by sub-sectors and end-uses is required. Undoubtedly, poor data availability limits drastically the applicability of the indicators and therefore the scope and relevance of country energy efficiency assessments. There is an urgent need to define, at the international level, the basic minimum data requirements that would allow relevant country evaluations and cross-country comparisons on energy efficiency, in particular in view of international discussions on CO2/GHG effects. The recent efforts of EUROSTAT and IEA could help define such minimum requirements108. For some countries, where the data availability is adequate, the energy efficiency indicators proposed in this study are sufficient to evaluate energy efficiency policies, from both sides: effectiveness of policy measures and energy efficiency progress. To be fully relevant, such an evaluation should nevertheless include effective criteria for the use of public funds in the economy and demonstrate how the spending on energy efficiency would benefit the economy: through which mechanism and how soon? Such criteria are almost never available or public, which makes it difficult, for example, to judge if the taxpayer’s money is better used when spent on energy efficiency measures than, for instance, on subsidies for public transport or agriculture or in energy supply infrastructure (“eviction effect”). In most cases, therefore, the evaluation has to be done in absolute terms, either in purely economic terms (how much is spent, how much is saved) or in a purely normative way (how close are we to the objective), or a combination of both. In such a case, energy efficiency indicators, as those used in this study, are necessary. If the data availability is good, they are quite comprehensive and sufficient for the evaluation purposes.
107 See for instance the ODYSSEE and CEEC indicators project. 108 IEA, 30 years of energy use in IEA countries, IEA,2004

World Energy Council Energy Efficiency Policies and Indicators
95
4.4 General Conclusions and Recommendations: Energy Efficiency Policies in the New Decade
The global energy market faces several challenges due to strong uncertainties about energy prices evolution. Several factors point in the direction of a price increase:109
••••
Availability of conventional oil resources in the future is more and more a topic of debate between experts. Despite the possibility of extension of proven reserves, the increasing dependency of most developed countries on Middle East supplies reinforces the instability of oil markets. In the shorter term, the strong increase of oil demand in emerging economies, such as China, is a driving force towards higher prices;110
••••
The climate change issue is likely to result in a fossil fuels prices increase whatever the outcome of the Kyoto Protocol. The growing consensus among the experts of the International Panel on Climate Change about human induced impacts on the temperature increase has led several governments to implement GHG mitigation policies. A decrease of domestic GHG emissions by a factor of 4 or 5 by 2050 is even explicitly adopted as an objective by some governments (e.g. UK / France). The Climate Change issue will impose a constraint on energy consumption even if the flexibility mechanisms were able to alleviate this for a while. CO2 Emissions Tradable Permits Schemes may allow Annex 1 countries to avoid strong constraints on their industry in the short term but in the long term, the price of permits should increase, making energy more and more costly. Energy efficiency is often the first option to reduce emissions in many sectors. Research and development are certainly a priority in order to push technological innovation toward a low carbon economy but the penetration of new technologies needs public support through specific measures (e.g. standards, voluntary agreements);
••••
Energy market liberalisation does not always result in lower energy prices. The competition between suppliers does induce economic efficiency but increasing electricity demand, especially peak demand, leads to high spot prices as peaking investments capacity is not immediately implemented.
In this context, the uncertainty about energy prices should lead governments to design efficient policies in order to prepare economies for an increasing cost of energy. The scarcity of public funds and the competition between diverse public needs (e.g. employment, education, health, security) encourages the use of cost-effective measures. Public-private partnership is becoming a necessary part of public policies. The privatisation of energy production companies alleviates the burden of public investment on the supply side but, on the demand side, some market mechanisms need to be developed in order to make energy efficiency investments attractive for private participants. Energy efficiency services could provide a new field of activity for companies but governments need to bring in some incentives (soft interest rates, tax credits, etc.) or mandatory targets (quotas or commitments). The new instruments are not a panacea and traditional instruments, such as minimum efficiency standards, have proved to be effective in many sectors. Fiscal and pricing policies are, of course, the strongest instrument to internalise long-term signals in the markets. The unpopularity of taxes should not prevent the careful design of new taxation schemes, taking into account international competition and the disruptive impact on low-income households. Co-ordination at international level could help overcome obstacles to the implementation of
109 See WEC, Drivers of the Energy Scene, December 2003 110 See WEC, Survey of Energy Resources 2004

World Energy Council Energy Efficiency Policies and Indicators
96
both standards and price signals. A progressive increase of energy prices even at a low rate, announced publicly, can have, in the long-term, a large impact on technological innovation. National governments, as well as regional and local administrations, should incorporate energy efficiency into all main sectoral public policies (land planning, transport infrastructures, social housing policy, urban planning). There are synergies between these policies and the long-term issues of energy efficiency policies. Infrastructure investment decisions should incorporate the expected growth in energy prices and constraints on CO2 emissions. The mitigation of CO2 emissions in the transport sector is particularly suited to this approach. This could be done by establishing a carbon value, which would be taken into account in public decisions to direct choices toward energy efficiency (with a low initial value which is expected to grow). An integration of energy efficiency and other public policies will make the mix of market instruments more efficient. Within this context, the energy efficiency service of the World Energy Council could help governments select appropriate and cost effective measures for different sectors, taking into account national circumstances. Energy efficiency indicators allow quantification of the global impact of the mix of measures implemented in each sector. These indicators and policy evaluations could help define long-term energy demand scenarios, particularly with low energy consumption profiles. The World Energy Council provides a unique forum for the discussion and comparison of experiences on energy efficiency measures among different countries and economies,
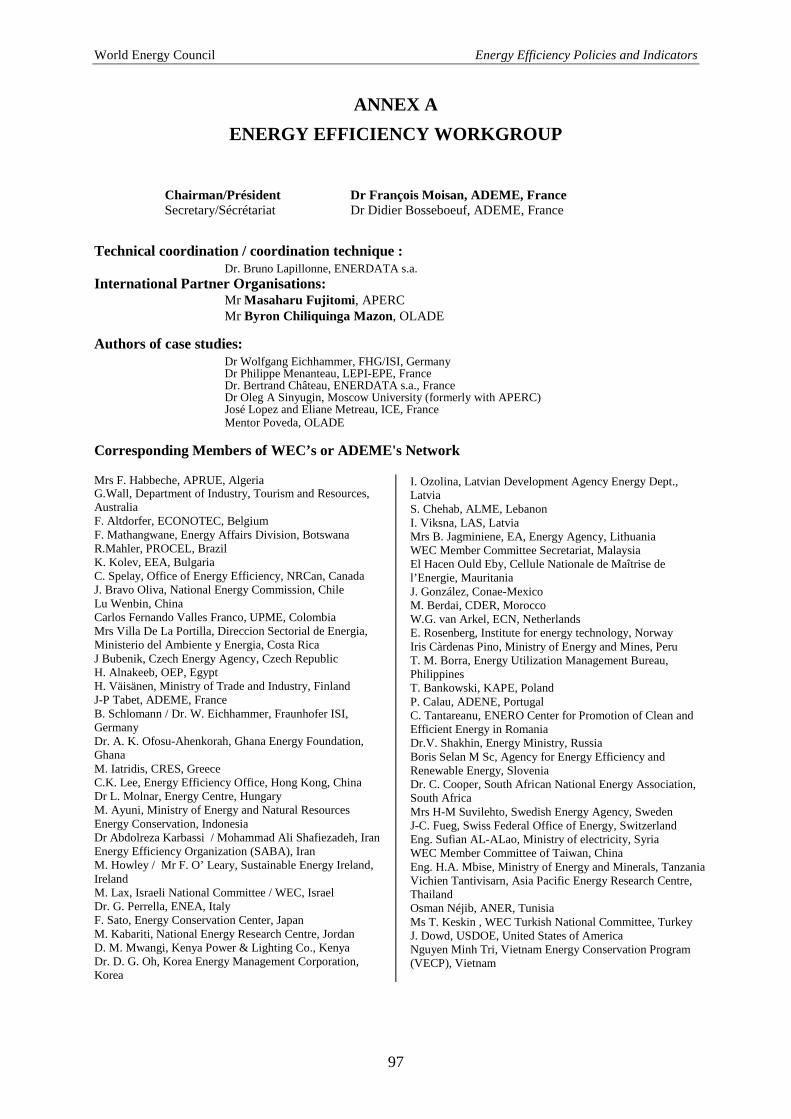
World Energy Council Energy Efficiency Policies and Indicators
97
ANNEX A ENERGY EFFICIENCY WORKGROUP
Chairman/Président Dr François Moisan, ADEME, France Secretary/Sécrétariat Dr Didier Bosseboeuf, ADEME, France
Technical coordination / coordination technique : Dr. Bruno Lapillonne, ENERDATA s.a. International Partner Organisations: Mr Masaharu Fujitomi, APERC Mr Byron Chiliquinga Mazon, OLADE Authors of case studies: Dr Wolfgang Eichhammer, FHG/ISI, Germany Dr Philippe Menanteau, LEPI-EPE, France Dr. Bertrand Château, ENERDATA s.a., France Dr Oleg A Sinyugin, Moscow University (formerly with APERC) José Lopez and Eliane Metreau, ICE, France Mentor Poveda, OLADE Corresponding Members of WEC’s or ADEME's Network Mrs F. Habbeche, APRUE, Algeria G.Wall, Department of Industry, Tourism and Resources, Australia F. Altdorfer, ECONOTEC, Belgium F. Mathangwane, Energy Affairs Division, Botswana R.Mahler, PROCEL, Brazil K. Kolev, EEA, Bulgaria C. Spelay, Office of Energy Efficiency, NRCan, Canada J. Bravo Oliva, National Energy Commission, Chile Lu Wenbin, China Carlos Fernando Valles Franco, UPME, Colombia Mrs Villa De La Portilla, Direccion Sectorial de Energia, Ministerio del Ambiente y Energia, Costa Rica J Bubenik, Czech Energy Agency, Czech Republic H. Alnakeeb, OEP, Egypt H. Väisänen, Ministry of Trade and Industry, Finland J-P Tabet, ADEME, France B. Schlomann / Dr. W. Eichhammer, Fraunhofer ISI, Germany Dr. A. K. Ofosu-Ahenkorah, Ghana Energy Foundation, Ghana M. Iatridis, CRES, Greece C.K. Lee, Energy Efficiency Office, Hong Kong, China Dr L. Molnar, Energy Centre, Hungary M. Ayuni, Ministry of Energy and Natural Resources Energy Conservation, Indonesia Dr Abdolreza Karbassi / Mohammad Ali Shafiezadeh, Iran Energy Efficiency Organization (SABA), Iran M. Howley / Mr F. O’ Leary, Sustainable Energy Ireland, Ireland M. Lax, Israeli National Committee / WEC, Israel Dr. G. Perrella, ENEA, Italy F. Sato, Energy Conservation Center, Japan M. Kabariti, National Energy Research Centre, Jordan D. M. Mwangi, Kenya Power & Lighting Co., Kenya Dr. D. G. Oh, Korea Energy Management Corporation, Korea
I. Ozolina, Latvian Development Agency Energy Dept., Latvia S. Chehab, ALME, Lebanon I. Viksna, LAS, Latvia Mrs B. Jagminiene, EA, Energy Agency, Lithuania WEC Member Committee Secretariat, Malaysia El Hacen Ould Eby, Cellule Nationale de Maîtrise de l’Energie, Mauritania J. González, Conae-Mexico M. Berdai, CDER, Morocco W.G. van Arkel, ECN, Netherlands E. Rosenberg, Institute for energy technology, Norway Iris Càrdenas Pino, Ministry of Energy and Mines, Peru T. M. Borra, Energy Utilization Management Bureau, Philippines T. Bankowski, KAPE, Poland P. Calau, ADENE, Portugal C. Tantareanu, ENERO Center for Promotion of Clean and Efficient Energy in Romania Dr.V. Shakhin, Energy Ministry, Russia Boris Selan M Sc, Agency for Energy Efficiency and Renewable Energy, Slovenia Dr. C. Cooper, South African National Energy Association, South Africa Mrs H-M Suvilehto, Swedish Energy Agency, Sweden J-C. Fueg, Swiss Federal Office of Energy, Switzerland Eng. Sufian AL-ALao, Ministry of electricity, Syria WEC Member Committee of Taiwan, China Eng. H.A. Mbise, Ministry of Energy and Minerals, Tanzania Vichien Tantivisarn, Asia Pacific Energy Research Centre, Thailand Osman Néjib, ANER, Tunisia Ms T. Keskin , WEC Turkish National Committee, Turkey J. Dowd, USDOE, United States of America Nguyen Minh Tri, Vietnam Energy Conservation Program (VECP), Vietnam
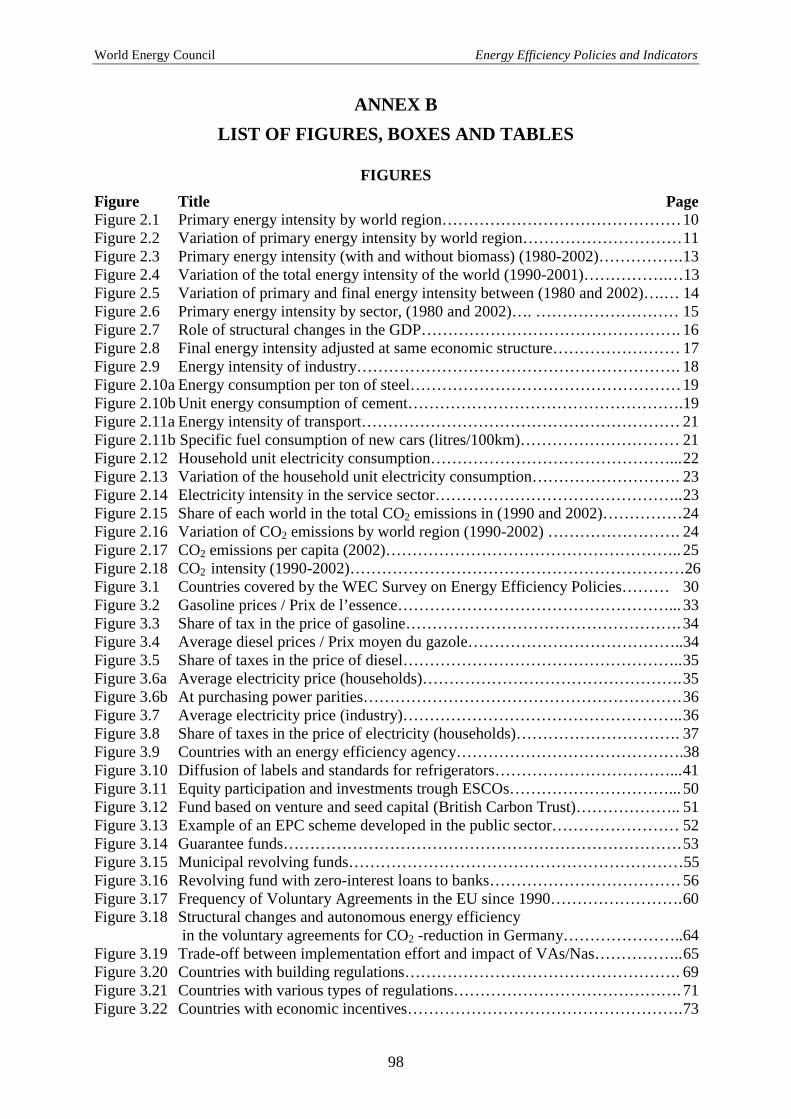
World Energy Council Energy Efficiency Policies and Indicators
98
ANNEX B LIST OF FIGURES, BOXES AND TABLES
FIGURES
Figure Title Page Figure 2.1 Primary energy intensity by world region……………………………………… 10 Figure 2.2 Variation of primary energy intensity by world region………………………… 11 Figure 2.3 Primary energy intensity (with and without biomass) (1980-2002)……………. 13 Figure 2.4 Variation of the total energy intensity of the world (1990-2001)…………….…13 Figure 2.5 Variation of primary and final energy intensity between (1980 and 2002)….… 14 Figure 2.6 Primary energy intensity by sector, (1980 and 2002)…. ……………………… 15 Figure 2.7 Role of structural changes in the GDP…………………………………………. 16 Figure 2.8 Final energy intensity adjusted at same economic structure…………………… 17 Figure 2.9 Energy intensity of industry……………………………………………………. 18 Figure 2.10a Energy consumption per ton of steel…………………………………………… 19 Figure 2.10b Unit energy consumption of cement…………………………………………….19 Figure 2.11a Energy intensity of transport…………………………………………………… 21 Figure 2.11b Specific fuel consumption of new cars (litres/100km)………………………… 21 Figure 2.12 Household unit electricity consumption………………………………………... 22 Figure 2.13 Variation of the household unit electricity consumption………………………. 23 Figure 2.14 Electricity intensity in the service sector……………………………………….. 23 Figure 2.15 Share of each world in the total CO2 emissions in (1990 and 2002)…………… 24 Figure 2.16 Variation of CO2 emissions by world region (1990-2002) ……………………. 24 Figure 2.17 CO2 emissions per capita (2002)……………………………………………….. 25 Figure 2.18 CO2 intensity (1990-2002)………………………………………………………26 Figure 3.1 Countries covered by the WEC Survey on Energy Efficiency Policies……… 30 Figure 3.2 Gasoline prices / Prix de l’essence……………………………………………... 33 Figure 3.3 Share of tax in the price of gasoline……………………………………………. 34 Figure 3.4 Average diesel prices / Prix moyen du gazole…………………………………..34 Figure 3.5 Share of taxes in the price of diesel…………………………………………….. 35 Figure 3.6a Average electricity price (households)…………………………………………. 35 Figure 3.6b At purchasing power parities…………………………………………………… 36 Figure 3.7 Average electricity price (industry)…………………………………………….. 36 Figure 3.8 Share of taxes in the price of electricity (households)…………………………. 37 Figure 3.9 Countries with an energy efficiency agency…………………………………….38 Figure 3.10 Diffusion of labels and standards for refrigerators……………………………... 41 Figure 3.11 Equity participation and investments trough ESCOs…………………………... 50 Figure 3.12 Fund based on venture and seed capital (British Carbon Trust)……………….. 51 Figure 3.13 Example of an EPC scheme developed in the public sector…………………… 52 Figure 3.14 Guarantee funds………………………………………………………………… 53 Figure 3.15 Municipal revolving funds………………………………………………………55 Figure 3.16 Revolving fund with zero-interest loans to banks……………………………… 56 Figure 3.17 Frequency of Voluntary Agreements in the EU since 1990……………………. 60 Figure 3.18 Structural changes and autonomous energy efficiency in the voluntary agreements for CO2 -reduction in Germany…………………..64 Figure 3.19 Trade-off between implementation effort and impact of VAs/Nas…………….. 65 Figure 3.20 Countries with building regulations……………………………………………. 69 Figure 3.21 Countries with various types of regulations……………………………………. 71 Figure 3.22 Countries with economic incentives……………………………………………. 73

World Energy Council Energy Efficiency Policies and Indicators
99
Figure 3.23 Counties with fiscal incentives…………………………………………………. 74 Figure 3.24 Countries with audits schemes…………………………………………………. 76 Figure 3.25 Number of local information centres and advisers per capita………………….. 77
BOXES Box Title Page Box 1 Breakdown of the world by region /countries for the indicators analysis……….. 7 Box 2 Energy intensities at purchasing power parities…………………………………. 8 Box 3 Definitions and measurement of energy consumption.…………………………...9 Box 4 Final energy intensity at constant GDP structure.……………………………….16 Box 5 Evaluation of local energy information centres: the case of France…………….78
TABLES Table Title Page Table 1 Energy efficiency measures covered by the WEC survey………………………31 Table 2 Summary of various innovative funds………………………………………….. 49 Table 3 Beneficiary of energy efficiency funds………………………………………….57 Table 4 Examples of the different types of VAs/NAs…………………………………... 59 Table 5 Regional distribution of VAs/NAs from WEC questionnaire………………….. 60 Table 6 Characterisation of selected VA/NAs on energy efficiency and climate protection………………………………………………. 63

World Energy Council Energy Efficiency Policies and Indicators
100
ANNEX C LIST OF ACRONYMS & ABBREVIATIONS
CDM Clean Development Mechanism CEECs Central and Eastern European Countries CHP Combined Heat and Power CIS Commonwealth of Independent States CO2 Carbon Dioxide EBRD European Bank for Reconstruction and Development ESCO Energy Services Company EUROSTAT European Union’s Statistical Office EU European Union GDP Gross Domestic Product GEIS Global Energy Information System (www.worldenergy.org) GHG Greenhouse Gas GJ gigajoule Gt gigatonne GW gigawatt IMF International Monetary Fund IEA International Energy Agency km kilometre kW kilowatt kWh kilowatt hour m metre m2 square metre MEPS Minimum Energy Performance Standard MW megawatt MWh megawatt hours NICs Newly Industrialised Countries SO2 Sulphur Dioxide toe tonne of oil equivalent UNECE United Nations Economic Commission for Europe UNFCCC United Nations Framework Convention on Climate Change US$95 United States Dollar (1995 value) WEC World Energy Council
World Energy Council Energy Efficiency Policies and Indicators
101
BIBLIOGRAPHY111 Energy Efficiency Indicators And Policies Evaluations ADEME-SAVE-EnR (2002): Cross countries comparison on energy efficiency indicators (4 volumes), Paris ADEME-SAVE, Bosseboeuf D., Lapillonne B. (2004): Energy efficiency indicators in Central and Eastern Europe , Final report, Paris (Volumes 1 and 2) ADEME-SAVE (2000): Monitoring tools for energy efficiency in Europe, Paris ADEME, Bosseboeuf D., Lapillonne B., Eichhammer W.(1999): Energy efficiency indicators : the European experience, 167 p., Paris APERC (2001): Energy efficiency indicators: a study of energy efficiency indicators in APEC economies, p. 161, Tokyo APERC (2000): Energy efficiency indicators for industry in the APEC Region, p. 153, Tokyo Bosseboeuf D., Château B. (2000): The link between indicators and CO2 policies, UNFCCC workshop on policies and measures, Copenhagen, 2000 ECEEE (2003): Time to turn down energy demand, Summer Study, Stockholm ECEEE (2001): Further than ever from Kyoto? Rethinking energy efficiency can get us there, Summer Study, Paris EUROSTAT (2003): Energy efficiency indicators, Luxemburg IEA (2004): 30 years of energy use in IEA countries, p 211, Paris IEA (1997): Energy efficiency initiative, Energy policy analysis, vol 1 and 2, Paris IEA (1997): The link between energy and human activity, p 119, Paris WEC (2001), Moisan F, Bosseboeuf D. et al: Energy efficiency policies and indicators, 229 p., London WEC (2003): Drivers of the Energy Scene, London Efficiency Standards And Labelling For Electrical Appliances APEC (1999): Energy Efficient Strategies, Review of Energy Efficiency Test Standards and Regulation in APEC Member Economies, Main Report CECED (2000): CECED Voluntary Commitment on reducing energy consumption of domestic washing machines, 3rd annual report to the CEC, Aug 2000 Egan, K. (1999): Energy efficiency standards for electrical appliances: regulatory and voluntary approaches in the Philippines and Thailand, Compendium on Energy Conservation Legislation in Countries of the Asia and Pacific Region, United Nations ESCAP Egan, K., Du Pont, P. (1998): Asia's new standard for success: energy-efficiency standards and labelling programs in 12 Asian countries, IIEC report European Commission/DG TREN (2000): COLD II, The revision of energy labelling and minimum energy efficiency standards for domestic refrigeration appliances Geller, H., Goldstein D.,B., (1999): Equipment Efficiency Standards : Mitigating Global Climate Change at a Profit, Physics and Society, vol 28, n°2 Holt S. and Harrington L.(2003): Lessons from Australia's standards and labelling programme, ECEEE Summer Study, St Raphael IEA (2003): Cool appliances: Policy strategies for energy-efficient homes, Paris IEA (2000): Energy Efficiency labels and standards for appliances and equipment, Energy efficiency policy profiles, draft report, Paris Lin (2002): Appliances efficiency standards and labelling programmes in China, Annual Review of Energy and Environment, vol 27 Nadel S. (2003): Appliance & equipment efficiency standards in the US: Accomplishments, next steps and lessons learned, ECEEE Summer Study, St Raphael Thorne, J. , Kubo, T. & Nadel, S. (2000): Opportunity Knocks : capturing pollution reduction and consumer savings from updated appliance efficiency standards, ACEEE/ASAP, Washington World Bank (1996): Thailand - Promotion of electricity energy efficiency – GEF grant mid term review, East Asia and Pacific Regional Office
111 A complementary bibliography of national case studies is given in Annex 1
World Energy Council Energy Efficiency Policies and Indicators
102
Voluntary/ Negotiated Agreements OECD (1999): Voluntary Approaches for Environmental Policy: an Assessment, OECD, Paris OECD (2003): Voluntary Approaches for Environmental Policy – Effectiveness, Efficiency and Uses in Policy
Mixes, OECD, Paris (Available for purchase at www.sourceoecd.org) UNEP (2000): Voluntary initiatives: current status, lessons learnt and next steps. UNEP discussion paper
based on the UNEP Multi-Stakeholder Workshop on Voluntary Initiatives, 20 September 2000, Paris. See also the United Nations Environment Programme website on Voluntary Initiatives (www.uneptie.org/outreach/vi_home.htm)
ten Brink, P., ed. (2002): Voluntary Environmental Agreements: Process, Practice and Future Use. Sheffield, UK: Greenleaf Publishing Ltd. (www.greenleaf-publishing.com/catalogue/volun.htm)
IEA, International Energy Agency (1997): Voluntary Actions for Energy-Related CO2 Abatement. Paris: OECD/IEA
Price, L.; Worrell, E. (2002): Overview of Voluntary Agreements in the Industrial Sector, Energy Analysis Department, Environmental Energy Technologies Division, Lawrence Berkeley National Laboratory, July 2002 (eetd.lbl.gov/ea/ies/iespubs/vaoverview.pdf)
M.G. Rietbergen et al: Do Agreements Enhance Energy Efficiency Improvement? Analysing the Actual Outcome of Long-Term Agreements on Industrial Energy Efficiency Improvement in the Netherlands, Faculty of Chemistry, Department of Science, Technology and Society, Utrecht University, 2001
Böhringer, Ch. and Frondel, M.: Assessing Voluntary Commitments: Monitoring is Not Enough!, ZEW (Zentrum für Europäische Wirtschaftsforschung) Discussion Paper No. 02-62 (ftp://ftp.zew.de/pub/zew-docs/dp/dp0262.pdf)
Segerson, K. and T. J. Miceli (1998): Voluntary Environmental Agreements: Good or Bad News for Environmental Protection? Journal of Environmental Economics and Management, Vol. 36.
CEC (1996): Communication from the Commission to the Council and the European Parliament on Environmental Agreements, COM(96) 561 final, Brussels, 27.11.1996
Segerson, K. and Na Li (1999): Voluntary approaches to environmental protection. In: H. Folmer and T. Tietenberg (eds.) Yearbook of environmental and resource economics 1999/2000. Cheltenham, UK. Edward Elgar
Khanna, Madhu (2001): Non-Mandatory Approaches to Environmental Protection. Journal of Economic Surveys, Volume 15, No. 3
Orts, E.-W. and Deketelaere, K. (eds.) (2001): Environmental Contracts. Comparative Approaches to Regulatory Innovation in United States and Europe. Kluwer Law International, Dordrecht, the Netherlands
European Union (2003): Directive 2003/87/EC of the European Parliament and the Council of 13 October 2003 establishing a scheme for greenhouse gas emission allowance trading within the Community and amending Council Directive 96/61/EC
Regulation For New Buildings Australian Greenhouse Office (2000): International Survey of Building Energy Codes, ISBN 1 876536 32 2,
(www.greenhouse.gov.au/energyefficiency/buildings) Hui, S. C. M., (2000): Building energy efficiency standards in Hong Kong and mainland China, ACEEE
Summer Study on Energy Efficiency in Buildings, Pacific Grove, California CEC (2001): Proposal for a Directive of the European Parliament and of the Council on the energy
performance of buildings, COM(2001) 226 final, Brussels, 11.5.2001 (http://europa.eu.int/eur-lex/en/com/pdf/2001/en_501PC0226.pdf)
FhG-ISI (1999): A Comparison of Thermal Building Regulations in the European Union, MURE Database Case Study N° 1, Study carried out in the framework of the MURE project, financed by the SAVE Programme of the EC, http://www.mure2.com/Mr-fr5.htm
Local Energy Information Centres ADEME (2004): Première évaluation de l’activité de conseil des Espaces Info Energie Report prepared by
IDE, Paris, 143p ADEME (2003): Local energy information centres, report prepared by Predac, Paris
Energy Efficiency Funds Proceedings of the First European Conference on Energy Service Companies (ESCO),Milan, May 21-22 2003 ( http://energyefficiency.jrc.cec.eu.int)

World Energy Council Energy Efficiency Policies and Indicators – ANNEX 1
1
Annex 1
Case Studies on Energy EfficiencyPolicy and Measures

World Energy Council Energy Efficiency Policies and Indicators – ANNEX 1
2

World Energy Council Energy Efficiency Policies and Indicators – ANNEX 1
3
TABLE OF CONTENTS
LABELLING PROGRAMS AND EFFICIENCY STANDARDS FOR HOUSEHOLD APPLIANCES
European Union....................................................................................................................................................... 7 USA ......................................................................................................................................................................... 9 Brazil ..................................................................................................................................................................... 11 China ..................................................................................................................................................................... 13 Ghana .................................................................................................................................................................... 15
CASE STUDIES ON ENERGY EFFICIENCY FUNDS Dexia-Fondelec Fund ............................................................................................................................................ 19 Canada: Green Municipal Funds ........................................................................................................................... 23 UK: Carbon Finance From The Low Carbon Initiative Programme ..................................................................... 27 Thailand: Revolving Fund For Energy Conservation............................................................................................ 31 Germany – Berlin: Energy Saving Partnerships .................................................................................................... 34 France: Guarantee Fund For Energy Conservation Fogime .................................................................................. 38
VOLUNTARY AGREEMENTS
Australia ................................................................................................................................................................ 41 Germany ................................................................................................................................................................ 44 Netherlands............................................................................................................................................................ 49 European Union..................................................................................................................................................... 53 Finland................................................................................................................................................................... 57 Japan...................................................................................................................................................................... 63 National Allocation Plan and voluntary/ negotiated agreements........................................................................... 65
LOCAL ENERGY EFFICIENCY INFORMATION CENTRES Belgium ................................................................................................................................................................. 71 China ..................................................................................................................................................................... 72 Denmark ................................................................................................................................................................ 73 France .................................................................................................................................................................... 74 UK ....................................................................................................................................................................... 75 Italy ....................................................................................................................................................................... 76 Japan...................................................................................................................................................................... 78 Mexico................................................................................................................................................................... 79

World Energy Council Energy Efficiency Policies and Indicators – ANNEX 1
4

World Energy Council Energy Efficiency Policies and Indicators – ANNEX 1
5
Prepared by P. Menanteau, LEPII-EPE
Labelling programs and efficiencystandards for household appliances

World Energy Council Energy Efficiency Policies and Indicators – ANNEX 1
6
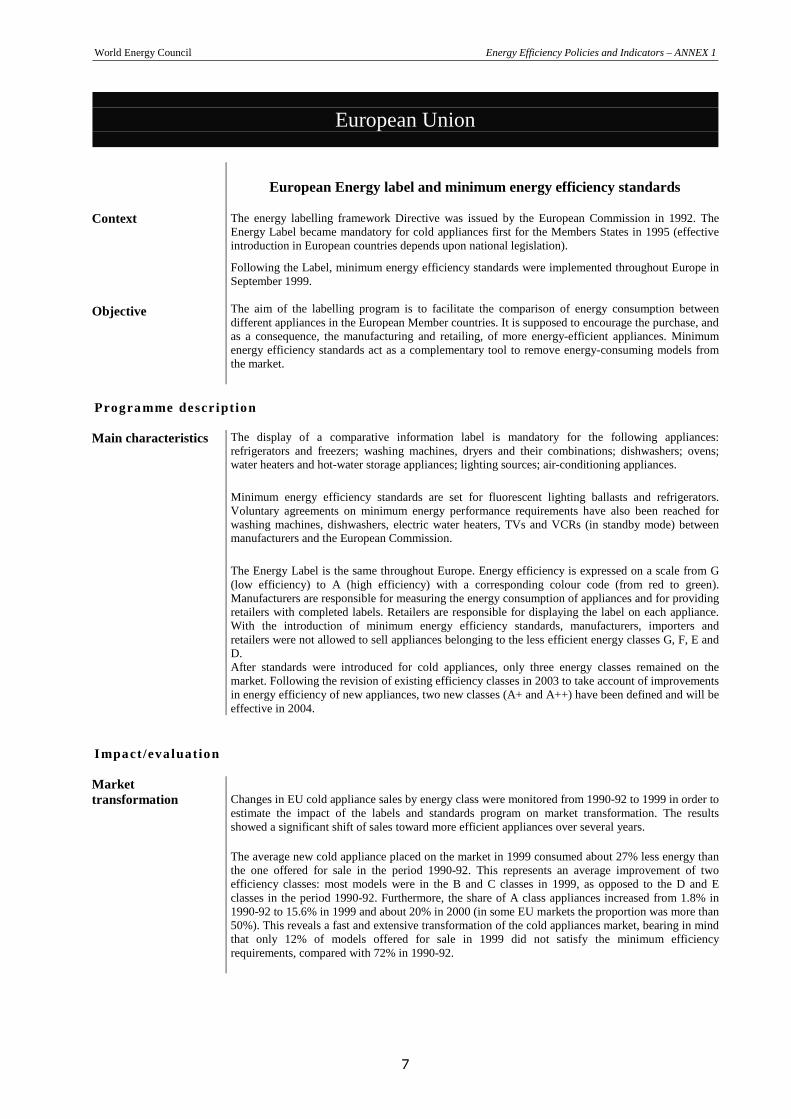
World Energy Council Energy Efficiency Policies and Indicators – ANNEX 1
7
European Union
European Energy label and minimum energy efficiency standards Context The energy labelling framework Directive was issued by the European Commission in 1992. The
Energy Label became mandatory for cold appliances first for the Members States in 1995 (effective introduction in European countries depends upon national legislation).
Following the Label, minimum energy efficiency standards were implemented throughout Europe in September 1999.
Objective
The aim of the labelling program is to facilitate the comparison of energy consumption between different appliances in the European Member countries. It is supposed to encourage the purchase, and as a consequence, the manufacturing and retailing, of more energy-efficient appliances. Minimum energy efficiency standards act as a complementary tool to remove energy-consuming models from the market.
Progra mme descr iption Main characteristics The display of a comparative information label is mandatory for the following appliances:
refrigerators and freezers; washing machines, dryers and their combinations; dishwashers; ovens; water heaters and hot-water storage appliances; lighting sources; air-conditioning appliances.
Minimum energy efficiency standards are set for fluorescent lighting ballasts and refrigerators. Voluntary agreements on minimum energy performance requirements have also been reached for washing machines, dishwashers, electric water heaters, TVs and VCRs (in standby mode) between manufacturers and the European Commission.
The Energy Label is the same throughout Europe. Energy efficiency is expressed on a scale from G (low efficiency) to A (high efficiency) with a corresponding colour code (from red to green). Manufacturers are responsible for measuring the energy consumption of appliances and for providing retailers with completed labels. Retailers are responsible for displaying the label on each appliance. With the introduction of minimum energy efficiency standards, manufacturers, importers and retailers were not allowed to sell appliances belonging to the less efficient energy classes G, F, E and D. After standards were introduced for cold appliances, only three energy classes remained on the market. Following the revision of existing efficiency classes in 2003 to take account of improvements in energy efficiency of new appliances, two new classes (A+ and A++) have been defined and will be effective in 2004.
Impact/eva luation
Market transformation Changes in EU cold appliance sales by energy class were monitored from 1990-92 to 1999 in order to
estimate the impact of the labels and standards program on market transformation. The results showed a significant shift of sales toward more efficient appliances over several years.
The average new cold appliance placed on the market in 1999 consumed about 27% less energy than the one offered for sale in the period 1990-92. This represents an average improvement of two efficiency classes: most models were in the B and C classes in 1999, as opposed to the D and E classes in the period 1990-92. Furthermore, the share of A class appliances increased from 1.8% in 1990-92 to 15.6% in 1999 and about 20% in 2000 (in some EU markets the proportion was more than 50%). This reveals a fast and extensive transformation of the cold appliances market, bearing in mind that only 12% of models offered for sale in 1999 did not satisfy the minimum efficiency requirements, compared with 72% in 1990-92.

World Energy Council Energy Efficiency Policies and Indicators – ANNEX 1
8
Energy savings As a consequence of the program, the average energy consumption of cold appliances declined from 450 kWh/yr in 1990-92 to an estimated 364 kWh/yr immediately after the introduction of the standards at the end of 1999. The impact on the overall energy consumption of cold appliances is difficult to evaluate as it would involve estimating hypothetical electricity increases and efficiency improvements had no efficiency measures been implemented. According to recent studies, the EU electricity consumption of cold appliances declined from 124 TWh in 1990 to 118 TWh in 1995 and could reach 96 TWh in 2010 taking into account existing programs. With new policy measures introduced after 2000 (new efficiency classes and standards) these savings could be further increased and the electricity consumption of cold appliances could reach 81 TWh. For the overall electricity consumption of household appliances, the difference between the business-as-usual scenario and the enhanced policy scenario would be of 156 TWh in 2010 (591 TWh in 1990, 618 TWh in 1995 and 723 TWh in BaU scenario) (Waide, 2001).
Public costs No evaluation of the administrative costs of EU appliance programs has been published yet. A tentative estimation by the International Energy Agency of the national budgets for the implementation of labels and standards programs in different countries gives similar results for the EU, Australia and Canada (about 3 to 5 government man years and 4 to 6 consultant man year in 2000). However, it is not clear whether these estimates include the costs of the different studies conducted before implementation and the reinforcement of the label and standards programs.
Problems / adaptations Following the introduction of minimum energy performance standards for cold appliances, there
were only three classes left and no incentives remained for manufacturers to introduce new more efficient models. The creation of two new classes (A+ and A++) to be introduced in 2004 may be an interim arrangement but a comprehensive revision of the energy labelling classes must take place afterwards.
As far as standards are concerned, the future of the program does not seem to be assured in its present form. Most manufacturers are opposed to the continuation of minimum energy performance standards and favour the adoption of voluntary agreements, which they claim offer greater flexibility with comparable impacts. These difficulties encountered by the earlier and most effective appliance efficiency program in the EU do not necessarily mean calling into question the whole program but more likely a move toward less ambitious energy efficiency targets for cold appliances.
References International Energy Agency, 2003, Cool Appliances, Policy strategies for energy-efficient homes,
OCDE/AIE, Paris. Waide, P., 2001, "European Evaluation Experience", Lessons Learned in Asia: Regional Symposium on Energy Efficiency Standards and Labelling, United Nations, 29-31 May 2001 Bangkok, Thailand Bertoldi, P., "Effective policies and measures in energy efficiency in end-use equipment and industrial processes", Workshop on good practices in Policies and Measures, 8-10 October 2001, Copenhagen.
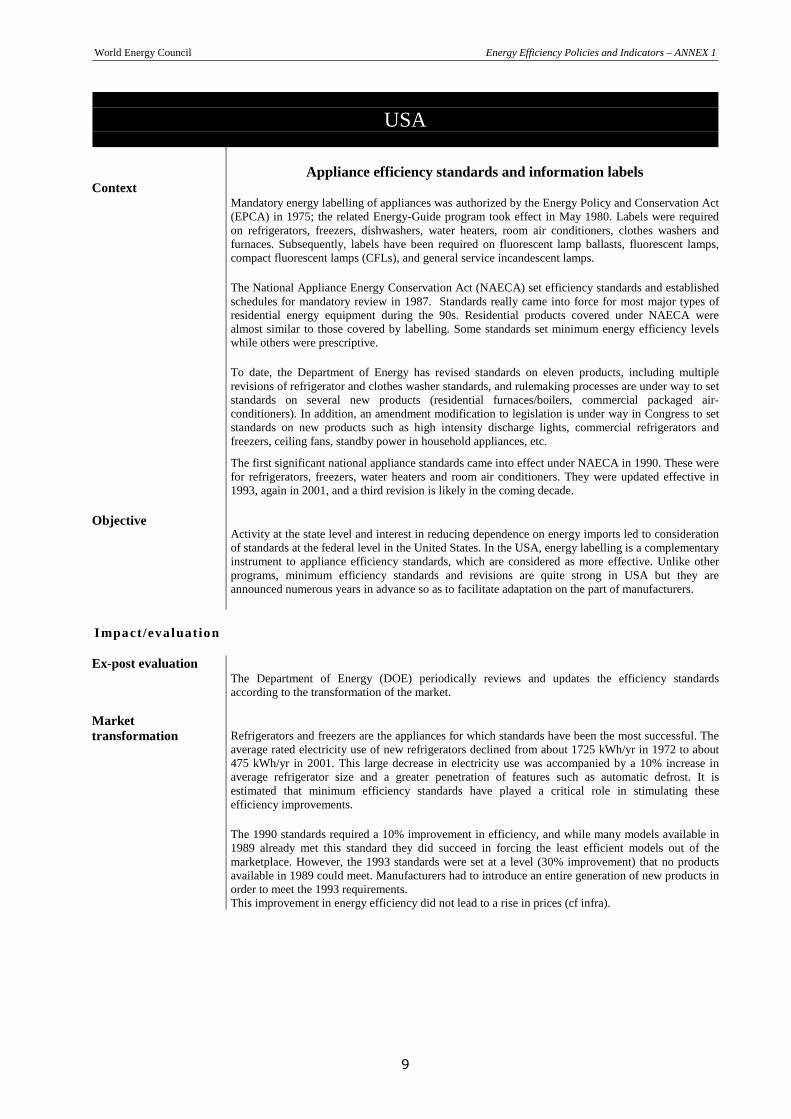
World Energy Council Energy Efficiency Policies and Indicators – ANNEX 1
9
USA
Appliance efficiency standards and information labels Context
Mandatory energy labelling of appliances was authorized by the Energy Policy and Conservation Act (EPCA) in 1975; the related Energy-Guide program took effect in May 1980. Labels were required on refrigerators, freezers, dishwashers, water heaters, room air conditioners, clothes washers and furnaces. Subsequently, labels have been required on fluorescent lamp ballasts, fluorescent lamps, compact fluorescent lamps (CFLs), and general service incandescent lamps.
The National Appliance Energy Conservation Act (NAECA) set efficiency standards and established schedules for mandatory review in 1987. Standards really came into force for most major types of residential energy equipment during the 90s. Residential products covered under NAECA were almost similar to those covered by labelling. Some standards set minimum energy efficiency levels while others were prescriptive.
To date, the Department of Energy has revised standards on eleven products, including multiple revisions of refrigerator and clothes washer standards, and rulemaking processes are under way to set standards on several new products (residential furnaces/boilers, commercial packaged air-conditioners). In addition, an amendment modification to legislation is under way in Congress to set standards on new products such as high intensity discharge lights, commercial refrigerators and freezers, ceiling fans, standby power in household appliances, etc.
The first significant national appliance standards came into effect under NAECA in 1990. These were for refrigerators, freezers, water heaters and room air conditioners. They were updated effective in 1993, again in 2001, and a third revision is likely in the coming decade.
Objective
Activity at the state level and interest in reducing dependence on energy imports led to consideration of standards at the federal level in the United States. In the USA, energy labelling is a complementary instrument to appliance efficiency standards, which are considered as more effective. Unlike other programs, minimum efficiency standards and revisions are quite strong in USA but they are announced numerous years in advance so as to facilitate adaptation on the part of manufacturers.
Impact/eva luation
Ex-post evaluation The Department of Energy (DOE) periodically reviews and updates the efficiency standards according to the transformation of the market.
Market transformation Refrigerators and freezers are the appliances for which standards have been the most successful. The
average rated electricity use of new refrigerators declined from about 1725 kWh/yr in 1972 to about 475 kWh/yr in 2001. This large decrease in electricity use was accompanied by a 10% increase in average refrigerator size and a greater penetration of features such as automatic defrost. It is estimated that minimum efficiency standards have played a critical role in stimulating these efficiency improvements.
The 1990 standards required a 10% improvement in efficiency, and while many models available in 1989 already met this standard they did succeed in forcing the least efficient models out of the marketplace. However, the 1993 standards were set at a level (30% improvement) that no products available in 1989 could meet. Manufacturers had to introduce an entire generation of new products in order to meet the 1993 requirements. This improvement in energy efficiency did not lead to a rise in prices (cf infra).

World Energy Council Energy Efficiency Policies and Indicators – ANNEX 1
10
Energy savings According to a study made by the DOE and LBNL, the energy and demand savings from standards in relation to projected trends are substantial. In 2000, compared with projected efficiencies without regulation, the national standards reduced electricity consumption by 88 TWh, which was 2.5% of electricity use. Energy efficiency standards have also had a considerable impact on peak electricity demand. In 2000, the standards reduced the peak demand by approximately 21 000 MW, which is about 2.8% of installed generating capacity. This reduction in energy consumption corresponds to a reduction of carbon dioxide emissions of 25 MtC (1.7% of total emissions).
These savings are expected to increase in the future. According to a DOE/LBNL estimate, standards already set will reduce electricity consumption by 341 TWh (7.8% of projected use in 2020) and reduce peak electricity demand by 120 000 MW (more than 10% of projected demand for 2020). Already enacted standards are estimated to bring discounted benefits to consumers of about $180 billion net (i.e. discounted savings minus discounted costs to consumers) for products purchased by 2030. The average benefit-to-cost ratios of these standards are about 3 to 1. It is important to note that these figures are based on incremental cost estimates made before the standards took effect; recent analyses have found that actual price increases have been much lower that anticipated and, as a consequence, benefits could be higher than expected.
Public costs Public costs related to standards are generally considered low, but the problems encountered by the US Department of Energy in reinforcing existing standards have shown that the budgetary question was not insignificant. The limited information that is available on public costs suggests Federal government program expenditure of $200-250 million over the past 20 years in developing and implementing these standards.
Problems / adaptations According to recent evaluations, the US information labelling program was difficult for some
consumers to understand and appears to have had little impact on sales. As a result, proposals to overhaul the program are being discussed. The DOE encountered serious organizational, budgetary and analytical problems in reviewing and updating standards in the early 90s. Responding to manufacturers concerns, Congress issued a one-year moratorium in 1996 on proposing or issuing energy conservation standards
Accompanying measures
The Energy Star endorsement label used to identify products with higher than average energy efficiency has been more successful for computers and electronic and other office equipment. An estimated 80 to 99% of personal computers, monitors and printers sold in 1999 were labelled models, and 45-95% of the TVs, video recorders, and DVD players in 2002. However the impact is more limited for other appliances: in 2001 the market share of Energy Star dishwashers, room air conditioners and refrigerators was no more than 15-20%.
References
Nadel S., 2003, Appliance and equipment efficiency standards in the US: Accomplishments, next steps and lesson learned, ECEEE 2003 Summer Study – Time to turn down energy demand, St Raphael.
Nadel S., 2002, Appliance and equipment efficiency standards, Annual Review of Energy and the Environment, Nov 2002, Vol. 27, pp. 159-192
Wiel S. and McMahon J., 2003, "Governments should implement energy-efficiency standards and labels – cautiously", Energy Policy 31.

World Energy Council Energy Efficiency Policies and Indicators – ANNEX 1
11
Brazil
Label and minimum energy efficiency standards
Context The Brazilian Labelling Programme - PBE was implemented in 1984. After the energy crisis in early
2001 the government introduced a new law in October 2001 to allow for the introduction of minimum energy performance standards for all energy consuming equipment (Lei 10.295).
Objective
The objective of the labelling programme is to inform consumers on the energy efficiency of energy- consuming devices, including electrical appliances. The PBE provides information on the most common appliances and allows consumers to assess the energy consumption and identify the most efficient ones. Eletrobras, the national electric utility, and Petrobras, the national petroleum company, both participate in the program through their respective programs for energy efficiency : Programa Nacional de Conservaçao de Energia Elétrica – PROCEL and Programa Nacional de Racionalizaçao do Uso dos Derivados do Petroleo e do Gas Natural – Conpet.
Progra mme descr iption Main characteristics The labelling programme presently covers 25 different products, including refrigerators, freezers,
electric water heaters, showers, compact fluorescent lamps, incandescent lamps, air conditioners, electric motors, solar collectors, solar water storage tanks, electromagnetic reactors, among others; at least 20 more appliances should be labelled in the coming years. Participation in the PBE is on a voluntary basis. Some of the products labelled by PBE, such as refrigerators, freezers, air conditioners, lamps, showers and solar collectors are subject to different test procedures and then ranked according to its position on an energy efficiency scale for similar products. The format of the label is similar to that of the European energy label (cf. figure 1) : the products are ranked in seven energy efficiency classes from G (the least efficient) to A (the most efficient). Others such as electric motors, electromagnetic reactors and solar water storage tanks are not ranked. For them is set a minimum efficiency level by PBE they have to attend. In parallel to this comparison labelling programme, the endorsement label Procel (Selo Procel de Economia de Energia) has been granted on a yearly basis since 1993 to the most efficient appliances already labelled under the PBE program ; the endorsement label is awarded according to the recommendations of a technical committee to the appliances which belong to the PBE "A class" and to those that attend an efficiency level set by PROCEL. The objective of this label is to facilitate the identification by the consumer of the most efficient appliances in order to permanently stimulate technical innovation among manufacturers and raise the quality of Brazilian appliances to the international level. After the energy crisis in early 2001 the Brazilian government introduced a new law in October 2001. The law allows for the construction and setting of minimum energy performance standards for all energy consuming equipment commercialised in the country (Lei 10.295). A board was created to help implement the law (CGIEE). It aims to define indicators and manage energy efficiency standards. At the end of 2003, minimum efficiency standards were introduced for electric motors and others should be set soon for air conditioners, refrigerators and lighting equipment.
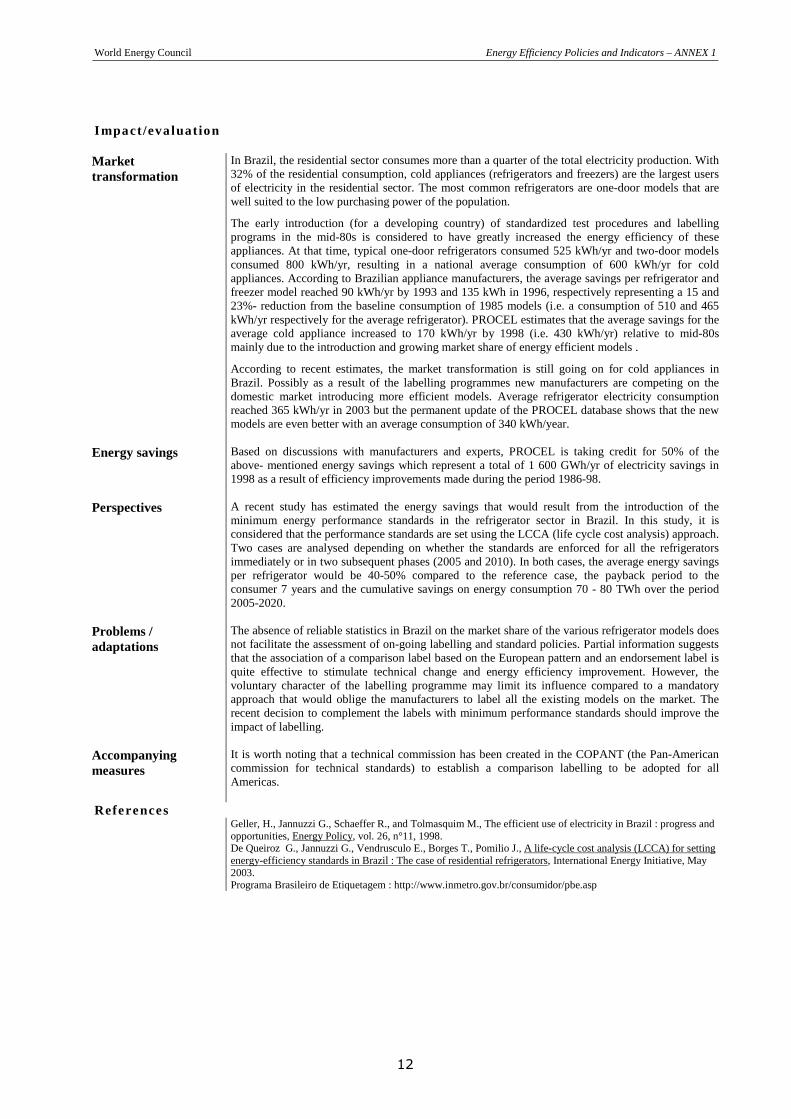
World Energy Council Energy Efficiency Policies and Indicators – ANNEX 1
12
Impact/eva luation
Market transformation
In Brazil, the residential sector consumes more than a quarter of the total electricity production. With 32% of the residential consumption, cold appliances (refrigerators and freezers) are the largest users of electricity in the residential sector. The most common refrigerators are one-door models that are well suited to the low purchasing power of the population.
The early introduction (for a developing country) of standardized test procedures and labelling programs in the mid-80s is considered to have greatly increased the energy efficiency of these appliances. At that time, typical one-door refrigerators consumed 525 kWh/yr and two-door models consumed 800 kWh/yr, resulting in a national average consumption of 600 kWh/yr for cold appliances. According to Brazilian appliance manufacturers, the average savings per refrigerator and freezer model reached 90 kWh/yr by 1993 and 135 kWh in 1996, respectively representing a 15 and 23%- reduction from the baseline consumption of 1985 models (i.e. a consumption of 510 and 465 kWh/yr respectively for the average refrigerator). PROCEL estimates that the average savings for the average cold appliance increased to 170 kWh/yr by 1998 (i.e. 430 kWh/yr) relative to mid-80s mainly due to the introduction and growing market share of energy efficient models .
According to recent estimates, the market transformation is still going on for cold appliances in Brazil. Possibly as a result of the labelling programmes new manufacturers are competing on the domestic market introducing more efficient models. Average refrigerator electricity consumption reached 365 kWh/yr in 2003 but the permanent update of the PROCEL database shows that the new models are even better with an average consumption of 340 kWh/year.
Energy savings Based on discussions with manufacturers and experts, PROCEL is taking credit for 50% of the above- mentioned energy savings which represent a total of 1 600 GWh/yr of electricity savings in 1998 as a result of efficiency improvements made during the period 1986-98.
Perspectives A recent study has estimated the energy savings that would result from the introduction of the minimum energy performance standards in the refrigerator sector in Brazil. In this study, it is considered that the performance standards are set using the LCCA (life cycle cost analysis) approach. Two cases are analysed depending on whether the standards are enforced for all the refrigerators immediately or in two subsequent phases (2005 and 2010). In both cases, the average energy savings per refrigerator would be 40-50% compared to the reference case, the payback period to the consumer 7 years and the cumulative savings on energy consumption 70 - 80 TWh over the period 2005-2020.
Problems / adaptations
The absence of reliable statistics in Brazil on the market share of the various refrigerator models does not facilitate the assessment of on-going labelling and standard policies. Partial information suggests that the association of a comparison label based on the European pattern and an endorsement label is quite effective to stimulate technical change and energy efficiency improvement. However, the voluntary character of the labelling programme may limit its influence compared to a mandatory approach that would oblige the manufacturers to label all the existing models on the market. The recent decision to complement the labels with minimum performance standards should improve the impact of labelling.
Accompanying measures
It is worth noting that a technical commission has been created in the COPANT (the Pan-American commission for technical standards) to establish a comparison labelling to be adopted for all Americas.
References Geller, H., Jannuzzi G., Schaeffer R., and Tolmasquim M., The efficient use of electricity in Brazil : progress and
opportunities, Energy Policy, vol. 26, n°11, 1998. De Queiroz G., Jannuzzi G., Vendrusculo E., Borges T., Pomilio J., A life-cycle cost analysis (LCCA) for setting energy-efficiency standards in Brazil : The case of residential refrigerators, International Energy Initiative, May 2003. Programa Brasileiro de Etiquetagem : http://www.inmetro.gov.br/consumidor/pbe.asp

World Energy Council Energy Efficiency Policies and Indicators – ANNEX 1
13
China
Energy efficiency standards and labelling Context China first enacted minimum energy performance standards in 1989 for eight residential products
including, refrigerators, clothes washers and air-conditioners as well as less energy-consuming appliances such as fans, rice cookers, televisions, radio receivers and recorders, and irons. Since the publication of the first set of standards in 1989, China has revised or introduced new minimum energy performance standards for different products:
- fluorescent lamp ballasts in 1999 - cold appliances and room air conditioners in 1999 and 2000 respectively - compact and linear fluorescent lamps, and clothes washers (planned for 2003)
Development of standards for televisions, central air-conditioners, water heaters, cooking and other gas appliances has begun.
Until 1999, there was no labelling system in China. A voluntary endorsement-type energy efficiency labelling system, which first applied to refrigerators, was introduced in China in August 1999. There is a project under way to develop a mandatory comparative labelling system based on the European energy label.
Objective
Appliance standards and labels play a significant role in China's new energy efficiency policy. The new Energy Conservation Law has highlighted the importance of end-use energy efficiency (the average annual growth rate of Chinese electricity consumption between 1980 and 2000 was 8% overall and 16% for residential uses). As a consequence, the introduction of new or revised standards has been stepped up in recent years. It is expected that standards and labels will help to slow down the increase in electricity consumption of appliances, which has been stimulated by the rapid penetration of major home appliances in Chinese urban households: by 2001, colour TV ownership had reached 121 units per 100 urban households. Similarly, ownership levels had reached 92 for clothes washers, 82 for refrigerators and 36 for room air conditioners.
The development of a comprehensive program of standards and labelling in the appliances sector is all the more important since China has become the largest appliance producer in the world (by volume). Setting efficiency standards for home appliances may thus influence not only national electricity consumption but also the characteristics of the products exported to other markets without standards.
Progra mme descr iption Main characteristics China is considered to have developed one of the most comprehensive appliance standard and
labelling programs in the developing world. The program includes the following aspects: - minimum energy efficiency standards. They are mandatory and concern 9 types of
appliance and lighting products. - voluntary endorsement labelling: voluntary labelling has been applied to 15 types of
appliances, lighting and industrial products. - mandatory information label: the label could be implemented as a pilot program in 2003 or
2004.
Impact/evaluation
Energy savings The impacts of China's appliance standard and labelling programs are still not well documented. Due to the lack of historical data on appliance efficiency, it is impossible or at best difficult to estimate the impact of the standards. This problem is not specific to China; it will be found in almost all the developing countries where quantitative data on appliance efficiency is recent or non-existent. However, one of the most recent assessments of China's efficiency standards program (Li, 2002) considers that existing Chinese standards and labelling requirements for refrigerators and room air

World Energy Council Energy Efficiency Policies and Indicators – ANNEX 1
14
conditioners are already having a substantial impact in slowing the growth of residential electricity demand. By the end of the decade, existing standards and labels in China for the most common appliances could reduce residential electricity consumption by 33.5 TWh/year, or 9% of forecast residential electricity consumption in 2010 (Li, 2002). These savings correspond in China to 11 MtC.
At the same time, an energy conservation label has been developed and implemented for refrigerators. In 1999, the label was attributed to 103 models of refrigerators and, in 2000, to 203 models. These models consumed on average 18% less electricity than non-labelled products. In 2000, the label was also given to air conditioners, followed by other products including fluorescent lamp ballasts, electric water heaters and microwave ovens. This voluntary certification program has produced considerable results through the enthusiastic commitment of manufacturers.
Lessons
One might expect the impacts of existing labels and standards to be huge because of the size of the
Chinese population and the high ownership ratios of electric appliances among urban households. But the required unitary improvements in energy efficiency are rather limited and in fact the standards prohibit only the least efficient products. Thus, the first standards were apparently not very effective in transforming the market because they were too weak: about 95% of the equipment already met the standard at the time of promulgation.
As far as refrigerators are concerned, the first set of standards was considered not very effective, while the revised standards would reduce the energy consumption of the most popular refrigerators by only 10 to 15%. The new standards for fluorescent lamp ballasts are also considered to be modest and the improvement in the energy efficiency ratio resulting from the room air conditioner standards is no more than 8%.
A still significant efficiency gap exists between appliances sold in China and those sold in developed countries: the standard Chinese refrigerator uses 2.5 kilowatt-hours per litre of volume per year compared with 1.5 kWh/l for European refrigerators.
References
Lin, J., "Made for China: Energy efficiency standards and labels for households appliances", LBNL, China
Energy Group, Sinosphere, Nov. 2002, http://china.lbl.gov/pubs/appstd_sino_nov02.pdf Lin, J., "Appliances efficiency standards and labelling programs in China", Annual Review of Energy and Environment, 2002.

World Energy Council Energy Efficiency Policies and Indicators – ANNEX 1
15
Ghana Context The abundant supply of hydropower in Ghana has historically resulted in a long period of low
electricity tariffs and little interest in energy efficiency. In turn, low tariffs have stimulated a dramatic growth in demand that in the 80's and 90's largely outpaced supply. As a consequence, drought at the end of the 1990's resulted in a serious energy crisis with power shortages and rolling blackouts. The energy crisis in Ghana coincided with a rapid increase in ownership ratio of major appliances such as refrigerators, air conditioners and lighting equipment, with the risk of a massive importation of low-cost inefficient appliances exacerbating the energy supply problem. This has led the Ghanaian authorities to promote energy efficiency as a key strategy to meet the country’s growing energy needs and to pave the way for setting up the first appliance standard regulations in Sub-Saharan Africa.
Progra mme descr iption Main characteristics Efficiency standards have not yet been implemented in Ghana. The label and test procedure for room
air conditioners was officially published in December 2001. It is the first of a series of five scheduled efficiency standards that will be developed under the initial program. These standards concern room air conditioners, refrigerators, lighting systems, deep freezers and industrial motors. After some debate, it was decided to focus first on room air conditioners. This equipment was chosen in preference to refrigerators for fear that efficiency standards on a very popular appliance might have negative financial consequences for low income households. It has been agreed that the standards for air conditioners will be implemented first, followed by standards for lighting systems, refrigerators and deep freezers, in that order. In 2002, the following schedule was recommended for room air-conditioners by the Technical Committee on Standards:
- adoption by the Parliament of a legislation enforcing standards, - introduction of mandatory labels on air conditioners exported to Ghana - creation of a testing and certifying facility that will check the conformity of air conditioners
with the new standards - full enforcement of standards from January 2005 - expansion of standards to the neighbouring countries.

World Energy Council Energy Efficiency Policies and Indicators – ANNEX 1
16
Impact/eva luation
Ex-post evaluation Of course, no evaluation of the impact of the standard and label program is available yet. It is nevertheless possible to estimate its impact on energy consumption taking into account the development of household appliance ownership and the impact of standards on the energy efficiency ratio. According to a study conducted by experts from LBNL using a new analysis model, compliance with the room air conditioners standard in 2003 would free up 13 MW of generating capacity and 150 MW by 2013. Over 30 years, the amount of carbon saved would amount to 2.8 MtC. Moreover, the standard would save Ghanaian consumers an average of $64 million/year and the payback period on the incremental investment would not exceed 9 months.
References CLASP, Transforming the West African Market for Energy Efficiency: Ghana leads the way with mandatory
standards and labels, draft April 2002, http://www.clasponline.org/download/Air_conditioner/2002/246/CLASP_Ghana_Draft.pdf

World Energy Council Energy Efficiency Policies and Indicators – ANNEX 1
17
Prepared by J.Lopez and E. Métreau, ICE
Case studies on energy efficiencyfunds

World Energy Council Energy Efficiency Policies and Indicators – ANNEX 1
18

World Energy Council Energy Efficiency Policies and Indicators – ANNEX 1
19
Dexia-Fondelec Fund Geographical area Central and Eastern European Countries but consideration of the investments in all of the Bank’s
countries of operation.
Context The energy intensity is decreasing in almost every country region mainly due to structural evolutions of the economy (less industry, more services) and not to an improvement of energy efficiency. The energy saving potential is considerable and very largely under-exploited. If the whole countries of adhesion had in 2001 a primary energy intensity equal to that of the EU for the same year, their total primary energy consumption would be of 63 % of their present consumption.
Objective
To promote investments in energy conservation and renewable energy valorisation in the countries of the ex-East-block and to contribute to the reduction of the greenhouse gas emissions. The investment strategy of the fund includes the valorisation of these emission reductions in the form of carbon credits.
Lifetime 2000-2010 with a possibility of 2 years extension. For the fund manager, this period corresponds to 2 phases of activity: 4 years of investment period and 6 years of exist period.
Sponsors
Specialized investors. The minimum investment in the funds is one million Euro. The investors of the funds are: • the BERD, at 20 M€ (28% of the capital); • DEXIA (via its subsidiary company Dexia Public Finances Bank), at 20 M€ (28% of the
capital); • KPIC Singapore, Kansai Electric and MARUBENI Corporation at 10 M€ each one (14% of
the capital for each one); • Mitsui & Co Europe (for 1 M€); • Fondelec C.E.E. Corp. management (at 0,1 M€).
The French Global Environment Fund (FFEM) support the fund by covering part if the additional cost of the operations arrangement in a region which, although in progress at the economic and legal level, still remains difficult to access regarding private business.
Fund Management
The management of the Dexia-Fondelec fund is ensured by Fondelec Clean Energy Efficiency Management Corp. FondElec Group Inc. is a private equity investment firm with five funds under management and more than $250 million of investment capital. The group is a global energy, communications and technology investor. The firm was founded in 1992 to capitalize on the rapid growth of worldwide market electricity, utility, technology and communications businesses.
Beneficiaries / projects
Projects of small and average sizes in a fork of investment from 1 to 10 M€, which: • improve energy efficiency in existing plants and equipment, e.g. plant retrofits and fuel
conversions, heat recovery systems, electric transmission grids, gas and district heating system improvements, illumination, other public facilities and industrial energy efficiency enhancement;
• valorise the use of renewable energy.
Until now, the fund has more developed operations from the first category. The "renewable" projects (two projects to date) are projects of biomass valorisation. The funds managers have the will to enlarge their "renewable" portfolio to other types of energy (wind and hydraulic in particular). Minimum profitability objective: 20% / Expected average internal rate of return: 20%
World Energy Council Energy Efficiency Policies and Indicators – ANNEX 1
20
Mechanism Description
Project Selection The projects on which the fund wishes to invest are subjected to DEXIA and the BERD (principal investors of the funds) for opinion. The two sponsors have fifteen days to give an opinion. If the opinion is favourable, the project is submitted to the Investment Committee. If it is negative, the fund manager can nevertheless present the project at the Investment Committee but with the mention "project refused by the sponsor".
Mode of intervention The fund can intervene either directly on an energy conservation project or a renewable energy production project (heat network, industrial process, etc.) or through equity participation in companies (existing or new) specialized in the realisation of this type of projects (ESCOs). The fund, through an ESCO, enters into contracts with individual companies or municipalities to provide the capital, project build-out, and ongoing technical monitoring for specific projects. The increased income resulting from the installation of new equipment, as mandated in the energy service contract, will be split in a manner that allows the fund to receive a return on its investment.
Project illustration Example of direct intervention: in Poland, in the town of Gorlice, the fund intervened for the
retrofitting and the optimisation of the heat production infrastructures of the district heating company, EC. Gorlice. The funds brought 3,7 M€ in capital and 3,3 M€ in convertible debt to the company. The resources thus invested allowed the realisation of energy conservation operations on the heat generating stations, the putting into commission of an existing turbine of 7 MWe and of a cogeneration plant, as well as the extension of the heat network to new industrial and residential customers.
Example of intervention through specialised companies: in Hungary, the fund repurchased in December 2000 the consulting and engineering company in energy technology EETEK Limited. This company then was capitalized and transformed into an energy service company (ESCO). EETEK is now able to reach potential customers, to lead feasibility studies for the realisation of energy efficiency projects or renewable energy valorisation projects, to finance and carry out the investment operations identified in an turn-key approach and to refund them on the energy savings realised. On this basis, EETEK developed a project portfolio in the private and public sectors (industry, hospital, street lighting, networks of heats, etc).
Follow-up At the level of the fund management, the decision-making process relies on an extremely "compact" method: the president and the general manager of Fondelec intervene personally on the ground. They ensure a maintained presence in Poland and Hungary, as in the other countries where the fund seeks to develop operations. In Poland and Hungary where most of the investment operations was carried out, Fondelec detached an associate who, from day to day, ensures the follow-up of the projects at the administrative and financial level. This restricted team takes the whole decisions relating to the management of the investment operations carried out and to the new investments and organises the work and the studies of canvassing new opportunities of investment. The canvassing work of the manager in the countries where the funds has not invested yet can imply external consultants. From the end 2001, subsidiary companies or representations of the ESCO EETEK Hungary (developed by the fund) were created in Bulgaria, Croatia and Slovakia. In 2003, such structures were installed in Poland and Romania.
On the level of the projects in which the fund invested (projects in existing companies like Gorlice or Mielec or ESCO creation projects), the fund relies on a highly qualified local "management" (experienced in working at international scale, excellent level of English) and generally young person. If the persons in charge of the technical directions are specialists of the energy sector, the base of recruitment for the posts of the development, investment and finance management is diversified.

World Energy Council Energy Efficiency Policies and Indicators – ANNEX 1
21
Figure 1 – Description of DEXIA – Fondelec fund mechanism
Outcomes
Project portfolio At geographical level: the fund operations concentrated initially in Poland and Hungary. In 2002 and especially 2003, the activities widened to Bulgaria, Croatia and Slovakia. In 2003, a first energy performance contract was signed for an amount of 2,3 M€ in Croatia. In Bulgaria and Slovakia, the first operations are also being negotiated.
At customers’ level: the fund carried out operations in the public sector and the municipal infrastructures (hospital, street lighting), in the industry (chemistry sector, wood industry, automobile components and equipment) and in the district heating sector. In the public and municipal sector, the projects relate to energy efficiency improvement in perennial activity sectors (health, lighting, heating, electricity). In the industrial sector, the projects aimed to improve the financial performance of production activities with outlets both on the national market and the export market.
On the level of the projects’ technical contents and legal and financial arrangement: cogeneration projects, ESCOs creation projects and equity participation in existing energy service companies, repurchases of performance contracts from other ESCOs, projects of renewable energy valorisation as well as projects of recovery and/or delegated management of energy installations.
Financial volumes /
Total projects to date At present, the amount of capital engaged by the partners of the fund goes up to 71 M€. In term of
investment, 40 M€ were already called for the financing of nine projects.
Company that implement EE or EnR operations
Company that implement EE or EnR operations
Company that implement EE or EnR operations
Support to
creation
Direct intervention
Indirect intervention
DEXIA-FONDELEC FUND
SPONSORS
� the Berd (20 M€) � Dexia (20 M€)
� KPIC Singapore, Kansai Electric and Marubeni (30 M€),
� Mitsui and Co Europe (1 M€)
� Fondelec CEE Corp Management (0,1 M€)
Company that implement EE
or EnR operations
Equity participation
Convertible debt
FFEM (1,68 M€)
Coverage of additional cost in the project identification and structuring phases
ESCOs

World Energy Council Energy Efficiency Policies and Indicators – ANNEX 1
22
Key Findings And Conditions Of Replication
An experienced management team
• Fondelec, the fund manager, has already worked with the World Bank, and thus has a knowledge of the principles and methods of intervention of a development bank;
• Fondelec has already worked in the emergent countries (Latin America and to a lesser extent Eastern Europe) and is presently created a new fund in Asia;
• Fondelec has specialized in the management of funds dedicated to the investments in the “utility” sector and in particular in the electricity sector within the framework of privatisation program.
The local teams are highly qualified in financial issues, have a perfect knowledge of English and are very dynamic. This constitutes are prerequisite for the fund success.
Develops a market for energy efficiency
To date, Fondelec has not been through significant difficulties and the fund seems successful. The fund increases the participation of the private sector in the renewal of infrastructure and, by its financing of ESCOs, it provides commercial means to improve energy infrastructure without additional debt burden.
Relevant size of the project
This size of the project selected enables the fund to place itself on the market of SME and municipalities of average size on which strategic investors (as Dalkia or Elyo) as well as development banks (BERD, the World Bank, IFC, etc.) are not very present. Moreover, the fork of investment selected contributes to an allocation of the fund resources on a more significant number of projects and thus to a better spread of the risk.
A function of decision at the level of
sponsors
In general, in this type of fund, the fund manager enjoys a total freedom of management. The investor is held informed of the operations engaged by the manager but does not take part in the decision. In the case of the Dexia-BERD-Fondelec fund, the diagram set up tend to limit this autonomy and to restore a certain function of decision on the level of the investors by introducing a device of pre-review of the projects.
Furthermore, one very strong asset of the fund is that it was created at the initiative of investors with a pre-existing commitment to provide fund. This prerequisite is all the more significant as there is a perception that the “new energy” field is a risky one, usually cooling down investor’s enthusiasm.
Conditions of applications
• Favourable policy and regulatory environment • Reliable legal framework • A favourable business climate • A sophisticated banking system • A local high experienced staff • Economic relative stability
References
Source http://www.fondelec.com Juillet 2003, ICE-FondElec et FFEM, Présentation au comité de pilotage des operations d’efficacité énergétique et de réduction des émissions de CO2 du Fonds Dexia-Fondelec

World Energy Council Energy Efficiency Policies and Indicators – ANNEX 1
23
Canada: Green Municipal Funds
Context
The Government of Canada ratified the Kyoto Protocol on December 17, 2002 in which it committed itself to an annual reduction of greenhouse effect gases of 240 Mt. It has allocated more than 3,7 billion CA$ (2,4 billion €) to climate change programmes and to the development of leading edge technologies over the past five years including 2 billion CA$ (1,3 billion €) in Budget 2003 alone. Canada is a federation of ten provinces and three territories. Many provincial and territorial governments have announced programmes and action plans to improve energy efficiency and promote greater use of alternative energy. The Office of Energy Efficiency has been established as the core unit responsible for delivering energy efficiency components of the EAE.
Objective To provides municipal governments with the tools to implement innovative environmental projects
Lifetime 2000 - ongoing
Sponsors
On the initiative of the Federation of Canadian Municipalities (FCM), the Canadian Federal Government (department of environment, department of natural resources and department of finance) signed in 2000 an agreement with the Federation of Canadian Municipalities in which it has engaged itself to bring 125 MCA$ (around 80 M€) to Green Municipal Funds (GMF). The endowment was doubled to 250 MCA$ in the federal 2001-2002 budget.
Fund Management The FCM manages the Green Municipal Funds through its Centre for Sustainable Community Development (20 persons). The agreement with the federal government imposes a limitation of the annual administrative costs at 5 MCA$ (3,2 M€). They are financed by the interest rates.
Beneficiaries / projects
Beneficiaries: The Funds are open to all Canadian municipalities (even those not belonging to the federation) and their public sector or private-sector partners. The partnership between a municipality and a private organisation has to be clearly stated either by the financial participation of the municipality in the investment, by its participation in the input (for instance by procuring a land for a wind farm project) or by its participation in the output (by contracting a long term renewable electricity purchase agreement with the firm for example).
Projects: the five eligible sectors are: energy and energy services, water, solid waste management, sustainable transportation services and technologies and integrated community projects. The project must significantly improve environmental performance or energy efficiency in these areas of municipal infrastructure.
Mechanism Description Project Selection Completed applications are reviewed by a Peer Review Committee of two or three independent
experts in the field addressed by the project. These experts come from government, institutions and/or the private sector. A system of quotation ranging from 0 to 1000 gives a mark to each project. Criteria as environmental improvement (150 points), replication possibilities (100 points), partnership quality, innovation (230 points) intervene in the notation. Most of the time, projects with a mark superior to 600 points are recommended by staff. Recommendations from the FCM’ staff are made to the 15-member Green Municipal Funds Council. The Council includes representatives from the Government of Canada (one-third), FCM (one-third), and non-governmental institutions and the private sector (one-third). The council supports or rejects staff recommendations. Final approval rests with the Board of Directors of FCM. In theory, not more than 30% of the fund can be allocated to one of the 5 eligible activity sectors.
Mode of intervention Two types of funds with similar objectives and criteria: • The Green Municipal Enabling Fund (GMEF): it provides up to 100 000 CA$ (64 000 €) to
cover half the cost of feasibility studies for innovative environmental projects. The fund helps the Canadian municipalities and their public or private-sector partners to determine the technical, environmental and/or economic feasibility of municipal projects. The total amount of GMEF is 50 MCA$ (32 M€). The government should stop providing the fund in 7 or 10 years.

World Energy Council Energy Efficiency Policies and Indicators – ANNEX 1
24
• The Green Municipal Investment Fund (GMIF): GMIF has two main products: the primary product is loans and the secondary product is grants. Green Municipal Funds Council decided as a policy to direct half of the Fund’s capital in loans to municipalities and the other half towards the private sector. The total federal government contribution to GMIF is 200 MCA$ (128 M€). It is revolving and fixed for an undetermined period. here are three types of loans: - Direct loans to municipalities with very low risk at the preferred interest rate of 1,5% below
the Government of Canada bond rate (which is the Country’s lowest rate: currently 4,8% per annum for a 10 year term).
- Corporate loans to private-sector partners; - Project finance through loans: this type of loan is more risky as, in case of project failure,
the project promoter is not bound to reimburse the loan. The interest rate is thereby higher. The average of the interest rates for the loans to companies and for the loans to projects is an interest rate of 1,5% above the Government of Canada bond rate. As the fund shares equally loans between municipalities and private sector, the average interest rate of the GIMF loans is the one of the bond rate.
GMIF finances up to 25% of the capital costs of a qualifying project. GMIF can also provide loan guarantees. Loan payback periods may range from four to ten years.
If money is still available after the covering of the administrative costs from the interest rates, the remaining is dedicated to the allocation of grants for GMIF Pilot Projects: environmental projects that are highly innovative, but have a payback period in excess of 10 years. Special grant funding permits these projects to be structured in ways that offer acceptable payback periods and levels of risk.
The Fund is constantly seeking to develop new loan products to overcome barriers to the implementation of valuable projects. For example, it is developing two other special tools:
• The “Emission Reduction Rights based financing”: loans will be reimbursed not in terms of financial flux but by transferring to GMIF the carbon credits gained thanks to the project’s emission reductions. GMIF will sale those credits to reimburse the loan and the interest rate. The remaining proceeds from the sale of the credits will be to the benefit of the project sponsor.
• The “Reinvestment loans”: the Fund can lend to projects which are not a priori innovative if the municipality commits itself to place the economic savings earned by the difference between GMIF’s interest rate and another financial institutions interest rate into small but very innovative projects.
Follow-up
After approbation of the project, a standardised convention is signed between the GMIF and the municipality (or private organisation) in which a few conditions are settled. Among them, the municipality has the obligation to sign a “Project Results Reporting Agreement” in which it commits itself to create a monitoring system, tools to check the results of the project and to report one year after the project achievement. A grant of 30 000 CA$ (19 000 €) is provided by the GMIF for this purpose. Staff from the GMIF is especially dedicated to the supervision of the evaluation process.

World Energy Council Energy Efficiency Policies and Indicators – ANNEX 1
25
Figure 2 – Description of the Green Municipal funds mechanism
Outcomes
Project portfolio For the moment, there has been greater demand for grants from the Enabling Fund for feasibility projects that for project financing from the Investment Fund. To date, the amount versed to investments is still small compared to the total budget of the GIMF (2,6 M€ on 128 M€). FCM anticipated this initial result. The expectation has been that as feasibility studies were completed, demand for financial services offered by the Investment Fund would increase. This, in fact, is what is occurring. By mid-2002, more than 20 projects were in various stages of negotiation with Investment Fund development staff. In 2001-2002: • Concerning GMEF: just over 5,8 MCA$ (3,7 M€) in grants leveraging 25,5 MCA$ (16,4 M€) in
total spending / 132 feasibility studies with 34% in the water category, 31% in energy, 25% in solid waste management.
• Concerning GMIF: 4 MCA$ (2,6 M€) leveraging 19,6 MCA$ (12,6 M€) in project spending. Four water and four energy projects received approval.
Only one project has asked and beneficiated from a loan guarantee. In the other project, the Fund is acting as a lender.
Project illustrations City of Ottawa – Integrated Facility Retrofit Pilot – Phase I: Retrofitting of 49 city facilities, implementing alternative technology applications such as solar hot water and space heating, solar wall technology, strategic planting, shading and green roofs, rainwater collection, combined heat and power systems. The city has already achieved a 17% reduction in energy use in its facilities and has reduced CO2 emissions by 29% since 1990. The retrofit measures will pay for themselves in approximately 10 years and will cut energy use by 38% over 1990 levels. Town of Colonsay – Operation Fast Freeze: the town of Colonsay has a sports centre that consists of curling and skating ice surfaces and a banquet hall. The existing ice-making and building heating equipment at the centre is failing. The community has decided to install a more innovative system – a heat pump with geothermal sink and heat source – to replace the conventional equipment. The new system’s energy costs will be significantly lower than those of the old system. The project is also
Sponsor: The
Canadian federal
government
Fund manager: the Federation of
Canadian Municipalities
Green Municipal Enabling
Fund
Green Municipal
Investment Fund
convention
Municipalities
Private organisations
Grants
Loans
Projects
160 M€ from federal budget 32 M€
128 M€
Average interest rate of 1,5%
above the Canada bond rate
Loan guarantees
Grants
Interest rate of 1,5% below the Canada bond rate
Feasibility studies
To very innovative projects with high
environmental impacts
Repayment

World Energy Council Energy Efficiency Policies and Indicators – ANNEX 1
26
expected to provide new income opportunities for the community, because the facility will now be available year-round instead of seasonally. The project’s total cost is estimated at CA$ 360 000 (€ 228 600). City of Bécancour – Modernization of the Public Lighting System: this project will replace over 1 000 existing high-pressure sodium street lights in the City of Bécancour with newly developed induction lamps. This will cut maintenance costs and reduce electrical consumption, for street lighting by more than 35%. The new system promises 100 000 hours of service compared with 24 000 hours for the high-pressure sodium lights.
Key Findings And Conditions Of Replication
Self-financing
The administration costs of the fund are financed by the interest rate
Highly experienced staff
Half of the staff has a specialisation in financial issues and the other half in environmental issues.
A well known and truthful fund
manager
The federation has the advantage of having regular and numerous contacts with Canadian municipalities. It has a good reputation and is known as skilled by the municipalities on financial but also environmental issues.
Need to find a good “niche”
The GMIF must offer really interesting products (very low interest rates or intervention into risky innovative projects) to attract municipalities or private partners to compete with offers from other financial institutions.
An insufficient participation into the
projects’ financing
The maximum loan is up to 25% of the project capital costs. This financing coverage is considered too small to really permit the achievement of the government objectives regarding the Kyoto Protocol. If GMIF were permitted to fund up to 100% of the capital cost of municipal projects the Fund offering would be more attractive and would be a significant inducement to municipalities to contribute to Canada’s Kyoto objectives.
References
Source http://www.fcm.ca/scep/support/GMIF/gmif_index.htm 2003, FCM, Green Municipal Annual Report 2001-2002
World Energy Council Energy Efficiency Policies and Indicators – ANNEX 1
27
UK: Carbon Finance From The Low Carbon Initiative Programme
Context In the framework of the Kyoto Protocol, the United Kingdom must achieve a goal of 12,5% reduction
of the greenhouse gas emissions by 2008-2012 compared to their level of 1990. The Energy White Paper “Our Energy future – Creating a Low Carbon Economy”, published in February 2003, draws down an objective of a 60% CO2 reduction by about 2050 compared with current levels.
The two mains instruments to promote energy efficiency and manage national incentive programmes are the Energy Saving Trust (EST) and the Carbon Trust (CT). EST is mainly focused on end-users programmes in the domestic sector while the Carbon Trust focuses on technology innovation and the uptake of energy efficiency in business and the public sector.
Objective Deliver carbon savings over the medium and long term in a cost effective manner and stimulate the emergence if a low carbon sector in the UK.
Lifetime of LCIP May 2002 – on-going
Sponsors
The Carbon Trust is partly financed by the Climate Change Levy in force since April 1, 2001. It is a tax on the energy consumption of the industrial, public and agriculture sectors. The tax is of 0,1 c€/kWh for the LPG, 0,24 c€/kWh for gas and coal and of 0,7 c€/kWh for electricity.
Fund Management The Carbon Trust was established in April 2001 as a non-profit organisation to lead on business and public sectors energy efficiency and support the creation of a low carbon economy in the UK. Around 40 persons are employed in the CT. The Low Carbon Initiative Programme (LCIP), launched in May 2002, has up to £75 million (107 M€) to invest over a 3-year period and has four principal areas of activity: R&D, demonstration, carbon finance and market diffusion. 13 persons are dedicated to the LCIP management and 2 work especially on the Carbon Finance.
Beneficiaries / projects
Beneficiaries: • SMEs raising investment capital to commercialise technologies • Other public/private sector institutions or funds wishing to establish investment support
structures for SMEs in the sector (such as incubator/spin-out initiatives)
Eligible projects: For initial guidance, there are a number of specific ranking criteria that are used to prioritise projects seeking support: • Financially sound: Proposals should be accompanied by a level of financial support data that
allows for a detailed appraisal of the organisation's economic viability. • Relevant team experience, a clear team leader and a team with complimentary areas of expertise,
such as management, marketing, finance. • Market assessment: identification of a market from which to generate income from the
technology. • Competitive advantage: demonstrate a clear competitive advantage for the business proposal and
the extent to which the project addresses a specific need or market demand. • Identify funding. • Technical evidence that supports the feasibility of the project. • Confirmation of intellectual property protection.
World Energy Council Energy Efficiency Policies and Indicators – ANNEX 1
28
Mechanism Description Project Selection The project portfolio is evaluated using a model based approach which reports on the potential
savings that may occur from LCIP funded projects in 2010, 2020 and 2050. Each proposal is transferred to the technology team in the CT and to independent experts for advice.
Mode of intervention The Carbon Finance will soon have two specific mode of intervention: seed capital and venture capital. • Seed Capital for the creation of companies specialised in low carbon technology: it consists in
providing commercial advisory services to technology developers who wish to create a company (generally a university team). The CT will fund incubators – small teams that will help the technology developer to build a business plan and create his company. This mode of intervention has not started yet.
• Venture Capital: The CT acts in a similar manner to a venture capital company and seeks both a carbon abatement return and a commercial return compatible with other equity investors. The CT only invests on a parri passu basis with other private sector firms due to EC State Aid regulation. A typical organisation may be one willing to exploit a new technology by starting a new business or an existing company looking to expand rapidly. These types of organisations are traditionally funded by either banks or venture capital firms. However sufficient normal sources of commercial funding may not be available due to the under provision of private sector funds, the failure of private investors to recognise the long term value of reducing CO2 emissions or their aversion to risk arising from 'information gaps'. Here LCIP acts as an informed co-investor and uses its funds to leverage additional private sources of funding. The minimum amount of venture capital per company is 250 000 £ (360 000 €). The remaining is brought by other financial institutions (specialised private investors, banks). The CT seeks to exit the company as soon as possible.
Project illustration • A minority participation in a £16 million (23 M€) equity investment in a company which is
producing advanced gas turbine CHP systems. • A participation in a £0,8 million investment (1,15 M€) in a company supplying ecological
building materials such as natural fibre insulation, clay and mineral plasters and board, clay blocks and natural paints.
• A participation in a £0,8 million investment (1,15 M€) in a company focused on the continuous development and advancement of wood-fuel gasification technology in order to make biomass technology a commercially viable form of renewable energy.
Links with other instruments
In some circumstances, the Carbon Trust may consider linking its return to future carbon credits arising from the successful market deployment that results from programme investment.
Follow-up The board of the company which includes the CT meets once a quarter to monitor the operation.

World Energy Council Energy Efficiency Policies and Indicators – ANNEX 1
29
Figure 3 – Description of the Carbon Fund mechanism
Outcomes
Project portfolio In February 2003, the CT announced its first portfolio of projects including fuel cells, building materials, wave power, photovoltaic and Combined Heat and Power (CHP). Projects are spread geographically across England, Scotland, Wales and North Ireland. Concerning LCIP: to date, the CT has received over 450 funding applications and over 150 of these projects have passed the initial evaluation stage and have been subjected to detailed analysis. So far, 46 projects have been agreed. Concerning Carbon Finance Seed Capital: following a call for proposal, the CT has received 32 proposals. It has decided to support 4 of them (mostly universities). Concerning Carbon Finance Venture Capital: in June 2003, 62 proposed projects have been appraised with equity investment made in three since June 2002.
Climate Change Levy
Research and development
Carbon Finance
Demonstration
Market diffusion
Very innovative
projects using low carbon
technologies
Seed Capital
Venture Capital
Enhanced Capital
Allowance Scheme
≈ 35 M€/year
Low Carbon Initiative
Programme
Action Energy
CARBON TRUST
Tax on the energy consumption of the industrial, public and agriculture sectors
Action Energy
Programme
≈ 72 M€/year
Advice on the project proposals from independent experts

World Energy Council Energy Efficiency Policies and Indicators – ANNEX 1
30
Key Findings And Conditions Of Replication
LCIP fills up the market gap for low carbon technologies
It can support a wide range of projects, from research to near-market technologies and assists technologies overcome barriers across the innovation chain.
Higher risk accepted by the Fund manager
Although the CT looks for an economic return, overall, it is seeking a carbon return in the form of lower CO2 emissions. In appropriate cases this means that the Fund is prepared to accept a higher degree of financial risk than a typical early stage commercial investor.
Highly qualified staff The staff working on the Carbon Finance have a strong experience in high risk financing and environmental issues.
Getting familiar with the innovative funding
tool
A strong effort on communication actions has to be exerted to develop knowledge on this new tool among companies which are generally used to public direct funding. This means spreading information through media, internet, financial institutions, etc.
Favourable country conditions
• Second largest country in terms of Venture Capital activities • Many specialised investors • Strong level of innovation from different types of entities (companies, universities) generating
a great supply of proposals.
References
Source http://www.thecarbontrust.co.uk/TheCarbonTrust/Default.htm
World Energy Council Energy Efficiency Policies and Indicators – ANNEX 1
31
Thailand: Revolving Fund For Energy Conservation
Context In 1992, the Royal Thai Government passed the Energy Conservation Promotion Act (ENCON Act) to
promote energy conservation and set up related regulations for funding and resources to support energy efficiency and renewable energy. Under the ENCON Act, the Department of Alternative Energy Development and Energy Efficiency (DEDE), department of the Thai Ministry of Energy, is responsible for the Compulsory Program for Designated Factories and Buildings. These Designated Facilities have to comply with government regulations requiring them to manage their energy use and to conduct energy audits and establish energy conservation targets and plans.
Objective To promote and push investment in EE projects and to increase the confidence of financial institutes in lending for EE projects.
Lifetime In 2002, the budget allocated from the ENCON Fund to the Revolving fund for Energy Conservation was approved. The agreement with the financial institutions was signed in January 2003, marking the start of the scheme implementation. The scheme is fixed for a period of three years, after which an agreement could be signed again with the ENCON Fund Committee. Yet, the idea is that this type of financing becomes “self-functioning”, i.e. without public intervention.
Sponsors
DEDE has received approval from the ENCON Fund Committee to use 2 billion Baht (approximately 43 M€) to set up an EE Revolving Fund. The ENCON Fund is a special fund created by Encon Act 1992 by collecting small taxes from the use of benzene, diesel, fuel oil and kerosene. At present, the Fund has been accumulated to the amount of around 17 billion Baht (app. 365 M€).
Fund Management The Department of Alternative Energy Development and Energy Efficiency (DEDE). A couple of people from the DEDE are dedicated to manage the Fund and cooperate with the participating financial institutions. As for the financial institutions, they manage risks related to the loans, they realise the book-keeping, the credit checking and the customers’ selection.
Beneficiaries / projects
Beneficiaries: Buildings and factories classified as Designated Facilities (buildings and factories) according to the 1992 ENCON Act. They are defined as facilities which have an installed capacity of 1175 kVA of transformers and have a peak demand of 1 MW and above, consume 20 million MJ or more of electricity annually, use steam power and other non-renewable energy sources. These Designated Facilities have to comply with government regulations requiring them to manage their energy use, including lighting energy, air-conditioning energy, and the building envelope.
Projects: Improvement in combustion efficiency of fuels, protection of energy loss, recycling of energy wastes, substitution of one type of energy by another type, more efficient use of electricity through improvements in power factors, use of energy - efficient machinery or equipment as well as use of operation control systems and materials that contribute to energy conservation, etc.

World Energy Council Energy Efficiency Policies and Indicators – ANNEX 1
32
Mechanism Description Loan modalities • Term of loan: Not more than 7 years and/or the simple payback period (SPP) shall not be more than
7 years • Maximum loan size: 50 MBaht per project (1,1 M€). No minimum size for the investment projects
has been set. • Maximum interest rate: Not more than 4% per year (amount charged by financial institute to
borrower). This interest rate is intended to cover the financial institutes' management fees and risk associated with the loan.
• Costs included in the EE Loan: equipment and installation costs, consulting fee for design, supervision, and guarantee of savings (e.g., for an energy service company, or ESCO), construction of a gas pipeline from the main pipeline to the Designated Factory or Building, transportation and demolition costs, import duties and taxes, and value-added tax (VAT) for the above costs.
Project Selection Interested owners of Designated Facilities need to request a loan application form through a
participating financial institute. Financial institutes approve the EE project loans according to their regular lending criteria and perform an initial financial analysis of the project. DEDE considers and approves projects according to the its criteria and conditions.
Mode of intervention On the eight banks that declared their interest to participate in the scheme, six commercial banks were
selected. They are responsible for providing the loans: the Industrial Finance Corporation of Thailand, the Bank Thai, the Bangkok Bank PCL., the Sri Ayutthaya Bank, the Thai Military Bank and the Siam City Bank. DEDE is in charge of distributing the money between the six banks. The share is defined according to each bank’s potential. But the budget for each bank is redefined every 6 month and adjusted (lowered or increased) according to the bank’s dynamism in the field of energy conservation. Each bank’s manager of the fund receives training on energy efficiency issues and technical assistance from consultants paid by DEDE. They are explained basic mechanisms such as Energy Performance Contracting, energy savings, ESCOs, etc. They can phone and get advice from DEDE. DEDE is assisted by the Energy Research Institute in the communication, information and advising activities. With regard to the above criteria, the actual interest rate and period of loan depend upon the agreement reached between the bank and the borrower, however, the interest rate ceiling is 4% and the loan term cannot exceed 7 years. The borrower makes repayments to the ENCON Fund via the bank and will also submit a report on the project energy savings.
Follow-up The banks have to report regularly to DEDE on their activities regarding the Fund.

World Energy Council Energy Efficiency Policies and Indicators – ANNEX 1
33
Figure 4 – Description of the Revolving Fund for Energy Conservation mechanism
Outcomes
Project portfolio So far, 19 projects have been approved,4 of which have already received money.
• 14 projects in factories: half of them in the food factory, then textile sector, rubber, electrical cable
• 5 projects in buildings: 4 in hotels and 1 in a hospital. The projects are very diverse: installation of renewable energy equipments, biogas, cogeneration, lighting and air conditioning, energy management.
Financial volumes / Total projects to date
399 MBaht (8,5 M€) have been allocated. This represents a total investment of 700 MBaht (15,5 M€). 2 of these projects have involved ESCOs which guaranteed a certain amount of energy savings
Key Findings And Conditions Of Replication
Great interest from financial institutions
While hard to convince to participate in this project at first stage, financial institutions are now expressing a really great interest in the scheme. Two more banks have recently applied for participation. According to DEDE, banks are getting aware of the advantages that can get from participating in terms of environmental and public image but also in terms of profitability. For DEDE, the participation of banks is a key point of the whole scheme as the objective of the Fund is to give the financial institutions experience on energy conservation projects. In the middle and long term, DEDE hopes that this mechanism would function with a lesser public support.
An objective of enlarging the eligibility criteria
For the moment, the fund is restricted to “Designated Buildings”. DEDE wishes to relax this criterion and to make to fund accessible to smaller organisations such as ESCOs or SMEs. For this, it has to submit a request to the ENCON fund Committee.
Favourable country conditions
• A favourable legal framework: The Energy Conservation Promotion act (ENCON Act) has fostered energy efficiency awareness in factories and buildings.
• A tough competition: saving costs has become a key action to increase competitiveness.
References
Source http://www.dedenewprograms.org/index_en.htm
Energy Conservation
Fund
� Interest rates ceiling at 4% � Max. loan: 1,1 M€
� Max. loan term: 7 years Provides advices, training and technical assistance to Bank’s managers
43 M€
Energy Research Institute
Industrial Finance Corporation of
Thailand
LOANS
PaymentThai Military Bank
Siam City Bank
Bangkok Bank PCL.
Bank Thai
Designated Factories
Designated Buildings
Sri Ayutthaya Bank
Department of Alternative Energy Development and Energy Efficiency
State budget

World Energy Council Energy Efficiency Policies and Indicators – ANNEX 1
34
Germany – Berlin: Energy Saving Partnerships
Context The National Energy Agency, DENA, created in spring 2000, coordinates the various federal energy
efficiency programs. 12 energy agencies of Länder and 16 regional and local agencies are distributed on the whole territory. They are public, mixed or private. They are very active in the field of energy efficiency.
Objective To reach ambitious objectives for climate protection and reducing energy costs while handling a tight budgetary position.
Lifetime 1995 – ongoing
Sponsors
The sponsors are the State of Berlin and the districts which pay the Berlin Energy Agency’s fees for consultancy. All the ESCO investments are expressively not subject to public funding schemes.
Project Management The Berlin Energy Agency (BEA): it intervenes by assisting the municipality from the tendering process to the supervision of the contracts (see below). The Agency is paid on a basic consultant fee half by the State of Berlin and half by the district concerned by the project.
Beneficiaries / projects
Beneficiaries: Public buildings (School centres, swimming-pools, museums, etc.). Type of projects: heating techniques (central control systems, optimisation of individual control tasks, distribution network, adaptation of thermal installed load, etc.) and electrical application (peak load management, efficient drives, ventilation and cooling technique, lighting control systems, etc.).
Mechanism Descr iption Mode of intervention Principal: The client (for example the local authority) is responsible for the upkeep of various
buildings, such as nursery schools or offices. It is bound by contract to energy suppliers who deliver electricity and heating (i.e. gas or oil). In order to reduce energy costs and damaging levels of carbon dioxide, the client transfers the financing, planning, implementation and controlling of energy saving measures to a private energy saving partner – the so-called contractor (an ESCO). The successful contractor undergoes a tendering process. The existing contracts between the client and the energy suppliers covering the delivery of electricity and heating are not affected by the project. The contractor, however, agrees the necessary technology and supply with the energy suppliers.
Building pools: An Energy Saving Partnership is not only applied to energy saving in large building complexes. The Berlin model is a conscious effort to pool smaller projects and create “building pools”. In order to reduce the transaction costs, the buildings are pooled as the tender procedure is quite similar with one or 20 buildings. In addition, due to organisational reasons, the whole buildings of one pool have to belong to one full responsible administration.
Energy Saving Guarantee Contract: The ESCO signs a contract to guarantee the client a minimum level of energy savings. The contractor only receives his agreed earnings if the stipulated energy savings are reached.
The investments carried out by the contractor are re-financed through the savings. Any remaining savings are shared by the partners according to a ratio system agreed to in the contract for the duration of the project. The contractor remains responsible all this time for the maintenance and service of the systems. The client profits from all cost savings once the contract has expired.
In order to ensure long-term quality, the co-operation has to be based on a balanced contract. The Energy Saving Guarantee Contract ensures the highest possible degree of reliability. It takes all the specific demands of the project into account and legally guarantees the client’s interests. The contract includes all details of technical measures taken, the nature and extent of any investments made by the contractor as well as duration and level of savings. The contractor is responsible for the performance of the technical systems and therefore also for any risks caused if the systems break down. He also guarantees the client a minimum level of targeted energy savings and carries any financial risks – if, for example, interest rates rise.

World Energy Council Energy Efficiency Policies and Indicators – ANNEX 1
35
Project agenda: • Preparation: project definition, technical data-collection, creation of building pools if necessary,
check of potential, technical economic objectives • Tendering process and award: announcement of the process and/or identification and choice of
the target group for tenders, invitation for tender, negation of the tenders, recommendation for award
• Energy Saving Contract • Contract Preparation Phase: fine planning, index of planned performance, conception and
financing, installation, transfer of propriety • Main Performance Phase: optimisation of the operation, parameterisation, proof of savings,
maintenance.
BEA’s missions All municipal institutions are allowed to address the experts of BEA to get their EPC projects defined, to get assistance for the procurement. BEA creates a Steering group in the administration to explain the staff the modalities of an EPC. It elaborates with the basic data on the buildings and the energy consumption baselines. The preparation of the documents for the tendering process, the negotiation and final recommendation on the contractor as well as the assignment of the contract are carried out by the experts. Finally, BEA can intervene in the supervision of the contract.
Project illustration Building Automation Systems in Pankow: The Berlin District Pankow entered an Energy Saving Partnership with a contractor in 1998. The successful bidder for the pool of 55 buildings was the company Johnson Controls JCI Regelungstechnik GmbH. The District decided to set the focal point of the contract on high investments with a duration of less than 15 years: investments of roughly 1,8 M€ were therefore calculated for the contract with a duration of 14 years. The contractor guarantees more than 24% (502 000 € guaranteed savings and 2 500 CO2 tons/year). In addition to other technical measures, JCI installed building automation systems in order to lower energy consumption and a central building control system in the building pool in Pankow. This enables all buildings to be optimally supplied with heating according to their types and times of usage.
Other examples of projects: • Individual Temperature Control for the Berlin District Friedrichshain (a pool of 30 buildings) /
Total investment: app. 940 000 € / Energy Saving Guarantee: 20% / Energy Partners: ARGE, MVV Energie AG, WFM GmbH &Co.
• Conversation from coal to gas in Steglitz-Zehlendorf (41 buildings) / Total investment: app. 920 000 € / Energy Saving Guarantee: 22%. Energy Partner: SFW GmbH.
• High energy savings in Berlin’ Public Baths (11 swimming-pools) / Total investment: app. 4,9 M€ / Energy Saving Guarantee: 33,5% / Energy Partners: Landis & Staefa, Siemens Building Technologies GmbH.
Follow-up At the charge of the contractor

World Energy Council Energy Efficiency Policies and Indicators – ANNEX 1
36
Figure 5 – Description of the Energy Saving Partnerships
Outcomes Project portfolio From 1995 to 2003, in total 345 public buildings in Berlin, grouped in 14 pools were contracted to
private investors. These buildings represent a total energy consumption of 500 000 MWh/year. 10 different energy partners from Germany have been involved. The average energy saving guarantee is of 22,9%. In addition one pool of 14 buildings was contracted in Slovenia.
Financial volumes The total investment in Berlin reaches 26 M€ and the private investors guarantee for savings of 23,5 % (average over all pools).
Savings The yearly cost savings amount to 1,85 M€/year for the public households, whereas the contractor is
already paid from the total energy cost savings which amount to 6,6 M€/year. The CO2 reduction amounts to yearly 37 000 tons.
Project manager: Berlin Energy Agency Ltd
Guaranteed savings
BUILDING POOL Public building 1(ex: hospital) Public building 2 (ex: school)
Public building 3 Etc
ENERGY SAVING PARTNER
Payment
Energy supplier
District heating
Gas ElectricityOil Agreement covering
technology and supply
STATE OF BERLIN
Payment
ESCO 1 ESCO 4 ESCO 3ESCO 2
Assistance for the procurement
process
ESCO selected by the building pool after the tendering process
payment
Negotiation, final recommendation and assignment of the contract
Assistance: � on the preparation
of the basic data on the building
� on the whole EPC implementation

World Energy Council Energy Efficiency Policies and Indicators – ANNEX 1
37
Key Findings And Conditions Of Replication
Large possibility of application
The concept is not restricted to public real estate. Hospitals, universities, hotels and modern office buildings are also able to save energy, carbon dioxide and a great deal of money. In addition the model has been already transferred to Slovenia and will be further implemented in Central and Eastern European Countries through the project “Clearcontract - Clearinghouse for TPF in Eastern Europe” which is supported under the SAVE-Program.
High interest from private partners
In all projects, 10-20 companies declared their interest; 5-10 of them were usually invited for the call of tenders.
A reliable client The public sector is a reliable contract partner: on one hand it represents an attractive volume and on the other hand energy efficiency can – more or less – directly influence the decisions of the public building administrations.
Great energy potential
Energy Saving Partnerships have an enormous potential. The energy costs of all public buildings in Germany could be reduced by 20 %. This means cuts of over 350 million Euro per year. At the same time, environmentally harmful emissions of carbon dioxide could be reduced by 20 to 30 %, i.e. by about 3 million tons/year.
Opened to smaller or unprofitable buildings
These pooled buildings have different levels of energy consumption, construction material, fixtures and fittings which leads to profitable cross calculations and also means that seemingly unprofitable buildings are integrated into the project. Moreover, it increases the project volume making it attractive for the national market and minimises the specific transaction costs to make it more profitable .
Favourable country characteristics
• No legal barriers and establishment of contracting guidelines with both practical and formal advice.
• A competitive market • A highly expert consultant providing easy access to competent advice for buildings
administrator • Low fluctuation in energy prices and interest rates • A grouping of investment costs and running costs managing into one administration responsible
for the other administrations energy costs (investment + functioning).
References
Source Web Site: www. berliner-e-agentur.de June 2003, Friedrich Seefeldt, Energy performance contracting: success in Austria and Germany – dead end for Europe?, ECEEE 2003 Summer Study
World Energy Council Energy Efficiency Policies and Indicators – ANNEX 1
38
France: Guarantee Fund For Energy Conservation Fogime
Context The national Climate Change Programme, elaborated by the Interministerial mission against the
greenhouse effect (MIES), was adopted in January 2000 by the government. It presents the strategy to fulfil the Kyoto Protocol Objective which consists in reaching over the period the 2008-2012 the greenhouse gas emission level of 1990, that is to say 144 MteC).
Objective To encourage SMEs’ investments in favour of energy conservation by guaranteeing the loans they have contracted with banks.
Lifetime June 2001 – on going
Sponsors
This fund was set up by the ADEME in partnership with the Bank for the Development of SMEs (BDPME) through its subsidiary company SOFARIS, EDF and Charbonnages de France.
Fund Manager Sofaris, a subsidiary company of the Bank of the development of SME (BDPME). Held mainly by the State and the Caisse des Dépôts et Consignations (CDC), the BDPME controls directly or indirectly the majority of the capital of the Credit for SMEs’ equipment. By creating the BDPME, the authorities wanted to have a specific instrument which fulfils a mission of general interest to the SMEs: to share the risk of their financing.
Beneficiaries / projects
Beneficiaries: More than 3-year life time companies with a turnover lower than 40 M€ and employing less than 250 people, whatever their activity sector and their legal form.
Eligible operations: The eligible investments are in particular those relating to the equipments indicated in the list of materials devoted to energy conservation published in the Official Journal:
1) High-performance material. 2) Modifications of installations. 3) Renewable energies. 4) Production of efficient equipments in the environment and energy sectors.
Mechanism Description Mode of intervention The FOGIME is a mutual guarantee conferred by BDPME-SOFARIS and ADEME provided to banks
granting loans in the medium and long term. The FOGIME indeed makes it possible for SME to beneficiate from a reinforced guaranteed: 70 % against 40 % provided by the National Guarantee Fund for the development of SME, 30% additional being financed by ADEME. The Fund guarantees a maximum of 750 000 € per company. It also guarantees leasing operations for SMEs.
The successive stages in the implementation of the guaranteed loan are as follows: 1. The SME applies for a short or the long term loan to its bank or for a leasing in order to finance an energy conservation investment. 2. The bank makes a demand to BDPME-Sofaris to benefit from the guarantee. 3. BDPME-Sofaris addresses the project to the regional Delegation of ADEME concerned for technical opinion. This advice is simplified when the investment follows a decision-making aid financed by the ADEME. 4. In case of agreement from ADEME, the bank sets up the loan. In the event of refusal, the project remains eligible for the National Guarantee Fund for the development of SMEs in which loans are traditionally guaranteed to the amount of 40%.
Follow-up SOFARIS

World Energy Council Energy Efficiency Policies and Indicators – ANNEX 1
39
Figure 6 – Description of the FOGIME mechanism
Outcomes
Project portfolio The guaranteed projects are of very diverse nature (renewable energy sites, efficient building, etc.).
Financial volumes From June 2001, around 30 projects were accepted and 20 loans have been subscribed for a credit outstanding at 5,6 M€. Of the 30 projects, around 10 had already beneficiated from a grant of the ADEME to realise energy audits.
Savings There is no global accounting of the energy saved. Assets And Conditions Of Replication
Favour investments in the environment and energy sectors by offering an advantageous level of guarantee
Energy efficiency and renewable energies are fields of activity characterized by a lack of equity capital, over-costs and high payoff period. There is a need for new specific financial instruments, allowing to complete the financing plan in these sectors. The guarantee of 70% against 40% gives an incentive for the customer and for the bank that becomes more confident and avoid the search of supplementary guarantees.
Difficulties to globalise date on energy savings
The fact that the fund manager – SOFARIS - has no specific skills in environment and energy efficiency issues makes it difficult to evaluate thoroughly the benefit of such scheme on the environment.
Sub-optimal organisation
The tripartite relation between the bank directly in contact with the SME, the fund manager – SOFARIS - and the ADEME which brings its technical opinion is not optimal as it lengthens the procedures.
Favourable country conditions
• The level of the commission rate for the guarantee is similar to other guarantees • Good identification of SME
References
Source www.bdpme.fr
www.ademe.fr
Bank Bank Bank
Application for loan
ADEME
Demand for technical advice Guarantee of 30%
Demand for guarantee
FOGIME - BDPME Guarantee of 70%
SMEs which invest in energy efficiency or renewable energy

World Energy Council Energy Efficiency Policies and Indicators – ANNEX 1
40
Prepared by W. Eichhammer and J. Schleich, Fraunhofer ISI.
Voluntary / Negotiated Agreements
World Energy Council Energy Efficiency Policies and Indicators – ANNEX 1
41
Australia
Greenhouse Challenge
Context The Greenhouse Challenge programme is part of Australia’s measures to combat climate change and to reduce greenhouse gas emissions to 108 % of 1990 emissions in the period 2008/12. The Greenhouse Challenge is a joint voluntary initiative between the national Government and industry in Australia to abate greenhouse gas emissions. Participating organisations sign agreements with the Government, which provide a framework for undertaking and reporting on actions to abate emissions. The Greenhouse Challenge was launched in 1995. An implementation plan was drawn which describes the program in the following way: “The Commonwealth and industry will work together to put in place cost-effective, flexible, voluntary measures that will constitute credible commitments to significant greenhouse gas reductions through improvements in energy and process efficiency on a continuing basis and by enhancing greenhouse gas sinks.” The Greenhouse Challenge is administered by an own organisation within the Australian Greenhouse Office.
Objectives The Greenhouse Challenge Program is a voluntary co-operative partnership between government and industry which aims to: • achieve maximum practicable greenhouse abatement performance by members; • drive continuous improvement by members of their management of greenhouse gas emissions; • develop knowledge and experience about measuring, monitoring, managing, reporting and
verifying greenhouse gas emissions and sinks; and • strengthen understanding and knowledge between government and industry about practical and
cost-effective ways of managing greenhouse gas emissions.
Progra mme descr iption Procedure of involvement
Participation is voluntary. An organisation joining the Challenge makes either an individual, facilitative or aggregate cooperative agreement. Individual cooperative agreements are reached with organisations to reduce emissions from that particular organisation. A facilitative agreement is made with a representational body such as an industry association, where the association agrees to support and actively encourage its members to join the Challenge. An aggregate agreement is generally made by an industry sector (in whole or part), with an industry association preparing and entering into an agreement on behalf of its members in that sector. The agreement describes in aggregate the actions to be taken, inventory information and emissions forecasts for those individual organisations covered by the agreement. The CEO of the participant signs the agreement.
Motivation to participate
The main motivation to join the Challenge was to reduce costs and adopt best practice processes; highlight the organisation’s commitment to responsible environmental management; demonstrate the viability of voluntary action; and improve dialogue and understanding between government and business.
Coverage of energy or GHG emissions
All greenhouse gases including greenhouse gas sinks.” According to the Implementation Plan action plans drawn by participants could include policies or measures that extended beyond the boundaries of the participating organisation. These types of actions, termed influence actions, can occur at either the domestic or international level (provision of products that result in fewer emissions by end-users, upstream activities to influence suppliers.
Sector coverage 728 companies (challengers) have signed the agreement (as of 28 January 2004). Close to half of the companies are from the manufacturing sector; the other companies belong to the tertiary sector as well as the agricultural sector. For comparison: by 1 July 1999, the time of the last evaluation report, 224 large and medium-sized companies had effectively signed an agreement.
According to the evaluation from 1999, the Challenge targeted by the time 55 % (267.9 Mt CO2-e) of the 1995 greenhouse gas emissions of Australia, given as 487 Mt CO2-e. The agreements concluded up to 1999 covered 47% (125.1 Mt CO2-e) of the targeted emissions, hence roughly a quarter of all national emissions. Given the increase in participants up to 2004, this figure should be considerably larger though the largest emitters were already included in the 1999 evaluation. In the manufacturing sector coverage of emissions by the Challenge was 65% in 1999, the electricity generation & distribution 98%, the mining sector 78%, the oil and gas extraction 98%. Coverage of other emitters (generally tertiary sector) was only 3%, given that they are comparatively small emitters.

World Energy Council Energy Efficiency Policies and Indicators – ANNEX 1
42
Target(s) The cooperative agreements under the Challenge do not impose specific quantitative abatement
targets. The Implementation Plan describes the objective of agreements as: “... to ensure industries and firms seek continuous improvements in energy and process efficiency, achieve maximum practicable greenhouse abatement performance, and at the same time, enhance their competitive advantage. It is also intended to encourage the development of long term sustainable strategies in response to climate change concerns.”
Targets of 500 large and medium-sized participating organisations by 2000 and 1000 by 2005 were set in a statement of the Australian Prime Minister in 1997. In November 1997, Australia’s Second National Report under the FCCC indicated that participants were expecting to abate emissions by 22 Mt CO2-e annually against static efficiency in 2000. This static efficiency objective was met according to the evaluation report. Later in the Second Report it forecasts that the Challenge will reduce emissions by 10 Mt CO2-e annually by 2010 against a business as usual scenario. However, these are non-binding targets.
Companies participating are obliged to set up inventories of greenhouse gas emissions and sinks according to guidelines; assess actions to reduce emissions including financial, environmental and other considerations; forecast emissions to 2000 (by the time of the first evaluation in 1999) and 2005; submit and annual progress report
Verification Verification is carried out sequentially for a selected number of participants. Independent verification was first in 1998 with four Greenhouse Challenge Members involved in an informal pilot verification. In 2000, 31 members of the programme were verified on a voluntary basis in a first round of independent verification. In 2002, another round of 23 members were verified. The verification process includes verification of reports and on-site visits.
Sanctions No sanctions as the participants have no binding quantitative targets
Accompanying measures
Managing Energy for Profits (MEFP) was added to the Challenge in 1997 to help medium-sized organisations reduce energy consumption. In most instances energy consultants are appointed to assist organisations in mapping their energy use and quantity. Workbooks are also provided to assist participants in completing a pro forma agreement and workshops are held detailing how to join the Challenge. MEFP is aimed at benefiting organisations that would typically spend approximately $500,000 to $2 million a year on energy and fuels.
Greenhouse Allies was developed in 1998 and utilises a partnership approach to extend the influence of the Challenge to small businesses. This takes advantage of relationships and networks between existing Challenge members and small businesses. Challengers use expertise gained through developing their own cooperative agreements, and act as Partners in mentoring and assisting groups of smaller businesses. Small businesses are shown ways to improve energy management and implement sound greenhouse practices without undue time, financial or expertise costs to their company.
Impact/eva luation
Ex-post evaluation So far, one evaluation study was carried out and published in October 1999. Hence an independent evaluation on the recent performance (1999-2003) is not publicly available. The evaluation has been managed by a Steering Group, chaired by a member of the Australian National University. The members of the Steering Group were drawn from the Greenhouse Challenge Joint Consultative Committee and include representatives from Commonwealth agencies and industry associations. Input from key environmental groups was sought at the outset of the evaluation.
The evaluation aimed at assessing the achievements of the Greenhouse Challenge (against performance indicators of emissions abatement, participation, management change, domestic and international influence), the efficiency and effectiveness of the program methodology and delivery, and the most appropriate future directions for the Greenhouse Challenge.
The evaluation was based on programme data (from the cooperative agreements and the progress reports delivered annually by participants), interviews (with participants and non-participants), and international comparison with seven international voluntary programmes. However, according to the evaluation report by the time of 1999 nearly no progress report was available as many companies had recently entered the agreement.
The evaluation report established the emission savings for 2000, which was based on the estimates provided by the companies, hence the result is rather an ex-ante evaluation. The estimates were based, according to the evaluation report, in most cases on static efficiencies of 1995, hence did not considered autonomous progress in efficiency in the period.
Measures undertaken to reduce emissions are, according to the evaluation report: fuel switching; purchase of new equipment; process changes; increased use of sequestration in carbon sinks to offset emissions of greenhouse gases; changes to lighting; recycling; and others (including best operating

World Energy Council Energy Efficiency Policies and Indicators – ANNEX 1
43
practice, training and improved maintenance).
The evaluation report notes significant limitations in information and data underpinning analysis. Electricity related emissions are reported at source and at end-use under the Challenge. In the evaluation, electricity source and end-use information is presented separately to avoid this double inclusion
Performance Indicators
• Total aggregate emission abatement (for each member, sector and the Program as a whole) – measured both in terms of absolute and relative changes in inventories and emission intensity.
• Continuous Improvement Indicators – for example, percentage of members with energy or greenhouse management systems, and percentage of members with greenhouse considerations integrated into their business planning process.
• Coverage of the Program – measured both in terms of coverage of total industry emissions and number of member companies, particularly in sectors where significant abatement opportunities are identified.
• Reporting obligations are met by members – measured in terms of numbers/proportion of current reports received, how many progress reports are overdue and by how long.
• Performance verification – a representative sample of reports are verified on a regular basis to ensure integrity of the data and credibility of the Program.
Public costs At the inception of the Challenge in 1995 the program had an annual budget of $591,000 (Australian
Dollars). Targets and expectations have increased since and in 1999 resources were $6,000,000 per annum. Involvement in the Challenge for industry has also been resource intensive, both in terms of time and finances.
Environmental effectiveness
For end-users, abatement actions taken under action plans were reported in the evaluation report to achieve 23.5 Mt CO2-e of abatement in 2000. Without the Challenge, annual emissions would have grown between 1995 and 2000 (assuming static efficiency) by 25.6 Mt CO2-e (without abatement actions) or 20.8 per cent. They are in fact, expected to grow by only 2.1 Mt CO2-e (with abatement actions) or 1.6 per cent. For electricity generators and distributors, actions taken are expected to achieve annual abatement of 5 Mt CO2-e in 2000. This will reduce growth in annual emissions from 36.4 Mt CO2-e (without actions) to 31.4 Mt CO2-e (with actions). This represents a reduction in growth from 26.5% (without actions) to 22.8% (with actions). After adjusting for the double inclusion of electricity related emissions included in these two figures, it is estimated that the overall annual abatement in 2000 due to actions is expected to be 27 Mt CO2-e. These emission changes are projected against a backdrop of strong economic growth (21% over 5 years) and an increase in population (6.3% over 5 years).
The Greenhouse gas newsletter from January 2004 mentions an achievement of 21 Mt CO2-e by 2003, hence somewhat lower than the projections for 2000.
Projected emission abatement against a ‘business as usual’ forecast were not quantified in the evaluation due to "practical data and methodological complexities". The report notes that some of the abatement reported against a static efficiency baseline would have occurred in the absence of the Challenge but that for over half of surveyed organisations, the Challenge played a significant role in stimulating abatement action.
Impact on firm behaviour
The evaluation report noted that " two-thirds of organisations reported positive management and cultural changes, with the most important changes relating to processes and practices shaping the way decisions are made. " In a few cases, these changes are starting to translate into specific changes to investment criteria.
References
Source Australian Greenhouse Office 1999, Greenhouse Challenge Evaluation Report, Commonwealth of Australia, Canberra. ISBN 1876536 551. Greenhouse Challenge web site: www.greenhouse.gov.au/challenge/

World Energy Council Energy Efficiency Policies and Indicators – ANNEX 1
44
Germany
1st and 2nd voluntary agreement of German industry on the reduction of CO2 emissions and specific energy consumption
Context In the early 90ies German industry had signalled interest in voluntary agreements through talks between the head organisation of German industrial associations, BDI, a few member associations and the Federal Government. The German economy, which is represented by the BDI as well as by several associations of the energy supply sector, is convinced that improving energy efficiency and reducing CO2 emissions are more likely to be achieved at a reasonable cost through voluntary agreements with clear targets than by imposing a CO2/energy tax or regulation. Energy taxes would have only a small impact on energy efficiency and would tend to increase the general tax burden and reduce the competitiveness of the German economy.
This line of reasoning was also expressed in the Declaration of the German Industry for Climate Protection of March 10, 1995, in which the participating associations declared that, compared to 1987, they would reduce the specific energy consumption of their member companies by up to 20% by 2005. After severe critics that the target was too soft, this declaration was amended in several points on March 27, 1996 and the target was sharpened to 20% (BDI, 1996).
Furthermore, the declarations take 1990 as the base year, not 1995, the year of the first declaration. 1990 was the year in which the East German industry - after reunification - shrank catastrophically, and in which the entire East German economy began a major restructuring process. This backdating of the base year to a point in time five years before the first declaration generates new problems for the evaluation as, for the period 1990 to 1995, apart from enormous structural changes, one has to distinguish between investments which were "carried out anyway" due to necessary reinvestments being postponed for years or decades, and others which were carried out in expectation of a CO2 /energy tax ("special efforts").
A second round of declarations was opened up in the year 2000/2001, aiming at the reduction of greenhouse gases and the promotion of CHP.
Objectives The voluntary agreements between the German government and the associations of the German economy aim: • to contribute to the German climate change programme • to reduce specific energy consumption and emissions from industrial sources and from the
energy supply sector, both within the industrial sector and the residential/tertiary sectors (through the energy suppliers). Hence the agreement aims both at the efficiency of processes and of products.

World Energy Council Energy Efficiency Policies and Indicators – ANNEX 1
45
Progra mme descr iption
Procedure of involvement
Involvement of companies occurred through the participation of the association to which the company belonged
Motivation to participate
• Avoidance of energy/CO2 taxation (introduced in 1999) • Avoidance of mandatory energy management (in discussion in early 90ies)
Coverage of energy or GHG emissions
The first voluntary agreement (1995-2000) covered energy and CO2 (depending on the association either in specific terms, i.e. related to some production unit) or in absolute terms. The second declaration from the year 2000 included all six Kyoto greenhouse gases and CO2 in particular.
Sector coverage • 14 member associations of the BDI, the German industrial head association (including the mineral oil association (MWV))
• the association of industrial power generators (VIK) • the association of gas and water supply (BGW), the head organisation of electricity supply
companies (VDEW), the organisation of municipal companies (VKU) • German Association of Industry and Commerce (DIHT) About 75% of the industrial energy consumption, 99% of the public electricity supply and an important part of the energy supply for the residential and tertiary sector was covered by the first agreement.
Target(s) The target of the first agreement was to reduce the specific energy consumption or CO2 emissions of
the member companies by 20% by 2005 as compared to 1990. Individual associations participating in the agreement set the following targets:
Source: Buttermann and Hillenbrand (2002)

World Energy Council Energy Efficiency Policies and Indicators – ANNEX 1
46
In the second voluntary agreement from 2000 the target was set to reduce the specific emissions of the 6 Kyoto greenhouse gases (CO2, CH4, N2O, HFC, PFC, SF6) by 35% in 2012 as compared to 1990, and to reduce the specific emissions of CO2 by 28% until 2005. The declaration, similar to the previous declaration, does not specify the meaning of “specific” but leaves it to the individual declarations of the associations to specify their targets more concretely. In addition to this general declaration, on 25 June 2001 a special agreement was made concerning CHP, which should achieve between 1998-2005 an absolute emission reduction of 10 Mt CO2 and of up to 23 Mt CO2 by 2012. The general declaration and the CHP declaration together should add up to a reduction of 45 Mt CO2 by 2012.
Monitoring Four monitoring reports available to the public for the years 1997-2000, including a final evaluation (see references). The monitoring was not based on the performance of the individual companies but on official statistics for the industrial sectors, hence CO2 reduction occurring through structural changes within sectors, in particular the structural changes related to the restructuring of the Eastern German economy, were included in the reduction. To a large degree, statistics provided by the associations themselves were used. The associations submitted individual reports to the RWI. There was no evaluation of the overall declaration of the participants. The final evaluation of the RWI points to the heterogeneity of the reports: “Some reports are partially missing essential elements and do not correspond to the criteria of a verifiable monitoring report. For example data concerning reduction of emissions or investments for the reduction measures or both are missing. An uncommented collection of a multitude of measures cannot replace a detailed description of individual measures” (translated from German).
The second round of agreements should also be accompanied by an independent monitoring but so far, no progress reports have been published.
Verification The institute in charge of the monitoring, RWI, should to a certain degree also verify the data
submitted by the associations. However, the final evaluation by RWI of the first period of agreements, published in 2002, concluded that “it is particular critical that the associations use increasingly instead of official statistics own statistical data. Although this might be justified in some cases due to gaps in the official statistics, it is clear, however, that this procedure limits considerably the verification of the results and makes cross-checking by an independent party nearly impossible” (translated from German).
Sanctions No sanctions foreseen
Accompanying measures
No accompanying measures
Impact/eva luation Ex-post evaluation The voluntary agreement includes evaluation and monitoring by a research institution. On 18
November 1997, the first monitoring report was submitted, in which its authors have reached the conclusion that industry is on the right way towards CO2 cuts through efficiency increases and structural change. About three quarters of the reduction commitment had already been achieved, but it was estimated that the distance still to be covered on the road towards the full reduction aim will be more difficult. Further progress showed the Monitoring Reports for 1998 (publ. March 1999), for 1999 (publ. November 2000) and 2000 (publ. April 2002) by RWI.
Performance Indicators
Degree of target fulfilment of individual industrial sectors or branches of the energy supply sector
Public costs Low: only a few persons involved in the ministries for Economic Affairs and the Environment to a small part of their time during the negotiation processes. Monitoring costs ca be estimated to around 200,000 Euro.
Environmental effectiveness
In total, a CO2 emission reduction by 78 million tons was reached between 1990 and 1999, of which 53 million tons in the industrial sector and 25 million tons in the public electricity supply area. A considerable amount is, however, due to the restructuring of the Eastern German economy, especially from 1990 to 1995: by 1996, the year of the updated first declaration, already 69 million t of CO2 reduction had been observed.

World Energy Council Energy Efficiency Policies and Indicators – ANNEX 1
47
Source: Buttermann and Hillebrand (2002) RWI in its 2002 final evaluation report points to the following issues: • With the Monitoring 2000 report the first round of voluntary agreements is concluded in
Germany, as since 6 November 2000 there is the new agreement between the German Government and the German Industry, which does not only fix new targets but integrates also the „Six GHG approach“ of the Kyoto Protocol.
• RWI criticises the still rather heterogeneous way of reporting by individual sectors, which in some sectors impedes the meaningful monitoring of results. This is in particular the case when associations use own statistics which are not opened up to the monitoring process.
• RWI as in previous reports points to the very high degree of target achievement already after half of the agreement period: nearly all sectors have the target for 2005 already reached by 2000, or have surpassed it (see figure below for 1998, i.e. three years after the updated declaration). RWI suggests to go for more ambitious targets, which for the overall declaration was taken with the declaration from November 6, 2000 (see Voluntary agreement with German industry II). However, the adoption of individual declarations is still lacking behind.
• In the reformulation of the agreements new elements must be taken into account: the possible integration of Kyoto flexibility instruments, sanctions in the case of under- or over-compliance, in particular if the agreements are linked to other instruments. (e.g. tax reductions for the manufacturing industries within the ecological tax reform, which is currently criticised by the EU Commission for competition reasons)
Source: Buttermann and Hillebrand (2002) In Ziesing et al. (1997), the pure effect of the voluntary agreement is estimated considerably lower to 14 Mt of CO2 for 2005 (ex-ante evaluation), since a considerable part of industrial CO2 reductions are due to autonomous technical progress, structural changes in industry, fuel substitution and influence of other measures (e.g. financial programmes)
Transparency/ Openness
Independent organisations are not directly included, except for the monitoring institute which was chosen in agreement between the public and private representatives in the agreement.

World Energy Council Energy Efficiency Policies and Indicators – ANNEX 1
48
References MURE (Measures for the Rational Use of Energy ) database: www.mure2.com (chose MURE online and the
industrial sector measure database)
BDI (1996): Aktualisierte Erklärung der deutschen Wirtschaft zur Klimavorsorge, Bundesverband der Deutschen Industrie, Köln 27 March 1996,
Buttermann H.G. and Hillebrand, B. (2002): Fourth Monitoring Report Monitoring Report 2000: Die Klimaschutzerklärung der deutschen Industrie vom März 1996 – eine abschließende Bilanz. RWI Heft N°40 (Essen University), April 2002 (in German) (see Monitoring website of the RWI below)
Buttermann H.G. and Hillebrand, B. (2000): Third Monitoring Report (1999): CO2 -Emissions in German Industry 1997–1998. RWI Papers N°70 (Essen University), November 2000 (see Monitoring website of the RWI below)
Ressing, W.: The Declaration of German Industry on Global Warming Prevention. Fact sheet. German Ministry of Economic Affairs. Paper presented at the IEA workshop Government-Industry Cooperation to Improve Energy-efficiency and the Environment Through Voluntary Action, 22 February 2001, Washington DC www.iea.org/Textbase/work/workshopdetail.asp?id=108
Ziesing, H.-J. et al: Politikszenarien für den Klimaschutz. Band 1. Jülich, Forschungszentrum 1997
Website of the RWI CO2-monitoring of the first round of agreements (in German, some summaries in English): www.rwi-essen.de
Klimaschutzvereinbarung der deutschen Wirtschaft: www.bmwi.de

World Energy Council Energy Efficiency Policies and Indicators – ANNEX 1
49
Netherlands
Long-term Agreements and Benchmarking Agreements
Context Since 1992, long term agreement (LTAs) on energy efficiency have been concluded with industry and other sectors (agriculture, commercial and non-profit services and energy conservation sectors) as a part of energy conservation policy. LTAs are voluntary agreements between the Ministry of Economic Affairs and a particular business sector regarding efforts to improve energy efficiency by a specific percentage within an agreed period. As of 31 December 1999, a total of 29 LTA’s have been concluded with industry and 14 with other sectors.
After ending of the first round of LTAs (1989-2000), negotiations of second-generation LTAs (2000-2012) have been carried out, which apply to the less energy-intensive industries. In parallel, benchmarking covenants were introduced for the more energy-intensive companies participating in the first round of LTAs
Objectives The LTA also includes the commitments of the individual companies, such as the preparation and implementation of energy conservation plans (ECP) and annual monitoring of energy consumption, expressed in the EEI (Energy Efficiency Indicator). An ECP consists of the following elements: • A description of energy consumption in the reference year and the current year • The company’s energy efficiency target • An indication of possible activities until 2000 • An estimated timetable of activities • The method for determining the EEI • The reporting method Many of these agreements expired in 2000. In the coming years, a total of 17 are expected to be renewed and 5 new ones will be contracted. The distinguishing features of the new generation of LTAs are:
• A more individual approach to companies/institutions
• Energy consumption in the sector concerned is higher than 1 PJ per year
• The companies/institutions that contract an LTA jointly account for more than 80 % of energy consumption in their sector
• In 2001, monitoring will be standardised at an improved quality level
• All companies/institutions taking part will have an energy management system in 2002
• Reasonable measures will be taken, with an internal interest rate of at least 15 %. This corresponds to a recovery period of 5 years or less for investments.
The new-generation LTAs will focus mainly on the larger energy consumers. The LTA is often too heavy an instrument for smaller consumers.

World Energy Council Energy Efficiency Policies and Indicators – ANNEX 1
50
Progra mme descr iption Procedure of involvement
In order to contract an LTA, a market segment must comply with a number of conditions: 1. The segment’s energy consumption level should exceed 1 PJ 2. the energy consumption of the companies taking part should account for at least 80% of the total
energy consumption in the segment 3. The sectoral organisation must be well organised, in the sense that it has god contacts with its
members and can effectively provide them with information 4. The sectional organisation must demonstrate a commitment to actively encouraging compliance
with the LTAs. Companies with a substantial energy consumption level (at least 0.1 PJ) that do not belong to a sectoral organisation with an LTA have the option of joining the Other Industry LTA on an individual basis.
Before an LTA is contracted with a segment, an exploratory survey is conducted into the conservation opportunities and the associated potential. This can involve both organisational measures (good housekeeping and energy management) and technical ones. The survey results form the input for the determination of a quantified energy conservation target for the segment as a whole. The means to realise the target for the entire segment are defined in a long-term plan (LTP). A review of the energy conservation options is derived from the survey.
Target(s) LTA1: The target was an average energy-efficiency improvement of 20 % in industry, 25-30 % in
utilities and 23 % in the agricultural sector by the year 2000, relative to 1989. These figures relate to energy consumption per physical unit of product. Consumption for non-energy purposes (e.g. the use of oil as a raw material in the production of plastics) is not a factor. This means that the energy efficiency level is not affected by a higher level of energy consumption resulting from economic growth or a switch of production to more energy-intensive sectors and products.
Monitoring The progress of the LTAs is monitored annually. The reported improvement in energy efficiency for all LTA sectors in 1999 was 2,9 % in comparison with 1998. The EEI dropped from 82.5 down to 79.6. Conservation realised in 1999 was higher than the 2% realised in 1997 as compared to 1996. Over the period of 1989-1999 an average Energy Efficiency improvement is achieved of 20.4%. By this the objectives for 2000 are already realised.
Sanctions No
Impact/eva luation Ex-post evaluation A study from University of Utrecht, (Rietbergen et al., 2001 and Glasbergen et al., 1997) analysed
the actual outcome of LTAs on industrial energy efficiency improvement in the Netherlands. The study employed two different methods (expert judgement and company surveys) in an attempt to obtain an estimate of the effectiveness of LTAs. Two main conclusions were (1) it is estimated that, on average, between a 25- 50 % of the energy efficiency improvement in the manufacturing industry of the Netherlands is caused by the LTAs, and (2) without LTAs, energy efficiency improvement in industry probably would have been about 1 % per year instead of 1.8 %. However reaching such conclusions was not without some uncertainty due, in large part, to a lack of adequate program data for evaluation. Further development of tools for the evaluation of policy effectiveness is necessary.

World Energy Council Energy Efficiency Policies and Indicators – ANNEX 1
51
Source: Peter van Luyt (2001)
Performance Indicators
• Energy Efficiency Indicator defined at the level of the individual company
Public costs LTA 1: The MJA with the industry sector, that run from 1989-2000 had cost € 159 million. MJA at itself is not a costly process. However, subsidies devoted to raising awareness and transfer of knowledge are extremely important for the establishment of and the progress of the MJA’s. This is less the case with investment-subsidies. Especially the subsidies for CHP (until 1995, the Dutch government spent around € 24 million a year) make the total of energy savings policy rather expensive. Benchmarking The benchmarking covenant will run from 1999-2012 and has yearly implementation costs of € 2.3 million. The Ministry of Economic Affairs is the responsible ministry, the Commission Covenant Benchmarking and the Verification Bureau Benchmarking do the execution. An additional budget of € 13,6 million is available for training of staff of provinces and municipalities with respect to the application of the Benchmarking covenant in the environmental permits. The specific costs of Dutch voluntary agreements (estimated from a government perspective, i.e. excluding the net energy savings for the companies), were estimated by Utrecht University as follows (in comparison to other instruments):
Source: Rietbergen et al. (2001)

World Energy Council Energy Efficiency Policies and Indicators – ANNEX 1
52
Transparency/ Openness
The joint consultative committee in charge to overview the programme and charged with the first evaluation is only composed by industry and government representatives. Independent organisations are not directly included. No regular monitoring reports are available publicly
References
Glasbergen P, Das MC, Driessen PPJ, Habermehl N, Vermeulen WJV, Blok K, Farla JCM, Korevaar EM: Evaluatie meerjarenafspraken over energie-efficiency (Evaluation of long-term agreements on energy efficiency). Utrecht University, Department of Science, Technology and Society & Department of Environmental Science, 1997: www.chem.uu.nl
Interim Report Benchmarking Committee, Feb. 2002: www.benchmarking-energie.nl
Luyt, Peter van: LTAs and the recent Covenant Benchmarking Energy Efficiency Agreements in the Netherlands, NOVEM., IEA workshop Government-Industry Cooperation to Improve Energy-efficiency and the Environment Through Voluntary Action, 22 February 2001, Washington DC www.iea.org/workshop
Martijn G. Rietbergen, Jacco C.M. Farla and Kornelis Blok: Do Agreements Enhance Energy Efficiency Improvement? Analysing the Actual Outcome of Long-Term Agreements on Industrial Energy Efficiency Improvement in the Netherlands, Faculty of Chemistry, Department of Science, Technology and Society, Utrecht University. IEA workshop Government-Industry Cooperation to Improve Energy-efficiency and the Environment Through Voluntary Action, 22 February 2001, Washington DC www.iea.org/workshop
Website for LTA 1 and 2: www.mja.novem.nl
Website for benchmarking covenants: www.benchmarking-energie.nl

World Energy Council Energy Efficiency Policies and Indicators – ANNEX 1
53
European Union
Voluntary Labelling of LV AC Electric Motors (CEMEP/EU Agreement)
Context The European motor manufacturers, CEMEP (European Committee of Manufacturers of Electrical Machines and Power Electronics, www.cemep.org) and the European Commission have agreed in 1999 to a joint classification system that will enable all Original Equipment Manufacturers (OEMs) and other customers and users of electric motors to have an appreciation of the efficiency of this component. At the same time, the share of the lowest labelling class should be reduced. This agreement will be revised in the year 2004/2005 on the basis of the experience since 1999.
Objectives The joint target of the participants is a transformation of the European motor market toward higher efficiencies and save of electricity. This target will be achieved by providing better information to
customers about the advantages of improved motor efficiencies, a clearer designation of motor efficiency and by reducing the production/sales of low efficiency motors.

World Energy Council Energy Efficiency Policies and Indicators – ANNEX 1
54
Progra mme descr iption Procedure of involvement
Participation based on a voluntary decision of each equipment manufacturer
Motivation to participate
This agreement is intended to be an easier to handle and sooner to realize alternative to public regulations.
Sector coverage No estimates available on what share of electricity used for electric motors is covered. It can be assumed that the 2- or 4 pole motors are largely covered.
Target(s) The agreement comprises the following elements:
• Target: Voluntary target of participants to reduce the market penetration of 3 motors (4-pol) in their joint sales by 30 % by 31/12/2001 and by 50 % by 31/12/2003 (compared to the base year 1998). In the case of 2-pol-motors the market penetration of eff3 motors in the joint sales of the participants shall be reduced by 30 % by 31/12/2002 and by 50 % by 31/12/2003.
• Classification as eff3, eff2 or eff1, all motors covered by the following definition: three phase A.C. squirrel cage induction motors 1.1 to 90 kW, 400 V (low voltage) with 2- or 4-poles (compared to the base year 1998).
• Efficiency classes eff3, eff2 and eff1 are defined in Table 1 below
Table 1: Class definition for 4-pole motors and 2-pole motors
kW Class definition for 4-pole motors Class definition for 2-pole motorseff3 eff2 eff1 eff3 eff2 eff1
ηN
ηN
1.1 < 76.2 >= 76.2 >= 83.8 < 76.2 >= 76.2 >= 82.81.5 < 78.5 >= 78.5 >= 85.0 < 78.5 >= 78.5 >= 84.12.2 < 81.0 >= 81.0 >= 86.4 < 81.0 >= 81.0 >= 85.63 < 82.6 >= 82.6 >= 87.4 < 82.6 >= 82.6 >= 86.74 < 84.2 >= 84.2 >= 88.3 < 84.2 >= 84.2 >= 87.6
5.5 < 85.7 >= 85.7 >= 89.2 < 85.7 >= 85.7 >= 88.67.5 < 87.0 >= 87.0 >= 90.1 < 87.0 >= 87.0 >= 89.511 < 88.4 >= 88.4 >= 91.0 < 88.4 >= 88.4 >= 90.515 < 89.4 >= 89.4 >= 91.8 < 89.4 >= 89.4 >= 91.3
18.5 < 90.0 >= 90.0 >= 92.2 < 90.0 >= 90.0 >= 91.822 < 90.5 >= 90.5 >= 92.6 < 90.5 >= 90.5 >= 92.230 < 91.4 >= 91.4 >= 93.2 < 91.4 >= 91.4 >= 92.937 < 92,0 >= 92,0 >= 93,6 < 92.0 >= 92.0 >= 93.345 < 92,5 >= 92,5 >= 93,9 < 92.5 >= 92.5 >= 93.755 < 93,0 >= 93,0 >= 94,2 < 93.0 >= 93.0 >= 94.075 < 93,6 >= 93,6 >= 94,7 < 93.6 >= 93.6 >= 94.690 < 93,9 >= 93,9 >= 95,0 < 93.9 >= 93.9 >= 95.0
Note: ηN in accordance to existing IEC 34, summation of losses method.
• The values of efficiency, expressed as percentages, for full load ηN and for three quarters load η(3/4—load) and the classification code eff1, eff2 or eff3 should be specified in the motor catalogues. The catalogues had be adapted by the participants for 4-pole motors by June 2000 at the latest and for 2-pole motors by the end of December 2000 the latest.
• Label design: Designation in catalogues and on rating plates may be based upon the following logos:
Monitoring
A statistical secretariat of CEMEP monitors on an annual basis the market penetration of eff3, eff2 and eff1-motors (units produced/sold, weighted by efficiency class). CEMEP establishes a list of participants and keeps it updated. Participants are responsible for the accuracy of the information given to the statistical secretariat or to the national member associations of CEMEP. Efficiency

World Energy Council Energy Efficiency Policies and Indicators – ANNEX 1
55
Reporting
classifications stated by the participants must be based on test data that are in accordance with the currently valid European standards (EN60034-2 +A1:1996+A2:1996, summation of losses method). The publication of results includes no total figures, but indices and percentage shares.
The monitoring report should: • indicate the percentage of the market covered jointly by the participants. • publish the share of eff1-, eff2- and eff3-motors for the power range of 2- and 4-pole motors
each. • include a list of participating manufacturers supplying data • include a list of participating manufacturers not supplying data. • the Commission will be informed confidentially about the improvements of the single
participants. These data may not be published.
Verification Each participant will regularly check its products to ensure that the declared efficiencies and efficiency classes in the catalogue, and on the nameplate of its product, are correct as required by this agreement (self-verification).
Sanctions If a participant does not provide the required data in time, the national association or CEMEP will immediately issue a written statement of non compliance to the manufacturers concerned. The supply of the required data will be requested within one month after receipt of the statement. If the manufacturer has still not provided the required data in time, the name of this manufacturer will be published in the annual report, as being in non compliance to the signed agreement.
Accompanying measures
CEMEP creates additional information material for the public and promotes the classification scheme at European exhibitions. The participants provide motor data and support the EuroDEEM database on high-efficiency motors.
Impact/eva luation Ex-post evaluation The agreement is evaluated by a self-monitoring carried out by CEMEP based on the figures that the
motor manufacturers participating in the agreement have to provide on an annual basis. No indication is given on how many motors carry the label.
Figure 1 shows that the motors of Efficiency class 3 have been reduced already by 2002 more than required.
Figure 1: Impact of the CEMEP motor agreement 1998/1999 to 2002 (market shares in the sales of participants)
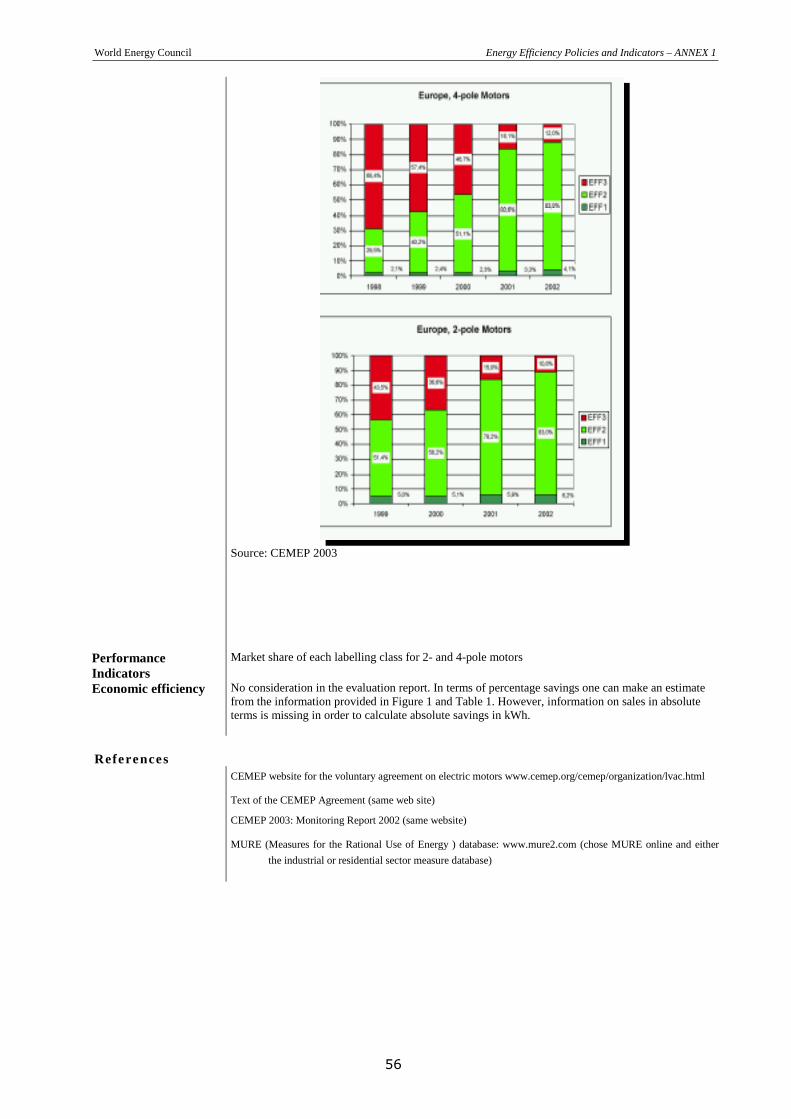
World Energy Council Energy Efficiency Policies and Indicators – ANNEX 1
56
Source: CEMEP 2003
Performance Indicators
Market share of each labelling class for 2- and 4-pole motors
Economic efficiency No consideration in the evaluation report. In terms of percentage savings one can make an estimate from the information provided in Figure 1 and Table 1. However, information on sales in absolute terms is missing in order to calculate absolute savings in kWh.
References
CEMEP website for the voluntary agreement on electric motors www.cemep.org/cemep/organization/lvac.html
Text of the CEMEP Agreement (same web site)
CEMEP 2003: Monitoring Report 2002 (same website)
MURE (Measures for the Rational Use of Energy ) database: www.mure2.com (chose MURE online and either the industrial or residential sector measure database)
World Energy Council Energy Efficiency Policies and Indicators – ANNEX 1
57
Finland
Conservation Agreements (Industry, Municipalities, Residential Sector)
Context Voluntary energy conservation agreements were introduced in Finland in November 1997. At the end of 2003, there were eight energy conservation agreements in force concluded between the Ministry of Trade and Industry and various branch associations with the aim of increasing the efficiency of energy use.
Four of the agreements were signed in autumn 1997 with the Confederation of Finnish Industry and Employers TT, the Finnish Energy Industries Federation Finergy, the Finnish District Heating Association FDHA, and the Finnish Electricity Association Sener. The new energy and climate agreement concluded with the municipal sector in autumn 2002 is a follow-up on the previous municipal energy conservation agreement.
An agreement was signed in 1999 with the Finnish Association of Building Owners RAKLI, and it was extended in autumn 2002 to cover also the real property of the state sector. The extended agreement replaced the co-operation programme for the state property units, which was signed in 1997 and expired at the end of 2002.
In March 2001, also the Finnish Bus and Coach Association concluded an energy conservation agreement. In November 2002, the agreement practice was extended to cover municipal and non-profit housing properties of the Federation of Housing Property Owners and Developers ASRA. The agreement encompasses about 290,000 homes, or over 65% of all right-of-occupancy and part-ownership homes, as well as homes financed with state-subsidized housing loans or interest subsidies. ASRA's members include the major public builders, such as VVO, SATO, SOA, YH-Yhtymä, as well as municipal owners of rental housing. In this sector, the responsibility rests with the Ministry of the Environment.
In July 2002, the Finnish Oil and Gas Federation and the Finnish Oil and Gas Heating Association signed the “Höylä II” co-operation programme on furthering energy conservation in oil-heated properties. The agreement is a follow-up on the previous “Höylä” co-operation programme launched in 1997. The Finnish Trucking Association SKAL’s energy conservation agreement, which expired at the end of 2002, was replaced with an energy conservation programme concerning truck and van transports at the beginning of 2003. The Ministry of Transport and Communications is responsible for this agreement.
The energy conservation agreements are mainly valid until 2005. Only ASRA’s agreement on housing properties extends to the end of 2012.
Objectives In the national climate strategy and the associated energy conservation programme, voluntary energy conservation agreements play a central role in the implementation of energy efficiency. The objective is that a total of approximately a quarter of Finland’s targeted greenhouse gas reduction in 2010 will be achieved by means of energy conservation measures. Measures increasing the use of renewable energy are expected to account for another quarter of the reduction. One central objective of the agreements is to extend the coverage of energy audits in the area in question.
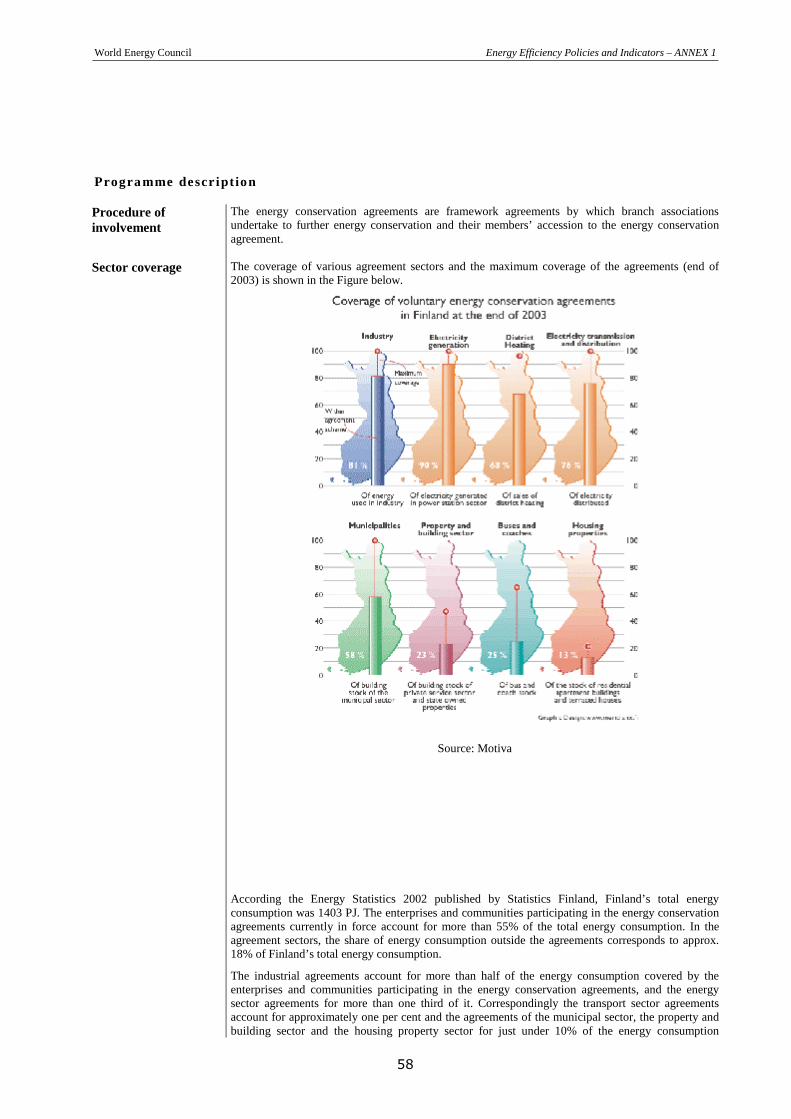
World Energy Council Energy Efficiency Policies and Indicators – ANNEX 1
58
Progra mme descr iption Procedure of involvement
The energy conservation agreements are framework agreements by which branch associations undertake to further energy conservation and their members’ accession to the energy conservation agreement.
Sector coverage The coverage of various agreement sectors and the maximum coverage of the agreements (end of 2003) is shown in the Figure below.
Source: Motiva
According the Energy Statistics 2002 published by Statistics Finland, Finland’s total energy consumption was 1403 PJ. The enterprises and communities participating in the energy conservation agreements currently in force account for more than 55% of the total energy consumption. In the agreement sectors, the share of energy consumption outside the agreements corresponds to approx. 18% of Finland’s total energy consumption.
The industrial agreements account for more than half of the energy consumption covered by the enterprises and communities participating in the energy conservation agreements, and the energy sector agreements for more than one third of it. Correspondingly the transport sector agreements account for approximately one per cent and the agreements of the municipal sector, the property and building sector and the housing property sector for just under 10% of the energy consumption
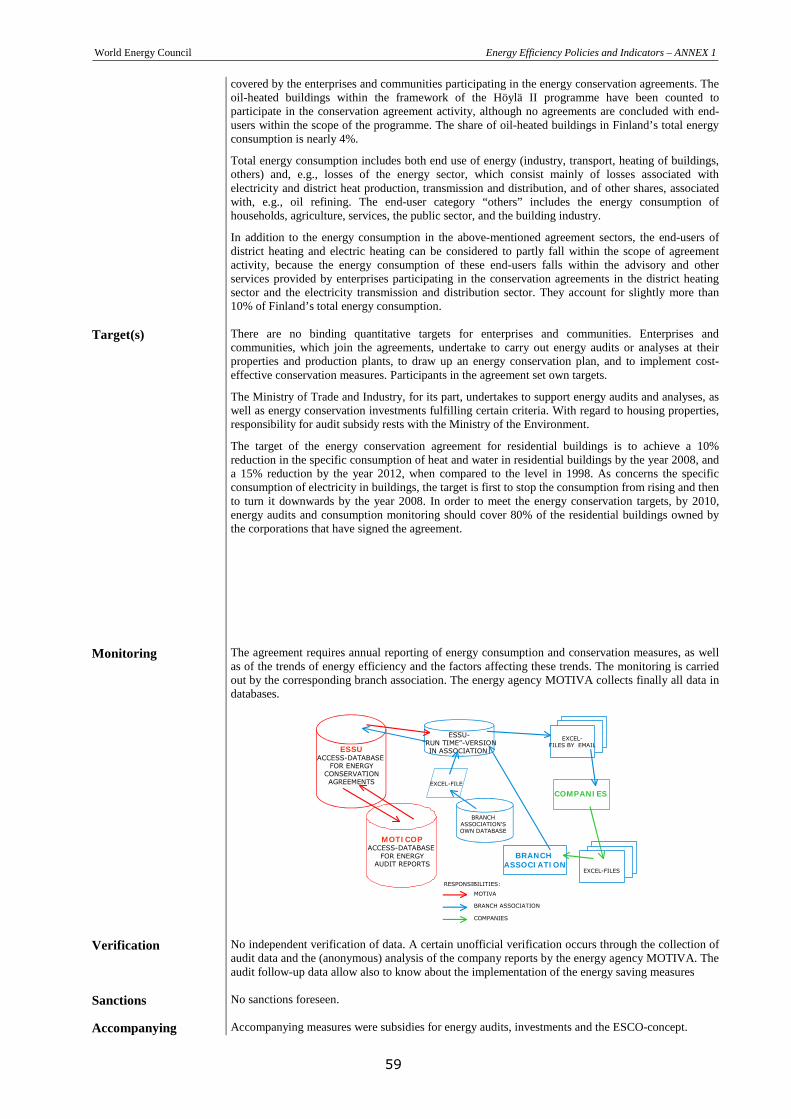
World Energy Council Energy Efficiency Policies and Indicators – ANNEX 1
59
covered by the enterprises and communities participating in the energy conservation agreements. The oil-heated buildings within the framework of the Höylä II programme have been counted to participate in the conservation agreement activity, although no agreements are concluded with end-users within the scope of the programme. The share of oil-heated buildings in Finland’s total energy consumption is nearly 4%.
Total energy consumption includes both end use of energy (industry, transport, heating of buildings, others) and, e.g., losses of the energy sector, which consist mainly of losses associated with electricity and district heat production, transmission and distribution, and of other shares, associated with, e.g., oil refining. The end-user category “others” includes the energy consumption of households, agriculture, services, the public sector, and the building industry.
In addition to the energy consumption in the above-mentioned agreement sectors, the end-users of district heating and electric heating can be considered to partly fall within the scope of agreement activity, because the energy consumption of these end-users falls within the advisory and other services provided by enterprises participating in the conservation agreements in the district heating sector and the electricity transmission and distribution sector. They account for slightly more than 10% of Finland’s total energy consumption.
Target(s) There are no binding quantitative targets for enterprises and communities. Enterprises and communities, which join the agreements, undertake to carry out energy audits or analyses at their properties and production plants, to draw up an energy conservation plan, and to implement cost-effective conservation measures. Participants in the agreement set own targets.
The Ministry of Trade and Industry, for its part, undertakes to support energy audits and analyses, as well as energy conservation investments fulfilling certain criteria. With regard to housing properties, responsibility for audit subsidy rests with the Ministry of the Environment.
The target of the energy conservation agreement for residential buildings is to achieve a 10% reduction in the specific consumption of heat and water in residential buildings by the year 2008, and a 15% reduction by the year 2012, when compared to the level in 1998. As concerns the specific consumption of electricity in buildings, the target is first to stop the consumption from rising and then to turn it downwards by the year 2008. In order to meet the energy conservation targets, by 2010, energy audits and consumption monitoring should cover 80% of the residential buildings owned by the corporations that have signed the agreement.
Monitoring The agreement requires annual reporting of energy consumption and conservation measures, as well as of the trends of energy efficiency and the factors affecting these trends. The monitoring is carried out by the corresponding branch association. The energy agency MOTIVA collects finally all data in databases.
ESSU- “RUN TIME”-VERSION
IN ASSOCIATIONESSUACCESS-DATABASE
FOR ENERGYCONSERVATIONAGREEMENTS
MOTICOPACCESS-DATABASE
FOR ENERGYAUDIT REPORTS
COMPANIES
BRANCH ASSOCIATION
MOTIVA
BRANCH ASSOCIATION
COMPANIES
RESPONSIBILITIES:
EXCEL-FILES BY EMAIL
EXCEL-FILES
BRANCHASSOCIATION'SOWN DATABASE
EXCEL-FILE
Verification No independent verification of data. A certain unofficial verification occurs through the collection of audit data and the (anonymous) analysis of the company reports by the energy agency MOTIVA. The audit follow-up data allow also to know about the implementation of the energy saving measures
Sanctions No sanctions foreseen.
Accompanying Accompanying measures were subsidies for energy audits, investments and the ESCO-concept.

World Energy Council Energy Efficiency Policies and Indicators – ANNEX 1
60
measures Energy audits: With the exception of the areas covered by the energy conservation agreements of the transport sector, the central objective is to extend energy audits and energy analyses to the greatest possible extent to the energy consumption in the area in question. In most agreement sectors, the energy conservation agreements have had a significant impact on the increase in the volume of energy audit activity in the last few years. The ministry of Trade and Industries (MTI) is subsidising the implementation of energy audit models. The subsidy is mainly 40 % of the audit costs. For municipalities and federations of municipalities that have signed the voluntary energy conservation agreement with the MTI the subsidy is maximum 50 %. Investment subsidies: Enterprises and communities, which have joined energy conservation agreements, can on certain conditions, receive investment support. Subsidised investments must be verified by reported energy audits, energy analyses or other similar reports. In 2003, the maximum subsidy percentage for conventional energy conservation investments was 15 -20%. Before the year 2002, the maximum subsidy percentage has been 10%. The minimum amount of a subsidised project was EUR 25 000, the maximum subsidy to one enterprise as a rule EUR 150 000 per year. As regards subsidised conventional energy conservation measures, priority is given to projects which save electricity. Subsidies are not granted for the renewal of the heating system, with the exception of switching over to the use of renewable sources of energy. As a rule, subsidy is granted for investments whose interest-free repayment period exceeds 2 years. In 2002 and 2003, some of the enterprises which received investment subsidies were so-called ESCO projects. In 2002, the ESCO projects accounted for approx. 20% of the subsidies granted and in 2003 for more than 35%. In both years, the ESCO projects accounted for slightly less than 20% of the total number of projects. Out of the total subsidy of EUR 7,0 million granted in 1998–2003, industry received approx. 67%, municipalities approx. 11%, the energy sector approx. 22%, and the property and building sector less than one per cent.
Source: Motiva

World Energy Council Energy Efficiency Policies and Indicators – ANNEX 1
61
Impact/eva luation
Ex-post evaluation The agreements contain provisions on the assessment of the contents, objectives and implementation of the agreements. Assessment of the agreements in force until the end of 2005 will start in 2004. Decisions on the continuation of this agreement activity after 2005 will be based on the results of the assessment as well as on other changes taking place in the environment, such as the introduction of emissions trading.
In 2001 an interim assessment of the agreement with industry and the energy sector was carried out. The feedback on the assessments was mainly positive, and the agreement will be prolonged in the present form until the end of the agreement period, in 2005. The assessment of the “Höylä” programme was also completed in 2001, and a new programme (“Höylä II”) based on the results of the assessment was launched in 2002.
The assessment of the municipal sector agreement and of the co-operation programme for the state property units was completed in autumn 2002. On the basis of the results, the municipal sector agreement was broadened out into an energy and climate agreement in force until the end of 2005. The co-operation programme for the state property units expired at the end of 2002. The programme was not renewed; instead, the state sector properties can join the existing property and building sector agreement, which was expanded in autumn 2002. The assessment of the agreement on the truck and van sector was also completed in autumn 2002. On the basis of the feedback received, the agreement was transformed into an energy conservation agreement, which was signed at the beginning of 2003.
In autumn 2003 a brief net-based inquiry on the property and building sector agreement was conducted. The results of the inquiry, concerning the profitability, cost-effectiveness, and organising of activities, were mainly positive and the agreement will be continued in its current form for the rest of the period.
According to the annual reports of the agreement sectors, the total effect of the energy conservation measures implemented in the participating enterprises and communities by the end of 2002 was approx. 4.1 TWh/a (electricity 0.73 TWh, heating+fuels 3.33 TWh). More than 85% (3.54 TWh) of the implemented measures are reported in connection with the energy conservation agreement of industry. The energy sector accounted for approx. 10% (0.46 TWh) of the conservation effect of the implemented measures. The rest of the implemented conservation effects were reported by the municipal sector (0.05 TWh) and the property and building sector (0.01 TWh). In addition, completed measures, whose saving potential is about. 0.8 TWh/a, were reported by various agreement sectors.
Public costs In 2003, a total of approx. 3 million € of investment subsidies were granted for 42 projects within four agreement sectors. Since the conclusion of the agreements, subsidies have been granted for 116 projects to the total amount of 7 million €.
Environmental effectiveness In addition to the above measures which have been implemented and completed, the total saving
potential of the energy conservation measures which according to annual reports are under consideration is 3,43 TWh/a, a somewhat higher figure than in the previous year. The cumulative annual energy conservation effect of implemented energy conservation measures reported by industry, the energy sector, the municipalities, and the property and building sector in reporting years 1998-2002
Source: Motiva When the conservation agreement system was started, it was estimated that the total saving potential in various agreement sectors would be approx. 11 TWh by end of 2005. Of this

World Energy Council Energy Efficiency Policies and Indicators – ANNEX 1
62
amount, electricity would account for approx. 10%. It was estimated that approximately half of this saving potential would be implemented by 2010. The conservation effects of the implemented measures reported by the end of 2002 confirm the opinion that the original estimate of the conservation effect, approx. 5.5 TWh, will be exceeded already during the agreement period, by the end of 2005. So far, the annual effects of the implemented conservation measures on carbon dioxide reduction are approximately 1Mt CO2, depending on the emission coefficients used in the calculations.
References Energy conservation agreements website: www.motiva.fi/
MURE database web site: : www.mure2.com

World Energy Council Energy Efficiency Policies and Indicators – ANNEX 1
63
Japan
Keidanren Voluntary Action Plan on the Environment (Section on Global Warming)
Context The Keidanren Action plan is a unilateral voluntary plan. There is no negotiation between government and industries. The Keidanren Voluntary Action Plan on the Environment was formulated by Nippon Keidanren ahead of the adoption of the Kyoto Protocol in July of 1997. It adopted as a unified goal for measures against global warming, the "reduction of CO2 emissions from participating industries in the industrial and energy-converting sectors in fiscal 2010 to below the levels of fiscal 1990." Japan Business Federation is an economic organization born in May 2002 from the joining of Keidanren (Japan Federation of Economic Organizations) and Nikkeiren (Japan Federation of Employers' Associations).
Objectives Contribute to the Japanese Kyoto target
Progra mme descr iption Procedure of involvement
Companies participate through their associations
Motivation to participate
Voluntary action plans are seen as the most efficient tools to deal with global problems such as the greenhouse gas effect. Keidanren rejects the introduction of negotiations between government and industry in the voluntary plan, regulation, emissions trading or tax instruments.
Coverage of energy or GHG emissions
Each industry can choose freely total CO2 emissions, CO2 emission intensity, or energy use and energy intensity.
Sector coverage A total of 35 industries participated in the fiscal 2003 Follow-up, with one new industry (Japan Lime Association). They comprise, in addition to many manufacturing industries, associations the Federation of Electric Power Companies, Japan Federation of Housing Associations, Communications and Information Networks Association of Japan and other actors in the field of transportation, offices and the household sector. These 35 industries emitted 507.95 million t-CO2 in fiscal 19902, equivalent to around 45.3% of the 1.1221 billion t-CO2 emitted by Japan as a whole during that year. Moreover, the emissions of the 35 industries represented approximately 82.6% of the total amount of CO2 emitted by the country’s industrial and energy-converting sectors in fiscal 1990 (615.3 million t-CO2).
Target(s) Reduction of CO2 emissions from participating industries in the industrial and energy-converting sectors in fiscal year 2010 to below the levels of fiscal year 1990.
Monitoring The monitoring is done by Nippon Keidanren on an annual basis based on the individual reporting of the participating associations. Keidanren carries out follow-up surveys each year on the progress of the respective voluntary action plans, and releases the results of these surveys widely to the general public via the Internet and other media. The Keidanren Voluntary Action Plan strives to encourage continual improvement, and is structured to spot and prevent failure to reach goals beforehand. A four-step process, which is repeated every year, ensures such improvement and effectiveness: (1) establishment of goals; (2) identification of measures to achieve goals; (3) periodic follow-up on the progress being made through these measures; and (4) the public release of follow-up results through the Internet etc.
The progress of the voluntary action plans is reviewed annually by related government councils; Keidanren also reports the results of these reviews to joint Meetings of such councils, which are established to review domestic proposals aimed at dealing with the problem of global warming.
Verification See Transparency/Openness
Sanctions None
Accompanying measures
None

World Energy Council Energy Efficiency Policies and Indicators – ANNEX 1
64
Impact/eva luation Ex-post evaluation Performance Indicators
Either absolute energy consumption or CO2 emissions or energy/CO2 intensities
Public costs None. Monitoring and evaluation are fully carried out by Keidanren
Environmental effectiveness
Results of 2003 indicate that CO2 emissions in 2002 were 498.5 M t-CO2, a 1.8% increase compared to f 2001 and a 1.9% decrease compared to 1990 (fiscal years).
Source: Nippon Keidanren (2003) BAU (business as usual): without Voluntary Action Plan from FY2003 on.
Transparency/ Openness
Independent organisations are not directly included. In July 2002 an Evaluation Committee for the Voluntary Action Plan was set up with the aim to increase transparency. Members of Committee are from Universities, Industry and from the Green Purchasing Network GPN. Tasks of the Committee are: evaluation of the collection and aggregation of data by industries participating in follow-up surveys and the propriety of performance of each stage of the process of reporting to the Nippon Keidanren Secretariat ("the Secretariat"); evaluation of whether reported data has been correctly aggregated by the Secretariat; and, finally, provision of recommendations to improved the transparency and credibility of the follow-up. Due to the need in the medium term to evaluate the suitability of the target setting in each industry and the relationship between each industry's targets and overall targets, and also to develop means of evaluating the environmental effectiveness of the Keidanren Action Plan these issues will be considered in the next year. The report of the evaluation committee criticized among others overlap in savings, heterogeneity in target setting and in emissions forecasts, insufficient evaluation of measures impact (suggestion of factor analysis).
References

World Energy Council Energy Efficiency Policies and Indicators – ANNEX 1
65
National Allocation Plan and voluntary/ negotiated agreements Netherlands The Netherlands National Allocation Plan and Benchmarking Covenants / Long-term
Agreements The draft National Allocation Plan of the Netherlands was published in February 2004. It is a grandfathering system with a 100 % free allocation of initial allowances. The NAP breaks the Kyoto target of the Netherlands down for the sectors industry (including energy sector), agriculture, transport, buildings (residential and tertiary) according to a projection up to 2010 for the different sectors (after addition to the target of the amounts of CO2 which they want to buy from abroad through the JI and CDM mechanisms, and after taking into account the other Kyoto greenhouse gases which are not broken down on the sectoral level, as they form not part of the emission trading scheme). The allocation within the industry/energy sector occurs according to the following formula (with a certain number of exceptions and after subtracting a reserve for new entrants to the trading scheme; also the formula for electricity suppliers, especially with CHP are somewhat more complicated):
A = E x G x EE x C, with: A = allocation for an individual installation E = historic emissions (average of 2001-2002) G = projected sectoral growth rate (2003-2006) EE = relative energy efficiency C = correction factor which assures that the overall emissions targeted for the sector are kept within specification Table 1: Participants of industrial and energy sector companies in NAs/VAs for energy efficiency
Units under ET-Directive
Share in CO2 emissions (
BM Industry 234 90 43.3 BM energy sector 30 42 45.0
LTA2 Industry 850 116 4.5 Others - 81 7.2
BM: Benchmarking Covenants LTA2: Second edition of Long-term Agreements ET: Emission Trading The benchmarking covenants and LTA2 are integrated in this calculation procedure as follows. Table 1 shows the split of allowances (emissions) for the EU-ETS for the participants of the previous sector agreements): � The general principle is that the existing contracts between the participants and the Dutch
government should be transferred to the setting of the emissions trading scheme as closely as possible.
� The relative energy efficiency factor EE is derived for the fuels (note that indirect emissions stemming e.g. from electricity used in the industrial sector do not belong to the sector) from the existing agreements as described below. The Dutch government tends to exclude a larger number of companies which are emitting less than 25 kt or in total less than 1.5 % of sector emissions from the scheme in order to reduce the administrative burden.
� For companies participating in the Benchmarking Covenants (in principle companies consuming more than 0.5 PJ) the distance to the world top, as fixed in the Covenants provide the guideline to derive the development of the EE factor for the period 2005-2007.
� For companies participating in the LTA2 (companies with less than 0.5 PJ), the measures fixed in their energy efficiency plan with payback periods of less than 5 years and to which the company has committed to, are used to fix the development of the EE factor.
� Companies which had no agreement in the past receive a standard reduction of the EE factor of 15 %
� If companies have already done more in the past than required by the existing agreements they can obtain additional rights, if they have done less they receive less rights. Thus, early action is rewarded.
� The existing agreements also provide a good basis for the determination of the historic emissions because they have already been established and verified independently in the course of these agreements

World Energy Council Energy Efficiency Policies and Indicators – ANNEX 1
66
UK The UK National Allocation Plan and Climate Change Agreements (CCA) The UK has decided to use a two-stage approach to allocate allowances to EU ETS participants. First, the total number of allowances is allocated to an intermediate “activity level” by using updated UK emission projections, which then is further distributed to individual installations in those activities. The UK distinguishes in the breakdown of allocations to the intermediate levels several categories, which have connections to the existing Climate Change Agreements (CCA), by distinguishing CCAs with relative and absolute targets: � Activities with relative targets in CCAs: Most carbon intensive sectors (apart from refineries
and generators) in the UK are covered by Climate Change Agreements (“CCAs”). These are voluntary agreements with the Government at sectoral and operator level providing for discounts from the climate change levy where energy efficiency improvements are undertaken. These agreements cover emissions from both electricity use (indirect emissions) and combustion (direct emissions). The EU ETS is only relevant to the direct emissions portion of the CCAs. In relation to these direct emissions, installations will, if accepted by the EU Commission have a choice between opting out of the EU ETS during the first phase (2005-2007) and retaining their CCAs completely. If an installation does not opt out, (i.e. it stays in the scheme) the CCAs will remain in place but will be amended so that it only covers the indirect emissions of the installation. The proportion of the CCA sectoral target which relates to direct emissions, was estimated using historic sector level CCA data. The allocations are derived from historic data for EU ETS installations to which growth rates from UK emission projections have been applied and then adjusted by the relevant CCA targets. CCA targets are biannual (2002, 2004, 2006 etc) and are expressed in terms of emissions per unit output or Specific Energy Consumption (SEC). For the purpose of calculating the Phase 1 allocations, the 2006 CCA targets have been used as a basis for calculating the allocations throughout that phase. The CCA targets for 2006 and subsequent year are due to be reviewed by end of 2004. The revised CCA targets will lead to a revised projected emission level for the CCA sectors during phase 1 of the EU ETS as a result of revised CCA targets.
� Activities with absolute CCA targets: This concerns only the Iron and Steel. The review of the CCA target for 2006 will be taken into account in calculating the projected emissions from this sector.
The activity level allocations are divided between installations according to each installation’s average share of annual emissions over the period 1998 to 2002, excluding the lowest year’s emissions for each installation.

World Energy Council Energy Efficiency Policies and Indicators – ANNEX 1
67
Germany The German National Allocation Plan and the Voluntary Agreements According to the Draft National Allocation Plan published by the Federal Environmental Ministry for Environment the total amount of emission allowances allocated to installations covered by the directive will be based on the Voluntary Agreement by the German industry. According to this VA total CO2 emissions by the major industry and the energy sectors will be reduced by 45 Mio t by 2010 relative to 1998 levels. That is, the total target for all other sectors emerged implicitly as the residual. The VA reduction target was first adjusted to account for emission reductions in sectors not covered by the EU-ETS (such as private households), which led to a reduction of the target by 10 Mt. Then the resulting budget of 35 Mt was split proportionally between the periods 2005-07 and 2008-12. Finally adjustments were made to this budget to account for the phase-out of nuclear energy (no effect in 2005-07, plus 7 Mt for 2008-12), provisions for early action with an overall cap (i.e. minus 30 Mt for 2005-07), and a reserve for newcomers (i.e. 15 Mt for 2005-07). Likewise, additional allowances for existing CHP plants and for process-related emissions had to be subtracted from the budget. Allowances are made based on average emissions for the years 2000-2002. For the actual allocation (grand fathering), energy-related emissions are adjusted by a correction factor (of around 0.92-0.93), which is identical for all installations, while process-related emissions are not adjusted. Thus, unlike in the Dutch Draft NAP existing sectoral VA-targets for specific emissions are not used for the allocation to individual allowances. Instead the overall target of the VA is used and – after some adjustments to account for CHP etc – this target is broken down equally (via the correction factor) for the individual allocation. Industry, however, realising that their emissions have increased since 1998 (base year of the agreement), consider the agreement as too demanding now. Some branch associations consider that they never signed the agreement, which is true to a certain degree as so far it was signed by the head organisation of the industry and a variety of branches only. The process of realisation of the agreement was fairly slow in the past three years.

World Energy Council Energy Efficiency Policies and Indicators – ANNEX 1
68
References Overview papers/books on VAs/NAs: OECD (1999): Voluntary Approaches for Environmental Policy: an Assessment, OECD, Paris. (Available for
purchase at www.sourceoecd.org)
OECD (2003): Voluntary Approaches for Environmental Policy – Effectiveness, Efficiency and Uses in Policy Mixes, OECD, Paris (Available for purchase at www.sourceoecd.org)
UNEP (2000): Voluntary initiatives: current status, lessons learnt and next steps. UNEP discussion paper based on the UNEP Multi-Stakeholder Workshop on Voluntary Initiatives, 20 September 2000, Paris. See also the United Nations Environment Programme website on Voluntary Initiatives (www.uneptie.org/outreach/vi_home.htm)
ten Brink, P., ed. (2002): Voluntary Environmental Agreements: Process, Practice and Future Use. Sheffield, UK: Greenleaf Publishing Ltd. (www.greenleaf-publishing.com/catalogue/volun.htm)
International Energy Agency (1997): Voluntary Actions for Energy-Related CO2 Abatement. Paris: OECD/IEA.
Price, L.; Worrell, E. (2002): Overview of Voluntary Agreements in the Industrial Sector, Energy Analysis Department, Environmental Energy Technologies Division, Lawrence Berkeley National Laboratory, July 2002 (eetd.lbl.gov/ea/ies/iespubs/vaoverview.pdf)
Böhringer, Ch. and Frondel, M.: Assessing Voluntary Commitments: Monitoring is Not Enough!, ZEW (Zentrum für Europäische Wirtschaftsforschung) Discussion Paper No. 02-62 (ftp://ftp.zew.de/pub/zew-docs/dp/dp0262.pdf
Segerson, K. and T. J. Miceli (1998): Voluntary Environmental Agreements: Good or Bad News for Environmental Protection? Journal of Environmental Economics and Management, Vol. 36, 109-130.
CEC (1996): Communication from the Commission to the Council and the European Parliament on Environmental Agreements, COM(96) 561 final, Brussels, 27.11.1996
Segerson, K. and Na Li (1999): Voluntary approaches to environmental protection. In: H. Folmer and T. Tietenberg (eds.) Yearbook of environmental and resource economics 1999/2000. Cheltenham, UK. Edward Elgar.
Khanna, Madhu (2001): Non-Mandatory Approaches to Environmental Protection. Journal of Economic Surveys, Volume 15, No. 3.
Orts, E.-W. and Deketelaere, K. (eds.) (2001): Environmental Contracts. Comparative Approaches to Regulatory Innovation in United States and Europe. Kluwer Law International, Dordrecht, the Netherlands.
Older overviews include the CAVA project (Concerted Action on Voluntary Approaches, see www.cerna.ensmp.fr/Progeuropeens/CAVA/Index.html and the literature review on voluntary approaches, mainly for the period 1993-2000), the VAIE project (Voluntary agreements – Implementation and efficiency, see www.akf.dk/VAIE) and the NEAPOL project (Negotiated Environmental Agreements, see fetew.rug.ac.be/ neapol/conference/index.html)

World Energy Council Energy Efficiency Policies and Indicators – ANNEX 1
69
Interaction of VAs/NAs with Emission Trading: European Union (2003): Directive 2003/87/EC of the European Parliament and the Council of 13 October 2003
establishing a scheme for greenhouse gas emission allowance trading within the Community and amending Council Directive 96/61/EC.
OECD (2003b): Voluntary Approaches for Environmental Policy, OECD, Paris. OECD (2003b): The use of Tradable Permits in Combination with other environmental policy instruments, ENV/EPOC/WPNEP(2002)28/FINAL, July 2003. (both papers by Nick Johnstone)
Johnstone, Nick (OECD): Emissions trading, taxes and voluntary agreements policy interaction. Paper presented at Third Annual Workshop on Greenhouse Gas Emission Trading: 23/24 September 2003, International Energy Agency IEA, Paris (Sessions: Interactions between GHG Emissions Trading and Other Policies)
European Union (2003): Directive 2003/87/EC of the European Parliament and the Council of 13 October 2003 establishing a scheme for greenhouse gas emission allowance trading within the Community and amending Council Directive 96/61/EC.
Schafhausen, Franzjosef: Climate Policy Mix: Voluntary Agreements and Emissions Trading. Federal Environmental Ministry, Germany. Paper presented at: Legal Issues in the Implementation and Enforcement of Climate Policies in Europe, 16/17 June 2003 (organised by EEP Network)
Albrecht, J. en François, D. (2002): Negotiated environmental agreements and CO2 emissions trading, in Ten Brink (Editor), 327-340 (see above)
EEA
EU NAP website: europa.eu.int/comm/environment/climat/emission_plans.htm
Other References:
Delmas, M.A. and Terlaak, A.K. (2000): Voluntary agreements for the environment: innovation and transaction costs, CAVA Working Paper 00/02/13, (www.cerna.ensmp.fr/Progeuropeens/CAVA/Abstracts/Delmas.pdf)
Eichhammer, W. and Jochem, E. (1999): Voluntary agreements for the reduction of CO2 greenhouse gas emissions in Germany and their recent first evaluation, CAVA Working Papers N°98/11/8, January 1999, presented at the CAVA workshop The World-wide Use of Voluntary Approaches: State of the Art and National Patterns, Ghent Nov. 26-27, 1999 (allserv.rug.ac.be/~mdeclerc/CMM/CAVA/papers/eichhammer.pdf)
Lévêque, F. (1996): Externalities, public goods and the requirement of a state's intervention in pollution abatement, Conference Economics and Law of Voluntary Approaches in Environmental Policy ,Venice, November 18-19, 1996 (www.cerna.ensmp.fr/Documents/FL-Venise96.pdf)
Lynn, P., Yun, J., Worrell, E., Wenwei, D., and Sinton, J.: Development of an Energy Conservation Voluntary Agreement Pilot Project in the Steel Sector in Shandong Province, Project Report to the State Economic and Trade Commission , People’s Republic of China (LBNL-51608), January 2003 (ies.lbl.gov/iespubs/51608.pdf)
Perrels, A. (2001): Efficiency and effectiveness policy instruments – concepts and practice, UNFCCC Workshop on Good Practices in Policies and Measures, 8-10 October 2001, Copenhagen (unfccc.int/sessions/workshop/010810/perrels.pdf)
Rousseau, S. and Proost, S. (2002): The cost effectiveness of environmental policy instruments in the presence of imperfect compliance. Working paper series N°2002-04, Catholic University of Leuven, June 2002 (www.econ.kuleuven.ac.be/ew/academic/energmil/downloads/ete-wp02-04.pdf)

World Energy Council Energy Efficiency Policies and Indicators – ANNEX 1
70
Prepared by Dr Oleg A Sinyugin, Moscow University
Local Energy Efficiency Information Centres
World Energy Council Energy Efficiency Policies and Indicators – ANNEX 1
71
Belgium
The Energy Information Centre network in Wallonia Objectives Budget Staff
The Walloon Region has a network of local energy information centres that are called «Guichets de l’énergie» (energy counters). This network is coordinated by the Walloon Regional Energy Administration (DG TRE), and was set up in 1985. Today 12 offices are distributed over the Walloon region.
«Guichets de l’énergie » is a service that advises households on energy efficiency issues. They provide a free information service. Their aim is to advise individuals about everything that relates to rational use of energy in the context of renovations or new buildings: insulation, heating, lighting, choice of domestic electric appliances and humidity problems. It also provides information on renewable energies. Typical question that are addressed to « Guichets de l’énergie » are :
• Which window glazing and which frame to use for the house ? • How to reduce the cost of heating ? • Why should we install a solar thermal system ? • How to communicate with one’s architect or with a heat engineer ? • Which type of washing machine should be bought ? • What kind of heating system should be chosen ? • What material should be used to insulate the house ?
The «Guichet de l’énergie » service answers with impartiality. It also diffuses a large range of documentation published by the Regional Energy Administration. In addition, the staff of the «Guichets de l’énergie » take part in local events such as markets and fairs. There are 3 ways to contact the « Guichets de l’énergie”: by phone, e-mail and in office. In 2001, the service received about 9 000 visits and answered more than 19 000 phone calls.
This service is entirely free. It is fully financed by the Regional Authority. For 2001, the budget was 2.1 million EUR, or an average of 166000 EUR per information point. In 2003, the « Guichets de l’énergie » employ 26 people. In general, 2 persons are employed per « Guichet de l’énergie» but in the larger cities (Liège and Namur) 3 people are employed. A system of training exists for the staff. A working group of consultants identifies the type of information that is lacking and weaknesses. To fulfil these weaknesses, the staff receives periodic training.

World Energy Council Energy Efficiency Policies and Indicators – ANNEX 1
72
China
Energy conservation service centres EMCs Description There were more than 180 energy conservation service centres with 3000 staff set by different areas
and industrial administrations during the1980s. Following the national, local and sectoral energy conservation plan, these centres got support from governments, provided technical services to enterprises and play very important roles in energy conservation under the planning economy conditions. As China market economy progress and administration reform, most canters lost the support from governments. Because of shortage of capacities of marketing, most centres can’t develop their business further and their roles are becoming less and less important. A new form of service agency—EMC (energy management company) has occurred in China following up the development of ESCOs in other countries. Three EMCs have set up energy conservation service centres to find the effective ways to promote energy efficiency under the market economy conditions in China.
Evaluation Till the first half year of 1999, these three EMC conducted 30 projects with the grant of 24.91
million yuan from EU and the total investment reached 34.98 million yuan. 24.91 million yuan has returned from those project, in which, 9 projects has get all investment back and others are in the stage of benefit sharing. More EMCs will be built in the further.
Energy Conservation Information Dissemination Centre
Description Energy Conservation Information Dissemination Centre (ECIDC) has been set up in 1997 under an energy efficiency promotion project supported by World Bank and State Economic and Trade Commission of China. The mission of this centre is to provide valid and independent information on energy efficiency, disseminate it to public, promote energy efficiency technology utilizations and achieve economic benefits and environmental protection targets through energy efficiency improvement.
Evaluation Up to year 2002, the centre has developed 56 best practice case studies that cover board range in industrial and public sectors. Each best practice case presents the information of investment, energy conservation, pay back time, emission reduction, and project hosted entity and auditing agency. The public can access all these information by free. The centre has published technical guidelines in 8 specific fields such as retrofitting air condition system at commercial buildings, industrial boiler efficiency improvement, condensing water recycle for steam network, and etc. The public can buy these technical guidelines by paying 60 RMB each.

World Energy Council Energy Efficiency Policies and Indicators – ANNEX 1
73
Denmark Copenhagen Environment and Energy Office Description Copenhagen Environment and Energy Office was officially founded in 1987. Copenhagen
Environment and Energy Office is a local association with 12 employees (including 2 energy advisors and 1 green guide) and 350 members. Its aim is to promote an ecological sustainable development in the Copenhagen area by providing impartial information and advice on environmentally friendly and resource saving solutions as well as working towards concrete solutions.
Budget Its approximate budget is 500 k per year, of which approximately 125 k per year used to be for
advisory work. The funding comes from the Copenhagen municipality (Dep. of Environment), various foundations and until 2002 from the Danish Energy Authority and The Green Foundation. Copenhagen Environment and Energy Office provides information and advice on RE, energy and water saving, waste separation, green accounts, rainwater usage and sustainable building materials. CEEO has been involved in various RE and energy efficiency campaigns and are running several projects:
Campaigns Energy efficient windows in 2001-2002; earlier campaigns on solar heating, biomass heating and fuel shift -electricity to biomass/district heating/gas. The campaigns have been targeting the public and decision makers in the public sector. The campaigns have been carried out in cooperation with installers and other stakeholders.

World Energy Council Energy Efficiency Policies and Indicators – ANNEX 1
74
France
The network of “Espace info-energie” Objectives A network of local energy information centres has been set up by the French National
Agency for Environment and Energy Efficiency (ADEME) in 2001. They are called “Espace Info Energie”. They have been created to provide for consumers an information service and advice on energy efficiency and renewables matters. The network has evolved and now comprises 155 local centres with 275 advisers
Network development A national coordination provides a jurisdictional framework (a charter); tools such as an
“extranet” database for questions/answers; organises training for the advisers and contacts with professional partners. It also ensures the promotion, monitoring and evaluation of the network. Specific developments are carried out at regional level to answer the exigencies of the service such as pre-feasibility studies, site visits, conferences and exhibitions.
ADEME and the local structures sign a multi-annual agreement. On average ADEME is funding one third of the total costs, local authorities supporting the remainder. The nature of participating local structures are different: associations dealing with environmental and renewables matters (43%); associations specialised in the building business (35%); structures linked with the local authorities (city, regions ) generally partly funded by the E.U. (15%); local consumers associations (7%).
Activities of the
network In terms of information and advice, the activity is increasing. 130 000 contacts of a 27 minutes average duration have been performed in 2002-2003. 80% were from households, 8% from professionals and 12% from organisations.
440 000 personalised information packs and 450 000 documents have been delivered over the 2002-2003 period.
2000 animated exhibitions, conferences on the theme of housing, DSM and renewables have been displayed by the network. More than 400 000 persons have been informed through this channel and 600 000 documents distributed
. Evaluation A qualitative evaluation based on 600 interviews has been carried out on personalised
information and advice activities.
The degree of satisfaction was very high, but depends on the targets types: 78% of individuals were very or quite satisfied, 92% of professionals and 91% of the organisations.
A quarter of the individuals have carried out works in the 6 following months after receiving advice. These works are generally large investments amounting on average to euros 7700 for each project. Projects have averaged yearly energy savings of 0.63 toe and a 1.1t CO2e abatement.
World Energy Council Energy Efficiency Policies and Indicators – ANNEX 1
75
UK
Energy Saving Trust (EST) : network of 52 energy information centres
Description To support the creation of partnerships on the local level, and to increase awareness, EST is building up a local authority/community support for energy efficiency and renewables through a domestic advice programme of EEACs (Energy Efficiency Advice Centres), six of which are now also REAC’s (Renewable Energy Advice Centres) throughout Great Britain. The Network is managed by the Energy Saving Trust (EST) and consists of 52 local centres. The strategy has been developed by EST in partnership with each of the EEACs, and executed locally by EEACs. They are independent organisations so have own internal decision making structures. The EEAC manager is in post at EST with administrative support. There are 52 EEACs hiring from 3 to 10 staff each. In 2001, 1.2 million customers were estimated across the network.
Objectives The aim of the network is to provide free, impartial and expert energy efficiency and renewable energy advice to householders that motivates them to implement measures and improve energy efficiency. The target audiences include all householders –private and public sector – owner-occupiers and tenants – fuel rich and fuel poor.
Activities • Delivery of energy efficiency advice to householders through bespoke energy advice reports, telephone visits and home visits.
• Increase energy efficiency awareness through presentations, training and exhibitions. • Motivate householders to take action through local co-ordination of national network of
energy efficiency installers and referrals to grant schemes.
Operation mode • Customer questionnaire leading to bespoke energy advice report • Freephone telephone advice • Home visits (on small scale - currently being piloted) • Grant information database available on line • EST website and some EEACs have own websites
Results • 6000 written advice reports in 2001/2 rising to 8000 in 2003/4
• 1000 verbal advice clients in 2001/2 rising to 2000 in 2003/4 • Service level agreements with all local authorities • In-kind match funding on a 1:1 basis to be drawn into the network. • Each EEAC to carry out on average per year: 100 presentations, 50 training sessions, 25
media interviews and to have a regional marketing plan
Quality Assurance • Each EEAC has annual monitoring visit • All EEACs sign a service level agreement, which includes guidelines and standards for
advice services, referrals, presentations, training, media • All EEACs must have a written complaints procedure • All EEACs must submit monthly financial and activity reports
The South West London EEAC It is supported by EST and is run in partnership with CEN (Creative Environmental Networks) and
the Green Energy Centre. CEN is a not for profit organisation of 35 staff. It is a growing company funded by the EU and EST. The Green Energy Centre was launched in July 2002 and is carrying out a range of projects on renewables and energy efficiency. The South West London EEAC aims to provide environmental benefit through the reduction of CO2 emissions and the alleviation of fuel poverty. To date they have helped Local Municipalities work in 12,000 properties and offset over 100,00 tonnes of CO2.

World Energy Council Energy Efficiency Policies and Indicators – ANNEX 1
76
Italy
Two Italian energy information networks were created in different moments, but with the common mission of promoting RES and RUE: a national network of «Centri di Consulenza Energetica Integrata» operated by ENEA on behalf of the Ministry of Industry and a regional network «Punti Energia», committed by Lombardia Region.
Centri di Consulenza Energetica Integrata (ENEA)
Context
Description
During the nineties ENEA (the Italian National Agency for new Technology, Energy and Environment) was appointed by the Ministry of Industry to work out an action programme for accompanying the Italian Energy Strategy. One of the tasks was aimed at the establishment of a small network of Energy Centres. A CCEI (Centro di Consulenza Energetica Integrata) was created in each Italian Region. They were charged with the mission of informing energy users on energy savings, renewable energy sources and energy efficient technology, and of assisting Local Authorities to accomplish the numerous tasks that the central government had given them as a part of the national energy strategy. At present 12 ENEA CCEIs , with 30 employees, are acting as Energy Offices in the southern towns of Palermo, Reggio Calbria, Potenza, Bari, Campobasso, in the central towns of Pescara, Firenze, Perugia e Ancona and in the northern towns of Genova and Venezia. They give information to the public upon request and assist public administrations with advice in the sector of energy planning, energy interventions identification and energy project selection. They are involved with LAs and SMEs in several co-operative projects, creating new jobs as «boiler inspectors», operating energy auditing campaigns and analysing regional and municipal energy plans.
Budget The total CCEIs’ budget is approximately 2.5 Million Euros and half of the finance comes from governmental support and the remaining half from projects income.
Rete di Punti Energia

World Energy Council Energy Efficiency Policies and Indicators – ANNEX 1
77
Context Description
Starting in the middle of the nineties under the SAVE programme, the European Commission backed the setting up of regional and local energy management agencies. The mission of SAVE agencies is to inform, through direct involvement of local actors, on rational use of energy and to promote the exploitation of local energy resources. So far over 30 agencies have been created in Italy and to join forces and find an organic form of representation in 1999 RENAEL, the National Network of Local Energy Agencies, was created.
«Rete di Punti Energia» started off in 1995 thanks to contributions from the EU as well as from Regional and Local Governments. Presently, the agencies of Cremona, Brescia, Como, Pavia, Varese and Lecco are operating, co-ordinated by a Central Unit located within the premises of the Lombardia Region in Milan. Overall this non-profit organisation has about 20 staff members. Each agency independently organises and locally manages the activities and the services offered by the Network, while the Central Unit carries out tasks such as: fostering the opening of new agencies; promoting joint initiatives and campaigns in support of the Network; guaranteeing a quality policy in service supply, providing technical, logistic and instrumental support to local agencies; developing the annual communication strategy and action plan; managing toll free calls from the general public; launching ad-hoc public information campaign. The activities of the Network are :
• Energy planning • Energy labelling and auditing • RTD of energy integrated systems • Contract definition of energy management services with third party financing • Feasibility studies for the promotion of RES • Environmental impact studies and assessment reports • Action plans for Local Agenda 21 • Sustainable urban mobility • Supporting SMEs • EU projects • Assistance in seeking financial support • Education, Training, Information & Communication.
The principal sources of financing of the Network are: members' fees, EU projects and project incomes from both public and private clients.

World Energy Council Energy Efficiency Policies and Indicators – ANNEX 1
78
Japan
Two energy efficiency outreach information programmes are now implemented in Residential and Commercial Sector. They provide support for grass-root people’s activities for energy conservation and support for schools in energy conservation education.
“Energy Saving Navi” Navi is an energy cost indicator system/device, showing an actual and target energy fees (the difference is a monetary estimate of energy savings). It is linked wireless to electricity or gas meter, working in real time. Already installed in ~10,000 houses and 200 buildings. Dissemination of “Energy Saving Navi“ System for Cars.
“Energy Conservation Republic” in schools. Their activity is to:
• Elect the president and the ministers • Set targets and programs for energy conservation • Practice energy conservation activities by each floor. Return saving money to school
(“Energy Conservation Fund”). Saving electricity fee – 14%

World Energy Council Energy Efficiency Policies and Indicators – ANNEX 1
79
Mexico Context Description Objectives Program’s evolution
In order to meet its wide-ranging mandate to provide technical assistance on energy efficiency to federal offices throughout Mexico, as well as to extend these same services to municipal and state governments, CONAE began providing technical assistance directly from its central Mexico City office in the early 90s. Beginning in 1993, these efforts were supplemented by a few regional delegations called Liaison Units for Energy Efficiency (U3Es). These “U3Es” are now present in 14 different states and adjoining regions where the regional managers work in close collaboration with local authorities, industrial associations and higher education centres. At their inception, the U3Es promoted energy efficiency by visiting a limited number of industrial and commercial facilities to perform walk-through (or “Level 1”) energy audits – sometimes followed by more comprehensive studies to identify specific energy-saving measures. Today, the U3Es also have become active, sometimes together with private firms or state and municipal agencies, in training facilities personnel and in organizing local events. In 1997 CONAE set out a new strategy called “Virtual CONAE” in order to widen the reach and scope of its technical assistance activities. The basic strategy developed of “Virtual CONAE” was centred on the use of Internet to link U3Es and their customers to other research centres, energy efficiency offices, and financing institutions, both in Mexico and worldwide, and to broaden and accelerate the technical assistance to energy users in the form of updated economic and technical information, including software tools for evaluating and developing energy efficiency and renewable energy projects. Virtual CONAE is an information system operating through CONAE’s Website that allows users to automatically access CONAE’s methodologies to evaluate both energy efficiency and renewable energy projects. In order to implement this strategy CONAE began establishing a number of “Ports of Attention” (PACs) to provide low-cost and high-quality technical assistance to potential users who did not have access to Internet. Ports of Attention (PACs) in Mexico represent a new creative approach in organisation of local energy efficiency centres and expanding an outreach of EE campaigns. PACs are Internet-equipped stations operated mainly by students and directed and supervised by CONAE’s central and regional offices. PACs started providing technical assistance to users who did not have access to Internet, such as small firms and some offices of municipal governments. Currently, the program has evolved; the PAC’s have become more sophisticated and specialized, supporting facility operators and other co-workers interested in implementing energy efficiency projects.
• To provide technical assistance in the field of energy efficiency to consumers throughout the country
• To assist energy users in the identification of energy savings potentials in specific areas • To assist consumers in establishing the economic and financial feasibility of energy
efficiency projects • To provide the guidance and information desired on energy efficiency and renewable
energy Since their inception in 1997, PACs have gradually proliferated throughout the country, some of them becoming more sophisticated and specialized. For instance, besides offering relevant linkages for energy efficiency or providing on-line technical assistance for consumers who do not have access to the Internet, some PACs have been supporting facility operators and other co-workers interested in

World Energy Council Energy Efficiency Policies and Indicators – ANNEX 1
80
Municipal and state governments Households Businesses and industries. Organisation Results, benefits and lessons learned
implementing energy efficiency projects. Very soon, PACs started to show a promising evolution and today many have triggered a multiplier effect locally (at the state or municipal level) by promoting the creation of additional, sometimes specialized, PACs. For example, in the hot northern states of Sonora and Baja California, besides the local U3E, there are 8 PACs each, most of which focus primarily on the high electricity consumption from air conditioning. The industrial state of Nuevo Leon, also with extremely long hot summers, houses 10 PACs. As of 2002, there were more than 100 PACs, with all 31 Mexican states represented. In addition, PACs are present in several dozen energy efficiency events across the country each year. These PACs are located in state or municipal government offices and are formed by an agreement among CONAE, the National Bank for Public Woks (Banobras) and the Federal Electricity Commission (CFE). CONAE provides technical assistance mainly through performing energy studies to identify operational or technological savings opportunities. CFE supplies CONAE relevant data to carry out the studies and finally Banobras provides financing to carry out the measures proposed. These are located in public high schools, as their operators do not require specialized training. They register the users help them download the forms to carry out a residential energy study, and then assist them in sending the completed forms to central CONAE for evaluation. These PACs also promote an energy efficiency culture among the students. These PACs are located either in higher education centres such as technical institutes and universities, or in trade associations and industrial chambers. The PACs are low-cost technical assistance units; each PAC requires only a computer connected to the Web and an operator. Their basic function is to assist energy users in identifying energy savings potentials and evaluating the economic feasibility of specific measures. PACs have their own site within CONAE’s Web page which provides operators with updated information on CONAE’s tools and methods and allows them to exchange information with central CONAE’s staff. This site publishes a monthly bulletin, NotiPac, which documents PACs activities and successes. CONAE does not support the PACs with funding for salaries, office space, or computers; only the training and back-up technical assistance are provided. A few PAC operators are paid salaries (by the local counterpart), but many are students who are meeting their “social service” obligation (a graduation requirement in all Mexican universities). Others use a PAC assignment as an undergraduate thesis topic, and some get course credits.
PACs have turned out to be a very successful story in energy efficiency activities in Mexico. The main stakeholders -- energy users, host institutions and operators -- have found that a variety of benefits can be derived from CONAE’s PACs network.
Examples of these benefits can be found in various types of PACs. In 2001, a PAC established under the CONAE-Banobras agreement in the state of Guerrero supported three municipalities (Coyuca de Benítez, Atoyac de Álvarez and Benito Juárez) in the analysis of their public lighting equipment. The audits yielded potential savings of approximately 50%with proposed investments that could be recovered in less than three years. (Annex 1).
Furthermore, in 2002, this same PAC also helped the municipality of Tecpan de Galeana to perform a public lighting energy study. The study revealed that almost 2,500 obsolete conventional lighting fixtures could be substituted by efficient equipment, thus reducing the public lighting electricity bill by more than 75% -- over 170,000, kWh per month, equivalent to US$20,000.
Industrial PACs have also shown great success. In 2002, operators from the PAC located in the Toluca Institute of Technology (ITT) provided technical assistance to a Coca-Cola Company Plant situated in Altamirano, Guerrero. The operators visited the plant and performed energy studies of the plant’s lighting, its steam generation and distribution systems, as well as some of its industrial processes. This group recommended several operational and low investment measures during its visit and reported potential electricity savings of US$12,400 per year and primary fuel consumption savings of approximately US$11,500 annually. Nowadays, a Coca-Cola Committee is evaluating the possibility of implementing the measures proposed by CONAE.
In 2001, the ITT PAC also provided technical assistance to a public hospital from the Mexican Social Security Institute (IMSS). CONAE, through this PAC, performed a lighting assessment of the IMSS East Delegation which yielded potential electricity savings of US$3,000 per year. By substituting

World Energy Council Energy Efficiency Policies and Indicators – ANNEX 1
81
obsolete lighting equipment with efficient models, an initial investment of US$7,600 dollars could be recovered in less than three years. One of the students of the ITT documented this experience in his/her undergraduate thesis.
The PAC located in the San Juan del Río Technological University in 2002 assisted the contractor that was building the University library in an assessment of the lighting system. The analysis was performed through the PAC by CONAE’s central office and it allowed a significant reduction in the electricity load while actually increasing the facility’s illumination levels.
References
Source Local Energy Information Centres. Guidelines and Comparison of European Experiences. Predac. Energie. 2003. Morales, Francisco. Los Puertos de Atención CONAE. CONAE. April 2002 Li Tienan Energy Efficiency in China. China Certification Center for Energy Conservation Product 2003

Annex 2 Overview of Energy Efficiency
Policy Measures
Synthesis of the 2003 survey


World Energy Council Energy Efficiency Policies and Indicators – ANNEX 2: Synthesis
Contents
1. Institutions and programmes ...................................................................1
1.1. Institutions in charge of the implementation of energy efficiency programmes ............ 1 1.2. Existence of national programmes of energy efficiency ................................................ 2
2. Regulations.................................................................................................5
2.1. Efficiency standards and labels for household electrical appliances.............................. 5 2.2. Thermal energy efficiency standards for new buildings ................................................ 8 2.3. Other regulations .......................................................................................................... 10
3. Fiscal and economic measures ...............................................................12
3.1. Fiscal measures............................................................................................................. 12 3.2. Economic incentives..................................................................................................... 14
4. Information and voluntary agreements ................................................16
4.1. Audits............................................................................................................................ 16 4.2. Local energy information centres ................................................................................. 18 4.3. Voluntary agreements to reduce energy consumption and/or CO2 emissions.............. 21

World Energy Council Energy Efficiency Policies and Indicators – ANNEX 2: Synthesis
List of organisations participating in the survey
Algeria APRUE, National Agency for the promotion and the rationalization of the utilization of the energy
Australia Department of Industry, Tourism and Resources, Energy and Environment Division
Austria E.V.A.- The Austrian Energy Agency
Belgium ECONOTEC
Botswana Energy Affairs Division
Brazil PROCEL/Eletrobras
Bulgaria EEA, Energy Efficiency, Agency
Canada Office of Energy Efficiency, NRCan
Cote d’Ivoire SOPIE
Costa Rica Direccion Sectorial de Energia
Chile National Energy Commission
China State Development Planning Commission
Colombia UPME, Mining and Energy Planning Unit
Czech Republic CEA, Czech Energy Agency
Denmark Danish Energy Authority
Egypt Organisation of Energy Planning and Egypt WEC Committee
Finland Ministry of Trade and Industry
France ADEME, Agency for environment and Energy Management
Germany Fraunhofer/ISI
Ghana Ghana Energy Foundation
Greece CRES, Centre for Renewable Energy Sources
Hong Kong, China
Energy Efficiency Office
Hungary Energy Centre
Indonesia Energy Conservation Sub-Directorate, Ministry of Energy and Natural Resources
Iran SABA, Iran Energy Efficiency Organisation
Ireland Sustainable Energy Ireland
Israel Israeli WEC National Committee
Italy ENEA
Japan Energy Conservation Centre
Jordan National Energy Research Centre
Kenya Kenya Power & Lighting Co
Korea (ROK) KEMCO

World Energy Council Energy Efficiency Policies and Indicators – ANNEX 2: Synthesis
Latvia Latvian Development Agency, Energy Department
Lebanon ALMEE
Lithuania SC Energy Agency
Malaysia Ministry of Energy
Mali Direction Nationale de l’Energie
Mauritania National Cell of Energy Efficiency
Morocco CDER, Center for Development of Renewable Energies
Mexico Conae
Netherlands ECN
Norway IFE, Instittutt for Energiteknikk
Peru Ministry of Energy and Mines
Philippines Department of Energy, Energy Utilization Bureau
Poland KAPE, Polish Energy Agency
Portugal ADENE, Energy Agency
Romania ENERO, Center for Promotion of Clean and Efficient Energy in Romania
Russia Ministry of Energy of Russian Federation, Department of State Energy Supervision
Slovakia Slovak Energy Agency
Slovenia AURE, Agency for Energy Efficiency and Renewable Energy
South Africa SANEA, South African National Energy Association
Spain IDEA, Institute for the Diversification and Saving of Energy
Syria Ministry of Electricity
Sweden STEM
Switzerland Swiss Federal Office of Energy
Thailand APERC
Taiwan, China MOEA
Tanzania Ministry of Energy and Minerals
Tunisia ANER, National Agency for Renewable Energies
Turkey EİE/ National Energy Conservation Center
UK Defra, Department for Environment, Food and Rural Affairs
USA US DOE
Vietnam Vietnam Energy Conservation Program Notes: For most non OECD APEC economies1, the survey was co-ordinated of by APERC.
1 The APEC economies followed by APERC are the following: Chile, Hong Kong China, Indonesia, Malaysia, Mexico, Peru, Philippines, Russia, Taiwan China, Thailand and Vietnam
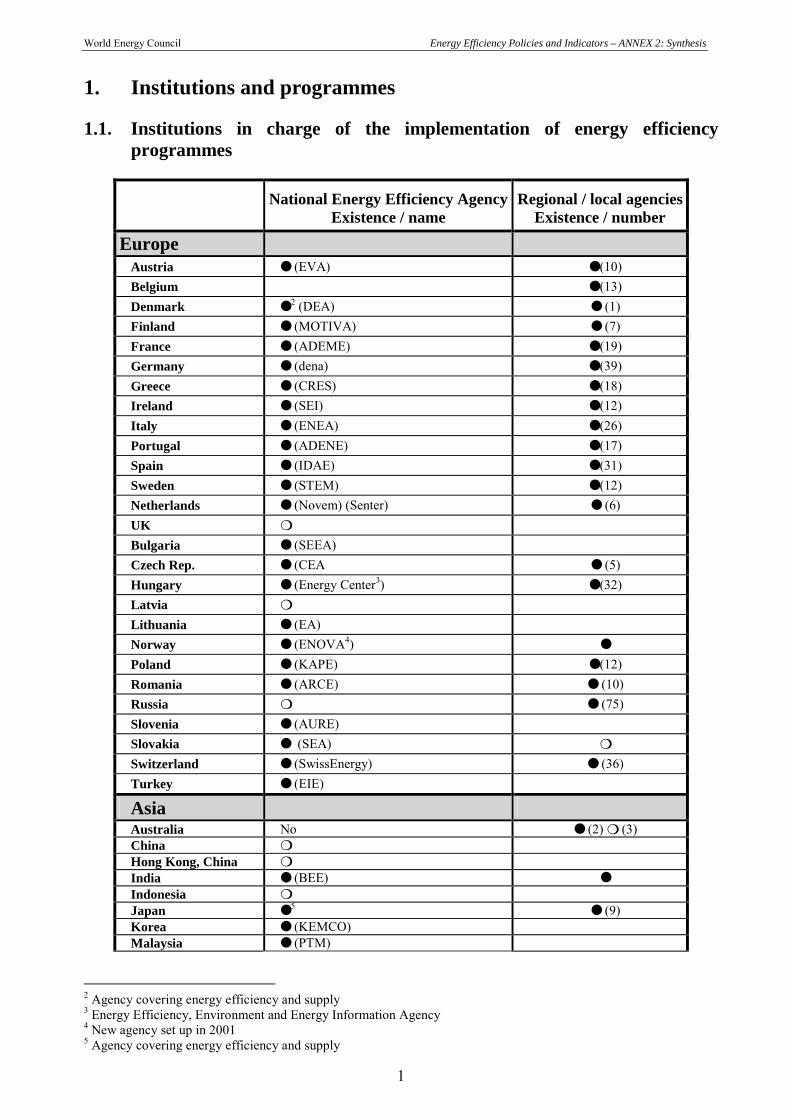
World Energy Council Energy Efficiency Policies and Indicators – ANNEX 2: Synthesis
1
1. Institutions and programmes 1.1. Institutions in charge of the implementation of energy efficiency
programmes
National Energy Efficiency AgencyExistence / name
Regional / local agenciesExistence / number
Europe
Austria ● (EVA) ● (10) Belgium ● (13) Denmark ● 2 (DEA) ● (1) Finland ● (MOTIVA) ● (7) France ● (ADEME) ● (19) Germany ● (dena) ● (39) Greece ● (CRES) ● (18) Ireland ● (SEI) ● (12) Italy ● (ENEA) ● (26) Portugal ● (ADENE) ● (17) Spain ● (IDAE) ● (31) Sweden ● (STEM) ● (12) Netherlands ● (Novem) (Senter) ● (6) UK ❍ Bulgaria ● (SEEA) Czech Rep. ● (CEA ● (5) Hungary ● (Energy Center3) ● (32) Latvia ❍ Lithuania ● (EA) Norway ● (ENOVA4) ● Poland ● (KAPE) ● (12) Romania ● (ARCE) ● (10) Russia ❍ ● (75) Slovenia ● (AURE) Slovakia ● (SEA) ❍ Switzerland ● (SwissEnergy) ● (36) Turkey ● (EIE)
Asia
Australia No ● (2) ❍ (3) China ❍ Hong Kong, China ❍ India ● (BEE) ● Indonesia ❍ Japan ● 5 ● (9) Korea ● (KEMCO) Malaysia ● (PTM)
2 Agency covering energy efficiency and supply 3 Energy Efficiency, Environment and Energy Information Agency 4 New agency set up in 2001 5 Agency covering energy efficiency and supply
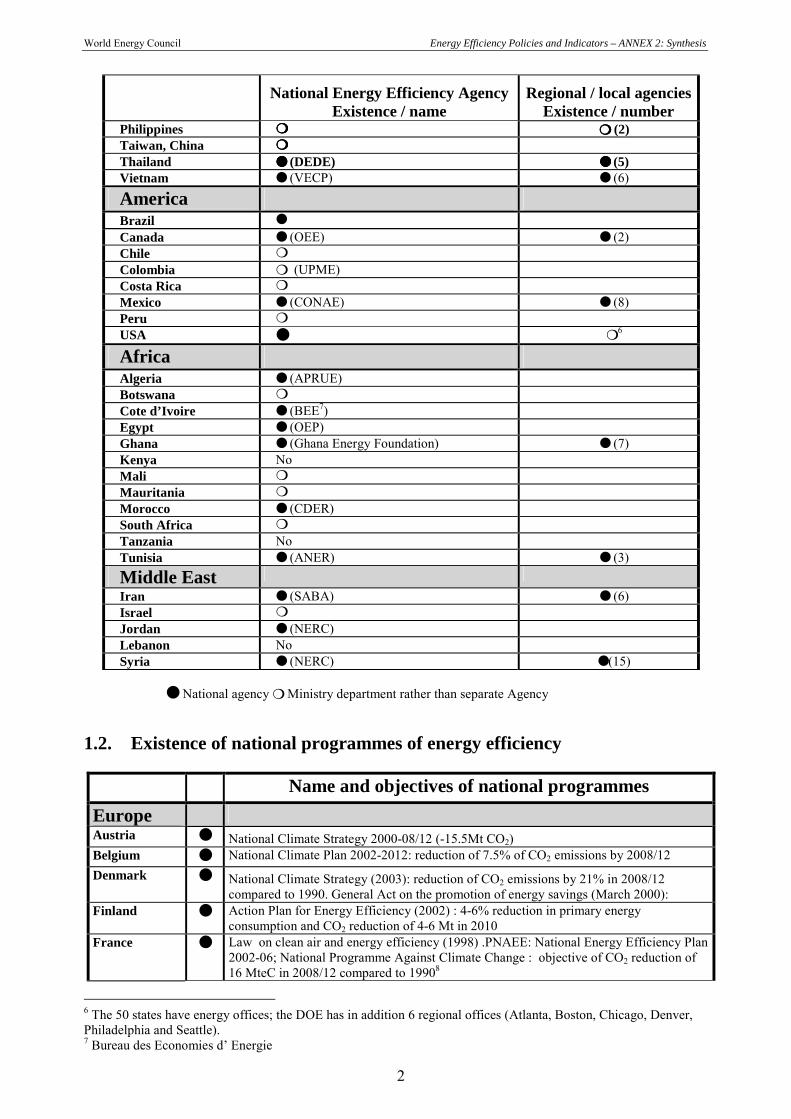
World Energy Council Energy Efficiency Policies and Indicators – ANNEX 2: Synthesis
2
National Energy Efficiency Agency Existence / name
Regional / local agenciesExistence / number
Philippines ❍❍❍❍ ❍❍❍❍ (2) Taiwan, China ❍❍❍❍ Thailand ●●●● (DEDE) ●●●● (5) Vietnam ● (VECP) ● (6)
America
Brazil ● Canada ● (OEE) ● (2) Chile ❍ Colombia ❍ (UPME) Costa Rica ❍ Mexico ● (CONAE) ● (8) Peru ❍ USA ● ❍ 6
Africa
Algeria ● (APRUE) Botswana ❍ Cote d’Ivoire ● (BEE7) Egypt ● (OEP) Ghana ● (Ghana Energy Foundation) ● (7) Kenya No Mali ❍ Mauritania ❍ Morocco ● (CDER) South Africa ❍ Tanzania No Tunisia ● (ANER) ● (3) Middle East
Iran ● (SABA) ● (6) Israel ❍ Jordan ● (NERC) Lebanon No Syria ● (NERC) ● (15)
● National agency ❍ Ministry department rather than separate Agency
1.2. Existence of national programmes of energy efficiency
Name and objectives of national programmes Europe Austria ● National Climate Strategy 2000-08/12 (-15.5Mt CO2) Belgium ● National Climate Plan 2002-2012: reduction of 7.5% of CO2 emissions by 2008/12 Denmark ● National Climate Strategy (2003): reduction of CO2 emissions by 21% in 2008/12
compared to 1990. General Act on the promotion of energy savings (March 2000): Finland ● Action Plan for Energy Efficiency (2002) : 4-6% reduction in primary energy
consumption and CO2 reduction of 4-6 Mt in 2010 France ● Law on clean air and energy efficiency (1998) .PNAEE: National Energy Efficiency Plan
2002-06; National Programme Against Climate Change : objective of CO2 reduction of 16 MteC in 2008/12 compared to 19908
6 The 50 states have energy offices; the DOE has in addition 6 regional offices (Atlanta, Boston, Chicago, Denver, Philadelphia and Seattle). 7 Bureau des Economies d’ Energie
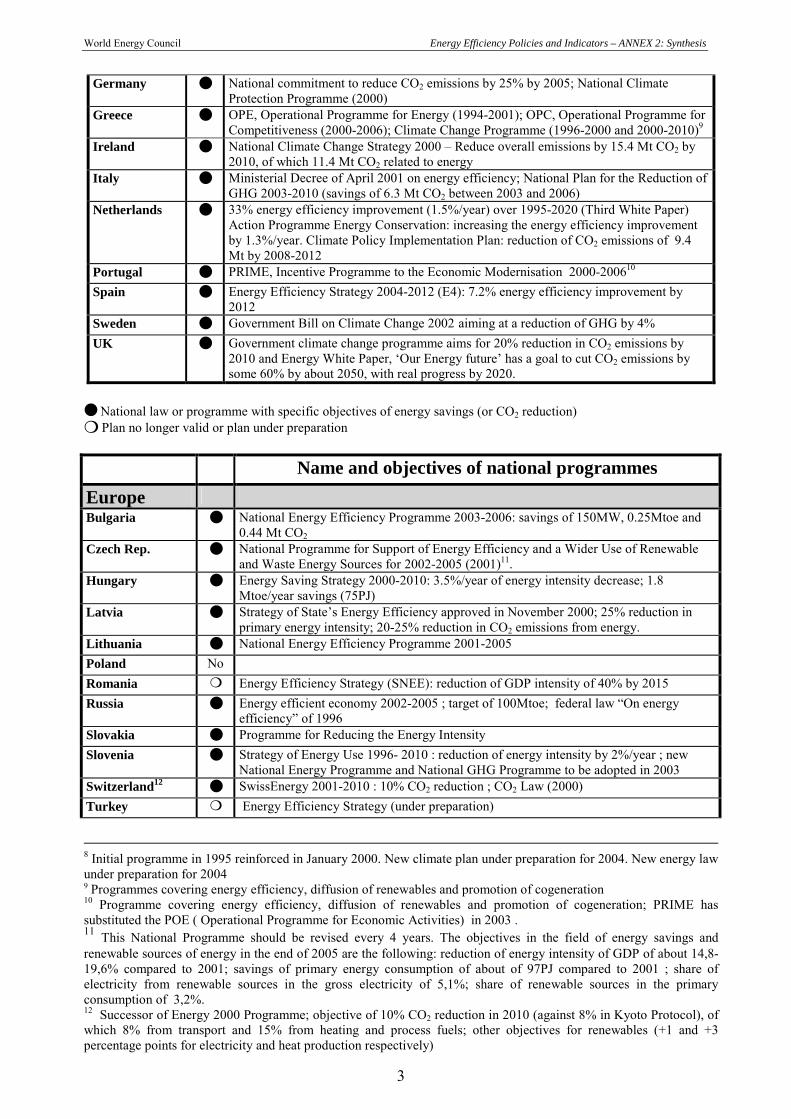
World Energy Council Energy Efficiency Policies and Indicators – ANNEX 2: Synthesis
3
Germany ● National commitment to reduce CO2 emissions by 25% by 2005; National Climate Protection Programme (2000)
Greece ● OPE, Operational Programme for Energy (1994-2001); OPC, Operational Programme for Competitiveness (2000-2006); Climate Change Programme (1996-2000 and 2000-2010)9
Ireland ● National Climate Change Strategy 2000 – Reduce overall emissions by 15.4 Mt CO2 by 2010, of which 11.4 Mt CO2 related to energy
Italy ● Ministerial Decree of April 2001 on energy efficiency; National Plan for the Reduction of GHG 2003-2010 (savings of 6.3 Mt CO2 between 2003 and 2006)
Netherlands ● 33% energy efficiency improvement (1.5%/year) over 1995-2020 (Third White Paper) Action Programme Energy Conservation: increasing the energy efficiency improvement by 1.3%/year. Climate Policy Implementation Plan: reduction of CO2 emissions of 9.4 Mt by 2008-2012
Portugal ● PRIME, Incentive Programme to the Economic Modernisation 2000-200610 Spain ● Energy Efficiency Strategy 2004-2012 (E4): 7.2% energy efficiency improvement by
2012 Sweden ● Government Bill on Climate Change 2002 aiming at a reduction of GHG by 4% UK ● Government climate change programme aims for 20% reduction in CO2 emissions by
2010 and Energy White Paper, ‘Our Energy future’ has a goal to cut CO2 emissions by some 60% by about 2050, with real progress by 2020.
● National law or programme with specific objectives of energy savings (or CO2 reduction) ❍ Plan no longer valid or plan under preparation
Name and objectives of national programmes Europe
Bulgaria ● National Energy Efficiency Programme 2003-2006: savings of 150MW, 0.25Mtoe and 0.44 Mt CO2
Czech Rep. ● National Programme for Support of Energy Efficiency and a Wider Use of Renewable and Waste Energy Sources for 2002-2005 (2001)11.
Hungary ● Energy Saving Strategy 2000-2010: 3.5%/year of energy intensity decrease; 1.8 Mtoe/year savings (75PJ)
Latvia ● Strategy of State’s Energy Efficiency approved in November 2000; 25% reduction in primary energy intensity; 20-25% reduction in CO2 emissions from energy.
Lithuania ● National Energy Efficiency Programme 2001-2005 Poland No Romania ❍ Energy Efficiency Strategy (SNEE): reduction of GDP intensity of 40% by 2015 Russia ● Energy efficient economy 2002-2005 ; target of 100Mtoe; federal law “On energy
efficiency” of 1996 Slovakia ● Programme for Reducing the Energy Intensity Slovenia ● Strategy of Energy Use 1996- 2010 : reduction of energy intensity by 2%/year ; new
National Energy Programme and National GHG Programme to be adopted in 2003 Switzerland12 ● SwissEnergy 2001-2010 : 10% CO2 reduction ; CO2 Law (2000) Turkey ❍ Energy Efficiency Strategy (under preparation)
8 Initial programme in 1995 reinforced in January 2000. New climate plan under preparation for 2004. New energy law under preparation for 2004 9 Programmes covering energy efficiency, diffusion of renewables and promotion of cogeneration 10 Programme covering energy efficiency, diffusion of renewables and promotion of cogeneration; PRIME has substituted the POE ( Operational Programme for Economic Activities) in 2003 . 11 This National Programme should be revised every 4 years. The objectives in the field of energy savings and renewable sources of energy in the end of 2005 are the following: reduction of energy intensity of GDP of about 14,8-19,6% compared to 2001; savings of primary energy consumption of about of 97PJ compared to 2001 ; share of electricity from renewable sources in the gross electricity of 5,1%; share of renewable sources in the primary consumption of 3,2%. 12 Successor of Energy 2000 Programme; objective of 10% CO2 reduction in 2010 (against 8% in Kyoto Protocol), of which 8% from transport and 15% from heating and process fuels; other objectives for renewables (+1 and +3 percentage points for electricity and heat production respectively)

World Energy Council Energy Efficiency Policies and Indicators – ANNEX 2: Synthesis
4
Asia Australia ● Safeguarding the future 1998-2004: Constrain emissions growth to 8% above 1990
levels. China ● National Energy Conservation Prospect 2001-2005 Hong Kong, China No India ● Energy conservation Law Indonesia ● Energy conservation programme 2003-2010: reduction of the energy intensity of
1%/year Japan ● Guidelines for Measures to Prevent Global Warming: 2002-2010 Korea ● Second Energy Rationalisation Energy Plan 1999-2003 (10% saving in 2003) Malaysia ● Malaysian Industrial Energy Efficiency Improvement Programme 2000-04 (10%
saving) Philippines ● Energy conservation and efficiency programme 2000-2001; Promotion of Energy
Efficient Use Law (2000) Taiwan, China ● Energy efficiency and conservation programme: 28% reduction in the energy
intensity of the GDP by 2020 (16% in 2010) Thailand ● Vietnam ● Vietnam Energy Conservation Program 2003-2005; 120 MW and 449 GWh saving
America Brazil ● PROCEL – Energy Conservation Programme. Objective of additional saving of 2
TWh/year (17 TWh saved from 1986 to 2003). Canada ● Energy Efficiency and Alternative energy Programme (EAE); Climate Change Plan
for Canada: 6% CO2 reduction by 2008/12 Costa Rica ● Programa Nacional de Conservacion de Energia, PRONACE 2003-2008 USA ● Office of Energy Efficiency and Renewable Strategy Plan 2000-2010; climate change
technology program Chile No Colombia No Mexico No Peru ● Saving Energy Project 1995-2000; Promotion of Energy Efficient Use Law (2000)
Africa Algeria No13 Botswana No Egypt ● Energy Efficiency Improvement and Greenhouse Gases Reduction (EEIGGR): 1999-
2004. Framework for Egyptian National Energy Efficiency Strategy within Egyptian Environmental Policy Program, EEPP.
Ghana ●●●● Energy Efficiency and Conservation Programme (1988-2004) Ivory Coast No Kenya No14 Mali No15 Mauritania ❍ 16 Morocco ●●●● Strategic Plan for Renewables and Energy Efficiency 2002-2020: savings of 2 Mtoe
by 2011 and 4 Mtoe by 2020 (18%)17 South Africa ● Strategy of Energy Use (1996) (reduction of energy intensity by 2%/year between
1996 and 2010); new National Energy Programme under preparation Tanzania No Tunisia ● National Programme for Energy Management : Objective of 10% energy saving in
2010 (1 Mtoe)
13 Only exists yearly plans. 14 Only exits an industrial energy efficiency project supported by GEF over 2001-2005 (4.5 ktCO2 already saved). 15 Exists a general programme 2004-2006 without quantified objectives. 16 Exists a general programme of reduction of energy consumption over the period 2004-2006. 17 Savings of 100 000 toe/year in industry and 50 000 toe/year in services.

World Energy Council Energy Efficiency Policies and Indicators – ANNEX 2: Synthesis
5
Middle East
Iran ● Energy Management Programme: 2004 –2009: 2.7 Mtoe (20 Mboe) energy savings Israel No Jordan No Lebanon No Syria ● Supply Side Efficiency & Energy Conservation & Planning Project (SSEECP): 1.8%
savings by 2010 (2.4 Mtoe) ● National law or programme with specific objectives of energy savings (or CO2 reduction) ❍ Plan no longer valid or plan under preparation or sectoral programme 2. Regulations 2.1. Efficiency standards and labels for household electrical appliances
Refrigerators Washing Machines Air conditioners
Europe EU18 L, M (1996) L, V (2002) L (2002) Austria L, M L P Belgium L, M L Denmark L, M L L (2002) Finland19 L, M (2000) L France L, M (1998) L (1997) Germany L, M (1998) L Greece L, M (1998) L P Ireland L, M (1997) L (1997) L (2002) Italy L, M (1999) (V 2004) L L (2003) Portugal L, M (1999) L P Spain L, M L L Sweden L, M (1999) L Netherlands L, M (2004) L UK L, M L, V L (2003) Bulgaria L (2002) V V Czech Rep. L, M (2001) L, V (2001) L (2001) Hungary L (1998) L Latvia L (2001) L (2001) L (2001) Lithuania L,M (2004) L,M (2004) L,M (2004) Norway Poland L,M (2003) L,M (2003) L,M (2003) Romania L (2002) L (2002) L (2003)20 Russia V V No Slovenia21 L, M (2001) L (2001) No
18 For EU countries, exist Directives defining mandatory labels for most appliances and mandatory standards for some appliances: refrigerators and freezers (Directive 96/57/EC); a law has to be passed in each country to make it effective. For washing machine, there is a voluntary agreement to improve the efficiency, signed with the association of manufactures (CECED). 19 In 2002, 50% of refrigerators sold were of label A, in reference to approximately 18% in year 1999 20 Government Decision no.407/2.04.2003, regarding the establishment of the requirements on energy labeling for the introduction of the domestic air conditioning equipment on the market.

World Energy Council Energy Efficiency Policies and Indicators – ANNEX 2: Synthesis
6
Refrigerators Washing Machines Air conditioners
Slovakia L (2002) L (2002) L (2003) Switzerland L, M (2002) L, M (2002) P Turkey L L P Asia
Australia22 M (1999, 2005) L M (2001/04/07)
China L (2004), M (1989/2000) M (1989) M (1989/2001) Hong Kong, China23
No No No
Indonesia P (2005) No No
Japan24 M (1999) M (1999) Korea L,M (1992) L,M (2001) L,M (1993) Malaysia No No No
Philippines M (2000) M (1993/2002)
Taiwan, China25 M (2000) M (2002)
Thailand26 L, M (2004) L, M (2004)
Vietnam P P P America
Brazil27 L(1984) ,V (1994) L(1994), V (1995)
Canada M (2003) M (2003) M (2003) Chile28 No No No
Colombia L, M (2004) L, M (2005) L, M (2004)
Costa Rica29 L, M (2000) L
Mexico M (1995/2003) M (1997/2000) M (1995)30
USA31 M M M
21 Labelling scheme exist since 2001 for washing machine, tumble dryers, dishwashers and light bulbs 22 Projected saving from MEPS of 1.4 TWh in 2018 for refrigerators and commercial refrigerators and 0.8 TWh for air conditioners. 23 Only voluntary labeling scheme for refrigerators (1995), washing machine (1997) and air conditioners (1997), compact fluorescent lamps, electric water heaters and rice cookers 24 Estimated average savings from the standard: 30% for refrigerators and 63% for air conditioners 25 Standards are also planned for fluorescent lamps (2001), induction motors (single and three phase) (2002), ballasts for fluorescent lamps (1994), water chiller (2003 26 Standards also exist for fluorescent lamps tubes and ballasts (2003) and for compact fluorescent lamps (2003) 27 Saving estimated in 2003 at 450 GWh/yr for refrigerators and 125 GWh/yr for air conditioners. Exist also voluntary standards for lamps (saving of 729 GWh/yr) and mandatory standards for motors since 1992. 28 Labeling scheme under preparation 29 Labels exist also for freezers, electric motors (>1 kW), ballasts, electric water heaters, electric cookers and ovens, and fluorescent lamps. For refrigerators and freezers the US DOE standards of 1993 apply. 30 Standards implemented in 1995 for room AC (1998 for central AC) with an update in 2000 (2002 for central) 31 Savings from all standards on appliances estimated by AIEE and DOE at 88 TWh in 2000 (2.5% of electricity use). This displaced the needs of 70 300 MW of capacity. Appliances concerned: refrigerators and freezers, clothes washers and dryers, central AC and heat pumps, room AC, dishwashers, lamps, heating equipment, water heaters, motors, furnaces and boilers.

World Energy Council Energy Efficiency Policies and Indicators – ANNEX 2: Synthesis
7
Refrigerators Washing Machines Air conditioners
Africa
Algeria No No No
Botswana No No No
Cote d’Ivoire No No M (1993)
Egypt L, M (2003) L, M (2003) L, M (2003)
Ghana L, M (2004) No L, M (2004)
Kenya No No No
Mali No No No
Mauritania No No No
Morocco No No No
South Africa P P P
Tanzania No No No
Tunisia M (2004) P P
Middle East
Iran32 L, M (1999) L, M (2002) L, M (2002) Israel L, M (2005) No M (2000) 33
Jordan No No No
Lebanon No No No
Syria P (2008) P (2010) P (2010)
L: mandatory labels; M: mandatory efficiency standards; V: voluntary standards, P: under preparation
32 Standards also exist for iron, and electric water heaters 33 Minimum COP of 2.6 since 2000 (against 2.4 previously), upgraded to 3.0 as of January 2005; EU type of labelling to be also introduced in January 2005; estimated yearly savings of 120 GWh
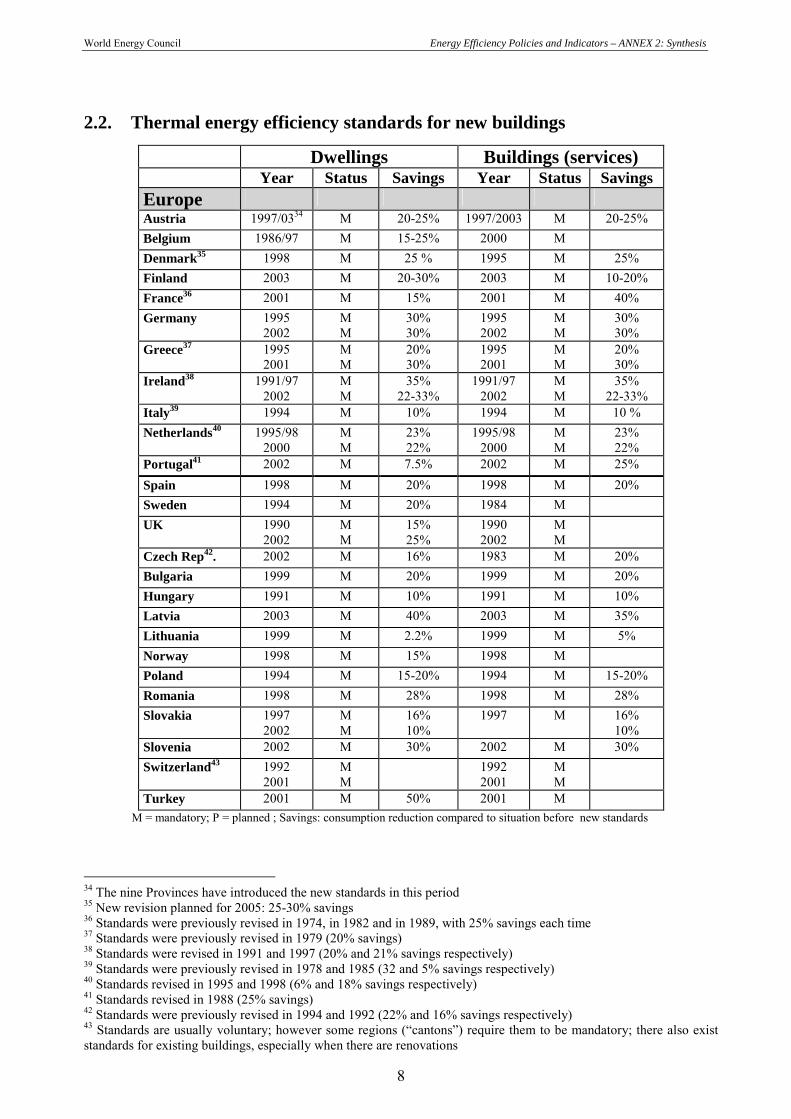
World Energy Council Energy Efficiency Policies and Indicators – ANNEX 2: Synthesis
8
2.2. Thermal energy efficiency standards for new buildings
Dwellings Buildings (services) Year Status Savings Year Status Savings Europe Austria 1997/0334 M 20-25% 1997/2003 M 20-25% Belgium 1986/97 M 15-25% 2000 M Denmark35 1998 M 25 % 1995 M 25% Finland 2003 M 20-30% 2003 M 10-20% France36 2001 M 15% 2001 M 40% Germany 1995
2002 M M
30% 30%
1995 2002
M M
30% 30%
Greece37 1995 2001
M M
20% 30%
1995 2001
M M
20% 30%
Ireland38 1991/97 2002
M M
35% 22-33%
1991/97 2002
M M
35% 22-33%
Italy39 1994 M 10% 1994 M 10 % Netherlands40 1995/98
2000 M M
23% 22%
1995/98 2000
M M
23% 22%
Portugal41 2002 M 7.5% 2002 M 25% Spain 1998 M 20% 1998 M 20% Sweden 1994 M 20% 1984 M UK 1990
2002 M M
15% 25%
1990 2002
M M
Czech Rep42. 2002 M 16% 1983 M 20% Bulgaria 1999 M 20% 1999 M 20% Hungary 1991 M 10% 1991 M 10% Latvia 2003 M 40% 2003 M 35% Lithuania 1999 M 2.2% 1999 M 5% Norway 1998 M 15% 1998 M Poland 1994 M 15-20% 1994 M 15-20% Romania 1998 M 28% 1998 M 28% Slovakia 1997
2002 M M
16% 10%
1997 M 16% 10%
Slovenia 2002 M 30% 2002 M 30% Switzerland43 1992
2001 M M
1992 2001
M M
Turkey 2001 M 50% 2001 M M = mandatory; P = planned ; Savings: consumption reduction compared to situation before new standards
34 The nine Provinces have introduced the new standards in this period 35 New revision planned for 2005: 25-30% savings 36 Standards were previously revised in 1974, in 1982 and in 1989, with 25% savings each time 37 Standards were previously revised in 1979 (20% savings) 38 Standards were revised in 1991 and 1997 (20% and 21% savings respectively) 39 Standards were previously revised in 1978 and 1985 (32 and 5% savings respectively) 40 Standards revised in 1995 and 1998 (6% and 18% savings respectively) 41 Standards revised in 1988 (25% savings) 42 Standards were previously revised in 1994 and 1992 (22% and 16% savings respectively) 43 Standards are usually voluntary; however some regions (“cantons”) require them to be mandatory; there also exist standards for existing buildings, especially when there are renovations

World Energy Council Energy Efficiency Policies and Indicators – ANNEX 2: Synthesis
9
Dwellings Buildings Year Status Savings Year Status Savings Asia Australia 2003 P 2003 P China 1995 M 1995 M Hong Kong, China No 1995 M India No 2001 P Indonesia No 2000 V Japan 1999 M 1999 M Korea 1994 M 2001 M 10% Malaysia No 2001 P, V Philippines No 1994 M Taiwan, China44 1995-
2002 M 20% 1995-2002 M 5-10%
Vietnam P P
America Brazil Canada 1997 V 20-50% 1997 V Chile 2000/03 No 1999 M Colombia No No Costa Rica No Mexico 2002 M 2002 M Peru V V USA45 1998 V, M 1998 V Africa Algeria 2000 M 2000 M Botswana No No Cote d’Ivoire No 1993 M Egypt 2004 P 2004 P Ghana No No Kenya No No Mali No No Mauritania No No Morocco P 20% P 20% South Africa No No Tanzania No No Tunisia P P
Middle East
Iran 2000 M 2000 M Israel 1986 M 1986 M Jordan 1998 V 1998 V Lebanon P P Syria 2003 10% 2003 10%
M = mandatory; P = planned; V = voluntary Savings: consumption reduction compared to buildings built before the enforcement of the standards
44 Standards revised in 1995, 1997 and 2002 45 There is no mandatory federal standards but mandatory standards exist in a majority of States

World Energy Council Energy Efficiency Policies and Indicators – ANNEX 2: Synthesis
10
2.3. Other regulations
Mandatory consumption
reporting
Mandatory energy
managers
Mandatory energy
saving plan46
Mandatory maintenance
Europe
Austria Belgium Denmark PS Yes Finland France Germany H, S47 Greece S Yes 48 Ireland Italy I, U I, T, S, U I, H, S T, H, S Portugal I,S,T I,S,T I,S,T Spain I,S,H,T,U,M49 Sweden Netherlands UK I, S50 Bulgaria Czech Rep. I, T, S I51, H, S52 Hungary I, S S Latvia Lithuania Norway Poland I, S I, S Romania53 I, U I, U, M Russia I I I I, S, U Slovenia I Slovakia U U U Switzerland S54 H, S 55 Turkey S, I I I
I: Industry, S: Services, H: households, T: transport, U: utilities, M: municipalities, PS: public sector;
Empty cell: no measure 46 including DSM plans 47 for heating boilers (2002) 48 1980, 1988, 1994 and 1997 49 Energy Efficiency Strategy for Spain (E4) 2004-2012 (Council of Ministers on 28th November 2003). 50 for energy intensive industry in Climate change agreements and for the participants (industry and services) in the UK emissions trading scheme. 51 Energy management, buildings and operational or manufacturing facilities of industrial companies, with the total energy consumption exceeding 15,000 GJ per year 52 Energy management and buildings in public sector with the energy consumption at a single location exceeding 1,500 GJ per year. 53 Mandatory energy saving plans for consumers above 1 000 to/year and for municipalities above 20 000 inhabitant 54 for buildings of large public enterprises 55 for heating furnaces

World Energy Council Energy Efficiency Policies and Indicators – ANNEX 2: Synthesis
11
Mandatory consumption
reporting
Mandatory energy
managers
Mandatory energy
saving plan56
Mandatory maintenance
Asia
Australia China Hong Kong, China India Indonesia S I Yes 57 Japan58 I, S I, S I, S Korea I, S I, S,U Malaysia Philippines I, T, S I I, T, H, S Taiwan, China I, T, H, S I, T, H, S I, T, H, S Thailand Yes Vietnam
America
Brazil Canada Chile Colombia Costa Rica I I, U, S Mexico Peru USA
Africa
Algeria Botswana Cote d’Ivoire Egypt I Ghana Kenya Yes Mali Mauritania Morocco South Africa Tanzania I I Tunisia
Middle East
Iran I Yes Israel59 I, S, H, T I, S, H, T Jordan Lebanon Syria Yes
I: Industry, S: Services, H: households, T: transport; empty cell: no measure
56 including DSM plans 57 Objective of 320 MW ; by October 2002, power saving of 7 MW; target of 150 MW for 2003 58 Factories which consume large amount of fuel or electricity (more than 3,000 kL of fuel per year in crude oil equivalent or more than 12 GWh of electric power per year) are subject to the mandatory requirement. 59 All sectors consuming more than 300 toe/year since 1986

World Energy Council Energy Efficiency Policies and Indicators – ANNEX 2: Synthesis
12
3. Fiscal and economic measures 3.1. Fiscal measures
I: Industry, S: Services, H: households, T: transport; empty cell: no measure
60 Tax reduction linked to energy efficiency agreements; if the companies make an agreement and meet the objective the CO2 tax is reduced. 61 VAT reduced for households from 19.6% to 5.5% for energy efficiency investments; replace the tax credit that still exist with a much limited scope. 62 Tax reduction for labour cost for efficient windows or pellet boilers. 63 There is tax credit for electricity and heat generation from renewable energy sources to limited generation; planned VAT reduction from 22% to 5% for renewable energy was canceled 64 Exemption of custom taxes for selected technologies 65 In some regions (“cantons”) exist tax reduction for energy efficiency investments in buildings, as well as reduced taxes for efficient vehicles. A tax was introduced in 2001 (Heavy Vehicle Fee (HVF)) to finance railroad infrastructures and reduce the road traffic of goods through Switzerland
Tax credit or tax
reduction
Accelerate depreciation
Tax reduction
Europe Austria Belgium H Denmark I60 Finland France 61 H H Germany Greece Ireland Italy I, S, H I, S, H Portugal I, S, H Spain I, S, H Sweden H62 Netherlands I, S UK I, S I, H, T Bulgaria Czech Rep.63 I Hungary Latvia Lithuania Norway Poland Romania64 I, S, H Russia I Slovenia I, S, H Slovakia I, S, T Switzerland65 H, S T Turkey I, S I

World Energy Council Energy Efficiency Policies and Indicators – ANNEX 2: Synthesis
13
Tax credit
or tax reduction
Accelerate depreciation
Tax reduction
Asia Australia China Hong Kong, China India Indonesia Japan I, S, H I Korea I, S, H, T I, S, H Malaysia I I I, S Philippines I Taiwan, China I, S Thailand I Vietnam America
Brazil I,S, H66 Canada I T Chile Colombia Costa Rica Mexico I, S, H, T I I Peru USA Africa
Algeria Botswana Cote d’Ivoire Egypt 67 Ghana S, H68 Kenya Mali Mauritania Morocco S, H69 South Africa Tanzania T Tunisia I, S, H, T Middle East
Iran Israel H70 Jordan I, S, H, T Lebanon Syria
I: Industry, S: Services, H: households, T: transport; empty cell: no measure
66 Tax reduction for compact fluorescent lamps and high efficient motors since 2001 67 Tax reduction for new capital investments and tax reduction for imported capital investments exist that are not specific to energy efficiency 68 No import tax on compact fluorescent lamp since April 2003 69 Reduction of import tax for compact fluorescent lamps (tax rate of 2.5%) 70 Reduction of 50% of sale tax for high efficiency compact fluorescent lamps (PL and HP sodium light bulbs)

World Energy Council Energy Efficiency Policies and Indicators – ANNEX 2: Synthesis
14
3.2. Economic incentives
Investment subsidies
Soft loans Energy Efficiency Funds
ESCO’s Number/ turnover
Europe
Austria I, S, H, T ● 40 Belgium H ● 1-5 Denmark ●●●● (Electricity Saving Trust
(12 M€)
Finland71 I, S, H ● 3 (2 M$) France 72 I, S, H, T ●●●● (FIDEME) (FOGIME) 73 Germany I, S, H I, S, H ●●●● KfW funds74 ● 500-1000 (150 M$) Greece I, S, T Ireland Italy I, T ● (30) (25 M$) Portugal I, S, T H ● (7) Spain I, S, H, T I, S, H, T ●●●● ICO-IDEA fund75 ● Several Sweden76 H ● (KLIMP) (43 M$)77 Netherlands I, S UK H I, S ● Several Bulgaria ● Several Czech Rep. I, S, H, T 78 ● CEA fund (3M$), (SFZP
27 M $ (loans 6 M $); Prototype Carbon Fund 79
● Several
Hungary I, S, H I, S ● HEECP fund (0.6 M$/ yr)80
● (30) (400 M$)
Latvia I I Lithuania ● (2) Norway Poland I I, S, H, T ● (7) Romania I, S, H, T I, S, H, T ● Energy efficiency fund
(10 M$)81 ● (2)
Russia I I, S ● (10) Slovenia H I, S, H ● Energy saving fund (3 M$
/y); Ecological fund (7.8 M$/y)● (1)
Slovakia I, S, T Switzerland82 H, S H, S ● (50) (13 M$) Turkey I, S
I: Industry, S: Services, H: households, T: transport; empty cell: no measure
71 For dwellings, subsidies only available for buildings of 3 or more apartments 72 Subsidies are mainly limited to demonstration projects, DSM investments and vehicles using alternative fuels; for buildings, they are given for investments that are part of large retrofitting programmes. 73 Budget of 17.8 M$; expected volume of loans: 260 M$ (20 contracts and 5 G M$ loans achieved in 2002). 74 Climate protection funds of KfW directed at private companies (planned from 2003) 75 Used to finance interest rate subsidies: 61 projects in 2001 corresponding to 76 M€ of loans, of which 13.4 M€ subsidies. 76 Subsidy of 56 000 $ per flat for building dwellings ecologically (total budget of 55 M$ over 2002-2005) 77 KLIMP: Climate Investment Programme introduced in 2002: budget of 900 M SEK for 2002-2004. 78 SFZP: State Environment Fund gives soft loans on renewable energy sources 79 Figures for 2003; SFZP is financed by fees for emissions. Prototype Carbon Fund (PCF) was established by Word Bank in the framework of joint implementation projects; budget of 5 to 7 mil. $USD to the year 2012 80 Hungarian Energy Efficiency Co-financing Programme (HEECP) developed in 1997 by the World Bank and funded by the Global Environment Facility Programme (GEF) to facilitate the establishment of ESCOs 81 In 2003, approximately 3.2 M€ from the income of the development tax were allocated to efficiency projects. 82 In some regions only (“cantons”)
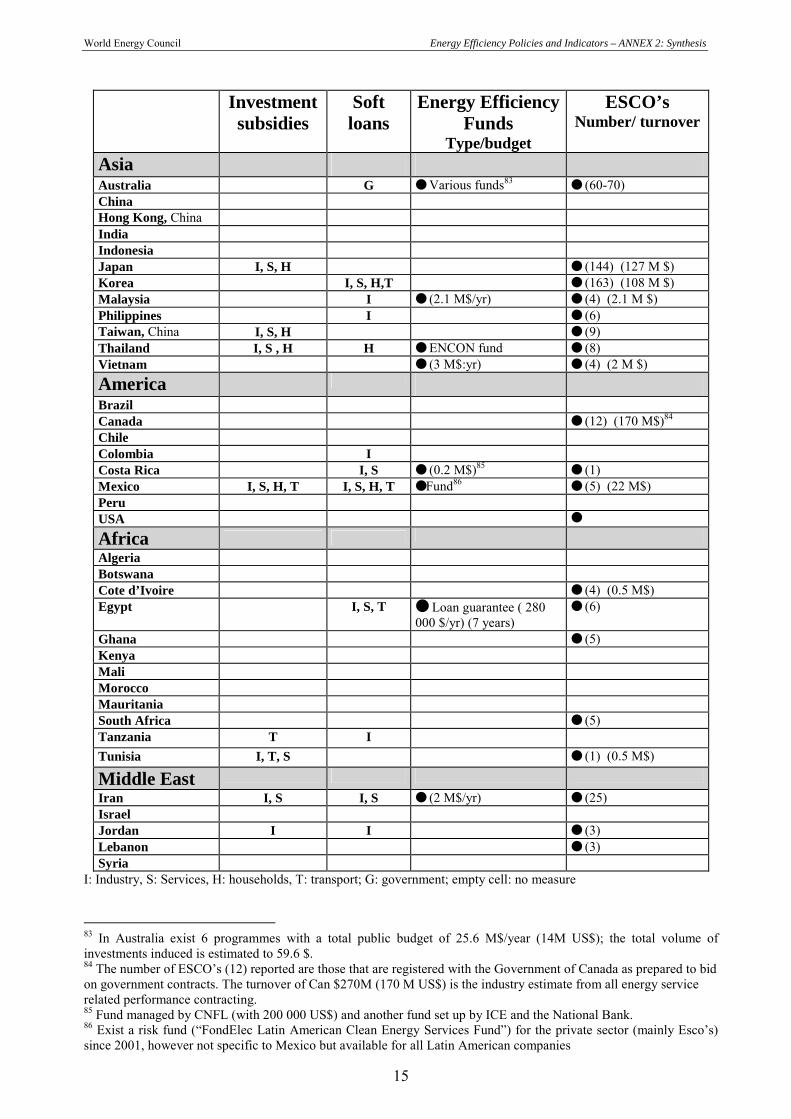
World Energy Council Energy Efficiency Policies and Indicators – ANNEX 2: Synthesis
15
Investment
subsidies Soft loans
Energy Efficiency Funds
Type/budget
ESCO’s Number/ turnover
Asia Australia G ● Various funds83 ● (60-70) China Hong Kong, China India Indonesia Japan I, S, H ● (144) (127 M $) Korea I, S, H,T ● (163) (108 M $) Malaysia I ● (2.1 M$/yr) ● (4) (2.1 M $) Philippines I ● (6) Taiwan, China I, S, H ● (9) Thailand I, S , H H ● ENCON fund ● (8) Vietnam ● (3 M$:yr) ● (4) (2 M $) America Brazil Canada ● (12) (170 M$)84 Chile Colombia I Costa Rica I, S ● (0.2 M$)85 ● (1) Mexico I, S, H, T I, S, H, T ● Fund86 ● (5) (22 M$) Peru USA ●
Africa
Algeria Botswana Cote d’Ivoire ● (4) (0.5 M$) Egypt I, S, T ● Loan guarantee ( 280
000 $/yr) (7 years) ● (6)
Ghana ● (5) Kenya Mali Morocco Mauritania South Africa ● (5) Tanzania T I Tunisia I, T, S ● (1) (0.5 M$)
Middle East
Iran I, S I, S ● (2 M$/yr) ● (25) Israel Jordan I I ● (3) Lebanon ● (3) Syria
I: Industry, S: Services, H: households, T: transport; G: government; empty cell: no measure
83 In Australia exist 6 programmes with a total public budget of 25.6 M$/year (14M US$); the total volume of investments induced is estimated to 59.6 $. 84 The number of ESCO’s (12) reported are those that are registered with the Government of Canada as prepared to bid on government contracts. The turnover of Can $270M (170 M US$) is the industry estimate from all energy service related performance contracting. 85 Fund managed by CNFL (with 200 000 US$) and another fund set up by ICE and the National Bank. 86 Exist a risk fund (“FondElec Latin American Clean Energy Services Fund”) for the private sector (mainly Esco’s) since 2001, however not specific to Mexico but available for all Latin American companies

World Energy Council Energy Efficiency Policies and Indicators – ANNEX 2: Synthesis
16
4. Information and voluntary agreements 4.1. Audits
Dwellings Buildings Industry Europe
Austria S Belgium S 87 Denmark88 M Finland89 S S S France90 S S S Germany S91 Greece M (50) (1994-97) M(25) (2001) 40 (1994-98 ) Ireland Italy F F F Portugal92 M (79) (1986-2000) M (708) (1986-2000) Spain Sweden Netherlands S S (2001) UK Bulgaria Czech Rep. M, S M, S M Estonia Hungary S (50/year) S (30/year) Latvia Lithuania F (>400) F F Norway Poland S (20%) M, S (3200) M Romania93 M M M Russia94 M M Slovenia F (2600 / yr) S (20 / yr) S (10 / yr) Slovakia S S S Switzerland95 S S, M S, M Turkey96 M , S
M: mandatory ; F: free for the consumers (100% subsidies) ; S: partly subsidised
87 Grants cover 50% to 75% of cost for Wallonia (75% for sectors with VA); grants of 20% in Flanders. 88 For buildings over 1500 m2. 89 Rate of subsidy of 40% for dwellings, commercial buildings and industry, and of 50% for public buildings; targets of audits 80% of buildings stock and 80% of industry consumption. For the period 1992-2002, 4550 buildings audited (of which 3183 public) and 883 factories corresponding to 45% and 25% of municipal and commercial buildings respectively. In industry, coverage of about 65% of the electricity consumption (slightly less for heat and fuels). Potential savings for heat and fuels of 15% (6% for electricity) for service sector buildings, of 23% (8% for electricity) for smaller industrial consumers (consumption <70 GWh/yr), and of 11% (4% for electricity) for medium industrial consumers (below 500 GWh/yr) and of 6% (1% for electricity) for large industrial consumers. About 2/3 of the proposed measures will finally be implemented. 90 Rate of subsidy 50%. 11 235 eq. dwellings audited in the household and service sectors, 636 factories, 102 transport companies and 150 agriculture premises (2002) 91 Audits subsidized up to 100 €/audit in one region (Baden-Würthemberg) 92 The potential of energy savings represent 5% of the audited sites (2.3 TWh/ year); audits are mandatory for buildings and industrial sites > 11.6 GWh/year and for transport companies > 5.8 GWh/ year. 93 Mandatory for large consumers (>1000 toe every year, >200 toe every 2 years and every 5 years for buildings above 1500m2); to be made by authorized audtors 94 3000 audits per year, including 800-900 mandatory audits for organisations consuming more 6000 toe / year (according to the federal law "On energy efficiency" of 1996). 95 Audits are mandatory for any sector entering voluntary agreements; they are partly financed by SwissEnergy. In some regions (“cantons”) that subsidize energy efficiency investments, audits are required 96 Mandatory for factories consuming more than 2000 toe/ year; 25 factories audited in 2002

World Energy Council Energy Efficiency Policies and Indicators – ANNEX 2: Synthesis
17
Dwellings Buildings IndustryAsia Australia97 S S(Victoria EPA only) China Hong Kong, China98 S (154) India Indonesia F, S F, S Japan99 F (177) F (200) Korea100 F, S (419) F, S (1750) Malaysia F (2002-06)101 F (2000-04) Philippines (525) (1979-) Yes Taiwan, China102 F, M F, M Thailand103 M, S (< 30%) S (< 30%) Vietnam S America
Brazil104 S S Canada105 S S S Chile Colombia F Costa Rica106 F M, S (123) M, S (94) Mexico F (7430) (1990-2001) F (166) (1999-2002) F (71) (2001) Peru F F F USA F107
97 included in other programs for dwellings and buildings 98 Savings estimated at 50TJ / year 99 Number of audits refers to fiscal year 2003 from April 2003 to March 2004 100 Free for large size buildings and companies 101 Existing public buildings “government energy audits” funded by Malaysian Electricity Supply Industry Trust Account (1.4 M $) 102 Mandatory audits since 1986 for large consumers (> 1 MWh or 6 kt/yr coal or 6 ktoe/yr oil or 10 Mm3/yr); annual saving 118 354 kloe (2002); cumulated savings (767 969 kloe) (1999-2002) 103 Mandatory for electric consumers above 20 TJ; ongoing since 1997; 156 commercial buildings audited, 250 public buildings audited and 635 factories (2001) 104 Rate of subsidy of 75%; energy saving target estimated at of 1.6 TWh/year for all public buildings ; programme initiated in 1994 but with effective actions since 1998 (100 buildings audited since 1998); 105 Objective of 30,000 dwellings per year since 2003 (17,700 achieved), objective of 175 buildings between 2002 and 2005 (200 projects achieved by end of November 2003); in industry objective of 75 audits in SME’S (81 achieved). 106 Audits are mandatory in buildings and industry, for consumers above 0.24 GWh/yr or 360 m3/year of hydrocarbons; since 1998, 66 audits performed in commercial buildings, 57 for public buildings and 94 in industry. 107 Free audits within the Industrial Assessment Center and Best Practice programs.

World Energy Council Energy Efficiency Policies and Indicators – ANNEX 2: Synthesis
18
Dwellings Buildings Industry
Africa
Algeria Botswana F Cote d’Ivoire Egypt F (62) F (440) Ghana Kenya F (40) (2000-) Mali Mauritania 108 S SMorocco F (34) 109
South Africa Tanzania S S (20) (1990-2003) Tunisia110 M, S (20%) (2002-06) M, S (20%) (2002-06)
Middle East
Iran111 F (20 buildings) S (11 buildings) S (>100) Israel 112 M M Jordan S Lebanon F F Syria
M: mandatory; F: free for the consumers (100% subsidies) ; S: partly subsidised 4.2. Local energy information centres
Number/budget113
Europe
Austria ● 30 centres
Belgium ● (15 centres, 26 advisers (1.5M$/year))
Denmark ● (40 centres)
Finland ● (7 agencies, 18 advisers)
France ● (160 centres, 265 advisers 15 M$/yr))
Germany No
Greece No
Ireland No
Italy ● (6 centres)
108 10% subsidies over the period 2004-06 109 6 audits in hotels in 1997-98; 18 audits in hospital between 1997 and 2003; 10 audits in hospitals and education premises underway. 110 Audits planned for the period 2002-2006: 72 industrial sites, 25 transport companies, 85 hotels/hospitals; mandatory for factories consuming more than 1000 toe/year, buildings and transport companies 111 Since 1999 for buildings and 1996 for industry; audits show a potential of 30% electricity savings for buildings and 40% for thermal uses. 112 Mandatory audits for all consumers using more that 2 ktoe/year, includes also transport companies 113 annual budget

World Energy Council Energy Efficiency Policies and Indicators – ANNEX 2: Synthesis
19
Number/budget114
Portugal No
Spain ● (18 centres)
Sweden ● (290 centres) (38 M$/yr)
Netherlands No
UK ● (52 centres, 10 M$/yr)
Bulgaria No
Czech Rep. ● (62 centres, 152 advisers)115
Hungary ● (600 advisers)
Latvia No
Lithuania ● (10 advisers)( 0.1 M$)
Norway No
Poland No
Romania ● 4 centres (20 advisers)
Russia ● (20 centres)
Slovenia ● (30 centres) (0.39 M$)
Slovakia No
Switzerland No
Turkey No
Asia
Hong Kong, China No
Indonesia No
Japan No
Korea No
Malaysia No
Philippines ●
Taiwan, China No
Thailand No
Vietnam ● (30 advisers) (1 M$)
114 annual budget 115 The advisors are grouped in Energy Consulting and Information Centres -EKIS CEA.
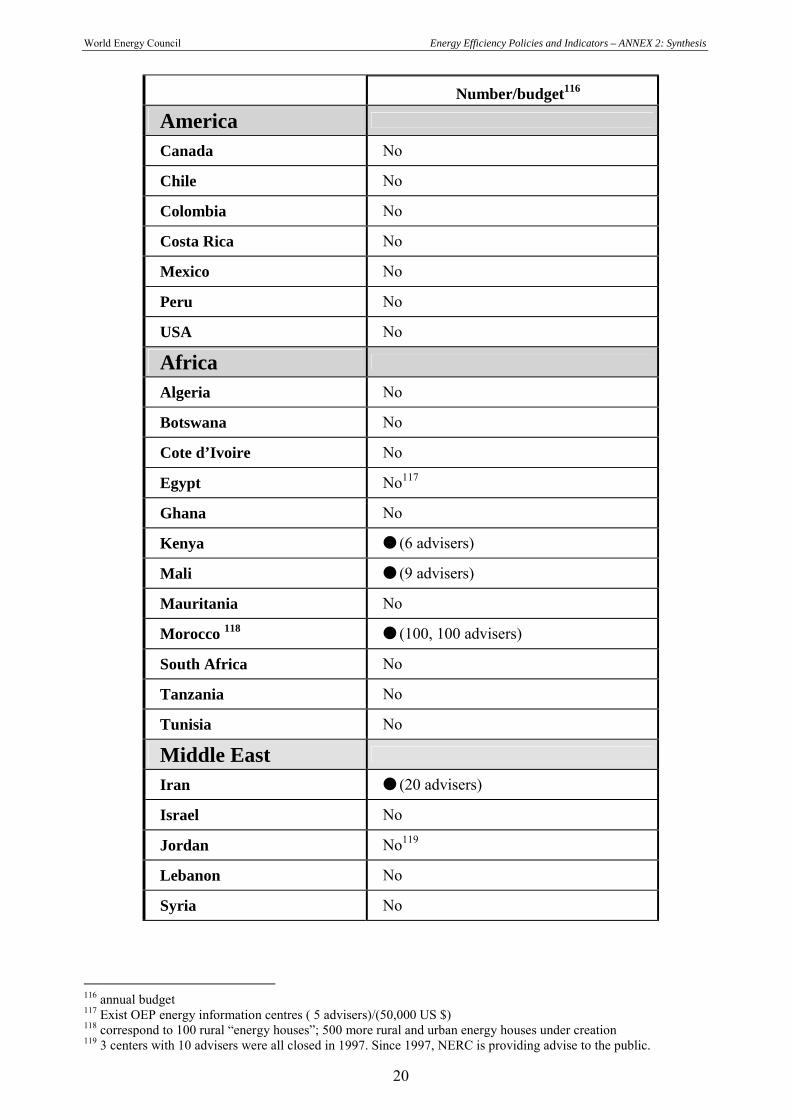
World Energy Council Energy Efficiency Policies and Indicators – ANNEX 2: Synthesis
20
Number/budget116
America
Canada No
Chile No
Colombia No
Costa Rica No
Mexico No
Peru No
USA No
Africa
Algeria No
Botswana No
Cote d’Ivoire No
Egypt No117
Ghana No
Kenya ● (6 advisers)
Mali ● (9 advisers)
Mauritania No
Morocco 118 ● (100, 100 advisers)
South Africa No
Tanzania No
Tunisia No
Middle East
Iran ● (20 advisers)
Israel No
Jordan No119
Lebanon No
Syria No
116 annual budget 117 Exist OEP energy information centres ( 5 advisers)/(50,000 US $) 118 correspond to 100 rural “energy houses”; 500 more rural and urban energy houses under creation 119 3 centers with 10 advisers were all closed in 1997. Since 1997, NERC is providing advise to the public.
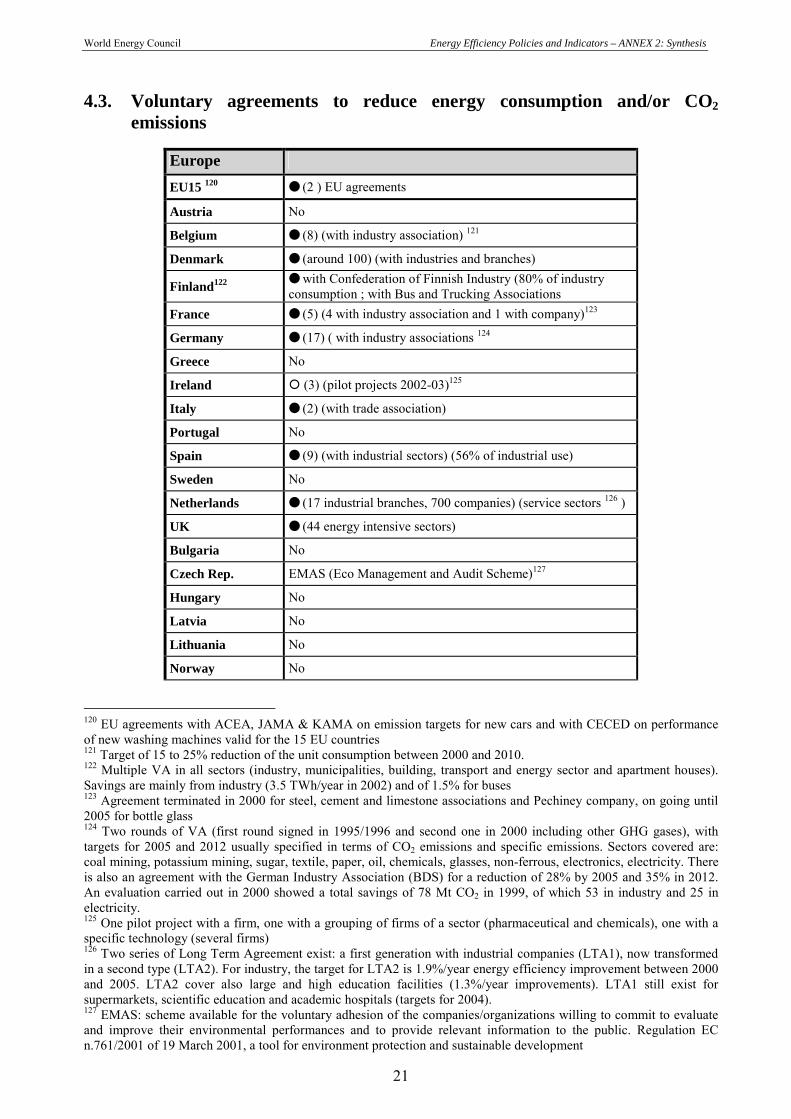
World Energy Council Energy Efficiency Policies and Indicators – ANNEX 2: Synthesis
21
4.3. Voluntary agreements to reduce energy consumption and/or CO2
emissions
Europe EU15 120 ● (2 ) EU agreements
Austria No
Belgium ● (8) (with industry association) 121
Denmark ● (around 100) (with industries and branches)
Finland122 ● with Confederation of Finnish Industry (80% of industry consumption ; with Bus and Trucking Associations
France ● (5) (4 with industry association and 1 with company)123
Germany ● (17) ( with industry associations 124
Greece No
Ireland � (3) (pilot projects 2002-03)125
Italy ● (2) (with trade association)
Portugal No
Spain ● (9) (with industrial sectors) (56% of industrial use)
Sweden No
Netherlands ● (17 industrial branches, 700 companies) (service sectors 126 )
UK ● (44 energy intensive sectors)
Bulgaria No
Czech Rep. EMAS (Eco Management and Audit Scheme)127
Hungary No
Latvia No
Lithuania No
Norway No
120 EU agreements with ACEA, JAMA & KAMA on emission targets for new cars and with CECED on performance of new washing machines valid for the 15 EU countries 121 Target of 15 to 25% reduction of the unit consumption between 2000 and 2010. 122 Multiple VA in all sectors (industry, municipalities, building, transport and energy sector and apartment houses). Savings are mainly from industry (3.5 TWh/year in 2002) and of 1.5% for buses 123 Agreement terminated in 2000 for steel, cement and limestone associations and Pechiney company, on going until 2005 for bottle glass 124 Two rounds of VA (first round signed in 1995/1996 and second one in 2000 including other GHG gases), with targets for 2005 and 2012 usually specified in terms of CO2 emissions and specific emissions. Sectors covered are: coal mining, potassium mining, sugar, textile, paper, oil, chemicals, glasses, non-ferrous, electronics, electricity. There is also an agreement with the German Industry Association (BDS) for a reduction of 28% by 2005 and 35% in 2012. An evaluation carried out in 2000 showed a total savings of 78 Mt CO2 in 1999, of which 53 in industry and 25 in electricity. 125 One pilot project with a firm, one with a grouping of firms of a sector (pharmaceutical and chemicals), one with a specific technology (several firms) 126 Two series of Long Term Agreement exist: a first generation with industrial companies (LTA1), now transformed in a second type (LTA2). For industry, the target for LTA2 is 1.9%/year energy efficiency improvement between 2000 and 2005. LTA2 cover also large and high education facilities (1.3%/year improvements). LTA1 still exist for supermarkets, scientific education and academic hospitals (targets for 2004). 127 EMAS: scheme available for the voluntary adhesion of the companies/organizations willing to commit to evaluate and improve their environmental performances and to provide relevant information to the public. Regulation EC n.761/2001 of 19 March 2001, a tool for environment protection and sustainable development

World Energy Council Energy Efficiency Policies and Indicators – ANNEX 2: Synthesis
22
Poland No
Romania No
Russia No
Slovenia No
Slovakia No
Switzerland128 ● (7) (with large consumers associations and SME’S)
Turkey No
Asia
Australia ● (variety of programs with voluntary commitments)
China ● (2 steel companies)
Hong Kong, China No
India No
Indonesia No
Japan ● (1) (industry federation)
Korea ● (industry and building)
Malaysia ● (14) (4 with industry associations and 10 with industrial companies)
Philippines ●
Taiwan, China ● (5) ( with industry associations )129
Thailand
Vietnam ● (1) (textile industry)
America
Brazil ● (2) industry, water and sewage sector130
Canada131 ● (12) (10 with industry associations, 2 in transport)
Chile No
Colombia No
Costa Rica No
Mexico ● (1) (oil company)
Peru No
USA ● 132
128 Out of the 7 on-going agreements, 6 have completed audits (4 large consumers: shopping centers, cheese factories, ceramics factories, hotel association) and 2 SME’s) and 1 was signed in February 2003 (cement association). Voluntary agreements are provided for in the CO2 law: to avoid an impending CO2 tax in 2004 at the earliest, enterprises or groups can enter in biding agreements. End of 2002, 600 businesses grouped in 46 large consumer groups and 6 SME groups accounting for about 25% of Swiss industrial CO2 emissions were at varying stages of negotiation. End of 2003, 40% of industrial CO2 emissions should be covered by VA. 129 Iron & steel, chemicals, cement, pulp & paper and man made fibers ; period 1997-2002; target of 1.9 MGloe savings (about 1.7 Mtoe) 130 savings of 2 TWh/year on motor efficiency (industry) by 2005and 1.4 TWh/year on pumping (water and sewage) after 3 years 131 There exist in addition 2 overall agreements, of which: CIPEC, Canadian Industry Program for Energy Conservation, has a target of 1%/y improvement in energy intensity for 2000-2005. 132 The US has many different voluntary programs (see US Climate Action Report 2002 at //yosemite.epa.gov)
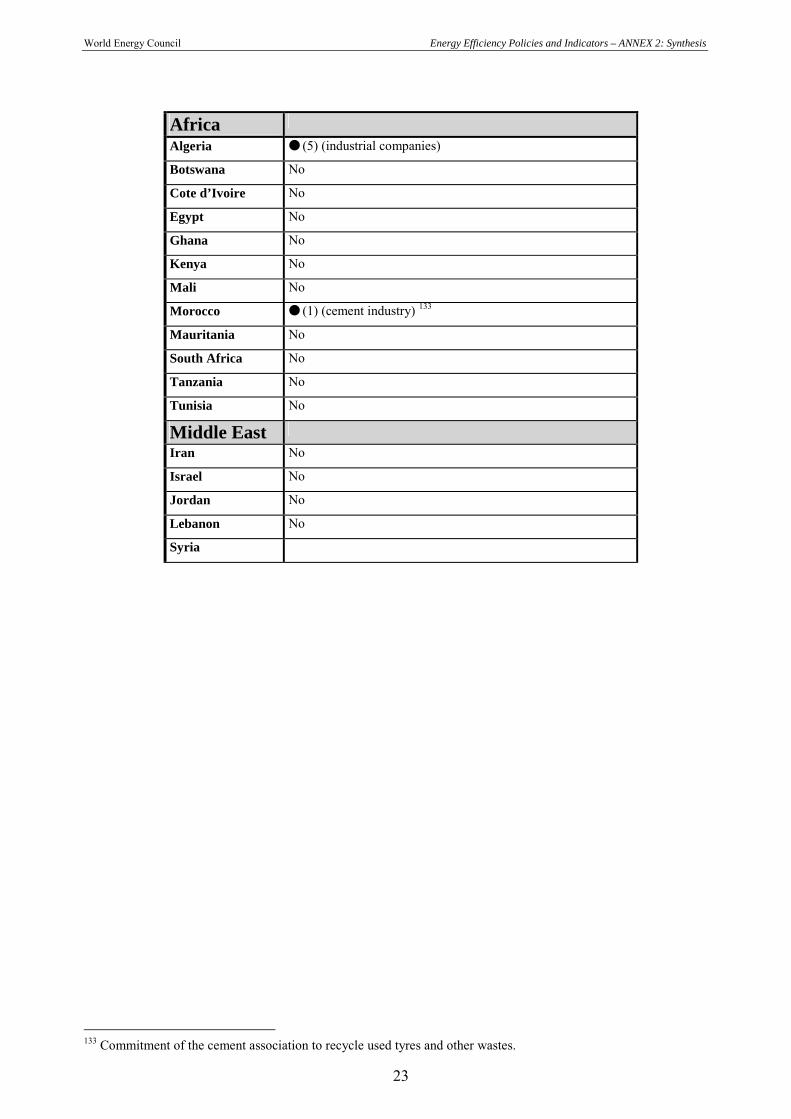
World Energy Council Energy Efficiency Policies and Indicators – ANNEX 2: Synthesis
23
Africa
Algeria ● (5) (industrial companies)
Botswana No
Cote d’Ivoire No Egypt No Ghana No
Kenya No Mali No
Morocco ● (1) (cement industry) 133
Mauritania No
South Africa No Tanzania No Tunisia No
Middle East
Iran No
Israel No
Jordan No
Lebanon No
Syria
133 Commitment of the cement association to recycle used tyres and other wastes.


