The International Energy Agency (IEA) is an autonomous body which was established in November 1974 within the framework of the Organisation for Economic Co-operation and Development (OECD) to implement an international energy programme.
It carries out a comprehensive programme of energy co-operation among twenty-seven of the OECD thirty member countries. The basic aims of the IEA are:
n To maintain and improve systems for coping with oil supply disruptions.
n To promote rational energy policies in a global context through co-operative relations with non-member countries, industry and international organisations.
n To operate a permanent information system on the international oil market.
n To improve the world’s energy supply and demand structure by developing alternative energy sources and increasing the efficiency of energy use.
n To promote international collaboration on energy technology.
n To assist in the integration of environmental and energy policies.
The IEA member countries are: Australia, Austria, Belgium, Canada, Czech Republic, Denmark, Finland, France, Germany, Greece, Hungary, Ireland, Italy, Japan, Republic of Korea, Luxembourg, Netherlands, New Zealand, Norway, Portugal, Slovak Republic, Spain, Sweden, Switzerland, Turkey, United Kingdom and United States. Poland is expected to become a member in 2008. The European Commission also participates in the work of the IEA.
ORGANISATION FOR ECONOMIC CO-OPERATION AND DEVELOPMENT
The OECD is a unique forum where the governments of thirty democracies work together to address the economic, social and environmental challenges of globalisation. The OECD is also at the forefront of efforts to understand and to help governments respond to new developments and concerns, such as corporate governance, the information economy and the challenges of an ageing population. The Organisation provides a setting where governments can compare policy experiences, seek answers to common problems, identify good practice and work to co-ordinate domestic and international policies.
The OECD member countries are: Australia, Austria, Belgium, Canada, Czech Republic, Denmark, Finland, France, Germany, Greece, Hungary, Iceland, Ireland, Italy, Japan, Republic of Korea, Luxembourg, Mexico, Netherlands, New Zealand, Norway, Poland, Portugal, Slovak Republic, Spain, Sweden, Switzerland, Turkey, United Kingdom and United States.The European Commission takes part in the work of the OECD.
International Energy Agency (IEA), Head of Communication and Information Office,
9 rue de la Fédération, 75739 Paris Cedex 15, France.
Please note that this publication is subject to specific restrictions that limit its use and distribution.
The terms and conditions are available online at http://www.iea.org/Textbase/about/copyright.asp
3
Foreword At their 2005 summit in Gleneagles, leaders of the G8 asked the International Energy Agency (IEA) for advice on how to achieve a clean, clever and competitive energy future. Improved energy efficiency is often the most economic and readily available means of improving energy security and reducing greenhouse gas emissions. To support better energy efficiency policy-making and evaluation, the IEA is therefore developing in-depth indicators of energy use, efficiency trends and CO2 emissions. As part of this work, the IEA published in May 2008 Worldwide Trends in Energy Use and Efficiency: Key Insights from IEA Indicator Analysis. For the first time the report included indicators examining the efficiency of electricity generation from fossil fuels. This Information Paper expands on the key results for the electricity generation sector. The additional analysis includes efficiency indicators for electricity production from the individual fossil fuels, as well as an analysis of the sensitivity of the results to some of the key assumptions. The report was prepared by the Office of Energy Technology and R&D in co-operation with the Energy Statistics Division. Peter Taylor is the co-ordinator of the IEA indicators work and had overall responsibility for the report, with input from Olivier Lavagne d’Ortigue, Nathalie Trudeau and Michel Francoeur. Many other IEA colleagues provided helpful comments. Particular thanks go to IEA Communication and Information Office for their work in producing this publication.
This paper was prepared in support of the G8 Plan of Action in 2008. It was drafted by the Energy Technology Policy Division in collaboration with the Energy Statistics Division. This paper reflects the views of the IEA Secretariat and may or may not reflect the views of the individual IEA Member countries. For further information on this document, please contact the Energy Technology Policy Division at [email protected].
Summary ........................................................................................ 5 Introduction .................................................................................... 5 Methodology .................................................................................... 6 Fossil-Fuelled Electricity Production and Fuel Mix ....................................... 7 Efficiency of Coal-Fired Electricity Production .......................................... 10 Efficiency of Natural Gas-Fired Electricity Production ................................. 12 Efficiency of Oil-Fired Electricity Production ........................................... 14 Efficiency of Fossil Fuel-Fired Electricity Production .................................. 16 Energy Savings Potential from Improving Efficiency .................................... 18 References .................................................................................... 19 Annex A: Electricity Production Efficiencies by Fuel ................................... 20
5
Summary
Electricity production is responsible for 32% of total global fossil fuel use, accounting for 132 EJ, and 41%, or 10.9 Gt of energy-related CO2 emissions. Improving the efficiency of electricity production therefore offers economic benefits and a significant opportunity for reducing dependence on fossil fuels, which helps to combat climate change and improve energy security.
A set of indicators has been developed to analyse the energy efficiency of electricity production from fossil fuels on a global level and for a number of key countries and regions. These indicators show the efficiency of electricity production from coal, natural gas and oil separately and from all fossil fuels together. The technical potentials for energy and CO2 savings from improving the energy efficiency of electricity production are also calculated.
The global average efficiencies of electricity production are 34% for coal, 40% for natural gas and 37% for oil. For all fossil fuels, the global average efficiency is 36%. Wide variations are seen in efficiencies amongst countries, with OECD countries typically having the highest efficiencies. The level of efficiency has been slowly improving in recent years in most countries.
However, significant fuel and CO2 saving potentials still exist. Across all fossil fuels the technical fuel savings potential is between 21 EJ and 29 EJ per year, with an associated CO2 reduction potential of 1.8 Gt CO2 to 2.5 Gt CO2 per year. The largest savings are from improving the efficiency of coal-fired plants, which alone could provide savings of between 15 EJ and 21 EJ (1.4 Gt CO2 to 2.0 Gt CO2). On a regional basis, just less than half the global savings would come from OECD countries, with the remainder from developing countries.
Introduction Electricity production accounts for 32% of total global fossil fuel use and around 41% of total energy-related CO2 emissions. Improving the efficiency with which electricity is produced is therefore one of the most important ways of reducing the world’s dependence on fossil fuels, thus helping both to combat climate change and improve energy security. Additional fuel efficiency gains can be made by linking electricity generation to heating and cooling demands through high efficiency combined heat and power (CHP) systems (e.g. in industry and for district heating).1 This paper presents a set of indicators that are used to analyse the energy efficiency of electricity production from fossil fuels on a global level and for a number of key countries and regions. The analysis is based on IEA statistics and includes public electricity plants and public CHP plants. Electricity production by autoproducers is not included and represents less than 6% of global electricity production. However, the share of autoproducers is significant in certain countries, particularly in Europe. Austria, Finland, Luxembourg, the Netherlands and Spain all have a share of electricity production from autoproducers that is more than twice the global average.
1 The potential for carbon savings from increased use of combined heat and power in industry is analysed in IEA, 2007b, and is calculated to be between 110 Mt CO2 and 170 Mt CO2 per year.
6
Country specific indicators are calculated for all OECD countries2 plus Brazil, China, India, Russia and South Africa. Information is also presented for two country groupings, OECD countries and non-OECD countries, and for the world. The analysis compares the trends and levels of fossil-fuelled electricity production by developing indicators showing the efficiencies for coal, natural gas and oil separately and then aggregating the results to provide an indicator for all fossil fuels. Finally, a calculation is made of the technical potential for energy and CO2 savings from improving the energy efficiency of electricity production.
Methodology
Data on fuel inputs to public electricity and CHP plants and electricity and heat outputs from these plants are taken from IEA statistics. In the case of OECD countries the data are from Electricity Information 2007 (IEA, 2007c), and for other countries they come from Energy Balances of Non-OECD Countries (IEA, 2007d). The IEA statistics provide a consistent set of data for all countries in which:
Energy inputs for both electricity plants and CHP plants are based on net calorific values; and
Energy outputs are defined as the gross production of electricity and heat. In the case of electricity, this is defined as all the electricity produced including the auxiliary electricity consumption and losses in transformers at the power station.
The methodology used to calculate the energy efficiency of electricity production is based on Graus et al, 2007 and Phylipsen et al, 1998. The energy efficiency (E) of electricity production is defined as:
E = (P + H s)/I
Where: P = electricity production from public electricity plants and public CHP plants; H = useful heat output from public CHP plants; s = correction factor between heat and electricity, defined as the reduction in electricity production per unit of heat extracted; I = fuel input for public electricity plants and public CHP plants.
In CHP plants the combined production of heat and electricity is more efficient in terms of the use of primary energy compared to separate production of heat and electricity. However, heat extraction causes the energy efficiency of electricity production to decrease. The loss of efficiency depends on the temperature of the heat extracted. To account for this, a correction for heat extraction is applied. As public CHP is mainly used to provide district heating the appropriate substitution factor lies somewhere between 0.15 and 0.2 (Phylipsen, 1998). In this analysis a value of 0.175 is used, with the sensitivity of the results to higher and lower values also examined in Annex A. It should be noted that when heat is delivered at higher temperatures (e.g. to industrial processes), the substitution factor can be significantly higher. However, the amount of high-temperature heat delivered to industry by public utilities is small in most countries.
2 OECD countries are Australia, Austria, Belgium, Canada, the Czech Republic, Denmark, Finland, France, Germany, Greece, Hungary, Iceland, Ireland, Italy, Japan, the Republic of Korea, Luxembourg, Mexico, the Netherlands, New Zealand, Norway, Poland, Portugal, the Slovak Republic, Spain, Sweden, Switzerland, Turkey, the United Kingdom and the United States.
7
To counter the effects of unusual circumstances in a particular year leading to higher or lower than average efficiencies for electricity production in a particular country, the fuel-specific efficiencies presented for each country or region are the simple average of efficiencies over the five years from 2001 to 2005. 3 The average efficiencies of all fossil-fuelled electricity production for the 2001 to 2005 period are the weighted average of the annual fuel-specific efficiencies.
Fossil-Fuelled Electricity Production and Fuel Mix
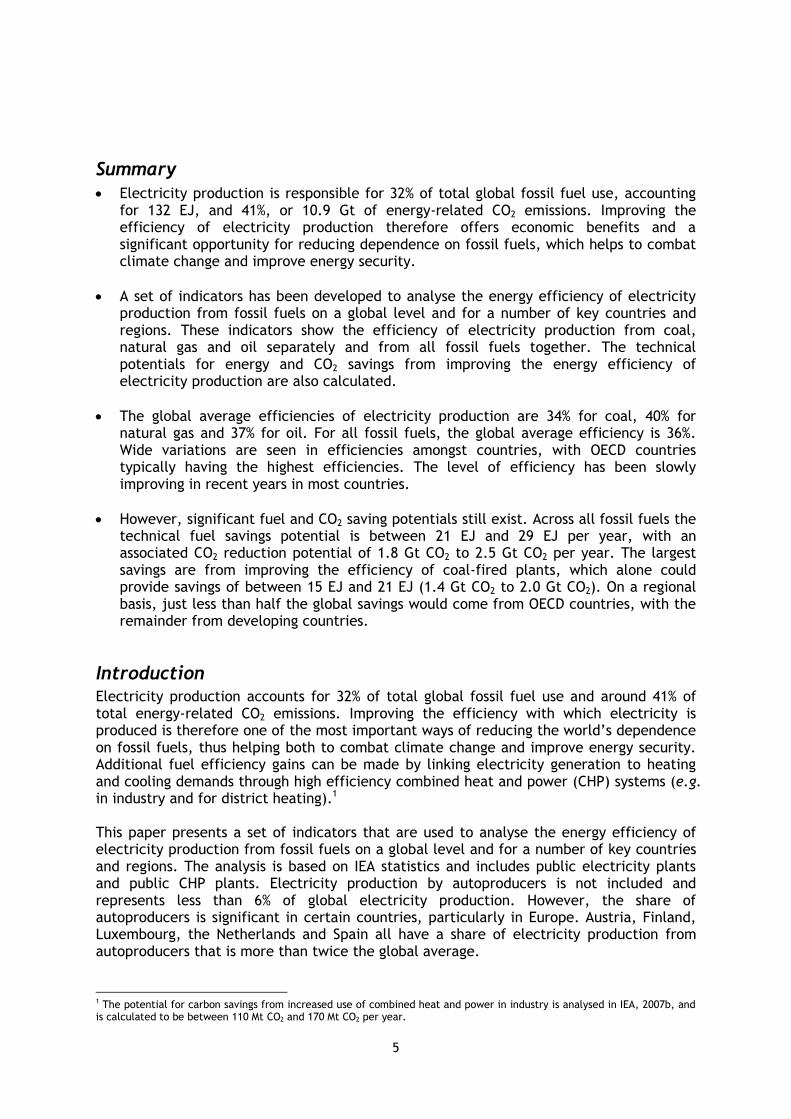
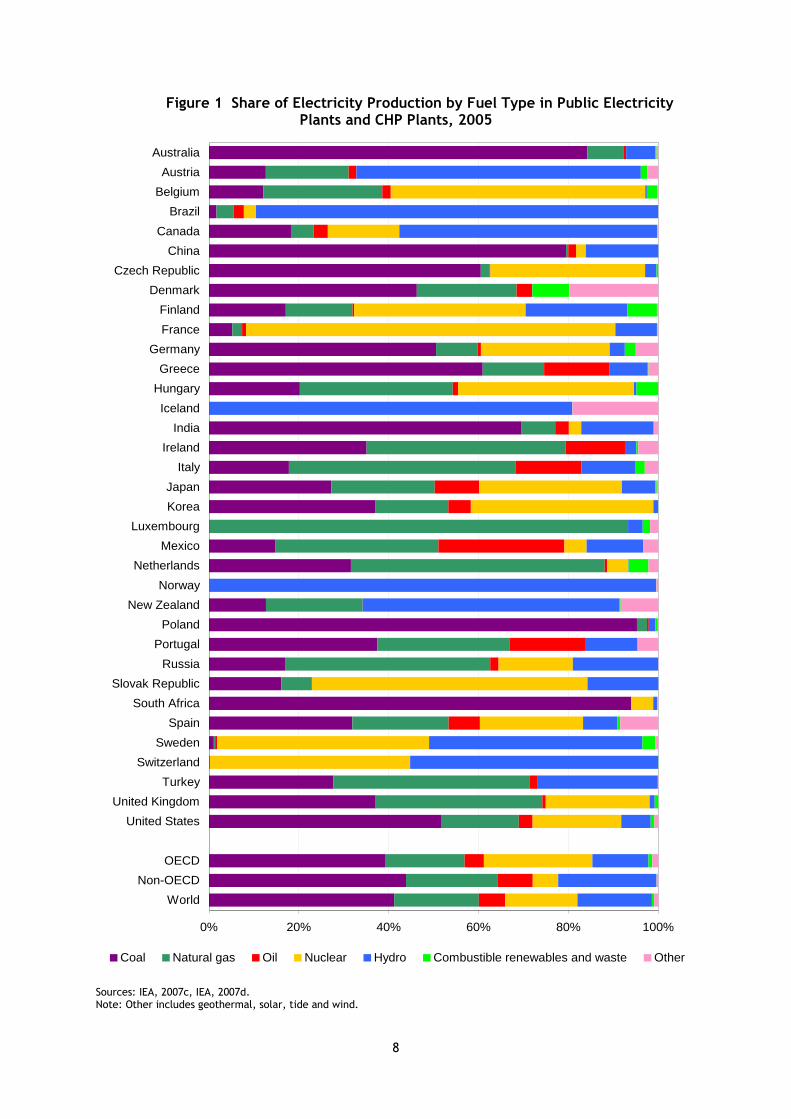
The share of electricity production from fossil fuels (coal, natural gas and oil) in 2005 varies considerably amongst the countries analysed (Figure 1), as do the absolute levels of electricity production (Figure 2). On average, the share of electricity production from fossil fuels in OECD countries is around 61%. In contrast, non-OECD countries have a higher share, 72% on average. A number of individual countries also have significantly higher shares of fossil-fuelled electricity production than these average figures e.g. Poland (98%), South Africa (94%), Luxembourg (93%), Australia (93%), Ireland (93%), Greece (89%), the Netherlands (89%), Portugal (84%), Italy (83%), China (82%) and India (80%).
In absolute terms, the United States and China have the highest production of electricity from fossil fuels and account for 44% of world production. A further five countries, Russia, Japan, India, Germany and the United Kingdom, account for another 20% of fossil-fuelled electricity production. Globally most fossil-fuelled electricity production is from coal (63%), followed by natural gas (29%) and oil (9%).
3 These country average efficiencies are for electricity production from both electricity only and CHP plants.
8
Figure 1 Share of Electricity Production by Fuel Type in Public Electricity Plants and CHP Plants, 2005
0% 20% 40% 60% 80% 100%
Australia
Austria
Belgium
Brazil
Canada
China
Czech Republic
Denmark
Finland
France
Germany
Greece
Hungary
Iceland
India
Ireland
Italy
Japan
Korea
Luxembourg
Mexico
Netherlands
Norway
New Zealand
Poland
Portugal
Russia
Slovak Republic
South Africa
Spain
Sweden
Switzerland
Turkey
United Kingdom
United States
OECD
Non-OECD
World
Coal Natural gas Oil Nuclear Hydro Combustible renewables and waste Other
Sources: IEA, 2007c, IEA, 2007d. Note: Other includes geothermal, solar, tide and wind.
9
Figure 2 Electricity Production by Fossil Fuels in Public Electricity and CHP Plants, 2005
0 500 1000 1500 2000 2500 3000
Czech Republic
France
Greece
Netherlands
Turkey
Poland
Spain
Canada
Mexico
Korea
South Africa
Australia
Italy
United Kingdom
Germany
India
Japan
Russia
China
United States
TWh
Coal Oil Natural gas
Sources: IEA, 2007c, IEA, 2007d.
10
Efficiency of Coal-Fired Electricity Production Coal is the main fossil fuel used for electricity production. The share of coal-fired electricity production in total electricity production in OECD countries was 39% in 2005, down from 42% in 1990. The share of coal in non-OECD countries was higher, at 44%. In absolute terms, coal-fired electricity production was highest in the United States (2 129 TWh) and China (1 957 TWh). These two countries accounted for 58% of global coal-based electricity production. Other countries with significant coal-fired electricity production include India, Germany, Japan, South Africa, Australia, Russia, Poland, the Republic of Korea, the United Kingdom and Canada. In most countries, the vast majority of coal-fired electricity production is in electricity-only plants. However, in Russia, Denmark, Norway, Poland and Sweden all electricity production from coal is reported in IEA statistics as coming from combined heat and power plants. The Slovak Republic and Finland also have more than half of coal-fired electricity generation from CHP plants. The average efficiency of electricity production from coal in both public electricity-only and public CHP plants is 37% in the OECD (averaged over the 2001 to 2005 period).4 This is significantly higher than the average efficiency of 32% in non-OECD countries. Average efficiencies of coal plant in individual countries range from 27% in India to 43% in Denmark (Figure 3). Amongst OECD countries the spread of efficiencies is more limited, from 36% in the United States to 43% in Denmark. Since 1990, the average efficiencies of coal-fired plants have risen in most countries, with increases of about half a percentage point in OECD countries and of two percentage points in non-OECD countries. The efficiencies of coal-fired plants depend on a range of factors including the technology employed, the type and quality of coal used and the operating conditions and practices. The low average efficiencies in India are at least partly explained by the widespread use of subcritical plants burning unwashed coal with high ash content, as well as the use of coal-fired plants for peak load electricity production. In contrast, Denmark has some of the most efficient coal-fired power plants in the world, including a new generation of pulverised coal supercritical plants that were introduced in the 1990s (IEA, 2007a).
4 Efficiencies in this paper are presented on a gross output basis using net calorific values. On a net output basis using gross
calorific values, the global average coal-fired power plant efficiency was around 28% in 2004.
11
Figure 3 Efficiency of Electricity Production from Coal in Public Electricity and CHP Plants
33%
41%
38%
29%
38%
32%
32%
43%
39%
39%
38%
36%
31%
27%
39%
38%
42%
36%
36%
39%
34%
34%
36%
40%
32%
30%
37%
38%
40%
35%
38%
36%
37%
32%
34%
0% 5% 10% 15% 20% 25% 30% 35% 40% 45%
Australia
Austria
Belgium
Brazil
Canada
China
Czech Republic
Denmark
Finland
France
Germany
Greece
Hungary
Iceland
India
Ireland
Italy
Japan
Korea
Luxembourg
Mexico
Netherlands
Norway
New Zealand
Poland
Portugal
Russia
Slovak Republic
South Africa
Spain
Sweden
Switzerland
Turkey
United Kingdom
United States
OECD
Non-OECD
World
Average 2001-2005 1990
Source: IEA analysis. Note: According to IEA statistics, some countries do not have any public electricity generation from coal-fired plants.
12
Efficiency of Natural Gas-Fired Electricity Production The share of natural gas-fired electricity production has increased rapidly in recent years in many countries and by 2005 represented 19% of global electricity production, up from a share of 14% in 1990. In OECD countries, the increase has been more rapid, from a share of 9% in 1990 to 18% in 2005. In contrast, the share of natural gas in non-OECD countries has fallen slightly over the same period from 22% in 1990 to 20% in 2005. The United States and Russia have the highest absolute levels of natural gas-fired electricity production, accounting for 35% of global natural gas-fired production. Other countries with significant electricity production from natural gas include Japan, Italy and
the United Kingdom. The majority of natural gas-fired electricity production is from electricity-only plant (74% of the total). However, the share of natural gas based electricity production from CHP plants is important in some countries. For instance, in Denmark, Poland, the Slovak Republic, Sweden, Switzerland and Russia, IEA statistics record all natural gas-fired electricity production as coming from CHP plants. Higher than average shares for CHP plants are also found in France, Finland, the Czech Republic, the Netherlands, Hungary, Germany, Austria, Canada and Italy. The average efficiency of natural gas-fired electricity production (over the period 2001 to 2005) in both public electricity-only and public CHP plants is 45% in the OECD and around 35% in non-OECD countries. Average efficiencies of natural gas plants in individual countries range from 31% in Sweden (which produces very little electricity from natural gas) to 55% in Luxembourg (Figure 4). Since 1990, the average efficiencies of natural gas-fired plants have risen significantly in many countries. As a result, the average efficiency in OECD countries has increased by almost eight percentage points, while non-OECD countries have seen a two percentage points rise. The widespread introduction of successively more efficient combined-cycle gas turbine (CCGT) plants in OECD countries has been the main driver behind the increase in both the use of natural gas for electricity production and the average generation efficiency. The latest CCGTs can have efficiencies of about 60%. New, high efficiency, CCGT plants are also the reason behind the substantial increase in efficiency for Brazil and India (24 and 17 percentage points respectively).
13
Figure 4 Efficiency of Electricity Production from Natural Gas in Public Electricity and CHP Plants
40%
35%
45%
43%
52%
55%
36%
50%
35%
33%
54%
34%
47%
47%
44%
55%
49%
45%
51%
47%
41%
39%
45%
43%
48%
49%
45%
34%
39%
40%
45%
51%
46%
37%
0% 10% 20% 30% 40% 50% 60%
Australia
Austria
Belgium
Brazil
Canada
China
Czech Republic
Denmark
Finland
France
Germany
Greece
Hungary
Iceland
India
Ireland
Italy
Japan
Korea
Luxembourg
Mexico
Netherlands
Norway
New Zealand
Poland
Portugal
Russia
Slovak Republic
South Africa
Spain
Sweden
Switzerland
Turkey
United Kingdom
United States
OECD
Non-OECD
World
Average 2001-2005 1990
Source: IEA analysis. Note: According to IEA statistics, some countries do not have any public electricity generation from natural gas-fired plants.
14
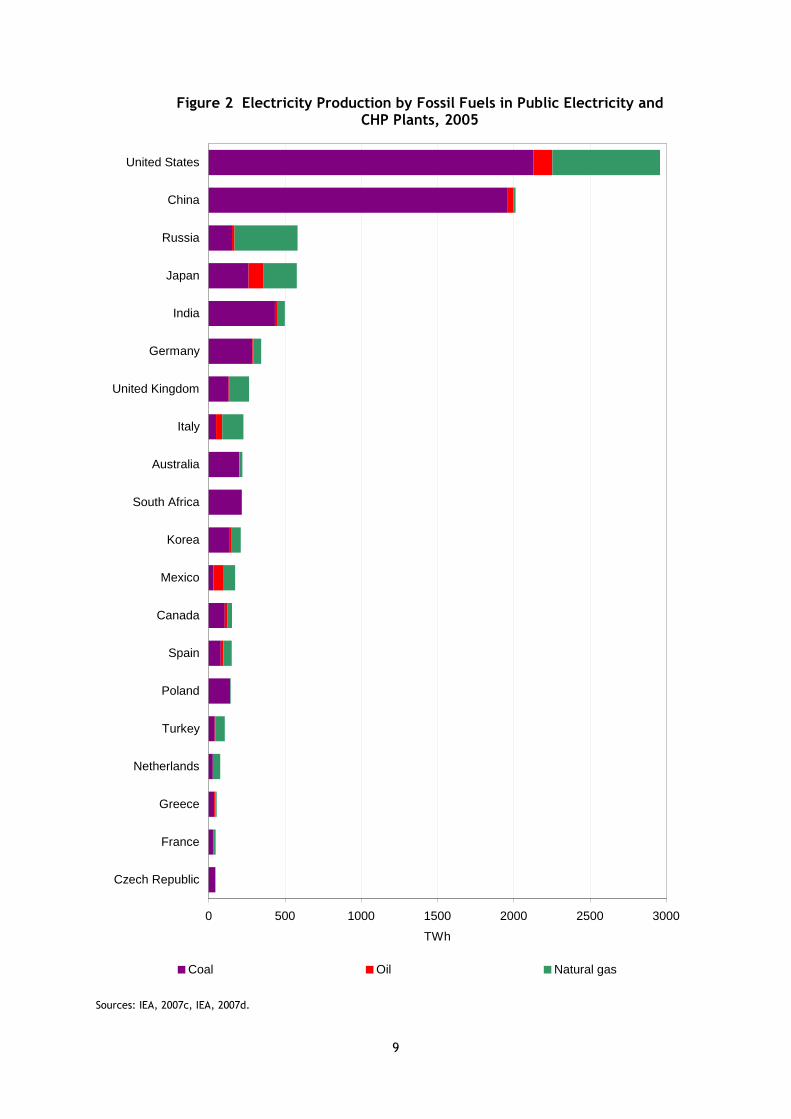
Efficiency of Oil-Fired Electricity Production The share of electricity production from oil has fallen sharply since 1990 in many countries. On average, oil-fired electricity production in 2005 accounted for 4% of total electricity production in the OECD, down from 9% in 1990. A similar fall was seen in non-OECD countries, where the share of oil in 2005 was 8%. The highest absolute levels of electricity production from oil are in the United States, Japan, Mexico, China and Italy. These five countries now account for more than 36% of global oil-fired electricity production. The overwhelming majority of oil-fired electricity production is in electricity-only plants (91% of the total). However, for the Netherlands, Poland and Russia all electricity production from oil is recorded in IEA statistics as being from CHP plants. CHP plants also have a high share of total oil-fired electricity production in Austria, the Czech Republic, Denmark, Finland and Sweden. The average efficiency of oil-fired electricity production in OECD countries is 37% (over the 2001 to 2005 period). In non-OECD countries the average efficiency is similar at 36%. The efficiencies in individual countries range from 23% in the Slovak Republic to 43% in the Netherlands (Figure 5). Since 1990, average efficiencies for oil-fired electricity production have increased slightly in most regions.
15
Figure 5 Efficiency of Electricity Production from Oil in Public Electricity and CHP Plants
37%
36%
37%
35%
29%
35%
30%
37%
35%
23%
33%
38%
36%
30%
43%
34%
37%
42%
41%
36%
26%
30%
33%
36%
34%
31%
35%
40%
24%
34%
39%
34%
41%
36%
33%
0% 5% 10% 15% 20% 25% 30% 35% 40% 45%
Australia
Austria
Belgium
Brazil
Canada
China
Czech Republic
Denmark
Finland
France
Germany
Greece
Hungary
Iceland
India
Ireland
Italy
Japan
Korea
Luxembourg
Mexico
Netherlands
Norway
New Zealand
Poland
Portugal
Russia
Slovak Republic
South Africa
Spain
Sweden
Switzerland
Turkey
United Kingdom
United States
OECD
Non-OECD
World
Average 2001-2005 1990
Source: IEA analysis. Note: According to IEA statistics, some countries do not have any public electricity generation from oil-fired plants.
16
Efficiency of Fossil Fuel-Fired Electricity Production The efficiencies calculated for coal, natural gas and oil can be combined to give weighted average efficiencies for all fossil fuels for the period 2001 to 2005. The average efficiencies of all fossil-fired electricity production are 39% for OECD countries and 33% for non-OECD countries. Average efficiencies in individual countries range from 28% in India to 55% in Luxembourg (Figure 6). Since 1990, the average efficiency of fossil fuel-fired electricity production has increased by almost two percentage points in both OECD and non-OECD countries. The overall efficiency of fossil fuel-fired electricity production is strongly influenced by the mix of fuels used. Countries with a large share of natural gas generally have much higher average efficiencies than countries that mainly rely on coal and oil. Similarly, for many countries an increasing share of natural gas in the electricity production mix has been the main factor driving up efficiencies over time. One exception to this is Russia, where the efficiency of gas-fired electricity production, at 33%, is low compared to the world average. Thus the overall efficiency of Russia’s fossil-fuelled electricity production (71% of which is gas) is very similar to that of China (of which 97% is from coal). In both countries there are significant potentials for improving the efficiency of electricity production.
17
Figure 6 Efficiency of Electricity Production from all Fossil Fuels in Public Electricity and CHP Plants
36%
33%
39%
37%
44%
44%
35%
38%
39%
37%
31%
32%
43%
36%
43%
34%
44%
38%
55%
39%
43%
45%
42%
28%
30%
35%
37%
39%
40%
42%
43%
32%
32%
38%
36%
45%
43%
33%
0% 10% 20% 30% 40% 50% 60%
Australia
Austria
Belgium
Brazil
Canada
China
Czech Republic
Denmark
Finland
France
Germany
Greece
Hungary
Iceland
India
Ireland
Italy
Japan
Korea
Luxembourg
Mexico
Netherlands
Norway
New Zealand
Poland
Portugal
Russia
Slovak Republic
South Africa
Spain
Sweden
Switzerland
Turkey
United Kingdom
United States
OECD
Non-OECD
World
Average 2001-2005 1990
Source: IEA analysis. Note: According to IEA statistics Luxembourg does not have any public electricity generation from fossil fuelled-fired plants in 1990.
18
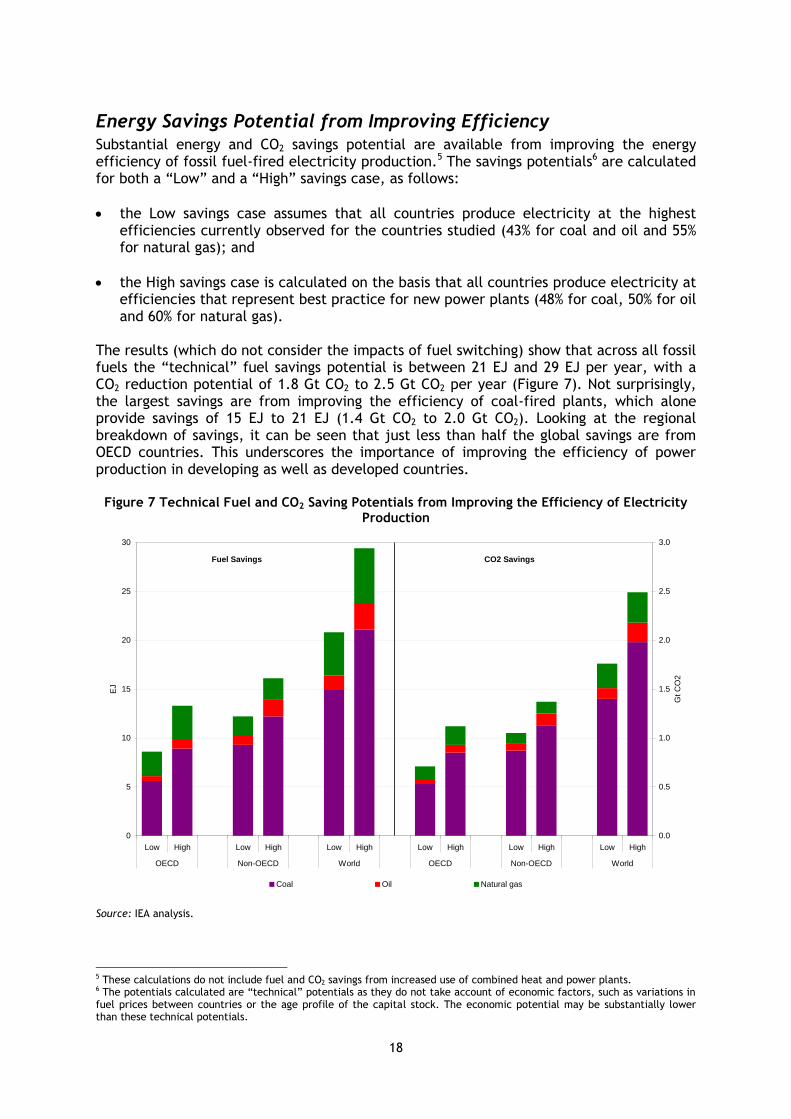
Energy Savings Potential from Improving Efficiency Substantial energy and CO2 savings potential are available from improving the energy efficiency of fossil fuel-fired electricity production.5 The savings potentials6 are calculated for both a “Low” and a “High” savings case, as follows:
the Low savings case assumes that all countries produce electricity at the highest efficiencies currently observed for the countries studied (43% for coal and oil and 55% for natural gas); and
the High savings case is calculated on the basis that all countries produce electricity at efficiencies that represent best practice for new power plants (48% for coal, 50% for oil and 60% for natural gas).
The results (which do not consider the impacts of fuel switching) show that across all fossil fuels the “technical” fuel savings potential is between 21 EJ and 29 EJ per year, with a CO2 reduction potential of 1.8 Gt CO2 to 2.5 Gt CO2 per year (Figure 7). Not surprisingly, the largest savings are from improving the efficiency of coal-fired plants, which alone provide savings of 15 EJ to 21 EJ (1.4 Gt CO2 to 2.0 Gt CO2). Looking at the regional breakdown of savings, it can be seen that just less than half the global savings are from OECD countries. This underscores the importance of improving the efficiency of power production in developing as well as developed countries.
Figure 7 Technical Fuel and CO2 Saving Potentials from Improving the Efficiency of Electricity Production
0
5
10
15
20
25
30
Low High Low High Low High Low High Low High Low High
OECD Non-OECD World OECD Non-OECD World
EJ
0.0
0.5
1.0
1.5
2.0
2.5
3.0
Gt
CO
2
Coal Oil Natural gas
Fuel Savings CO2 Savings
Source: IEA analysis.
5 These calculations do not include fuel and CO2 savings from increased use of combined heat and power plants. 6 The potentials calculated are “technical” potentials as they do not take account of economic factors, such as variations in fuel prices between countries or the age profile of the capital stock. The economic potential may be substantially lower than these technical potentials.
19
References Graus, WHJ et al (2007), Energy Policy, Volume 35, Issue 7, Pages 3936-3951. IEA (2007a), Fossil Fuel-Fired Power Generation. Case Studies of Recently Constructed Coal- and Gas-fired Power Plants, IEA/OECD, Paris. http://www.iea.org/w/bookshop/add.aspx?id=313 IEA (2007b), Tracking Industrial Energy Efficiency and CO2 Emissions, IEA/OECD, Paris. http://www.iea.org/w/bookshop/add.aspx?id=298 IEA (2007c), Electricity Information 2007, IEA/OECD, Paris. http://www.iea.org/w/bookshop/add.aspx?id=34 IEA (2007d), Energy Balances of Non-OECD Countries 2004-2005, IEA/OECD, Paris. http://www.iea.org/w/bookshop/add.aspx?id=31 Phylipsen, G.J.M., Blok, K., Worrell, E. (1998), Benchmarking the Energy Efficiency of the Dutch Energy-Intensive Industry. A Preliminary Assessment of the Effect on Energy Consumption and CO2 Emissions.
Annex A: Electricity Production Efficiencies by Fuel
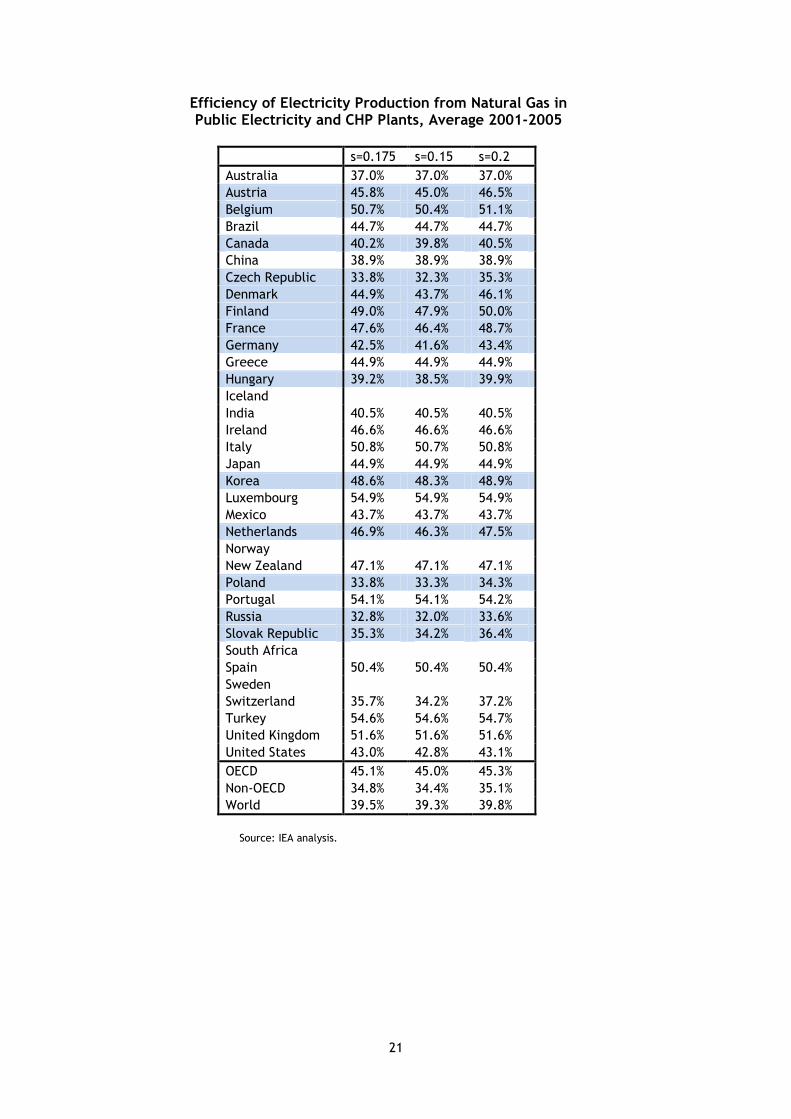
The following tables show the calculated efficiencies by fuel for each country, including the impact of different choices for the parameter s (the correction factor between heat and electricity, defined as the reduction in electricity production per unit of heat extracted). The default value for s is 0.175, with the efficiencies also calculated for values of s of 0.15 and 0.2 as a sensitivity analysis. The countries highlighted in each table are those for which the impact of varying the value of s changes the calculated efficiency by more than 0.5 percentage point.
Efficiency of Electricity Production from Coal in Public Electricity and CHP Plants, Average 2001-2005
s=0.175 s=0.15 s=0.2
Australia 32.9% 32.9% 32.9%
Austria 41.0% 40.8% 41.1%
Belgium 38.2% 38.2% 38.2%
Brazil 28.9% 28.9% 28.9%
Canada 37.8% 37.8% 37.8%
China 32.4% 32.4% 32.4%
Czech Republic 32.0% 31.6% 32.3%
Denmark 43.0% 42.4% 43.5%
Finland 39.0% 38.2% 39.7%
France 39.1% 39.1% 39.1%
Germany 38.1% 37.9% 38.2%
Greece 35.6% 35.6% 35.6%
Hungary 30.8% 30.6% 31.1%
Iceland
India 27.3% 27.3% 27.3%
Ireland 38.8% 38.8% 38.8%
Italy 38.3% 38.3% 38.4%
Japan 41.5% 41.5% 41.5%
Korea 36.5% 36.5% 36.5%
Luxembourg
Mexico 35.6% 35.6% 35.6%
Netherlands 39.2% 39.1% 39.3%
Norway 34.4% 32.6% 36.1%
New Zealand 34.3% 34.3% 34.3%
Poland 36.2% 35.9% 36.5%
Portugal 39.5% 39.5% 39.5%
Russia 31.5% 30.6% 32.4%
Slovak Republic 29.5% 29.1% 29.9%
South Africa 37.2% 37.2% 37.2%
Spain 37.8% 37.8% 37.8%
Sweden 40.4% 39.2% 41.6%
Switzerland
Turkey 35.0% 35.0% 35.0%
United Kingdom 37.8% 37.8% 37.8%
United States 36.1% 36.1% 36.1%
OECD 36.6% 36.5% 36.6%
Non-OECD 31.9% 31.8% 31.9%
World 34.3% 34.3% 34.4%
Source: IEA analysis.
21
Efficiency of Electricity Production from Natural Gas in Public Electricity and CHP Plants, Average 2001-2005
s=0.175 s=0.15 s=0.2
Australia 37.0% 37.0% 37.0%
Austria 45.8% 45.0% 46.5%
Belgium 50.7% 50.4% 51.1%
Brazil 44.7% 44.7% 44.7%
Canada 40.2% 39.8% 40.5%
China 38.9% 38.9% 38.9%
Czech Republic 33.8% 32.3% 35.3%
Denmark 44.9% 43.7% 46.1%
Finland 49.0% 47.9% 50.0%
France 47.6% 46.4% 48.7%
Germany 42.5% 41.6% 43.4%
Greece 44.9% 44.9% 44.9%
Hungary 39.2% 38.5% 39.9%
Iceland
India 40.5% 40.5% 40.5%
Ireland 46.6% 46.6% 46.6%
Italy 50.8% 50.7% 50.8%
Japan 44.9% 44.9% 44.9%
Korea 48.6% 48.3% 48.9%
Luxembourg 54.9% 54.9% 54.9%
Mexico 43.7% 43.7% 43.7%
Netherlands 46.9% 46.3% 47.5%
Norway
New Zealand 47.1% 47.1% 47.1%
Poland 33.8% 33.3% 34.3%
Portugal 54.1% 54.1% 54.2%
Russia 32.8% 32.0% 33.6%
Slovak Republic 35.3% 34.2% 36.4%
South Africa
Spain 50.4% 50.4% 50.4%
Sweden
Switzerland 35.7% 34.2% 37.2%
Turkey 54.6% 54.6% 54.7%
United Kingdom 51.6% 51.6% 51.6%
United States 43.0% 42.8% 43.1%
OECD 45.1% 45.0% 45.3%
Non-OECD 34.8% 34.4% 35.1%
World 39.5% 39.3% 39.8%
Source: IEA analysis.
22
Efficiency of Electricity Production from Oil in Public Electricity and CHP Plants, Average 2001-2005
s=0.175 s=0.15 s=0.2
Australia 32.5% 32.5% 32.5%
Austria 35.6% 34.6% 36.7%
Belgium 40.7% 40.7% 40.7%
Brazil 34.1% 34.1% 34.1%
Canada 38.9% 38.8% 38.9%
China 33.6% 33.6% 33.6%
Czech Republic 23.8% 22.1% 25.4%
Denmark 40.4% 39.8% 41.0%
Finland 35.1% 34.0% 36.2%
France 30.6% 30.0% 31.2%
Germany 33.8% 33.2% 34.4%
Greece 35.9% 35.9% 35.9%
Hungary 33.4% 33.1% 33.7%
Iceland 30.0% 30.0% 30.0%
India 25.7% 25.7% 25.7%
Ireland 35.6% 35.6% 35.6%
Italy 40.7% 40.6% 40.7%
Japan 41.9% 41.9% 41.9%
Korea 36.8% 36.7% 36.9%
Luxembourg
Mexico 34.4% 34.4% 34.4%
Netherlands 43.0% 42.0% 44.0%
Norway
New Zealand 29.9% 29.9% 29.9%
Poland 36.5% 36.2% 36.8%
Portugal 38.1% 38.1% 38.2%
Russia 33.2% 32.4% 34.0%
Slovak Republic 22.8% 22.5% 23.2%
South Africa
Spain 34.6% 34.6% 34.6%
Sweden 37.0%
Switzerland 30.2% 28.7% 31.7%
Turkey 35.3% 35.3% 35.3%
United Kingdom 29.2% 29.2% 29.2%
United States 35.3% 35.3% 35.4%
OECD 37.2% 37.1% 37.2%
Non-OECD 36.1% 36.0% 36.1%
World 36.5% 36.5% 36.6%
Source: IEA analysis.
23
Efficiency of Electricity Production from all Fossil Fuels in Public Electricity and CHP Plants, Average 2001-2005