28
Energy efficiency trends and market transformations for household electrical appliances and lighting in the EU Bruno Lapillonne, Carine Sebi, Enerdata

Energy efficiency trends and market transformations for household electrical appliances and lighting in the EU
Bruno Lapillonne, Carine Sebi, Enerdata

Ou
tlin
e
1. Overall electricity consumption trends 2. Electrical appliances and lighting 3. Large appliances 4. Lighting 5. Air conditioning

3
Trends in the electricity consumption
Rapid increase in the electricity consumption between 2000 and 2008 in half of countries, with 6 countries > 4%/year and 10 countries around 2-4%/yr (1.7% for EU). Decrease in Slovakia or very low progression in Norway, Denmark, Sweden and Bulgaria, partly due to substitution of electricity for thermal uses Very rapid progression in south Europe due to AC and in Baltic countries.
Strong impact of the 2009 crisis, except in France, Portugal & Croatia : net slow down in Estonia Italy, Poland & Cyprus; severe drop in UK, Spain, Ireland, Netherlands
-7%
-5%
-3%
-1%
1%
3%
5%
7%
Slo
vaki
a
No
rway
Den
mar
k
Swed
en
Bu
lgar
ia
Cze
ch R
ep.
Ger
man
y
Be
lgiu
m
Luxe
mb
ou
rg
Ital
y
UK
Net
her
lan
ds
Au
stri
a
EU
Hu
nga
ry
Cro
atia
Fran
ce
Slo
ven
ia
Mal
ta
Gre
ece
Po
lan
d
Fin
lan
d
Irel
and
Po
rtu
gal
Ro
man
ia
Lith
uan
ia
Spai
n
Cyp
rus
Latv
ia
Esto
nia
%/y
ear
2000-2008 2008-2009 2009-2010
>4% >2%
2009 -2010: Enerdata estimates

4
Electricity consumption per dwelling: thermal uses vs electrical appliances
Thermal uses of electricity important in Sweden, France, Ireland, Finland
Consumption for electrical appliances and lighting (excl. thermal use) in a range of 1300 kWh/yr for Bulgaria, Romania to 3600 kWh for Cyprus, Malta and Sweden and > 4000 kWh in Finland
Still low contribution of AC (Air Conditioning) in southern countries
2500 kWh for the EU average
0
1 000
2 000
3 000
4 000
5 000
6 000
7 000
8 000
9 000
10 000
Bu
lgar
ia
Ro
man
ia
Latv
ia
Cze
ch R
ep.
Ger
man
y
Ital
y
Spai
n
Slo
vaki
a
Cro
atia EU
Po
rtu
gal
Au
stri
a
Slo
ven
ia
Be
lgiu
m
Gre
ece
Fran
ce
Net
her
lan
ds
Irel
and
Den
mar
k
UK
Cyp
rus
Mal
ta
Swed
en
Fin
lan
d
kWh
/yea
r
electrical appliances & lighting space heatingwater heating cookingAC

5
Electricity consumption per dwelling: share of thermal uses
Thermal uses of electricity important above 50% in Sweden, France and Czech Republic and above 40% in Ireland, Bulgaria, Germany and Finland
Still low share of AC (Air Conditioning) in southern countries (10-15%) of total electricity consumption
0%
10%
20%
30%
40%
50%
60%
70%
80%
90%
100%
Ro
man
ia
Slo
vaki
a
Ital
y
Net
her
lan
ds
Den
mar
k
Mal
ta
Latv
ia
Cyp
rus
Po
rtu
gal
Slo
ven
ia UK
Au
stri
a
Cro
atia
Be
lgiu
m
Gre
ece
EU
Spai
n
Fin
lan
d
Ger
man
y
Bu
lgar
ia
Irel
and
Cze
ch R
ep.
Fran
ce
Swed
en
thermal uses electrical appliances & lighting AC

Ou
tlin
e
1. Overall electricity consumption trends 2. Electrical appliances and lighting 3. Large appliances 4. Lighting 5. Air conditioning

7
Trends in electricity cons. per dwelling for electrical appliances & lighting
Very unequal progression across countries since 1998: decreasing trends in Bulgaria and Slovakia, low growth for Czech Rep., Sweden and Germany.
Rapid growth in southern countries (Cyprus, Greece, Croatia)
EU average 1,2%/yr
-4%
-3%
-2%
-1%
0%
1%
2%
3%
4%
5%
Bu
lgar
ia
Slo
vaki
a
Cze
ch R
ep
Ger
man
y
Swed
en
Bel
giu
m
Den
mar
k
Ital
y
Slo
ven
ia
Net
her
lan
ds
Spai
n
EU UK
Mal
ta
Po
rtu
gal
Fran
ce
Ro
man
ia
Fin
lan
d
Au
stri
a
Esto
nia
Cro
atia
Cyp
rus
Irel
and
Gre
ece
1998-2008
2000-2007 for Estonia; 2000-2008 for Malta, 1998-2007 Finland; Greece: AC included

8
Electricity consumption per dwelling for electrical appliances & lighting
Big difference of electricity consumption per dwelling for electrical appliances and lighting : range between 1000-6000 kWh
Highest unit consumption in Finland and Sweden (above 3 500 kWh)
2007 for Estonia, Portugal, Finland and Lithuania; 2001 for Latvia and 2000 for Malta; Greece: AC included
0
500
1 000
1 500
2 000
2 500
3 000
3 500
4 000
4 500
5 000
Esto
nia
Ro
man
ia
Lith
uan
ia
Bu
lgar
ia
Latv
ia
Cze
ch R
ep.
Ger
man
y
Ital
y
Spai
n
Slo
vaki
a
Cro
atia EU
Po
rtu
gal
Au
stri
a
Slo
ven
ia
Be
lgiu
m
Fran
ce
Net
her
lan
ds
Irel
and
Gre
ece
Den
mar
k
UK
Cyp
rus
Mal
ta
Swed
en
Fin
lan
d
kWh
/yr
1998 2008

9
Breakdown of consumption between large and small appliances and lighting (EU)
Moderate increase of the consumption of large appliances and decreasing share in the consumption for electrical appliances & lighting (from 63 % in 1990 to 46 % in 2008).
Rapid progression for small appliances : more than tripling of the consumption and share increasing from 17% to 37%
Slightly decreasing share for lighting below 20%
0
50
100
150
200
250
Largeappliances
Smallappliances
Lighting
TWh
1990 2008
0%
10%
20%
30%
40%
50%
60%
70%
Largeappliances
Smallappliances
Lighting
1990 2008
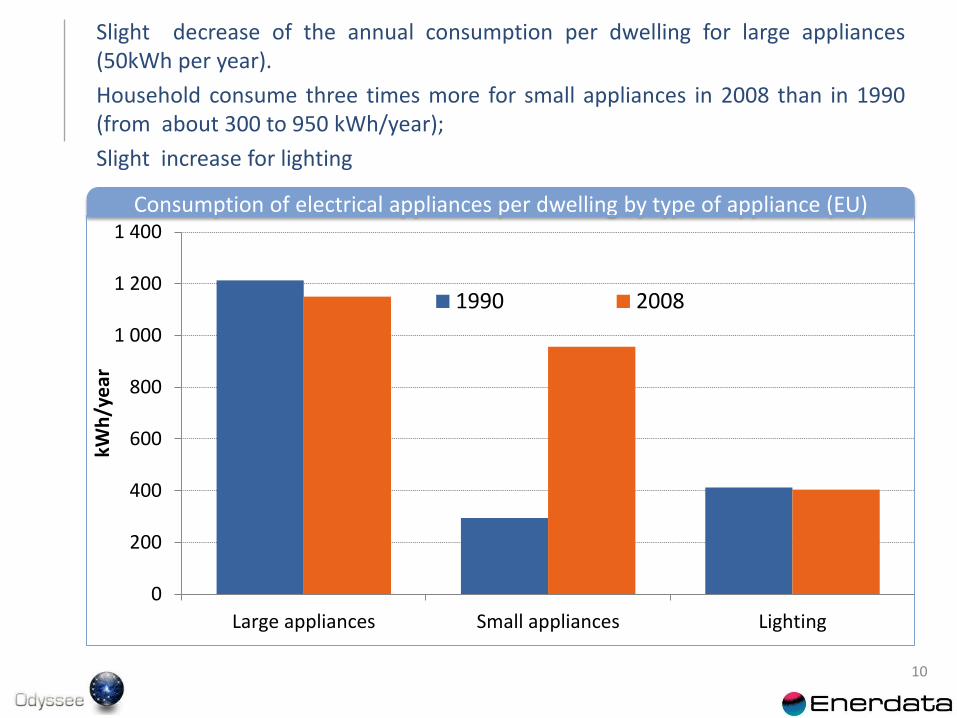
10
Consumption of electrical appliances per dwelling by type of appliance (EU)
Slight decrease of the annual consumption per dwelling for large appliances (50kWh per year).
Household consume three times more for small appliances in 2008 than in 1990 (from about 300 to 950 kWh/year);
Slight increase for lighting
0
200
400
600
800
1 000
1 200
1 400
Large appliances Small appliances Lighting
kWh
/ye
ar
1990 2008

Ou
tlin
e
1. Overall electricity consumption trends 2. Electrical appliances and lighting 3. Large appliances 4. Lighting 5. Air conditioning

12
Consumption of large electrical appliances by type (EU27)
Decreasing consumption and share for refrigerators and washing machine
Strong progression of consumption for dishwashers (+90%), dryers and TV (~+ 50%)
0
10
20
30
40
50
60
70
80
Ref
rige
rato
r
Free
zer
Was
hin
gm
ach
ine
Dis
h w
ash
er TV
Dry
ers
TWh
1990 2008
0%
5%
10%
15%
20%
25%
30%
35%
40%
Ref
rige
rato
r
Free
zer
Was
hin
g m
ach
ine
Dis
h w
ash
er TV
Dry
ers
1990 2008

Large appliance are on average 25% more efficient than in 1990, with some countries registering very strong progress (Germany, Sweden, and Netherlands): ~2%/yr Slight reduction in the progress achieved since 2000 (1,6%/yr over 1990-2008 and 1,3%/yr since 2000 at EU level
Energy efficiency trends for large appliances (ODEX)
0102030405060708090
100
Gre
ece
Fran
ce
Au
stri
a
Ital
y
UK
EU
Ger
man
y
Net
her
lan
ds
Swed
en
2008 (1990=100) 2008 (2000=100)

14
Variation of the consumption per dwelling for large appliances (EU)
Almost all energy efficiency gains have been offset by an increase in equipment ownership: as a result the consumption per dwelling for large appliance is only slightly decreasing
Energy savings reached 83 TWh in 2008 (30% of the consumption of large appliances) compared to 1990, limiting the consumption increase to 28 TWh
-2.0%
-1.5%
-1.0%
-0.5%
0.0%
0.5%
1.0%
1.5%
2.0%
1990-2008 2000-2008
%/y
r
Observed variationIncreased equipment ownershipenergy efficiency progress
-120
-80
-40
0
40
80
Tota
l var
iati
on
Dem
ogr
aph
ic e
ffec
t
Equ
ipm
ent
effe
ct
Ener
gy e
ffic
ien
cy
TWh
Variation of the consumption of large appliances (EU) (1990-2008)

Almost 90% of refrigerators, washing machines and dishwashers with label equal or
above A class
0
10
20
30
40
50
60
70
80
90
100
1995 1998 2000 2002 2004 2006 2008 2009
refrigerators washing machines dish washers
Source GFK, EEDAL
Market share of label A, A+ and A++ for cold and washing appliances (EU)

About 30% of new refrigerators with labels A+ or A++ in the EU in 2009 up from less
than 10% in 2005
Around 40% in The Netherlands and 45% in Germany
0
10
20
30
40
50
60
70
80
90
100
2000 2001 2002 2003 2004 2005 2006 2007 2008 2009
A A+ A++
Source GFK, EEDAL
Market share of label A, A+ and A++ for refrigerators (EU-15)

Ou
tlin
e
1. Overall electricity consumption trends 2. Electrical appliances and lighting 3. Large appliances 4. Lighting 5. Air conditioning

18
Electricity consumption per dwelling for lighting
Unequal electrical consumption per dwelling: range from 200 to 900 kWh/yr
400 kWh on average for the EU
Decrease in several countries with the diffusion of CFL (in half of the sample)
2007 for Portugal and UK; 2006 for Romania
0
100
200
300
400
500
600
700
800
900
Bu
lgar
ia
Ro
man
ia
Slo
vaki
a
Ger
man
y
Slo
ven
ia
Cro
atia
Fran
ce
Au
stri
a
EU
Spai
n
Po
rtu
gal
Net
her
lan
ds
UK
Swed
en
kWh
/yr
2000 2008

19
Bulgaria Romania
Germany
France Austria EU
Portugal Netherlands
UK
Sweden
0
100
200
300
400
500
600
700
800
900
1000
0 5 10 15 20 25 30 35 40 45
kWh
Number of lighting points/dwelling
The level of consumption depends on the efficiency of lamps, i.e. the penetration of CFL, but also on the number of lighting points ... and this number is increasing
Electricity consumption per dwelling for lighting
Number of lighting points: compiled by Enerdata from various sources, of which Remodece, JRC-Ispra

About 7 CFL per household in the countries with the largest diffusion of CFL
20
0
1
2
3
4
5
6
7
8
Po
lan
d
Fin
lan
d
Ro
man
ia
Bu
lgar
ia
Spai
n
UK
Cyp
rus
Gre
ece
Fran
ce
Hu
nga
ry
Po
rtu
gal
EU
Net
her
lan
ds
Swed
en
Cze
ch R
ep.
Den
mar
k
Ital
y
Ger
man
y
1995 2002 2007 2008
Compiled by Enerdata from various sources, of which Odyssee, Remodece, JRC-Ispra
Diffusion of CFL lamps : number of lamps per household

High penetration of CFL lamps in Portugal, Czech Republic and Hungary : the % of
CFL in total number of lamps depend on the number of CFL per household and
the total number of lighting points (above 30 in Sweden and Denmark, below 20
in new member countries
21
0%
5%
10%
15%
20%
25%
30%
35%
40%
45%
50%
Po
lan
d
Slo
vaki
a
Spai
n
Bu
lgar
ia UK
rom
ania
Swed
en
Ger
man
y
EU
Fran
ce
Au
stri
a
Gre
ece
Net
her
lan
ds
Ital
y
Den
mar
k
Hu
nga
ry
Cze
ch R
ep
Po
rtu
gal
1995 2007 2009
Compiled by Enerdata from various sources, of which Odyssee, Remodece, JRC-Ispra
Diffusion of CFL lamps : % of CFL in total number of lamps

Ou
tlin
e
1. Overall electricity consumption trends 2. Electrical appliances and lighting 3. Large appliances 4. Lighting 5. Air conditioning

Cyprus, Malta, Croatia and Bulgaria are the largest consumers for air conditioning
23
Unit consumption per dwelling for air conditioning
0
100
200
300
400
500
600
700Sl
ove
nia
Po
rtu
gal
Spai
n
Ital
y
Gre
ece
Bu
lgar
ia
Cro
atia
Cyp
rus
Mal
ta
kWh
/dw
1990 2000 2008

24
Trends in unit consumption of air cooling per dwelling
Moderate growth for bigger air cooling consumers: Malta and Croatia and Cyprus
Big accelerations in the trends for the new air cooling consumer: Bulgaria, Slovenia and Spain
0%
5%
10%
15%
20%
25%
30%
35%
40%
45%
50%M
alta
Cyp
rus
Cro
atia
Po
rtu
gal
Ital
y
Spai
n
Slo
ven
ia
Bu
lgar
ia
%/y
ear
1990-2008 2000-2008

New air conditioners are 30% more efficient in 2009 than in 2002 in the EU
25
0
0.5
1
1.5
2
2.5
3
3.5
2002 2003 2004 2005 2006 2007 2008 2009
Efficiency of new air conditioners in the EU (EER)
EER: kW per kW Source: IEA, Mapping and Benchmarking, 2010; data from GFK; sales weighted; include split and multi-split (split about 95% of the market) ; products < 14kW
Labelling since 2002 % of units with variable speed drive increased from 4 % to 50% •Almost 90 % of reverse cycles models (up from about 50% in 2002) •Over half of sales in Italy (33%) and Spain (21%) (Greece 13% and France 7%)
Label A
Label B

26
Very rapid progression of the total electricity consumption of households in south Europe and Baltic countries until 2009; low growth in the largest consuming countries
Strong impact of the 2009 crisis in most countries
Rapid progression of the electricity consumption of small appliances for which there is almost no policy
Large appliances are 25% more efficient than in 1990 but almost all the energy efficiency progress has been offset by an increase in equipment ownership
The share of efficient lamps and large appliances, including AC is increasing
Conclusions

27
Trends in electricity consumption per dwelling
Very different trends of electricity consumption per household Decrease in Slovakia, Bulgaria, Luxembourg, Norway, Denmark and Sweden, partly due to substitution of other fuels to electricity for thermal uses Very rapid progression in south Europe due to AC and in Baltic countries.
-4%
-2%
0%
2%
4%
6%
8%
Slo
vaki
a
No
rway
Bu
lgar
ia
Den
mar
k
Luxe
mb
ou
rg
Swed
en
Ital
y
Cze
ch R
ep.
Be
lgiu
m
Ger
man
y
Au
stri
a
Euro
pea
n U
nio
n
Slo
ven
ia
Irel
and
Net
her
lan
ds
UK
Hu
nga
ry
Fran
ce
Mal
ta
Cro
atia
Po
rtu
gal
Spai
n
Po
lan
d
Esto
nia
Cyp
rus
Gre
ece
Fin
lan
d
Ro
man
ia
Lith
uan
ia
Latv
ia
1990-2000 2000-2008
2007 for Estonia and Lithuania; 2006 for Portugal

28
Electricity consumption per dwelling
Very unequal level of electricity consumption per household: very high level in Finland (~8000 kWh), Sweden (~9000 kWh) and Norway (>10 000 kWh); heterogeneity due to different use of electricity for thermal uses and different level of household electrical appliance ownership (especially for most new EU members)
0
1 000
2 000
3 000
4 000
5 000
6 000
Ro
man
ia
Lith
uan
ia
Po
lan
d
Latv
ia
Slo
vaki
s
Ital
y
Hu
nga
ry
Esto
nia
Bu
lgar
ia
Po
rtu
gal
Net
her
lan
ds
Cze
ch R
ep.
Ger
man
y
Spai
n
Den
mar
k
Luxe
mb
ou
rg EU
Slo
ven
ia
Be
lgiu
m
Cro
atia
Au
stri
a
Mal
ta
Gre
ece
UK
Irel
and
Fran
ce
Cyp
rus
Fin
lan
d
Swed
en
No
rway
kWh
/yea
r
1998 2008
2007 for Estonia and Lithuania; 2006 for Portugal


