Report No. 94-03 A Report of the Office of Energy, Environment, and Technology Bureau for Global Programs, Field Support, and Research United States Agency for International Development ENERGY FROM SUGARCANE COGENERATION IN EL SALVADOR Prepared byWinrock International Institute for Agricultural Development 1611 North Kent Street, Suite 600 Arlington, VA 22209-2134 Biomass Energy Systems and Technology Project HR-5737-A-00-9058-00 November, 1994
Transcript
Report No. 94-03
A Report of the Office of Energy, Environment, and TechnologyBureau for Global Programs, Field Support, and Research
United States Agency for International Development
ENERGY FROM SUGARCANE COGENERATION
IN EL SALVADOR
Prepared byWinrock International Institute for Agricultural Development1611 North Kent Street, Suite 600
Arlington, VA 22209-2134
Biomass Energy Systems and Technology ProjectDHR-5737-A-00-9058-00 November, 1994
2
This publication was made possible through support provided by the Office ofEnergy, Environment, and Technology; Bureau for Global Programs, Field Support, andResearch; United States Agency for International Development. The opinions expressedherein are those of the author(s) and do not necessarily reflect the views of the U.S.Agency for International Development.
3
ACKNOWLEDGEMENTS
This report results from the efforts of a team organized by Winrock InternationalInstitute for Agricultural Development and funded by the Office of Energy, Environment,and Technology of the U.S. Agency for International Development (USAID). The projectmanager was Mr. Bradford Hollomon of Winrock's Renewable Energy and the EnvironmentProgram, and the team included Mr. Felix Ah-Kee, who analyzed sugar mill operations anddesigned conceptual cogeneration systems, and Mr. H. Mike Jones, who handled utilityeconomics and planning aspects of the study. Ms. Fay Ellis assisted with administrativearrangements and with preparation of the report.
The team is indebted to the management and staff of the Comisión EjecutivaHidroeléctrica del Río Lempa (CEL) for their assistance and insight. The project would nothave been possible without the encouragement of Ing. Carlos Hayem, the utility's ExecutiveDirector, and our analysis of the national electric power system and avoided costs owesmuch to the Department of Conservation and Energy Development under the leadership ofIng. Reynaldo Iván Cruz Villalta and to the Natural Resources and Environment Unit underIng. José Antonio Lazo Paz. Ing. Francisco Rivera and his planning staff at the Compañiade Alumbrado Eléctrico de San Salvador performed the load flow simulation that issummarized at the end of Chapter 3.
Of particular importance was the contribution of Ing. Ana María GonzalezTrabanino, CEL's chief of Cogeneration Studies. Her initiative was instrumental in settingthe study in motion, and her knowledge of sugar industry cogeneration technology and hertireless support in organizing meetings with key people greatly facilitated our work in ElSalvador.
The project also could not have gone forward without the active support of theSalvadoran sugar industry. Although space does not allow us to acknowledge all of thespecific individuals, assistance and insight from the Asociación Azucarera de El Salvador,the Instituto Nacional de Azucar, and the Corporación Salvadoreña de Inversiones werecritical, as was the cooperation we received from the managers and superintendents at eachof the country's ten sugar mills. Thanks are also due to Ing. Peter Walte, the grand old manof Salvadoran sugar production, for his help and constructive critique.
Other indispensable contributors include Mr. Myk Manon and his staff in theNational Rural Electric Cooperative Association office in San Salvador and the CentroSalvadoreño de Eficiencia de Energía. Finally, we acknowledge the essential support of Ing.Raúl Gonzalez, the USAID Energy Officer in San Salvador.
3.0 EL SALVADOR'S ELECTRIC POWER SYSTEM AND AVOIDED COST . . . . . 513.1 OVERVIEW OF ELECTRIC SECTOR513.2 INSTITUTIONAL AND LEGAL BASIS FOR COGENERATION AND
PRIVATE POWER533.2.1 Institutional Structure for Private Power and
Power Sector Regulation533.3 ELECTRIC POWER SUPPLY AND DEMAND IN
EL SALVADOR553.3.1 Current CEL and Distribution Company
Growth Projections553.3.2 El Salvador's Generation System and Its
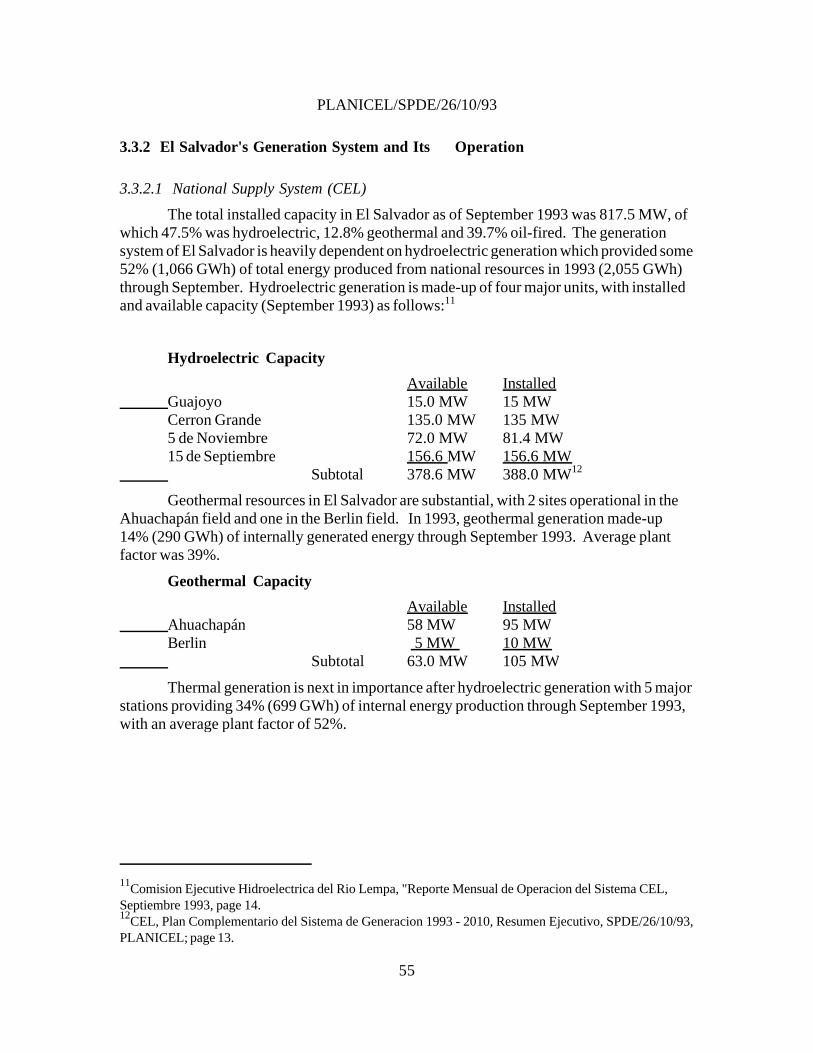
In 1992-1993, El Salvador produced 346,503 tons of sugar from sugarcane in tenfactories, ranging in capacity from 50 to 240 tons of cane per hour. Four of the factories areprivately owned, and the rest are owned and operated within the public sector. Privatizationof the public mills is under active consideration by the government.
Using bagasse as a fuel in high-pressure boilers, the Salvadoran sugar industryshould be in a position to export economically 55 megawatts of power for the nation duringthe four month cane crushing season from December to March, and over 75 megawattsduring the remainder of the year if the generators continue to operate with supplemental fuel. These amounts represent, respectively, 6.7 percent and 9.2 percent of the country's installedgenerating capacity. In addition, the mills located to the north of San Salvador may beadvantageously situated to help limit power transmission and distribution costs associatedwith serving nearby communities.
The objective of the study is twofold: to establish from a technical perspective howmuch power each of the mills could export and at what cost, and to estimate what the powerwould be worth to the national electric system in the context of CEL's expansion plans, giventhe specific timing and location of possible power production at the mills. To accomplishthis, "avoided cost" criteria, based on CEL planning data, have been applied in an economicanalysis of mill cogeneration options to yield projections of the power production potentialand to screen candidate installations for further development. Specific findings appearbelow:
1. If the mills were to generate power throughout the year, using Bunker C as asupplemental fuel, the industry could profitably export 565,000 megawatt hours peryear at a price at or below US$0.058 per kWh, as shown in Chapter 4 (Figure 4.1). This represents 23% of the nation's power production in 1992. Achieving this levelwould entail installation of high-pressure (900 lb. per square inch) boilers andextraction turbines.
2. The industry also could produce power for sale economically using a lower steampressure (600 lb. per square inch), but in lower volumes and at higher cost. Underthese conditions the potential would be 473,000 megawatt hours, or 19% of 1992national production, at or below a cost of US$0.062 per kWh. The advantage of theless efficient technology would be lessened need to train mill workers andsupervisors in the operation of water treatment systems and automated controlsrequired for higher pressures.
3. The cost of cogenerating power could be reduced in a number of circumstances. Central Izalco, for example, is installing a new boiler in conjunction with a plannedexpansion, and specifying a higher pressure rating to permit cogeneration will addonly marginally to the cost. Purchasing used equipment may also reduce initialcapital requirements, but possibly at an added cost in terms of maintenance,
7
efficiency and useful life. Finally, old equipment that is replaced while it is stilluseful may still have a signficant salvage value. Purchasing available equipmentthat is not matched to the remainder of the system also will result in sub-optimalperformance.
4. The power output levels estimated in this report assume that the mills' internal steamrequirements remain the same as they are currently. With a market for surpluselectricity, mill owners have an incentive to conserve steam and thereby to increasepower sales beyond the levels presented here. The volume of power exported couldtheoretically be increased in this way by a factor of two or three.
5. The value of cogenerated power to the national grid, based on CEL's estimated five-year average avoided generation costs, is now between approximately US$0.0685and US$0.0745 per kWh. The value is dependent on time of year because ofseasonal fluctuations in rainfall influencing CEL's ability to produce hydropower,and it varies by time of day as well because of cycles in demand.
6. In the case of the La Cabaña and San Francisco mills, cogenerated power may beworth more than the avoided generation cost, because CAESS, the local distributioncompany, would probably be able to scale back or postpone needed transmission anddistribution system improvements along a nearby power line extending to the northfrom San Salvador. If the utility could obtain 6 MW from these mills, it would beable to restore minimum voltages (now around 90 V) to more acceptable levels andto reduce line losses by approximately 500 kW, without adding substation orconductor capacity beyond 8 kilometers of new line to connect the mills.
7. With the exceptions of Ahuachapán, Chanmico, La Magdalena and El Carmen, all ofthe mills appear to represent promising investment opportunities. The decisions as towhether to invest the needed resources at each site will depend on the strategicinterest of each company in diversifying into the electric power market and on theoutcome of power sales contract negotiations with CEL.
8. One of the principal barriers to cogeneration investments in the eyes of several sugarindustry managers is the absence of clear long-term pricing and contract terms forpower sales to CEL. To justify an investment of of several millions of dollars at asingle installation will require assurance that the project revenues will continue farenough into the future to amortize the expenditure. Since CEL is the onlyprospective purchaser, the utility will need to provide that assurance. On anotherlevel, the sugar mill managers will need a clear indication of their rights andobligations concerning interconnection, metering, personnel safety, protection ofelectrical system integrity, supply reliability, and conflict resolution.
9. In-season cogeneration will not result in any incremental environmental degradation,since no additional fuel will be burned, and environmental quality will benefit fromcorresponding reduced combustion emissions at CEL oil-fired powerplants. Use ofoil as a supplemental fuel for year round operation will
result in local emissions of acid gases, ash, and uncombusted organic materials, butthese will be at least partially offset by corresponding reductions in thermal power
8
production by CEL.
9
1.0 INTRODUCTION
This study arises out of the need for economical new supplies of electric energy tosuppport future growth and development in El Salvador. The national utility, the ComisiónEjecutiva Hidroeléctrica del Río Lempa (CEL), depends on a mixture of hydropower andthermal generation to supply its customers, but increasing demand will requires new sourcesof power in the future to meet the requirements for economic growth and social well-being.
In other parts of the world, notably the islands of Hawaii, Mauritius and Cuba, thesugar industry contributes substantially to local electric supply. In other locations, like ElSalvador, the industry burns waste bagasse to generate electricity and steam for its ownneeds but not for export to the surrounding community. With no incentive in the form of anopportunity to sell power, mill managers generally configure their installations in such a wayas to burn all of the bagasse produced, while providing energy only for self sufficiency.
Against this background, CEL is evaluating alternative new generation options andis studying legislative proposals to legalize purchases of power from the private sector. In aletter to the sugar industry in July, 1993, CEL indicated that it was disposed to acquire 80megawatts of power, or 599,960 megawatt-hours of energy per year, beginning in January,1995. The letter anticipated an additional 40 megawatts of requirements in 1998 andsuggested a range of between US$0.06 and US$0.07 as a basis for price projections, and itinvited the industry to participate in drafting private power enabling legislation andregulatory frameworks to be proposed to the government.
Where the managers have the opportunity to sell power at a price comparable to thecost of conventional generation, investments in plant modifications to produce surplus powercan be attractive. This generally involves replacing existing low pressure boilers, ratedtypically at around 20 atmospheres, with higher pressure ones capable of generating steam inthe vicinity of 60 atmospheres; installing extraction condensing turbines to expand the steamon its way to the existing sugar milling process or condenser; and tightening up the designand operation of the mills to minimize process steam requirements.
Since sugar production is seasonal, the profitability of cogeneration investments canoften be enhanced by instituting year-round power production through the use ofsupplemental fuels. While non-bagasse fuels must be purchased, their cost is likely to bemore than offset by added revenues from power sales, and the required additional capitalexpenditure for larger condensers and fuel storage and handling equipment is minimal. While oil and coal are more typical supplemental fuels, other forms of biomass like sawmillwaste or cane field trash are possible alternatives as well.
From a national perspective, private sugar mill cogeneration could represent a near-term opportunity to acquire electric power at a cost equal to or less than that of alternativesources. Using an indigenous waste resource instead of imported fossil fuel, at least for partof the year, will save foreign exchange and reduce exposure to world oil price fluctuations. Cogeneration could also enhance the productivity of the Salvadoran sugar industry, by bothproviding an additional revenue stream and intensifying the economic incentive forimproved plant efficiency and reliability. Finally, the experience of successful cogenerationin the sugar mills may facilitate similar projects in other energy intensive industries.
Because of interest expressed by CEL's management, the US Agency for
10
International Development has sponsored this assessment of the potential for sugar industrycontribution to the nations electric supplies. The purpose is to estimate how much power thesugar industry could produce at what cost and to suggest the value of the power to thenational grid, given the location and timing of its availability.
The pages that follow report the results of analyses performed after a visit to ElSalvador in December of 1993. At that time the project team visited with CEL staff andconsultants, sugar industry association representatives, and managers or superintendents ateach of the country's ten mills. The body of the report is organized in three chapters. Chapter 2 provides technical and historical background on the present design and operationof each individual mill, and it presents alternative cogeneration system configurations andassociated costs for operation at two different steam pressures. Chapter 3 discusses at lengththe value, in the context of CEL's anticipated costs, of the power that the sugar industrymight make available to the national grid. Finally, Chapter 4 integrates the material in thepreceding chapters in an overall analysis of economic costs and benefits.
Albert Viton, "El Salvador on the March," Sugar y Azucar, September, 1993, pp. 21-26.1
11
2.0 THE SUGAR INDUSTRY IN EL SALVADOR
2.1 BACKGROUND
In 1992-1993, El Salvador produced 346,503 tons of sugar from sugarcaneprocessed in ten factories, which range in capacity from 50 to 240 tons of cane per hour. Last year's production was comparable to that of the year before, which for the first timesince the decade of armed conflict exceeded the earlier record of 318,000 tons set in 1977.1
Four of the factories are privately owned, and the rest are owned and operated byINAZUCAR and CORSAIN, two public entities. Privatization of the public sector mills iscurrently under consideration by the national government. The following table summarizesthe production characteristics of the ten factories, and Figure 2.1 indicates their geographiclocations.
TABLE 2.1: PRODUCTION CHARACTERISTICS OF SUGAR FACTORIES
Annual sugar
Central Izalco Private 78,177
El Angel Private 53,119
Ingenio Jiboa CORSAIN 57,804
La Cabaña INAZUCAR 44,560
San Francisco Private 35,298
Chaparrastique INAZUCAR 25,768
El Carmen INAZUCAR 15,466
La Magdalena INAZUCAR 15,032
Chanmico INAZUCAR 14,610
Ahuachapán Private 6,669
Total 346,503
The sugar factories generate all or most of their steam and electricity requirementsby burning bagasse in furnaces to generate steam at pressures that range from 200 to 300psi. Part of the steam is expanded through turbogenerators in order to produce electricity.
12
The rest of the steam is generally used in turbine drives to provide mechanical powerdirectly, and exhaust steam from the turbines is used for heating purposes in the factories. Insome instances, a portion of the steam for heating comes directly from the boilers via apressure reduction valve.
FIGURE 2.1 LOCATION OF EL SALVADOR SUGAR FACTORIES
(MAP)
A number of factories are finding it necessary to purchase up to 25% of theirelectrical power requirements from CEL even during the harvest season. Others, such asCentral Izalco, Jiboa and San Francisco, either do not require any purchased electricity orhave kept such purchases at low levels, having successfully implemented measures to reducetheir consumption of process steam and mechanical power. Jiboa is also reducing itspercentage of lost time, during which the factory is not producing any bagasse and isconsuming steam and electricity. At the beginning of the 1993-1994 crop, San Franciscobegan exporting 500 kW of power to the local community during the season as part of anexperiment in conjunction with CEL and is contemplating a cogeneration project inconjunction with future plant expansion. Central Izalco has installed a new 600 psi boilerand plans to export 5 MW of power to CEL during the crop season.
An objective of this study is to determine the potential for cogeneration by the tenfactories if the existing boilers were replaced with high pressure units in order to producemore electricity for sale to the public utility company. Features that make mills attractivecandidates for this kind of investment include large scale, long grinding seasons, full use ofmilling capacity with minimum downtime, and low process steam requirements.
2.2 CASE ANALYSIS OF COGENERATIONPOTENTIAL
Sugar factories in El Salvador generally produce steam at between 200 and 300 psig
13
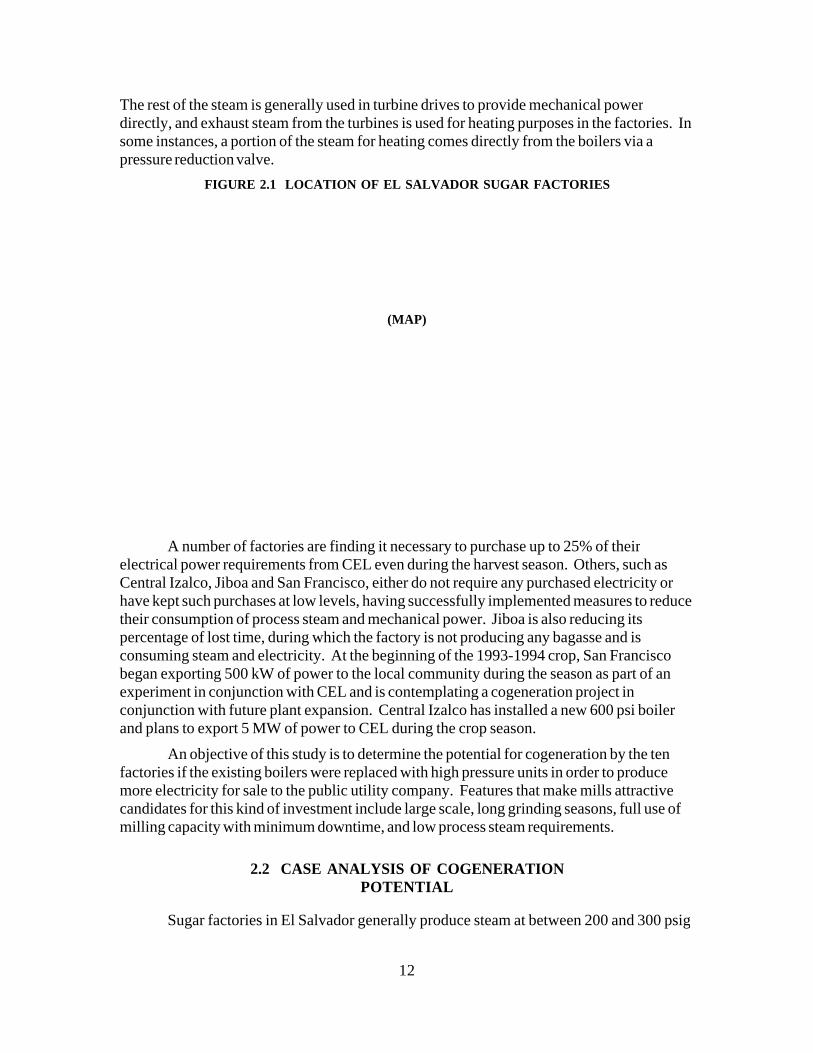
by the combustion of bagasse. Part of the steam is used to run steam turbines, which drivethe mills that crush the incoming cane. The rest of the steam passes through one or moreturbogenerators to produce enough electricity for use by the factory. Exhaust steam from themill turbines and the turbogenerator, at approximately 20 psig pressure, supplies the heatrequirements of the evaporators and vacuum pans. The figure below depicts a typicalexisting installation.
Since the volume of steam required at the higher pressure for the mill turbines is notusually measured in practice, the proportion of the steam to be extracted at the lowerpressure was assumed to equal the volume currently exiting the back pressureturbogenerator in the existing system. In most cases this was derived from the generator'spower output and its specific steam consumption per kWh. Flows estimated in this way areinexact, especially if confounded by significant present use of the expansion valve to by-passthe turbogenerator. Another way to derive these flows would be to postulate a horsepowerrequirement per ton of cane and a specific steam consumption per horsepower-hour for themill drives in order to calculate the higher pressure steam flow. This too would be inexactand would not reflect the factories' individual steam consumption characteristics. Appropriate instrumentation would help to improve the reliability of any future analysis.
FIGURE 2.2: EXISTING CONFIGURATION
In the proposed systems, steam is produced at either 600 or 900 psig and pipedthrough a double extraction turbine generator. The first extraction, occuring at 200 psig,provides steam to turn the mill turbines. The second extraction, occurring at 15 psig,together with exhaust steam from the mill turbines, provides the steam needed to run theevaporators and vacuum pans. This configuration appears in Figure 2.3.
14
FIGURE 2.3: PROPOSED IN-SEASON CONFIGURATION
For more economical operation, the generator continues running during the off-season, and all of the steam condenses after passing through the high-pressure turbine, asillustrated in Figure 2.4. Since the system is sized to consume all of the available bagasseduring the grinding season, bunker oil, supplemented perhaps by other sources of wastebiomass, would be used as a secondary fuel when the remainder of the mill is not inoperation.
FIGURE 2.4: PROPOSED OFF-SEASON CONFIGURATION
For each of the ten sugar factories in El Salvador, we have developed two cases forthe evaluation of its potential for cogeneration.
15
CASE 1 Installation of a boiler producing steam at 900 psia and 850 degrees F,together with a double extraction condensing turbogenerator.
CASE 2 Installation of a boiler producing steam at 600 psia and 750 degrees F,together with a double extraction condensing turbogenerator.
For purposes of evaluating these two cases, the Base Case is considered to describethe existing configuration, with in-season factory operations and no power sales to CEL. Netexportable power and energy are calculated separately for in-season and for off-seasonoperations.
The sizes of the boilers and turbogenerators used in developing the capital costs arebased on designing the boilers to burn all the bagasse that is produced each hour. Smallerboilers would require adding storage capacity for bagasse, whereas larger units wouldrequire the in-season burning of supplementary fuels. Storing bagasse, a labor-intensive andenergy-consuming operation, adds to its cost as a fuel without any increase in energyavailability. Oversizing a sugar factory boiler to burn oil in-season would not be financiallybeneficial to the sugar company as its dual fuel boilers cannot be as efficient as CEL'sboilers, which are specifically designed to burn fuel oil.
In practice, most of the mills in El Salvador need little or no additional fuel now tosupplement bagasse in the boilers, while at the same time, they do not generally have surplusbagasse at the end of the season. This allows one to derive the steam needed for the milldrives and factory heat requirements from the present volume of bagasse produced by themill and burned in the existing boilers. The volume of steam that can be generated with thesame fuel at higher pressure will be somewhat less, but the assumption is that a replacementboiler will be more efficient, and that other simple economy measures will enable the mill toaccommodate the reduction.
Experience in Hawaii, Mauritius and elsewhere indicates that when a market existsfor exported power, steam savings measures, like improved evaporators and electric milldrives, become financially attractive. When these measures are implemented, a portion ofthe steam can pass through the turbogenerator to a condenser, generating considerableadditional power for sale. In this study, however, we have assumed that no steam will beavailable for condensing, since the the arrays of economy measures will require additionalinvestments to finance them and will vary among the individual mills.
Even if the sugar factory does not enjoy a comparative fuel cost advantage whenbagasse is not available, burning oil during the off-season may be desirable for more efficientcapital utilization. Most of the inefficiencies associated with burning oil in a bagasse boilercan be eliminated at the start of the off-season. For example, the grates may be covered withbricks to reduce heat losses, and the boiler controls can be reset for oil. During the off-season gross power generation remains the same as during the season, but net power sales toCEL will be higher because no power is needed for the sugar factory operation.
Appendix A contains design details for all of the individual factories and presentspower production and fuel consumption calculations for both of the alternative casesoutlined above.
Capital costs for boilers and turbogenerators are estimated using actual quotations
16
from major international manufacturers, and adjusted for size at the various factories. ForCase 1, the boilers are high-pressure units, operating at 900 psig and 850 degrees F. ForCase 2, the boilers operate at 600 psig and 750 degrees F. The turbogenerators are doubleextraction units providing steam for the existing factory requirements.
The cost of piping, civil, electrical foundation works, buildings, water cooling,pollution control, instrumentation, etc. are based on actual projects implemented elsewhere. Utility interconnection is included as an electrical cost, assuming transformers, switchgear,meters, etc. necessary to deliver power at up to 15 kV will be charged to the project. Utilityimprovements (or reduced need for them) beyond the mill substation are not included herebut are discussed in Section 3.6 below.
Costs at individual locations will vary based on the availability of existinginfrastructure. For example, some locations with plentiful supplies of cooling water may notrequire any investment in a cooling tower. In other instances, the existing building orfoundations may be used. Furthermore, competition among contractors may further reducecosts, especially for engineering and erection, as may the participation of local labor,depending on its productivity. The total estimated capital costs include 20% formiscellaneous items and for contingency.
The cost estimates used in this study assume that no useful cogenerationinfrastructure already exists. For actual construction, some of a new installation's cost maybe justified by more efficient or expanded sugar production, and old equipment that isreplaced may have a salvage value. This consideration would argue for buildingcogeneration systems gradually in concert with other plant improvements.
The cost of a boiler capable of burning bagasse during the season and oil during theoff season is almost the same as one that burns bagasse only during the season. Theadditional installation for burning oil consists of an oil pump, piping and oil burners at a costthat is relatively small compared to that of the total project.
The price of Bunker C fuel prices is assumed to be $14 per barrel for oil. Operatingand maintenance costs are assumed to be $21.73 per kW per year for fixed costs on a year-round basis, and US$2.50 for variable costs for every MWh that is exported. One economicadvantage of power cogeneration in a sugar factory is that the fixed costs of powergeneration have already been met in the existing sugar operations. However, managementand engineering personnel costs will increase if year-round operations are contemplated. Assuming that fixed costs are already paid for during the season, the additional fixed cost foryear-round operation will be a fraction of 205/365 (where 205 is the number of off-seasondays per year), i.e. 0.5616, times the fixed costs of $21.73 per kW per year. Thus theadditional fixed cost when burning oil during the off-season will be 0.5616 x US$21.73 , i.e.$12.20 per kW per year.
For off-season operations, an availability factor of 90% is assumed. During theseason, each factory is assumed to operate at its current grinding time efficiency.
2.2.1 Central Izalco
Central Izalco, a privately owned sugar factory, is the largest in El Salvador, with a
17
designed capacity of 6,500 metric tons cane per day. During the 1992-1993 crop, thefactory processed an average of 5,274 tons of cane per day and produced a total of 78,177tons of sugar, of which 61,200 tons were either plantation white or refined.
The cane harvest season lasts about 160 days a year. The factory is nearly self-sufficient in electricity; of the 13,131 MWh consumed in the 1991-1992 season, only about5 MWh were purchased from CEL. The consumption of bunker oil is also low (1,200gallons in 1991-1992 and none in 1992-1993).
Table 2.2 shows some of the relevant production statistics.
TABLE 2.2: PRODUCTION STATISTICS -- CENTRAL IZALCO
The milling tandem consists of a shredder and four mills with individual turbinedrives. Three boilers supply steam at 250 psig pressure to the factory and to twoWorthington turbines coupled to Electrical Machinery generators for power generation. Theturbine-generators are rated at 2,500 and 3,500 kW respectively. The boilers, made byBabcock and Wilcox, were installed in 1964. Two have a capacity of 65,000 pounds perhour of steam each, and the third can produce 95,000 pounds per hour of steam. The firsttwo boilers are equipped with economizers, and the third has an air preheater.
Central Izalco presently produces an excess of bagasse in spite of a refinery operationannexed to the raw sugar factory, and a 600 psi boiler is under construction to generate anestimated 5 MW of power for export to CEL. The company plans to expand sugar caneprocessing to 12,000 tons cane per day in order to obtain enough bagasse for use as fuel inthe new boiler.
Table 2.3 shows the potential for export of cogenerated power based on burning thebagasse that is currently being produced to generate steam in 600 psi or 900 psi boilers
TABLE 2.3: POTENTIAL FOR EXPORT OF COGENERATED POWER
CASE 1 CASE 2
Pounds steam per hour 265,000 276,000
Gross generation capacity, MW 17 14
Net exportable power( season), MW 11 8
Net exportable power (off-season), MW 17 14
Net exportable MWh (season) 41,952 32,790
Net exportable MWh (off-season) 73,622 63,288
Net exportable MWh per year 115,574 96,078
19
Table 2.4 shows the capital cost of installing new 900 psi or 600 psi boilers andturbogenerators at Central Izalco.
TABLE 2.4: CAPITAL COST OF INSTALLING NEW BOILERSAND TURBOGENERATORS
CASE 1 CASE 2
Boiler $5,185,000 $4,714,000
Turbogenerator $3,238,000 $2,944,000
Piping, civil, electrical, foundation $8,424,000 $7,658,000
Erection $1,791,000 $1,628,000
Engineering $932,000 $847,000
Miscellaneous $1,957,000 $1,779,000
Contingency $2,153,000 $1,957,000
TOTAL $23,680,000 $21,527,000
$ million per gross MW 1.41 1.49
Table 2.5 shows the estimated annual operating cost of power generation. Production costs are based on the assumptions that only bagasse is burned during the season,and only bunker C fuel is burned during the off-season.
TABLE 2.5: ESTIMATED ANNUAL OPERATING COSTOF POWER GENERATION
CASE 1 CASE 2
Fuel cost (season) 0 0
Fuel cost (off-season) $2,197,308 $2,005,825
Variable operating and maintenance costs $104,881 $81,974
Variable operating and maintenance costs $184,054 $158,220
Fixed operating and maintenance costs 0 0
Fixed operating and maintenance costs $202,917 $174,436
2.2.2 El Angel
El Angel sugar factory is a also privately owned and is the second largest in ElSalvador with a designed capacity of 4,800 metric tons cane per day. During the 1992-1993crop the factory processed 625,468 tons of cane. The hourly grinding rate adjusted for losttime is about 210 tons of cane. The factory produced 59,061 tons in 1992-1993, of which42,728 tons were plantation white sugar and 16,333 tons were refined.
The cane harvest season lasts about 120-130 days a year. The factory is nearly self-
20
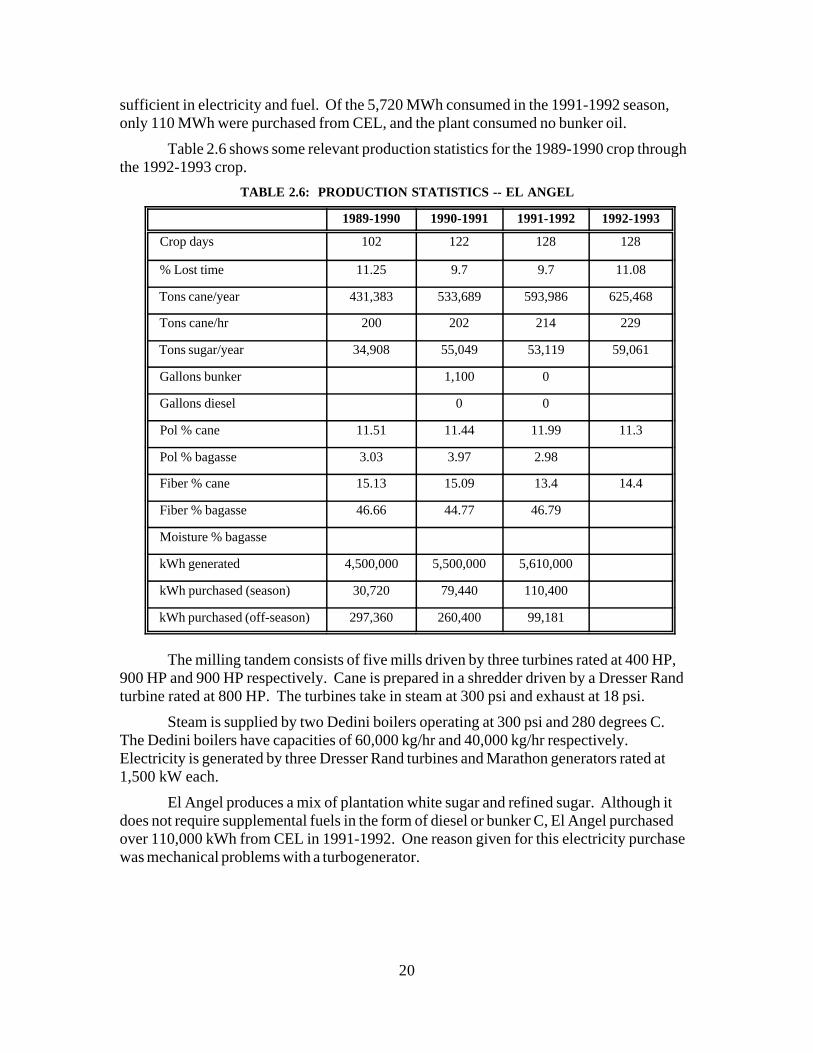
sufficient in electricity and fuel. Of the 5,720 MWh consumed in the 1991-1992 season,only 110 MWh were purchased from CEL, and the plant consumed no bunker oil.
Table 2.6 shows some relevant production statistics for the 1989-1990 crop throughthe 1992-1993 crop.
TABLE 2.6: PRODUCTION STATISTICS -- EL ANGEL
1989-1990 1990-1991 1991-1992 1992-1993
Crop days 102 122 128 128
% Lost time 11.25 9.7 9.7 11.08
Tons cane/year 431,383 533,689 593,986 625,468
Tons cane/hr 200 202 214 229
Tons sugar/year 34,908 55,049 53,119 59,061
Gallons bunker 1,100 0
Gallons diesel 0 0
Pol % cane 11.51 11.44 11.99 11.3
Pol % bagasse 3.03 3.97 2.98
Fiber % cane 15.13 15.09 13.4 14.4
Fiber % bagasse 46.66 44.77 46.79
Moisture % bagasse
kWh generated 4,500,000 5,500,000 5,610,000
kWh purchased (season) 30,720 79,440 110,400
kWh purchased (off-season) 297,360 260,400 99,181
The milling tandem consists of five mills driven by three turbines rated at 400 HP,900 HP and 900 HP respectively. Cane is prepared in a shredder driven by a Dresser Randturbine rated at 800 HP. The turbines take in steam at 300 psi and exhaust at 18 psi.
Steam is supplied by two Dedini boilers operating at 300 psi and 280 degrees C. The Dedini boilers have capacities of 60,000 kg/hr and 40,000 kg/hr respectively. Electricity is generated by three Dresser Rand turbines and Marathon generators rated at1,500 kW each.
El Angel produces a mix of plantation white sugar and refined sugar. Although itdoes not require supplemental fuels in the form of diesel or bunker C, El Angel purchasedover 110,000 kWh from CEL in 1991-1992. One reason given for this electricity purchasewas mechanical problems with a turbogenerator.
21
Table 2.7 shows the potential for export of cogenerated power based on burning thebagasse that is currently being produced to generate steam in 900 psi or 600 psi boilers
TABLE 2.7: POTENTIAL FOR EXPORT OF COGENERATED POWER
CASE 1 CASE 2
Pounds steam per hour 245,000 254,000
Gross generation capacity, MW 14 12
Net exportable power( season), MW 10 8
Net exportable power (off-season), MW 14 12
Net exportable MWh (season) 29,871 23,410
Net exportable MWh (off-season) 74,956 63,780
Net exportable MWh per year 104,834 87,190
Table 2.8 shows the capital cost of installing new 900 psi or 600 psi boilers andturbogenerators at El Angel.
TABLE 2.8: CAPITAL COST OF INSTALLING BOILERS AND TURBOGENERATORS
CASE 1 CASE 2
Boiler $5,023,000 $4,566,000
Turbogenerator $2,972,000 $2,702,000
Piping, civil, electrical, foundation $7,995,000 $7,268,000
Erection $1,735,000 $1,577,000
Engineering $886,000 $806,000
Miscellaneous $1,861,000 $1,692,000
Contingency $2,047,000 $1,861,000
TOTAL $22,519,000 $20,472,000
$ million per gross MW 1.56 1.66
22
Table 2.9 shows the estimated annual operating cost of power generation. Production costs are based on the assumptions that only bagasse is burned during the season,and only bunker C fuel is burned during the off-season.
TABLE 2.9: ESTIMATED ANNUAL OPERATING COSTOF POWER GENERATION
CASE 1 CASE 2
Fuel cost (season) 0 0
Fuel cost (off-season) $2,237,138 $2,021,408
Variable operating and maintenance $74,693 $58,524
Variable operating and maintenance $187,390 $159,449
Fixed operating and maintenance costs 0 0
Fixed operating and maintenance costs $206,595 $175,791
2.2.3 Ingenio Jiboa
The Jiboa factory is publicly owned, and is the third largest in El Salvador. It has adesigned capacity of 4,800 metric tons of cane per day and in 1992-1993 processed 713,586tons of cane.
The harvest season lasts about 180 days. In 1992-1993, 4,800 tons of cane wereprocessed per day of crop on average. After adjustments for lost time, the mills grind onaverage 211 tons of cane per hour.
The Jiboa factory produces a mix of raw sugar, white sugar and refined sugar. In1992-1993 total production amounted to 57,804 tons, of which 24,799 tons were raw sugar,32,442 tons white sugar and 563 tons refined sugar.
Jiboa factory's milling tandem consists of four mills driven by individual PeterBrotherhood turbines rated at 400 HP each. Cane is prepared by two sets of cane knives,and a fiberizer.
23
Table 2.10 shows some relevant production statistics for Jiboa.
Electricity is generated by means of two Peter Brotherhood turbogenerators installedin 1975 and rated at 1,750 KVA each. The turbines take in steam at 300 psi and exhaust at18 psi.
Steam is supplied by two Clarke Chapman boilers which were first installed in 1976. Each boiler has a capacity of 100,000 pounds per hour of steam at 300 psi pressure and atemperature of 350 degrees C. The boilers are equipped with air preheaters but do not haveeconomizers.
The steam supply is a bottleneck which limits the capacity of the entire factory to itspresent rate of 4,800 tons cane per day. The factory could potentially process up to 6,500tons cane per day with adequate boiler capacity.
The factory has two batteries of quadruple effect evaporators which can operate as aquintuple effect evaporator.
Table 2.11 shows the potential for export of cogenerated power based on burning thebagasse that is currently being produced to generate steam in 900 psi or 600 psi boilers.
24
TABLE 2.11: POTENTIAL FOR EXPORT OF COGENERATED POWER
CASE 1 CASE 2
Pounds steam per hour 214,000 222,00
Gross generation capacity, MW 12 10
Net exportable power( season), MW 8.4 6.6
Net exportable power (off-season), MW 11.9 10.0
Net exportable MWh (season) 36,424 28,301
Net exportable MWh (off-season) 47,678 40,162
Net exportable MWh per year 84,102 68,465
Table 2.12 shows the capital cost of installing new 900 psi or 600 psi boilers andturbogenerators at Injiboa.
TABLE 2.12: CAPITAL COST OF INSTALLINGBOILERS AND TURBOGENERATORS
CASE 1 CASE 2
Boiler $4,600,000 $4,182,000
Turbogenerator $2,689,000 $2,444,000
Piping, civil, electrical, foundation $7,288,000 $6,626,000
Erection $1,589,000 $1,445,000
Engineering $808,000 $735,000
Miscellaneous $1,697,000 $1,543,000
Contingency $1,867,000 $1,697,000
TOTAL $20,538,000 $18,672,000
$ million per gross MW 1.72 1.86
25
Table 2.13 shows the estimated annual operating cost of power generation. Production costs are based on the assumptions that only bagasse is burned during the season,and only bunker C fuel is burned during the off-season.
TABLE 2.13: ESTIMATED ANNUAL OPERATING COST
CASE 1 CASE 2
Fuel cost (season) 0 0
Fuel cost (off-season) $1,423,006 $1,272,955
Variable operating and maintenance costs $91,060 $70,753
Variable operating and maintenance costs $119,196 $100,411
Fixed operating and maintenance costs 0 0
Fixed operating and maintenance costs $131,412 $110,702
2.2.4 La Cabaña
La Cabaña is government-owned and is the fourth largest sugar factory in ElSalvador. It has a designed capacity of 4,800 metric tons of cane per day. In 1992-1993,La Cabaña processed 505,963 tons of cane.
The harvest season lasts about 126 days. In 1992-1993, 4,016 tons of cane wasprocessed per day of crop on average. After adjustments for lost time, the mills grind onaverage 193 tons of cane per hour.
La Cabaña produces a mix of raw, white and refined sugar. In 1992-1993 totalsugar production amounted to 44,560 tons, of which 25,026 tons were white sugar, 17,214tons were raw sugar and 2,320 tons were brown sugar.
The milling tandem consists of five mills driven by three Elliott turbines rated at 750HP, 1,000 HP and 1,000 HP respectively. Cane is prepared by a set of cane knives and afiberizer.
26
Table 2.14 shows some relevant production statistics for La Cabaña.
Steam is generated in four boilers producing a total of 290,000 pounds of steam perhour at 200 psi and 488 degrees F. Boiler 1 is a Babcock and Wilcox unit installed in 1947and with a capacity of 90,000 pounds of steam per hour. Boilers 2 and 3 are Heine unitsinstalled in 1948 and with a capacity of 75,000 pounds per hour each. Boiler 4 is aCombustion Engineering unit installed in 1969 with a capacity of 50,000 pounds of steamper hour. The Babcock and Wilcox unit has an economizer, and the Heine units and theCombustion Engineering boiler are equipped with air preheaters but do not haveeconomizers.
La Cabaña's electrical power demand is 3,000-3,200 kW, and power is generated by2 turbogenerators, a Siemens unit installed in 1969 and rated at 1,500 kW, and an IdealElectric unit installed in 1975 and rated at 2,000 kW. Thus, the turbogenerators haveadequate capacity, but shortages have resulted from the requirement of the factory to supplyboth steam and electricity to an adjoining distillery, which produces ethanol from molasses. The shortfall amounts to as much as 1,200-1,400 kW, which is made up by electricitypurchases from CEL. During the 1991-1992 season, the energy purchased from CELamounted to 10% of the total consumption during the season.
27
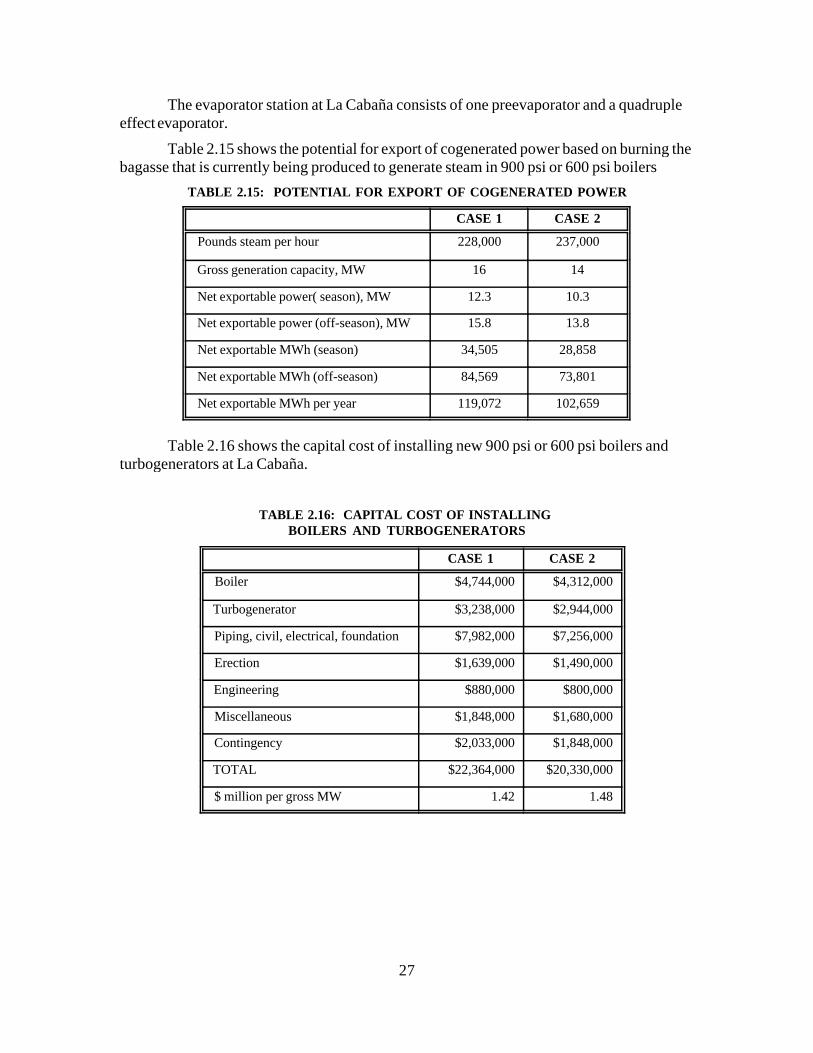
The evaporator station at La Cabaña consists of one preevaporator and a quadrupleeffect evaporator.
Table 2.15 shows the potential for export of cogenerated power based on burning thebagasse that is currently being produced to generate steam in 900 psi or 600 psi boilers
TABLE 2.15: POTENTIAL FOR EXPORT OF COGENERATED POWER
CASE 1 CASE 2
Pounds steam per hour 228,000 237,000
Gross generation capacity, MW 16 14
Net exportable power( season), MW 12.3 10.3
Net exportable power (off-season), MW 15.8 13.8
Net exportable MWh (season) 34,505 28,858
Net exportable MWh (off-season) 84,569 73,801
Net exportable MWh per year 119,072 102,659
Table 2.16 shows the capital cost of installing new 900 psi or 600 psi boilers andturbogenerators at La Cabaña.
TABLE 2.16: CAPITAL COST OF INSTALLING BOILERS AND TURBOGENERATORS
CASE 1 CASE 2
Boiler $4,744,000 $4,312,000
Turbogenerator $3,238,000 $2,944,000
Piping, civil, electrical, foundation $7,982,000 $7,256,000
Erection $1,639,000 $1,490,000
Engineering $880,000 $800,000
Miscellaneous $1,848,000 $1,680,000
Contingency $2,033,000 $1,848,000
TOTAL $22,364,000 $20,330,000
$ million per gross MW 1.42 1.48
28
Table 2.17 shows the estimated annual operating cost of power generation. Production costs are based on the assumptions that only bagasse is burned during the season,and only bunker C fuel is burned during the off-season.
TABLE 2.17: ESTIMATED ANNUAL OPERATING COST OF POWER GENERATION
CASE 1 CASE 2
Fuel cost (season) 0 0
Fuel cost (off-season) $2,524,054 $2,339,021
Variable operating and $86,257 $72,145
Variable operating and $211,423 $184,503
Fixed operating and maintenance 0 0
Fixed operating and maintenance $233,091 $203,412
2.2.5 San Francisco
San Francisco is a privately-owned sugar factory and the fifth largest in El Salvador. It has a designed capacity of 3,800 metric tons of cane per day. In 1992-1993, SanFrancisco processed 367,846 tons of cane.
The harvest season lasts about 127 days. In 1992-1993, 2,896 tons of cane wereprocessed per day of crop on average. After adjustments for lost time, the mills grind onaverage 193 tons of cane per hour.
San Francisco factory produces a mix of raw sugar and white sugar. In 1992-1993total production amounted to 35,297 tons, of which 26,964 tons were white sugar, and8,333 tons were raw sugar.
The milling tandem consists of five mills with individual Buckau-Wolf turbinedrives, one of which is rated at 530 HP, and the four others are rated at 330 HP each. Caneis prepared with a a set of cane knives and a shredder.
29
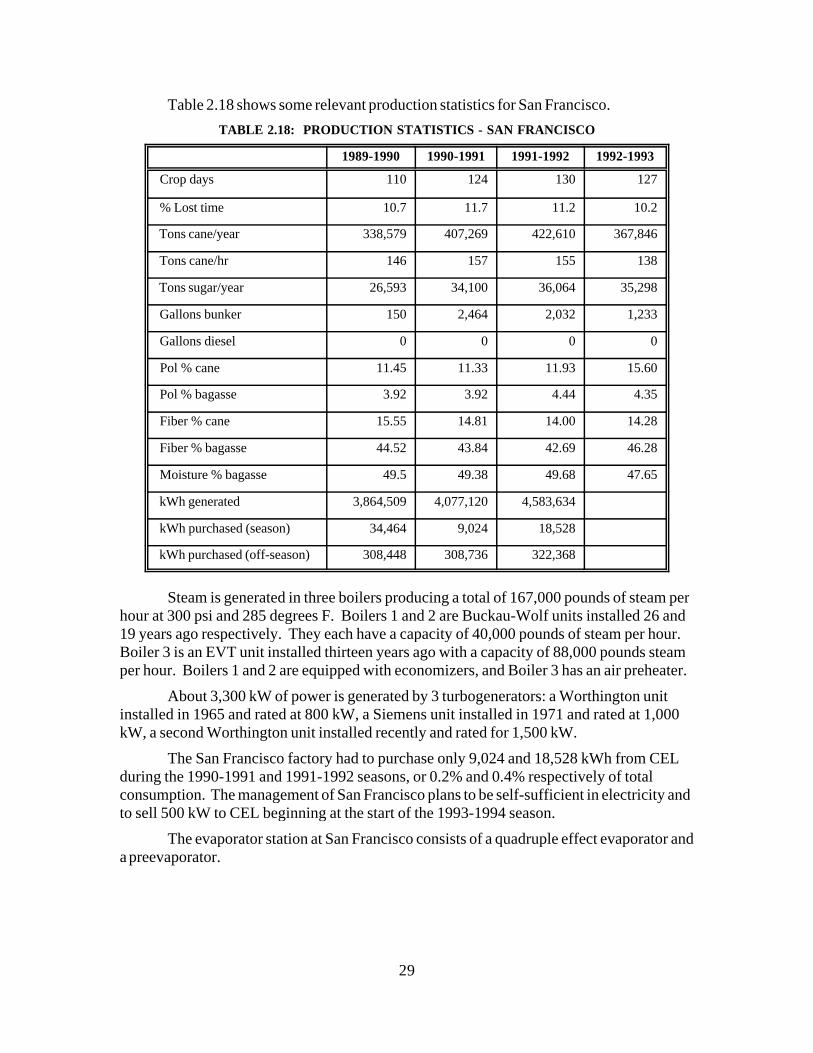
Table 2.18 shows some relevant production statistics for San Francisco.
Steam is generated in three boilers producing a total of 167,000 pounds of steam perhour at 300 psi and 285 degrees F. Boilers 1 and 2 are Buckau-Wolf units installed 26 and19 years ago respectively. They each have a capacity of 40,000 pounds of steam per hour. Boiler 3 is an EVT unit installed thirteen years ago with a capacity of 88,000 pounds steamper hour. Boilers 1 and 2 are equipped with economizers, and Boiler 3 has an air preheater.
About 3,300 kW of power is generated by 3 turbogenerators: a Worthington unitinstalled in 1965 and rated at 800 kW, a Siemens unit installed in 1971 and rated at 1,000kW, a second Worthington unit installed recently and rated for 1,500 kW.
The San Francisco factory had to purchase only 9,024 and 18,528 kWh from CELduring the 1990-1991 and 1991-1992 seasons, or 0.2% and 0.4% respectively of totalconsumption. The management of San Francisco plans to be self-sufficient in electricity andto sell 500 kW to CEL beginning at the start of the 1993-1994 season.
The evaporator station at San Francisco consists of a quadruple effect evaporator anda preevaporator.
30
Table 2.19 shows the potential for export of cogenerated power based on burning thebagasse that is currently being produced to generate steam in 900 psi or 600 psi boilers. Themill's management is planning a major expansion of the mill and anticipates installingcogeneration capacity as part of the overall project. The increased production will enablethe mill to export power substantially in excess of the 8 to 10 MW illustrated here.
TABLE 2.19: POTENTIAL FOR EXPORT OF COGENERATED POWER
CASE 1 CASE 2
Pounds steam per hour 187,000 194,000
Gross generation capacity, MW 11 9
Net exportable power( season), MW 7.7 6.0
Net exportable power (off-season), MW 11.0 9.3
Net exportable MWh (season) 23,405 18,392
Net exportable MWh (off-season) 56,440 47,985
Net exportable MWh per year 79,846 66,377
Table 2.20 shows the capital cost of installing new 900 psi or 600 psi boilersand turbogenerators at San Francisco sugar factory. If installed in conjunction with plantcapacity expansion, these items will not need to be justified solely in terms of power sales.
TABLE 2.20: CAPITAL COST OF INSTALLINGBOILERS AND TURBOGENERATORS
CASE 1 CASE 2
Boiler $4,226,000 $3,842,000
Turbogenerator $2,539,000 $2,308,000
Piping, civil, electrical, foundation $6,766,000 $6,151,000
Erection $1,460,000 $1,327,000
Engineering $750,000 $681,000
Miscellaneous $1,574,000 $1,431,000
Contingency $1,731,000 $1,574,000
TOTAL $19,046,000 $17,314,000
$ million per gross MW 1.73 1.86
Table 2.21 shows the estimated annual operating cost of power generation. Production costs are based on the assumptions that only bagasse is burned during the season,and only bunker C fuel is burned during the off-season.
TABLE 2.21: ESTIMATED ANNUAL OPERATING COSTOF POWER GENERATION
31
CASE 1 CASE 2
Fuel cost (season) 0 0
Fuel cost (off-season) $1,684,521 $1,520,813
Variable operating and $58,513 $45,980
Variable operating and $141,101 $119,962
Fixed operating and maintenance 0 0
Fixed operating and maintenance $155,562 $132,257
2.2.6 Ingenio Chaparrastique
Ingenio Chaparrastique, a government-owned sugar factory, is the sixth largest in thecountry. With a designed capacity of 3,800 metric tons of cane per day, Chaparrastiqueprocessed 276,359 tons of cane in 1992-1993.
The harvest season lasted 104 days in 1992-1993, and has varied between 82 days in1989-1990 and 136 days in 1991-1992. In 1992-1993, 2,658 tons of cane were processedper day of crop on average. After adjustments for lost time, the mills grind on average 129tons of cane per hour.
Chaparrastique factory produces only white sugar. In 1992-1993 total sugarproduction amounted to 25,768 tons.
The milling tandem consists of four mills with individual turbine drives, each ratedat 700 HP. Mills 1 and 2 are driven by Worthington-Turbodyne turbines and Mills 3 and 4are equipped with Elliott turbine drives. A shredder is used to prepare cane before milling.
32
Table 2.22 shows some relevant production statistics for Chaparrastique factory.
TABLE 2.22: PRODUCTION STATISTICS -- CHAPARRASTIQUE
1989-1990 1990-1991 1991-1992 1992-1993
Crop days 82 113 136 104
% Lost time 5.7 18.6 11.9 14.0
Tons cane/year 159,602 222,156 352,5370 276,359
Tons cane/hr 67 102 124 129
Tons sugar/year 12,0583 17,172 30,889 25,768
Gallons bunker 3,812 8,747 3,812 1,416
Gallons diesel 0 0 0
Pol % cane 10.84 11.64 12.34
Pol % bagasse 3.36 3.21 3.05
Fiber % cane 13.05 13.46 12.14
Fiber % bagasse 45.89 47.21 45.18
Moisture % bagasse
kWh generated 3,752,405 4,888,493
kWh purchased (season) 570,384 193,392
kWh purchased (off-season) 353,328
Steam is generated in two boilers producing a total of 190,000 pounds of steam perhour. Both boilers were installed in 1988. Boiler 1 is a Distral unit with a capacity of100,000 pounds per hour of steam at 240 psi and 300 degrees C. Boiler 2 is a Babcock andWilcox unit with a capacity of 100,000 pounds per hour of steam at 240 psi and 300 degreesC. Boiler 2 does not have an economizer or a preheater. Boiler 1 is equipped with aneconomizer but not a preheater.
During the 1990-1991 and 1991-1992 crops, the Chaparrastique factory had topurchase 570,384 and 193,392 kWh from CEL during the season, or 13% and 4%respectively of total consumption in those years. Power is generated by an Ideal Electricturbogenerator rated at 2,000 kW. The management of Chaparrastique plans to replace anexisting 600 kW unit installed in 1967 with a new 1300 kVA one which would allow themto eliminate power purchases from CEL and to export 500 kW to the grid during the season. They also plan to increase the cane grinding rate from 3,000 tons per day to 4,000 tons perday, as the existing factory capacity allows.
The evaporator station, which presently consists of two sets of quadruple effectevaporators, will be modified. Three vessels will be removed and the station will operate asa single quintuple effect evaporator.
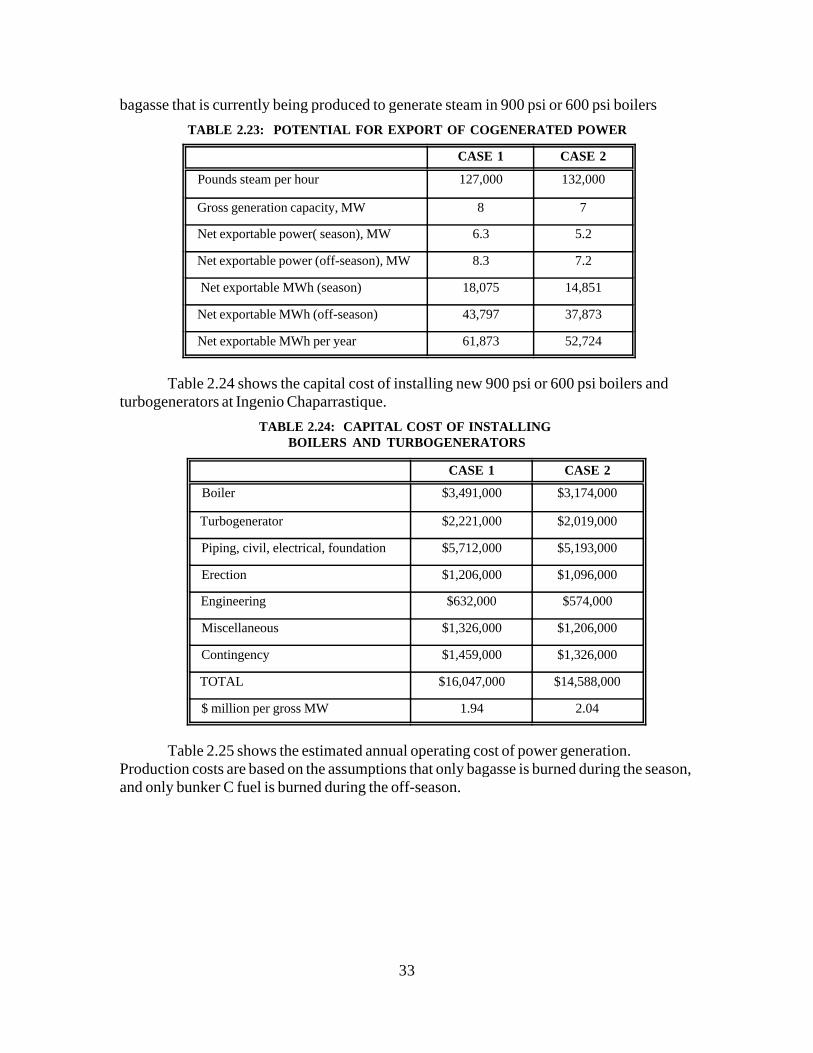
Table 2.23 shows the potential for export of cogenerated power based on burning the
33
bagasse that is currently being produced to generate steam in 900 psi or 600 psi boilers
TABLE 2.23: POTENTIAL FOR EXPORT OF COGENERATED POWER
CASE 1 CASE 2
Pounds steam per hour 127,000 132,000
Gross generation capacity, MW 8 7
Net exportable power( season), MW 6.3 5.2
Net exportable power (off-season), MW 8.3 7.2
Net exportable MWh (season) 18,075 14,851
Net exportable MWh (off-season) 43,797 37,873
Net exportable MWh per year 61,873 52,724
Table 2.24 shows the capital cost of installing new 900 psi or 600 psi boilers andturbogenerators at Ingenio Chaparrastique.
TABLE 2.24: CAPITAL COST OF INSTALLING BOILERS AND TURBOGENERATORS
CASE 1 CASE 2
Boiler $3,491,000 $3,174,000
Turbogenerator $2,221,000 $2,019,000
Piping, civil, electrical, foundation $5,712,000 $5,193,000
Erection $1,206,000 $1,096,000
Engineering $632,000 $574,000
Miscellaneous $1,326,000 $1,206,000
Contingency $1,459,000 $1,326,000
TOTAL $16,047,000 $14,588,000
$ million per gross MW 1.94 2.04
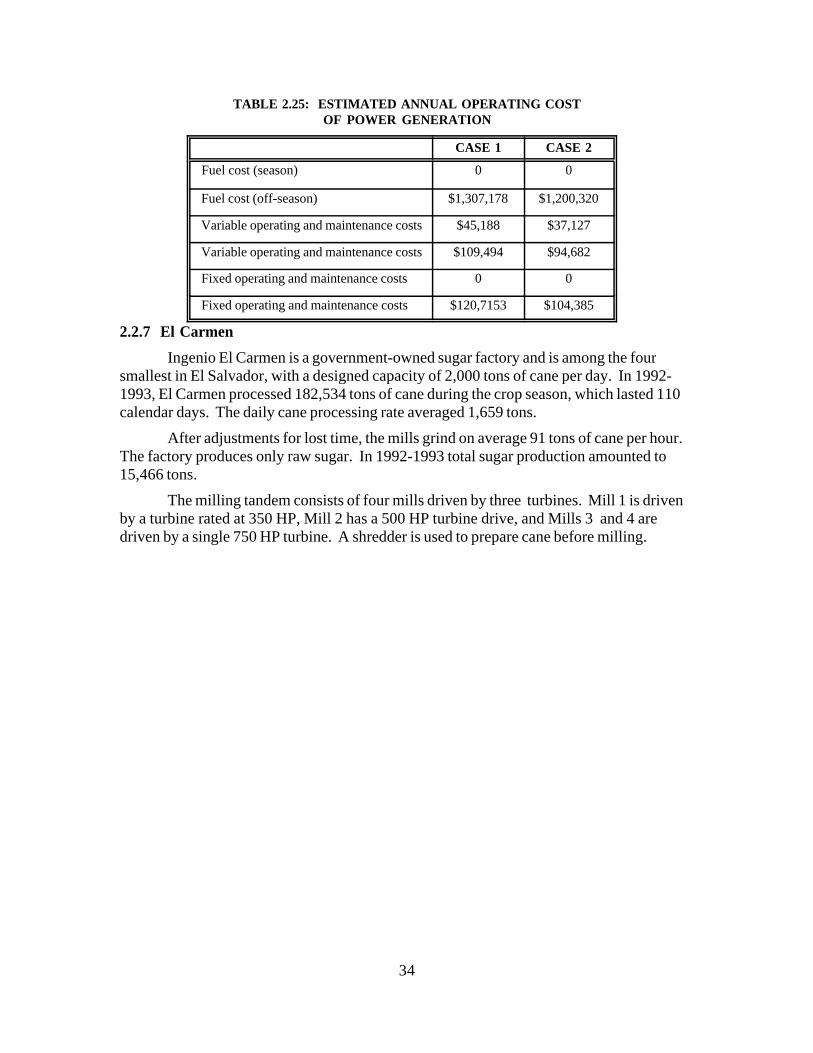
Table 2.25 shows the estimated annual operating cost of power generation. Production costs are based on the assumptions that only bagasse is burned during the season,and only bunker C fuel is burned during the off-season.
34
TABLE 2.25: ESTIMATED ANNUAL OPERATING COSTOF POWER GENERATION
CASE 1 CASE 2
Fuel cost (season) 0 0
Fuel cost (off-season) $1,307,178 $1,200,320
Variable operating and maintenance costs $45,188 $37,127
Variable operating and maintenance costs $109,494 $94,682
Fixed operating and maintenance costs 0 0
Fixed operating and maintenance costs $120,7153 $104,385
2.2.7 El Carmen
Ingenio El Carmen is a government-owned sugar factory and is among the foursmallest in El Salvador, with a designed capacity of 2,000 tons of cane per day. In 1992-1993, El Carmen processed 182,534 tons of cane during the crop season, which lasted 110calendar days. The daily cane processing rate averaged 1,659 tons.
After adjustments for lost time, the mills grind on average 91 tons of cane per hour. The factory produces only raw sugar. In 1992-1993 total sugar production amounted to15,466 tons.
The milling tandem consists of four mills driven by three turbines. Mill 1 is drivenby a turbine rated at 350 HP, Mill 2 has a 500 HP turbine drive, and Mills 3 and 4 aredriven by a single 750 HP turbine. A shredder is used to prepare cane before milling.
35
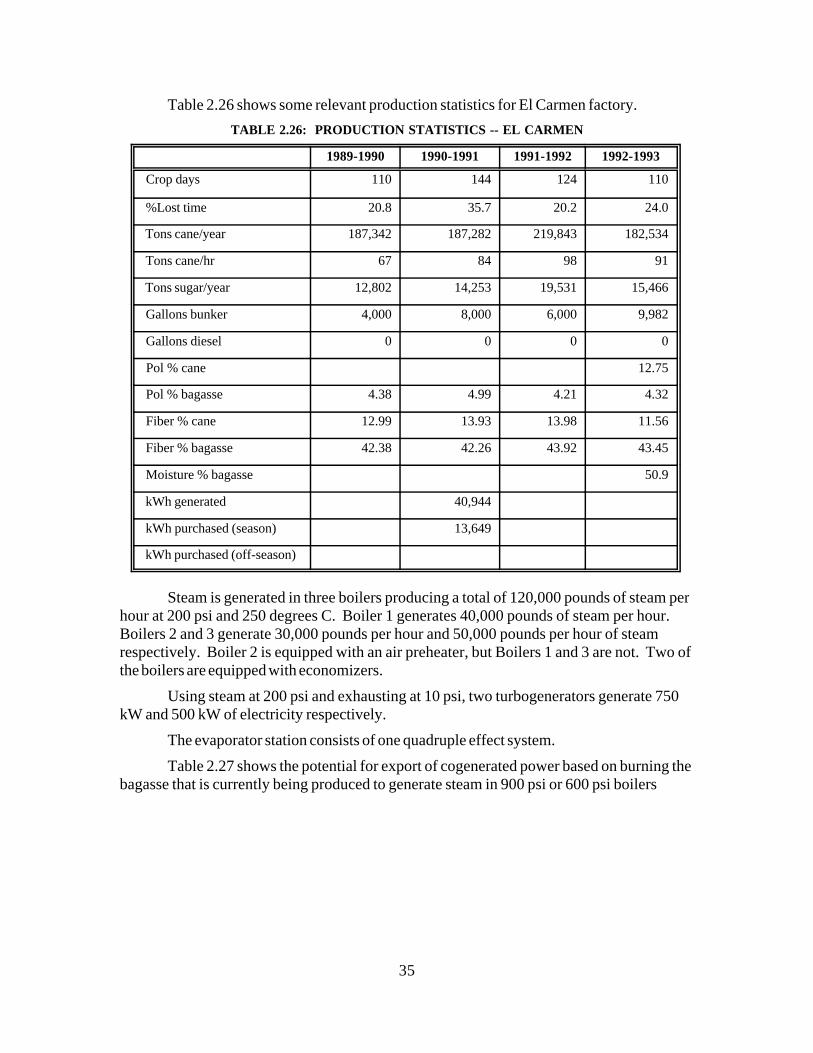
Table 2.26 shows some relevant production statistics for El Carmen factory.
TABLE 2.26: PRODUCTION STATISTICS -- EL CARMEN
1989-1990 1990-1991 1991-1992 1992-1993
Crop days 110 144 124 110
%Lost time 20.8 35.7 20.2 24.0
Tons cane/year 187,342 187,282 219,843 182,534
Tons cane/hr 67 84 98 91
Tons sugar/year 12,802 14,253 19,531 15,466
Gallons bunker 4,000 8,000 6,000 9,982
Gallons diesel 0 0 0 0
Pol % cane 12.75
Pol % bagasse 4.38 4.99 4.21 4.32
Fiber % cane 12.99 13.93 13.98 11.56
Fiber % bagasse 42.38 42.26 43.92 43.45
Moisture % bagasse 50.9
kWh generated 40,944
kWh purchased (season) 13,649
kWh purchased (off-season)
Steam is generated in three boilers producing a total of 120,000 pounds of steam perhour at 200 psi and 250 degrees C. Boiler 1 generates 40,000 pounds of steam per hour. Boilers 2 and 3 generate 30,000 pounds per hour and 50,000 pounds per hour of steamrespectively. Boiler 2 is equipped with an air preheater, but Boilers 1 and 3 are not. Two ofthe boilers are equipped with economizers.
Using steam at 200 psi and exhausting at 10 psi, two turbogenerators generate 750kW and 500 kW of electricity respectively.
The evaporator station consists of one quadruple effect system.
Table 2.27 shows the potential for export of cogenerated power based on burning thebagasse that is currently being produced to generate steam in 900 psi or 600 psi boilers
36
TABLE 2.27: POTENTIAL FOR EXPORT OF COGENERATED POWER
CASE 1 CASE 2
Pounds steam per hour 82,000 85,092
Gross generation capacity, MW 4.3 3.6
Net exportable power( season), MW 3.1 2.4
Net exportable power (off-season), MW 4.3 3.6
Net exportable MWh (season) 9,938 7,620
Net exportable MWh (off-season) 21,656 18,059
Net exportable MWh per year 31,595 25,679
Table 2.28 shows the capital cost of installing new 900 psi or 600 psi boilers andturbogenerators at El Carmen.
TABLE 2.28: CAPITAL COST OF INSTALLING BOILERS AND TURBOGENERATORS
CASE 1 CASE 2
Boiler $2,570,000 $2,336,000
Turbogenerator $1,465,000 $1,332,000
Piping, civil, electrical, foundation $4,035,000 $3,668,000
Erection $888,000 $807,000
Engineering $448,000 $407,000
Miscellaneous $941,000 $855,000
Contingency $1,035,000 $941,000
TOTAL $11,382,000 $10,346,000
$ million per gross MW 2.62 2.86
Table 2.29 shows the estimated annual operating cost of power generation. Production costs are based on the assumptions that only bagasse is burned during the season,and only bunker C fuel is burned during the off-season.
37
TABLE 2.29: ESTIMATED ANNUAL OPERATING COSTOF POWER GENERATION
CASE 1 CASE 2
Fuel cost (season) 0 0
Fuel cost (off-season) $646,351 $572.368
Variable operating and maintenance costs $24,846 $19,050
Variable operating and maintenance costs $54,141 $45,149
Fixed operating and maintenance costs 0 0
Fixed operating and maintenance costs (off- $59,689 $49,776
2.2.8 La Magdalena
The government-owned La Magdalena sugar factory and is also among the foursmallest in El Salvador. It has a designed capacity of 2,000 tons of cane per day butprocesses about 1,700 tons cane per day on average. In 1992-1993, La Magdalenaprocessed 151,760 tons of cane during a crop season, which lasted 94 calendar days. Afteradjustments for lost time, the mills grind on average 74 tons of cane per hour.
La Magdelena factory produces only plantation white sugar, and in 1992-1993, totalsugar production amounted to 18,568 tons.
The milling tandem consists of six mills driven by four turbines. Mills 1 and 2 aredriven by a turbine rated at 400 HP. Mills 3 and 4 have another 400 HP turbine. Mills 5and 6 are individually driven by 200 HP turbines. There is no cane preparation prior tomilling.
Table 2.30 shows some relevant production statistics for La Magdalena.
38
TABLE 2.30: PRODUCTION STATISTICS -- LA MAGDALENA
1989-1990 1990-1991 1991-1992 1992-
Crop days 77 106 108 94
% Lost time 11.2 22.9 15.0 11.7
Tons cane/year 108,116 136,491 175,908 151,760
Tons cane/hr 71 70 80 76
Tons sugar/year 10,858 13,535 18,568 15,032
Gallons bunker 47,384 21,064 26,508
Gallons diesel 0 0 0
Pol % cane 13.19
Pol % bagasse 4.16 4.08 3.35
Fiber % cane 12.41 12.69 13.00
Fiber % bagasse 44.19 44.87 45.44
Moisture % bagasse
kWh generated 564,102 67,162 45,334
kWh purchased (season) 256,641 328,812 13,876
kWh purchased (off-season) 487,872 67,162 68,429
Steam is generated in two boilers producing a total of 80,000 pounds of steam perhour at 250 psi and 480 degrees F. Boiler 1, a Babcock and Wilcox unit, generates 45,000pounds of steam per hour, and Boiler 2, an ERTE unit, produces 35,000 pounds per hour ofsteam. Neither boiler is equipped with an economizer or a preheater.
Electrical power is generated by a single turbogenerator. An Elliot turbine coupledwith an Allis-Chalmers generator generate 1,000 kW of power using steam at 200 psi andexhausting at 10 psi.
Due to inadequate amounts of bagasse, the factory burns Bunker C fuel during theseason to maintain steam flow. The factory also experiences a shortage of electricity whichis made up by means of electricity purchases from CEL.
Table 2.31 shows the potential for export of cogenerated power based on burning thebagasse that is currently being produced to generate steam in 900 psi or 600 psi boilers
39
TABLE 2.31: POTENTIAL FOR EXPORT OF COGENERATED POWER
CASE 1 CASE 2
Pounds steam per hour 72,000 75,000
Gross generation capacity, MW 4.1 3.5
Net exportable power( season), MW 3.1 2.5
Net exportable power (off-season), MW 4.1 3.5
Net exportable MWh (season) 7,983 6,350
Net exportable MWh (off-season) 22,896 19,352
Net exportable MWh per year 30,879 25,702
Table 2.32 shows the capital cost of installing new 900 psi or 600 psi boilers andturbogenerators at La Magdalena.
TABLE 2.32: CAPITAL COST OF INSTALLING BOILERS AND TURBOGENERATORS
CASE 1 CASE 2
Boiler $2,417,000 $2,197,000
Turbogenerator $1,465,000 $1,332,000
Piping, civil, electrical, foundation $3,882,000 $3,529,000
Erection $835,000 $758,000
Engineering $430,000 $391,000
Miscellaneous $903,000 $821,000
Contingency $993,000 $903,000
TOTAL $10,925,000 $9,931,000
$ million per gross MW 2.66 2.86
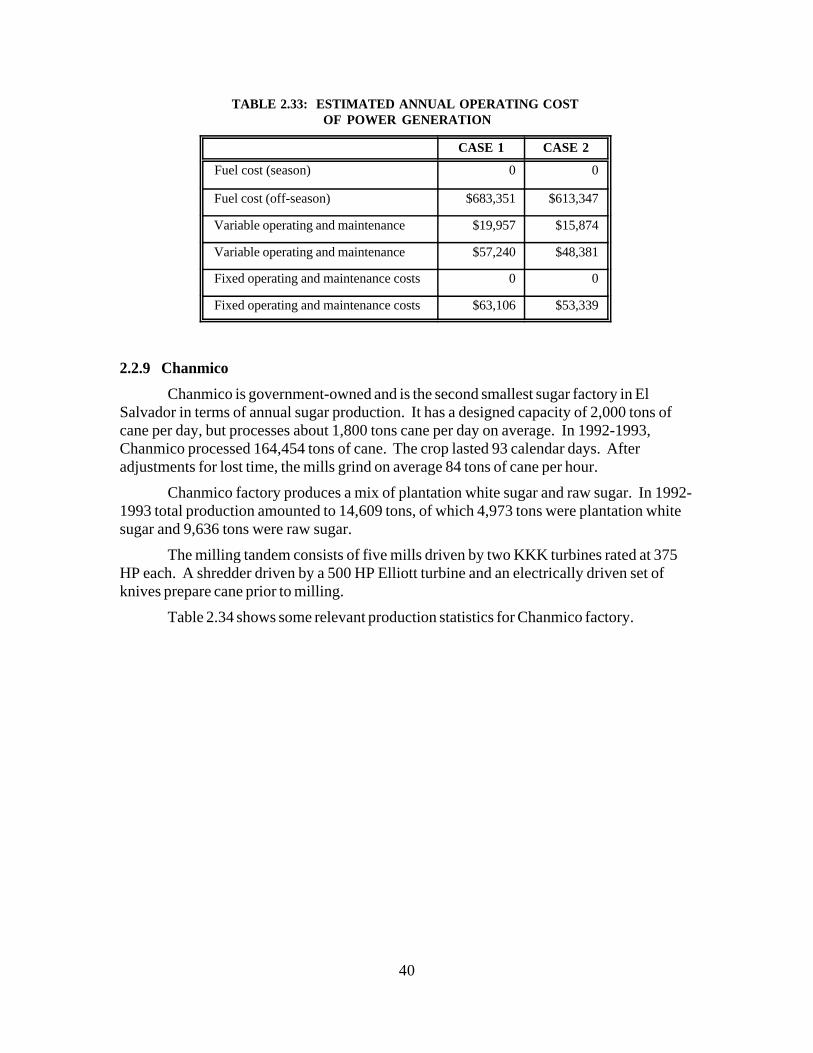
Table 2.33 shows the estimated annual operating cost of power generation. Production costs are based on the assumptions that only bagasse is burned during the season,and only bunker C fuel is burned during the off-season.
40
TABLE 2.33: ESTIMATED ANNUAL OPERATING COST OF POWER GENERATION
CASE 1 CASE 2
Fuel cost (season) 0 0
Fuel cost (off-season) $683,351 $613,347
Variable operating and maintenance $19,957 $15,874
Variable operating and maintenance $57,240 $48,381
Fixed operating and maintenance costs 0 0
Fixed operating and maintenance costs $63,106 $53,339
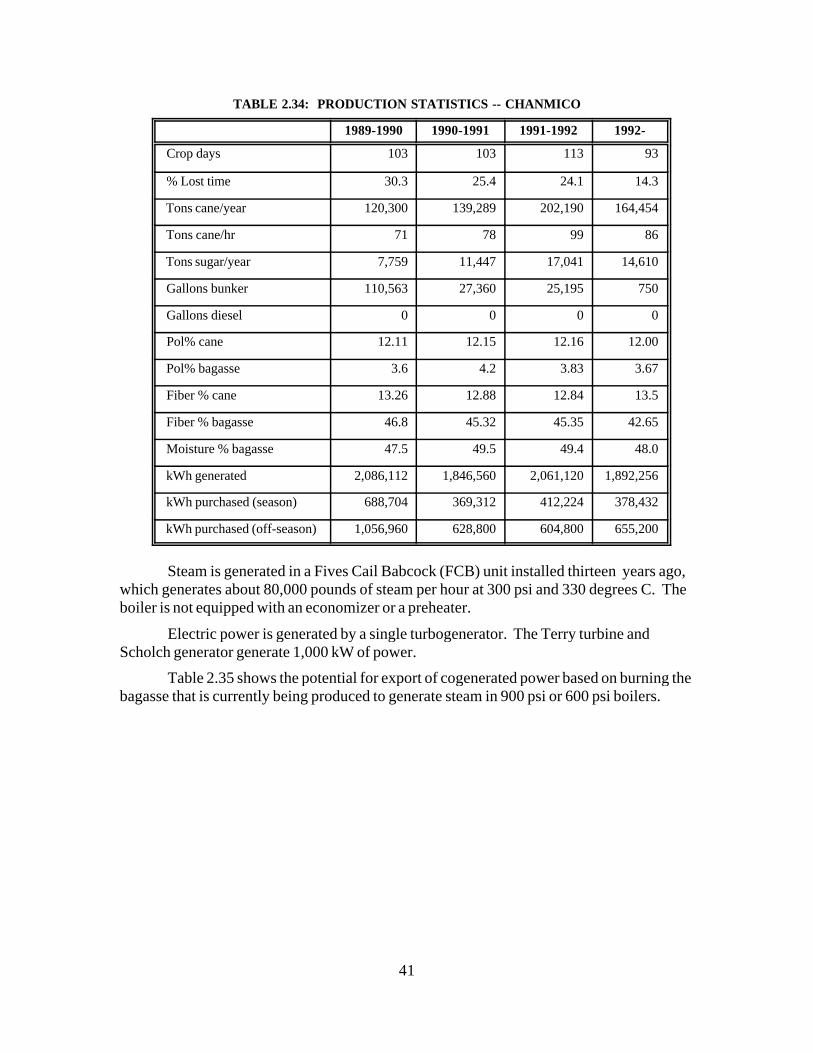
2.2.9 Chanmico
Chanmico is government-owned and is the second smallest sugar factory in ElSalvador in terms of annual sugar production. It has a designed capacity of 2,000 tons ofcane per day, but processes about 1,800 tons cane per day on average. In 1992-1993,Chanmico processed 164,454 tons of cane. The crop lasted 93 calendar days. Afteradjustments for lost time, the mills grind on average 84 tons of cane per hour.
Chanmico factory produces a mix of plantation white sugar and raw sugar. In 1992-1993 total production amounted to 14,609 tons, of which 4,973 tons were plantation whitesugar and 9,636 tons were raw sugar.
The milling tandem consists of five mills driven by two KKK turbines rated at 375HP each. A shredder driven by a 500 HP Elliott turbine and an electrically driven set ofknives prepare cane prior to milling.
Table 2.34 shows some relevant production statistics for Chanmico factory.
Steam is generated in a Fives Cail Babcock (FCB) unit installed thirteen years ago,which generates about 80,000 pounds of steam per hour at 300 psi and 330 degrees C. Theboiler is not equipped with an economizer or a preheater.
Electric power is generated by a single turbogenerator. The Terry turbine andScholch generator generate 1,000 kW of power.
Table 2.35 shows the potential for export of cogenerated power based on burning thebagasse that is currently being produced to generate steam in 900 psi or 600 psi boilers.
42
TABLE 2.35: POTENTIAL FOR EXPORT OF COGENERATED POWER
CASE 1 CASE 2
Pounds steam per hour 85,000 88,000
Gross generation capacity, MW 4.7 4.0
Net exportable power( season), MW 3.8 3.1
Net exportable power (off-season), MW 4.7 4.0
Net exportable MWh (season) 9,515 7,662
Net exportable MWh (off-season) 26,877 22,635
Net exportable MWh per year 36,392 30,297
Table 2.36 shows the capital cost of installing new 900 psi or 600 psi boilers andturbogenerators at Chanmico.
TABLE 2.36: CAPITAL COST OF INSTALLINGBOILERS AND TURBOGENERATORS
CASE 1 CASE 2
Boiler $2,633,000 $2,394,000
Turbogenerator $1,465,000 $1,332,000
Piping, civil, electrical, foundation $4,099,000 $3,726,000
Erection $910,000 $827,000
Engineering $455,000 $414,000
Miscellaneous $956,000 $869,000
Contingency $1,052,000 $956,000
TOTAL $11,570,000 $10,518,00
$ million per gross MW 2.44 2.63
Table 2.37 shows the estimated annual operating cost of power generation. Production costs are based on the assumptions that only bagasse is burned during the season,and only bunker C fuel is burned during the off-season.
43
TABLE 2.37: ESTIMATED ANNUAL OPERATING COST OF POWER GENERATION
CASE 1 CASE 2
Fuel cost (season) 0 0
Fuel cost (off-season) $802,157 $717,368
Variable operating and maintenance $23,788 $19,155
Variable operating and maintenance $67,191 $56,586
Fixed operating and maintenance costs 0 0
Fixed operating and maintenance costs $74 078 $62,388
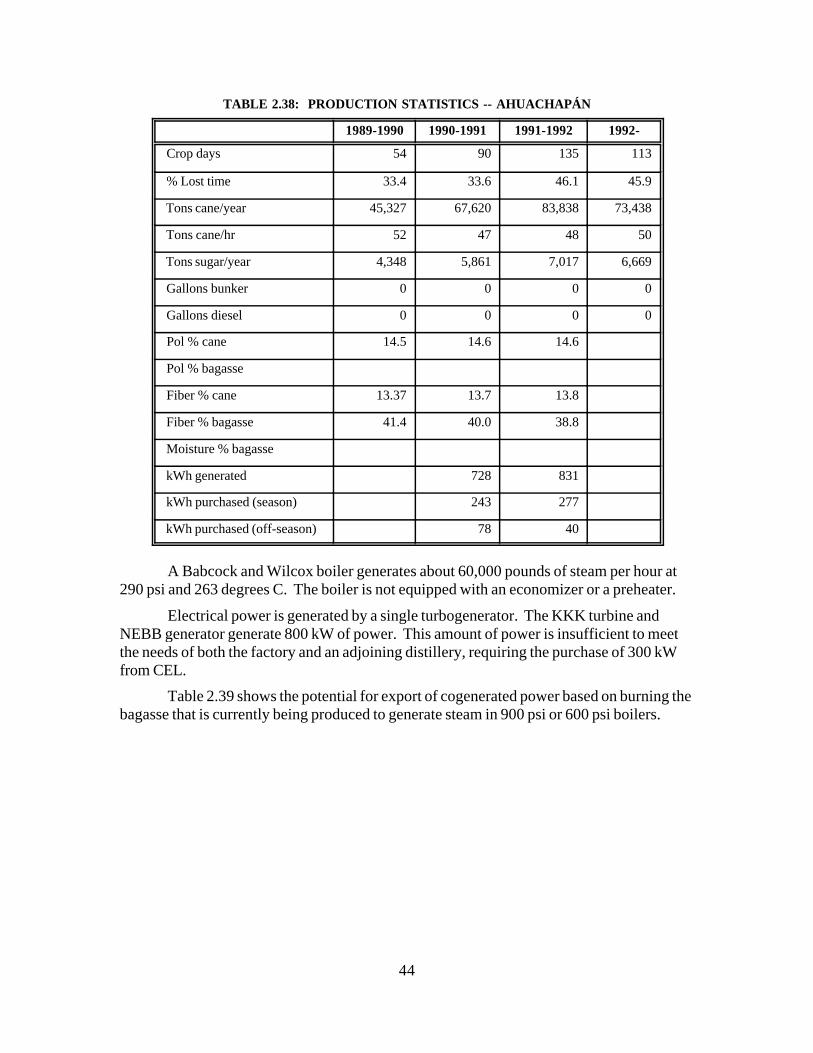
2.2.10 Ahuachapán
Ahuachapán is privately-owned and is the smallest sugar factory in El Salvador interms of annual sugar production. It has a designed capacity of 1,200 tons of cane per day,but processes about 650 tons cane per day on average. In 1992-1993, Ahuachapánprocessed 73,438 tons of cane during a crop season that lasted 113 calendar days. Afteradjustments for lost time, the mills grind on average 50 tons of cane per hour.
Ahuachapán factory produces a mix of plantation white sugar and raw sugar. In1992-1993 total production amounted to 6,669 tons, of which 3,709 tons were plantationwhite sugar and 2,960 tons were raw sugar.
The milling tandem consists of three mills driven by a single Worthington turbinerated at 750 HP. There is no cane preparation prior to milling.
Table 2.38 shows some relevant production statistics for Ahuachapán factory.
44
TABLE 2.38: PRODUCTION STATISTICS -- AHUACHAPÁN
1989-1990 1990-1991 1991-1992 1992-
Crop days 54 90 135 113
% Lost time 33.4 33.6 46.1 45.9
Tons cane/year 45,327 67,620 83,838 73,438
Tons cane/hr 52 47 48 50
Tons sugar/year 4,348 5,861 7,017 6,669
Gallons bunker 0 0 0 0
Gallons diesel 0 0 0 0
Pol % cane 14.5 14.6 14.6
Pol % bagasse
Fiber % cane 13.37 13.7 13.8
Fiber % bagasse 41.4 40.0 38.8
Moisture % bagasse
kWh generated 728 831
kWh purchased (season) 243 277
kWh purchased (off-season) 78 40
A Babcock and Wilcox boiler generates about 60,000 pounds of steam per hour at290 psi and 263 degrees C. The boiler is not equipped with an economizer or a preheater.
Electrical power is generated by a single turbogenerator. The KKK turbine andNEBB generator generate 800 kW of power. This amount of power is insufficient to meetthe needs of both the factory and an adjoining distillery, requiring the purchase of 300 kWfrom CEL.
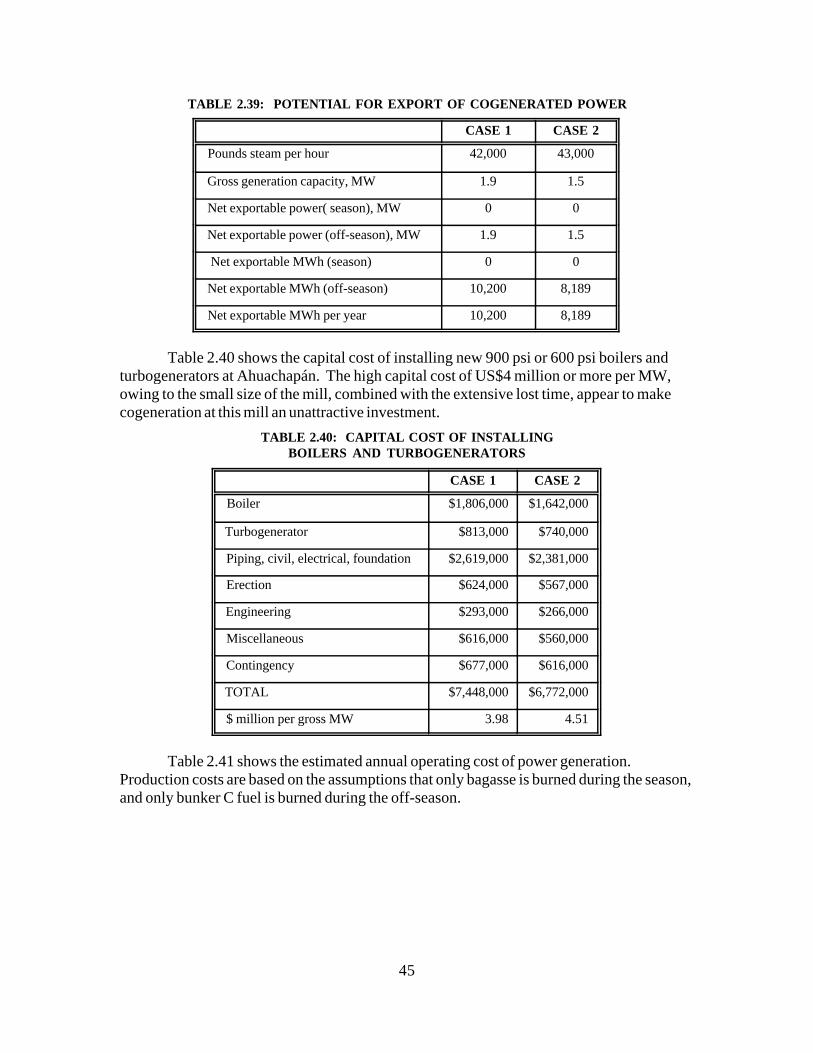
Table 2.39 shows the potential for export of cogenerated power based on burning thebagasse that is currently being produced to generate steam in 900 psi or 600 psi boilers.
45
TABLE 2.39: POTENTIAL FOR EXPORT OF COGENERATED POWER
CASE 1 CASE 2
Pounds steam per hour 42,000 43,000
Gross generation capacity, MW 1.9 1.5
Net exportable power( season), MW 0 0
Net exportable power (off-season), MW 1.9 1.5
Net exportable MWh (season) 0 0
Net exportable MWh (off-season) 10,200 8,189
Net exportable MWh per year 10,200 8,189
Table 2.40 shows the capital cost of installing new 900 psi or 600 psi boilers andturbogenerators at Ahuachapán. The high capital cost of US$4 million or more per MW,owing to the small size of the mill, combined with the extensive lost time, appear to makecogeneration at this mill an unattractive investment.
TABLE 2.40: CAPITAL COST OF INSTALLINGBOILERS AND TURBOGENERATORS
CASE 1 CASE 2
Boiler $1,806,000 $1,642,000
Turbogenerator $813,000 $740,000
Piping, civil, electrical, foundation $2,619,000 $2,381,000
Erection $624,000 $567,000
Engineering $293,000 $266,000
Miscellaneous $616,000 $560,000
Contingency $677,000 $616,000
TOTAL $7,448,000 $6,772,000
$ million per gross MW 3.98 4.51
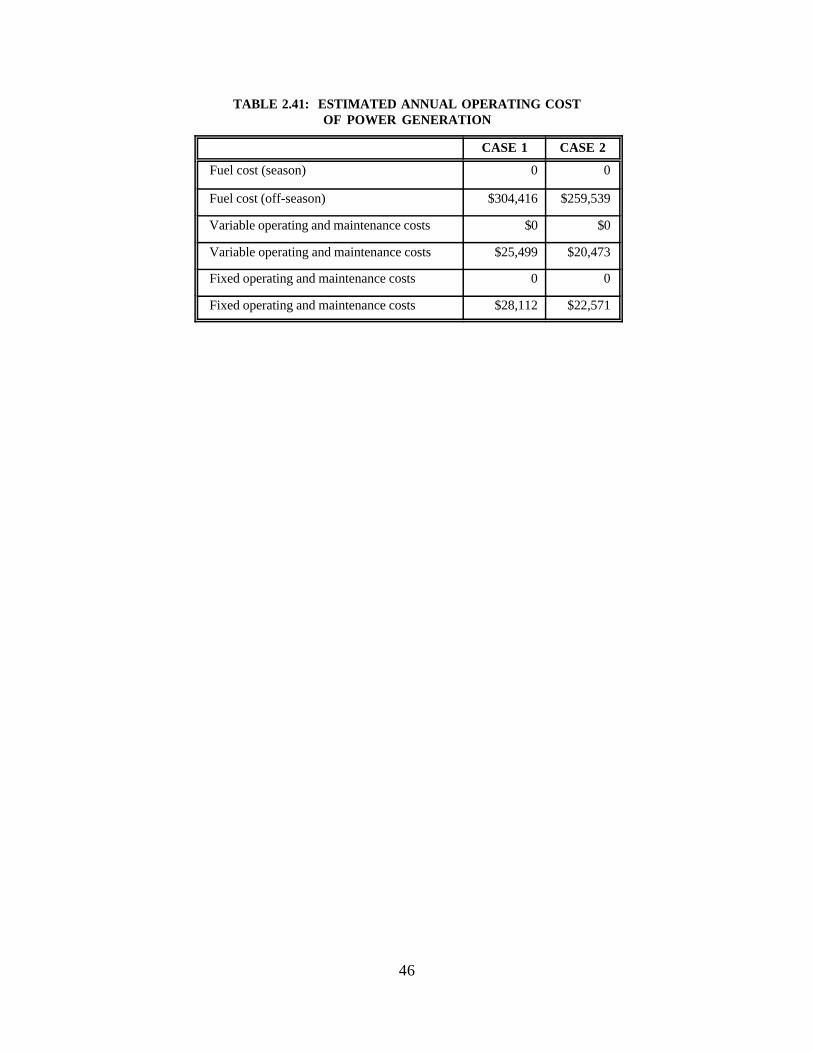
Table 2.41 shows the estimated annual operating cost of power generation. Production costs are based on the assumptions that only bagasse is burned during the season,and only bunker C fuel is burned during the off-season.
46
TABLE 2.41: ESTIMATED ANNUAL OPERATING COSTOF POWER GENERATION
CASE 1 CASE 2
Fuel cost (season) 0 0
Fuel cost (off-season) $304,416 $259,539
Variable operating and maintenance costs $0 $0
Variable operating and maintenance costs $25,499 $20,473
Fixed operating and maintenance costs 0 0
Fixed operating and maintenance costs $28,112 $22,571
47
2.3 ENVIRONMENTAL CONSIDERATIONS
In addition to the financial costs, some of the options will have incrementalenvironmental impacts associated with them as well. In the case of in-season cogenerationwith bagasse fuel only, the same material will be burned in the same quantities and in thesame ways as before, and the impacts on air, land and water quality should remainunchanged. For year-round generation, however, additional fuel will be consumed, and theimpacts will depend largely on the type of secondary fuel selected. In each case, a favorableeffect of independent cogeneration will be to offset generation by CEL to meet the same levelof demand for power.
While other waste biomass resources may be available in specific locations, bunkeroil is the most likely supplemental fuels for off-season operation. Sugar mills in El Salvadornow employ no flue gas emission controls. Oil combustion, depending on specific fuelcontent, would evolve oxides of sulfur and nitrogen, unburned organic material, and a smallamount of ash. Finally, while the off-season is rainy, operation with any fuel while theremainder of the mill is not operating will require additional cooling water to condensesteam.
Since the mills are small, the incremental environmental effects may be minor,especially at isolated rural installations. However, their cumulative impact in combinationwith other nearby polluting activities should be evaluated on a case by case basis.
CEL has an energy cost incentive to use geothermal and hydropower in preference tofossil fuel-fired generation, and capacity additions for the remainder of the decade are likelyto be either geothermal or oil-fired power plants. (See Table 3.5 below.) For this reason, theprobable environmental benefits due to cogeneration at sugar mills will lie in reduced fossilfuel (oil) combustion at CEL facilities. These benefits would result, in different amounts,from both in-season and all-year operation.
Since much of CEL's oil-fired capacity involves diesels or gas turbines, which burn acleaner distillate oil and have higher efficiencies than bunker fueled steam generators, the netimpact of generation by sugar mills during the off-season will probably be adverse. Thepollutants will be different, however, in that the internal combustion engines are likely toevolve more NOx and less SOx and particulates than bunker-fired boilers.
CEL, Informe Gerencial, October 1993, pp. 21-23.2
48
3.0 EL SALVADOR'S ELECTRIC POWERSYSTEM AND AVOIDED COST
3.1 OVERVIEW OF ELECTRIC SECTOR
La Comision Ejecutiva Hidroelectrica del Rio Lempa (CEL), is the state-ownednational power generation authority in El Salvador. CEL has been primarily responsible forall new power generation and transmission in El Salvador since 1948. DISCEL, a unit ofCEL, is responsible for the distribution and sale of power to the final consumer in rural areasin El Salvador. Distribution to the major portion of the remainder of the country is theresponsibility of four state owned distribution companies. Until 1986, when concessionsexpired, these were private companies under the administration of CEL. The four formerlyprivate companies are: CAESS-Compañía de Alumbrado Electrico de San Salvador, CLES-Compañía de Luz Electrica de Sonsanate, CLEA- Compañía de Luz Electrica deAhuachapán and CLESA-Compañía de Luz Electrica de Santa Ana.
A number of important factors are adversely affecting both the supply system of CELand planning for future generation resources. The majority of current generation equipmentis 20 years old or greater, reducing reliability and raising costs of maintenance. Expansionof the system in recent years has not been adequate to meet loads, and the drought whichoccurred in 1991 made it necessary to add emergency capacity with two new gas turbines of37.5 MW. Subsequently with the failure of the Soyapango oil-fired plant in 1992, anadditional gas turbine of 82.1 MW had to be added. As discussed further below, the electricpower system in El Salvador has experienced much more rapid growth in demand (9.7%versus 7.2%) than had been previously forecast for planning purposes. This growth rateeven if later moderated, will require significantly greater additions to the CEL system thanhad been programmed only as recently as last year.
While electricity is clearly a critical input to most economic activity in El Salvador,it also constitutes one of the largest expenditure obligations for the government. Expenditures for the electric power sector during the 1970's constituted 25% of total publicinvestment and 8% of total national investment. CEL's investments reached 16.9% of totalpublic investment in 1990. The indebtedness of the power sector, of which CEL is a majorpart, at the end of September 1993, totaled 2,613 million colones (US $296.9 million). As2
a condition of recent financing by IDB, CEL has agreed to adhere to strict financialmanagement and indebtedness guidelines over the next 10 years. These will limit CELborrowing and affect tariff policy. The most important accords provide that CEL will:
RCG/Hagler, Bailly, Inc. "Estudio del Sistema Tarifario del Subsector Electrico-Informe Final," Julio3
1993, Cuadro 5-15 and Cuadro 5-16.
49
1. Maintain a current ratio of not less than 1.5 (current assets/current liabilities).
2. Not assume, without prior agreement with IDB, new financial obligationsgreater than one year duration which would:
a. cause indebtedness to rise above a ratio of 0.75 (totalliabilities/total assets),
b. cause debt coverage for long-term obligations to fall below1.5, except for 1993-94 where a ratio of not less than 1.0 isagreed. (ratio of actual cash flow to maximum projected debtservice), and
c. not incur new investments without prior agreement if theseexceed 2% of the average of fixed assets.
Recent tariff studies by CEL consultants have provided detailed analysis of bothprice levels and tariff structures. In general, these show CEL revenues at the bulk tarifflevel, using 1992 financial results, were only 0.4054 colones/kWh (US $ 0.046) versusstrict long run marginal costs of 0.8698 colones/kWh (US $ 0.099). At the retail level,current revenues are 0.5415 colones/kWh (US $0.0615) versus costs for CAESS, whichwere 1.022 colones/kWh (US $0.116), at 8.8 colones/US dollar. 3
The projected heavy financial burden of electric sector expansion, as well as poorpast financial performance, have led to a number of important reforms affecting the marketfor, and economics of private power generation. The Government of El Salvador (GOES)intends to reduce the intervention of the government in electric sector, includingconsideration of private generation, new regulatory mechanisms and reprivatized electricitydistribution. Accords with the Interamerican Development Bank (IDB) and other donorscommit the GOES to substantial additional tariff increases to bring electricity prices to thelevel of long-run marginal cost by 1996, and to maintain prices at these levels thereafter.
It will become increasingly difficult politically to expand the power system in thefuture due to the very large tariff increases, financing restrictions and the heavy financingburden that will be required for this expansion. As the discussion which follows explains,the GOES is now considering a variety of means to mitigate the financial burden of powersector expansion, among which is partial reliance on private power.
50
3.2 INSTITUTIONAL AND LEGAL BASIS FORCOGENERATION AND PRIVATE POWER
3.2.1 Institutional Structure for Private Powerand Power Sector Regulation
The Government of El Salvador (GOES) is proceeding rapidly to establish a legalframework for power sector restructuring in El Salvador. The Unidad de EstudiosSectoriales (UES) is the GOES interagency body responsible for overseeing the preparationof legal and institutional reform proposals. Various draft reform laws are currently beingprepared for consideration, including a new electricity sector law (Anteproyecto de LeyGeneral de Electricidad), a law to create a new energy regulatory agency or CREH(Anteproyecto de Ley de Creación de la Comisión Reguladora de Electricidad eHidrocarburos) to deal with the electricity and petroleum sectors, and a law to establish anew national energy commission or CNE (Anteproyecto de la Ley de Creación del ConsejoNacional de Energía).
The CNE would be the highest energy policy making body in government and wouldbe made up of the Ministry of Planning, Ministry of the Economy, Ministry of Housing,Ministry of Agriculture and Livestock and President of the Central Bank. The CNE wouldbe responsible for such matters as development of national energy strategy and associatedlegislation, including promotion of private investment, approve quality of service standardsfor energy supply, and establish policy for exploration and exploitation of national energyresources.
The regulatory agency, CREH, would be responsible for the actual regulatoryactivities having to do with the development and supply of energy resources within thecountry, including monitoring of adherence to technical and environmental norms and toboth the laws dealing with hydrocarbons and electricity. This agency would be responsiblefor fixing tariffs for generation, transmission and distribution of electricity, and guaranteeingthat quality of service standards are met.
The new Ley General de Electricidad (LGE) would provide a comprehensiveframework for management of the electricity sector, and in so-doing provide a number ofinnovations which will be important for the effective introduction of competition in theelectricity sector and for private power investment. For example, among the objectives ofthe LGE is the promotion of free competition in the generation of electricity and free accessof generators to transmission and distribution, as well as the guarantee that the prices ofelectricity reflect costs of generation, transmission and distribution. Concessions for privategeneration would generally be required by the law, except that thermal and non-conventionalelectricity generators below levels to be prescribed under the law would be exempt. Published national generation and transmission expansion plans would form the basis uponwhich interested parties would be able to bid for generation and/or transmission concessions,either on their own motion or in response to public solicitations, and proposers would present
U.E.S, "Anteproyecto de Ley General de Electricidad," pp. 6-14.4
U.E.S, "Anteproyecto de Ley General de Electricidad," pg. 18.5
U.E.S, "Anteproyecto de Ley General de Electricidad," pp. 44-46.6
U.E.S, "Anteproyecto de Ley General de Electricidad," pp. 47-48.7
U.E.S, "Anteproyecto de Ley General de Electricidad," pp. 53-54.8
51
brief feasibility studies along with schedule, budget and sources of funds.4
The new law provides eminent domain procedures for use of private property forelectricity generation, transmission or distribution, and provides for use of hydrologic,geothermal, wind and solar natural resources without additional payment to the state byelectricity generators. The responsibility of developers will be primarily for facilitiesnecessary to exploit these resources. Distribution concessions are described and rules for5
operation given, and the Ministry of Economy would have one year formally to grant theconcessions. In addition, the procedure for determining prices of wholesale power sales todistributors is specified, generally making these prices equal to the prospective 5 yearaverage of short-term marginal costs of generation plus a cost for use of transmission. Thereis also authority, but few details are specified, for eventual complete liberalization ofwholesale power sales prices, that is, authority for competitive purchase under regulatorysupervision. Criteria for transmission access or use and appropriate payments are also6
described. 7
Criteria for determining final tariffs to consumers are provided, generallycorresponding to cost of purchased power, plus value-added by the distribution companyassuming "efficient" (defined) operation. Tariffs for classes of customers are to be cost-based, taking into account losses and associated energy and capacity costs. Studies bydistributors are to be prepared proposing tariff levels by class of customer. These are thenreviewed by the CREH to determine the internal rate of return on investment (from revenuesless costs of operation), using an historic test year. The allowed rate of return will be thediscount rate defined for calculation of tariffs (opportunity cost of capital fixed by CNE)plus a maximum of 4 percent.8
CEL, op. cit., pg. 12; and CEL, Plan Complementario del Sistema de Generacion 1993-2010 26/10/93, pg.9
22.
52
3.3 ELECTRIC POWER SUPPLY AND DEMAND IN EL SALVADOR
3.3.1 Current CEL and Distribution Company Growth Projections
3.3.1.1 CEL Projections
The forecast of sales and power demand prepared by CEL is the basis for investmentplanning in El Salvador. The methodology for preparing this forecast involves analysis ofdemand patterns at the national level using an econometric model of historic power sales byeconomic sector versus various economic variables. The projection of these economicvariables at the national level by economic officials and/or international organizations, areused as the basis for CEL's forecast of the corresponding future electrical consumption up to2010. In addition, the staff of CEL separately take into consideration plans for additionallarge private and public projects.
The future growth of El Salvador's electricity sector as well as the economy hasrecently been very robust due to the end of the conflict of the 1980's. Unfortunately, this hasalso added substantially to the uncertainty of forecasts and corresponding supply plans. Asan example, the consumption of electricity grew at an average of 3.8% during the period1980 to 1989, versus 10.3% from 1970-79, and in 1993 appears to have grown at a rate ofabout 9.7%. Potentially damping the need for new capacity will be a number of other new9
factors. During the next 5-10 years El Salvador's electricity sector will be subject to a largenumber of important policy interventions, including more concerted effort to reduce largetransmission and distribution losses (which lower need for new capacity), as well as pricereform leading to large increases in electricity rates, and introduction of load managementand energy conservation programs.
The following tables present both previous and current electricity sales and demandforecasts for comparison. The recent but no longer accepted forecast growth rates used byCEL to prepare the 1992 CEL-IDB supply plan, as well as recent revisions used for thecurrent plans, are shown in Table 3.1 below. The most recent forecast projects averagedemand growth over the period 1994 to 2010 at 8.8% per year.
Misión del BID-Revision, "Proyecciones de la Demanda de Energia Electrica," 26/08/92.10
53
TABLE 3.1: PAST AND CURRENT FORECAST NATIONALELECTRICITY GROWTH RATES (1992-2010) 10
Year Scenario Intermedio Scenario Optimista Scenario PesimistaPrevious Forecast
An important element of the forecast process used for generation planning purposesis the projection of losses in energy and capacity in transmission and distribution from bothtechnical and non-technical (e.g., theft) sources, shown below. These are combined withforecast consumption and maximum demand to determine generation capacity requirements.
TABLE 3.2: TOTAL SYSTEM LOSSES - CEL ESTIMATE
Year Transmission Losses Distribution Losses Total Losses (%) (%) (%)
TABLE 3.3: PREVIOUS AND CURRENT CEL GENERATION AND MAXIMUM DEMAND FORECAST
Year Net Generation Maximum Load(GWh) Demand (MW) Factor
1992Previous/ 2,434.6/ 455.6/ 0.61 Current 2,503.4 476.01995 Previous/ 2,929.7/ 539.4/ 0.61 Current 3,307.0 625.02000 Previous/ 4,225.6/ 765.7/ 0.61 Current 5,203.5 974.02005 Previous/ 5,957.5/ 1,062.5/ 0.62 Current 7,851.5 1,446.02010 Previous/ 8,366.9/ 1,492.4/ 0.63 Current 11,421.0 2,069.0
Source: CEL, Plan Complementario del Sistema de Generacion 1993 - 2010,
Comision Ejecutive Hidroelectrica del Rio Lempa, "Reporte Mensual de Operacion del Sistema CEL,11
Septiembre 1993, page 14.CEL, Plan Complementario del Sistema de Generacion 1993 - 2010, Resumen Ejecutivo, SPDE/26/10/93,12
PLANICEL; page 13.
55
PLANICEL/SPDE/26/10/93
3.3.2 El Salvador's Generation System and Its Operation
3.3.2.1 National Supply System (CEL)
The total installed capacity in El Salvador as of September 1993 was 817.5 MW, ofwhich 47.5% was hydroelectric, 12.8% geothermal and 39.7% oil-fired. The generationsystem of El Salvador is heavily dependent on hydroelectric generation which provided some52% (1,066 GWh) of total energy produced from national resources in 1993 (2,055 GWh)through September. Hydroelectric generation is made-up of four major units, with installedand available capacity (September 1993) as follows:11
Hydroelectric Capacity
Available InstalledGuajoyo 15.0 MW 15 MWCerron Grande 135.0 MW 135 MW5 de Noviembre 72.0 MW 81.4 MW15 de Septiembre 156.6 MW 156.6 MW
Subtotal 378.6 MW 388.0 MW12
Geothermal resources in El Salvador are substantial, with 2 sites operational in theAhuachapán field and one in the Berlin field. In 1993, geothermal generation made-up14% (290 GWh) of internally generated energy through September 1993. Average plantfactor was 39%.
Geothermal Capacity
Available InstalledAhuachapán 58 MW 95 MWBerlin 5 MW 10 MW
Subtotal 63.0 MW 105 MW
Thermal generation is next in importance after hydroelectric generation with 5 majorstations providing 34% (699 GWh) of internal energy production through September 1993,with an average plant factor of 52%.
NRECA, "Valuo de Inventarios de Lineas y Transformadores de Distribution...," San Salvador, February13
Of the total CEL generation system ,with an installed capacity of 817.5 MW,672.6 MW was available capacity as of September 1993.
3.3.3 National Transmission and Distribution System
Decentralized generation sources, such as the sugar sector, will not only potentiallyimpact the generation system of CEL, but also will have an impact on transmission anddistribution to varying degrees. Although smaller size cogeneration and/or seasonablecapacity, may not impact required transmission investment to serve national loads,decentralized generation would reduce transmission losses and possibly substation powerrequirements and investments. By improving the quality of power supply at intermediatepoints in the distribution system, decentralized generation may have significant benefits forquality of service, reduced distribution losses and possibly lower distribution investmentrequirements. Distribution power quality in many rural areas is now substandard andrequires changes such as substation relocation or improvement, changing voltage, and linereconductoring.
The principal transmission system in El Salvador operates at 115 kV system with theexception of the interconnection with Guatemala which is 230 kV. The system consists ofsome 29 lines of 848 kms interconnecting generating stations with CEL's main substations.CEL's Operations Center controls the transmission and distribution of electricity, through thesix main distribution companies, to 7 direct clients of CEL and 13 rural electrification zones(distributed by DISCEL). Figure 3.1 below contains a line diagram of the nationalinterconnected system.
The distribution system in El Salvador consists of some 16,672 kms of primary andsecondary distribution lines. While no exact figure is available it is normally assumed thatthe rural distribution system consists of at least 7,842 kms, which is the entire system ofDISCEL. Most rural primary distribution is at 13.2 KV, while the majority of urban primarydistribution (CAESS) is at 23 KV. Long line lengths , along with inadequate conductorsizes, are major contributors to large losses and low voltage levels experienced in rural ElSalvador. DISCEL reports average distribution losses of 22.8% in 1992 for example. These unfavorable characteristics substantially influence (increase) the potential distributionbenefits of decentralized generation.13
57
FIGURE 3.1
(FULL PAGE CEL MAP)
58
3.3.3.1 Planned Expansion of the National Interconnected System
Until very recently CEL had planned to accommodate annual demand growth of7.2%, consistent with recent projections of growth in national income of 4.0% (1993) to4.6% (1996 and thereafter). The plan contemplated financing by the IDB of 4 projectsduring the period 1993-1996. These were: the third well-head unit of the Berlin geothermalfield, the steam-turbine to be added to the existing combined-cycle unit, a feasibility study ofthe San Vicente geothermal field and rehabilitation of the steam units of Acajutla. TheAcajutla rehabilitation will be carried out with funds from the Overseas EconomicCooperation Fund of Japan.
In order to respond to the accelerated rate of demand growth, CEL has performedadditional operational and planning studies to ascertain the implications for immediateaction and planned new generation. Given the critical nature of the supply situation, CELhas also incorporated private power generation as an alternative for the first time in itsofficial generation planning. In order to understand the worst-case implications of notexpanding their system adequately, CEL performed several operational studies, assuming noadditional short-term generation is added (due to delays in planned projects, etc.) with thefollowing results:
C Under average hydro conditions during the period 1993-1996, there wouldbe a deficit in energy of 183.2 GWh and 508.7 GWh in the years 1995 and1996 respectively.
C Under dry hydro conditions during this same period, an energy deficit of 530GWh and 575 GWh in 1995 and 1996, respectively, would occur
C Assuming only rehabilitation of Soyapango by 1995, the system would havea deficit of 25 GWh in 1995 under dry hydro conditions.
Tables 3.4 - 3.5 describe CEL planning assumptions and results of the previousgeneration plan done as input to IDB loan evaluations.
TABLE 3.4: AVERAGE CAPITAL AND O&M COSTS OF THE INVESTMENT PLAN
1 Ahuachapán Stabilization 211998 1 Berlin Geothermal 23.7
1 Chipilapa Geothermal 23.71999 1 C.H. 5 de Noviembre 1202000 1 Oil-fired Steam 692001 2 C.H. San Marcos Lempa 802002 1 Oil-fired Steam 692003 1 San Vicente Geothermal 23.7
CEL has now reformulated their least-cost expansion plan taking into account anumber of other adverse factors in addition to the higher demand growth they areexperiencing These factors include delays in expansion of the 5 de Noviembre Hydrofacility, delay of 8 months in the third Berlin well-head unit, delay of the steam turbine forthe existing combined cycle unit, and finally, failure of Chipilapa field studies to indicateadequate geothermal steam for that development.
The two tables in Appendix B below are reproduced from CEL's revised plan andpresents two versions. The first table, "con recursos CEL," shows the revised plan utilizingonly CEL resources. This plan would produce an effective addition of 299.7 MW ofcapacity net of retirements by the year 2010, at a net present value of costs of $1,505.8million. In the second case, "con generación privada," private power generation is allowedto enter the plan, with amounts of 80 MW in 1995, and 115 MW in 1998. The same totaleffective capacity of 299.7 MW would be added, with the net present value of CEL'sinvestment costs dropping to $1,164.6. In most future years adequate reserve margin aremaintained with only CEL generation, however 1996-7, 2002 and 2006 reserve margins arebelow 10%. Reserve margins under the plan with private participation only fall below 10%in 1996, and thereafter generally exceed 15%. Both plans show that short-term energy needscan be satisfactorily met.
3.3.4 CEL Actions Regarding Private Power Supply
CEL is currently attempting to determine the potential for private generation througha public solicitation to provide an 80 MW unit for operation by January 1995. This appearsto be the most attractive option for CEL, as it would offer an alternative to acquiring 3 gasturbines 1995 (2x37.5 MW) and 1997 (1x37.5 MW). The break-down of near-termrequirement assuming private generation is as follows:
CEL, Plan Complementario del Sistema de Generacion 1993 - 2010, Resumen Ejecutivo, SPDE/26/10/93,14
PLANICEL; pp. 46-47.CEL-Hagler-Bailly.15
60
Rehabilitation of SoyapangoUnits 1 and 3 April 1995Unit 2 July 1995
Rehabilitation of Acajulta58 MW Dec 1995/May 1996
Steam turbine Combined-Cycle32 MW January 1996
Berlin Geothermal 5 MW 199623.7 MW 1997
Private GenerationUnit of 80 MW January 1995Unit of 115 MW January 1998
The latest CEL generation plan (SPDE/26/10/93) indicated that a decision would bereached on whether or not to pursue private generation for the above 80 MW facility byNovember 1993. This schedule appears to now have slipped. The plan does not go intodetail concerning what terms and conditions would be required, nor criteria for pricing. However, it is noted in the report that CEL will require an 80% availability rate, and that thecost must not exceed the objective function of the least-cost plan (assumed here to meanequal to or lower than long-run marginal cost). The failure of the private generationapproach would require CEL to proceed immediately to acquire two 37.5 MW gas turbinesfor 1995, and another 37.5 MW in 1997, plus a 75 MW oil-steam plant in 1998. With orwithout private generation, CEL would continue with rehabilitation of the oil-fired steamunits at Acajutla for December 1995 and May 1996, and acquire a steam turbine for itscombined cycle plant by January 1996. 14
3.4 AVOIDED COST PRICING FOR PRIVATE POWER
A preliminary analysis of marginal costs, and adjustments to them to establishappropriate avoided costs for valuing private power supply, is presented below. The currentsupply plan and forecast considered most likely by CEL and described above is used for thisanalysis, with the avoided cost estimate derived form marginal cost analyses done for CEL inits recent tariff study. 15
3.4.1 Avoided Cost
The main alternatives which have been used in the past in the United States for
61
estimating the price for private power purchases from cogenerators or others are discussedbelow. In principle, the method for determining the price to be paid for privately generatedpower should be simple to use and permit adjustments over time for contingencies whichmight arise such as changing exchange rates, taxes, inflation, etc. In tariff design, theprinciple that rates should reflect marginal cost of supply has been generally accepted aseconomically efficient. This basis should ensure that national economic resources areallocated efficiently within the power sector and when applied to tariffs and combined withnon-distorting adjustment for achieving an appropriate return on rate base, should result in afair allocation of costs among customers according to the costs they impose on the system. Applying the marginal cost principle to purchases from cogenerators leads to a similar result,that is, power supplied is essentially worth the cost "avoided" by the utility.
Avoided costs consist of two parts, an energy component, which is based on theshort-run incremental operation cost of the utility, adjusted for losses; and a capacitycomponent, which is based on the marginal cost of new capacity, also adjusted for losses. The basic objective of avoided cost pricing is to find a fair and readily implementable meansfor determining the value to the utility for additional private generation. While short-runcosts are recognized as the correct economic basis for pricing, they can fluctuate widely fromyear to year. Other bases, such as average short-run costs or long-run marginal cost areoften used to approximate this cost, since they offer a more stable basis.
In order to achieve the least-cost for purchased power, competitive bidding is alsobeing introduced in many countries for acquisition of large blocks of power. In this case,avoided costs may be considered a ceiling, with the utility attempting to purchase eachsuccessive block of power needed at the lowest prices and presumably from the mostefficient producer.
Several factors enter into the valuation of private power and computation of prices tobe paid for it. The most prominent factors are:
C Reliability--to what extent will the power generated be available whenneeded and in the amount needed?
C Energy and capacity value of power--how are the values for kWh's and kW'ssupplied to be determined? What utility costs are displaced by private powersources? Are these merely short-run operating costs (e.g. for cogenerators ofsmall amounts of non-firm power), or do they offset new capital investmentby the utility?
C Balance between incentives to cogenerators and consumer costs.
C Transmission and distribution impacts and line loss differences to beachieved due to the location of the cogeneration capacity in relation to loads,as compared to location of utility capacity.
A variety of approaches have been applied to estimating of avoided costs andestablishing private power prices, including the "Peaker Method", "Average IncrementalCost", "Generation Expansion", "Competitive Bidding" and "Standard Offers". Theseapproaches are briefly discussed in the box below:
62
3.4.2 Application of Avoided Cost Principles inEl Salvador
A number of consideration specific to the case of El Salvador must be considered inestimating avoided costs. These are apart from prospective new electricity policy and law inEl Salvador which the Government is now considering.
3.4.2.1 Investment Funds Shortage and Loan Subsidies.
The existence of loan subsidies to CEL from international donors warrants specialattention. Financial subsidies in terms of grants or below-market interest loans received byCEL tend to lower actual CEL cost. Subsidized sources of finance provide a distorted signalrelative to the cost-effectiveness of private generation, and if used as a basis of comparison,would put private generators at an inappropriate disadvantage. Considering that subsidizedfinancing is always rationed and can be transferred to other public purposes with no loss tothe country, it would appear inappropriate to utilize subsidized financing terms inconsidering the relative benefit of private versus public power supplies.
The current terms of CEL's long-term debt, and in some cases joint debt with CAESSand/or the GOES, is presented below. Total long-term debt amounted to $278.7 million inmajor loans as of November 1993. These consist of loans from the Inter-AmericanDevelopment Bank for $125.9 million, Overseas Economic Cooperation Fund (OECF)$72.9 million and CITIBANK and Eximbank $43.2 million, as well as the World Bank$11.0 million, among others. Terms from major lenders are shown in Table 3.6 below. Costs in the case of OECF funds are clearly heavily subsidized.
63
Avoided Cost Options 1. Peaker Method: In this method short-run marginal operating costs of the utility system areused for valuing energy supplied, and capital costs avoided are assumed to be equal to the annualized costs of a newcombustion turbine or other peaking facility (including O&M, fuel inventory costs). Adjustments for reliability (e.g.required additions to reserve margin) and forced outage adjustment are also normally made. Comment: Thisapproach is convenient and relatively easy to calculate. However, the approach may also underestimate actualavoided cost, as the long-run costs of new baseload generation would normally be higher than a peaking unit. 2. Average Incremental Cost Approach This approach is similar to the peaker method and alsoutilizes the capital and operation cost of an "avoided" unit in the generation mix. However, rather than only use apeaking unit, it would normally use the next expected generation unit in the optimal generation expansion plan, as thebasis for estimated avoided cost payments for the private generator. Differences in reliability of the private generationversus utility power production may be incorporated. Comment: While this method is simple like the peakermethod, it is likely to be more accurate, although still only a rough estimate of avoided cost, in that it does notconsider other system effects or costs based on the planned dispatching of the "avoided" unit, or exact project timing.. 3. Generation Expansion Plan - Differential Revenue Requirements Method This approachrequires the modeling of the system over a substantial period of time, e.g. 25 years, with the development of a least-cost expansion plan for the period. Addition of the private power project into the plan or deletion (or delay) of aplanned additions is used to generate a revised least-cost plan, together with revised fund requirements each year. Differences in the present worth of required revenues due to the private project are the amounts which could be paidthe private generator. Comment: The cost, data intensiveness and time consuming nature of this approach are theprincipal disadvantage. Small increments of capacity such as cogenerated power generation would not normallyjustify such an analysis. 4. Competitive Bidding This approach is meant to approximate the results of a free-market forpower supply. It is based on the utility requesting offers which may differentiate based on type and size of capacity,timing, reliability, and baseload-intermediate-peaking needs. The utility would compute its avoided cost, for example,utilizing the generation expansion method above, to establish a baseline for evaluating proposals. Other factors thanprice would affect the evaluation, including the utilities judgement of the capability of the bidder, fuel type and futurecost of fuels proposed, type of generation and perceived reliability and performance, etc. Comment: This methodwould only work with a substantial number of willing bidders, with the utility committed to purchase and facilitatearrangements once bids are accepted. 5. Standard Offers. Where the size of individual projects is likely to be small, for example, in systemswith sugar industry cogeneration of electricity and steam, or with initial small private projects, another option is the"standard offer". After calculating its avoided cost, the utility prepares a standard offer similar to a power sales tariff. Comment:: This approach avoids costly negotiation and analysis by the private generator, and is likely to beconducive to sales from small-generators. The offer will normally differentiate respectively, between only energypurchases, firm capacity supplied, dispatchable capacity, etc.
CEL, "Reporte Mensual de Operacion del Sistema CEL," Septiembre 1993, pg. 25.16
64
TABLE 3.6: FINANCIAL TERMS OF PAST AND PROSPECTIVE CEL BORROWING
Financing Terms Inter-American Overseas Economic CITIBANK & WorldDevelopment Bank Cooperation Fund Eximbank Bank
Amortization 20 years 20 years 5 - 7 years 15 yearsPeriod 5 years 10 years 6 months 3-5 years Grace Period 7.29% 3.0% LIBOR + 7.8% Interest Rate 0.375%-0.55% 1.0% Inspection &Review Fund 0.75% 1.0% 0.125-0.1875% plus 0.75% Credit 5.06%-6.33% (Flat)Commission orGuarantee
3.4.2.2 Short-term Capacity and Energy Shortages
Another factor affecting the value of cogenerated electricity during the next 3-5 years in El Salvador is the general shortage of energy and capacity. Under ordinarycircumstances, it would be appropriate to determine avoided cost, includingseasonality, time of day, and "firmness" and then to set avoided cost paymentsaccordingly. However, due to a current shortage of energy and capacity, CEL is ableto utilize any additional capacity regardless of the time of year to avoid unservedenergy and more fully achieve reserve criteria. Thus, even if sugar sectorcogeneration were seasonal, and therefore did not provide "firm capacity" all year,the value of this capacity to CEL in the near-term is still equal at a maximum toseasonal and daily peak avoided cost during each period, and at a minimum to thevalue of unserved energy. Furthermore, from a review of the seasonality ofhydroelectric energy and capacity available in El Salvador, it is clear that the dryseason where hydroelectricity is least available, is also the harvest period during whichthe majority of sugar cogeneration would be available. For example, available hydrocapacity using 1993 data on reservoir levels for the two main storage reservoirs in ElSalvador, Guajoyo (Guija) and Cerron Grande, showed that decrease or outflows dueto dry conditions were in December - April, while maximum inflows were in May toOctober-November, that is, outside the cane harvest season.16
In the short-term however, particularly given the relatively small amount ofcogeneration from industrial sources such as the sugar industry, explicit GOES andCEL incentives, such as payment of full-peak season avoided cost for all cogenerationin order to stimulate development of this resource, would appear to be a reasonableoption. In the future, when and if the CEL system can again operate without unservedenergy, and with adequate reserves during all seasons, etc., then seasonality andhourly availability characteristics would become relevant for determining avoided
65
cost payments.
CEL, "Informe Mensual...," pp. 11-18.17
66
3.4.2.3 High-Cost of Marginal Energy Supply
A review of CEL marginal costs showed the high cost of current energy andcapacity shortages. During the period January 1993 to September 1993 for example,CEL suffered from unusual overhaul, unavailability or failure of some or all units ofthe Ahuachapán, Acajutla, Miravalle, and Soyapango facilities. Partly as aconsequence, it was necessary to utilize higher cost diesel at Acajutla and San Miguelthroughout the period, except for September. Costs per kWh for fuel alone averaged0.68 colones/kWh (US $0.077/kWh) for San Miguel and 0.58 colones/kWh (US$0.066/kWh) for Acajutla. As a result, the average cost of fuel for all thermalgeneration was a very high 0.516 colones/kWh (US $ 0.059/kWh). As can be seen aswell in Figure 3.2 and Table 3.7, "Diesel Requirement", the prospective operation for1994 shows that the available capacity from lower cost generation capacity, that is,hydroelectric, geothermal and bunker oil-fired capacity, will be substantially belowrequirements to meet peak demand. Therefore, high cost peaking capacity usingdiesel (Acajutla and San Miguel) will be called upon to meet from a low of 42 MW(8%) of annual seasonal peak demand to a high of 148 MW (28%) when demand isprojected at 523 MW demand. Implied in these figures is a substantial requirementfrom high cost diesel burning facilities. 17
TABLE 3.7: CEL PLAN OF OPERATION - NET AVAILABLE CAPACITY 1994
Month
Jan Feb Mar Apr May Jun Jul Aug Sep Oct Nov DecHydroelectric 369.6 285.3 277.3 266.3 347 302 312 378 378 378 378.6 378.
CEL-RCG/Hagler, Bailly, Inc. "Estudio del Sistema Tarifario del Subsector Electrico, Informe Final",18
Julio 1993.In certain instances generation is added which not only meets peak demand, but also reduces operating19
costs. This is normally the case when one uses the incremental plant or system planning method for avoidedcost analysis.
68
3.5 GENERATION EXPANSION PLAN ANDESTIMATION OF AVOIDED AND LONG-RUN
MARGINAL COST
CEL maintains both short and long-term investment plans and has just completed amajor study of marginal costs and tariffs, which is the primary basis for avoided costcalculations in this section. The analysis provides estimated long-run marginal cost on a18
basis similar to what is normally termed "short-run marginal cost" in other avoided costanalyses. The essential differences are that short-run cost, strictly speaking, refers toresponses which take place solely with existing equipment,so they include no capital costcomponent. "Short-run marginal" costs refer to those incurred in response to an increase indemand which is sustained indefinitely into the future, and to corresponding capitalinvestment for peaking facilities to maintain system reliability given this increaseddemand. "Short-run marginal costs" as defined here for avoided cost analysis purposes19
therefore reflect the optimization of the system not just for a given hour, but for an increasesustained in the future including capital investment requirements. These costs, converted toan amount per kWh, reflect the "life-cycle" concept utilizing the annualized cost for aspecific increment in demand..
3.5.1 Marginal Energy Costs
An analysis of energy costs was undertaken for the entire year, with classificationinto dry and wet seasons respectively, and peak, mid-peak and outside peak periods. This isthe necessary approach both to calculate the average marginal energy cost properly, as wellas to permit seasonal and/or time of day rate making. In the case of analysis of the avoidedcost for small amounts of cogenerated power, to undertake so comprehensive an analysiswould normally not be necessary. However, the availability of this information does permita more refined analysis and allows clarification of an important issue, that is, the relativemarginal cost during the dry and wet seasons.
Marginal energy costs are the cost to supply a marginal or incremental kWh duringeach hour of the year. The generating system is dispatched (additional kWh's generated byadditional plants which are brought into service) in a so-called "merit order", that is, in themanner that always uses the lowest cost source of energy given reliability, maintenance andother constraints. Since the level of demand varies by hour of the day, day of the week andtime of year, the type of plant generating this incremental kWh will also vary. Normally lowoperating cost plants such as hydro, geothermal, and bunker oil fired plants are loaded first,with higher operating cost plants such as gas turbines and diesels units used last. Marginalenergy cost analysis requires an estimate of which plants generate the marginal energyduring each hour of the year, the type, and fuel and variable O&M costs.
It should be noted that for tariff purposes these marginal economic costs are converted into estimated local20
costs by dividing by the standard conversion factor, and are adjusted for unrecovered revenues.
69
Table 3.8 a-d provides basic assumptions used for determining marginal energycosts, and calculations of seasonal and time of day costs for three hydrological conditions(with associated probabilities): normal, low water and high water. The estimate of marginalenergy cost normally involves use of a generation dispatch model of the marginal plants foreach of the three daily periods, and for each season. For simplification, the analysis for CELused two plants, which were found to be the most likely peaking units selected for eachperiod, and based on their estimated percentage of use, calculated the marginal weightedenergy cost (Table 3.8 b-d). Data for representative generation plans and utilization for theyear 1997 is used as a proxy for plant selection. In the table under the normal hydrologiccondition (Table 3.8 b), one can see that peak energy is provided 35% by a large gas turbineand 65% by combined cycle generation. Their respective variable costs, US$0.0722 andUS$0.054 are averaged on a weighted basis using percentages of use, and an average ofUS$0.0604 is calculated. Following the calculation for each of the three hydrologicalconditions, a probability weighted average marginal energy cost by period and season iscalculated below Table 3.8 d. This hydrological probability weighted average is used foravoided cost analysis in Table 3.10. 20
The costs shown in Table 3.8 for various generation options demonstrate thedifferences between the base, intermediate and peaking plants. Baseload hydro plant costsare not shown, as these are nearly zero and not used for meeting peak demand. Peakinghydro also has nearly zero variable costs and is not considered for meeting incrementaldemand as it is always already fully used given the system requirements, and therefore is notone of the options for meeting increases in load. Annual hours of utilization indicate theduty each type is expected to provide. These utilization rates are determined by relativevariable costs (and reliability criteria) as shown in the 5th and next-to-last columns, varyingfrom US$ 0.0979 (fuel costs alone) for the small gas turbine to US$ 0.0024 for geothermalgeneration. The three remaining parts of the table c-d, show the calculation of seasonal anddaily demand period costs. Using the dry season peak period and low water conditions forcomparison, we can see that variable costs reach a high of US$ 0.0735. The lowest variablecosts of US$ 0.0258 are for wet season off-peak and high water condition. This range, US$0.0735 - 0.0258 reflect the significance of using seasonal and daily cost bases to set pricesfor private power.
70
Source: CEL-RCB/Hagler, Bailly Inc. Cuadro 5-3.
71
ICF, Inc. "Costs and Rates Workbook, Part I: Textbook," EPRI, September 1981, pp. 3-5 to 3-36.21
ICF, Inc. "Costs and Rates Workbook, Part I: Textbook," EPRI Rate Design Study, Sept. 1981, pp. 3-27 -22
3-34.
72
3.5.2 Marginal Capacity Cost
Table 3.9 shows the marginal capacity costs for both the "peaker" and incrementalplant methods. Here again the CEL tariff study is the basis for this calculation. The peakermethodology assumes that the incremental capacity during any peak period will be suppliedby the lowest capital and highest operating cost unit, that is, a peaking plant. Theincremental plant method is somewhat more realistic, in that it attempts to utilize the actualplant addition which is expected to be added to meet growth in demand. However, with theincremental plant method, the additional benefit that the plant will also normally displacesome of existing kWh's generated by higher cost plants must be taken into account. Thenormal procedure is to use such fuel savings to reduce the capital charge for this plant(shown below the table).21
The table shows, for example, for the peaker method, basic economic assumptions onplant cost, lifetime, O&M costs, foreign vs. local costs (local costs are adjusted using theIDB's 1992 conversion factor of 0.87 to convert to economic or border prices), andcalculated annualized capital cost. In the case of the incremental plant method, fuel savingsare calculated and subtracted from capital costs. This approximate fuel savings calculationassumes the operation of a combined cycle to replace a large gas turbine for 785 hours peryear, and a large gas turbine replacing a small gas turbine for 212 hours per year.
Costs for the peaker in colones at border (economic) prices is 3,554 colones/kW(US$386/kW), or adjusted for reserve margin and station losses 4,868 colones/kW(US$529/kW) or 652 colones/kW on an annualized basis. The annualized capital cost of acombined-cycle unit, which is the optimal choice using the incremental plant method, 1230colones/kW, less fuel savings of 169 colones/kW, or 1,516 colones/kW. The finalannualized cost including O&M for each is: "Peaker" 782 colones/kW vs."IncrementalPlant" 1,766 colones/kW. While the incremental plant may be a nearer approximation to theactual addition planned, not all of the capacity added is actually strictly for meetingincremental demand. That is, this higher capital cost plant is also added to reduce energycosts for non-incremental sales. On the other hand, the peaking plant is clearly only beingadded to serve the incremental demand. Neither capital cost can be considered better thanthe other, although for reasons of simplicity and cost of analysis, it is more common to usethe peaker method. The peaker method is the one employed here for calculating the22
capacity component of avoided cost.
73
TABLE 3.9A: GENERATION CAPACITY COSTPEAKER AND INCREMENTAL PLANT
(1994 Costs in Colones)
Peaker Incremental PlantMethod Method
Marginal Plant Gas Turbine Combined CycleLife (years) 20 30O&M and A&G (% of capital) 0.0268 0.0184Capital Cost (colones/kW) Foreign 3,010.50 10,023.05 Local Materials 1,115.04 1,237.44Capacity Cost (discounted to study year) Border Price 3,554.09 9,910.38Capital Cost (colones/kW) 4,868.12 13,573.00Capital Cost per Year (colones/kW/yr) 651.74 1,685.00Associated Fuel Savings (colones/kW/yr) -- 168.51Capital Cost Net of Fuel Savings (colones/kW/yr) 651.74 1,516.50O & M Cost per Year (colones/kW/yr) 130.47 249.74Total Capital Cost per Year (colones/kW/yr) 782.20 1,766.24
Generation Type Cost (colones/kWh)--Linked Hrs/Yr Savings/kW
New Original New Originalcc gtl 0.4486 0.5994 785 118.44gtl gts 0.5994 0.8126 212 45.18
Total Fuel Savings = 163.62
Source: Update to Cuadro 5-6, CEL-RCG/Hagler, Bailly, Inc.
3.5.3 Avoided Cost
Table 3.10 is used to calculate avoided cost. The concept of avoided cost includesboth energy and capacity as does marginal cost, however it varies from marginal cost in thatwith avoided costs, we are interested only in costs to the level at which cogenerated powerwill off-set CEL generation. In the case of energy cost by season and time of day,adjustment is made only for average high voltage transmission losses and station losses. Marginal cost on the other hand, normally corresponds to the end user level and wouldinclude distribution, transformation and non-technical losses. In the case of capital costs,adjustment is made to include only peak period high voltage transmission and station losses,
It should be noted that these values reflect an average marginal cost based on a "representative" situation23
estimated based on 1997 plans and dispatch of the system; actual costs vary by year only due to differingloss estimates. All are in 1993 currency terms.
74
and for lack of reserves provided by the cogenerator. This latter adjustment is made toreflect the fact that for any new demand of 1 kW, CEL costs must reflect this 1 kW plusadditional capacity to provide a reserve margin. Thus if an additional 1 kW of cogeneratedcapacity is added, it offsets only a part of 1 kW plus reserve requirement faced by CEL. TheCEL tariff study has used a reserve percentage of 33% or 0.33 kW addition for each 1 kWof new demand.23
The last difference between avoided and marginal costs is that transmission capitalcosts are excluded from avoided costs. These are excluded since it is not realistic to thinkthat addition of small amounts of cogenerated power will actually reduce the need for highvoltage transmission. It is possible however, that additional benefits in substation costs,distribution line loss reduction and quality of service may result from such decentralizedgeneration. An analysis performed by CAESS to estimate these benefits in the cases of theSan Francisco and La Cabaña mills appears in the next section.
The total avoided cost estimates for 1994 in Table 3.10 range from a high in the dryseason during peak hours of US$ 0.0823/kWh to a low for the wet season off-peak of US$0.0480/kWh. Averaging wet season marginal costs using weighting according to base,intermediate and peak hours in each daily period gives a 1994 avoided cost of US$0.0685/kWh. The corresponding average for the dry season is US$ 0.0745/kWh.
Departamento de Planificación, Compañia de Alumbrado Eléctrico de San Salvador, Análisis de24
Cogeneración - Ingenios San Francisco y La Cabaña, Mayo, 1994.
75
TABLE 3.10: CALCULATION OF AVOIDED COSTS(1994 US$'s)
Marginal Energy Cost 0.0668 0.0634 0.0363 0.0677 0.0617 0.0546HV and Station Losses 8.6% 8.6% 8.6% 8.6% 8.6% 8.6%Loss-Adjusted Energy Cost 0.0730 0.0692 0.0396 0.0739 0.0674 0.0596Annual kWh/kW Capacity 7,500 7,500 7,500 7,500 7,500 7,500Short Run Capital Cost/kWh* 0.0115 0.0115 0.0115 0.0115 0.0115 0.0115Peak HV and Station Losses 8.4% 8.4% 8.4% 8.4% 8.4% 8.4%Loss Adjusted Capital Cost 0.0125 0.0125 0.0125 0.0125 0.0125 0.0125Reserve Adjusted Capital Cost** 0.0084 0.0084 0.0084 0.0084 0.0084 0.0084Total Avoided Cost 0.0813 0.0776 0.0480 0.0823 0.0758 0.0680Daily Average for Season US$0.0685/kWh US$0.0745/kWh
* Peaker method (see text.)** Reserve requirement reduction factor = 0.67Reference: Hagler Bailly, Estudio del Sistema Tarifarico del Subsector Eléctrico, Julio, 1993, Cuadros 5-10, 5-11 (HV and HV peak losses) and Cuadro 5-13 (short-run capital costs)
3.6 TRANSMISSION AND DISTRIBUTION SYSTEM IMPACTS
In addition to affecting CEL's future generation cost, purchasing power from sugarmills will also impact the performance and cost of operating and expanding the transmissionand distribution system. Power generated where it is not needed must be transported towhere it is and distributed to users. On the other hand, a mill producing power at a locationwith growing demand and inadequate power line or substation capacity may offer benefitsbeyond the traditional avoided generation cost estimated above.
Two of the mills included in this study, San Francisco and La Cabaña, are served bya power line extending along the northern arterial highway from San Salvador. This line,circuit number 109613 from CAESS' Nejapa substation, now experiences resistance lossesof 935 KW and delivers power to customers at its remote end in the village of Citalá at justover 90 volts. To determine the effect of importing power from the mills, the PlanningDepartment at CAESS used the load flow simulation model MILLSOFT in an analysis offour cases: 1)the present situation, 2)San Francisco exporting 6 MW alone, 3)La Cabañaexporting 5.4 MW alone, 4)and the two mills exporting a total of 6.3 MW.24
As shown in the following table, the effect of the mills supplying about 6 MW to thesystem would be to increase the minimum voltage on the line by 15 volts and to reduce
76
losses by approximately 500 kW, equivalent to eight percent of the amount delivered by themills.
TABLE 3.11: LOAD FLOW SIMULATION RESULTS
CASE MAXIMUM MINIMUM LOSSESVOLTAGE VOLTAGE
1 120.0 V 90.7 V 935 KW2 120.2 V 104.8 V 457 KW3 120.2 V 105.9 V 484 KW4 120.6 V 106.7 V 426 KW
Source: CAESS Planning Department
The analysis goes on to point out that eight kilometers of new three phase line wouldbe needed to connect the mills, and that while the mills could deliver several times thepostulated 6 MW, larger volumes would create excessive voltages in the immediate vicinityin the absence of increased local demand. Thus in order to take full advantage of the 27MW of combined capacity at the mills, CAESS would have to invest in additional linecapacity to transport the power south toward the capital. In this regard, the entire linecurrently serves a load of only 19 MW, so the direction of the current would be reversedsouth of the mills.
The CAESS Planning Department did not go so far as to estimate the investmentrequirements for controlling the losses along the line and bringing minimum voltages up tostandard with and without higher levels of power output from the mills. However, theanalysis does illustrate that the effect of cogeneration on the local transmission anddistribution system can be significant and, in some instances, positive.
77
4.0. ECONOMIC COSTS AND BENEFITS
The preceding two chapters present estimates of cogeneration system performanceand cost at each mill and project the value of power that could be produced by the sugarindustry in the context of CEL's system and cost structure. The purpose of this chapter is tointegrate these supply and demand considerations in an analysis that provides a sense of theprofitability of possible individual cogeneration investments, as well as their collectivepotential contribution to meeting future Salvadoran electric requirements.
4.1. ASSUMPTIONS
For purposes of calculating returns on investment, the value of the energy exportedto CEL is assumed to be US$0.075 per kWh during the dry season from November to Apriland US$0.69 during the remainder of the year when hydropower is more abundant. Thesefigures correspond to the avoided costs in Table 3.10 in the previous chapter, with the dailypeak, mid-peak and off-peak components averaged over time, since the mills' outputs arenearly constant throughout the day. In this analysis, the value of power supplied to CEL isnot expected to change in real terms over the course of any project.
The time-value of money is reflected at a real disount rate of 12 percent per year,which is consistent with the utility avoided cost calculations in the previous chapter. Debtleveraging is ignored for simplicity, and profitability is expressed in terms of total pre-taxreturns on employed assets. Including tax implications of cogeneration investments wouldhave required intimate knowledge of the individual mills' financial circumstances, andcogeneration costs derived without taxes are more nearly comparable to CEL's avoidedcosts, as discussed in the preceeding chapter. The unit cost of bunker oil is US$14 perbarrel, as indicated in Chapter 2, and savings from eliminating present mill electricityconsumption are valued at the same US$0.075 per kWh, since crushing occurs entirelywithin the dry season.
The assumed project economic life is 20 years, based on the predicted longevity ofthe larger items of capital equipment. Although useful for illustration, this duration may notbe reasonable in certain specific circumstances where the mill in question may face anuncertain future for other mechanical or economic reasons. The mills are assumed togenerate steady output while the mill is running (based on individual downtime experience)during the grinding season and at 90 percent availability during the off-season. A high levelof reliability is necessary in order to represent firm capacity to the CEL system. Achievingadequate reliability will require improvements in the operation of some of the mills, but thereduced downtime will benefit them in terms of improved sugar production and lower costs.
The analysis also assumes that higher-pressure boilers and new turbine generatorswould be purchased for the sole purpose of cogenerating electricity. While boilers are themost expensive single items in the systems, they must occasionally be replaced orrefurbished to keep the mill in operation. If a boiler is replaced for other reasons, the addedcost of a higher pressure rating is likely to be small in relation to the total price, making
78
cogeneration more profitable than in the cases presented here. Furthermore, the poweravailable for export could be enhanced as much as two- or threefold by reductions in millprocess steam requirements, which may become cost-effective as a result of access to anattractive market for the power. Ideally, one would design a cogeneration system into anynew mill so as to achieve a a substantially lower incremental capital cost of construction andpossibly with a better optimized overall plant configuration.
4.2. RESULTS
Table 4.1 below presents for each mill the estimated returns on investment for thetwo different cogeneration configurations discussed in Chapter 2. Both utilize all of theavailable bagasse for cogeneration during the crushing season, and they achieve year-roundoperation to make more efficient use of the capital invested in boilers and generators byburning oil as a supplemental fuel while cane is not being processed. Details of theeconomic evaluation appear in Appendix C.
TABLE 4.1: COGENERATION RETURNS ON INVESTMENT(PERCENT PER YEAR)
MILL HIGH PRESSURE LOW PRESSURECentral Izalco 24.06% 20.97%
El Angel 21.71% 18.84%Ingenio Jiboa 21.12% 18.08%
La Cabaña 25.56% 23.39%San Francisco 19.56% 16.93%Cahparrastique 17.80% 15.86%
El Carmen 12.07% 9.77%La Magdalena 11.95% 10.05%
Chanmico 14.37% 12.44%Ahuachapán 0.34% -1.28%
Instead of calculating return on investment for a postulated value of the powergenerated, one can estimate the price at which the power must be sold to yield a real annualreturn equal to twelve percent. Combining prices derived in this way with the powerproduction rates from Chapter 2 allows one to create "supply curves" corresponding to thetwo generation schemes. These appear below, illustrating how much cumulative energycould be supplied by the sugar industry at a given price for purchased power. Note thathigher boiler pressures both reduce the cost of the power and increase the output.
79
FIGURE 4.1: POTENTIAL ELECTRIC SUPPLY FROM SALVADORAN SUGAR MILLS
Winrock International Institute for Agricultural Development, Baling Sugarcane Tops and Leaves: The25
Thai Experience, Washington, D.C.: U.S. Agency for International Development, 91-15, August, 1991, p.xvi.
80
4.3. DISCUSSION
As the graph indicates, six of the mills are able to produce power for US$0.062 orless per kWh at a steam pressure of 600 psi, and for US$0.058 or less per kWh at 900 psi. The potential corresponding annual power sales volumes are 473,000 MWh and 565,000MWh respectively. Three other mills could produce smaller volumes of power atincreasingly higher costs, and the last mill, Ahuachapán, would be unable to produce surpluspower for export during the grinding season and has been excluded from the graph.
Replacing present low-pressure boilers and installing new turbogenerators at the sixpromising mills would entail a capital cost of between US$1.50 and US$2.00 per watt ofcapacity, depending primarily on the size of the facility. Incremental operating costs arenegligible during the four to five month grinding season, when mill boilers are fueled bybagasse. Because year-round operation is necessary to amortize the investment, andseasonal supply is of less value to CEL, the mills will probably need to burn bunker oil orsome other fuel for the remainder of the year.
Other forms of biomass might be suitable as supplemental fuel. Cane trashrepresents a potential fuel supply, approximately equal in volume and heating value to thebagasse generated in sugar production. Although harvesting, storage, and material handlingtechnologies are largely experimental, research is proceeding on improved methods withlower costs in Thailand and the Philippines, for example. A study based on harvesting trialsby Winrock International in 1990 concluded that baled cane trash could be delivered to amill in Thailand at a cost equivalent, in heating value terms, to the price of Bunker Cassumed for this analysis.25
The postulated values of US$0.069 and US$0.075 per kWh are based on thepresumption of no unique costs or benefits corresponding to power transmission anddistribution. Transmission capacity to the north from San Salvador is insufficient to meetdemand in the region surrounding Aguilares and Colima without substantial line losses, andvoltages in Citalá on the border with Honduras are as low as 91 volts. According to thelocal distribution company's load flow analysis summarized at the end of the precedingchapter, power from the San Francisco or La Cabaña mills could increase minimumvoltages, reduce the present high line losses, and help to postpone the need for addedtransmission and substation capacity to supply these northern communities. In fact, the millshave the potential to meet the entire demand served by CAESS circuit 109613 along thenorthern arterial highway and still have power left over to deliver to San Salvador, but thiswould require some investment to upgrade the south end of the line to take full advantage ofthis supply.
81
4.4 CONSIDERATIONS IN THE BUYING ANDSELLING OF COGENERATED ELECTRICITY
It is important for CEL to have an in-depth understanding of pricing and relatedconsiderations to implement avoided cost or competitive bidding for cogeneration, eventhough in the final analysis, the pricing and terms for sale of electricity, and the manner inwhich it is provided, must be a process of negotiation. The following is intended to providebackground information for CEL on the actual process of contracting for the supply ofprivate cogeneration, including risk mitigation and contract issues. The main risks may besummarized as follows:
4.4.1 Seller - Cogenerator
The seller faces four basic types of risks: sales, payment, regulatory and political. Given the large capital investment by the seller, he must be guaranteed that power producedcan be sold. Related to this sale, the amount to be paid must be reasonably certain to beavailable for payment, and the price received must be adequate to cover future costs, even ifthere should be some escalation. The sales of power and purchase arrangements will besubject to some sort of control or regulation. This regulation may involve such areas asgeneral legal authority for power generation and sales, regulation of price terms, foreignexchange control relative to expatriation of profits or loan repayment, quality of service andsafety standards. Future legislation or political considerations can also affect risks for theseller by changing groundrules for cogeneration or changing the conditions under whichforeign investment in general is handled.
4.4.2 Buyer - CEL
The buyer faces three general types of risk. These are purchase risks, maintainingquality and continuity of service, and price risk. The buyer has the obligation to meet theneeds of its customers. The buyer may incur higher costs and other problems if the seller isunable to supply the power contracted. The greater the amount of the power in relation tothe size of the system, the greater the risk. The buyer also assumes some risk that theoperation of the seller may actually cause damage to the buyers electricity system. Pricerisks refer to the potential that the buyer will pay too much, or that it may not be able torecover its purchase costs from its customers. Terms of the contract may be too liberal forexample, locking the buyer into long-term arrangements which foreclose more attractivefuture opportunities, including purchases from other cogenerators.
4.4.3 Power Purchase/Sales Contract
The contract for power sales from the cogenerator will cover a number of specificareas, generally specifying the technical configuration of the plant and specifications; theamount, firmness, dispatchability and seasonal or daily availability of energy and capacity tobe provided; interconnection requirements, including metering, protection equipment andtransformer characteristics; and the contract start-date, length and pricing. Among the mostimportant categories of conditions will be the contract term, frequency and form of payment,sanctions for failure of either party to meet contractual terms, and means to resolve disputes.
82
4.4.3.1 Term of Contract
The term of the contract should be adequate to permit the seller both to recover hisinvestment and to earn a reasonable rate of return. The term should also meet the buyersneed to ensure continuity of service. A term of 10 years is normally considered a minimum,however longer terms are necessary as the investment and useful life of the facility increases. A shorter term, for example, 5-7 years before any changes, might be preferable whencogeneration is initially implemented to allow adjustments in certain terms to be made basedon experience. However, this shorter term should not unduly prejudice the position of theseller.
4.4.3.2 Form of Payment
Fixing payment terms in US dollars, or some equivalent currency, paid monthlyappears to be appropriate, although alternatively payment might be in colones at theprevailing free-market exchange rate, provided conversion and repatriation is guaranteed. This is to account for the fact that much of the cost of cogenerated power is amortization ofcapital expended for imported equipment, and loans may be denominated in foreigncurrency. Agreement on how to measure the quantity of power sold and specifically howenergy and capacity loses are to be recorded and taken into account is very important. Sanctions for late payment are appropriate.
4.4.3.3 Determining Prices
Assuming the use of calculated avoided costs as a basis for pricing, there must be anaccord on the methodology used, assumptions for projections. Prices may be set to providefor seasonal and/or time of day marginal cost differences. Although the complexity ofperforming seasonal pricing and the disincentive for cogenerators in the first stage ofimplementing a new program, should be weighed against the potential efficiency benefits. While a fixed set of prices in the contract is possible, it is likely to be more realistic to allowadjustments for factors beyond the sellers control, in order to permit adjustment ifassumptions in the estimated investment financial analysis change over time. For example,if the cogenerator is using oil as a supplemental fuel for out-of-season generation, theninternational oil price fluctuations should reasonably be incorporated as a variable, as mightlocal labor and tax rates, etc.
Similarly to seasonal or time of day pricing, separate payment for the value of firmcapacity are possible. This involves separating purchase prices into two elements, one forenergy or variable cost, and the other for the cost of new capacity (which would otherwiseneed to be added by CEL) to meet demand. Separately dealing with whether cogenerationcapacity is firm, that is, available at peak, may be particularly important where privategeneration is large, and where it substantially affects the reliability of the system. In the casewhere there are only small amounts of cogeneration capacity however, capacity paymentswhile not inappropriate, may discourage cogenerators unnecessarily. This is the case wherethe firmness of the capacity has little affect on the reliability of the utility, for example,where large quantities of hydro and hydro storage is available, when the cogeneration is ofvery small-size in relation to the system, or when the number of cogenerators is large(increasing group availability probabilities over individual probabilities).
83
4.4.3.4 Competitive Bidding
While avoided costs are an appropriate benchmark, and we believe an appropriatebasis for initial cogeneration contracts, it would normally be more financially advantageousfor CEL to use competitive bidding for large purchases. It would not appear reasonablehowever, in the short-term when no clear competitive market exists for cogeneration, toexpect competitive bidding either to encourage generation to be offered or to influence priceterms significantly.
In the sugar industry, as well as other enterprises, ancillary power generation is notlikely to be a major factor in the near-term in overall profitability. Significant investment inadditional power generation capacity on the other hand, would increase financial risks, alteroperations, and increase the complexity and possible outside interference in production. Furthermore, the private sector in El Salvador appears hesitant about contractualarrangements with government and CEL, and could not be expected to be aggressive inbringing cogeneration on-line without a distinctly positive environment. The secondary andpotentially significant additional benefits of decentralized generation in El Salvador, that is,reduction of distribution system losses and investment requirements and improved powerquality, are also likely to be difficult for the private generators to quantify and properlyreflect in their bidding.