Page 1
Contents:
1. Energy Fundamentals, Energy Use in an
Industrial Society
2. The Fossil Fuels, Heat Engines
3. Heat Engines
4. Renewable Energy Sources
5. Nuclear Energy
6. Energy Conservation
7. Air Pollution
8. Global Effects
Text Book : Energy and the Environment (2nd Edition)
by Robert A. Ristinen & Jack J. Kraushaar
Page 3
1. Spaceship Earth
It’s only in recent decades that there
has been widespread awareness
that our atmosphere and oceans can
no longer be considered as infinite.
The rate of dumping wastes has
increased with increasing population
and the expanding technical base for
our way of life.
There is now clear evidence that we
are seriously polluting the one
atmosphere that we have.
The sources of atmospheric pollution
are many and have far-reaching
results. The solution to pollution is dilution!
Page 4
2. The Earth’s Atmosphere
Some numbers:
• Weight: 5.7x10¹⁵ tons, one-millionth the weight of the earth.
• Area: 200 million square miles.
• Thickness: hundreds of miles. Half of the air is below 18,000 feet
altitude above see level.
• Density at sea level: 1.3 kg/m3.
• Pressure at sea level: 14.7 lb/in2 (1.01x10⁵ N/m2)
The density and the corresponding pressure, gradually decrease with altitude.
By 50,000 feet the pressure has been reduced to 1.6 lb/in2, and by 600 miles
altitude the atmospheric pressure is essentially zero.
Page 5
Figure 9.1 The temperature of the atmosphere as a
function of altitude. The arrows indicate the normal range
of temperature variation and the dots the extreme values.
The names given to the various regions of the
atmosphere are shown on the right.
• affects us most
directly and with
which we are mainly
concerned.
• extends to 7 km at
the poles and 17 km
at the equator.
• In the Greek word
trope, meaning turn
or overturn.
350–800 km
80–85 km
50 - 55 km
Page 6
Table 9.1 Major Permanent Constituents of the Atmosphere.
In addition to these permanent gases, there are a number of others, such
as water vapor, carbon dioxide, methane, carbon monoxide, ozone and
ammonia, that fluctuate with time, altitude, and location.
Water vapor: < 1% - 3%
Page 7
3. Thermal Inversions
• Normally a negative temperature
gradient exists near the earth,
and this has important
consequence for the dispersal of
pollutants.
• A parcel of warm polluted air
released into the lower levels of
the atmosphere under normal
meteorological conditions, it will
rise in the atmosphere to as
much as 10,000 meters.
• However, not all meteorological
conditions are conducive to this
upward motion of the warmed
polluted air.
What is the purpose of the tall smokestacks we see at coal-burning power plants?
Page 8
The generally prevalent temperature-altitude relationship in the lower
atmosphere is known as the adiabatic lapse rate (ALR, 绝热递降速率).
adiabatic: no heat energy is either gained or lost by some defined volume of gas
lapse: temperature decreases with increasing altitude
If a given parcel of air, warmer than its surroundings, starts to rise in the
atmosphere, and if it can be considered to do without exchanging heat energy
with the neighboring air, it will expand and cool at the adiabatic lapse rate.
An approximate average ALR is -0.65 oC/100m or -3 oF/1000feet.
The ALR, in simple terms, is the rate at which the temperature of a volume of air
will naturally tend to decrease as altitude increase, or increase as altitude
decreases.
Page 9
Scenario 1
If the atmospheric temperature decreases more rapidly with altitude than
ALR because of unusual meteorological circumstances, then any parcel of
air released near ground level and warmer than its surroundings will rise
indefinitely into the upper atmosphere.
This is because as it cools at the ALR, it will always be warmer, and thereby
less dense, than the surrounding air.
This unstable condition is obviously desirable because it leads to good
vertical mixing and a relatively pollution-free lower atmosphere.
Page 10
Scenario 2
If the atmospheric temperature decreases more slowly with altitude than
indicated by the ALR, a volume of warm air released near ground level will
rise in the ambient cooler air, cooling at the ALR as it rise, until at some level
it is no longer warmer than its surroundings, at which point it will then cease
to rise.
Scenario 3
If the existing temperature profile and the ALR happen to be the same, there
will be a neutral condition that neither forces the warm air upward nor traps it
near the earth.
Page 11
Scenario 4
An extreme condition exists when the air temperature actually increases
with altitude. This corresponds to a very stable condition where any polluted
warm air released near the ground will be trapped and not vertically
dispersed. This condition is known as a thermal inversion.
There are several causes for thermal inversions, and their duration varies
from a few hours to many days.
Their occurrence in cities such as Los Angeles, Denver, and Mexico City is a
major contributor to the air pollution problems of those cities.
Page 12
Figure 9.2 Some possible temperature profiles in the lower atmosphere. The
region to the left of the adiabatic lapse rate is unstable and will lead to appreciable
vertical mixing of polluted air released near the ground. The region to the right
represents stable conditions and air stagnation.
Page 13
One of the most notable incidents of a thermal
inversion occurred in London, England, on
December 5, 1952. A thermal inversion developed,
enveloping the city in fog with essentially no vertical
movement of air higher than 150 feet.
The sulfur dioxides and particulates from burning
coal, in addition to the other pollutants of a large city,
accumulated for four days.
During the four days, an estimated
4000 deaths occurred beyond those
normally experienced for a four-day
period.
Two similar episodes also occurred in
London in 1956 and 1962.
This type of smog is now known as
classic smog.
All major air pollution incidents that have lead to
documented elevated levels of human mortality have
occurred during period of thermal inversions.
Page 14
Many courses of thermal inversions are now well
understood, and their occurrence can usually be
predicted by meteorologists.
One such cause is a high pressure subsidence.
When a high pressure region of the atmosphere
subsides, or moves downward toward the earth
where the pressure is greater, the air mass will be
compressed and its temperature will rise.
This relatively dense warm air then will continue
to move toward the earth until it meets the higher
density air near the surface.
It was this kind of inversion that caused the
problems in London in 1952.
A high pressure mass of air
subsides toward the earth and
it compressed and heated in
the process, causing a thermal
inversion layer some distance
above the ground.
Page 15
Another type of inversion called a radiative
thermal inversion is much more frequent but
less troublesome.
On a clear night, the earth’s surface radiates
thermal energy into space, thus cooling both
the surface and the air near the surface.
After a night of cooling, the air near the surface
will be cooler the next morning than the air
above it, and a thermal inversion will result.
As the morning progressed, the sun will warm
the surface of the ground and the lower
atmosphere, and the thermal inversion will
disappear by mid-afternoon.
Such radiative inversion are almost a daily
occurrence in Denver and similarly situated
cities.
Because of radiative cooling
during the night, the air near the
ground surface is cooler than the
air above it.
Page 16
Two global air circulation patterns
meet at about the latitude of Los
Angeles, sending air down toward
the earth. This air is warmed by
compression and forms a lasting
thermal inversion.
The San Gabriel Mountains to the
east of Los Angeles act to deter
winds that would help to move the
air from this area.
It would be tempting to blame air pollution on
the weather, but that would be self-defeating.
The real culprit is us.
Next, we will learn what the main pollutants
are and how they come about.
Page 17
4. Carbon Monoxide
Most of our serious air pollution is produced either directly or indirectly by
the combustion of fuels.
Incomplete combustion of carbon leads to the formation of carbon
monoxide:
2C + O2 → 2CO
A prime source of CO is the gasoline-fueled, spark-ignited internal
combustion engine, where the burning of gasoline takes place at high
pressure and temperature but not in an over-abundance of oxygen.
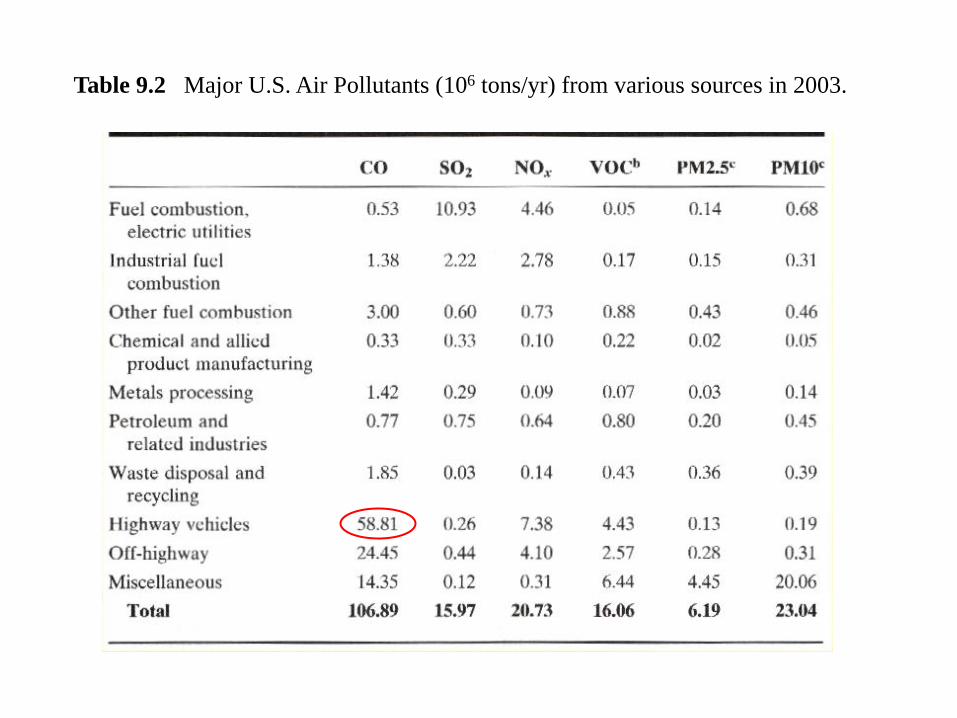
Motor vehicles account for more than 50% of the carbon monoxides.
In Los Angeles County, there are over 3 million cars and more than 8000
tons of CO emitted every day from internal combustion engines ( about 5
pounds per vehicle per day).
Page 18
Table 9.2 Major U.S. Air Pollutants (106 tons/yr) from various sources in 2003.
Page 19
CO is a colorless, odorless gas that is toxic at high concentrations.
Its toxicity stems mainly from its ability to form a stable compound with
hemoglobin (血红蛋白) called carboxyhemoglobin. CO has an affinity for
hemoglobin 200 times more than that of O2. CO tends to block the normal
distribution of oxygen in the body and leads eventually to suffocation.
The effect of CO on people is a function of concentration and duration of
exposure.
• 100 ppm for 10 hours — headaches and reduced ability to think clearly
• 300 ppm for 10 hours — nausea and possibly loss of consciousness
• 600 ppm for 10 hours — death can result
• 1000 ppm — unconsciousness occurs in 1hr and death in 4 hrs.
Page 20
Table 9.3 U.S. National Ambient Air Quality Standards
a Not to be exceeded more than once a year.
Page 21
Example:
If carbon monoxide is present in air at a concentration of 1 ppm, how many
CO molecules are there in 1m3, and what is the mass of CO in 1 m3?
Solution
Air at standard temperature ,and pressure (STP, 0oC and 1 atm ) has
Avogadro’s number (6.02x10²³) of molecules per mole, which occupies
22.4 liters or 0.0224 m3. Therefore the molecular density of air is
6.02x10²³ molecules / 0.0224 m3 = 2.69x1025 molecules/m3
At 1 ppm of CO, there are in 1 m3 of air
(1x10-6)x(2.69x1025) = 2.69x10¹⁹ molecules CO
Since CO has a molecular weight of 28, the corresponding mass density is
(2.69x1019)x(28 / 6.02x1023)x103 = 1.25 mg/m3
Page 22
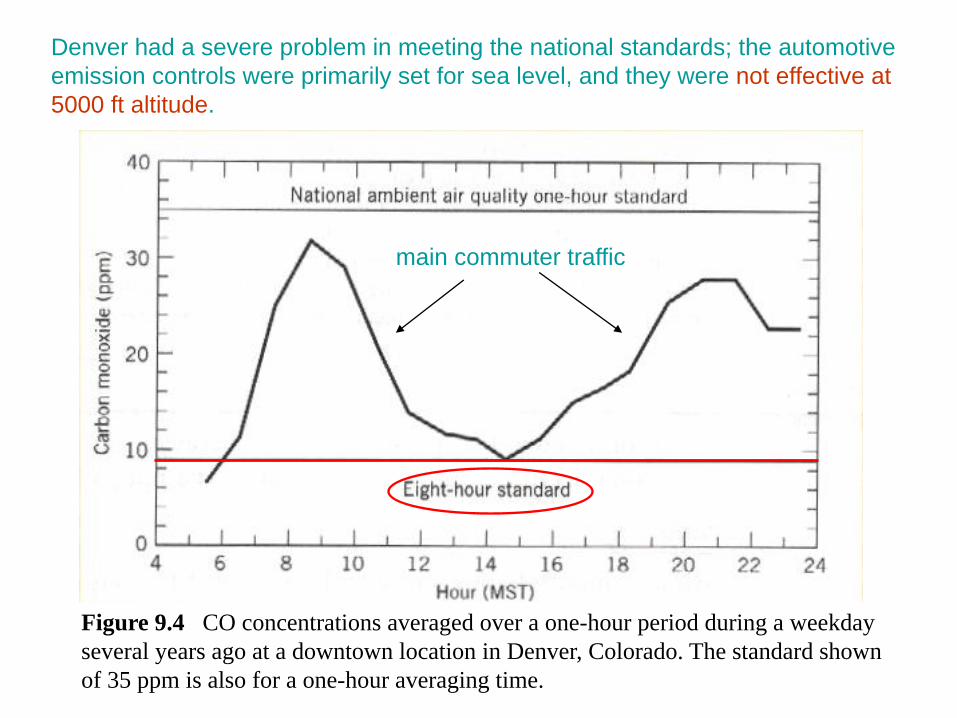
Figure 9.4 CO concentrations averaged over a one-hour period during a weekday
several years ago at a downtown location in Denver, Colorado. The standard shown
of 35 ppm is also for a one-hour averaging time.
main commuter traffic
Denver had a severe problem in meeting the national standards; the automotive
emission controls were primarily set for sea level, and they were not effective at
5000 ft altitude.
Page 23
Figure 9.5 The second 8-hour maximum concentration of CO observed each year
in Denver from 1970 to 2004. There have been no violations of the NAAQS carbon
monoxide standard for the past decade, owing to the success of air quality control
programs.
Since 1975, the State of Colorado has mandated the use of oxygenated
gasoline during the winter months. There have been technical improvements
in automobile engines, public transportation has been improved, and controls
on fixed-source emissions have been strengthened.
Page 24
5. The Oxides of Nitrogen
If a nitrogen-oxygen mixture such as air is heated to over 1100oC, the
nitrogen and oxygen will combine to form nitrogen oxide (NO, NO2).
The reaction that forms NO does not depend directly on the fuel used.
The vital ingredients are only the nitrogen, the oxygen, and the high
temperature.
The exhaust of an internal combustion engine running at high speed with
out emission controls will contain about 4000 ppm of NO. The exhaust of
a coal-fired steam generator will have 200 to 1200 ppm of NO.
NO is a colorless gas, toxic in high concentrations, but its toxicity is
generally considered to be minor compared to NO2.
NO2 is also produced when NO reacts with O3.
NO2 is reddish-brown gas that accounts for the brownish color of the
familiar smog in cities.
Page 25
Table 9.2 Major U.S. Air Pollutants (106 tons/yr) from various sources in 2003.
Page 26
The effect of NO2 on people:
• 0.5 ppm — can be smelled
• 5 ppm — begin to affect the respiratory system
• 20 - 50 ppm — strong odor, one’s eyes become irritated, damage to the
lungs, liver and heart
• 150 ppm with 3 – 8 hour exposure — serious lung problems can occur
The U.S. National Air Quality Standard is 0.053 ppm annual arithmetic mean.
In a city as Los Angeles, about 750 tons of NOx (NO + NO2) are put into the
atmospheric every day, about 500 tons form internal combustion engines
and 250 tons from electric power plants.
Page 27
The major effects of the nitrogen oxides are indirect.
In the presence of water vapor in the atmosphere, they are partially
converted to HNO3, which can cause acid rain.
Nitrogen oxides also play important role in photochemical reactions and
the formation of smog through following reaction:
NO2 + sunlight → NO + O (origin of the reddish-brown color of NO2)
O + O2 → O3
O3 + NO → NO2 + O2
More ingredients are needed to fully explain the formation of
photochemical smog, for example, hydrocarbons.
Page 28
6. Hydrocarbon Emissions and Photochemical Smog
• In about 1943, people in Los Angeles began
to experience a new kind of air pollution.
• After an intensive period of research, in the
early 1950s, A. J. Haagen-Smit and his
colleagues first arrived at an understanding
of the basic processes that were responsible.
• The basic ingredients of what is now called
photochemical smog are sunlight, NO2, and
hydrocarbons.
• In a study of the Los Angeles air, 56 different
species of gaseous hydrocarbons were
identified, but apparently the number
observed is limited only by the sensitivity of
the analytical techniques used.
Arie Jan Haagen-Smit (1900-1977)
Professor at Caltech. He was a
Dutch Chemist. He is best known
for linking the smog in Southern
Califonia to automobiles and is
therefore known by many as the
"father" of air pollution control.
Page 29
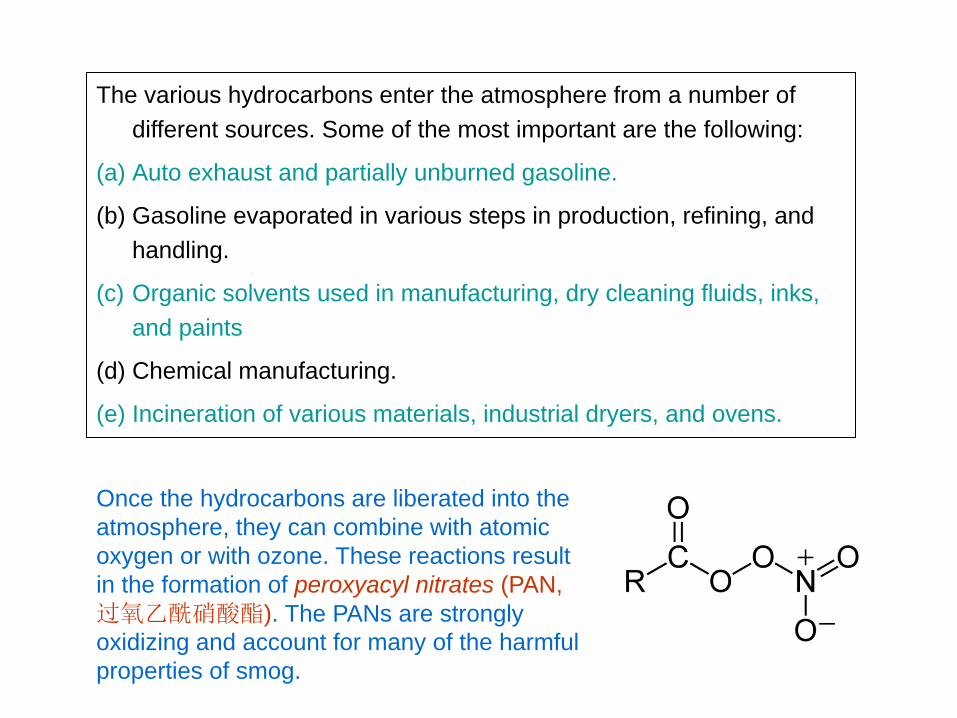
The various hydrocarbons enter the atmosphere from a number of
different sources. Some of the most important are the following:
(a) Auto exhaust and partially unburned gasoline.
(b) Gasoline evaporated in various steps in production, refining, and
handling.
(c) Organic solvents used in manufacturing, dry cleaning fluids, inks,
and paints
(d) Chemical manufacturing.
(e) Incineration of various materials, industrial dryers, and ovens.
Once the hydrocarbons are liberated into the
atmosphere, they can combine with atomic
oxygen or with ozone. These reactions result
in the formation of peroxyacyl nitrates (PAN,
过氧乙酰硝酸酯). The PANs are strongly
oxidizing and account for many of the harmful
properties of smog.
Page 30
Figure 9.6 Concentrations of total hydrocarbon (HC), nitrogen oxides (NO
and NO2), and ozone (O3) measured at a downtown location in Los Angeles for
different hours of the day.
sunlight
commuter traffic
The measure of the intensity of photochemical smog is the total oxidant
concentration. The standards relate to ozone. The ozone standard now calls
for 0.12 ppm (245 mg/m3), based on 1-hour average, not be exceeded more
than once a year.
Page 31
Harmful effects of photochemical smog:
• PANs and aromatic olefins, aldehyde, formaldehyde can cause eye
irritation
• Ozone can cause odor at 20 ppb. Single exposures of a few hours to
ozone in the range of 80 to 400 ppb have noticeable effects even on
young people.
• Chronic sinus trouble, hayfever (花粉热), bronchitis (支气管炎),
asthma, and other respiratory problems grow worse in severe
photochemical smog.
• Two types of plant disease, smog injury and grape stipple (or weather
fleck), are related to photochemical smog.
• The deterioration of materials exposed to
photochemical smog is another serious
effect of smog, such as the cracking and
disintegration of stretched rubber.
Page 32
7. Reduction of Vehicle Emissions
Table 9.4 U.S. Emissions, 2001
Over most of the years of our petroleum-powered transportation system, the
internal combustion engine, and hence the automobile, has been the main
source of CO, NOx, and hydrocarbons in many cities.
Page 33
Improvements in vehicle emission control:
The older cars were quite inefficient because there was no accurate control
of fuel-air mixtures or ignition timing.
These functions are now all controlled by inexpensive microprocessors that
sense the engine’s performance constantly and make adjustments as
needed to ensure high efficiency and low emissions.
The gasoline tanks, carburetors (化油器), and engine crankcases (曲轴箱) of
older cars were vented directly to the atmosphere so that fumes were
continuously released by evaporation.
In the cars made in recent decades, carburetors have been replaced by fuel-
injection systems, gasoline tanks are sealed against release of fumes, and
crankcase fumes are recirculated back into the engine.
The most widely used device is the catalytic converter installed on the
exhaust pipe under the car. This device caused the NO in exhaust gas to be
converted into harmless N2 and O2.
Page 34
For a 50-year period, from about 1923 to 1974, lead compounds were used
as an anti-knock additive (抗爆剂) in gasoline (more than 2 gram per gallon)
to increase the octane rating of the fuel and thereby decrease the tendency
for preignition in high-compression engines.
By the 1970’s, automobile exhaust was responsible for about 90% of the
airborne lead in United States.
Lead compounds in gasoline can also poison the platinum catalyst in the
converter used to convert NO into N2 and O2.
Since 1974, the sale of lead-containing fuels has been greatly restricted by
regulations put into effect by EPA. Leaded fuels were banned entirely starting
in January 1996.
Lead emissions from highway vehicles have now been essentially eliminated.
This is one of the great success? stories in environmental science and policy.
Page 35
Figure 9.8 Lead emissions into the environment from highway vehicles in
the United States. From 1970 to 1994 these emissions were reduced from
200,000 tons/year to less than 2,000 tons/year. By 1997 they essentially down
to zero.
Page 36
8. Sulfur Dioxide in the Atmosphere
• When fossil fuel is burned, the various sulfur compounds in the fuel are
converted to SO2, a colorless and nonflammable gas.
• The largest SO2 sources are stationary, particularly coal- and oil-
burning electric power plants and the metal smelting industries.
• The sulfur content of coal and petroleum varies widely, but it is
generally in the range of one-half percent to a few percent by weight.
• About one-third of the sulfur compounds in the atmosphere come from
man-made sources, about 93% in the Northern Hemisphere.
• It is estimated that the total SO2 in the atmosphere is about 11 million
tons. The U.S. contribution of man-made SO2 is about 16 million tons
every year.
• Dry deposition, precipitation, and plant uptake are the principal removal
processes of SO2 in the atmosphere.
Page 37
Environmental effects of SO2
• When SO2 enters the atmosphere, it is oxidized to sulfur trioxide, SO3, in a
relatively short time (a few days), and the SO3 can then combine with
moisture to form H2SO4 (sulfuric acid) or sulfate salts.
• It is difficult to separate the effects of SO2 from those of H2SO4 that results
from SO2.
• Concentrations of 0.01 ppm for a year, ranging to concentration of a few
ppm for 30 seconds, are thought to affect the health of people, particularly
through the respiratory and cardiovascular (心血管) systems.
• Building materials such as marble and limestone(石灰石) are severely
affected by sulfur dioxide because the carbonates present are, to exchanged
for sulfates originating from SO2.
• The oxides coatings on materials partially lose their ability to protect the
metal in an environment of SO2 and moisture.
• Various crops and trees suffer appreciable damage to their leaves and
internal cells at exposures of 0.01 for 1 year and 1 ppm for 1 hour.
Page 38
Reduction of SO2 Emissions
• Burning coal with less sulfur content: There is a vast amount of low-
sulfur coal (0 to 1%) in the U.S., 90% of it in the West (subbituminous not
anthracite, transportation expense).
• Removing the sulfur before burning the coal: With high sulfur coals,
iron sulfide, FeS2, is the most prevalent sulfur compounds. It is possible
to remove most of the FeS2 by crushing the coal to a fine powder,
washing it with water, and taking advantage of the density of FeS2, which
is about four times more dense than pure coal.
• Removing the SO2 from the stack gases (hot research area): One of
the most common processes causes the SO2 to combine chemically in
flue gas scrubber with an alkaline substance such as limestone to form
CaSO4.
Page 39
9. Particulates as Pollutants
• The airborne particulates can be solids or liquids, and, as such, they
can have a certain size as well as a chemical composition.
• There are a number of natural sources of particulates, such as salt
from ocean spray, dust from fields, volcanic ash, and forest fires.
Worldwide, the natural produce about 14 times as much as
particulates as are produced from man-made sources.
• Man-made particulates are often emitted in areas where the
population density is high. Sources to man-made particulates include
coal combustion, transportation, iron and steel mill, cement
manufacturing, and the burning of wood and other materials.
Page 40
Global Distribution of Atmospheric Particulates
Primary Source
Page 41
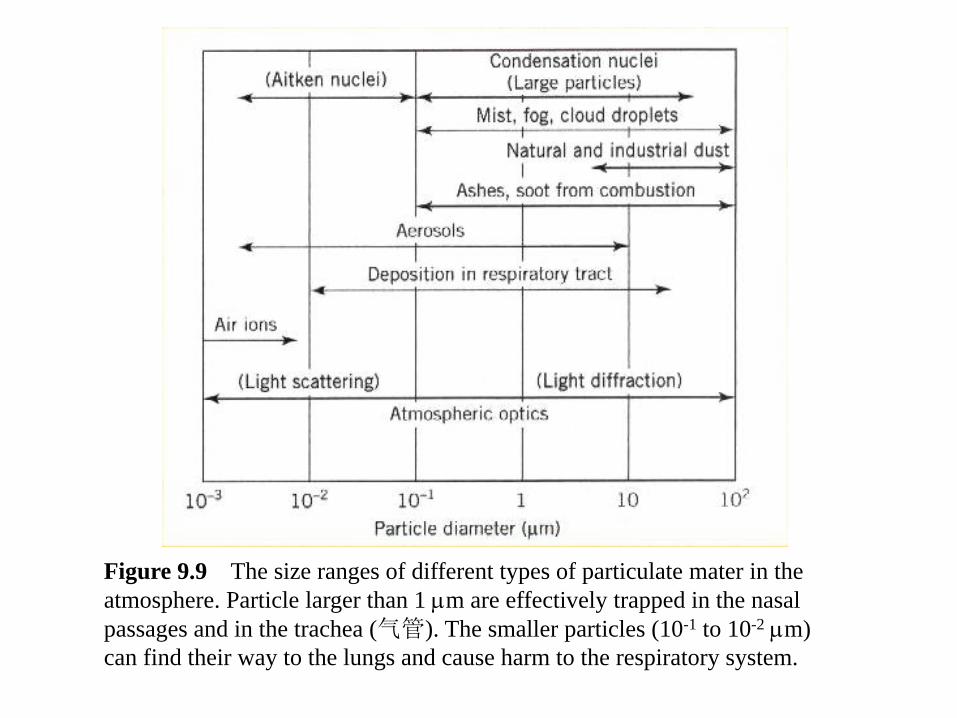
Figure 9.9 The size ranges of different types of particulate mater in the
atmosphere. Particle larger than 1 mm are effectively trapped in the nasal
passages and in the trachea (气管). The smaller particles (10-1 to 10-2 mm)
can find their way to the lungs and cause harm to the respiratory system.
Page 42
Health and Environmental Effects
• One of the main threats to health presented by particulates results
from their deposition in the lungs.
• The particles reaching the inner lung can directly interfere with the
respiratory system, or the particles may be toxic or carry a toxic
substance with them.
• Lung cancer is a know occupational hazard for chimney sweeps and
coal miners.
• High concentration particulates can reduce the visibility and enhance
fog formation.
• Corrosion of metals and degradation of other materials are caused by
the deposition of particles that have sulfuric acid and other corrosive
liquids.
Page 43
Effects on Regional and Global Climate
Direct effect: Particulates in the atmosphere can scatter and absorb an
appreciable amount of sunlight.
• It is known that the volcanic ash put into the atmosphere by the
eruption of Tambora in the Dutch East Indies in 1815 resulted in a
general lowering of the global temperature for several years afterward.
• On a more local level, cities now receive about 20% less sunlight than
do areas with less industry and fewer power plants.
Indirect Effect: Particulates can act as cloud nuclei to influence the cloud
formation.
Natural processes to remove the particulates include gravity (only
works for large particles with a radius greater than 20 microns) and
wet deposition
The natural residence time for particle in the atmosphere ranges from
days to years.
Page 44
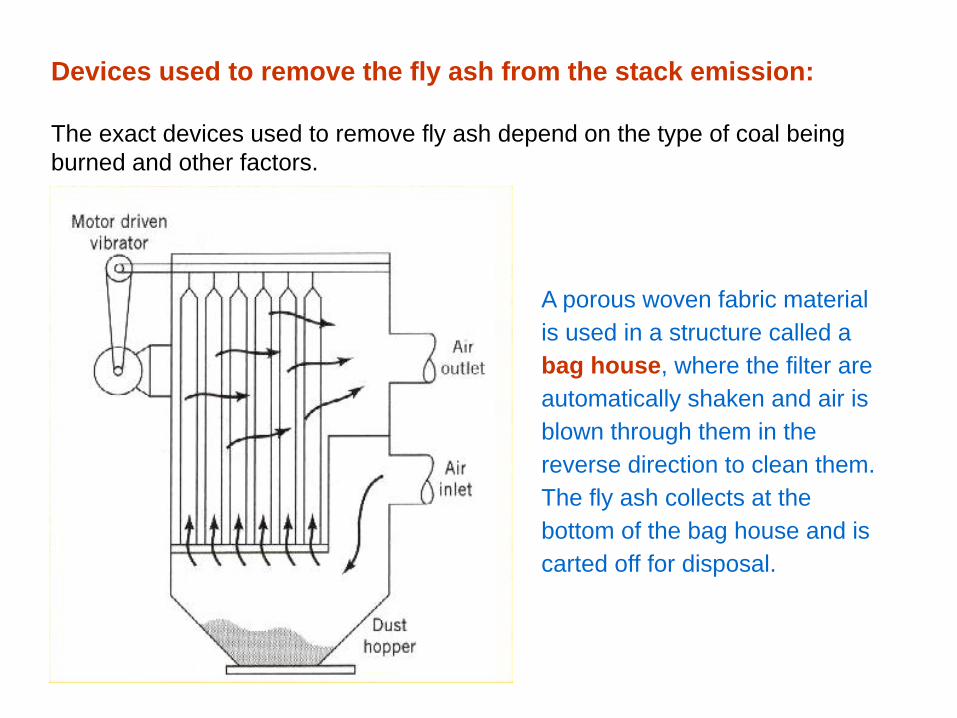
Devices used to remove the fly ash from the stack emission:
The exact devices used to remove fly ash depend on the type of coal being
burned and other factors.
A porous woven fabric material
is used in a structure called a
bag house, where the filter are
automatically shaken and air is
blown through them in the
reverse direction to clean them.
The fly ash collects at the
bottom of the bag house and is
carted off for disposal.
Page 45
Electrostatic precipitator
Page 46
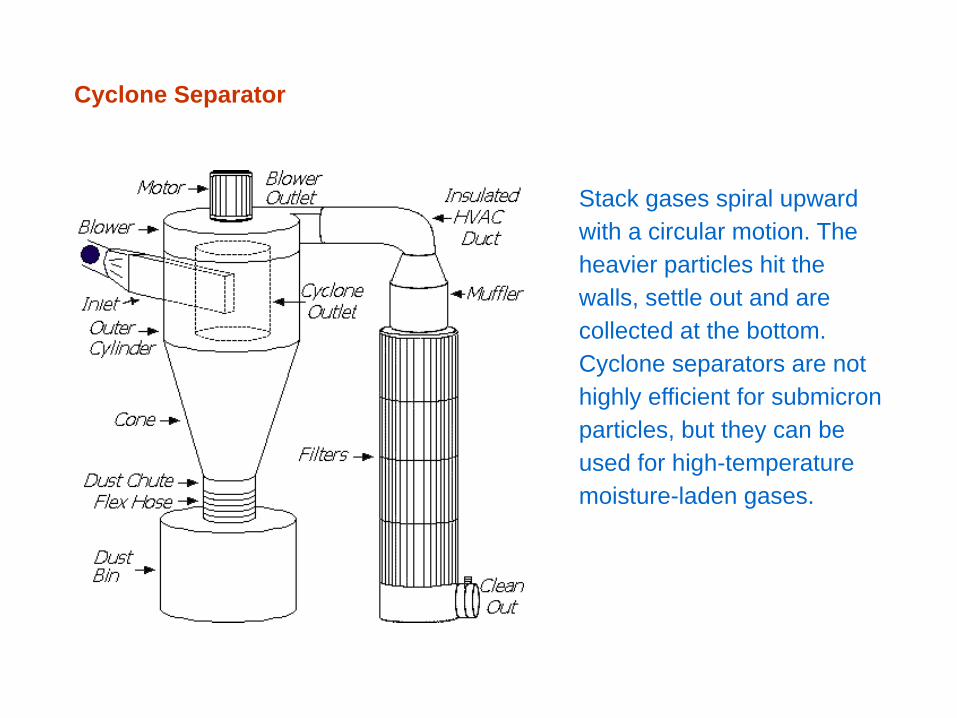
Cyclone Separator
Stack gases spiral upward
with a circular motion. The
heavier particles hit the
walls, settle out and are
collected at the bottom.
Cyclone separators are not
highly efficient for submicron
particles, but they can be
used for high-temperature
moisture-laden gases.
Page 47
Wet Scrubber: A family of devices which remove particles by having
them come into contact with water.
Page 48
10. Acid Rain
• The formation of acids, primarily sulfuric acid and nitric acid, from
sulfur oxides and nitrogen oxides and the resulting damage caused by
the acidic rain formed is a story of growing importance and interest.
• In terms of global atmospheric problems, many regard the overall
ramifications of the acid rain problem second only to carbon dioxide
and the greenhouse effect.
• Boundaries between states and countries are in no way barriers to the
flow of pollutants that travel many hundreds and even thousands of
miles before returning to the earth as acid rain.
Page 49
Review of the definition of pH as a measurement of acidity:
The pH scale ranges from 0 to 14, with the midpoint, 7.0, taken as the
neutral (neither acid nor alkaline) point.
Values less than 7.0 represent an excess of hydrogen ions (protons), and
hence, acidity.
Values or pH above 7 represent alkaline (or basic) soils or liquids.
The pH scale is logarithmic. Hence a change of 1 point on the pH scale
corresponds to changes by a factor of 10 in the excess H+ concentration.
Page 50
Pure rainwater has a pH of around 5.6, somewhat lower than the pH of
7 for a neutral solution. This slight acidity comes about mainly from the
formation of carbonic acid (H2CO3) from the CO2 in the atmosphere.
The problem of acid rain arises because of the further reduction in the
pH by acids formed from the sulfur oxides and nitrogen oxides that
originate primarily from fossil fuel burning, smelters, and other industrial
processes.
The name acid rain is somewhat a misnomer because 10 to 20% and
at times more than 50% of the acidity comes from the dry deposition of
particles. The dry deposition of acid is just as harmful as acids brought
to the surface by precipitation.
Page 51
Since 1950s, a general
increase in the acidity of
rain and snow has been
documented particularly in
Western Europe and the
northeastern section of
North America.
These increases appear to
be directly related to
increased emission of sulfur
and nitrogen oxides. Sulfur
dioxide is associated with
about 70% of the hydrogen
ion concentration.
Figure 9.12 Approximate pH values measured in
the spring of the year on the surface waters of
various regions of the U.S. and Canada.
4.5
Page 52
Impacts on the ecosystem:
After acid rain is received, its effects on the ecosystem depend on the type of
soil and rock. A limestone rock base in the soil or water can largely neutralize
the acidity. If the bedrock is granite (麻岩) or quartz sandstone (石英岩),
there is little buffering action since the water contain few dissolved minerals.
Effects on the reproduction process of fish are among the first consequences
of a lowering pH level. The newly hatched fish, fish fry, will generally not
survive a pH level in the region of 4.5 to 5.0, or if they do survive they are
often deformed.
Another effect of lower than normal pH is the release of aluminum from the
soil surrounding a lake, leading to clogging of fish gills and gradual
suffocation.
Aquatic plants are also adversely affected by acidity. Eventually, after the fish
and plant life of a lake have disappeared because of the increase of acidity,
the lake can only support a thick mat of algae(藻), moss(藓), or fungus(真菌)
at the bottom of the lake.
Page 53
Acid rain also damages forests, especially those at higher
elevations. It robs the soil of essential nutrients and releases
aluminum in the soil, which makes it hard for trees to take up
water. Trees' leaves and needles are also harmed by acids.
Jizera Mountain, Czech Republic
Page 55
• So far, we discussed the major air pollutants and their environmental
impacts mostly in a regional scale.
• In this chapter, we will deal with two examples of our influence on the
global atmosphere and climate
• The first example, the depletion of ozone in the stratosphere, is well
documented and corrective action is underway. What is surprising about
the ozone problem is that the release of relatively minor gases can have
such unexpected and important consequences.
• The second example of our large-scale impact is the very serious
possibility of global climate change caused by greenhouse.
1. Introduction
Page 56
2. Ozone Depletion in the Stratosphere
In the troposphere ozone is a harmful pollutant, and it plays an important
role in the formation of photochemical smog. In addition, it is one of the
greenhouse gases.
However, in the stratosphere at altitudes of 10 to 30 km, ozone is vital to
our well-being, because it is very strong absorber of ultraviolet radiation
from the sun.
If ozone were not present in the stratosphere, the UV radiation on the
earth’s surface would be sufficient to cause a large rise in the incidence
of skin cancer and to damage the ocean phytoplankton (浮游生物), which
are basic to the food chain.
Page 57
Image of the largest
Antarctic ozone hole ever
recorded (September 2006).
In1985, British scientists working in Halley Bay, Antarctica, announced a
startling drop in the ozone concentration that they had been measuring in a
vertical column extending upward from their ground-based instrument.
Page 58
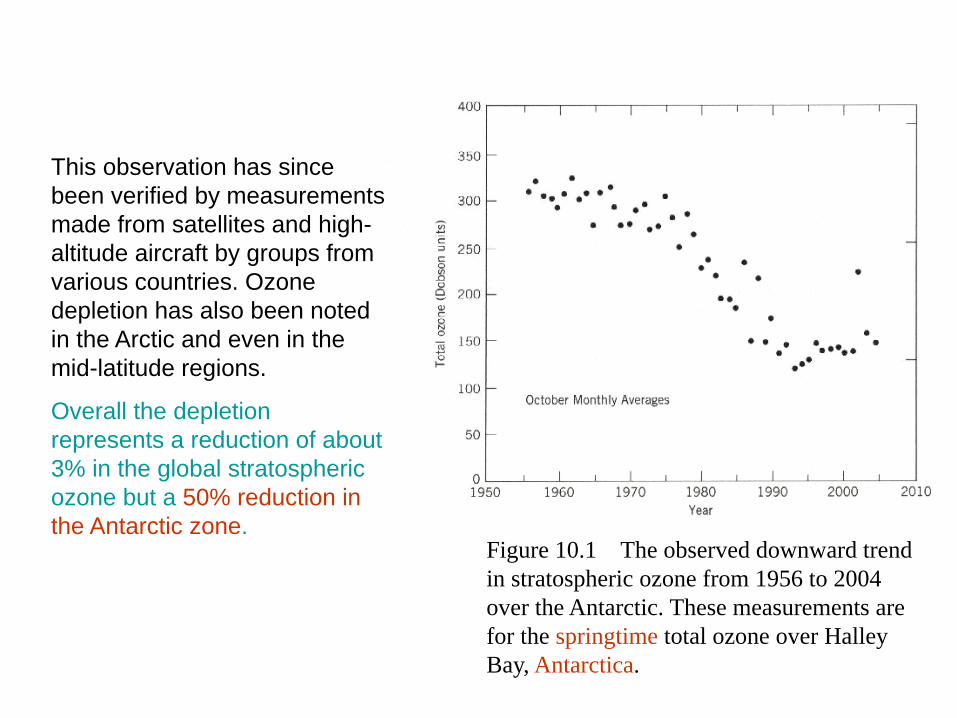
This observation has since
been verified by measurements
made from satellites and high-
altitude aircraft by groups from
various countries. Ozone
depletion has also been noted
in the Arctic and even in the
mid-latitude regions.
Overall the depletion
represents a reduction of about
3% in the global stratospheric
ozone but a 50% reduction in
the Antarctic zone.
Figure 10.1 The observed downward trend
in stratospheric ozone from 1956 to 2004
over the Antarctic. These measurements are
for the springtime total ozone over Halley
Bay, Antarctica.
Page 59
Ozone is formed and remains in equilibrium with the presence of O2 and
UV radiation through following reactions:
O2 + UV → 2O, O + O2 → O3, O3 + UV → O + O2
The main cause of man-made depletion of the ozone below its natural
concentration is the injection into the atmosphere of man-made
chlorinated fluorocarbons (CFCs). Two of the more widely used CFCs
are Freon-11 (CFCl3) and Freon-12 (CF2Cl2). These chemicals are used
in air conditioners, refrigerators, building insulation, solvents used in the
electronic industry, and spray cans.
The CFCs can be transported high up into the stratosphere where UV
radiation dissociates the molecule into free chlorine atoms and other
molecular fragments, The free chlorine can then act as a catalyst in
dissociating O3.
Page 60
First the chlorine interacts with the ozone: Cl + O3 → ClO + O2,
followed by ClO + O → Cl + O2.
What started as a free atom of chlorine again becomes a free atom of
chlorine leaving it available to repeat the process over the over again,
destroying ozone each time it is repeated. It is estimated that one chlorine
atom can destroy 100,000 ozone molecules.
There are many compounds of chlorine that come from various sources
on the earth’s surface. All of these chlorine compounds, however, are
readily dissolved in water and never reach the stratosphere.
Normally only a small fraction of the chlorine released from the CFCs in
the stratosphere is available to destroy ozone rapidly. The rest is in
molecules such as HCl that undergo only slow chemical reactions in the
stratosphere.
Page 61
During the Antarctic winter, chemical reactions on the surfaces of the ice
crystals convert the chlorine to chlorine monoxides, ClO. The catalytic
reaction then destroys ozone much more rapidly than in the rest of the
stratosphere.
Sunlight is required for the reaction, so not much ozone is destroyed in the
dark Antarctic winter. Instead, the ozone hole appears in October after
sunlight has returned.
The story of ozone depletion illustrates how human activities can have
unintended harmful consequences for the environment.
The global problem of ozone depletion can be mitigated only by limiting the
use of CFCs. Since the CFCs are also greenhouse gases, there is an
additional incentive for phasing them out.
In 1987 a world conference was held in Montreal to reach an international
agreement to reduce the use of CFCs. The Montreal Protocol mandated a
50% reduction in CFC production by the year 1998.
The protocol was strengthened in 1992 (the Copenhagen Amendments) to
call for the stopping of all CFC production in industrialized countries by the
end of 1995.
Page 62
The amount of ozone in the atmosphere over the Antarctic remains at level
much reduced from what is was several decades ago in spite of the
measures taken in the Montreal Protocol and the various amendments.
This is because the CFCs already in the atmosphere do not go away rapidly
even if no more are being added. Their residence times are very long,
estimated at 50 to 100 years.
While the problem of ozone depletion in the upper atmosphere is not
completely solved, the adherence of most nations to the Montreal Protocol
and its subsequent amendments is a shining example of nations getting
together to deal with a worldwide environmental problem in an encouraging
fashion.
Page 63
The Nobel Prize in Chemistry 1995 "for their work in atmospheric chemistry, particularly concerning the
formation and decomposition of ozone"
Paul J. Crutzen Mario J. Molina F. Sherwood
Rowland
the Netherlands USA USA
Max-Planck-Institut
für Chemie
Mainz, Federal
Republic of
Germany
Massachusetts Institute
of Technology (MIT)
Cambridge, MA, USA
University of
California
Irvine, CA,
USA
Page 65
3. Greenhouse Effect and World Climate Changes
The term greenhouse effect refers to the idea that incoming solar radiation
readily penetrates the glass covering of an ordinary greenhouse, but the
outgoing infrared radiation from the interior does not. The result is that the
solar energy is trapped, which leads to heating of the greenhouse.
The incoming solar energy easily penetrates the atmosphere, but the
thermal radiation from the earth’s surface does not. The wavelength of the
radiated thermal energy from the earth’s surface does not. The wavelength
of the radiated thermal energy from the earth’s surface is in the infrared
region (about 4 to 20 microns).
Certain gases absorb electromagnetic radiation very effectively in this
region of wavelength, and if they are present in the atmosphere, they will
trap the infrared radiation moving upward from the earth’s surface. The is
contributes to a warming of atmosphere.
Page 66
Table 10.1 Characteristics of the Major Green house Gases
15%
Page 67
To be more quantitative about the effects of greenhouse gases on the
global climate, the concept of climate forcing in terms of watts/cm2 has
been introduced. This is additional heating or cooling of the atmosphere
due to some perturbation on the system.
At their present concentrations :
CO2 + 1.4 watts/cm2
Methane + 0.6
Chlorofluorocarbons + 0.3
Nitrogen Oxides + 0.3
Black carbon + 0.8
Reflective aerosols - 1.3
Cloud droplet changes - 1.0
Land cover changes - 0.2
Sun brightness increases + 0.4
(past 150 yrs)
Page 68
• Another greenhouse gas, in fact the most important, is water vapor.
• Were it not fore the naturally occurring water vapor in the
atmosphere, the earth would be many degrees colder than it is now.
• The amount of water vapor in the atmosphere is relatively stable,
and not directly subject to man’s influence, so it is not normally
considered as a greenhouse gas of concern.
• It may happen, however, that is there is sufficient global warming, the
warmer air will take up more water vapor, leading to a positive
feedback effect. More warming means more water vapor, more water
vapor means more warming, and so on.
Page 69
Figure 10.3
Atmosphere carbon
dioxide concentrations
as measurement from
1958 to 2003 at the
Mauna Loa Observatory
on the island of Hawaii.
We are injecting large amounts of CO2 into the atmosphere. This amount
increased steadily from about 0.5 billion tonnes/yr in 1860 to about 5 billion
tonnes/yr now. It can be expected that the concentration of atmospheric CO2
will continue to increase as more fossil fuels are burned, possibly until the total
recoverable fossil fuels are consumed. There are 2X10¹² tonnes of carbon in
the total recoverable resource of fossil fuels.
Page 70
Figure 10.4 Atmosphere carbon
dioxide concentrations over the
past 1000 years from ice core
records and reom Hawaii. The ice
core measurements were taken in
Antarctica.
The average anthropogenic emissions from 1989-1998 are 7.9±1.0
billion tons per year, and of this 3.3±0.2 billion tons are stored in the
atmosphere. There is little doubt that we are adding to the atmosphere
burden of CO2, year by year, mainly by burning fossil fuels, but also by
reducing the world’s forests.
Page 71
Figure 10.5 Combined global land surface, air and sea temperatures 1861 to
1994. The solid curve represents smoothing of the annual values shown by
the vertical bars.
Page 72
When the term global warming is used, it refers to many related phenomena
taking place at the same time:
1. The earth’s temperature is increasing. The decade of the 1990s was the
warmest since the mid 1800s.
2. Most of the world’s glaciers are melting.
3. The Arctic sea ice is being reduced both in area and in thickness. The
area is shrinking by 9% per decade, and the thickness by 15 to 40% over
the past 30 years.
4. The level of the ocean is now rising more rapidly than in the past. The
main cause is thermal expansion of the seawater and, to a lesser extent,
the melting of the Antarctic ice.
5. Many other global warming effects are now becoming apparent. These
include longer growing seasons, Thawing of the Alaskan permfrost, coral
reef bleaching, earlier plant flowering, earlier bird arrivals, shifting of plant
and animal ranges poleward, and more frequent El Nino events.