41
Energy reform in Hungary László Varró Chief Economist MOL Plc
Energy reform in Hungary
László Varró Chief Economist MOL Plc

The historical heritage 1990
2
► Serious macroeconomic crisis
► Very low energy efficiency
► Heavy reliance on dirty fuels (coal, fuel oil)
► Lack of faith in market based methods
► A „green„ preception of transition
80
90
100
110
120
130
140
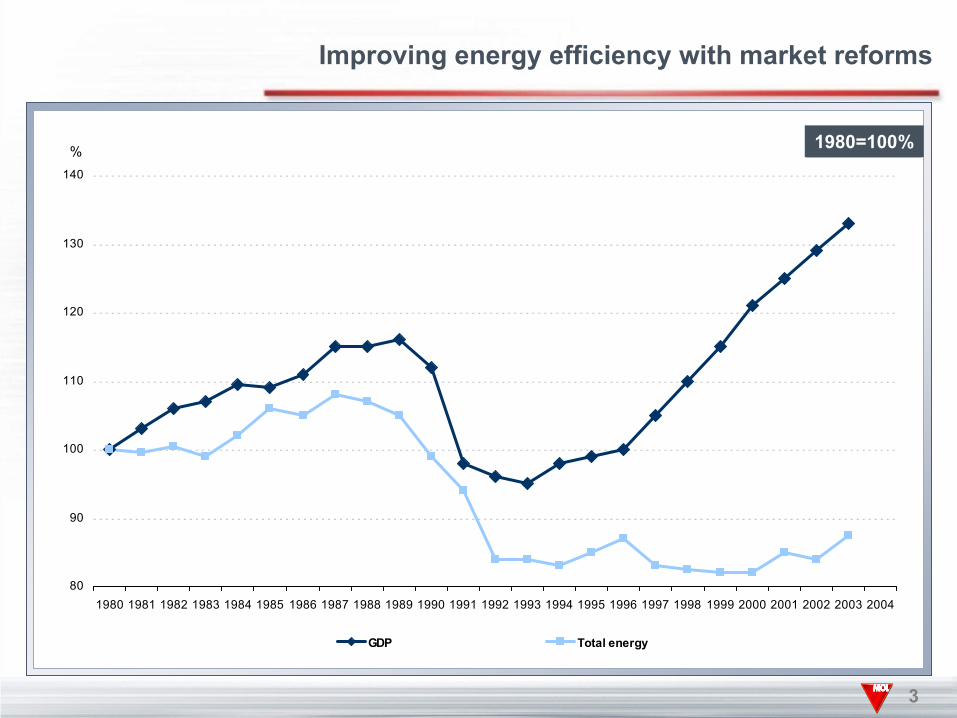
1980 1981 1982 1983 1984 1985 1986 1987 1988 1989 1990 1991 1992 1993 1994 1995 1996 1997 1998 1999 2000 2001 2002 2003 2004
GDP Total energy
% 1980=100%
3
Improving energy efficiency with market reforms

The virtue of necessity: drivers for change
Budget crisisLooming capacity shortageSO2 and other environmental issuesNeed to substitute from coal
The drivers for change
Privatisaton a means for government objectivesStructural reform is a prerequisitefor privatisation

POWER SECTOR REFORM PATH IN HUNGARY
1945Verticallyintegrated
1992Legal Separation:- generation- transmission- distribution/supply
1897-1945 1995Privatization
State-ownedEnterprise
State-ownedCorporation
WholesaleCompetition
Ow
ners
hip
Stru
ctur
eScope for Competition
RetailCompetition
SingleBuyerMonopoly
PrivateCorporation 2003
Competition
1991/92 1995/96 2003Restructuring Privatization Competition
4-5 years 6-7 years
generators (8) generators (except Nuclear)transmitter (1) distributors/suppliers
distributors/suppliers (6)

The big regulatory trade off
Strong investmentguarantees
• Easy privatisation• Modernisation
investment „bankable”• BUT: Rigid
commitments, lack ofcompetitve incentives
Strong competition• „Big bang” structural
reform• Lower inflationary
pressure• BUT: Credit rationing,
lack of investment• After Enron hangover
The first reform of 1995/97
Overriding priority for privatisationRigid, detailed PPAsPrivatisation in a single buyermodellThe state owned single buyermodell acted as a puffer

Grid Code Business RulesMarket Rules
BusinessRules
Power PlantCompanies
Electricitygeneration
TransmissionCompany
- Single Buyer wholesale
- Transmission,- Capacity balance- Export, Import
Distribution/ Supply
Companies
Distribution,Regulated Supply
Consumers
The single buyer model
Import Export
Operationallicences
Operationallicence
Operationallicences
Dispatcher

Electricity and natural gas prices in Euro, 1990=1,00
1.0
1.5
2.0
2.5
3.0
3.5
4.0
4.5
1990 1991 1992 1993 1994 1995 1996 1997 1998 1999 2000 2001 2002 2003
electricity
natural gas
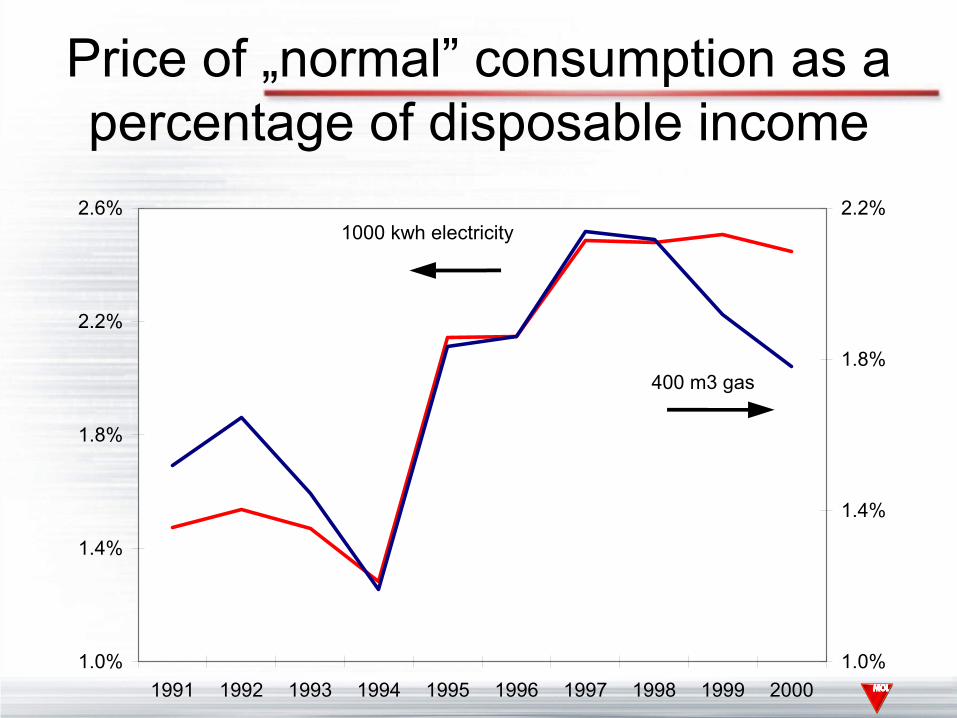
Price of „normal” consumption as a percentage of disposable income
1.0%
1.4%
1.8%
2.2%
2.6%
1991 1992 1993 1994 1995 1996 1997 1998 1999 20001.0%
1.4%
1.8%
2.2%1000 kwh electricity
400 m3 gas
Consequences of the firstreform
Significant investmentImproved efficiency, technologytransferBIG environmental benefits
BUTCost cutting versus grid qualityPolitical minefield

Expansion of the gas network
500
700
900
1 100
1 300
1 500
1 700
1 900
2 100
2 300
2 500
1995 1996 1997 1998 1999 20002 200
2 300
2 400
2 500
2 600
2 700
2 800
2 900
3 000thousand settlements, right scale
million consumers, left scale
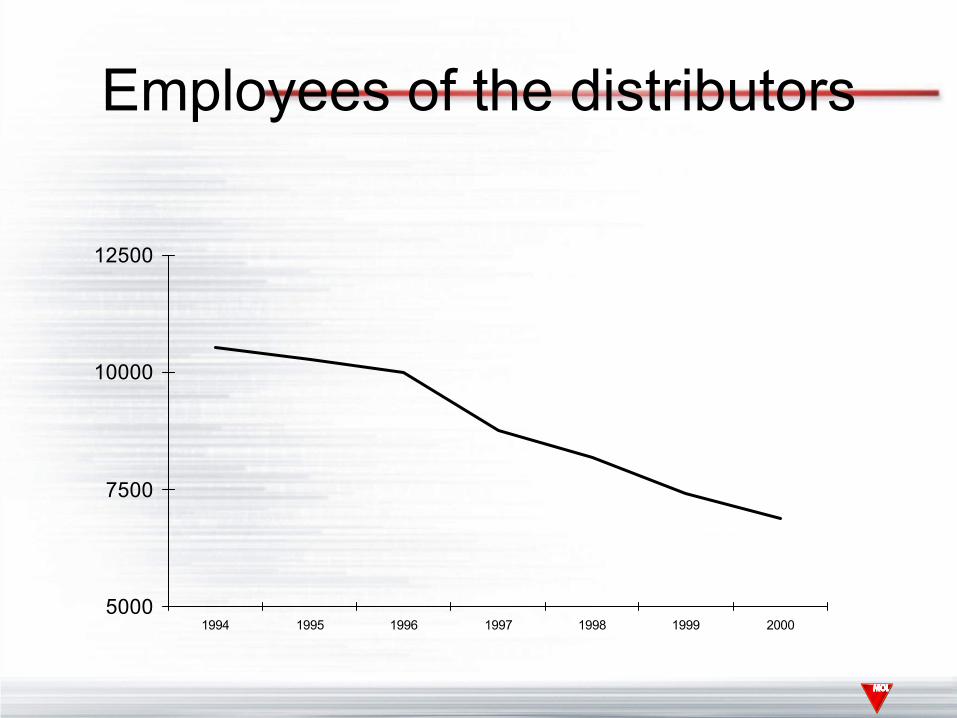
Employees of the distributors
5000
7500
10000
12500
1994 1995 1996 1997 1998 1999 2000
Our three most stupid mistakes
• Privatisation before tackling implicit subsidies
• No clear assignment of environmentalliabilites
• „Overcontarcing”: Failure to considerdemand elasticity
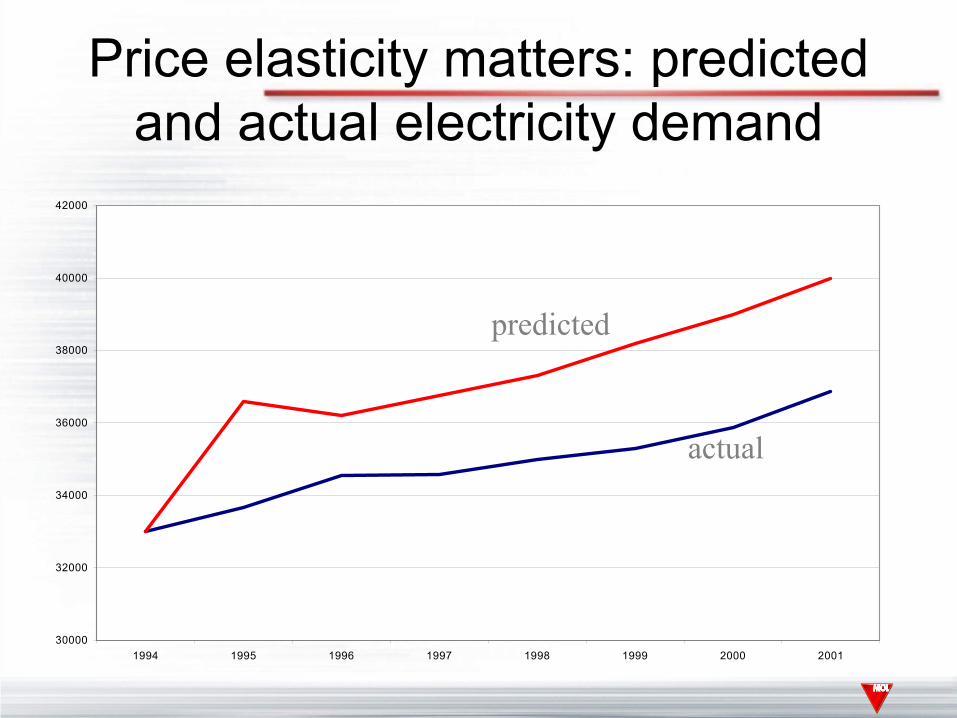
Price elasticity matters: predicted and actual electricity demand
30000
32000
34000
36000
38000
40000
42000
1994 1995 1996 1997 1998 1999 2000 2001
predicted
actual

Predicted and actual gasdemand
8000850090009500
1000010500110001150012000
1996 1997 1998 1999 2000 2001
1995 forecastactual

The second reform 2001-
Driven by EU accessionGradual transition to a competitivemarketRegulated access to the monopolyinfrastructureConstrains from the status quo

Constrains from the status quo
PPAs (stranded costs)Very strong lobby position of theprivatised industryWeak customer representationPolitical sensitivity
Gradual market opening
Busienss as usual in the captivemarketNo compulsory renegotiationIndependent system operatorOptional market openingOTC bilateral + optional pool (if)

Social consequences

Some sad facts• Characteristics of energy demand• Energy pricing reform in Hungary• Experience with social tariffs
Some sad facts 1: energy willhave a high relative price in
poor countries• Energy is very capital intensive• Capital goods have global markets• Power plants: 40%, network 60%
totally independet of local incomesand fuel availability

Some sad facts 2: someonewill pay
• Opportunity cost of taxpayers• Strained budgets• Current account constrains• The government must take a lead:
implicit subsidies to state ownedinstitutions

The implicit subsidy mith
• „Subsidized energy benefits the poor”• Problem 1: even if it were true it would be
highly inefficient• Problem2: it is not even true

Characteristics of energydemand: electricity
• Difficult to subsitute, multiplyapplication
• Perception of „life necessity” and„luxury” consumption
• Appliance penetration andefficiency
• Hot water?• It does react to price

On per capita basis electricity seems to have a high income
elasticityElectricity consumption per head as a function
of income
500
700
900
1100
1300
150000 250000 350000 450000 550000 650000 750000 850000 950000 1050000
• BUT: Poor families tend to have more dependents, on per familiy basis, income elasticity is much smaller
• +1 child = +25% electricity demand• Lot of noise
– Large families in the countriside– Single pensioners
Appliance penetration
• Usually grows with income• Society dependent „minimum group”• Energy efficiency as a luxury• Some inferior appliances (freezer)
Hot water complications
• Potentially 30-50% of total demand• Legacy systems• New housing• Substitution to gas

Differences between gas and electricity
• Electricification is finished in the 60s
• Very low substitution• Luxury tresholds (air
conditioning, wash up machine)
• Mostly domesticproduction, costs predictable
• Gas spread at the 90s• Significant groups
without access• Competition with
other fuels• Correlation with
flat/house size• Mostly import, market
volatility
Gas demand characteristics
• Mainly heating• High correlation with house size (flats
versus houses) income-family size• Price adjustment: marginal users, better
insulation, alternative fuels (e=0,5 longterm)
• Metering issues

Proportion of families with gas network access as a function of income
40
50
60
70
80
90
500000 700000 900000 1100000 1300000 1500000 1700000 1900000 2100000

Natural gas and unregulated fuel consumption as a function of
income
0
15000
30000
45000
500000 1000000 1500000 2000000
gas
unregulated

Social and political consequences: the Hungarian
experienceKamikaze action
• Ordinary welfare channels• Special targeted schemes• Social tariff schemes
Using ordinary welfare channels
• Easy organisation• Ready (?) institutional
framework• Can reach the elderly
and large families• Good incentive
properties
• Overloaded and strained
• Some targeting problems
• Hard to communicate
Special targeted schemes
• Can be targeted• Excellent PR• Tackle credit rationing
• Transaction costs• Transparency,
corruption• Poverty trap• Capture

Social tariffs (Block tariffs)
• Easy organisation• Low transaction costs• Transparency• Good PR
• Income elasticity• Targeting (large
families !)• Fuel substitution• Contrary to cost
structure
Social tariffs (Block tariffs) 2
• Low block limit– Equivalent to a lump
sum payment– Budget transparency– Marginal cost of
consumption: Good efficiency incentives
– Fairness problems
• High block limit– Equivalent to price
subsidy– Marginal cost of
consumption: Bad efficiency incentives
– Fair with high income elasticity

Some environmental aspects
• 1% increase in the effective marginal cost of electricity consumption saves– 800 tons of SO2
– 70 tons of NOx
– 35000 tons of CO2
• Price subsidy type “high block limit” tariffs are environmentally detrimental

A flat per kwh charge is already a social block tariff
Average price/cost
consumption
Cost structure
Block tariff


