ENERGY REGULATION QUARTERLY VOLUME 8, ISSUE 2 2020 ERQ E N E R G Y R E G U L A T I O N Q U A R T E R L Y - P U B L I C A T I O N T R I M E S T R I E L L E S U R L A R È G L E M E N T A T I O N D E L ’ É N E R G I E -
Transcript
ENERGY REGULATION QUARTERLY
VOLUME 8, ISSUE 2 2020
ERQ
ENERGY REGULATION QUARTERLY - PUBLICATION TRIMESTRIELLE SUR LA RÈGLEMENTATION D
E L’ÉN
ERGIE
-
MANAGING EDITORS
Mr. Rowland J. Harrison, QC, LLB, LLM, Energy Consultant, Calgary
Mr. Gordon E. Kaiser, BA, MA, JD, Arbitrator, JAMS Toronto, Washington DC
SUPPORTERS
Justice David M. Brown, BA, JD, LLM, Justice, Court of Appeal for Ontario
Mr. Scott Hempling, BA, JD, Adjunct Professor, Georgetown University Law Center
Dr. Mark A. Jamison, BSc, MSc, PhD, Director, Public Utility Research Center, University of Florida
Mr. William Lahey, BA, LLM, Professor, Schulich School of Law, Dalhousie University
Mr. Peter Ostergaard, BA, MA, Former Chair, BC Utilities Commission, Vancouver
Dr. André Plourde, BA, MA, PhD, Professor, Dean, Faculty of Public Affairs, Carleton University
Mr. Mark Rodger, BA, LLB, Senior Partner, Borden Ladner Gervais LLP, Toronto
Mr. Lawrence E. Smith, QC, BA, LLB, MA, Partner, Bennett Jones, Calgary
Mr. C. Kemm Yates, QC, BA, JD, Partner, Blakes, Calgary
Ms. Laura Scott , LLB, LLM, Student-at-Law – Legal Services Provider, Regulatory Law Chambers, Calgary
Mr. David Stevens, BA, LLB, Partner, Aird & Berlis LLP, Toronto
Ms. Rosa Twyman, BComm, LLB, EMBA, Legal Services and Business Director, Regulatory Law Chambers, Calgary
Mr. John Weekes, BA, Senior Business Advisor, Bennett Jones, Ottawa
Dr. Ron Wallace, Retired, Permanent Member, National Energy Board
Mr. Brady Yauch, BA, MA, Manager, Markets and Regulatory, Power Advisory LLC, Toronto
Mr. Glenn Zacher, BA, LLB, Partner, Stikeman Elliott, Toronto
MISSION STATEMENT
The mission of Energy Regulation Quarterly (ERQ) is to provide a forum for debate and discussion on issues surrounding the regulated energy industries in Canada, including decisions of regulatory tribunals, related legislative and policy actions and initiatives and actions by regulated companies and stakeholders. The role of the ERQ is to provide analysis and context that go beyond day-to-day developments. It strives to be balanced in its treatment of issues.
Authors are drawn from a roster of individuals with diverse backgrounds who are acknowledged leaders in the field of energy regulation. Other authors are invited by the managing editors to submit contributions from time to time.
EDITORIAL POLICY
The ERQ is published online by the Canadian Gas Association (CGA) to create a better understanding of energy regulatory issues and trends in Canada.
The managing editors will work with CGA in the identification of themes and topics for each issue. They will author editorial opinions, select contributors, and edit contributions to ensure consistency of style and quality. The managing editors have exclusive responsibility for selecting items for publication.
The ERQ will maintain a “roster” of contributors and supporters who have been invited by the managing editors to lend their names and their contributions to the publication. Individuals on the roster may be invited by the managing editors to author articles on particular topics or they may propose contributions at their own initiative. Other individuals may also be invited by the managing editors to author articles on particular topics.
The substantive content of individual articles is the sole responsibility of the respective contributors. Where contributors have represented or otherwise been associated with parties to a case that is the subject of their contribution to ERQ, notification to that effect will be included in a footnote.
In addition to the regular quarterly publication of Issues of ERQ, comments or links to current developments may be posted to the website from time to time, particularly where timeliness is a consideration.
The ERQ invites readers to offer commentary on published articles and invites contributors to offer rebuttals where appropriate. Commentaries and rebuttals will be posted on the ERQ website (www.energyregulationquarterly.ca).
CEA Virtual Regulation Program: Electricity Regulation during a Pandemic .....8
Indy Butany-DeSouza and Francis Bradley, Moderators
ARTICLE
Time of Use Rates: An International Perspectives ......................................... 9
Ahmad Faruqui and Cecile Bourbonnais
UPDATE: NAFTA 2.0: Drilling Down – The Impact of CUSMA/USMCA
on Canadian Energy Stakeholders .............................................................. 20
John M. Weekes, Darrel H. Pearson, Lawrence E. Smith QC and Margaret M. Kim
Carbon Policy and Emissions Targets ......................................................... 26
Jason Kroft, Jonathan Drance, Glenn Cameron and Victor MacDiarmid
Ontario’s Electricity Market Woes: How Did We Get Here
and Where Are We Going? ......................................................................... 30
Brady Yauch
COMMENT
Nova Gas Transmission Ltd. System Rate Design and Services Application ....42
Laura Scott, Rosa Twyman and Laura-Marie Berg
6
EDITORIAL
Managing Editors
Rowland Harrison QC and Gordon E. Kaiser
1 KMPG, “Capitalizing the Cloud: The Regulatory Challenges” (April 2020), online: ERQ <www.energyregulationquarterly.ca/reports/capitalizing-the-cloud-the-regulatory-challenges#sthash.C8B9xrrH.jV8AreYR.dpbs>.2 John M. Weekes et al, “NAFTA 2.0: Drilling Down – The Impact of CUSMA/USMCA on Canadian Energy Stakeholder” (2019) 7:1 Energy Regulation Q 45, online (pdf ): <www.energyregulationquarterly.ca/wp-content/uploads/2019/03/ERQ_Volume-7_Issue_1_2019.pdf>.
The COVID-19 pandemic has resulted in the widespread adoption of innovative communication tools, particularly to replace in-person gatherings. On May 6, the Canadian Electricity Association (CEA), a co-sponsor of Energy Regulation Quarterly (ERQ), hosted its annual CAMPUT Workshop in digital format. This issue of ERQ includes a summary of the proceeding, with a link to a recording of the workshop. As we expect this electronic form of presentation will likely continue to be adopted, ERQ has added a “Videos” section where links to material of interest to our readership will be posted from time to time.
ERQ has also occasionally posted links to relevant reports that are not themselves suitable for publication as such in ERQ. For example, a link to the KPMG Report “Capitalizing the Cloud” was included in the review of the report in ERQ Volume 8 Issue 1.1 We have now formalized this practice and added another section under the title “Reports” where links will be provided.
The articles in this issue run the gamut from the technical, to the broad policy/regulatory framework relevant to the energy industry and energy regulation.
In “Time Use of Rates: An International Perspective,” Ahmed Faruqui and Cecile Bourbonnais survey the deployment around the globe of Time-of-Use (TOU) or Time-Varying Rates (TVR), including the default application of TOU in Ontario (with 90 per cent customer participation, although TOU was recently suspended for 45 days in Ontario due to the COVID-19 pandemic) and pilot programs in
British Columbia and Québec. The authors report a clear correlation, as would be expected, between increases in the peak-to-off-peak price ratio and reduction of on-peak usage, which is further increased with enabling technology such as smart thermostats. Despite the widespread geographic deployment of TOU or TVR, however, the numbers are small and there is “tremendous room for growth.”
The most significant recent development in Canada-U.S. trade relations, with direct implications for energy, is the conclusion and implementation of the United States-Mexico-Canada Agreement (referred to in Canada as CUSMA and in the U.S. as USMCA). CUSMA, as originally signed on November 30, 2018, was analyzed by a Bennett Jones group in ERQ in March 2019, in “NAFTA 2.0: Drilling Down — the Impact of CUSMA/USMCA on Canadian Energy Stakeholders.”2 In this issue of ERQ, the authors provide an “Update” of their original analysis, including a review of the final package of amendments signed on December 10, 2019, in the form of a Protocol of Amendment, with particular reference to revisions to CUSMA of interest to energy stakeholders. At press time for this issue of ERQ, CUSMA was expected to come into force on July 1, 2020.
The debate about carbon policy and its role in addressing climate change (with direct and immediate consequences for the energy sector and its regulation) has dominated public discourse now for more than a quarter of a century. It was a significant issue in last year’s federal election. While its prominence has been somewhat overshadowed recently by the current
7
Volume 8 – Editorial – Rowland Harrison QC and Gordon E. Kaiser
global pandemic, the debate will inevitably re-emerge, possibly with increased intensity. It is, therefore, important to continue to review and analyze developments.
The article in this issue of ERQ on “Carbon Policy and Emissions Targets,” by a group from Stikeman Elliott, makes a valuable contribution in this regard, particularly by examining the record of what has actually happened in Canada since the Kyoto Protocol was signed in 1997. Noting criticism that Canada’s carbon policy is “longer on aspiration than on likely achievement,” the authors conclude that the challenge in meeting future emissions targets will be to design and implement policies that can “bridge the gap between our best intentions and our actual results.”
The divergence between objectives (“best intentions”) and outcomes (“actual results”) is all too often observed in the realm of public policy and regulation. In “Ontario’s Electricity Market Woes: How Did We Get Here and Where Are We Going?” Brady Yauch concludes that Ontario’s electricity market is materially different from what was envisaged when it opened in May 2002. Market opening was expected “to provide competition, lower prices and transparent price signals,” whereas subsequent priorities led to “increased prices, reduced competition and distorted price signals.” Yauch reviews “what went wrong” and briefly discusses current work on a coordinated set of reforms, known as the Market Renewal Program.
The Case Comment in this issue of ERQ, by Rosa Twyman, Laura Scott and Laura-Marie Berg, reviews a recent decision of the Canada Energy Regulator (CER) approving a new rate design methodology and terms and conditions of service for the Nova Gas Transmission Ltd. (NGTL) System. While approving the application, which was supported by a contested settlement, however, the CER found that there was potential for further improvements in NGTL’s rate design and services.
3 An Act to enact the Impact Assessment Act and the Canadian Energy Regulator Act, to amend the Navigation Protection Act and to make consequential amendments to other Acts, SC 2019, c 28, s 11.4 RSC 1985, c N-7, s 62, as repealed by An Act to enact the Impact Assessment Act and the Canadian Energy Regulator Act, to amend the Navigation Protection Act and to make consequential amendments to other Acts, SC 2019, c 28, s 44.5 Canadian Energy Regulator Act, SC 2019, c 28, s 10, ss 225–40.
Apart from the decision itself, the NGTL proceeding is noteworthy for illustrating the operation of the transitional provisions relating to the abolition by Bill C-69 of the National Energy Board (NEB) and the establishment of the CER as the Board’s successor.3 Specifically, section 36 of the CER Act provides that applications pending before the NEB at the time that the CER Act came into force (August 28, 2019) were to be taken up by the CER and continued in accordance with the National Energy Board Act (NEB Act).4 The NGTL application had been filed prior to August 28, 2019, and therefore was processed by the CER under the applicable provisions of the NEB Act, without any apparent interruption. It is also worth noting that, with respect to Traffic, Tolls and Tariffs, the CER Act contains provisions similar to those previously found in the NEB Act.5 Hence, the oversight of pipeline Traffic, Tolls and Tariffs is expected to continue under the CER much as it had under the NEB. n
8
CEA VIRTUAL REGULATION PROGRAM: ELECTRICITY REGULATION DURING A
PANDEMIC
Indy Butany-DeSouza and Francis Bradley, Moderators
On May 6, the Canadian Electricity Association (CEA) hosted its annual CAMPUT Workshop, Regulatory Perspectives on Electric Utility Pandemic Response & Digital Transformation. For the first time, the event was hosted in a digital format. ERQ is now offering a Video feature that allows readers to view this program: https://www.youtube.com/watch?v=bV5nmcgF7Fs.
CAMPUT WORKSHOP
The workshop had two primary themes.
First it considered customer relief measures and decreasing loads resulting from the COVID-19 pandemic and the increased pressure on electric utility financial models given the growing revenue shortfalls. The program also explored the recent KPMG report commissioned by the CEA and the Canadian Gas Association regarding the costs and benefits of utility cloud computing investments.1
The event started with a keynote speaker, Brien Sheahan, former Chair of the Illinois Commerce Commission who outlined the principles that should guide regulators in addressing COVID-19 challenges.
The first panel, which was chaired by Indy Butany-DeSouza, Vice President of Regulatory Affairs for Alectra Utilities, and
included: Jonathan Erling, Executive Director at KPMG; Kevin Major, Associate Partner at McKinsey & Company; and, Denise Parrish, Deputy Administrator in the Wyoming Office of the Consumer Advocate.
The panel explored how new technologies could promote utility cost savings, increased security and greater resiliency. Various obstacles to adoption were identified, including regulatory models that prevented optimal investment.
The second panel was chaired by Francis Bradley, President of the CEA. It included Gordon Kaiser, a former Vice Chair of the Ontario Energy Board, David Morton, Chair of the British Columbia Utility Commission and Larry Parkinson, Director of Enforcement at the Federal Energy Regulatory Commission in Washington.
The second panel surveyed the steps regulators have taken across Canada and the United States to increase regulatory efficiency during COVID-19. They also forecasted the challenges ahead including significant rate applications caused by historic demand destruction. n
9
TIME OF USE RATES: AN INTERNATIONAL
PERSPECTIVES
Ahmad Faruqui and Cecile Bourbonnais*
Time-of-Use (TOU) rates, sometimes also called Time-Varying Rates (TVR), include simple time-of-use rates, critical-peak pricing rates, peak time rebates (PTR), variable-peak pricing rates (VPP) and real-time pricing
rates (RTP). Today, they are deployed in small numbers in many parts of the globe.
Figure 1 presents a summary:
Figure 1: TVR Deployments throughout the Globe
Type of Rate Applicability Participating Customers**
* Dr. Ahmad Faruqui is a Principal with The Brattle Group in San Francisco.Cecile Bourbonnais is a Senior Research Analyst with The Brattle Group in San Francisco.** Estimated participation is based on historical trends.
10
Volume 8 – Article – Ahmad Faruqui and Cecile Bourbonnais
Despite this widespread deployment, there is tremendous room for growth. The deployment of Advanced Metering Infrastructure (AMI) is creating an opportunity to enhance customer engagement by deploying TVRs and harness the load flexibility benefits created by these rates.1 By the end of 2020, nearly 100 million smart meters are expected to be deployed in the US, representing nearly 85 per cent of households.2 At the same time, the deployment of TOU rates is limited to 4 per cent.
By comparison, in Ontario, Canada, TVRs (simple three-period TOU rates) are deployed to all residential and small commercial and industrial customers as the default, regulated
1 There is compelling evidence from 370 deployments of TVRs throughout the globe that customers respond to TVRs by lowering usage and shifting some or all of the peak period usage to the mid-peak or off-peak periods. See Figure 1.2 Adam Cooper & Mike Shuster, “Electric Company Smart Meter Deployments: Foundation for a Smart Grid (2019 Update)” (December 2019), online (pdf ): The Edison Foundation Institute for Electrical Innovation <www.edisonfoundation.net/iei/publications/Documents/IEI_Smart% 20Meter%20Report_2019_FINAL.pdf>.3 See Ahmad Faruqui, Sanem Sergici & Cody Warner, “Arcturus 2.0: A meta-analysis of time-varying rates for electricity” (2017) 30:10 The Electricity J 64.
pricing option, and 90 per cent are taking service on TVRs.
As shown in Figure 2, the magnitude of demand response varies by the peak to off-peak price ratio. Based on regression analysis of over 60 time-varying pilots and 370 pricing treatments, residential customers reduce their on-peak usage by 6.5 per cent for every 10 per cent increase in the peak-to-off-peak price ratio. In the presence of enabling technology such as smart thermostats, the effect is stronger. On average, customers enrolled on TVRs that offer enabling technologies reduce peak usage by 11 per cent for every 10 per cent increase in the price ratio.
Figure 2: Price Responsiveness with and without Emerging Technology3
11
Volume 8 – Article – Ahmad Faruqui and Cecile Bourbonnais
I. GLOBAL DEPLOYMENTS
As shown in Figure 1, utilities across the globe are experimenting with multiple pricing options.
For example, since 2014, Spain has offered real-time pricing as the regulated default rate for residential customers, with approximately 40 per cent of customers currently enrolled.4
In Italy, TOU rates have been mandatory since 2010 for all low-voltage residential customers.5 A 1.5 year transitional phase included limited variation between the peak and off-peak prices, before expanding to a larger price difference for the final tariff.
In the United Kingdom, Green Energy UK offers a time-varying TIDE tariff, while in 2018 Octopus Energy tested the first half-hourly TOU tariff and found that customers shifted usage out of peak periods by 28 per cent.6
The following sections provide case studies of other time-varying deployments.
A) AUSTRALIA
SA Power Networks (SAPN), which serves around 1.7 million customers in South Australia, has recently proposed offering default TOU rates for residential customers with interval meters starting in July 2020.7 Around 20 per cent of residential and small business customers currently have interval meters, with that number expected to grow to 50 per cent by 2025.
The proposed rate offerings will include a “solar sponge” component with a super off-peak period of 10 am–3 pm when solar exports are
4 “Voluntary price for the smaller consumer (PVPC)” (2014), online: RED Eléctrica De España <www.ree.es/en/activities/operation-of-the-electricity-systemvoluntary-price-small-consumer-pvpc>.5 Maggiore et al, “Evaluation of the effects of a tariff change on the Italian residential customers subject to a mandatory time-of-use tariff” (2013), online (pdf ): European council for an energy efficient economy <www.eceee.org/library/conference_proceedings/eceee_Summer_Studies/2013/7-monitoring-and-evaluation/evaluation-of-the-effects-of-a-tariff-change-on-the-italian-residential-customers-subject-to-a-mandatory-time-of-use-tariff/2013/7-014-13_Maggiore.pdf>.6 “Agile Octopus A consumer-led shift to a law carbon future” (2018), online (pdf ): Octopus Energy <octopus.energy/static/consumer/documents/agile-report.pdf>; Green Energy UK, Press Release, “A new and better way to control home energy bills” (5 January 2017), online: <www.greenenergyuk.com/PressRelease.aspx?PRESS_RELEASE_ID=76>.7 SAPN, “Attachment 17 Tariff Structure Statement Part B – Explanatory Statement” (10 December 2019) online (pdf ): Australia Energy Regulator <www.aer.gov.au/system/files/SAPN%20-%20Revised%20Proposal%20-%20Attachment%2017%20-%20Tariff%20Structure%20Statement%20Part%20B%20-%20Explanatory%20Statement%20-%20December%202019_0.pdf>.8 Ibid; Note that the Australian Energy Regulatory approved these proposed rate structures in a draft decision to be effective in July 2020, but the final decision is still pending.
high, an off-peak period of 1–6 am, and a peak period consisting of all other hours. In the super off-peak period of 10 am–3 pm, the “solar sponge” rate is 25 per cent of the standard rate offered to customers without interval meters, versus prices that are 50 per cent of the standard rate in the off-peak period and 125 per cent in all other hours. This is designed to respond to a change in the residential daily profile caused by an increase in solar photovoltaic adoption, which has caused a pattern of load peaks and troughs and shifted peak demand as over 30 per cent of customers have now installed solar on their rooftops.
The Australian Energy Regulatory approved these proposed rate structures in a draft decision to be effective in July 2020, though the final decision is expected in April 2020.
Separately, SAPN is also proposing to offer an optional, three-part “Prosumer” tariff for customers with interval meters.8 The monthly demand charge is estimated using average demand over a four-hour period from 5–9 pm for November through March, while the TOU usage rates under the Prosumer tariff will be halved relative to those under the default time-varying rate. This rate structure accommodates customers who want to discharge energy storage systems during peak periods. SAPN analysis finds that the standard deviation in customer outcomes (i.e., bill impact) is significantly larger under the Prosumer tariff than with TOU.
B) CANADA
1. British Columbia
BC Hydro, which serves approximately 95 per cent of British Columbia’s
12
Volume 8 – Article – Ahmad Faruqui and Cecile Bourbonnais
4.63 million residents, conducted a pilot from 2006–2008 testing TOU and TOU/CPP rates for approximately 2,000 opt-in customer.9 Currently, BC Hydro’s residential energy charge includes an inclining block structure, but at the time was simply a flat rate.
To avoid adverse selection, BC Hydro randomly assigned participants into either a control group, or a treatment group facing five different TOU rate schedules. The control group were billed on the regular residential rate, as was the treatment group during summer months. In winter, the TOU rates had peak/off-peak price ratios of 3–6, while the CPP/TOU rate had a peak/off-peak ratio of 7.9 for CPP and 3 for TOU. At the time, BC Hydro staff found that over the pilot’s first winter, the treatment group’s peak kWh was 9.6 per cent less than the control group’s peak kWh, and that the availability of an in-home display (IHD) did not have a discernible effect.
However, a more recent regression analysis based on the pilot’s second winter of operation estimated that IHD would approximately double TOU reductions of 2.2 per cent- 4.4 per cent without IHD, and critical peak reductions of 4.8-5.3 per cent without IHD.
2. Ontario
The Ontario Energy Board mandated the installation of smart meters for all customers to promote a culture of conservation. The C$2 billion rollout of 4.7 million smart meters was complete by 2014.10
Alongside smart meters, Ontario introduced default TOU rates in 2011–12 for residential and small commercial customers. Some 90 per cent of Ontario’s 4 million residential customers have been buying their energy through a regulated supply option, which features a three-period TOU rate. The TOU rates only apply to the energy portion of the customer’s bill, and off-peak, mid-peak, and on-peak prices are defined by season.
9 Chi-Keung Woo et al, “Winter Residential Optional Dynamic Pricing: British Columbia, Canada” (2017) 38:5 The Energy J 115.10 “Electricity Rates”, online: OEB <www.oeb.ca/rates-and-your-bill/electricity-rates>.11 Neil Lessem et al, “The Impact of Time-of-Use Rates in Ontario” Public Utilities Fortnightly (February 2017), online: <www.fortnightly.com/fortnightly/2017/02/impact-time-use-rates-ontario> (local distribution companies (LDCs) gradually adopted TOU rates beginning in 2009, and were all on TOU by 2017. The peak/off-peak price ratio for all of LDCs throughout the analysis period was approximately 1.5).
A small number of customers without smart meters are on Tiered Pricing rates with seasonally differentiated tiers and prices, while large commercial and industrial customers pay wholesale prices.
A Brattle analysis of the TOU rates from their inception in 2009 through 2014 found that for the province as a whole, TOU reduced usage during the summer peak by 3.3 per cent in the pre-2012 period, 2.3 per cent in 2012, 2.0 per cent in 2013 and 1.2 per cent in 2014.11 Load shifting impacts were lower in winter, which similar to the summer impacts decreased over successive years of the study. No evidence of electricity conservation was observed.
With the arrival of the pandemic, the Premier decided to suspend the TOU pricing plan for 45 days. This measure was taken to lessen the burden on customers who were faced with unprecedented hardships.
The pandemic forced people to stay at home, creating an economic hardship for many families. Many wage earners lost their jobs or began to think they were on the verge of losing theirs.
The Premier issued an Emergency Order under which residential and small business customers on time-of-use (TOU) pricing will pay 10.1 cents/kWh no matter what time of day the electricity is consumed. This meant that TOU customers will be paying the off-peak price, which is currently levied from 7 pm to 7 am, throughout the day as long as the Emergency Order remains in place.
Although their intention is admirable, suspending the TOU pricing plan is a huge step back in time and in the long-run will only serve to raise customer bills. Better options exist for assisting customers facing economic hardship. Rebates will assist customers to pay for essential electricity services while still giving customers a price signal to defer discretionary electricity usage to the cheaper off-peak period. Moreover, rebates can potentially be targeted to those
13
Volume 8 – Article – Ahmad Faruqui and Cecile Bourbonnais
customers with the greatest need, whereas the change in the TOU rate will disproportionately benefit large energy users, irrespective of the income or need.
For those customers who do feel that TOU is an unwelcome hardship, the Government can remind them that it is not mandatory. They can opt-out of it and chose another plan.
It’s worth recalling that TOU pricing was deployed in Ontario in 2009 to reduce customer electricity bills by encouraging customers to curtail electricity usage during the peak period when it is more expensive to generate the power. While customers in Ontario were defaulted onto the TOU pricing plan, this rate was not mandatory since customers had the option to opt-out and choose a flat rate offered by a competitive retail supplier.
In Ontario, some 90 per cent of all residential and small business customers still take their electric service on the TOU pricing plan. A team of consultants from The Brattle Group analyzed three years of data from a representative sample of customers in Ontario for the Ontario Power Authority (now part of the IESO). Our analysis showed conclusively that the TOU pricing plan reduced consumption during peak periods and moved it to off-peak periods. By so doing, it reduces the cost of electricity to all Ontarians and also minimizes unintended subsidies between customers. Those who consume more power when it is more expensive to generate pay their fair share of electricity costs. They are not subsidized by those who consume less power during the expensive period.
12 Hydro-Quebec, “Rapport final du Project Tarifaire Heure Juste” (2 September 2010), online (pdf ): Régie de l’énergie Québec <www.regie-energie.qc.ca/ audiences/3740-10/Demande3740-10/B-1_HQD-12Doc6_3740_02aout10.pdf>.13 Note winter is defined as December through March, and summer as April through November. Peak hours are from 6 am–10 pm under Réso, and 7–11 am and 5–9 pm under Réso+. The default fixed charge of 40.46 cents/day applied under both experimental rates.
While Premier Ford desires to address the economic hardship of Ontarians, changing the price of electricity is not the best way of doing it. Ontario’s TOU pricing plan has been admired throughout the globe. It has made Ontario stand out as a leader in the pricing of electricity. In the US, California, Colorado, Michigan and Missouri are giving serious consideration to deploying TOU pricing as the default option to manager energy costs and to pave the way for a clean energy future. Other states are likely to follow suit.
Scrapping the TOU pricing plan means annulling the transmission of efficient and equitable electricity price signals. It would be a huge step back in time and would ultimately hurt customers by driving up their electricity bills. To address the issue of affordability during the pandemic, the Government of Ontario should instead offer direct subsidies to those who can least afford electricity costs. This could be done by given them a rebate against their monthly bills and leaving the pricing plan intact.
3. Québec
From December 2008 to March 2010, Hydro-Québec (HQ) conducted a “Time it Right” pilot with 2,200 households in four cities.12 Approximately 88 per cent of participants stayed on the experimental rates through the end of the pilot, which tested two rate designs, Réso (TOU) and Réso+ (TOU/CPP), summarized below.
Volume 8 – Article – Ahmad Faruqui and Cecile Bourbonnais
Under Réso, usage reductions in the peak period were not statistically significant. Under Réso+, 28 critical days were called, with a statistically significant average reduction of approximately 6 per cent (0.27 kW) in critical peak events over the two winters.
In April 2019, Hydro-Québec began gradually rolling out opt-in residential PTR and CPP rate offerings for a limited number of customers.14 Randomly selected customers were invited to sign up for one of the two dynamic pricing rates, with sign-ups reaching the maximum limit for winter 2019–2020.
The first rate, the Winter Credit Option, offers a 50 cents/kWh peak time rebate for reducing electricity during winter peak demand events. The fixed charge and two-tiered variable charge for all other hours are the same as under the default residential rate, which charges 4.28 cents/kWh for energy consumed up to 40 kWh a day, and 7.36 cents/kWh for all other usage.15
The second option, Rate Flex D, charges a higher rate of 50 cents/kWh for energy consumed during winter peak demand events. In summer, the fixed charge and two-tiered variable charge for all other hours are the same as under the default residential rate, while in winter, the variable charge includes savings of 22–30 per cent depending on the tier. There may be 25–33 events per winter, at most, for a maximum of 100 hours in all.
C) NEW ZEALAND
1. Vector Limited
Vector Limited, the distribution utility that serves Auckland, the most populous city
14 “Dynamic pricing”, online: Hydro Québec <www.hydroquebec.com/residential/customer-space/rates/dynamic-pricing.html>.15 “Electricity Rates effective April 1, 2019” (2019), online (pdf ): Hydro Québec <www.hydroquebec.com/data/documents-donnees/pdf/electricity-rates.pdf>.16 “Electricity prices effective from 1 April 2020”, online: Vector <www.vector.co.nz/personal/electricity/pricing/electricity-prices-2020>.17 The Low User tariff represents a low fixed-charge option to assist low-use customers.18 Among these, 303 offer Time-of-Use (TOU), 29 offer Critical Peak Pricing (CPP), 14 offer Peak Time Rebate (PTR), 9 offer Variable Peak Pricing (VPP), and 6 offer Real-Time Pricing (RTP).
in New Zealand, conducted a PTR pilot program jointly with a retail, Mercury, from June–August 2019 with 630 customers.
At the time, Vector served most residential customers on a two-part rate with a flat volumetric charge. The peak time rebate was applied only to the distribution rate, with a peak to off-peak ratio of 5.4:1. There were 7 event days with both a morning peak period (7–11 am) and evening peak period (5–9 pm). Event days were triggered by Vector staff when minimum peak temperature was expected to drop below 9 degrees.
In April 2020, Vector expects to restructure its flat distribution charge as a TOU charge for Residential and General Consumer customers.16 The TOU rates have a peak period of 7–11 am and 5–9 pm weekdays, and a peak/off-peak ratio of approximately 2.5:1 for Low User customers and 5:1 for Standard customers.17 It will be up to the retailers whether to pass through these time-of-use delivery charges to retail customers or to bundle them into some other types of charges.
D) US BENCHMARK
According to 2018 EIA Form-861, 322 U.S. utilities offer at least one form of time-varying rate to residential customers.18 Altogether, 5.5 million customers (or 4 per cent of all residential customers) are enrolled on one of these time-varying rates, with the following 15 utilities accounting for 86 per cent of all customers enrolled on a time-varying rate.
15
Volume 8 – Article – Ahmad Faruqui and Cecile Bourbonnais
Highlights of several of the leading utilities follow.
1. Arizona
Arizona Public Service (APS) leads all U.S. utilities with the largest number of customers enrolled on an opt-in time-of-use rate — over 600,000 customers, or approximately 56 per cent of its 1.1 million residential customers, are on a time-of-use rate. APS offers five residential rate schedules, of which three are TOU rates and two are non-TOU rates restricted to customers with an average usage of less than 1,000 kWh.19
Among the TOU rates, Saver Choice (“R-TOU-E”) includes seasonal on-peak and off-peak energy charges, with a ratio of slightly over 2:1 and an on-peak period of 3–8 pm Monday–Friday. There is also a winter-only super off-peak energy charge. The other two rates, Saver Choice Plus (“R-2”) and Saver Choice Max (“R-3”), have a smaller peak/off-peak ratio and no super off-peak period, but include a demand charge.
Salt River Project, Arizona’s second largest utility, also offers three TOU options, with roughly 315,000 customers, or 33 per cent of its nearly 1 million residential customers, are enrolled on a TOU rate.20
One option, the SRP Time-of-Use Price Plan (“E-26”), defines on-peak hours of weekdays 2–8 pm in summer and 5–9 am and 5–9 pm in winter, with a peak/off-peak ratio of 1.4:1 in winter and 2.9:1 in summer. SRP’s Price Plan for Residential Super Peak Time-of-Use service offers two other options, E-21 and E-22, both of which charge higher costs in a three hour weekday time frame. The E-21 plan defines an on-peak period of weekdays 3–6 pm, while the E-22 plan’s peak period covers weekdays 4-6 PM. Both options have a peak/off-peak ratio of 3.5:1 in the summer, 4:1 in the summer peak, and 1.4:1 in the winter. Under the EZ-3 Price Plan, customers receive a 90-day bill protection. If their first three bills are higher than they would have been on the default Basic price plan, they are credited the difference and switched back to the Basic plan.
16
Volume 8 – Article – Ahmad Faruqui and Cecile Bourbonnais
2. California
Pacific Gas & Electric (PG&E) currently has around 400,000 customers on an opt-in time-varying rate21. Currently, residential customers can opt into an E-TOU-B option with peak hours from weekdays 4–9 pm, capped at 225,000 customers, while electric vehicle owners can sign up for rate schedule EV-B, a residential time-of-use service that requires the installation of a separate meter. EV-B charges lowest costs in the 11 pm–7 am off-peak period, and higher costs in the peak (2–9 pm) and partial-peak (7 am–2 pm and 9–11 pm) periods.22
The other two California investor-owned utilities, Southern California Edison (SCE) and San Diego Gas & Electric (SDG&E), have approximately 370,000 and 155,000 customers on opt-in TOU rates respectively. Almost 99 per cent of customers that were moved to either SCE or SDG&E’s TOU pilots chose to stay on a TOU plan.
All three of California’s investor-owned-utilities are planning the deployment of default time-of-use rates. SDG&E is beginning its rollout in March 2020, offering two TOU plans with a 4–9 pm peak period and a 2.1:1 peak/off-peak period, as well as an additional super off-peak period from 12–6 am. PG&E and SCE will begin transitioning customers in October 2020.
The California Public Utilities Commission has ordered two customer guarantees as part of the rollout. Customers will be provide an estimate of how their TOU bill compares with what their bill would have been on their old rate so they can see if they saved money or not. A 12-month bill guarantee, such that customers whose first-year bill under the new TOU rate is higher than it would have been under their old rate will be credited the difference.23
21 “Tariffs”, online: PG&E <www.pge.com/tariffs/index.page>.22 Some customers are on an EV-A option that combines the vehicle’s electricity costs with those of the customer’s residence, but this rate is now closed to new enrollments.23 Herman K Trabish, “California utilities prep nation’s biggest time-of-use rate rollout”, Utility Dive (6 December 2018), online: <www.utilitydive.com/news/california-utilities-prep-nations-biggest-time-of-use-rate-roll-out/543402>.24 “Time-of-Day (5-8 p.m.) Rate”, online: SMUD <www.smud.org/en/Rate-Information/Time-of-Day-rates/Time-of-Day-5-8pm-Rate>.25 Jennifer M. Potter, Stephen S. George & Lupe R. Jimenez, “Smart Pricing Options Final Evaluation” (5 September 2014), online (pdf ): SMUD <www.smud.org/-/media/Documents/Corporate/About-Us/Energy-Research-and-Development/research-SmartPricing-options-final-evaluation.ashx>.
Sacramento Municipal Utility District (SMUD), one of the largest U.S. municipalities, has already transitioned its 600,000 customers to default TOU rates. The TOU rate has a peak period of 5–8 pm year-round.24 Rates are highest in the summer months. They feature a peak rate of $0.2941/kWh, an off-peak rate of $0.1209, and an additional mid-peak rate (for noon to 5 pm and 8 pm to midnight) of $0.1671/kWh. Customers without rooftop solar can opt out and elect the Fixed Rate, which charges three different flat volumetric prices based on three different periods of the year. SMUD estimates the Fixed Rate is approximately 4 per cent higher than the TOU rate.
Before filing for its TOU rates, SMUD conducted a successful pilot program in 2012 and 2013 testing TOU, CPP, and TOU/CPP rates. The pilot found significant load shifting, customer preference for TOU over CPP, and about 50 per cent higher average reductions with opt-in versus opt-out (which had 90 per cent retention).25
3. Michigan
In the summer of 2019, Consumers Energy rolled out a TOU “Summer Peak Rate” to approximately 3 per cent of its 1.6 million customers, selecting communities that were representative of its service territory. During the months of June–September, the Summer Peak Rates charges an on-peak rate from weekdays during the 2–7 pm window a price that is about 1.5 times higher than the off-peak rate. The off-peak rate is the regular rate from October–May. On June 1, 2020, all residential customers will be defaulted to the TOU plan.
The rollout is part of Consumers’ “Clean Energy Plan”, which commits to 90 per cent clean energy by 2040. As part of the default TOU rollout, Consumers will deploy a bill impact tool
17
Volume 8 – Article – Ahmad Faruqui and Cecile Bourbonnais
in March 2020 so customers can see how their bill would differ under the new rate.26
4. Maryland
Baltimore Gas & Electric (BGE), Potomac Electric Power Co (Pepco), and Delmarva Power offer opt-out peak-time rebate programs that reward customers with $1.25/kWh bill credits for reducing energy usage during a handful of summer peak demand events.27
Customers receive an alert, usually the day before the savings event, and can choose whether or not to participate in a particular event by reducing their use. Energy and peak demand reductions are bid directly into the PJM wholesale market.
All three utilities offer the program on an opt-out basis, resulting in the enrollment of nearly all customers with smart meters.
According to EIA Form-861, 1.1 million (96 per cent) of BGE customers, 516,000 (98 per cent) of Pepco customers, and 175,000 (98 per cent) of Delmarva customers are enrolled. In 2018, BGE reported a 76 per cent participation rate among its 1.1 million eligible customers, with an average bill credit of $6.30. BGE’s Energy Savings Days program is currently largest-scale deployment of dynamic pricing by any US utility.
5. Illinois
Commonwealth Edison (ComEd) fully deployed smart meters to its 4 million customers between 2013 and 2019. All customers with smart meters are eligible for the Peak Time Savings Program, which is offered on an opt-in
26 “Summer Peak Rate”, online: Consumers Energy <www.consumersenergy.com/residential/rates/electric-rates-and-programs/summer-time-of-use-rate>.27 “Energy Savings Days”, online: BGE <www.bge.com/WaysToSave/ForYourHome/Pages/EnergySavingsDays.aspx>; “Peak Energy Savings Credit”, online: Delmarva <www.delmarva.com/WaysToSave/ForYourHome/Pages/DE/PeakEnergySavingsCredit.aspx>; “Peak Energy Savings Credit”, online: pepco <www.pepco.com/WaysToSave/ForYourHome/Pages/ MD/AboutPeakEnergySavingsCredit.aspx>.28 “Peak Time Savings”, online: ComEd <www.comed.com/WaysToSave/ForYourHome/Pages/PeakTime Savings.aspx>.29 Eric Bell, Shannon Hees & Chris Ramee, “Commonwealth Edison Company’s Peak Savings Program Annual Report” (August 2019), online (pdf ): ICC <www.icc.illinois.gov/docket/P2012-0484/documents/290476/files/506639.pdf>.30 Elevate Energy, “ComEd’s Hourly Pricing Program 2018 Annual Report”, online: ICC <www.icc.illinois.gov/docket/P2015-0602/documents/293022>.31 Jeff Zethmayr & David Kolata, “The Costs and Benefits of Real-Time Pricing” (14 November 2017), online (pdf ): The Citizens Utility Board <citizensutilityboard.org/wp-content/uploads/2017/11/20171114_FinalRealTimePricingWhitepaper.pdf>.
basis.28 In the summer of 2018, approximately 275,000 customers were enrolled in it, representing just under 7 per cent of the total. Customers earn a credit of $1 for every kWh saved relative to their expected usage, where a weather-normalized expected usage is calculated based on usage history. ComEd estimates that most customers will receive a $1–$12 bill credit for each event. Customers are notified on the day of the event, as early as 9 am up to 30 minutes before the event. Historically, ComEd has announced between 3 and 5 events during each summer season, with each event lasting a few hours between 11 am–7 pm. Customers may not participate simultaneously in ComEd’s Central AC Cycling program.29
ComEd also offers its residential customers an Hourly Pricing Program. Under ComEd’s Hourly Pricing program, prices vary hourly according to wholesale market prices. Customers can access online energy-management tools and view their hourly usage from the prior day. In 2018, the 30,251 Hourly Pricing participants saved an average of 10 per cent (~$75) compared to ComEd’s standard fixed-price rate.30 An analysis by Citizens Utility Board and EDF found 97 per cent of ComEd customers would have seen lower bills on RTP without changing behavior. The average customer would have saved $86.63 (13.2 per cent) per year.31
Ameren Illinois, which serves the southern portion of the state, offers an equivalent Power Smart Pricing Program. In 2018, 79 per cent of the Power Smart Pricing’s 13,339 active participants saw savings compared to what they would have paid under Ameren Illinois’ standard fixed-price rate. Customers saved an average of 8 per cent ($58). Both programs are mandated
18
Volume 8 – Article – Ahmad Faruqui and Cecile Bourbonnais
by Illinois’ Public Utilities Act, and overseen by the Illinois Commerce Commission.32
6. Oklahoma
Oklahoma Gas & Electric (OG&E) rolled out a dynamic pricing rate coupled with a smart thermostat to its residential customers a few years ago. The program, called “Smart Hours,” features variable peak pricing, or four levels of peak pricing depending on what day type it happens to be (Low, Standard, High, Critical). There are fixed summer and winter peak hours.33 Prices during peak hours vary depending on system conditions, and are communicated to the customer by 5 pm the previous day. Critical periods can be communicated with as little as two hours’ notice. The expectation is that there would be 10 Low price days, 30 Standard price days, 36 High price days, and 10 Critical price days in a typical year.
The program is also offered to Small GS customers whose annual demand is less than 10 kW or less than 400 kW with a load factor of less than 25 per cent. Some 130,000 customers out of 650,000 (20 per cent) are on that rate today; they control their thermostat setting, not OG&E. Impact evaluations carried out by OG&E show that customers on Smart Hours drop their average peak load by around 40 per cent. Average bill savings amount to around 20 per cent of the customer’s bill.
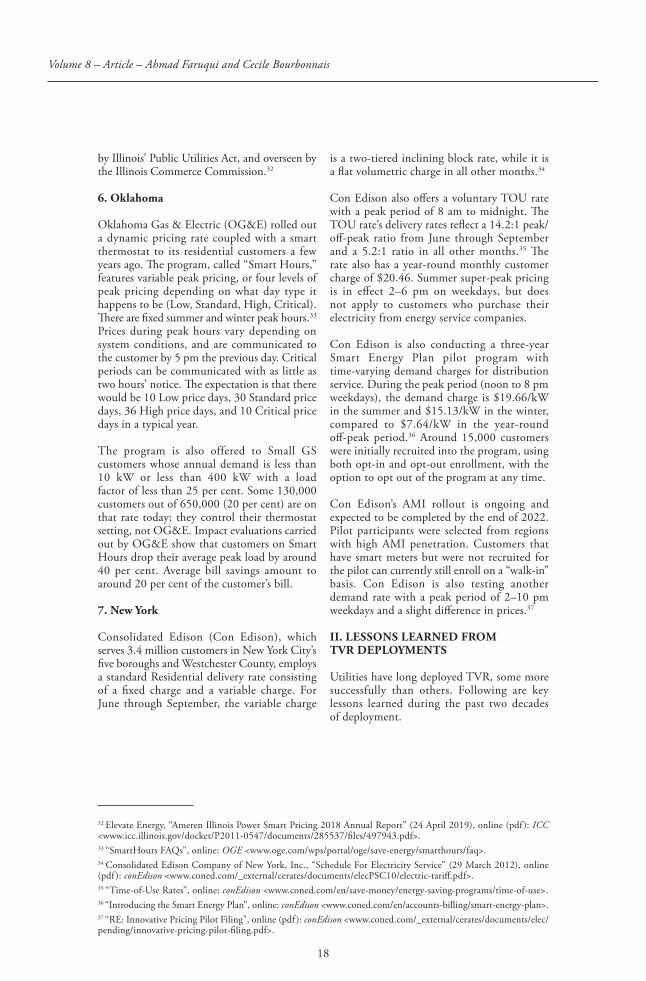
7. New York
Consolidated Edison (Con Edison), which serves 3.4 million customers in New York City’s five boroughs and Westchester County, employs a standard Residential delivery rate consisting of a fixed charge and a variable charge. For June through September, the variable charge
32 Elevate Energy, “Ameren Illinois Power Smart Pricing 2018 Annual Report” (24 April 2019), online (pdf ): ICC <www.icc.illinois.gov/docket/P2011-0547/documents/285537/files/497943.pdf>.33 “SmartHours FAQs”, online: OGE <www.oge.com/wps/portal/oge/save-energy/smarthours/faq>.34 Consolidated Edison Company of New York, Inc., “Schedule For Electricity Service” (29 March 2012), online (pdf ): conEdison <www.coned.com/_external/cerates/documents/elecPSC10/electric-tariff.pdf>.35 “Time-of-Use Rates”, online: conEdison <www.coned.com/en/save-money/energy-saving-programs/time-of-use>.36 “Introducing the Smart Energy Plan”, online: conEdison <www.coned.com/en/accounts-billing/smart-energy-plan>.37 “RE: Innovative Pricing Pilot Filing”, online (pdf ): conEdison <www.coned.com/_external/cerates/documents/elec/pending/innovative-pricing-pilot-filing.pdf>.
is a two-tiered inclining block rate, while it is a flat volumetric charge in all other months.34
Con Edison also offers a voluntary TOU rate with a peak period of 8 am to midnight. The TOU rate’s delivery rates reflect a 14.2:1 peak/off-peak ratio from June through September and a 5.2:1 ratio in all other months.35 The rate also has a year-round monthly customer charge of $20.46. Summer super-peak pricing is in effect 2–6 pm on weekdays, but does not apply to customers who purchase their electricity from energy service companies.
Con Edison is also conducting a three-year Smart Energy Plan pilot program with time-varying demand charges for distribution service. During the peak period (noon to 8 pm weekdays), the demand charge is $19.66/kW in the summer and $15.13/kW in the winter, compared to $7.64/kW in the year-round off-peak period.36 Around 15,000 customers were initially recruited into the program, using both opt-in and opt-out enrollment, with the option to opt out of the program at any time.
Con Edison’s AMI rollout is ongoing and expected to be completed by the end of 2022. Pilot participants were selected from regions with high AMI penetration. Customers that have smart meters but were not recruited for the pilot can currently still enroll on a “walk-in” basis. Con Edison is also testing another demand rate with a peak period of 2–10 pm weekdays and a slight difference in prices.37
II. LESSONS LEARNED FROM TVR DEPLOYMENTS
Utilities have long deployed TVR, some more successfully than others. Following are key lessons learned during the past two decades of deployment.
19
Volume 8 – Article – Ahmad Faruqui and Cecile Bourbonnais
A) DESIGNING THE RATES
Rates should be cost-reflective to promote economic efficiency and equity. However, they should also be customer focused. Unless new rates have savings opportunities, customers will either not join or not alter their usage habits to respond. Savings opportunities can be maximized by discounting off-peak prices substantially compared to the existing rate.
B) MARKETING THE RATES
Most utilities offer time-varying rates but only a handful of customers are on them. Often, customers don’t even know the rates exist due to limited customer outreach and advertising on traditional and social media. Customers who know the rates exist have questions, but customer service staff are untrained to answer them while information on websites is poorly presented and couched in utility-speak that eludes customers. This can be remedied by studying customer service practices of utilities like APS and OG&E, which have large numbers of customers on time-varying rates.
Utilities can also conduct focus groups with customers to get insights on which design features appeal to customers and which ones turn them off. For further insights, conjoint analysis can be carried out with data gathered via online customer surveys.
C) INCLUSION OF ENABLING TECHNOLOGIES
Customer responses to time-varying rates can be facilitated and often magnified by including new digital thermostats rapidly being acquired by customers. For example, OG&E has successfully used smart thermostats to boost response and take the pain out of demand management. Other enabling technologies include digitally-enabled appliances and home-energy controllers.
D) INCLUSION OF BEHAVIOURAL MESSAGING
Research has shown that behavioural messaging or social norming can boost response. This
38 See Ahmad Faruqui & Stephen S. George, “Demise of PSE’s TOU program imparts lessons” (2003) 81:1 Electric Light & Power 14, online: Powergrid International <www.power-grid.com/2003/01/01/demise-of-pses-tou-program-imparts-lessons>.
can be done through mailers, emails and text messages, which inform customers of how their change in usage compares with the response of peers on the same rate.
E) TRANSITIONING TO NEW RATES
Many rollouts are abruptly handled, such that customers are not prepared for the arrival of the new rates, and customer service staff are not trained to answer customer questions. This can be avoided through proper planning.38 n
20
UPDATE: NAFTA 2.0: DRILLING DOWN – THE IMPACT OF CUSMA/USMCA
ON CANADIAN ENERGY STAKEHOLDERS1
John M. Weekes, Darrel H. Pearson, Lawrence E. Smith QC
and Margaret M. Kim*
1 This is an addendum to John M. Weekes et al, “NAFTA 2.0: Drilling Down – The Impact of CUSMA/USMCA on Canadian Energy Stakeholder” (2019) 7:1 Energy Regulation Q 45, online (pdf ): <www.energyregulationquarterly.ca/wp-content/uploads/2019/03/ERQ_Volume-7_Issue_1_2019.pdf>.* John M. Weekes is a senior business advisor at Bennett Jones LLP and was Canada’s chief negotiator for the original NAFTA negotiations an ambassador to the WTO. With his extensive experience, John provides clients with an insider’s perspective on how governments approach such matters, including the negotiation, implementation and management of trade agreements and trade relations.Darrel H. Pearson is a senior partner and Leader of Bennett Jones’ International Trade and Investment Group. Darrel practices all aspects of international trade and customs law, including trade remedies, customs, international trade treaty matters, export regulation, sanctions and controls, goods and services taxes, government procurement dispute settlement, and other regulatory matters concerning Canadian trade regulation. He has appeared before and has served on panels struck under NAFTA Chapter 19 (trade remedy) dispute resolution, and before tribunals and reviewing/appellate courts including the Supreme Court of Canada.Lawrence E. Smith QC is the founding head of the regulatory department and the former Vice Chairman of Bennett Jones. Lawrence was counsel to the National Energy Board, and served as a policy advisor to a Minister of the Government of Canada. He has presented expert testimony in commercial and NAFTA arbitral proceedings; before the California Energy Commission; and appeared as a witness before the Canadian House of Commons and Senate. His practice has focused on pipeline, power and LNG projects, energy import/export approvals and related rate regulation.Margaret M. Kim is an associate in the International Trade and Investment Group of Bennett Jones. Margaret has previously worked as a consultant in the Legal Vice-Presidency Unit of the World Bank.Bennett Jones LLP has been intimately involved in virtually every major energy development in Canada in the past 20 years and has served as a strategic partner to both private and public sector participants in Canada’s energy industry for nearly a century. The strength and depth of our energy and trade experts have been widely acknowledged. With more leading energy lawyers than any other Canadian law firm (Lexpert®), and some of the country’s pioneers in international trade and investment law, Bennett Jones is uniquely positioned to help clients in the energy sector deal with complex legal and regulatory matters across borders.
I. INTRODUCTION
As noted in our original article, the United States-Mexico-Canada Agreement (USMCA or CUSMA) was signed by the leaders of the three NAFTA countries on November 30, 2018. At that time it was unclear how long the ratification process would take. The expectation
was that the biggest ratification challenge would be in the United States Congress where the Democrats had just won a majority in the House of Representatives in the 2018 Congressional elections. The Mexicans moved first when the Mexican Senate ratified the Agreement in June 2019. The Canadian Government introduced an implementing bill
21
Volume 8 – Article – John M. Weekes, Darrel H. Pearson, Lawrence E. Smith QC and Margaret M. Kim
into the House of Commons in early summer but decided to await developments in the U.S. Congress before proceeding further.
In Washington DC, the House Democrats, led by Speaker Pelosi, made clear that they were not prepared to accept the Agreement in its current form. Discussions began between the Trump Administration and the Democrats. These talks took place between a team led by the United States Trade Representative Robert Lighthizer and a team of senior House Democrats selected by Speaker Pelosi. Initially expectations for success were low, but with goodwill on both sides it gradually emerged that the Democrats were trying to work to a “yes.” Lighthizer had signaled that the Administration was prepared to accommodate, in some way, the demands for change set out by the Democrats. Essentially the Democrats wanted stronger dispute settlement provisions particularly with respect to the Labour and Environment chapters of the Agreement. In addition, they wanted to reduce the time period during which biologic drugs would be afforded the protection of the intellectual property provisions of the Agreement. As these internal American negotiations continued, Lighthizer maintained regular contact with his Canadian and Mexican counterparts, keeping them in the picture and to gauge whether Canada and Mexico would be prepared to go along with the changes that he was working on with the Democrats. For Canada this was a relatively easy decision because the changes sought by the Democrats were very similar to proposals that Canada had made during the renegotiation of the NAFTA.
Finally, on December 10, 2019 the three countries agreed to the final package of amendments to the CUSMA, which took the form of a 27-page Protocol of Amendment (Protocol) to the original CUSMA signed a year earlier.2
Once again the Mexicans were first to move with the Mexican Senate ratifying the revised deal on December 12, 2019. In the U.S. Congress first the House and then the Senate voted to approve the deal and to pass
2 This update examines how that Protocol impacts the provisions in the original deal signed on November 30, 2018.3 Bill C-4, An Act to implement the Agreement between Canada, the United States of America and the United Mexican States, 1st Sess, 43rd Parl, 2020, (assented to 13 March 2020); See also “A new Canada-United States-Mexico Agreement” (last modified 24 Avril 2020), online: Global Affairs Canada <international.gc.ca/trade-commerce/trade-agreements-accords-commerciaux/agr-acc/cusma-aceum/index.aspx?lang=eng>.
the associated implementing legislation by overwhelming majorities not seen in over 40 years for a major piece of trade legislation. The President signed the package into law on January 29, 2020, completing the process of American ratification.
Then on March 13, 2020, Bill C-4, An Act to Implement the CUSMA3 was passed by both the House of Commons and the Senate and given Royal Assent. The law will enter into force in Canada on a date to be determined by Order in Council. It is not clear at the time of writing exactly when the CUSMA will enter into force. The Americans are pressing for June 1 but that may require amending the Agreement itself to alter its provisions on entry into force. These provisions would currently provide for entry into force on June 1 only if the letters notifying the other Parties that each Party had completed the internal procedures required for the entry into force were sent before the end of March. That seems unlikely in which case the most likely date for the Agreement to come into force would be July 1, 2020.
In this Article, we examine revisions to the CUSMA of probable interest to energy stakeholders, and summarize the key changes to Canada’s domestic legislation that will take effect when the CUSMA Act enters into force.
II. NAFTA 2.1 – THE AMENDED CUSMA
In our original article, we discussed the following energy-related changes that will result from the CUSMA. They include:
• amendments to rights of investors, including the phase-out of recourse to investor-state dispute settlement between Canada and the United States, and significantly weakened protection for American investors in Mexico;
• revised means of gaining access to government procurement contracts involving the three North American countries;
22
Volume 8 – Article – John M. Weekes, Darrel H. Pearson, Lawrence E. Smith QC and Margaret M. Kim
• elimination of customs duties on imports into the U.S. of Canadian heavy oil containing diluent;
• elimination of the proportionality clause on energy trade between Canada and the U.S.; and
• a bilateral side letter on energy between Canada and the U.S. on energy.
The Protocol signed on December 10 made changes to certain aspects of the Agreement, namely: in the areas of state-to-state dispute settlement, labour and environment, automotive rules of origin, and intellectual property.4 The changes in the first three areas (i.e., dispute settlement, labour and environment) may have direct implications to the energy sector, and are summarized below. The effect of the changes in the latter two areas (i.e., automotive rules of origin and intellectual property) will be of lesser interest for the energy stakeholders.
1. State-to-State Dispute Settlement
The most noteworthy change in the Protocol from a Canadian perspective is the significant strengthening of the CUSMA’s State-to-State dispute settlement mechanism. The State-to-State dispute settlement is an improvement on Chapter 20 of the original NAFTA.
The dispute settlement provisions of the original NAFTA (Chapter 20) and the equivalent CUSMA provisions in Chapter 31 allowed a Party to block the formation of a panel in a State-to-State dispute settlement case by either not engaging in the meeting of the Free Trade Commission of Ministers (required to approve a panel), or by refusing to agree to the proposed roster of panelists from which the panelists were required to be selected. The updated dispute settlement system closes these gaps by causing panels to be automatically established upon request, bypassing the Commission of Ministers. If the government Parties cannot
4 “Summary of revised outcomes” (last modified 28 January 2020), online: Government of Canada <www.international.gc.ca/trade-commerce/trade-agreements-accords-commerciaux/agr-acc/cusma-aceum/summary_outcomes-resume_resultats.aspx?lang=eng> [Revised outcomes].5 Simon Lester, Inu Manak & Andrej Arpas, “Access to Trade Justice: Fixing NAFTA’s Flawed State-to-State Dispute Settlement Process” (2019) 18:1 World Trade Rev 63.6 Revised outcomes, supra note 4.
reach consensus agreement on the roster of panelists within one month, the roster will be formed automatically from the individuals proposed by each government.
No dispute settlement panel has been successfully formed under NAFTA Chapter 20 since 2000, when the United States blocked the establishment of a panel in the U.S.-Mexico sugar dispute.5 The revised dispute settlement provisions are consistent with more modern FTAs, such as the Comprehensive and Progressive Agreement for Trans-Pacific Partnership (CPTPP), which ensure that parties cannot unreasonably delay or block the formation of a panel.
This improvement is all the more important in the shadows cast by the current shutdown of the World Trade Organization (WTO) Appellate Body that has made WTO dispute resolution a less reliable process for dispute settlement by the WTO’s 164 member countries, including Canada, the United States and Mexico.
Going forward, the strengthened state-to-state dispute settlement procedures will provide greater assurance to Canadian energy stakeholders that the provisions of the CUSMA, including those on investment, will be upheld and enforceable, at least by the governments that are parties to the Agreement. This is significant because the CUSMA will phase out private recourse for investors to sue governments once the Agreement comes into force and terminates the investor-state provisions of the NAFTA as between Canada and the United States.
2. Labour
In response to pressure from Congressional Democrats, the United States secured a “Facility-Specific, Rapid Response Labor Mechanism” with Mexico, which is a first-of-its-kind bilateral mechanism for expedited dispute settlement of specific labour obligations concerning freedom of association and collective bargaining.6 Under the new
23
Volume 8 – Article – John M. Weekes, Darrel H. Pearson, Lawrence E. Smith QC and Margaret M. Kim
process, a Party may request an investigation into allegations of labour violations at an exporter’s facility by an independent panel of three labour experts. If the panel concludes that violations exist, the complaining Party may impose penalties on exports from that facility. An identical bilateral mechanism was also created between Canada and Mexico. While this was not a priority request for Canada, once the U.S. had acquired such a provision it was politically imperative for Canada to have one too. There is no such mechanism between Canada and the United States.
In the CUSMA negotiations, labour issues were a major Congressional concern in the United States. The Parties removed language in the Labour chapter’s “Violence Against Workers” provision that conditioned a violation on a “sustained and recurring course of action or inaction”. Also, the amendments reverse the burden of proof for challenging labour violations: as previously worded, a Party had to demonstrate that the other Party’s act or omission constituted a violation of labour rights “in a manner affecting trade or investment between the Parties”. In the amended version, the burden on the complaining Party to prove this point is replaced by a presumption that a labour violation affects trade and investment “unless the responding Party demonstrates otherwise”. These two changes should increase the flexibility to pursue dispute settlement by the Parties in connection with labour chapter violations.
Overall, the CUSMA Labour chapter enhances the equivalent in the original NAFTA in that the Labour chapter requires the Parties to adopt and maintain, in law and practice, labour rights (as recognized by the International Labour Organization) to effectively enforce their labour laws,7 and not to waive or derogate from their labour laws.8 The CUSMA includes a new prohibition of the importation of goods produced by “forced or compulsory labour”, including forced or compulsory child labour.9
Canadian stakeholders who have operations in Mexico, or those considering investment
7 Canada-United States-Mexico Agreement, 30 November 2018, arts 23.3, 23.5 [CUSMA 2018] (Labour Rights and Enforcement of Labour Laws).8 Ibid, art 23.4 (Non-Derogation).9 Ibid, art 23.6 (Forced or Compulsory Labour).10 Ibid, Chapter 24 (Environment).
prospects in Mexico, should be aware of these new labour standards and enforcement provisions under the CUSMA, in order to understand their obligations and recourse available in case of labour-related disputes.
3. Environment
The burden of proof for establishing a failure to comply with environmental obligations has been reversed. The changes should increase the enforceability of the Parties’ obligations in the Environment chapter.
The revised Environment chapter (Chapter 24) recognizes and reinforces the existing commitments of the Parties under various multilateral environmental agreements (MEAs). The amendments restore a provision under Article 104 of the original NAFTA that prioritizes MEA commitments when implementing MEA and trade agreement obligations. The list of covered MEAs for Canada are:
• The Convention on International Trade in Endangered Species of Wild Fauna and Flora;
• The Montreal Protocol on Substances that Deplete the Ozone Layer;
• The Protocol of 1978 Relating to the International Convention to the Prevention of Pollution from Ships;
• The Convention on Wetlands of International Importance Especially as Waterfowl Habitat; and
• The Convention for the Establishment of an Inter-American Tropical Tuna Commission.10
In the event of a conflict between the CUSMA and an MEA, the obligations under the CUSMA will not preclude a Party from taking measures to comply with its obligations under the MEA, as long as the measure is not a disguised restriction on trade.
24
Volume 8 – Article – John M. Weekes, Darrel H. Pearson, Lawrence E. Smith QC and Margaret M. Kim
III. RATIFICATION PROCESS
As noted above, the CUSMA as amended had to be ratified by each Party for the Agreement to come into force, thereby replacing the original NAFTA. And of course each Party had to take steps to ensure its domestic legislation was amended to be in conformity with the provisions of the new Agreement.
1. Mexico
Mexico was the first to ratify the new Agreement. On June 19, 2019, the Senate of Mexico ratified NAFTA 2.0, with an overwhelming majority support (114 in favour, 4 against).11 On December 12, 2019, Mexico’s Senate voted to accept the modifications resulting from the Protocol of Amendment by a vote of 107-1.12 The modifications included increased enforcement of labour and environmental rules, as described above. Notably, Mexico reformed its domestic labour legislations to guarantee secret-ballot votes on union representation and contracts, a measure designed to address, amongst others, concerns of corruption in Mexican unions.13
2. The United States
On January 29, 2020, President Trump signed the USMCA implementing legislation into law.14 The bill had received overwhelming bipartisan support in both the Democratic-controlled
11 Miguel Angle Lopez & Dave Graham “Mexico first to ratify USMCA trade deal, Trump presses U.S. Congress to do same”, Reuters (19 June 2019), online: <www.reuters.com/article/us-usa-trade-mexico-usmca/mexico-first-to-ratify-usmca-trade-deal-trump-presses-us-congress-to-do-same-idUSKCN1TK2U3>.12 Associated Press “Mexican Senate Ratifies Changes to USMCA Trade Pact”, US News (12 December 2019), online: <www.usnews.com/news/business/articles/2019-12-12/mexican-senate-ratifies-changes-to-usmca-trade-pact>.13 US, Congressional Research Service, USMCA: Labour Provisions (IF11308) (10 January 2020), online (pdf ): <fas.org/sgp/crs/row/IF11308.pdf>.14 US, Bill HR 5430, United States-Mexico-Canada Agreement Implementation Act, 116th Cong, 2020 (enacted), online: <www.congress.gov/bill/116th-congress/house-bill/5430/text>.15 The USMCA received bipartisan support, both at the House and the Senate; the House of Representatives approved legislation to implement the USMCA by a 385 to 41 vote, with 193 Democrats and 192 Republicans supporting the legislation; on January 16, 2020, the Senate voted for the USMCA implementing legislation by a 89 (Democratic 38, Republican 51) to 10. See Emily Cochrane “Senate Passes Revised NAFTA, Sending Pact to Trump’s Desk”, New York Times (16 January 2020), online: <www.nytimes.com/2020/01/16/us/politics/usmca-vote.html>; See also John M. Weekes “Canada and USMCA: An Unexpected Success Story”, BRINK (23 January 2020), online: <www.brinknews.com/unexpected-success-story-canada-and-usmca>.16 Heather Long, “The USMCA is finally done. Here’s what is in it”, Washington Post (10 December 2019), online: <www.washingtonpost.com/business/2019/12/10/usmca-is-finally-done-deal-after-democrats-sign-off-heres-what-is-it>.17 “Key democrats push back on Sanders’ USMCA renegotiation”, Inside U.S. Trade, World Trade Online (14 February 2020), online: <insidetrade.com/daily-news/key-democrats-push-back-sanders%E2%80%99-usmca-renegotiation-ambition>.18 SC 2020, c 1 [CUSMA 2020].19 Canadian Energy Regulator Act, SC 2019, c 28, s 10 [CERA]; See also CUSMA 2020, supra note 18, ss 207–12.
House of Representatives and the Senate.15 The very strong bipartisan support for the USMCA provides some assurance that the agreement will be durable over time.16 Interestingly, statements by Bernie Sanders that he would renegotiate the deal got a cold shoulder from House Democrats.17
3. Canada
In Canada, the Canada-United States-Mexico Implementation Act18 (the CUSMA Act) will amend several domestic legislations to bring Canada into conformity with its treaty obligations under the CUSMA. Among them, the following amendments are particularly relevant to Canadian energy stakeholders:
a) The Removal of the Proportionality Requirement
i. Changes to the Canadian Energy Regulator Act (CERA)
The CERA will be revised to reflect the removal of the proportionality requirement that was previously found in Article 605 of the original NAFTA.19 Under its terms, no NAFTA Party’s government measure may reduce the proportion of the supply of an energy product to the other Party based on recent export levels. Their obligation never operated to guarantee the supply of a specific quantity of product; rather, it was designed to prevent governments from
25
Volume 8 – Article – John M. Weekes, Darrel H. Pearson, Lawrence E. Smith QC and Margaret M. Kim
intervening in the market with the effect of reducing supply in a way that disproportionately impacts domestic purchasers in the other country. The NAFTA Parties have never invoked this clause, and concern in the U.S. about the reliability of energy supply dissipated with the enormous growth in its own energy production.
b) Labour-Related Changes
The Canadian Customs Tariff will be revised to reflect new provisions to prohibit the importation of goods produced by forced labour.
i. Changes to Customs Tariff
Currently under sections 132(1) and 136(1) of the Canadian Customs Tariff,20 the importation of goods of tariff item No. 9897.00.00, 9898.00.00 or 9899.00.00 is prohibited.21 The CUSMA Act will amend these provisions of the Customs Tariff by adding to the prohibition list importation of “goods mined, manufactured or produced wholly or in part by forced labour”.22 This imposes legal obligations on importers of goods to ensure that the goods entering into Canada are not connected with violations of labour rights as recognized by the CUSMA. Accordingly, importers and owners of goods being imported into Canada, including those in the extractive sector, should be vigilant of the process through which goods are mined, manufactured or produced prior to being imported into Canada, as importing these prohibited goods may attract civil penalties and criminal consequences.
c) Changes to the Commercial Arbitration Act
As we explained in the original article,23 the Investor-State Dispute Settlement (ISDS) provisions between Canada and the United
20 SC 1997, c 36.21 Ibid, ss 132(1), 136(1) (Prohibited Goods).22 CUSMA 2020, supra note 18, ss 201, 204(7) (amending Description of Goods of tariff item no. 9897.00.00).23 See Weeks, supra note 1 at 47 (Part C.2. What Has Changed? Phase out of the Investor-State Dispute Settlement Provisions between Canada and the United States).24 CUSMA 2018, supra note 7, Chapter 14, Annex 14-C, s 3 (“A Party’s consent under paragraph 1 shall expire three years after the termination of NAFTA 1994”).25 A “legacy investment” is defined as “an investment of an investor of another Party in the territory of the Party established or acquired between January 1, 1994, and the date of termination of NAFTA 1994, and in existence on the date of entry of force of this agreement.” This means that an investment must have been “established or acquired” when the NAFTA is in force, and remain “in existence” on the date the CUSMA enters into force. See CUSMA 2018, supra note 7, Chapter 14, Annex 14-C, s 6(a) (“Legacy Investment Claims and Pending Claims”).26 RSC 1985, c 17 (2nd Supp).
States will be phased out under the CUSMA. The ISDS mechanism is a private recourse available to an investor to bring a claim against another government Party host to the investment. According to CUSMA Chapter 14 on Investment, for three years after the termination of NAFTA,24 existing “legacy investment claims and pending claims”25 will be covered under what were formerly provisions of NAFTA Chapter 11. Thereafter, ISDS will no longer be available as a recourse for investments of Canadian investors in the United States, or those of U.S. investors in Canada.
To reflect this change, the CUSMA Act will revise the an eligible “claim” under the Commercial Arbitration Act26 by replacing the original NAFTA claim under Chapter 11 with legacy investment claims and pending claims, as defined in Annex 14-C of the CUSMA. Canada’s Commercial Arbitration Act implements the United Nations Commission on International Trade Law (UNCITRAL) Model Law on International Commercial Arbitration (Model Law) through the Commercial Arbitration Code.
IV. CONCLUSION
In all likelihood, the CUSMA will come into force on June 1 or July 1, 2020. The three countries are working urgently to ensure their domestic procedures needed for implementation are complete. The U.S. Administration has shown no signs to date of countenancing delay. In any event, with the Agreement finalized and the necessary legislation passed in all three countries, now is the time for businesses involved in trade or investment in the energy sector in North America to take stock of how the new Canada-United States-Mexico Agreement will affect their interests. n
26
CARBON POLICY AND EMISSIONS TARGETS1
Jason Kroft, Jonathan Drance, Glenn Cameron and Victor MacDiarmid*
1 This is a revised version of “Carbon Policy and Emissions Targets” originally published by Stikeman Elliott online: <www.stikeman.com/en-ca/kh/canadian-energy-law/Carbon-Policy-and-Emissions-Targets>.* Jason Kroft (partner), Jonathan Drance and Glenn Cameron (senior advisors) and Victor MacDiarmid (associate) with Stikeman Elliottt LLP.2 See generally Environment and Climate Change Canada, “Canada’s 2018 Greenhouse Gas and Air Pollutant Emissions Projections” ISSN 2562-2773 (Ottawa: 2018) [2018 Emissions Projections]; Environment and Climate Change Canada, “2019 National Inventory Report 1990–2017” ISSN 2371-1329 (Ottawa: 2019) (background information on Canada’s current and historical carbon emissions projects and policy direction as well as its actual and projected levels of carbon emissions).
CANADIAN CARBON POLICY
As we review the current status of Canadian carbon policy in the wake of the 2019 Election, it is clear that the concentration and focus of the federal government on carbon policy during its first term was significant, at least compared to any other area of policy.2 In particular, the government:
• signed the Paris Accord;
• negotiated the Pan-Canadian Framework with the provinces to introduce the concept of carbon pricing and to lay out a pathway to materially reduce the carbon intensity of the Canadian economy;
• passed the Greenhouse Gas Pollution Pricing Act to ensure that some form of carbon pricing actually came into effect across the country targeting a gradual increase to $50/t by 2022; and
• prepared a long-term strategy to achieve deep-decarbonization by mid-century.
Some critics have suggested, however, that Canada’s carbon policy, and in particular its specific targets for future emissions reductions,
are longer on aspiration than on likely achievement. There is some history behind that skepticism.
A central feature of every fresh Canadian carbon policy since the Kyoto Protocol is a grand vision accompanied by a stirring declaration of intent to act. However, any material actions have generally been deferred, only to be taken at some unspecified time in the future. This has resulted in relatively few reductions in the level of actual carbon emissions regardless of any declared goals or targets.
So, in 2005, the base year for calculating Canadian targets under the Paris Accord, carbon emissions were in the neighbourhood of 732 Mt per annum. After more than a decade, the adoption of various ambitious targets for future emissions reductions and various government initiatives almost too numerous to count, carbon emissions in 2016 were still up at 704 Mt per annum — only a 4 per cent reduction from the 2005 base year.
Now, in fairness, both population and economic growth meant that the overall carbon intensity of the Canadian economy declined materially over that period even if actual emissions did not. The objective of both national and global carbon policy, however, is to actually reduce
27
Volume 8 – Article – Jason Kroft, Jonathan Drance, Glenn Cameron and Victor MacDiarmid
carbon emissions per se — and on that front the rhetoric of Canada’s carbon policy has yet to be met by commensurate action.3
Indeed, since the Kyoto Protocol was signed in 1997:
• Canada has yet to meet any target it has set to reduce carbon emissions, including those under the Kyoto Protocol itself or the subsequent Copenhagen Agreement.
• Canada will clearly miss its 2020 target under the Paris Accord which was set at 20 per cent below the levels of its 2005 base year — or roughly 585 Mt. Canada currently projects its 2020 carbon emissions could be closer to 700 Mt, more or less — which would be in a range of 15 per cent to 20 per cent higher than the 2020 target.
• Canada is not yet on track to meet its 2030 target under the Paris Accord, which was set at 30 per cent below its 2005 base year — or roughly 512 Mt. Canada currently projects its 2030 carbon emissions could plausibly be as high as 701 Mt. To be fair, with various additional measures that have been announced but not fully implemented, 2030 carbon emissions might possibly be lowered to 592 Mt — but even this would be roughly 15 per cent above the 2030 target.
EMISSIONS TARGETS AND WILLINGNESS TO PAY
Canada’s struggles with emission targets are hardly unique. Virtually all countries which are major carbon emitters have an “emissions gap” of one form or another under the Paris Accords: either they have declared reasonable targets but are not meeting them or they are meeting their targets but the targets themselves are not sufficiently ambitious to meet the goals of the Paris Accords themselves. The United
3 See Ecofiscal Commission, “Bridging the Gap: Real Options for Meeting Canada’s 2030 GHG Target” (November 2019) at 3–5, online (pdf ): <ecofiscal.ca/wp-content/uploads/2019/11/Ecofiscal-Commission-Bridging-the-Gap-November-27-2019-FINAL.pdf> [Ecofiscal]; 2018 Emissions Projections, supra note 2 at 10, 41 (particularly the charts and the related text).4 United Nations Environment Program, Press Release, “Cut global emissions by 7.6 per cent every year for next decade to meet 1.5°C Paris target – UN report” (26 November 2019), online: <www.unenvironment.org/news-and-stories/press-release/cut-global-emissions-76-percent-every-year-next-decade-meet-15degc>.
Nations Environment Program has indicated that the current targets and commitments established under the Paris Accords fall far short of what is needed to meet the goals of holding temperature increases to less than 2.0°C above pre-industrial levels and preferably to 1.5°C above:
“On an annual basis, this means cuts in emissions of 7.6% per year from 2020 to 2030 to meet the 1.5°C goal and 2.7% per year to meet the 2.0° C goal. To deliver on these cuts, the levels of ambition…must increase at least fivefold for the 1.5°C goal and threefold for the 2.0°C.”4
Canada’s own emissions gap has persisted for roughly a generation and the emissions gaps in other countries are plainly both widespread and significant.
Given this consistent disparity between targets and actual achievements we are inclined to accept the view of some analysts and commentators that there is a fundamental structural reason that makes carbon reduction goals so hard to achieve. In his landmark Lloyd’s of London speech in 2015, Mark Carney, then the Governor of the Bank of England, identified “the tragedy of the [time] horizon” as a key issue that bedevils all carbon policy:
“The challenges currently posed by climate change pale in significance compared with what might come. The far-sighted amongst you are anticipating broader global impacts on property, migration and political stability, as well as food and water security. So why isn’t more being done to address it?…We don’t need an army of actuaries to tell us that the catastrophic impacts of climate change will be felt beyond the traditional horizons
28
Volume 8 – Article – Jason Kroft, Jonathan Drance, Glenn Cameron and Victor MacDiarmid
of most actors — imposing a cost on future generations that the current generation has no direct incentive to fix.”5
Carney went on to note the specific mismatch between the time horizons of politicians and regulators and the multi-generational time horizon required to effectively limit carbon emissions. Specifically, he noted that the time horizons for actors with the power to set climate policy were attuned to the business cycle (2–3 years), the political cycle (4–5 years) and, at the far end, to mandates for assuring financial stability (10 years at most). Meanwhile the most consequential direct impacts from carbon emissions and climate change are likely to be felt over a period that starts roughly 20 years in the future and continues for decades, if not for a century or more thereafter.
Moreover, Carney said, the issue of the time horizon does not end there. He noted that the damage caused by carbon emissions was cumulative. So, from the perspective of optimal policy, societies might rationally be inclined to make significant expenditures now to avoid incurring even greater costs in the future. However, politics and specifically diverging inter-generational political interests, tend to constrain this policy approach.
All of these issues fundamentally shape the politics of carbon. At the present time, and for the immediately foreseeable future, many will feel a natural human inclination to resist making material and present sacrifices for benefits that will be realized, mostly by future generations, in the relatively distant future. It is only over time that the public’s willingness to pay is likely to materially increase as the visible costs of carbon emissions go up, as the consequences become more proximate and as a greater portion of the population can expect to be directly and adversely affected over their own lifetimes.
5 Mark Carney, “Breaking the Tragedy of the Horizon – Climate Change and Financial Stability” (29 September 2015) at 2–3, online (pdf ): Bank for International Settlements <www.bis.org/review/r151009a.pdf>.6 Éric Grenier “Canadians are worried about climate change, but many don’t want to pay taxes to fight it: Poll”, CBC (18 June 2019), online: <www.cbc.ca/news/politics/election-poll-climate-change-1.5178514>.7 Jesse D. Jenkins, “Why Carbon Pricing Falls Short” (April 2019) at 8, online (pdf ): Kleinman Center for Energy Policy <kleinmanenergy.upenn.edu/sites/default/files/policydigest/KCEP-Why-Carbon-Pricing-Falls-Short-Digest-singles.pdf>.
This is all reflected in current opinion polling and more general analyses of public attitudes to carbon policy. For example, the CBC in the summer of 2019 reviewed polling data about carbon emissions and climate change and noted as follows:
“Canadians are deeply concerned about climate change and are willing to make adjustments in their lives to fight it — but for many people, paying as much as even a monthly Netflix subscription in extra taxes is not one of them…The findings point to a population that is both gravely concerned about the heating of the planet but largely unprepared to make significant sacrifices…” 6
This conclusion is substantially consistent with findings in similar surveys and analyses of both polling and utility customer data.7
IMPLICATIONS FOR POLICY DESIGN
The mismatch in the timing of the costs and benefits flowing from limiting carbon emissions and any resulting limitation on the willingness of the public to pay has political and policy design implications:
“Climate change mitigation is a global collective action challenge, d emand ing coo rd ina t ed action among many disparate stakeholders (e.g. nations, emitting industries, individual consumers). Meanwhile the benefits of climate mitigation are uncer ta in, unevenly distributed and accrue primarily to future generations while the costs of climate mitigation
29
Volume 8 – Article – Jason Kroft, Jonathan Drance, Glenn Cameron and Victor MacDiarmid
are born immediately, with acute distributional impacts for particular constituencies.”8
Given these dynamics, the incentives facing policy-makers, especially elected ones, tend to support policies that:
“…minimize direct and salient impacts on businesses and households, minimize burdens on regulated and strategically important sectors and/or redistribute welfare and rents in a manner that secures a politically durable coalition.”9
In terms of the implications for specific policy designs:
“Policymakers have in practice preferred command-and-control regulations that are narrowly targeted (and thus allow for regulatory capture while reducing scope for opposition) and subsidies (which allow for transfers of rents while spreading policy costs broadly and indirectly across the tax base) rather than uniformly pricing CO2.”
10
A recent paper from Canada’s Ecofiscal Commission11 focuses attention directly on the various trade-offs between the most economically efficient and effective policy tools and those which are most politically acceptable. Carbon pricing — and in particular carbon taxes imposed directly and openly on individuals and households — appear to be among the most effective and efficient ways of reducing carbon emissions. However, their very visibility can make them the most politically challenging and disruptive to implement. Meanwhile specific regulations imposed on particular industries or sectors — or subsidies granted to other industries and sectors — are often costlier or more cumbersome or less effective than carbon pricing. However, they
8 Jesse D. Jenkins & Valerie J. Karplus, “Carbon pricing under binding political constraints” (2016) United Nations University World Institute for Development Economics Research Working Paper No 2016/44, online (pdf ): <www.wider.unu.edu/sites/default/files/wp2016-44.pdf>.9 Ibid at 2.10 Ibid.11 Ecofiscal, supra note 3.
can often be designed to be less politically visible to individuals or households and therefore less politically disruptive.
The obstacles to organizing effective collective action to limit carbon emissions are on continuous display and operate at every level. At the global level, they have led to the outright failure or to the weak implementation of international agreements and accords. For instance, most recently the Madrid Conference was supposed to — but did not — resolve the mechanisms for a global system of trading in emissions credits required to implement the Paris Accords. At the national level, we have seen several decades of failure by Canada to meet its declared emissions targets. And at the sub-national level, we have seen very recent attempts to effectively shield local populations from federal carbon pricing signals by proposing to exempt individuals or households from some or all of federal carbon taxes or to offset them by decreasing provincial taxes on items like gasoline or home heating fuel.
To meet our future carbon emissions targets, it will not be enough to have policies that meet the concerns of traditional economics. We will need to devote equivalent effort to designing and implementing a mix of policies that are politically sensible and realistic and that can bridge the gap between our best intentions and our actual results. n
30
ONTARIO’S ELECTRICITY MARKET WOES: HOW DID
WE GET HERE AND WHERE ARE WE GOING?
Brady Yauch*
* Brady Yauch is the manager of Markets and Regulatory Affairs at Power Advisory LLC. He has worked in the IESO’s compliance division and appeared many times before the Ontario Energy Board (OEB). He has been published extensively on matters related to electricity markets and regulation.1 Neil B. Freeman, The Politics of Power: Ontario Hydro and its Government, 1906-1995, (Toronto: University of Toronto Press, 1996) (HELCO’s was viewed simultaneously as a provincial corporation and a trustee of a municipal distribution co-ops).2 Hydro “sold” power to local distributors at cost.3 Dawna Petsche-Wark & Catherine Johnson, “Royal Commissions of Inquiry for the Provinces of Upper Canada, Canada and Ontario 1792 to 1991: A Checklist of Reports” (1992) at 64–65, online (pdf ): Ontario Legislative Library <www.ontla.on.ca/library/repository/mon/27002/132991.pdf>; Ronald Daniels & Michael Trebilock, “Electricity Restructuring: The Ontario Experience” (2000) 33:2 Can Bus LJ 161; John Cruickshank, “Province to probe Ontario hydro costs”, The Globe and Mail (21 October 1983) 12 (Ontario Hydro’s debt in 1983 accounted for half of Ontario’s total outstanding debt).4 Lawrence Solomon, “Where should Ontario Hydro go from here?”, The Globe and Mail (19 August 1997) A21.
Ontario’s electricity market is materially different than the one envisioned when it opened in May 2002. In the lead-up to market opening, the electricity market was expected to provide competition, lower prices and transparent price signals to both consumers and investors.
Yet, over time, those principles became secondary concerns, overridden by new priorities that increased prices, reduced competition and distorted price signals.
Ontario again redesigning its key components of its electricity market in an effort to make good on a number of the promises made in 2002. This report provides a guideline to both what went wrong and whether these issues will be addressed going forward.
PART I: THE RISE AND FALL OF PUBLIC POWER IN ONTARIO
The story of Ontario’s electricity market really begins in 1906.
It was then that the Hydro Electric Company of Ontario (HELCO) — or “Hydro” — was founded by the province and led by Adam Beck. While Hydro was established to build, own and operate a transmission network to deliver power across Ontario, it quickly broadened this vision to include the construction of hydroelectric dams.1 The mantra of Hydro was to deliver, “power at cost.”2
Hydro eventually came to take over the entire electricity sector, but not without controversy. By the 1920s, after a series of cost overruns at one of its largest generation projects — the Queenston-Chippawa Generating Station (later renamed Adam Beck 1) — Hydro’s debt accounted for more than one-half of the province’s total debt.3 One commission in 1924 found that many of Hydro’s construction projects were unjustifiably elaborate and costly.4
But with Hydro’s importance to the growing electricity sector and the provincial economy firmly established — as well as remaining
31
Volume 8 – Article – Brady Yauch
popular with the public at large — Hydro’s economic and political influence grew stronger.
Demand for power continued to grow year-over-year and decade-over-decade, leading Hydro— officially transformed into a crown corporation in the 1970s and renamed Ontario Hydro — to expand its generation fleet beyond hydro dams. In the 1950s and 1960s it began construction on a series of large coal generators, such as the Lakeview generating station — the largest coal plant in the world at the time.5
By the 1970s, Ontario Hydro began construction on a series of nuclear generators, bringing the four-unit Pickering Generating Station into service in 1971, the first large-scale nuclear plant in Canada. In the 1970s and 1980s, Hydro built the four-unit Bruce Generation Station (Bruce A), four more units at Pickering (Pickering B) and another four units at Bruce (Bruce B). In 1990 — after years of delays and billions of dollars in cost overruns — Ontario Hydro completed the four-unit Darlington Generating Station, fully transforming itself into a predominately nuclear utility.6 By 1992, its nuclear fleet accounted for 53 per cent of total output.7
Ontario Hydro’s nuclear ambitions stood in stark contrast to its financial health. When the Darlington plant was completed in 1991, Ontario was suffering from a severe economic recession, yet Ontario Hydro was pushing for a 40 per cent rate increase.
5 Ontario Power Generation, “Lakeview GS 43 years of service to the Province of Ontario A pictorial retrospective of Lakeview Generating station” online (pdf ): Ontario Legislative Library <www.ontla.on.ca/library/repository/mon/16000/269120.pdf>.6 The final unit at Darlington didn’t come into service until 1993.7 Ontario Hydro, “Ontario Hydro Statistical Yearbook” (1992), online (pdf ): <archive.org/details/ontariohydrostat1992onta/page/6/mode/2up>.8 “Ontario Hydro loses $6.3-billion”, The Globe and Mail (18 February 1998) A1.9 The rate freeze was put back in place just months after the market opened.10 Anthony Depalma, “Canadians export a type of reactor they closed down”, The New York Times (3 December 1997), online: <www.nytimes.com/1997/12/03/world/canadians-export-a-type-of-reactor-they-closed-down.html>.11 Martin Mittelstaedt, “Change ‘unavoidable’ for Ontario Hydro, Lights Out: Giant utility’s woes mean a competitive market ‘is now inevitable”, The Globe and Mail (18 August 1997) A1.12 Ontario Power Generation, “Annual Information Form for the Year Ended December 31, 2017” (9 March 2018), online (pdf ): <www.opg.com/document/2017-annual-information-form-pdf>.13 Ontario Hydro ultimately built 4 nuclear units at Darlington. In 2006 it applied to build additional units at the site, but never moved ahead with the plan.
At the time, Ontario Hydro’s debt amounted to more than one third of the province’s total indebtedness. The financial deterioration culminated in a series of write-downs. First, a $3.6 billion write down in 1993 and later a $6.6 billion write down in 1997.8 These were the two largest write downs in Canadian corporate history. In 1993, the province implemented a rate freeze that was to remain in effect for the remainder of the decade and into 2002.9 By the end of the 1997, eight of Ontario Hydro’s 19 nuclear reactors were shut down due to poor performance and safety issues.10
Ontario Hydro’s reputation, like its finances, was teetering on the brink of collapse.11
One of the biggest problems facing Ontario Hydro was that it overbuilt the grid on the assumption that electricity demand would continue to grow, as had occurred throughout the 20th century. In the late 1980s, Ontario Hydro forecast demand would hit 184 TWh by 2000 — nearly 20 per cent higher than actual demand of 153 TWh in that year and more than 50 TWh higher than demand in 2017.12 In the short-term, Ontario Hydro expected demand to reach 159 TWh in 1994, even though actual demand turned out to be 135 TWh.13
In short, the utility had too much supply and too little demand.
32
Volume 8 – Article – Brady Yauch
Given that many of Ontario Hydro’s costs were fixed, lower demand increased the average cost to be recovered for each unit of power generated. The result was Ontario Hydro asking for a 40 per cent rate hike in the midst of a recession. A public reckoning on the fate of public power took hold.14
By 1999, Ontario Hydro’s reign as the province’s electricity monopoly was officially over.
In the end, Ontario Hydro was left holding $38.1 billion in debt and other liabilities, with more than half of that amount — $20.9 billion — unsupported by the value of its assets. Ultimately, $7.8 billion of that debt was unable to be paid down from future revenues and was collected from ratepayers in the form of a monthly charge known as the Debt Retirement Charge, which remained in effect until April 2018.15
PART II: BREAKING UP (ONTARIO HYDRO) IS HARD TO DO
Ontario Hydro’s financial demise shook the provincial legislature and economy. It also coincided with a push in the 1990s — both in Ontario and jurisdictions around the world — to deregulate the energy sector and transition to one based on competition and market principles, rather than a government-owned, top-down public utility model.16
In 1995, an Advisory Committee — known as the Macdonald Committee — was established to “study and assess options for phasing in competition in Ontario’s electricity system.” The committee called for an end to Ontario Hydro’s monopoly on generation, an independent transmission network open to private generators, an independent system operator and a new regulatory structure to oversee the sector and allow for greater independent oversight. It also called for full retail and wholesale competition. The report was a stark break with the last century of Ontario Hydro’s dominance.
14 Bertrand Marotte, “The crisis at Ontario Hydro is a…”, CanWest News (13 August 1997) 1.15 Office of the Auditor General of Ontario, “2013 Annual Report” (2013) at 318–20, online (pdf ): <www.auditor.on.ca/en/content/annualreports/arreports/en13/2013ar_en_web.pdf>.16 The United Kingdom led the way with the privatization of its Central Electricity Generating Board (CEGB) in 1991.17 Marotte, supra note 14.
The committee’s recommendations paved the way for the eventual breakup of Ontario Hydro in 1999 into five parts — Ontario Power Generation (OPG), Hydro One, the Independent Market Operator (later renamed the Independent Electricity System Operator), the Electrical Safety Authority (ESA) and the Ontario Electricity Financial Corporation (OEFC). One key recommendation was that Ontario Hydro’s generation division be split into various units and required to compete against one another. The report called for the nuclear unit to be split into competing entities, the hydroelectric stations to be grouped by river system and the thermal units to operate as distinct entities.
By 1997, the Government of Ontario issued a white paper laying out its vision for the electricity sector — stopping short of adopting the full list of recommendations from the Macdonald Committee. While the white paper called for splitting Ontario Hydro into a generation business and a transmission and distribution business, the generation business — comprising of nuclear, hydroelectric and thermal generators — would remain under public ownership and control nearly the entire market.
By 1998, the Government of Ontario passed Bill 35, the Energy Competition Act — which included the Electricity Act and the Ontario Energy Board Act — that formally laid out the breakup of Ontario Hydro. It also provided the Ontario Energy Board greater power in setting rates, among other changes.
The end of Ontario Hydro was complete.
The underlying theme in both the Macdonald Committee and the subsequent white paper was that a “competitive” electricity system would overwhelmingly benefit the province and its ratepayers by reducing prices. The push for deregulation was supported by a number of key industry players, notably the Association of Major Power Consumers in Ontario (AMPCO) and Independent Power Producers’ Society of Ontario (IPPSO).17 Small volume
33
Volume 8 – Article – Brady Yauch
customers (largely households) appeared eager to participate in the competitive retail market, with nearly one million of Ontario’s more than four million electricity customers having signed contracts with various retail intermediaries by the time the market opened in 2002.
While the market was initially scheduled to open in 2000, that date was subsequently pushed back to May 2002.
Other changes were also introduced in an effort to reduce OPG’s market power, as it continued to own and operate nearly 90 per cent of the generation assets in Ontario. In an attempt to reduce the public utility’s market power, the Market Power Mitigation Agreement (MPMA) was introduced in 1998.
The MPMA contained two key proposals. First, it capped the price paid to OPG on 90 per cent of its domestic sales at 3.8 cents per kWh. Anything above that amount — if wholesale prices were greater than 3.8 cents per kWh — would be rebated to Ontario consumers. Secondly, within ten years of the market opening, OPG would reduce its generating capacity to no more than 35 per cent of Ontario’s total capacity. OPG would also reduce its control of price setting, or marginal, generating plants to 35 per cent of the province’s total within 42 months.
In July 2000, OPG agreed to an 18-year lease with a private consortium to operate its four Bruce B nuclear units. OPG hailed the lease as “a major initial step” in meeting the terms of the MPMA.18 In 2002, OPG also sold four hydroelectric generators with a total capacity of 490 MW.19
Yet, contrary to the MPMA, OPG’s market power was never reduced to the levels imagined
18 Ontario Power Generation, “2000 third quarter report” (2000) at 7, online (pdf ): <archive.opg.com/pdf_archive/Financial%20Reports/F129_OPGQ3.pdf>.19 Martin Mittelstaedt, “Brascon buys four Ontario hydro plants”, The Globe and Mail (9 March 2002), online: <www.theglobeandmail.com/report-on-business/brascan-buys-four-ontario-hydro-plants/article18286993>.20 Ontario Power Generation, “2012 Annual Report” (2013), online (pdf ): <archive.opg.com/pdf_archive/Financial%20Reports/F035_2012AnnualReport.pdf>.21 Paris Fronimos, “ The Electrical industry in Ontario: Why Staying the Courts Matters” (16 March 2006), online (pdf ): CABREE <www.ualberta.ca/business/centres/carmen/energy/~/media/5AA6406DBF434513A26C9AAA012BB805.ashx>.22 Andrea Baillie, “Ontario passes law to freeze electricity rates for four years”, Canadian Press (9 December 2002).23 Fred Grobet, Don McFetridge & Tom Rusnov, “Market Surveillance Panel Monitoring Report on the IMO-Administered Electricity Markets” (17 December 2003), online (pdf ): OEB <www.oeb.ca/documents/msp/panel_mspreport_imoadministered_171203.pdf>.
prior to market opening. In 1999, for example, OPG moved forward with its decision to bring the four Pickering A units back into service. By 2012 — ten years after the market opened — OPG’s in-service generation capacity remained at 53 per cent.20 In 2005, it still owned as much as 72 per cent of installed capacity in Ontario.21 OPG continues to own and operate around 50 per cent of installed capacity.
PART III: ONTARIO PULLS BACK FROM DEREGULATION
In May 2002, after a near two-year delay, the market opens.
But just as quickly as the market opened, the province passed legislation freezing retail prices at 4.3 cents per kWh for the next four years.22
While the wholesale market continued to operate as planned, the price freeze directly undermined the price signal that a deregulated energy market was intended to send to consumers. Because the freeze was applied retroactively to May 2002, it also undermined the decision of the more than one million consumers to sign fixed contracts with private retailers.23 In its first major review of the electricity market, the Market Surveillance Panel (MSP) highlighted that the price freeze “removed any incentive…to conserve energy and clearly resulted in inefficient consumption decisions.”
Initially, the price freeze was intended only for small-volume customers. But by March of 2003, the province expanded the price freeze to include most small businesses. Eventually, customers covered by the price freeze accounted for more than half of all power consumed in Ontario.
34
Volume 8 – Article – Brady Yauch
The price freeze proved costly for the province. The rebate covered the difference between wholesale prices and the level determined by legislation. In the year following market opening, the average wholesale price was 6.2 cents per kWh — or 44 per cent higher than the legislatively mandated retail freeze. The cost of that difference — financed by the provincial agency — the Ontario Electricity Financial Corporation (OEFC) was approximately $730 million in the first year.24
So what went wrong?
There were two main factors that pushed prices higher. First, 2002 had an exceptionally hot summer, leading to higher than anticipated demand. Second, the market was hit by a number of supply issues, both expected and unexpected, that resulted in a supply shortage. When the market opened in May 2002, the average wholesale price was 3.01 cents per kWh, rising to 3.71 cents per kWh in June. By July that figure hit 6.2 cents per kWh, soaring to $1.03 per kWh — or $1028.42 per MWh — in one hour in September.25 Nonetheless, prices in Ontario during the month of May and June were actually lower than most neighbouring jurisdictions, while they were slightly higher in July and August.26
Higher temperatures meant higher demand — with AC usage having transformed Ontario from a winter peaking jurisdiction to a summer peaking one. Energy demand grew around 1.6 per cent annually between 1984 and 2001, but jumped by 5.5 per cent in 2002.27 High temperatures and dry weather conditions also lowered the amount of water available to power the province’s fleet of hydroelectric generators.
24 Michael J. Trebilcock & Roy Harb, “Electricity Restructuring in Ontario” (2005) 26:1 The Energy J 123; See “To pay the market price for Ontario’s electricity”, The Globe and Mail (19 August 2003), online: <www.theglobeandmail.com/opinion/to-pay-the-market-price-for-ontarios-electricity/article1334784/> (total cost was $1.5 billion, but was offset by rebates from OPG).25 Price spikes of $2,000 per MWh, which is the IESO-administered price cap, continue to occur in Ontario, but happen for a small number of five-minute intervals.26 Janet McFarland, “Electricity cheaper in Ontario: study”, The Globe and Mail (13 June 2002), online: <www.theglobeandmail.com/report-on-business/electricity-cheaper-in-ontario-study/article25298346>.27 Note that demand fell in the early 1990s as a result of a severe recession and the same time the Darlington nuclear plant entered service. Demand eventually picked up in the back half of the 1990s and continued to grow until 2005.28 As discussed later, many of the supply issues were known before market opening. What wasn’t expected was the sudden increase in demand that exacerbate that shortage.
The surge in demand and subsequent supply shortage was initially unexpected.28 Just one month prior to the market opening, the Independent Electricity Market Operator (IMO) noted that, “[b]ased on existing and proposed facilities, Ontario is expected to have reliable supply of electricity for the 10-year period under a wide variety of conditions.”
For years, Ontario had a surplus of power. Generation capacity was nearly 20 per cent higher than peak demand in 1996, but by the summer of 2002 it had fallen to a 1.5 per cent power deficit, which was met by imports from neighbouring jurisdictions. The power deficit saw the IMO issue multiple power warnings over the summer, urging consumers to cut demand.
Ontario was also facing a number of supply issues, although many of these issues had been evident for years prior to the market opening. Combined with these known supply issues were a number of unexpected outages.
For starters, a large portion of the province’s nuclear fleet remained offline. Between 1995 and 1998, both the Bruce A and Pickering A nuclear reactors, which amounted to around 3,000 MW and 2,000 MW of capacity, respectively, were taken offline for a variety of performance and safety issues noted in a 1997 assessment of Ontario Hydro’s nuclear assets.
In 1999, OPG announced its decision to bring the Pickering A units back to service — at an initial cost of $840 million, but eventually completed for an estimated $3 to $4 billion — with the first unit expected to be back in service by 2001. The last of the four units was expected to be back online by the end of 2002. The reality was that the first of the four Pickering units did not come back online until
35
Volume 8 – Article – Brady Yauch
late 2003. OPG later decided not to refurbish two of the four units due to cost concerns.29 The delays at Pickering created a giant hole in the province’s supply mix.
Nonetheless, these supply issues were known before the market opened.
There were also a few unexpected delays, although they were minor in scale. Hydro One had expected to increase its intertie capacity at the Michigan border by 500 MW by the summer of 2002, but that work was delayed.30 One of the nuclear units at Bruce B (unit 6) was also unexpectedly offline, removing a slice of the generation mix in August when demand in the province was at its peak.
Surging wholesale prices produced a public backlash when the market was in its infancy. In response, the province intervened in letting the market dictate prices at the exact moment the market was providing the right signal — high demand and a shortage in supply pushed prices higher, as market theory predicted. The province’s price freeze, in contrast, encouraged more consumption at a time of power deficits.31
The MSP found that, while prices in Ontario spiked as a result of a surge in demand and reduced supply, wholesale prices over the summer were largely in line with neighbouring jurisdictions that also operated a wholesale market. Off-peak prices in Ontario were, in six of nine months in 2002, actually lower on average compared to neighbouring markets.32 The surge in peak prices, particularly in August and September, was a clear signal to consumers that supply conditions in Ontario were tighter than initially anticipated. The price freeze undermined this signal.
29 The Honourable Jake Epp, Peter Barnes & Robin Jeffrey, “Report of the Pickering “A” Review Panel” (December 2003), online (pdf ): Ontario Legislative Assembly <collections.ola.org/mon/7000/10317476.pdf>; Roma Luciw, “OPG cancels Pickering repairs”, The Globe and Mail (12 August 2005), online: <www.theglobeandmail.com/report-on-business/opg-cancels-pickering-repairs/article1121297>.30 Trebilcock, supra note 24.31 By October 2002, as the weather cooled, demand dropped on its own accord and wholesale prices came down.32 “Market Surveillance Panel Monitoring Report on the IMO-Administered Electricity Markets” (24 March 2003), online (pdf ): OEB <www.oeb.ca/documents/msp/panel_mspreport_imoadministered_240303.pdf>.33 Dina O’Meara, “Sithe puts off power project, blames capacity sales rules”, National Post (30 October 2002) FP12.34 Steve Erwin, “Price caps in Ontario electricity market risky, power producer warns”, Canadian Press (7 November 2002).35 Steve Erwin, “Energy industry sees little reason to build new supply after Eves’ price cap”, Canadian Press (11 November 2002).
In the run-up to market opening, investors also remained skeptical of the province’s enthusiasm for a competitive market. For starters, there was a near two-year delay in the market opening. Secondly, up until 2001, OPG had not divested any of its assets, as was intended by the mitigation agreement. Thirdly, from 1999 to 2001, OPG had actually increased its market power with its decision to return the four units at Pickering A to service. Fourthly, in 2000, the province announced a freeze on the sale of OPG’s coal-fired units for environmental reasons — maintaining OPG’s market power. By 2002, the province fully blocked the sale of two of OPG’s coal-fired units. In 2002, Sithe Energies announced it was suspending plans to build two power plants — even though it had already been granted regulatory approval — citing OPG’s continued market power and changing government policy as two reasons.33
The price freeze implemented by the province months after the market opened simply put a further chill on the sector. An executive at one of Canada’s largest private power utilities called the price cap a “recipe for disaster.”34 Other investors said they were reluctant to invest in the sector until the Pickering A units were back online and its impact on wholesale prices was clear. One industry executive noted bluntly:
“I can’t see any generators wanting to invest in this province.”35
While the price freeze announced in 2002 was expected to be in place until 2006, it proved too expensive for the province. In April 2004 the price cap was raised to 4.7 cents per kWh on the first 750 kWh of consumption and 5.5 cents for each unit above that threshold. By April 2005, the price cap was raised once again to 5 cents on the first 750 kWh and
36
Volume 8 – Article – Brady Yauch
5.8 cents for each unit above that threshold. By November of 2005, OPG’s nuclear and baseload hydroelectric units were placed under full OEB regulation.
Nonetheless, even without the legislative intervention that would come to dominate later in the decade, the electricity market suffered from design flaws right from the start. These shortcomings included: the lack of location-based prices (Ontario instead implemented a uniform price across the province), OPG’s continued market dominance in wholesale market and system operator intervention. A number of these issues remain in place to this day.
PART IV: THE HYBRID STRUCTURE TAKES HOLD
The election of a new government in 2003 ushered in a new era in the province’s electricity sector. While the new government maintained the wholesale electricity market, it introduced legislation that reduced competition by establishing a provincial-led agency to procure new generation, among other policies. In time, the provincial agency responsible for new supply would be the sole source of new generation in Ontario and nearly all generators would be incented by some form of out-of-market payment.
The so-called “hybrid” market was now in full swing.
The hybrid market’s establishment is most tied to the passing of Bill 100, the Electricity Restructuring Act (2004), which created the Ontario Power Authority (OPA), established rate regulation for a majority of OPG’s generating assets and mandated the annual setting of retail rates for customers by the OEB.36 The province also abandoned the MPMA.
At the time of the bill’s passing, there had been little new private sector investment in the sector and, as a result, almost no new competitive
36 Ministry of Energy, News Release, “Ontario Government Introduces Fair And Stable Prices For Electricity From Ontario Power Generation” (23 February 2005), online: <news.ontario.ca/archive/en/2005/02/23/Ontario-Government-Introduces-Fair-And-Stable-Prices-For-Electricity-From-Ontari.html> [Fair and Stable Prices].37 John Spears, “Power shortage by ‘06, report says”, Toronto Star (25 January 2004) D01.38 Ontario Energy Board, “Monitoring Report on the IESO‐Administered Electricity Markets for the period from May 2005 – October 2005” (December 2005), online (pdf): <www.oeb.ca/documents/msp/msp_report%20final_131205.pdf>.
generation added to the grid. The biggest chunk of new capacity came from the completion of OPG’s Pickering A return to service. The province was expecting a power deficit in the coming decade.37
Yet, the combination of rate regulation for OPG, and a provincially run procurement agency established to sign guaranteed contracts with generators, meant that the private sector would only invest in the province if it was through the government of Ontario or its agencies. The MSP warned in 2005 that “it is unlikely that any generator would choose to build new supply without contractual guarantees.”38 It pointed out that even the limited number of private sector generators that had recently decided to invest in the province when there was no government help had, in the wake of the establishment of the OPA, negotiated contracts with the provincial agency.
And finally, the setting of retail rates by the OEB undercut the retail market while also further removing the “market” rate for power from the price paid by consumers. In essence, nearly all small volume customers had been moved to a retail agreement with the OEB acting as the de facto retailer.
The OPA quickly went from an independent agency overseen by the regulator to one overseen by the Ministry of Energy. The OPA’s primary role was to plan and procure new generation capacity in the province, as well as oversee conservation programs. As part of that process, the OPA was required to submit a long-term supply and demand forecast — known as the Integrated Power System Plan (IPSP) — to the OEB for review every three years. The OEB would then hold a hearing to determine whether this plan and forecast was economically prudent and cost-effective, among other criteria. The first IPSP was scrapped midway through the review process due to a directive from the Minister of Energy to include more renewable generation. The second IPSP hearing was never held. The IPSP process was eventually replaced by the Long-Term Energy Plan (LTEP) overseen and
37
Volume 8 – Article – Brady Yauch
published by the Ministry of Energy. The future of new supply in Ontario was now laid out by the Ministry of Energy and procured through its contracting agency without regulator review.39
The establishment of the OPA, combined with the province’s decision to phase out coal generators and growing demand forecasts, resulted in a rush of new capacity. By 2005, the province announced that it had agreed or was negotiating the procurement of more than 9,000 MW of new capacity — nearly four times the 2,200 MW of capacity that was built between 2000 and 2003.40 Nearly all of the contracts signed between the OPA and generators were 20 years in length.
More importantly, between contracts with OPA, OPG’s continued market dominance and the decision to rate-regulate OPG’s baseload assets, nearly all investment in the province was being shielded in some part from the wholesale market.
Nonetheless, in 2005, the OPA announced that the “hybrid” market was “intended to migrate toward a competitive structure.”41 The Minister of Energy at the time criticized previous policies that had artificially lowered the price of power.
“For too long, taxpayer subsidies have kept electricity prices unsustainably low,” then Minister of Energy Dwight Duncan said. “We are easing the burden on taxpayers, while ensuring electricity prices for consumers are stable and competitive with nearby jurisdictions.”42
39 Office of the Auditor General of Ontario, “2011 Annual Report” (2011) at 87–120, online (pdf ): www.auditor.on.ca/en/content/annualreports/arreports/en11/303en11.pdf [Auditor General of Ontario, “2011”].40 Ministry of Energy, News Release, “McGuity Government Unveils Bold Plan To Clean Up Ontario’s Air” (15 June 2005), online: <news.ontario.ca/archive/en/2005/06/15/McGuinty-Government-Unveils-Bold-Plan-To-Clean-Up-Ontario039s-Air.html>; Micheal Wyman, “Power Failure: Addressing the Causes of Underinvestment, Inefficiency and Governance Problems in Ontario’s Electricity Sector” (May 2008), online (pdf ): CD Howe Institute <www.cdhowe.org/sites/default/files/attachments/research_papers/mixed//commentary_261.pdf>.41 Jan Carr, “Making Ontario’s Electricity Market Work” (2005), online (pdf ): <www.regie-energie.qc.ca/Camput/Presentations/MARDI-eng/Carr_presentation-eng.pdf>.42 Fair and Stable Prices, supra note 36.43 Ontario Legislative Assembly, Standing Committee on General Government, “Green Energy and Green Economy Act, 2009”, Official Report of Debates (Hansard), No G-21 (8 April 2009).44 Guy Holburn, Kerri Lui & Charles Morand, “Policy Risk and Private Investment in Ontario’s Wind Power Sector” (2010) 36:4 Can Pub Pol’y 465.45 The smart meter program, for example, was rolled out in 2004 and the OEB was blocked from reviewing it for cost effectiveness. The project was initially expected to cost $1 billion, but the Auditor General expects that figure to hit $2 billion.46 Richard Corley et al, “Ontario Feed-in Tariff Report Released” (2 April 2012), online: <www.mondaq.com/canada/Energy-and-Natural-Resources/170294/Ontario-Feed-in-Tariff-Report-Released>.
But that migration never occurred.
PART V: ONTARIO’S ELECTRICITY SECTOR GOES GREEN
Ultimately, the transition from a hybrid market towards a competitive market took a backseat to renewable energy policies.
Those ambitions took centre stage with the passing of the Green Energy and Economy Act (GEA) in 2009. The objective of the GEA was to encourage the rapid development of renewable energy projects by, most notably, introducing a feed-in-tariff (FIT) that would pay renewable generators an above-market, guaranteed rate for the next 20 years.43
The GEA also altered the governance and regulatory structure of the electricity sector by bestowing more legal powers on the Minister of Energy, allowing, for example, the Minister to decide whether a competitive or non-competitive process should be used in procuring new capacity.44 The legislation also allowed the Minister to set prices, as well as limit the ability of the OEB to act independently of the Province’s renewable energy policies by determining they are uneconomic.45 Going forward, all costs related to renewable energy were to be automatically approved by the regulator. The feed-in-tariff rates paid to renewable generators were well above market rates and were determined by the legislature, not the market.46
38
Volume 8 – Article – Brady Yauch
The GEA wasn’t the province’s first move towards integrating renewable energy into the grid, it was simply a more pronounced one. In 2004, the OPA announced the first round of a competitive Request for Proposals (RFPs) for renewable energy, known as the Renewable Energy Supply (RES) program. It later launched further auctions in 2005 and 2007, known as RES II and RES III. In total, the RES program introduced 1,570 MW of new wind capacity at a cost of between 8 and 9 cents per kWh.47 Other renewable energy procurements were also undertaken.
The Green Energy Act pushed the province’s renewable energy ambitions to a new level. Nearly 15 years after the province first announced its move towards renewable energy, Ontario’s electricity grid had been transformed. By the end of 2017, Ontario had signed contracts with wind and solar generators amounting to 5,533 MW and 2,681 MW of capacity, respectively.48
Ontario’s coal generators have also been forced into early retirement and replaced, largely, with natural gas generators. The Independent Electricity System Operator (IESO), which was merged with the OPA in 2015, has signed contracts with gas generators amounting to 9,458 MW of capacity.49
In total, the IESO has signed more than 33,000 contracts with a variety of generators — ranging from large-scale natural gas generators to rooftop solar panels.
The province now also has a significant surplus of power.50 In part, the reason that ratepayers now pay more than they did a decade ago for each unit of power they consume, even though the wholesale price has declined, is that a
47 Holburn, supra note 44; Auditor General of Ontario, “2011”, supra note 39.48 “A Progress Report on Contracted Electricity Supply: First Quarter 2019” (2019), online (pdf ): ieso <www.ieso.ca/-/media/Files/IESO/Document-Library/contracted-electricity-supply/Progress-Report-Contracted-Supply-Q4-2019.pdf?la=en>.49 Ibid.50 Environmental Commissioner of Ontario, “Making Connections Straight Talk About Electricity in Ontario 2018 Energy Convervation Progress Report, Volume One” (2018) at 94–109, online (pdf ): Office of the Auditor General of Ontario <www.auditor.on.ca/en/content/reporttopics/envreports/env18/Making-Connections.pdf>.51 See “18-Month Outlook: An Assessment of the Reliability and Operability of the Ontario Electricity System from January 2007 to June 2008” (21 December 2006), online (pdf ): ieso <ieso.ca/-/media/Files/IESO/Document-Library/planning-forecasts/18-Month-Outlook/18-Month-Outlook—2006dec.zip>; See also “18-Month Outlook: An Assessment of the Reliability and Operability of the Ontario Electricity System from October 2018 to March 2020” (25 October 2018), online (pdf ): ieso <ieso.ca/-/media/Files/IESO/Document-Library/planning-forecasts/18-Month-Outlook/18MonthOutlook_2018oct_v2.pdf>.
greater portion of their bill relates to fixed costs associated with contracted and regulated rates. These fixed costs are largely recovered through the Global Adjustment charge.
Apart from transforming the mix of the province’s generation fleet, the renewable transformation also increased Ontario’s installed grid connected generation by more than 20 per cent from 31,189 MW in 2007 to 37,044 MW today. 51 Ontario has more installed generating capacity than it did a decade ago, even though demand for power has declined over that time.
PART VI: INTERVENTION BEGETS MORE INTERVENTION – ONTARIO’S ELECTRICITY MARKET IS SHAPED BY LEGISLATION AND DIRECTIVES
Ontario’s electricity market— and the agencies that oversee and regulate it — has increasingly been shaped by directives from the Ministry of Energy, rather than market-based, competitive forces.
The intervention is most clearly laid out in the number of directives issued to the OPA, IESO and the OEB since 2005. In total, there have been 114 directives issued to these agencies between 2005 and 2015. Nearly all generators now receive a fixed or contracted rate for their output and many consumers, both large industrial users and small-volume household customers, pay a price that is, in part, determined via legislation, not the wholesale market.
Directives are just one method of legislative intervention. In 2016, the province passed legislation transferring all electricity planning responsibility to the Ministry of Energy
39
Volume 8 – Article – Brady Yauch
through the LTEP.52 The LTEP process ensures the legislature, through the Ministry of Energy, is the final arbiter of what investment will occur in the province. It’s not clear what aspects of the LTEP process will continue in the future.
The Ministry of Energy now also decides what large transmission projects will get approved, whereas that power previously resided with the OEB, which would hold a public hearing to determine whether it was economic.53
The province passed legislation approving the Darlington Refurbishment Project (DRP), a $12.8 billion project to extend the life of the site’s four reactors.
The result of legislature intervention has created further divergence between the price ratepayers pay to consume power and prices on the province’s wholesale market. The difference between the wholesale market price and the rate guaranteed to generators that either have a contract with the IESO or have rates set by the OEB is made up through the Global Adjustment. The Global Adjustment and the wholesale market price — known as the Hourly Ontario Energy Price (HOEP) — are inversely related. A lower market price reduces revenues to generators, which then increases the Global Adjustment charge in order to make generators whole and cover rates set via contracting or rate regulation. Over time, as more generators had their costs set by contracting or rate regulation, the Global Adjustment has grown substantially and now accounts for a majority of the cost of generation and price paid by consumers.
With a surplus of generation in Ontario selling power on the wholesale market below their contracted rate and, in many cases, at a low marginal cost — as they now receive more money through the Global Adjustment charge than wholesale prices — prices have dropped dramatically. The average wholesale price in 2017, for example, was the lowest since the
52 Bill 135, An Act to amend several statutes and revoke several regulations in relation to energy conservation and long-term energy planning, 1st Sess, 41st Leg, Ontario, 2016 (assented to 9 June 2016), SO 2016, c 10.53 Bill 112, An Act to Amend the Energy Consumer Protection Act, 2010 and the Ontario Energy Board Act, 1998, 1st Sess, 41st Leg, Ontario, 2015 (assented to 3 December 2015), SO 2015, c 29.54 Adrian Morrow & Tom Cardoso, “Why does Ontario’s electricity cost so much? A reality check”, The Globe and Mail (7 January 2017), online: <www.theglobeandmail.com/news/national/why-does-electricity-cost-so-much-in-ontario/article33453270>.55 Ministry of Finance, News Release, “Helping Families Manage Electricity Costs McGuity Government Passes Ontario Clean Energy Benefit” (8 December 2010), online: <news.ontario.ca/mof/en/2010/12/helping-families-manage-electricity-costs.html>.
market opened in 2002. Wholesale prices are, in many cases negative, even during periods of high demand.
Over time, as more contracted power was added to the electricity system, costs also increased. Overall system costs increased from $8.3 billion in 2006 to $13.7 billion in 2017, marking a 65 per cent increase.
As system costs increase, so too did prices for consumers, particularly for low-volume consumers such as households and small businesses. Nearly all small-volume consumers now have their rates set biannually by the OEB. Between 2006 and 2017 — prior to the passing of the Fair Hydro Plan — the off-peak electricity rate increased nearly 150 per cent for households across the province.
The public became increasingly concerned over electricity rates.54 In response, the province implemented a series of policies that either shifted costs to the tax base, future ratepayers or between small and large volume customers — or some combination of the three.
• In 2011, the Clean Energy Benefit, provided small-volume consumers with a 10 per cent rebate on their monthly electricity bill.55
• Also in 2011, the Industrial Conservation Initiative (ICI) split Ontario ratepayers into two classes for the collection of Global Adjustment costs: Class A (large volume customers) and Class B (small volume customers). Class A consumers pay Global Adjustment charges based on their demand during peak hours — lowering those costs for the entire following year. These costs are shifted to Class B customers. Since the policy was implemented, nearly $5 billion in
40
Volume 8 – Article – Brady Yauch
costs have been shifted from Class A to Class B customers.
• In 2017, the Fair Hydro Plan (FHP) reduced electricity bills by 25 per cent for small customers by, most notably, using long-term debt to lower Global Adjustment costs, among other policies.
By 2017, prices in the wholesale market became just a small portion of the actual cost of generation due to the policy of signing long-term contracts with generators. The price signal — considered one of the key components to the wholesale market when it opened in 2002 — has been distorted.
PART VII: DEMAND FALLS WHILE SUPPLY INCREASES
In hindsight, Ontario built out its generation capacity at the exact moment that demand began a decade-long decline. And because many of the costs in the generation sector are fixed — either through regulated rates set by the OEB for OPG’s output or fixed-price contracts — any reduction in demand pushes up the price of each unit sold. Demand in Ontario fell from its high of 157 TWh in 2005 to 132.1 TWh in 2017 — a near 16 per cent decline.
This decline in demand stands in contrast to forecasts made in 2005 calling for years of growth. Similar to what occurred with Ontario Hydro in the 1980s and into the 1990s, the early demand forecasts laid out by the OPA turned out to be too high. In 2007, when the OPA submitted its first supply plan to the OEB, it predicted that demand in Ontario would grow to 165 TWh and 176 TWh by 2015 and 2020, respectively.56
Demand fell for a variety of reasons — an increase in embedded generation, a greater emphasis (and success) at energy conservation and a severe economic downturn in 2008-09. Embedded generation — largely made up of renewable generators that provide their power to local distribution companies (LDCs), as
56 See Ontario Power Authority, “EB-2007-0707, Exhibit D, Tab 1, Schedule 1 – Load Forecast – IPSP Reference Energy and Demand Forecast” (5 September 2008) at 1, online (pdf ): OEB <www.rds.oeb.ca/HPECMWebDrawer/Record/81114/File/document>.57 See “2016 Conservation Results Report” (1 December 2018), online (pdf ): ieso <www.ieso.ca/-/media/Files/IESO/Document-Library/conservation-reports/Annual/conservation-results-report-2016.pdf>.58 See Ontario Power Authority, “EB-2007-0707, Exhibit D, Tab 9, Schedule 1 – Meeting Resource Requirement” (5 September 2008) at 1735, online (pdf ): <www.rds.oeb.ca/HPECMWebDrawer/Record/81114/File/document>.
opposed to being connected to the provincial transmission grid — has increased from 1.7 TWh in 2006 to 6.3 TWh in 2017 and continues to grow. Conservation programs have also helped to reduce electricity demand by nearly 9 per cent between 2006 and 2016.57
More importantly, the rise of a directive-based electricity sector constrained the market’s ability to respond to falling demand. The directives that have been issued in Ontario are largely static tools that simply told the agencies overseeing the electricity sector what to do — procure more renewable energy or demand response, for example. But when conditions in the province’s electricity market changed — such as a reduction in demand — these static directives became out of date and, in most cases, worked against efficiency in the market. More directives must eventually be introduced to counteract the effect of previous directives. In response to falling demand, a truly competitive market may have curtailed investment and limited Ontario’s energy surplus.
Contrary to responding to a surplus by curtailing investment, the exact opposite occurred in Ontario over the last decade. In total, the OPA forecast that the province would have a generating capacity of 34,008 MW in 2017 from its 2007 level of 31,214 MW.58 Yet, over the next decade, the Ontario’s generation fleet grew to its current level of 37,555 MW (not including behind-the-meter generation which totals more than 3,000 MW), while demand fell from its 2005 peak of 157 TWh to 132 TWh in 2017.
PART VIII: BACK TO THE FUTURE WITH MARKET RENEWAL
The deficiencies in Ontario’s wholesale electricity market are well-known and long-standing. These deficiencies have been exacerbated by legislative directives and policies since the market opened — even if some of those policies may have been merited for social and environmental reasons.
41
Volume 8 – Article – Brady Yauch
But change is in the air.
The IESO is now working on a coordinated set of reforms, known as the Market Renewal Program (MRP), in an attempt to address many of these deficiencies. These reforms include, among others, the move to locational pricing, a technology neutral capacity auction and financially binding day-ahead market. The IESO recently released a number of detailed design documents as part of the next stage of MRP.
Nonetheless, a number of concerns have already arisen with the MRP. Notably, the IESO has reduced the scope and impact of the project— lessening the financial and efficiency benefits that it will provide ratepayers. Early estimates suggested the cost of implementing MRP was $200 million, while producing $3.4 billion in benefits between 2021 and 2030.59 But that benefits forecast has been lowered to around $500 million.
The reduced financial benefit is the result of a number of key changes made to the MRP by the IESO.
For starters, in response to feedback from stakeholders, the IESO will scrap locational (or zonal) pricing for most consumers and continue with a provincial-wide uniform price. Locational prices were expected to address a key inefficiency in the design of the wholesale market — leading to a more efficient use of Ontario’s high-voltage transmission network, more efficient consumption and targeted generation investment in areas where it’s most needed. While some of these benefits will still accrue due to locational pricing for generators, consumers will continue to be shielded from a transparent price (i.e., the true cost) of their consumption. Cross subsidies will continue to flow from one class of consumers to another as a result.
Second, the IESO has put on hold the Incremental Capacity Auction (ICA) and replaced it with a more modified capacity auction – which has since been further delayed as a result of the COVID-19 pandemic. The ICA was responsible for more than $2 billion
59 See Johannes Pfeifenberger et al, “The Future of Ontario’s Electricity Market – A Benefits Case Assessment of the Market Renewal Project”, (20 April 2017), online (pdf ): ieso <www.ieso.ca/-/media/Files/IESO/Document-Library/engage/me/Benefits-Case-Assessment-Market-Renewal-Project-Clean-20170420.pdf>.
of the $3.4 billion in benefits from the MRP. Nonetheless, even capacity auctions, while competitive when viewed at face value, may also result in large scale over procurement, as has been the case in a number of US jurisdictions. Additionally, the IESO noted that the capacity auction may be supplemented by further contracting — once again introducing the risk of repeating one of the major concerns surrounding the market since it opened.
Market Renewal is an attempt to right some of the well-known wrongs with Ontario’s electricity market. Yet, a number of changes proposed as part of the MRP are either being reduced or eliminated altogether. The updates included in MRP are necessary and long overdue if the province wants to move forward with a competitive and efficient electricity market. The IESO and stakeholders — both of which are vital components to any competitive market — now must decide whether they will support the current detailed designs regarding the most material aspects of MRP, or determine what the market should look like given the many unique aspects of Ontario’s grid. n
42
NOVA GAS TRANSMISSION LTD. SYSTEM RATE
DESIGN AND SERVICES APPLICATION1
Rates – Gas Pipeline – Rate Design
Laura Scott, Rosa Twyman and Laura-Marie Berg*
1 This summary was previously posted to Energy Regulatory Report, published by Regulatory Law Chambers, Calgary.* Laura Scott (Student-at-Law – Legal Services Provider), Rosa Twyman (Legal Services and Business Director), and Laura-Marie Berg (Associate Legal Services Provider) with Regulatory Chambers, Calgary.2 Re Nova Gas Transmission Ltd. (March 2020), RH-001-2019, online (pdf ): CER <docs2.cer-rec.gc.ca/ll-eng/llisapi.dll/fetch/2000/90465/92833/554137/3752363/3752364/3760156/3913151/C05448-1_CER_%E2%80%93_Reasons_for_Decision_RH-001-2019_%E2%80%93_NOVA_Gas_%E2%80%93_NGTL_System_Rate_Design_and_Services_-_A7E4S8.pdf?nodeid=3912507&vernum=-2> [Nova Gas].3 RSC 1985, c N-7, s 62, as repealed by An Act to enact the Impact Assessment Act and the Canadian Energy Regulator Act, to amend the Navigation Protection Act and to make consequential amendments to other Acts, SC 2019, c 28, s 44.4 Ibid, s 67.
In this decision,2 the Canada Energy Regulator (CER) considered an application (the “Application”) from Nova Gas Transmission Ltd. (NGTL) for approval of a new rate design methodology and terms and conditions of service for the NGTL System. The CER approved the Application. However, the CER found that there was potential for further improvements in NGTL’s rate design and services. To inform future toll and tariff discussions, the CER provided directions on additional steps NGTL must take and timelines for compliance.
BACKGROUND
The NGTL System is an extensive natural gas transmission system comprised of approximately 24,000 kilometres of pipeline and associated compression and other facilities in Western Canada. The NGTL System transports natural gas produced in Alberta and British Columbia from the Western Canada
Sedimentary Basin (WCSB). Natural gas produced from the WCSB competes in the North American gas market on many fronts.
LEGISLATIVE FRAMEWORK
Section 62 of the National Energy Board Act3 (NEB Act) states:
62. All tolls shall be just and reasonable and shall always, under substantially similar circumstances and conditions with respect to all traffic of the same description carried over the same route, be charged equally to all persons at the same rate.
Section 67 of the NEB Act4 states:
67. A company shall not make any unjust discrimination in
43
Volume 8 – Comment – Laura Scott, Rosa Twyman and Laura-Marie Berg
tolls, service or facilities against any person or locality.
On 28 August 2019, the Canadian Energy Regulator Act5 (CER Act) came into force, replacing the NEB Act. The National Energy Board (NEB) was succeeded by the CER. Section 36 of the transitional provisions associated with the CER Act states that applications pending before the NEB prior to coming into force of the CER Act are to be taken up by the CER and continued in accordance with the NEB Act.6 As the Application was pending before the NEB prior to 28 August 2019, the Application was taken up by the CER and continued in accordance with the NEB Act.7
THE APPLICATION
The Application was supported by a contested Settlement (the “Settlement”). NGTL also sought approval of two associated matters that did not form part of the Settlement: (1) a surcharge formula to be paid by Firm Transportation – Receipt (FT-R) shippers on the North Montney Mainline (NMML); and (2) amendments pertaining to Firm Transportation – Points to Point (FT-P) service.8
THE SETTLEMENT
Whether Settlement Treated as a Package
The CER found that the Settlement negotiation process would be undermined if the CER were to freely impose selected changes at its discretion. The CER stated that the Settlement submitted by NGTL should be treated as a package and approved the Settlement on that basis.9
5 SC 2019, c 28, s 10.6 An Act to enact the Impact Assessment Act and the Canadian Energy Regulator Act, to amend the Navigation Protection Act and to make consequential amendments to other Acts, SC 2019, c 28, s 36.7 Nova Gas, supra note 2 at 1.8 Ibid.9 Ibid at 11.10 Ibid at 12.11 Ibid at 15.12 Ibid.13 Ibid at 16.14 Ibid at 17.
Postage Stamp FT-D2 and FT-D3 Rates
Group 2 Delivery Points (FT-D2) and Group 3 Delivery Points (FT-D3) rates are based on a postage stamp methodology. FT-D3 is priced at a 20 per cent premium to the FT-D2 rate. The parties to the Settlement agreed to not depart from the current postage stamp methodology for FT-D2 and FT-D3 services.10
The CER approved the postage stamp methodology for FT-D2 and FT-D3 rates.11 However, the CER directed NGTL to initiate an additional evaluation of potential cross-subsidization between delivery points and further consultation with the Tolls, Tariff, Facilities and Procedures Committee (TTFP) regarding the Major Market proposal proposed by ATCO Gas (ATCO) in this proceeding. The CER also directed NGTL to file a report containing an assessment of the current FT-D2 and FT-D3 cost allocation methodology, an assessment of alternate methodologies, the consultation process NGTL undertook and the next steps to rectify any unreasonable cross-subsidization.12
Metering Charge
The NGTL ne t t r an spor t a t ion revenue requirement consists of two components: a transmission component and a metering component.13 The CER found that the metering charge, as included in the Settlement, was acceptable. However, the CER found that additional analysis was required on this matter, as well as further TTFP consultations.14
44
Volume 8 – Comment – Laura Scott, Rosa Twyman and Laura-Marie Berg
Unit Cost Index
NGTL currently uses a Unit Cost Index (UCI) in FT-R rates. Under NGTL’s proposed rate design, Firm Transportation – Delivery (FT-D) rates would also be derived using a delivery UCI. The UCI is a comprehensive determination of the relative unit cost for transportation for various pipe diameters, incorporating economies of scale derived from historical acquisition costs for each pipe size, and considers other factors, such as compression costs and Operations and Maintenance (O&M) costs.15 The CER did not find, as suggested by ATCO, that small diameter pipe is being unreasonably over-allocated costs within the UCI methodology. The CER noted ATCO’s acknowledgement that NGTL’s evidence that pipe integrity costs are generally not correlated to pipeline diameter lessened ATCO Gas’s concerns on this issue.16
Length of Contract Term and Term-Up Provision
Under the Settlement, the default minimum contract term in constrained areas of the System is an eight-year total term with a minimum primary term between two years and five years.17 The CER approved the minimum contract term length and no term-up provision.18
Intra-Basin / Export Shipper Contract Terms
The CER found that differences in contract term length between Group 1 Delivery Points (FT-D1) and intra-basin shippers were not unjustly discriminatory. NGTL’s evidence demonstrated that the discrepancy arises from the practical need to allocate capacity differently for intra-basin versus export delivery points.19
15 Ibid at 18.16 Ibid at 19.17 Ibid.18 Ibid at 21.19 Ibid at 22.20 Ibid.21 Ibid at 23.22 Ibid at 25.23 Ibid at 26.24 Ibid at 27.25 Ibid.
Rural Gas Interconnections
Rural gas interconnections (“Taps”) allow rural end users with an average daily demand of less than 1 TJ and peak daily demand of less than 5 TJ to access the NGTL System.20 The CER accepted NGTL’s commitment in the Settlement to hold discussions with a view to codifying in the NGTL’s Tariff the existing practices pertaining to Taps.21
Default Tolling of Extensions
The CER questioned the value and appropriateness of the default rolled-in provision, as drafted in the Settlement. The CER noted, however, that no provision could relieve or prevent the CER from exercising its regulatory oversight of a tolling methodology.22 The CER, therefore, interpreted the default methodology provision as solely a commitment by NGTL to its shippers to use rolled-in tolling as a starting point when beginning discussions on future projects. Tolling treatment of future extension projects, the CER found, must be addressed on a case-by-case basis.23
Flow Data and Toll Filings
The CER found that the information in Table 1.5-9 in response to NEB IR No.1.5 is relevant for the future interim and final tolls applications that implement the approved rate design.24 Table 1.5-9 provided distance and diameter data for NGTL’s proposed East Gate delivery tolling. The CER noted this information provides transparency regarding allocation factors, which can change over time and can have a significant impact on the resulting rates.25 The CER, therefore, directed NGTL to include the same type of information in all future filings for interim and final tolls under the approved rate
45
Volume 8 – Comment – Laura Scott, Rosa Twyman and Laura-Marie Berg
design.26 The CER also acknowledged NGTL’s commitment to use data for NGTL System flows from the most recent months of February and July to determine the FT-D paths.27
The CER indicated it expects NGTL to implement the proposed rate design within a reasonable time frame but did not impose any specific direction on implementation timing. However, the CER directed NGTL to file with the CER, at the time of its final 2020 rates application, its updated NGTL System Tariff in its entirety incorporating the revisions approved in this decision and the final 2020 rates, tolls and charges that NGTL is seeking the CER’s approval to implement.28
FT-P Amendments
NGTL applied for additional FT-P amendments that did not form part of the Settlement29:
a. the FT-P adjustment would increase from 4 cents/Mcf/d to 10 cents/Mcf/d, and
b. an FT-P Price Point D would be implemented with a discount set at 85 per cent of the FT-P Price Point A when three eligibility criteria are met.
These measures were uncontested and approved by the CER.30
NORTH MONTNEY MAINLINE TOLLING METHODOLOGY
The Settlement specified that shippers on the NMML would be subject to a surcharge
26 Ibid.27 Ibid.28 Ibid.29 Ibid at 28.30 Ibid.31 Ibid at 29.32 Ibid at 37.33 Ibid at 42.34 Ibid at 43.35 Ibid at 45.36 Ibid at 46.37 Ibid.
in addition to the otherwise applicable rates under the NGTL rate design. The specific methodology to be applied to NMML shippers, including the NMML Surcharge Formula and Surcharge Coefficient, was included in NGTL’s Application. However, it did not form part of the Settlement.31
The CER approved the NMML Tolling Methodology, including the NMML Surcharge Formula and the proposed Surcharge Coefficient of 0.3.32 However, the CER imposed a condition on NGTL should gas transported on the NMML be delivered to new large volume markets and certain accounting requirements specific to the NMML.33
BROADER CONSIDERATIONS
The CER indicated it was concerned with NGTL ensuring appropriate cost accountability for shippers requiring receipt extensions and the capability of the distance of haul methodology to recognize future flow patterns. Accordingly, the CER directed NGTL to file ongoing information to enable transparency and accountability to the CER and shippers over time.34
The CER stated that fundamental risk is not materializing on the NGTL System at this time but remains a long-term risk.35 Continuing the practice of regularly updating depreciation assumptions and providing revised studies reduces the future risk of undepreciated facilities.36 The CER, therefore, directed NGTL to file a depreciation study in the second-half of 2023, including certain capital spending and capital maintenance information.37
46
Volume 8 – Comment – Laura Scott, Rosa Twyman and Laura-Marie Berg
In the NEB’s previously issued North East British Columbia Decision38 (the “NEBC Decision”), the NEB directed NGTL to file certain information with its next toll filing regarding NGTL’s policies affecting capital spending for system expansions, NGTL’s depreciation policy and practices, and NGTL’s tolling methodology and tariff provisions.39 In the Application, NGTL put forth a mix of the existing rate design methodology with some proposed amendments. The CER found that the proposed changes were generally responsive to the NEBC Decision as they introduced stronger cost accountability for receipt shippers.40 However, the CER directed NGTL to file, and continue to make available certain information for the benefit of the CER and interested parties.41
The CER acknowledged NGTL’s position regarding the production of a five-year toll forecast to assess the cumulative impacts of its capital spending program. Instead of a five-year toll forecast, the CER directed NGTL to extend the narrative accompanying the unit cost of transportation data in its Annual Plan.42
CER DECISION
The CER approved the Application. The CER found that the Settlement would result in tolls that are just and reasonable and not unjustly discriminatory.43 The CER found that the Settlement is consistent with the cost-based/user-pay principle and promotes proper price signals in alignment with the economic efficiency principle.44 Further, the CER found that the Settlement complied with the NEB’s Settlement Guidelines.45 Overall, the proposed amendments represent an improvement in aligning tolls with the underlying costs of providing service.46
38 Re National Energy Board Examination to Determine Whether to Undertake an Inquiry of the Tolling Methodologies, Tariff Provisions and Competition in Northeast British Columbia (8 March 2018), A90483-1, online (pdf ): CER <docs2.cer-rec.gc.ca/ll-eng/llisapi.dll/fetch/2000/90463/3225050/3338199/3488659/A90483-1_NEB_-_Letter_Decision_-_Parties_-_Inquiry_of_the_Tolling_Methodologies%2C_Tariff_Provisions_and_Competition_-_NE_BC_-_A6A9Y3.pdf?nodeid=3490855&vernum=-2>.39 Nova Gas, supra note 2 at 46–47.40 Ibid at 47.41 Ibid at 48.42 Ibid at 49.43 Ibid at 50.44 Ibid.45 Ibid.46 Ibid.47 Ibid.48 Ibid.
Notwithstanding its approval of the Application, the CER indicated it sees a need for continued improvements in NGTL’s rate design and services. Throughout the decision, the CER provided direction to NGTL regarding additional obligations to disclose information and facilitate discussions among the TTFP and interested parties regarding areas of concern.47 The CER indicated it expects a pipeline company to share sufficient information with shippers on an ongoing basis. Shippers should be able to obtain information from a pipeline company during negotiations without having to resort to the information request process of a hearing.48 n