104
DNV GL © 2016 SAFER, SMARTER, GREENER DNV GL © 2016 Energy Storage Use Cases 1 DNV GL for BEIS
| Date post: | 20-Jul-2018 |
| Category: |
Documents |
| Upload: | truongthuan |
| View: | 213 times |
| Download: | 0 times |

DNV GL © 2016 SAFER, SMARTER, GREENER DNV GL © 2016
Energy Storage Use Cases
1
DNV GL for BEIS

DNV GL © 2016
Contents
2
Contents Slide
Use Cases Specifications 3
Electricity Storage Use Case Introduction 4 - 7
Electricity Storage Use Cases 1 – 5 8 – 43
Electricity Storage Use Case Conclusion 44 – 46
Heat Storage Use Case Introduction 47 – 51
Heat Storage Use Cases 6 – 9 52 – 82
Heat Storage Use Case Conclusion 83 – 85
Use Case Interactions and Energy Storage Enablers 86 - 93
References 94 – 106

DNV GL © 2016
Use Cases
3
Electricity Storage Heat Storage
Customer-led storage
(behind the meter)
Domestic and I&C scale
storage deployed alongside
demand
(<10MW)
Use case 1
Domestic electricity storage used to time
shift energy generated or energy usage
Use case 6
Domestic thermal storage used to
time shift energy usage
Use case 2
Industrial & Commercial electricity
storage used to time shift energy
generated or energy usage
Use case 7
Industrial & Commercial thermal
storage used to time shift energy
usage (seasonally)
Distribution level storage
Storage for network
reinforcement deferral or
storage deployed by
intermittent generators
connected at the distribution
level (<100MW)
Use case 3
Electricity storage used to protect
network infrastructure (voltage control,
increase reliability, black start and
thermal management) by a DNO
Use case 8
Network level coordinated thermal
storage in homes used to balance
locally. (e.g. Nines project)
Use case 4
Electricity storage used to firm up
intermittent generation (sensitivity for a
cheaper connection charge)
Use case 9
District heating combined with
storage (and CHP) to defer
reinforcement
System level storage
connected at the transmission
level or primarily for system
balancing (>100MW)
Use case 5
Merchant model large scale storage
(arbitraging energy prices, providing
national level ancillary services)

DNV GL © 2016
Electricity Storage
4

DNV GL © 2016
Introduction
Energy storage will play a key role in building a smarter energy system. However, to
understand where policy interventions could deliver the biggest benefit for consumers, BEIS
needs first to understand what value energy storage represents compared to conventional or
flexible alternatives.
BEIS are taking a Use Case approach to understanding and supporting energy storage policy
development. The Use Cases are split into two areas: electricity storage and heat storage.
This document explores both categories of Use Cases, this section examines the electricity UC
1 to 5.
Each Use Case (UC) will set out:
– How storage can meet the identified need
– Technology neutral system requirements with regards to attributes and performance
– Details of the investment case, including:
– Costs of the system (capital costs, operating costs and lifetime/discounted costs) and
prospects for cost reduction
– Benefits of the system accrued to whoever is paying for the system
– Drivers for installing the system (e.g. increasing energy security, sustainability, etc.)
5

DNV GL © 2016
Introduction
The following questions are addressed for each Use Case, using a red-amber-green (RAG)
scoring system:
– How well do existing technologies meet this specification?
– How well does the investment case for this electricity storage stack up (lifetime/discounted
costs)?
– What is the scale of the opportunity in 2016 and how is this likely to change over time?
– How well does the UC reduce peak consumption?
– How well does the UC defer network investment?
– How well does the UC avoid curtailing renewables?
– How well does the UC provide for optimal system balancing?
6

DNV GL © 2016
Overview – Electricity storage
7
S
Business (SME/I&C)
Electricity
Storage
CustomerDNOSupplier
Transmission
Network
Distribution – MV
(33 kV and 11 kV)
Transmission
Distribution – MV (33 kV and 11 kV)
Distribution – LV (415 V)
Distribution – LV
(415 V)
S
IGIntermittent
Generation
S IG
Residential
S
ResidentialBusiness
(SME/I&C)Business
(SME/I&C)
S
Business (SME/I&C)
S
Residential
S
IG
Business (SME/I&C)
S
IG
S S IG S S
Generator

DNV GL © 2016
Use Case 1: Domestic electricity storage used to time shift energy generated or energy usage
8
Use Case 1
S
Business (SME/I&C)
Electricity
Storage
Transmission
Network
Distribution – MV
(33 kV and 11 kV)
Transmission
Distribution – MV (33 kV and 11 kV)
Distribution – LV (415 V)
Distribution – LV
(415 V)
S
IGIntermittent
Generation
S IG
Residential
S
ResidentialBusiness
(SME/I&C)Business
(SME/I&C)
S
Business (SME/I&C)
S
Residential
S
IG
Business (SME/I&C)
S
IG
S S IG S S
CustomerDNOSupplier Generator

DNV GL © 2016
Use Case 1: Domestic electricity storage used to time shift energy generated or energy usage
9
Technology neutral system requirements:
• There are a variety of technologies that allow for the reduction of demand at peak times and the ability to minimize renewable energy export to the grid to be used locally.
• Electricity storage has the ability to achieve both of these objectives. • The chosen technology must meet the requirements: specifications such as the number of charging cycles, power
rating, energy density, system efficiency and safety, all play a role in selecting a specific technology. • Batteries are currently the leading technology (in terms of the number of domestic storage installations), however
technologies such as flywheels and super capacitors may also be potential future opportunities.
How storage can meet the identified need:
• Electricity storage is a proven technology in terms of time shifting diurnal energy usage. • However the need for the technology is reliant on a resilient commercial model. As energy storage technologies drop in
cost the commercial model for domestic electricity storage begins to add up when looking at specific opportunities [2]. • Many types of storage devices such as lithium-ion batteries, flywheels, flow batteries and supercapacitors may be
suitable to meet the requirements of domestic electricity storage.
Description:
• This Use Case has the potential to match generation to consumption by storing energy generated by renewables and using it when required by the household. This provides a reduction in the households electricity bill as less energy is required from the grid during peak times and could potentially lead to the point where households could eventually become grid independent.
• There have been over 700,000 domestic PV installations in the UK since 2010[1]. By December 2015, installed PV capacity in the UK reached 9 GW, making the UK the leading country in the top ten global markets for solar PV installations[62a].
• As Domestic Time Of Use Tariffs are introduced to the UK, electricity storage will give customers the opportunity to buy energy at periods when the cost is low, rather than consuming energy from the grid when the cost is high. Generally, periods of high costs are correlated to periods traditional high/peak demand.
• Domestic electricity storage could provide the increased level of flexibility required within the UK distribution networks • Electricity storage could also provide back up during outages and storms for domestic customers.

DNV GL © 2016
Use Case 1: Domestic electricity storage used to time shift energy generated or energy usage
10
Drivers for installing the system:
• Reduction in energy bills to the end user, the ability for a domestic system to be ‘Off-Grid’ and supply security during outages. • There are currently a very limited number of domestic ToU Tariffs in the UK, as smart meters are rolled out suppliers will be able
to introduce half hourly ToU Tariffs to domestic properties. • Increased system flexibility to the DNO –The SoLa Bristol LCNF project installed 2kW of battery storage in 26 homes, 5 schools
and 1 office along with PV Solar panels. The PV Panels are directly connected to the battery to store solar energy for use when the sun is not shining. In addition to this, each home has a DC micro grid installed that runs from the battery to power all lighting and USB charge points. [3] The project uses a joint ownership model for the storage device where the cost and benefit are split between the customer and the DNO.
• VPP Arbitrage (Aggregators) - Certain suppliers have stated they will offer Domestic Storage Tariffs in 2016 – the BEIS funded MASLOW project provides an example of such project [5].
Benefits of the system accrued to the system financer:
• Using Storage in Conjunction with TOU Tariffs - The value of TOU Tariffs will depend on the differential between the highest and lowest cost that the customer will pay (likely in half hourly increments) and will require the deployment of smart meters.
• Utilising PV Generation – Under the feed in tariff, domestic properties with PV get paid for the PV generation produced whether the energy produced is used or exported to the grid. Therefore if the energy can be stored and used at a point when demand is high (e.g. evening peak) then the energy requested from the grid and a customers bill is reduced, whilst still getting paid for the PV generation, there is also an additional payment for any ‘spill’ onto the network.
• DNO controlled domestic storage - Storage could be used to reduce demand imported or restrict generation exported. This is a potential future revenue stream.
• Aggregated domestic energy storage - Could be used to play a part in an aggregators virtual power plant.
Costs of the system and prospects for cost reduction:
• Several manufacturers have quoted costs for domestic storage systems in the UK over the past year. Most notably (and most high profile) is the Tesla Powerwall. In the UK, a 10kWh Powerwall with inverter is likely to retail about £6,176 [6]. However this does not include installation costs.
• Sonnenbatterie, a German storage company, have systems available from 2 – 16 kWh for the UK market. The storage and PV systems are available at €9,999, and a 2 kWh storage unit costs approximately €3,000.
• British companies such as Powervault and Moixia have domestic systems ranging from 2 – 6 kWh available to order. • Storage cost vary significantly according to what metric is used but are decreasing rapidly as adoption increases. There is no
consensus in price forecasts other than they will continue to decline driven by more domestic systems being installed and the Electric Vehicle industry requiring more lithium ion batteries. Current cost are at around $500/kWh for the energy storage capacity element of the system and are expected to reduce to less than half that to $225/kWh by 2018 [2].

DNV GL © 2016
Extracting Value From Domestic Storage
11
0
5
10
15
20
25
30
35
0.00
0.20
0.40
0.60
0.80
1.00
1.20
0 10 20
TO
UT
(p
/kW
h)
kW
h
Time (Hours)
Consumption (kWh) TOUT (p/kWh)
0
0.4
0.8
1.2
1.6
2
1 3 5 7 9 11 13 15 17 19 21 23
kW
h
Time (Hours)
Consumption (kWh) PV Generation (kWh)
0
5
10
15
20
25
30
35
0.00
0.40
0.80
1.20
1.60
2.00
0 10 20
TO
UT
(p
/kW
h)
kW
h
Time (Hours)
Consumption (kWh) PV Generation (kWh)
TOUT (p/kWh)
1
2
3
0
0.2
0.4
0.6
0.8
1
1.2
1 3 5 7 9 11 13 15 17 19 21 23
kW
h
Time (Hours)
Consumption (kWh) DNO Controlled (kWh)
4
Storage + TOU Tariff Storage + TOU Tariff + PV
5
Storage + PV
Aggregated Domestic Storage Services
DNO Controlled

DNV GL © 2016
Model for Value Stream 1 (Storage + TOU Tariff) – DNV GL Analysis
12
Source: TOU Tariff [7], Demand Profile [8]
Max battery storage (kWh)
Annual consumption (kWh)
Capital outlay (£)
Interest Payback period (years)
Discount factor
3 6000 1800 7% 15 2%
TOUT (p/kWh) Import rate (kWh/hr)
Consumption (kWh)
Import (kWh)
Daily savings (£)
Monthly savings (£)
Annual savings (£)
10 0.78 5.562 8.562 -0.30
14 0.73 6.612 6.612 0.00
30 0.31 4.236 1.236 0.90
16.41 16.41 0.60 13.04 156.43
Year Payment Savings
Present value -£2,964 £2,004 -£961
Max battery storage (kWh)
Annual consumption (kWh)
Capital outlay (£)
Interest Payback period (years)
Discount factor
10 6000 6000 7% 15 2%
TOUT (p/kWh) Import rate (kWh/hr)
Consumption (kWh)
Import (kWh)
Daily savings (£)
Monthly savings (£)
Annual savings (£)
10 1.41 5.562 15.562 -1.00
14 0.09 6.612 0.848 0.81
30 0.00 4.236 0 1.27
16.41 16.41 1.08 23.42 280.99
Year Payment Savings
Present value -£9,882 £3,599 -£6,282
• The model finds the optimal storage device charge and discharge behaviour that minimises the consumers daily energy bill. The tables show the model inputs, rates and consumption for each tariff level and the daily saving extrapolated as a monthly and annual saving. The present value over the payback is calculated and presented on the last row.
1

DNV GL © 2016
Model for Value Stream 1 (Storage + TOU Tariff) – DNV GL Analysis – Economy 7 Tariff
13
Source: TOU Tariff [7], Demand Profile [8]
Max battery storage (kWh)
Annual consumption (kWh)
Capital outlay (£)
Interest Payback period (years)
Discount factor
10 6000 6000 7% 15 2%
TOUT (p/kWh)
Import rate (kWh/hr)
Consumption (kWh)
Import (kWh)
Daily savings (£)
Monthly savings (£)
Annual savings (£)
6.5 1.64 3.108 13.108 -0.65
11.9 0.21 13.302 3.302 1.19
16.41 16.41 0.54 11.73 140.79
Year Payment Savings
Present value -£9,882 £1,803 -£8,078
Max battery storage (kWh)
Annual consumption (kWh)
Capital outlay (£)
Interest Payback period (years)
Discount factor
3 6000 1800 7% 15 2%
TOUT (p/kWh)
Import rate (kWh/hr)
Consumption (kWh)
Import (kWh)
Daily savings (£)
Monthly savings (£)
Annual savings (£)
6.5 0.76 3.108 6.108 -0.20
11.9 0.64 13.302 10.302 0.36
16.41 16.41 0.16 3.52 42.24
Year Payment Savings
Present value -£2,964 £541 -£2,423
1

DNV GL © 2016
Model for Value Stream 1 (Storage + TOU Tariff) – Community Energy Storage – DNV GL Analysis
14
CAPEX Paid Upfront
£500 kWh
Annual consumption split between 10 properties
24 kWh Storage Device
Community Energy Storage
Source: TOU Tariff [7], Demand Profile [8]
Max battery storage (kWh)
Annual consumption (kWh)
Capital outlay (£)
Interest Payback period (years)
Discount factor
24 60000 12000 2% 15 2%
TOUT (p/kWh) Import rate (kWh/hr)
Consumption (kWh)
Import (kWh)
Daily savings (£)
Monthly savings (£)
Annual savings (£)
10 7.24 55.62 79.62 -2.40
14 7.35 66.12 66.12 0.00
30 4.59 42.36 18.36 7.20
164.10 164.10 4.80 104.29 1251.43
Year Payment Savings
Present value -£14,009 £16,031 £2,022
• The monthly savings can be compared to the battery rental schemes offered by Renault and Nissan that range from £70 – £130 per month for a 24 kWh battery [18]
1

DNV GL © 2016
Model for Value Stream 1 (Storage + TOU Tariff) – Community Energy Storage – DNV GL Analysis
15
CAPEX Paid Upfront
Based on a Renault Electric Vehicle Battery Priced at
£5000* + 20% for an inverter and installation
Annual consumption split between 10 properties
24 kWh Storage Device Community Energy Storage
Source: TOU Tariff [7], Demand Profile [8], *Reference DNV GL / BEIS discussion 11/1/2016
Max battery storage (kWh)
Annual consumption (kWh)
Capital outlay (£)
Interest Payback period (years)
Discount factor
24 60000 6000 2% 15 2%
TOUT (p/kWh) Import rate (kWh/hr)
Consumption (kWh)
Import (kWh)
Daily savings (£)
Monthly savings (£)
Annual savings (£)
10 7.24 55.62 79.62 -2.40
14 7.35 66.12 66.12 0.00
30 4.59 42.36 18.36 7.20
164.10 164.10 4.80 104.29 1251.43
Year Payment Savings
Present value -£7,004 £16,031 £9,027
1

DNV GL © 2016
Use Case 1: Domestic electricity storage used to time shift energy generated or energy usage
16
Question Current Reasoning Future
How well do existing technologies meet this specification?
Demonstration projects have shown that electricity storage is able to meet the technical objectives required. However, enhancements in the technology with regards to efficiency, power to energy ratio, and the total system cost will be required to see an increased uptake and for business models to stack up.
How well does the investment case for this electricity storage stack up (lifetime/discounted costs)?
The investment case is heavily reliant on aspects of the co-located renewable generation system such as: the size and the commercial contract, the differential of the price in the feed in tariff, and the characteristics of the domestic demand profile such as predictability and variability.
What is the scale of the opportunity in 2016 and how is this likely to change over time?
Domestic storage and storage + PV systems are seen as the fastest growing storage markets across the globe. The falling cost of energy storage, the increased need for system flexibility and the transition of DNOs to Distribution System Operators will all support the growth and scale of domestic storage. Aggregators requiring flexible assets will also help support the system value streams.
Peak shaving Domestic peak shaving will depend on whether the value is gained by (or shared between) the Supplier, DNO or homeowner. The concept of domestic peak shaving can be driven by the Supplier using TOU tariffs or potentially the DNO.
Network investment deferral
Projects such as the WPD B.R.I.S.T.O.L project have shown the ability of both the householder and the DNO to benefit from domestic storage. DNOs could potentially restrict generation export and demand import in order to defer network investment.
Avoiding renewables curtailment
Domestic renewables are not curtailed in the sense of network operators restricting output, however PV systems stop working when networks go out of operational limits. The ability for DNOs to take a more proactive approach to managing renewables in the distribution network could be achieved by managing domestic loads via storage. Doing so could help alleviate problem such as over voltages and reserve power flows caused by PV.
Optimal system balancing
National aggregated domestic storage could play a role in supporting system balancing. National Grid have stated that they are aiming to achieve 30-50% of system balancing via demand side measures such as storage and demand side response by 2020.

DNV GL © 2016
Use Case 2: Industrial & Commercial electricity storage used to time shift energy generated or energy usage
17
S
Business (SME/I&C)
Electricity
Storage
Transmission
Network
Distribution – MV
(33 kV and 11 kV)
Transmission
Distribution – MV (33 kV and 11 kV)
Distribution – LV (415 V)
Distribution – LV
(415 V)
S
IGIntermittent
Generation
S IG
Residential
S
ResidentialBusiness
(SME/I&C)Business
(SME/I&C)
S
Business (SME/I&C)
S
Residential
S
IG
Business (SME/I&C)
S
IG
S S IG S S
CustomerDNOSupplier Generator
Use Case 2 Use Case 2

DNV GL © 2016
Use Case 2: Industrial & Commercial electricity storage used to time shift energy generated or energy usage
18
Technology neutral system requirements:
• There are a variety of technologies that allow for the reduction of demand at peak times and the ability to minimize renewable energy export to the grid. However the exact parameters are dependant on the specific applications and the customers demand/generation characteristics. Electricity storage has been proven across the globe to be able to achieve both of the aforementioned objectives.
• Specifications such as the number of charging cycles, power rating, energy density, system efficiency and safety, all play a role in selecting a specific technology.
• It is expected batteries will be the leading technology for Industrial and Commercial sited storage. However, technologies such as cryogenic storage may also be a potential future opportunities.
How storage can meet the identified need:
• Using Storage in Conjunction with TOU Tariffs - The value that can be extracted from a storage system being used for arbitrage will depend on the differential between the highest and lowest element of the supply contract (likely in half hourly increments), but more value may be achieved in the short term in decrease of Use of system charges.
• Utilising Generation – If the energy from renewable generation can be stored and used at a point when demand charges are high then the energy requested from the grid and a customers bill is reduced [67].
Description:
• Electricity consumption can be a significant proportion of an industrial and commercial (I&C) customers OPEX. A recent study showed that the average bill for UK business is £2,528 per year and most businesses use between 15,000 and 25,000 kWh per year [60] . Bills are dependant on the type of business, how much energy is used, whether the connection has a gas and electricity supply and the supply contract itself [59]. High demand user has bespoke supply contracts negotiated with the supplier
• In a recent position paper, a plan to encourage DNOs to take a more active role in network management is set out as well as highlighting the importance of encourage I&C customers to participate in the provision of flexible services [61].
• Electricity storage offers the potential for businesses to reduce power costs via arbitrage (peak shaving) and avoidance of both Transmission Use of System (TNUoS) and Distribution Use of System (DUoS) charges. By storing excess renewable energy generated onsite (for example, by rooftop solar PV), or by simply drawing down more off-peak power into a battery, customers can go ‘off-grid’ during peak periods and thus avoid paying high power prices [42].
• A recent report [58] showed that in a commercial setting, energy arbitrage can be a useful value stream. However, in the U.S., demand charge reduction is emerging as the real money-saving application given the large share of commercial power costs tied up in the demand side of for many of the U.S. markets.
DNV GL © 2016
Use Case 2: Industrial & Commercial electricity storage used to time shift energy generated or energy usage
19
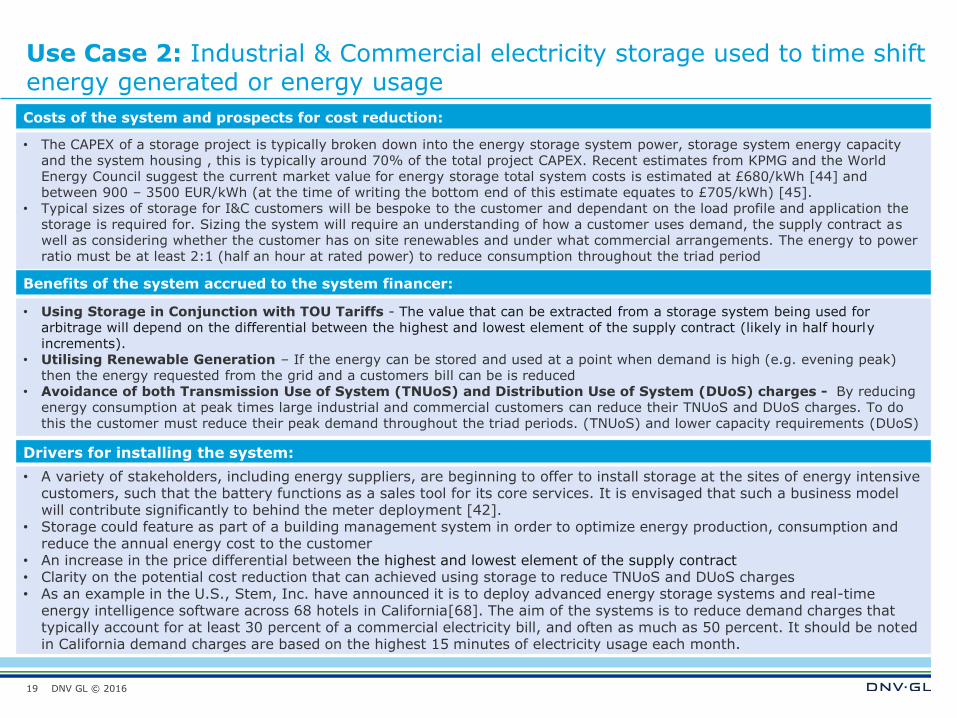
Drivers for installing the system:
• A variety of stakeholders, including energy suppliers, are beginning to offer to install storage at the sites of energy intensive customers, such that the battery functions as a sales tool for its core services. It is envisaged that such a business model will contribute significantly to behind the meter deployment [42].
• Storage could feature as part of a building management system in order to optimize energy production, consumption and reduce the annual energy cost to the customer
• An increase in the price differential between the highest and lowest element of the supply contract • Clarity on the potential cost reduction that can achieved using storage to reduce TNUoS and DUoS charges • As an example in the U.S., Stem, Inc. have announced it is to deploy advanced energy storage systems and real-time
energy intelligence software across 68 hotels in California[68]. The aim of the systems is to reduce demand charges that typically account for at least 30 percent of a commercial electricity bill, and often as much as 50 percent. It should be noted in California demand charges are based on the highest 15 minutes of electricity usage each month.
Benefits of the system accrued to the system financer:
• Using Storage in Conjunction with TOU Tariffs - The value that can be extracted from a storage system being used for arbitrage will depend on the differential between the highest and lowest element of the supply contract (likely in half hourly increments).
• Utilising Renewable Generation – If the energy can be stored and used at a point when demand is high (e.g. evening peak) then the energy requested from the grid and a customers bill can be is reduced
• Avoidance of both Transmission Use of System (TNUoS) and Distribution Use of System (DUoS) charges - By reducing energy consumption at peak times large industrial and commercial customers can reduce their TNUoS and DUoS charges. To do this the customer must reduce their peak demand throughout the triad periods. (TNUoS) and lower capacity requirements (DUoS)
Costs of the system and prospects for cost reduction:
• The CAPEX of a storage project is typically broken down into the energy storage system power, storage system energy capacity and the system housing , this is typically around 70% of the total project CAPEX. Recent estimates from KPMG and the World Energy Council suggest the current market value for energy storage total system costs is estimated at £680/kWh [44] and between 900 – 3500 EUR/kWh (at the time of writing the bottom end of this estimate equates to £705/kWh) [45].
• Typical sizes of storage for I&C customers will be bespoke to the customer and dependant on the load profile and application the storage is required for. Sizing the system will require an understanding of how a customer uses demand, the supply contract as well as considering whether the customer has on site renewables and under what commercial arrangements. The energy to power ratio must be at least 2:1 (half an hour at rated power) to reduce consumption throughout the triad period

DNV GL © 2016
Investment Case - Use Case 2: Industrial & Commercial electricity storage used to time shift energy generated or energy usage
20
Max battery
storage (kWh)
Annual
consumption
(kWh)
Capital
outlay
(£)
Interest Payback
period
(years)
Profile
Class
Discount
factor
5 20,000 2,500 4% 15 3 2%
TOUT (p/kWh) Consumption
(kWh)
Import
(kWh)
Daily
savings
(£)
Monthly
savings
(£)
Annual
savings
(£)
10 18.42 23.42 -0.50
14 39.05 39.05 0.00
30 13.14 8.14 1.50
1.00 21.73 260.71
Payment Savings Total
Present value -£3,373 £3,340 -£33
Small
0.00
5.00
10.00
15.00
20.00
25.00
30.00
35.00
0.00
2.00
4.00
6.00
0 4 8 12 16 20 24
TO
UT
(p
/kW
h)
kW
h
Hours
Consumption (kWh) Solar PV gen (kWh)
Intake (kWh) TOUT (p/kWh)
0
10
20
30
40
1 3 5 7 9 11 13 15 17 19 21 23
TO
UT
(p
/kW
h)
Time (Hours)
Small Medium Large
SizeProfile
Class
Profile Annual
Consumption
Range (kWh)
Annual
Consumption
(kWh)
Peak
Demand
(kWh)
Storage
Size
(kWh)
Small 3 0 - 70,000 20,000 5.05 5
Medium 5 0 - 85,000 75,000 17.4 10
Large 8 0-170,00 150,000 25 15
Case Study Descriptions

DNV GL © 2016
Investment Case - Use Case 2: Industrial & Commercial electricity storage used to time shift energy generated or energy usage
21
Max battery
storage (kWh)
Annual
consumption
(kWh)
Capital
outlay
(£)
Interest Payback
period
(years)
Profile
Class
Discount
factor
10 75,000 5,000 4% 15 5 2%
TOUT (p/kWh) Consumption
(kWh)
Import
(kWh)
Daily
savings
(£)
Monthly
savings
(£)
Annual
savings
(£)
8 73.69 83.69 -0.80
11.2 136.88 136.88 0.00
30 47.59 37.59 3.00
2.20 47.80 573.57
Payment Savings Total
Present value -£6,746 £7,348 £602
Medium
Large Max battery
storage (kWh)
Annual
consumption
(kWh)
Capital
outlay
(£)
Interest Payback
period
(years)
Profile
Class
Discount
factor
15 150,000 7,500 4% 15 8 2%
TOUT (p/kWh) Consumption
(kWh)
Import
(kWh)
Daily
savings
(£)
Monthly
savings
(£)
Annual
savings
(£)
6.55 158.94 173.94 -0.98
7.097 204.07 204.07 0.00
9.14 90.03 75.03 1.37
0.39 8.44 101.29
Payment Savings Total
Present value -£10,118 £1,298 -£8,821
Annual TUoS Savings for
the following demand
reduction percentages
[69]
50% Reduction – £355
20% Reduction - £142

DNV GL © 2016
Use Case 2: Industrial & Commercial electricity storage used to time shift energy generated or energy usage
22
Question Current Reasoning Future
How well do existing technologies meet this specification?
A variety of technologies could meet that system requirements. There are currently no comparable storage projects in the UK currently however there are parallels between storage for I&C customers and domestic properties
How well does the investment case for this electricity storage stack up (lifetime/discounted costs)?
The investment case is bespoke to the customer, however, at the current cost of storage it is not expected that reducing TNUoS and DUoS charges alone will make the business case stack up – Falling cost of storage technologies. The primary existing challenges are the technical and market knowledge that commercial customers have for storage
What is the scale of the opportunity in 2016 and how is this likely to change over time?
Acceptance from I&C customers that storage can provide energy bill reductions will support the uptake of I&C storage. New service offerings from suppliers and aggregators incorporating storage for I&C customers. Increased price signal volatility will increase the potential revenue from arbitrage
Peak shaving The opportunity for peak shaving will depend on whether the value is gained by (or shared between) the Supplier, DNO or I&C customer. Peak shaving can be driven by the Supplier using TOU tariffs or potentially the DNO.
Network investment deferral
If supply contracts and potential triad periods align with periods of high network stress then peak shaving could help defer network investment
Avoiding renewables curtailment
It is unlikely that I&C customers renewable output is curtailed in the sense of network operators restricting output, however PV systems stop working when networks go out of operational limits. The ability for DNOs to take a more proactive approach to managing renewables in the distribution network could be achieved by managing domestic loads via storage. Doing so could help alleviate problem such as over voltages and reserve power flows caused by renewables.
Optimal system balancing
Reducing the energy consumed from the grid during the half hourly triad period helps increase system balancing opportunities as large customers energy is often settled half hourly unlike domestic properties

DNV GL © 2016
Use Case 3: Electricity storage used to protect network infrastructure by
a DNO
23
Use Case 3
S
Business (SME/I&C)
Electricity
Storage
Transmission
Network
Distribution – MV
(33 kV and 11 kV)
Transmission
Distribution – MV (33 kV and 11 kV)
Distribution – LV (415 V)
Distribution – LV
(415 V)
S
IGIntermittent
Generation
S IG
Residential
S
ResidentialBusiness
(SME/I&C)Business
(SME/I&C)
S
Business (SME/I&C)
S
Residential
S
IG
Business (SME/I&C)
S
IG
S S IG S S
CustomerDNOSupplier Generator
Use Case 3

DNV GL © 2016
Use Case 3: Electricity storage used to protect network infrastructure by a DNO
24
Technology neutral system requirements:
• A majority of the energy storage systems deployed by DNOs in the UK are Lithium-Ion batteries. As the DNOs understand the technical requirements of the technology other technologies will be able to provide system services
• The Power electronics elements of a storage system can be very valuable to a DNO, providing phase balancing harmonic support etc.
How storage can meet the identified need: • There is circa 12.45 MW and 20.2 MWh of energy storage deployed across the country, with an additional 3 MW and 1.5 MWh of
energy storage either under construction or being planned in the UK [41]. The current level of deployment of battery storage capacity in the UK is relatively low with only 24 operational sites, ranging from 0.005 to 10 MW in power output [42]. A significant proportion of this storage is DNO owned and funded through the LCNF. The projects range from domestic storage systems with joint DNO domestic customer ownership models, Low Voltage network connected DNO owned energy storage systems to Medium Voltage network connected energy storage systems with shared ownership models.
• The projects have demonstrated (albeit through innovation funding) how storage connected at different parts of the network can provide Power Flow Management, Voltage Support and be used to minimise network losses
Description: • Reinforcing the distribution network will become essential to ensure it remains within its operating constraints as demand and
generation on the network increases, due to the penetration of low carbon devices, such as electric vehicles and electric heating. Therefore the Distribution Network Operators (DNOs) role of ensuring the distribution networks infrastructure remains within its operating constraints is becoming more difficult. The deployment of energy storage in the distribution network provides a potential alternative to conventional reinforcement.
Storage can provide support to the network in the following areas: • Power Flow Management - Electrical assets such as cables have finite thermal capacities beyond which their insulation
performance deteriorates; excessive heat will cause an asset to fail. The traditional engineering approach for addressing poor thermal performance seeks to distribute demand and generation evenly across phases at construction. Split-up heavily congested networks by introducing additional interconnection and overlay sections of reduced capacity. Theses traditional methods can be costly, disruptive and carbon-intensive operations. Storage can help mitigate peaks in demand, level load, balance demand across phases to minimise current flowing through the neutral cable and reducing reverse power flow
• Voltage - The DNO‘s are regulated as defined under the Electricity Supply Quality and Continuity Regulations (ESQCR) to constrain the network voltages to 216.2-253V (i.e. 230V +10%/-6%). Storage can both inject and absorb active and reactive power in the network to help solve under-voltage, over-voltage, voltage unbalance, voltage quality issues, provide power factor correction, reduce the need to constrain Distributed generation, minimise on-load tap changer operations, harmonics and mitigate flicker
• The technical losses on a distribution network are a function of current flow through the cable resistance. The traditional approach to technical loss reduction seeks to install additional capacity and attempts to balance connections across all phases. Storage can help mitigate losses in a distribution system [43].
DNV GL © 2016
Use Case 3: Electricity storage used to protect network infrastructure by a DNO
25
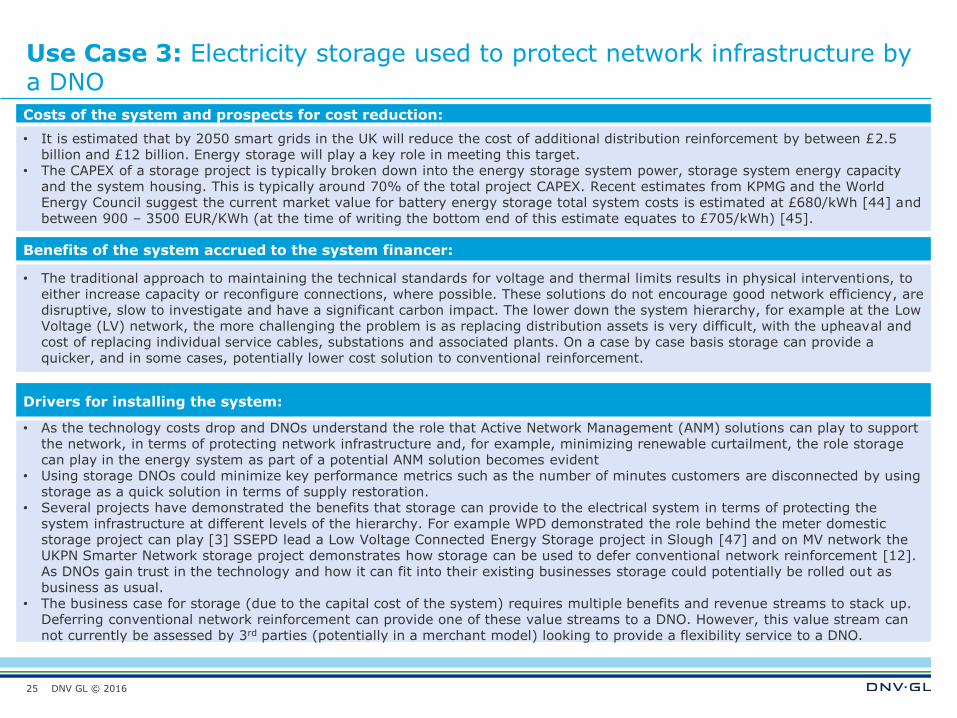
Drivers for installing the system:
• As the technology costs drop and DNOs understand the role that Active Network Management (ANM) solutions can play to support the network, in terms of protecting network infrastructure and, for example, minimizing renewable curtailment, the role storage can play in the energy system as part of a potential ANM solution becomes evident
• Using storage DNOs could minimize key performance metrics such as the number of minutes customers are disconnected by using storage as a quick solution in terms of supply restoration.
• Several projects have demonstrated the benefits that storage can provide to the electrical system in terms of protecting the system infrastructure at different levels of the hierarchy. For example WPD demonstrated the role behind the meter domestic storage project can play [3] SSEPD lead a Low Voltage Connected Energy Storage project in Slough [47] and on MV network the UKPN Smarter Network storage project demonstrates how storage can be used to defer conventional network reinforcement [12]. As DNOs gain trust in the technology and how it can fit into their existing businesses storage could potentially be rolled out as business as usual.
• The business case for storage (due to the capital cost of the system) requires multiple benefits and revenue streams to stack up. Deferring conventional network reinforcement can provide one of these value streams to a DNO. However, this value stream can not currently be assessed by 3rd parties (potentially in a merchant model) looking to provide a flexibility service to a DNO.
Benefits of the system accrued to the system financer:
• The traditional approach to maintaining the technical standards for voltage and thermal limits results in physical interventions, to either increase capacity or reconfigure connections, where possible. These solutions do not encourage good network efficiency, are disruptive, slow to investigate and have a significant carbon impact. The lower down the system hierarchy, for example at the Low Voltage (LV) network, the more challenging the problem is as replacing distribution assets is very difficult, with the upheaval and cost of replacing individual service cables, substations and associated plants. On a case by case basis storage can provide a quicker, and in some cases, potentially lower cost solution to conventional reinforcement.
Costs of the system and prospects for cost reduction:
• It is estimated that by 2050 smart grids in the UK will reduce the cost of additional distribution reinforcement by between £2.5 billion and £12 billion. Energy storage will play a key role in meeting this target.
• The CAPEX of a storage project is typically broken down into the energy storage system power, storage system energy capacity and the system housing. This is typically around 70% of the total project CAPEX. Recent estimates from KPMG and the World Energy Council suggest the current market value for battery energy storage total system costs is estimated at £680/kWh [44] and between 900 – 3500 EUR/KWh (at the time of writing the bottom end of this estimate equates to £705/kWh) [45].
DNV GL © 2016
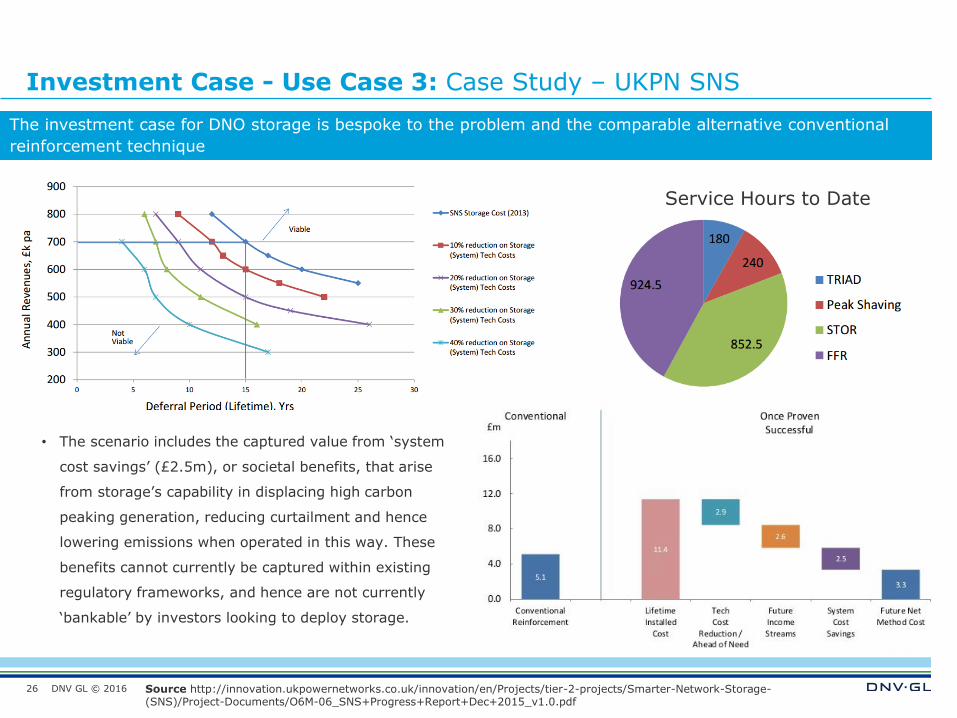
Investment Case - Use Case 3: Case Study – UKPN SNS
26 Source http://innovation.ukpowernetworks.co.uk/innovation/en/Projects/tier-2-projects/Smarter-Network-Storage-(SNS)/Project-Documents/O6M-06_SNS+Progress+Report+Dec+2015_v1.0.pdf
• The scenario includes the captured value from ‘system
cost savings’ (£2.5m), or societal benefits, that arise
from storage’s capability in displacing high carbon
peaking generation, reducing curtailment and hence
lowering emissions when operated in this way. These
benefits cannot currently be captured within existing
regulatory frameworks, and hence are not currently
‘bankable’ by investors looking to deploy storage.
The investment case for DNO storage is bespoke to the problem and the comparable alternative conventional
reinforcement technique
Service Hours to Date

DNV GL © 2016
Investment Case - Use Case 3: Electricity storage used to protect network infrastructure by a DNO
27
Example Network Reinforcement costs [15]
• A new 5 km dedicated 11 kV cable – likely cost £460k within overall range of £200k to £720k. Specific to SWWPD (South
West WPD) area
• A new 10 km dedicated 33 kV cable – likely cost £2 million within overall range of £0.8 million to £3.1 million. Specific to
SWWPD area
• Additional 132/33 kV transformer - £0.8 million to £1.2 million. Specific to SWWPD area. High likelihood of cost
apportionment.
A simple generic example (each case is very locational dependent) -
• Assume a 11/33 kV substation requires an upgrade as demand is expected to increase downstream on the
respective network.
• The ‘limit or capacity’ (as a proxy to the thermal limitations of the asset) is assumed to be 15 MW and future
peak demand is forecast to be 20 MW, the peak demand is expected to last for 1 hour.
• Assume that the DNO will need to cover the cost of the substation upgrade which is expected to be around £5
million
• A 6 MW / 6 MWh storage device at 900 £/kW cost a total of £5.4 million
• Typically the asset (storage or transformer) cost is levelized over its life and the yearly value of the
transformer upgrade deferral is estimated. However the deferral benefit can also be calculated as the benefit
from shifting transformer upgrade cash flow forward by the number of years of deferral
• A DNO will need to analyse the conventional vs. storage costs and how the value of the asset deferral is
calculated in order to evaluate whether storage is a potential solution to network reinforcement

DNV GL © 2016
Use Case 3: Electricity storage used to protect network infrastructure by a DNO
28
Question Current Reasoning Future
How well do existing technologies meet this specification?
Projects both in the UK and across the globe have shown the ability of energy storage to protect the electrical network infrastructure
How well does the investment case for this electricity storage stack up (lifetime/discounted costs)?
The business case for DNO owned storage is bespoke to the problem. UK projects have shown that as storage costs are reduced the business case begins to stack up. Lower technology costs, allowing DNOs access to the relevant value streams, quantifying flexibility
What is the scale of the opportunity in 2016 and how is this likely to change over time?
Issues with ownership and technology costs means there will be limited opportunities in 2016. However, in some scenarios such as the WPD and RES storage project DNOs will start deploying storage Lower technology costs, DNO trust and understanding of the assets and ownership/regulatory issues resolved. WPD is deploying a storage system with RES in mid 2016 [56]
Peak shaving By exporting energy to the network from a storage system can reduce the flow downstream from the point that the system is connected to the network. Storage can play a key role in increasing a systems security of supply
Network investment deferral
Across the globe energy storage has shown its ability to defer network investment. Storage at a variety of levels on the distribution network could help defer network investment from domestic to large scale MV connected storage
Avoiding renewables curtailment
See Use Case 4 – As Network operators take a more proactive approach to managing their network more actively there is an opportunity to both use storage to avoid renewables curtailment and protect the network infrastructure
Optimal system balancing
The role of the network operators does not currently include system balancing. In the future as a DNO potentially transforms to a DSO role DNO owned storage could support optimal system balancing

DNV GL © 2016
Use Case 4: Electricity storage used to firm up intermittent generation
29
Use Case 4
S
Business (SME/I&C)
Electricity
Storage
Transmission
Network
Distribution – MV
(33 kV and 11 kV)
Transmission
Distribution – MV (33 kV and 11 kV)
Distribution – LV (415 V)
Distribution – LV
(415 V)
S
IGIntermittent
Generation
S IG
Residential
S
ResidentialBusiness
(SME/I&C)Business
(SME/I&C)
S
Business (SME/I&C)
S
Residential
S
IG
Business (SME/I&C)
S
IG
S S IG S S
CustomerDNOSupplier Generator

DNV GL © 2016
Use Case 4: Electricity storage used to firm up intermittent generation
30
Technology neutral system requirements:
• Many storage technologies such as flow batteries, lithium ion (Li-ion) batteries and cryogenic storage meet the requirements needed to control and store the output of intermittent generation [13].
• The chosen technology must meet the requirements and specifications: the number of charging cycles, power rating, energy density, system efficiency and safety all play a role in selecting a specific technology.
• Technology such as demand side response could also help accommodate lower connection agreements for intermittent generation, however, it will be difficult without trust and a comprehensive understanding of such technologies by the DNOs and developer community.
How storage can meet the identified need:
• Storage systems can store the output of renewable generation and therefore add the ability to control the export of intermittent generation onto the network [9].
• Allowing firmer connection agreements means that more renewable energy can be generated and exported onto the system without causing the network to go out of its operational limits.
• Though the storage technology itself has been proven to smooth, control and store the output of renewable generation in a number of case studies, the contractual and commercial aspects of such a system in the UK still requires further consideration.
Description:
• A typical connection agreement in the UK has two fundamental elements: the required redundancy level (e.g. whether the connection is firm or non-firm) and the required network capacity. Typical intermittent generation connected to the distribution network has a non-firm agreement due to the high cost of a firm agreement. A non-firm agreement means that the DNOs can restrict export when the network is constrained which restricts the revenue gained from an intermittent generation system [11].
• Electricity storage can absorb power from the renewable assets and therefore allow lower cost non-firm connection whilst reducing the potential lost output of intermittent generation
• Certain network operators in the UK are allowing renewables to export overnight in constrained areas on non-firm connection agreements; similar contractual agreements could be put into place with storage and renewables. By increasing the flexibility and optimizing connection agreements electricity storage will increase the amount of renewable energy that can be exported on the network and minimize the amount being curtailed [12]. One example would be to introduce and define windows of time where specific generators can export power.
• Introducing storage to a renewable system and requesting a connection agreement increases the level of capacity that is requested. In the future, storage could decrease the level of connection capacity required in the connection agreement by controlling and limiting the output of intermittent generation.
• Currently the requester of a connection agreement will bear the charge of reinforcing the network if required to do so by the DNO. Storage could decrease the cost of reinforcing the network by deferring the cost of conventional expensive network reinforcement.

DNV GL © 2016
Use Case 4: Electricity storage used to firm up intermittent generation
31
Drivers for installing the system :
• Firming up intermittent generation means that financiers and developers can have a more comprehensive understanding and take on lower risk in terms of the revenue that can be generated from generation connected via non-firm connection agreements.
• DNOs will need to understand storage and its benefits in order to gain trust in the systems being able to achieve their potential contractual requirement. There are several options on how storage could be adopted by DNOs: allowing 3rd party control of the storage or giving the DNO direct/part control. Where several controllable elements are on the system Active Network Management (ANM) could be introduced giving DNOs greater control [14].
• The SSE NINES project introduced a new ‘flexible’ connection agreement which incorporates time periods or windows where generation can be exported [10].
• Adopting storage with intermittent generation could also increase flexibility within the networks and decrease the amount of renewable generation that is curtailed.
Benefits of the system accrued to the system financer:
• Lower connection agreement charges leads to a lower CAPEX for the financer and a lower rate of renewable curtailment means a higher return in revenue from the renewable generation system.
• Firming up intermittent generation has several secondary benefits such as the ability to sell the energy in blocks back to the market as well as being able to minimize the imbalance charges set out in the cash out reform.
Costs of the system and prospects for cost reduction:
• Considering potential prices for storage is complex due to the variety of technologies in the marketplace; there is no consensus in price forecasts other than they will continue to decline. Li-ion can be expected to follow the price reduction of its predecessor, Nickel-Metal Hybrid (NiMH), that was steeper than all predictions. Using the same curve and extrapolating to 2018, Li-ion achieves $500/kWh in 2015 – that is already being witnessed - and $225/kWh by 2018 [2]. It should be noted that depending on the storage technology and how it is packaged, the battery or ‘storage capacity’ cost may only be 25% to 50% of the system cost.
• The rate in which networks are becoming constrained is regional specific. For example, in the South of the UK there are large penetrations of PV in certain areas while Scotland has higher penetrations of wind. Therefore connecting more non-firm generation to these parts of the network risks a large amount of curtailment.
• Reinforcement costs are network specific, as each network is bespoke and reinforcement techniques depend on a number of currently uncontrollable parameters.

DNV GL © 2016
Investment Case through
Compare options 1 - 3 against 4
Non – Firm connection agreement cost
Revenue lost in terms of the amount of time renewables are likely to be curtailed
Firm connection agreement cost + traditional network reinforcement cost
Revenue lost in terms of the amount of time renewables are likely to be curtailed
Hybrid connection agreement cost + traditional network reinforcement cost
Revenue lost in terms of the amount of time renewables are likely to be curtailed
Compare cost to:
Firm / Partly–Firm connection agreement cost + storage system cost
Revenue lost in terms of the amount of time renewables are likely to be curtailed
If is less than - then electricity storage case should be considered
Integrating electricity storage with intermittent generation
1) Storage an help DNO defer conventional network reinforcement.
2) DNOs can allocate windows where export to the grid is allowed - agreed via a commercial contract.
3) Active Network Management – Transition for DNOs from passive to ANM dispatch. The UKPN Flexible Plug and Play project is an example of such a ANM scheme [14]. Such an arrangement could lead to the optimal allocation of connection agreements.
32
1
2
3
1 4 3
4

DNV GL © 2016
Curtailment Rate
33
0.00%
2.00%
4.00%
6.00%
8.00%
10.00%
12.00%
14.00%
Jan
Feb
Mar
Apr
May
Jun
Jul
Aug
Sep
Oct
Nov
Dec
Pro
porti
on
of
To
tal
En
erg
y e
xp
orte
d
Month
• Top plot shows the proportion of total energy for each month
for an example 5MW PV system with a load factor of 11%.
• Typical Load Factors vary between ~10-30%.
• In any one year the site was expected to export 11% of its
maximum potential capacity (potential export capacity =
installed MW x 365 days x 24 hours). The plot shows how the
11% load factor was distributed across the year.
• Sites in the UK which are beneath 5MW receive FIT rates, sites
above this receive ROCs until the closure date, at which point
the sites will be dependant on CFDs for income.
• The best case scenario in terms of curtailment could assume
2-3 days per year on average over a 20 year period. (Assumes
1 day constraint per year for 19 years and one 40 day
constraint in year 20).
• Using the bottom plot and assuming the availability on the
transmission network reflects that of the distribution network,
equating to an average circuit availability of 93% to 94%,
implies around 20 days lost per year on average as a worst
case scenario [17].
• For a worst case scenario it could therefore be assumed that
curtailment could range between 2 and 20 days a year.
• How does the price of an electricity storage system
compare to the cost of a 20 day outage in May?
87.00%
89.00%
91.00%
93.00%
95.00%
97.00%
2010-112011-122012-132013-142014-15Percen
tag
e o
f N
ati
on
al
Grid
s A
nn
ual
Syste
m
Availab
ilit
y
Year
There are currently no records of the rates of network outage or constraint volume from non-firm DNO
connections. The constraint volume is dependent on location, local network congestion and connection date.
Source: Percentage of National Grids Annual System Availability [17]

DNV GL © 2016
Connection Agreement – Connection Charge
34
Example Network Reinforcement costs [15]
• A new 5 km dedicated 11 kV cable – likely cost £460k within overall range of £200k to £720k. Specific to SWWPD
(South West WPD) area. Assume no reinforcement cost apportionment.
• A new 10 km dedicated 33 kV cable – likely cost £2 million within overall range of £0.8 million to £3.1 million.
Specific to SWWPD area. Assume no reinforcement cost apportionment.
• Additional 132/33 kV transformer - £0.8 million to £1.2 million. Specific to SWWPD area. High likelihood of cost
apportionment. This scheme would reflect a very straightforward reinforcement with no need to establish a 132 kV
switching node.
Note, installation rates vary between DNOs. DNOs are obligated to propose the lowest cost in terms of the proposed
network reinforcement technique but any use case studied will be a bespoke problem.
Storage system costs
Large battery systems that may be appropriate for such a system currently cost between 600 £/kW and 1200 £/kW.
• Assume a 5 MW PV plant that requires a new 10 km dedicated 33 kV cable costing ~£2 million
• Given the CAPEX for network reinforcement a 2MW / 2MWh storage device (assuming ~900 £/kW) would need
to achieve the same result using one of the 3 options on the previous slide to put in place a Firm connection
agreement.
• However, a storage device 4 times the generation size is 20 MWh and would cost ~£18 million. A storage
capacity of 4 times the PV plant peak equates to around 4 hours of generation at peak stored.
• Self consumption domestic models which average out demand and generation assume double the PV capacity
is required for the storage capacity. If a similar approach was adopted in this case a 10 MWh device is
required (large enough to take the peak and level it out across the shoulders of the profile) [16].

DNV GL © 2016
Use Case 4: Electricity storage used to firm up intermittent generation
35
Question Current Reasoning Future
How well do existing technologies meet this specification?
Each electricity storage technology is reaching maturity at its own rate. However there are examples across the globe of storage connected to the network with intermittent generation, most notably in Japan, China, North America and Germany. No single technology will be most suited to every scenario developed.
How well does the investment case for this electricity storage stack up (lifetime/discounted costs)?
The investment case is bespoke to the connection agreement. Aspects such as the location and temporal aspects as to when the network may currently be constrained, as well as the benefits storage can add in comparisons to deferring / negating the need for conventional network reinforcement should be considered.
What is the scale of the opportunity in 2016 and how is this likely to change over time?
Firming up non-firm renewable generation has multiple benefits, however the take up and deployment of such technology will depend on the understanding and relationship between DNOs and the development communities. Once storage is accepted as a solution to firming up generation and is seen as part of a standard connection agreement, the opportunity will increase significantly over time.
Peak shaving In periods of high demand the down stream flow of energy from the electricity storage system could be reduced when demand is high. However this will depend on the commercial arrangements put in place as well as who controls the storage system.
Network investment deferral
The ability for energy storage to defer conventional reinforcement is specific to each problem both in terms of technical and commercial challenges. However, storage placed and used correctly, which may be possible when combined with intermittent generation, as well as DNOs having more control and understanding over what goes onto the network could help defer network investment.
Avoiding renewables curtailment
This is one of the two the main drivers to the financer/developer to combining storage with intermittent generation. The other being the potential to lower connection charge agreements.
Optimal system balancing
Firming up intermittent generation could lead to new plants being available for dispatch. It will also allow network operators to have a greater understanding of when renewable generation will be exported onto the network. Better forecasting and understanding of the network means systems can be run more efficiently.

DNV GL © 2016
Use Case 5: Merchant model large scale storage (arbitraging energy
prices, providing national level ancillary services)
36
Use Case 5
S
Business (SME/I&C)
Electricity
Storage
Transmission
Network
Distribution – MV
(33 kV and 11 kV)
Transmission
Distribution – MV (33 kV and 11 kV)
Distribution – LV (415 V)
Distribution – LV
(415 V)
S
IGIntermittent
Generation
S IG
Residential
S
ResidentialBusiness
(SME/I&C)Business
(SME/I&C)
S
Business (SME/I&C)
S
Residential
S
IG
Business (SME/I&C)
S
IG
S S IG S S
CustomerDNOSupplier Generator
Use Case 5

DNV GL © 2016
Use Case 5: Merchant model large scale storage (arbitraging energy prices, providing national level ancillary services)
37
Technology neutral system requirements:
• The technical requirements depend on the vast array of services a storage system can provide • Defining generic parameters such as power, energy, efficiency, number of cycles etc. means that a variety of technologies
such as– CAES [54], pumped hydro, Power to gas [57] etc. could be used in a merchant model as large scale storage
How storage can meet the identified need:
• Storage can compete with existing market incumbents by providing/delivery energy to the energy system at a required rate. The Energy Storage power and energy trade off limits what services a system can provide
• Energy storage can absorb and generate energy so can also be used for turn up services • The flexibility and dynamic ranges of available technologies mean that storage systems can be developed to meet the
desired technology requirements
Description:
• A merchant model in terms of energy storage is a business model that consists in selling goods or services, the storage owner takes full ownership and operation of the asset and is responsible for monetising the value from the market [9]. Energy Storage can participate in a variety of the market mechanisms in the UK.
• See the diagram on the following slide for a list of services split by the market stakeholder who can access the relevant value stream:
• National Grid – National Grid offer a variety of market services that storage can participate in. Each of the services has a set of specifications that the storage system must meet. In 2015 National Grid published a Technical Guidance and Testing Procedure for Static and Dynamic Demand Response and Battery Storage Providers of Frequency Balancing Services [53].
• Supplier/Aggregator – Aggregators can give access to parties wanting to participate in the National Grid services. Storage can also play a key role in supporting an aggregators virtual power plant (asset base).
• DNO – As discussed in use case 3 there are several restrictions to opportunities for third parties once DNOs understand the value of quantifying flexibility
• Arbitrage - Market buy and sell price or via a supplier contract. • Capacity Market - the results of the first auction, which cleared at £19.40/kW-year, have demonstrated that, for now,
storage may not be ready to compete with other eligible technologies

DNV GL © 2016
Use Case 5: Merchant model large scale storage (arbitraging energy prices, providing national level ancillary services)
38
Drivers for installing the system:
• Long term contracts – Current market services with long term contracts are not accessible to energy storage, the new EFR service offered by NG will assign 4 year contracts to successful participants
• Falling capex – The falling cost of storage technology will help the business case for merchant model storage • Quantifying the value of flexibility • Ofgem Electricity Balancing Significant Code Review, changes to Imbalance charges – The EMR has tightened the charges
around imbalance charges , meaning that generators are now penalized more significantly for not meeting their forecasted output. • Regulatory/Legislation – Currently energy storage is not defined or mentioned in UK energy regulation/legislation (the capacity
market is an exception) • Increased volatility in the spot market price of energy - As the volatility of price increases the opportunity for storage in a
merchant model increases • Technology – As the technology readiness level increases system metrics such as the lifetime of the asset, safety guidelines and
performance etc. will be better understood. Increase the understanding will increase confidence in procuring and deploying storage systems.
Benefits of the system accrued to the system financer:
• Assuming the storage system owner/operator finances the system the benefits accrued to the system financer are access to the revenue streams from supplying services to the market
• Benefits to the stakeholders listed on the previous slides are increased demand side flexibility and an increase in fast responding plants on the system
Costs of the system and prospects for cost reduction:
• Recent estimates from the World Energy Council suggest the current market value for battery energy storage total system costs is estimated at between 900 – 3500 EUR/KWh (at the time of writing the bottom end of this estimate equates to £705/kWh) [45]. The report shows that higher energy density systems (and lower power rating systems) such as power to gas technologies or Compressed Air Energy Storage, currently have smaller price ranges than batteries, however, in 2030 the projections show that the lower end estimates are lower than those of battery technologies. Larger scale technologies such as Pump Hydro which currently have higher technology readiness levels will show little reduction in price over the next 15 years
• Significant cost reductions in storage technologies are not only linked to the energy market enablers but also the other markets that the technology can compete in. For example, a significant reason for the cost reduction in Lithium-Ion batteries is linked to the electric vehicle industry procuring large amounts of storage capacity. Each technology is at a different technology readiness level and costs and the cost of the technology is falling at different rates

DNV GL © 2016
Investment Case - Use Case 5: Merchant model large scale storage (arbitraging energy prices, providing national level ancillary services)
39
Storage
Supplier/Aggregator
Imbalance Risk Hedging
Opportunity Trading
Aggregated Services
1) Triad Avoidance
Distribution Network Operator
Constraint Management
Demand Side Response
ANM of curtailed Renewables
Other Future Services?
Transmission System Operator
2) STOR
3) Response Services
Fast Start/Reserve
Constraint management
Reactive Power
Energy Contracts
4) Enhanced Frequency Response

DNV GL © 2016
Investment Case - Use Case 5: Merchant model large scale storage (arbitraging energy prices, providing national level ancillary services)
40
STOR Availability Payment
Apr-14 May-14 Jun-14 Jul-14 Aug-14 Sep-14 Oct-14 Nov-14 Dec-14 Jan-15 Feb-15 Mar-15 Apr-15 May-15 Jun-15 Jul-15 Aug-15 Sep-15
STOR NBM Flexible Paid £m 0.02 0.04 0.01 0.01 0.01 0.01 0.01 0.06 0.05 0.06 0.04 0.06 0.02 0.03 0.03 0.03 0.03 0.02
STOR NBM Committed Paid £m 1.84 2.19 2.21 2.33 2.27 2.26 2.07 1.74 1.79 1.77 1.65 1.89 1.87 2.21 2.17 2.27 2.18 2.16
STOR BM Committed
Paid £m 0.96 1.19 1.19 1.37 1.36 1.36 1.42 1.56 1.6 1.57 1.43 1.53 0.49 0.57 0.59 0.59 0.58 0.59
STOR Utilisation
Apr-14 May-14 Jun-14 Jul-14 Aug-14 Sep-14 Oct-14 Nov-14 Dec-14 Jan-15 Feb-15 Mar-15 Apr-15 May-15 Jun-15 Jul-15 Aug-15 Sep-15
STOR NBM Flexible Volume MWh 2,059 2,001 1,307 1,354 2,863 3,085 9,089 17,608 17,064 13,536 10,076 17,799 2,971 4,550 5,038 4,042 7,231 6,998
STOR NBM Committed Volume MWh 11,051 6,844 5,965 6,755 15,691 17,331 13,800 471 278 965 1,098 1,920 4,059 6,780 6,283 5,610 9,330 8,750
STOR BM Committed
Volume MWh 6,178 3,118 2,070 2,006 4,926 3,714 11,804 6,363 7,136 14,159 4,500 6,201 1,233 1,975 1,316 3,209 3,965 4,350
Tot.Vol. MWh 19,288 11,963 9,342 10,115 23,480 24,130 34,693 24,442 24,478 28,660 15,674 25,920 8,263 13,305 12,637 12,861 20,526 20,098
STOR NBM Flexible Paid £m 0.946 0.464 0.306 0.291 0.746 0.543 1.816 1.075 1.066 2.262 0.666 0.950 0.210 0.351 0.365 0.292 0.560 0.469
STOR NBM Committed Paid £m 1.009 0.684 0.577 0.608 1.457 1.510 1.263 0.050 0.029 0.106 0.115 0.205 0.335 0.577 0.569 0.519 0.828 0.774
STOR BM Committed (Settlement)
Paid £m 0.244 0.230 0.147 0.151 0.290 0.249 0.807 1.537 1.386 1.198 0.871 2.029 0.196 0.314 0.204 0.500 0.600 0.600
STOR NBM Flexible Aver.Cost £/MWh 459.45 231.88 234.12 214.92 260.57 176.01 199.80 61.05 62.47 167.11 66.10 53.37 70.68 77.14 72.45 72.24 77.44 67.02
STOR NBM Committed Aver.Cost £/MWh 91.30 99.94 96.73 90.01 92.86 87.13 91.52 106.16 104.32 109.84 104.74 106.77 82.53 85.10 90.56 92.51 88.75 88.46
STOR BM Committed
Aver.Cost £/MWh 39.49 73.77 71.01 75.27 58.87 67.04 68.37 241.55 194.23 84.61 193.56 327.21 158.96 158.99 155.02 155.81 151.32 137.93
FFR Apr-14 May-14 Jun-14 Jul-14 Aug-14 Sep-14 Oct-14 Nov-14 Dec-14
Holding
Volume (MW) 255,749 290,253 291,950 305,392 280,673 275,186 297,511 232,551 273,297
Response Cost
(£m) 9.02 10.58 10.89 10.49 9.75 9.83 9.12 7.29 9.9
AVG (£/MW) 35.3 36.5 37.3 34.3 34.7 35.7 30.7 31.3 36.2
FFR Jan-15 Feb-15 Mar-15 Apr-15 May-15 Jun-15 Jul-15 Aug-15 Sep-15
Holding
Volume (MW)
286,587 271,682 323,470 281,060 357,420 300,000 360,000 360,320 433,020
Response Cost
(£m)
10.08 8.48 10.55 8.16 9.55 9.91 11.77 10.33 9.08
AVG (£/MW) 35.2 31.2 32.6 29.0 26.7 33.0 32.7 28.7 21.0
FFR
STOR
Further data on STOR is available from in the ‘STOR Annual Market Report 2014_2015 Data’ available from
http://www2.nationalgrid.com/WorkArea/DownloadAsset.aspx?id=44494

DNV GL © 2016
Use Case 5: Merchant model large scale storage (arbitraging energy prices, providing national level ancillary services)
41
Question Rating Reasoning Future
How well do existing technologies meet this specification?
Existing technologies and projects have demonstrated a variety of commercial and technical capabilities for storage to meet the specification required in a merchant model.
How well does the investment case for this electricity storage stack up (lifetime/discounted costs)?
The merchant model business case in the UK is complex, it is difficult to understand future long term market services and therefore revenue streams. Stakeholders are beginning to understand how storage can provide several services to allow the business model to stack up – Long term contracts, Quantifying the value of flexibility, Regulatory / Legislation (tax).
What is the scale of the opportunity in 2016 and how is this likely to change over time?
It is anticipated that the UK will start to see merchant model energy storage deployed in the second half of 2016. Network operators have seen a significant increase in grid connection requests and the 200 MW National Grid EFR tender has raised the interest and profile of storage.
Peak shaving Though storage deployed in a merchant model could be used for peak shaving, consideration needs to be given to where the value is in reducing the peak and how revenue is generated from doing so.
Network investment deferral
DNOs/TSOs could own or procure 3rd party services in a merchant model to support network investment deferral. SSEPD’s constrained management zones project and the UKPN SNS project are trialing these models.
Avoiding renewables curtailment
If deployed behind a meter with existing renewables, if actively managed by a network operator or if financially incentivized, merchant model large scale storage could play a role in avoiding renewables curtailment.
Optimal system balancing
Energy Storage (excluding pumped hydro) currently does not act as a BMU. However in the future large scale storage could play a role in the balancing of the UK energy system (generation and consumption BMUs).

DNV GL © 2016
Summary
UC
1
UC
2
UC
3
UC
4
UC
5
How well do existing technologies meet this specification?
How well does the investment case for this electricity storage stack up (lifetime/discounted costs)?
What is the scale of the opportunity in 2016 and how is this likely to change over time?
42
Use Case 1
Domestic electricity storage used to time
shift energy generated or energy usage
Use Case 2
Industrial & Commercial electricity
storage used to time shift energy
generated or energy usage
Use Case 3
Electricity storage used to protect
network infrastructure (voltage control,
increase reliability, black start and
thermal management) by a DNO
Use Case 4
Electricity storage used to firm up
intermittent generation (sensitivity for a
cheaper connection charge)
Use Case 5
Merchant model large scale storage
(arbitraging energy prices, providing
national level ancillary services)

DNV GL © 2016
Summary
43
UC
1
UC
2
UC
3
UC
4
UC
5
Peak shaving
Network investment deferral
Avoiding renewables curtailment
Optimal system balancing
Use Case 1
Domestic electricity storage used to time
shift energy generated or energy usage
Use Case 2
Industrial & Commercial electricity
storage used to time shift energy
generated or energy usage
Use Case 3
Electricity storage used to protect
network infrastructure (voltage control,
increase reliability, black start and
thermal management) by a DNO
Use Case 4
Electricity storage used to firm up
intermittent generation (sensitivity for a
cheaper connection charge)
Use Case 5
Merchant model large scale storage
(arbitraging energy prices, providing
national level ancillary services)

DNV GL © 2016
Summary
44
Further research into the Use Case development should include:
– Highlighting points of overlap between the Use Cases and cases not covered:
– For example electricity storage used to firm up intermittent generation can also be used to
support the network as in Use Case 3 and provide ancillary services as discussed in Use
Case 5.
– Consider adding a Use Case on distribution connected energy storage, NOT owned by the
DNO, being utilised for ancillary services and 3rd party DNO services where the storage is
<=100MW. This could also cover concepts such as LV connected community energy storage,
i.e. not domestic but still behind a meter.
– Regulatory obligations and impact.
– Commercial models and economic evaluations.
– Defining specific storage ownership models.
– Carrying out more detailed modelling of the current and future business models and
investment cases for storage technology.
– Consider hybrid scenarios between heat and energy storage technologies.

DNV GL © 2016
Heat Storage
45

DNV GL © 2016
Introduction
Energy storage will play a key role in building a smarter energy system. However, to
understand where policy interventions could deliver the biggest benefit for consumers, BEIS
need first to understand what value energy storage represents compared to conventional or
flexible alternatives.
To overcome this, BEIS are taking a Use Case approach to understanding and supporting
energy storage development. The use cases are split into two sections; energy storage and
heat storage. This section of the document explores the heat storage aspect of the storage
use cases 6 to 9.
The following topics are addressed for each use case:
– Brief description of the use case
– Attributes required to deliver the primary case
– How well existing technologies meet this specification
– Drives for installation and adoption from a grid perspective
– User benefits
– Investment case
– Capability to meet network needs
– How the use case could be optimized
46
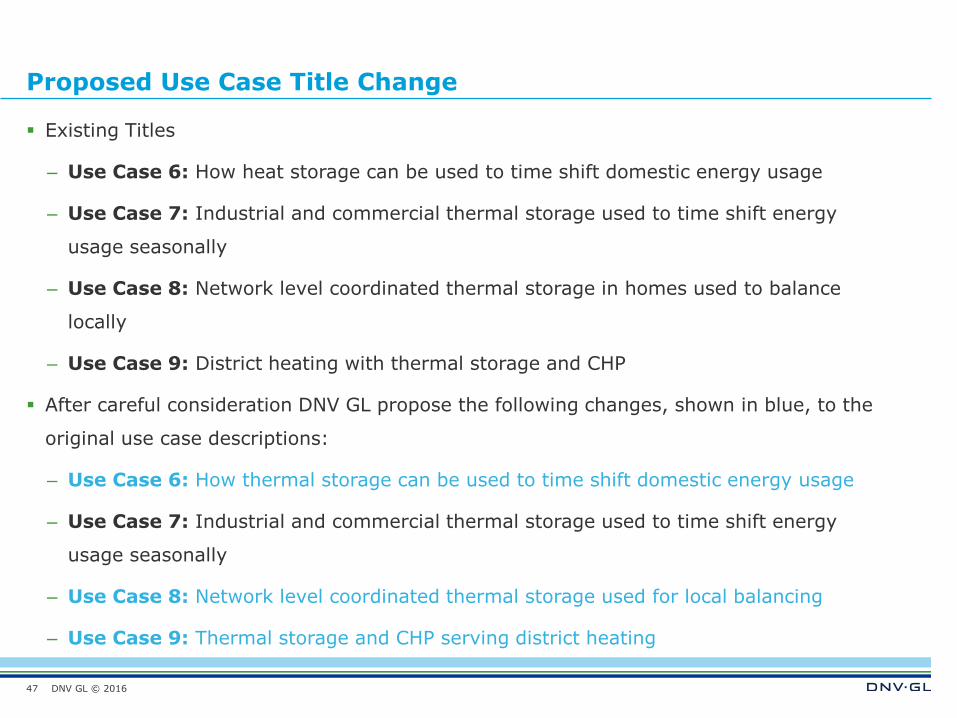
DNV GL © 2016
Proposed Use Case Title Change
Existing Titles
– Use Case 6: How heat storage can be used to time shift domestic energy usage
– Use Case 7: Industrial and commercial thermal storage used to time shift energy
usage seasonally
– Use Case 8: Network level coordinated thermal storage in homes used to balance
locally
– Use Case 9: District heating with thermal storage and CHP
After careful consideration DNV GL propose the following changes, shown in blue, to the
original use case descriptions:
– Use Case 6: How thermal storage can be used to time shift domestic energy usage
– Use Case 7: Industrial and commercial thermal storage used to time shift energy
usage seasonally
– Use Case 8: Network level coordinated thermal storage used for local balancing
– Use Case 9: Thermal storage and CHP serving district heating
47

DNV GL © 2016
Overview – Heat storage
48
S S
Residential
EM
S S
Residential
EM
S
Residential
HM
S
GM
S
S EM
Business (SME/I&C)
S S
Business (SME/I&C)
S S
HM
Business (SME/I&C)
S
HM
GM
GM
Heat Meter
Electricity Meter
Gas Meter
Thermal Storage
Water Storage
Residential
EM GM
CHP Combined Heat and PowerCHP
HeatDNO
CustomerDNOSupplierGasDNO
Heat
Electricity
Gas
EM
EM
EM
Residential
EM GM
Heat
Electricity
Gas
HM EM
S

DNV GL © 2016
Overview
System benefits are presented as four main goals:
–Peak Shaving: Peak shaving may occur for short term intra-day periods to reduce demand
for electricity on the transmission or distribution networks at times of system maximum
demand or maximum prices through to longer term intra seasonal demand (such as gas
demand in the winter.
–Network Investment Deferral: Reduce the need for investment in the electricity and gas
network for reinforcement generally by reducing the need to increase the network capacity.
–Avoiding Renewables Curtailment: Allow renewables to operate instead of reducing or
curtailing their output.
–Optimal System Balancing: Balance the supply and demand commodity requirements on
an electrical, gas or heat network in near real time to minimise import and exports to the
wider systems and provide the necessary network operational support services.
49

DNV GL © 2016
Use Case 6: How thermal storage can be used to time shift domestic energy usage.
50
Use Case 6
S S
Residential
EM
S S
Residential
EM
S
Residential
HM
S
GM
S
S EM
Business (SME/I&C)
S S
Business (SME/I&C)
S S
HM
Business (SME/I&C)
S
HM
GM
GM
Heat Meter
Electricity Meter
Gas Meter
Thermal Storage
Water Storage
Residential
EM GM
CHP Combined Heat and PowerCHP
HeatDNO
DNOGasDNO
Heat
Electricity
Gas
EM
EM
EM
Residential
EM GM
Heat
Electricity
Gas
HM EM
S
CustomerSupplier

DNV GL © 2016
Use Case 6: How thermal storage can be used to time shift domestic energy usage
51
Attributes required to deliver the primary use case:
For heat storage to effectively time shift domestic energy usage it should: • Be able to hold enough energy and be charged/discharged in such a manner as to meet the customer’s comfort needs. • Be well insulated to protect against losses. • Include an adequate control system that charges the heater at times of low power demand or high renewables
generation (either within in the home or from the grid); and provides heat in accordance with customers requirements. • Cost the same or less over its lifetime than a traditional heater.
How well do existing technologies meet this specification?
• There are about 6.5 million night storage heaters [37] and 13.7 million hot water storage cylinders [39] currently installed in the UK. Though this use case focused on night storage heaters, there are parallel opportunities for hot water storage.
• Currently installed traditional night storage heaters often have problems retaining a full charge. Heat ‘leaks’ from the heater even when it is not desired and can mean there is inadequate stored heat available the following evening. [37] The same will apply to poorly insulated hot water tanks.
• Since the storage heater is usually on a dedicated controlled circuit that only runs at night, a second heat source is likely to be used, such as a direct acting space heater (DASH) or over-ride of the immersion heater.
• Many newer storage heaters (currently on the market) store heat at lower temperatures and are better insulated so consume less energy and have less heat leakage. [37]
• There is also potential for heat pumps to replace immersion heaters as they are more efficient, albeit more expensive initially (£7,000-£11,000 for air source [35] and £11,000 to £15,000 for ground source [38]).
Description:
• A storage medium (generally either bricks or water) is ‘charged’ with heat during off peak times and then releases the heat (with some degree of control) throughout the day to maintain a comfortable space temperature.
• The most common version of this technology are night storage heaters, which charge bricks (usually overnight) with a resistance heater that uses cheaper electricity. Immersion heaters or heat pumps can also be paired with a water store.
• This requires a cost reflective time of use tariff for the customer and a form of control of the storage heating devices (including the immersion heater within a water tank). The same practice can also be applied on a larger scale to district heating schemes by heating a water store at night and utilizing the stored heat during the day.
• Solar thermal collectors can also be used to harness heat from the sun, that as a consequence represents an “offset” of domestic energy usage from the electricity and gas networks instead of shifting it. Some solar collectors can even store heat seasonally. [24] See UC7 for more details on seasonal storage.

DNV GL © 2016
Use Case 6: How thermal storage can be used to time shift domestic energy usage
52
Investment case:
• Many storage heaters are already installed and operating. However, new versions use about 20% less energy (and cost 25% less to run) than traditional storage heaters and hold a charge better. [37] This can result in up to £418* of savings per year per home. [32]
• When compared to an electric convector heater, these new storage heaters cost up to 47% less to run; resulting in up to £975* of savings per year per home. [32]
• There are about 6.5 million storage heaters and 2.5 million traditional electric resistance heaters currently installed in the UK. Replacing all of these with new smart storage heaters could provide up to 13 GW of controllable capacity. [37] However it is not clear how this 13 GW was defined (if it includes existing night heaters or not).
• One source stated a new Quantum (smart storage) heater costs about £700 [33]. New ‘dumb’ heaters cost between £154 and £380 depending on size. [34] Installation costs would likely be about the same for both technologies.
User benefits:
• Can utilize inexpensive energy to charge the system and therefore reduce the operating costs incurred by the consumer.
• Technology is already well known. • Increased electrification of heat by replacing higher carbon gas fired heating systems. • Provide greater comfort levels and energy efficiency for consumers.
Grid drivers for installation and adoption:
• Reduce peak demand from avoidable DASH and immersion heater use to smooth out electricity demands over a 24 hour period – potentially including consideration of the early morning Economy 7 peak in winter.
• Use cheaper, base load electricity instead of more expensive peak generation electricity.
*For a 3 bedroom semi-detached home built in the 1960s.

DNV GL © 2016
Value Streams - Use Case 6: How thermal storage can be used to time shift domestic energy usage
53
Network level coordinated thermal
storage
End User Purchase energy at
times of lower prices
Distribution Network Operator
Constraint management
Demand side response
Avoid/defer reinforcement
Transmission System Operator
Avoid renewable curtailment

DNV GL © 2016
Investment Case - Use Case 6: How thermal storage can be used to time shift domestic energy usage
Simple payback periods for standard and “smart” storage heaters:
54
TOUT
(p/kWh)
Night (20:00-6:59) 10
Day (7:00-15:59) 14
Peak Evening (16:00-19:59) 30
Rated
Power
(kW)
Max
Storage
(kWh)
Annual Heating
Requirements
(kWh)
Capital
Outlay (£) Interest
Loss
Factor
Annual
Savings (£)
Payback
(years) Sources
Elnur SH18M
Standard Storage
Heater 1.7 12 1000 £ 211.62 0.0% 20% £ 29.47 7.2 [64] [65]
Dimplex Qm125
Quantum Storage
Heater 1.25 14.9 1000 £ 698.90 0.0% 5% £ 40.23 17.4 [62] [66]
This doesn’t account for the added benefits of smart
controls (most of which are seen by the distribution
network operator) or the influence of building fabric heat
retention. However, its likely the building fabric influences
will be similar for both scenarios.
The life expectancy of a storage heater is 10-15 years.
[70] Dimplex’s Quantum heater comes with a 10 year
warranty. [71]
Homeowners will need an incentive of some sort to accept
the additional cost of smart storage heaters. (Different
TOUT, rebate payments, etc.)
Eln
ur
SH
18M
Q
m125 Q
uantu
m

DNV GL © 2016
Use Case 6: How thermal storage can be used to time shift domestic energy usage
55
Does this currently meet network needs?*
Peak Shaving
Yes. For the case where a storage heater is replacing DASH or water heating load, all heat load is shifted to non-peak hours since the heaters “charge” overnight and provide heat later. As long as the unit has adequate charge capacity, the heater will not run during peak hours. For the case where newer storage heaters are replacing older storage heaters, peak is reduced only if the older heater could not provide adequate heating and supplementary units were being used. [37] However it should be noted that widespread use of storage heaters can lead to an early morning peak.
Network Investment Deferral
Yes. Storage has the potential to reduce the consumption of energy used for heating in the evening and move it to non-peak times (but only when replacing traditional electric heaters). There is limited potential with homes that already have storage heaters (only the auxiliary heating will be shifted). Solar collectors will reduce the amount of grid energy required and could also help defer network upgrades. Under smart metering, the Supplier, DNOs and other stakeholders will need to determine who controls the switching and pricing as well as how it is implemented.
Avoiding Renewables Curtailment
Somewhat. This technology exists but is not widely used in the UK. Most storage heaters in the UK are effectively on a timer but some are tele-switched. See use case 8 for more details on more advanced flexible controls.
Optimal System Balancing
Somewhat. This technology exists but is not widely used in the UK. Currently installed night storage heaters do not have this capability but newer technologies have more advanced control systems. See use case 8 for more details on more advanced flexible controls.
*Unless otherwise cited, assessment of network needs and next steps comes from DNV GL institutional knowledge.

DNV GL © 2016
Use Case 6: How thermal storage can be used to time shift domestic energy usage.
56
How could the use case be optimized? (Future looking.)
Peak Shaving
Introduce higher efficiency storage heaters. New products consume less energy and are better insulated against loss. Newer units can hold a charge longer and do not require supplementary charging in the evenings. The adoption of smart meters can help avoid the early morning peak by staging the beginning of charging cycles. New users should also be educated on how a storage heater works in order to gain the most benefit since this technology can feel somewhat counterintuitive to those unfamiliar with it.
Network Investment Deferral
Newer high efficiency storage heaters use less energy and hold a charge more effectively. This means lower overall consumption as well as peak reduction. Need to pass control of the switched demand to the DNO but this will lead to problems for the Supplier and its wholesale purchase strategy. Under smart metering the Supplier, DNOs and other stakeholders will need to determine who controls the switching and pricing as well as how it is implemented.
Avoiding Renewables Curtailment
Integrate intelligent control systems with time of use pricing (trigger) or another notification system. Systems will respond by charging when prices are low due to low demand or excess renewable energy. Intelligent storage heaters can do this and are addressed more in use case 8.
Optimal System Balancing
Integrate intelligent control systems with time of use pricing or advanced network curtailment signals. These can modulate charging quickly and in real time to response to network stress. This is addressed more in use case 8.

DNV GL © 2016
Use Case 7: Industrial and commercial thermal storage used to time shift energy usage seasonally
57
S S
Residential
EM
S S
Residential
EM
S
Residential
HM
S
GM
S
S EM
Business (SME/I&C)
S S
Business (SME/I&C)
S S
HM
Business (SME/I&C)
S
HM
GM
GM
Heat Meter
Electricity Meter
Gas Meter
Thermal Storage
Water Storage
Residential
EM GM
CHP Combined Heat and PowerCHP
HeatDNO
CustomerDNOSupplierGasDNO
Heat
Electricity
Gas
EM
EM
EM
Residential
EM GM
Heat
Electricity
Gas
HM EM
S
Use Case 7

DNV GL © 2016
Use Case 7: Industrial and commercial thermal storage used to time shift energy usage seasonally
58
Attributes required to deliver the primary use case:
• The media should be able to hold enough energy for next season’s needs. • Cost the same, or less, over its lifetime than a traditional heater. • Efficient technology required to store energy for a long period of time.
How well do existing technologies meet this specification?
• There are four main categories of large scale low temperature thermal energy stores that have been successfully utilised over a number of different sites [21, 27] - Examples of all system types can be found in the UK:
• Tank thermal energy stores • Pit thermal energy stores • Borehole thermal energy stores • Aquifer thermal energy stores
• A Thermal Bank can also be used to store warm temperatures over a very large volume of earth for a period of months. Such a configuration is distinct from a standard heat store which can hold a high temperature for a short time in an insulated tank. [24]
Description:
• Seasonal thermal storage refers to 'long term' heat storage. • Primarily used for commercial/industrial processes that have time varying heat demands, batch processes or produce
waste heat as well domestic/commercial heating schemes. Heat storage can be used to reduce peak loads, shift heat availability in time and allow waste heat to be better utilised.[39]
• There are examples of inter-seasonal storage systems across several countries. They are typically based on solar thermal systems or waste heat. There are examples of seasonal thermal storage having been implemented for individual properties, multi occupancy buildings and groups of buildings. Many systems are installed with heat pumps to provide increased delivery temperatures.
• A majority of the inter-seasonal thermal storage in the UK is used to support domestic/commercial space and water heating demand within district heating schemes, in some cases utilising waste heat from industrial processes.

DNV GL © 2016
Use Case 7: Industrial and commercial thermal storage used to time shift energy usage seasonally
59
Investment case:
• Inter-seasonal Heat Transfer has been shown to double the performance of heat pumps by starting with warmth from Thermal Banks. [36] This can reduce carbon emissions by 50% when compared to using a gas fired boiler. [52]
• Due to the annual operational cycle, inter-seasonal storage cost must be low in order to provide payback on investment. There is an inherent relationship between the storage size and the cost. Small tank storage systems of 300m3 of water for example cost about €470/m3 compared to a cost of €120/m3 for a 12,000m3 store. Aquifer, borehole and pit thermal stores are lower cost, an aquifer storage for example with an equivalent storage capacity up to 5,000m3 of water costs around €40/m3 and a pit store with a volume of 75,000 m3 of water equivalent costs around €30/m3 [21, 37]
• Due to the low number of charge/discharge cycles and quantity of heat required, inter-seasonal heat storage needs to be very low cost to become attractive. To achieve low costs, systems need to be large.
• Case Study: Suffolk One is an East Anglian college that uses a thermal collector to collect solar energy that is then stored in 18 100 metres (330 ft.) probes for use in the winter heating.
User benefits:
• The ability to gain access to heat when it’s normally unavailable, or/and store excess heat that would otherwise be lost.
• Proven deployed examples across a variety of premises. • Can use renewable natural resources or waste heat product as an input. • Cost effectiveness and the ability to reduce winter demand (possibly including peak) will lead to lower customer bills
due to the reduction in annual heating demand supplied from the grid at higher prices. • Where batch processes are taking place heat exchange can be optimised.
Grid drivers for installation and adoption:
• Ability to reduce winter demand (possibly) including peak. • Current unpredictable high heat demand can be better understood and predicted by network operators, who can utilise
the knowledge to manage the system more effectively.

DNV GL © 2016
Value Streams - Use Case 7: Industrial and commercial thermal storage used to time shift energy usage seasonally
60
Seasonal thermal storage
End User Reduced energy costs, increased heat pump
performance
Distribution Network Operator
Defer reinforcement

DNV GL © 2016
Investment Case - Use Case 7: Industrial and commercial thermal storage used to time shift energy usage seasonally
Construction costs of seasonal
storage can vary significantly.
There is not a single ideal method,
but rather different concepts for
different applications. Some
examples of costs are given for four
case studies. [27] Note that these
costs do not include VAT or
planning costs.
– TTES: Tank Thermal Energy
Storage
– PTES: Pit Thermal Energy
Storage
– BTES: Borehole Thermal Energy
Storage
– ATES: Aquifer Thermal Energy
Storage
61

DNV GL © 2016
Investment Case - Use Case 7: Industrial and commercial thermal storage used to time shift energy usage seasonally
Costs per m3 tends to go down as the size of the thermal store increases. The plot
below shows the €/m3 for a number of case studies. [27]
62

DNV GL © 2016
Investment Case - Use Case 7: Industrial and commercial thermal storage used to time shift energy usage seasonally
ICAX claim a seasonal store can double the coefficient of performance (COP) for a heat pump.
We’ve modelled two scenarios, based on two thermal stores from Germany: Eggenstein and Rostock.
– Assumed both utilize a large central heat pump in addition to the thermal store. Heap pump capacity
based on auxiliary heating present at each site.
– Used weather data from Portland, Organ to approximate London (Model requires TMY3 weather data, only
TMY2 was found for London).
This model is a rough approximation. Payback periods are likely to vary greatly—detailed scenarios should be
modelled for each potential seasonal thermal store application.
63
PTES in
Eggenstein Sources
Operating Hours 24 hours a day
Months heated
Oct to Mar,
inclusive
COP without thermal store 3.3 [73]
COP with thermal store 6.6 [24]
HP Capacity (kW) 1,260 [75]
Annual consumption without
thermal store (MWh) 671
[72], DNV GL
model
Annual consumption with thermal
store (MWh) 336
[72], DNV GL
model
Annual savings (MWh) 336
Annual savings (£) 23,494£
Based on
£0.07/kWh
Size of thermal store (m3) 4,500 [27] [75]
Thermal store cost (£) 342,000£ [27]
Payback (years) 14.56
ATES in
Rostock Sources
Operating Hours 24 hours a day
Months heated
Oct to Mar,
inclusive
COP without thermal store 3.3 [73]
COP with thermal store 6.6 [24]
HP Capacity (kW) 250 [76]
Annual consumption without
thermal store (MWh) 133
[72], DNV GL
model
Annual consumption with thermal
store (MWh) 67
[72], DNV GL
model
Annual savings (MWh) 67
Annual savings (£) 4,659£
Based on
£0.07/kWh
Size of thermal store (m3) 20,000 [27] [76]
Thermal store cost (£) 135,000£ [27]
Payback (years) 28.97

DNV GL © 2016
Use Case 7: Industrial and commercial thermal storage used to time shift energy usage seasonally
64
Does this currently meet network needs?
Peak Shaving
Somewhat. Load is shifted from higher demand or higher priced parts of the year and therefore the seasonal heating demand met by the grid can be reduced as long as the unit has adequate capacity. This reduces overall demand and dependent on demand assumptions, may have a limited impact on peak. The value of peak shaving with in the Use Case depends on whether the customer has a gas or electric heating system. A majority of the sites where inter-seasonal storage is installed relies on minimising winter peak electricity demand.
Network Investment Deferral
Somewhat. Though the value of deferring the network investment is not passed onto the customer, typically seasonal thermal storage is installed in industrial and commercial premises who are high demand customers. Reducing their peak demand can have a greater impact than other, smaller, customers.
Avoiding Renewables Curtailment
No. Though seasonal thermal storage combined with solar thermal gives the ability to gain access to heat that is otherwise lost, this does not relate to the potential to avoid renewable curtailment in terms of the renewable energy generated.
Optimal System Balancing
No. This does not impact system balancing.

DNV GL © 2016
Use Case 7: Industrial and commercial thermal storage used to time shift energy usage seasonally
65
How could the use case be optimized? (Future looking.)
Peak Shaving
Seasonal storage reduces the amount of electricity required by the grid therefore reducing a customers winter overall consumption and potentially impacting their peak demand. (The impact on peak depends on the availability of the store during peak times.) As the storage technologies become more efficient and costs drop the business case for seasonal thermal storage will become more attractive. Suppliers could introduce tariffs to encourage seasonal thermal storage, this will increase the overall value storage can add to the system.
Network Investment Deferral
Network operators in constrained areas may consider operating and financing seasonal storage particularly for high demand users. Reducing the winter demand of large industrial and commercial users could therefore help avoid conventional network reinforcement.
Avoiding Renewables Curtailment
Another potential opportunity for industrial and commercial customers who own renewables could be to use excess electrical generation to store generated heat. A heat pump could be combined with renewables and a storage system. The heat pump would be run during periods of excess generation and the heat output can then be stored using an inter-seasonal thermal storage system. [39] The value of such system depends on whether customers connected to the system have a gas or electric heating system and supply.
Optimal System Balancing
No. This does not impact system balancing. The storage does not react fast enough to provide balancing.

DNV GL © 2016
Use Case 8: Network level coordinated thermal storage used for local balancing
66
Use Case 8
S S
Residential
EM
S S
Residential
EM
S
Residential
HM
S
GM
S
S EM
Business (SME/I&C)
S S
Business (SME/I&C)
S S
HM
Business (SME/I&C)
S
HM
GM
GM
Heat Meter
Electricity Meter
Gas Meter
Thermal Storage
Water Storage
Residential
EM GM
CHP Combined Heat and PowerCHP
DNOGasDNO
Heat
Electricity
Gas
EM
EM
EM
Residential
EM GM
Heat
Electricity
Gas
HM EM
S
HeatDNO
CustomerSupplier
Use Case 8

DNV GL © 2016
Use Case 8: Network level coordinated thermal storage used for local balancing
67
Attributes required to deliver the primary use case:
Network coordinated heat storage should: • Include smart controls that automatically charge the heater when electricity is the cheapest, generally due to low
demand or excess generation. • Include smart controls that can curtail consumption when required by the network operator. • Be well insulated to protect against losses. • Cost the same or less over its lifetime than a traditional heater. Additionally, the electricity grid needs to be ‘smart’ so that it can interact with the heaters’ controls.
How well do existing technologies meet this specification?
• There are 6.5 million night storage heaters currently installed in the UK [37] but almost all of them lack the controls required for network balancing or sophisticated demand response.
• In Denmark, large scale district heat networks have utilized storage for more than 20 years but only about 7% of the UK’s heat networks utilize thermal storage. [38] The technology exists but has not been widely adopted here.
• The NINES project is a good example of network coordinated storage. It includes district heating with storage as well as in-home storage heaters. [23]
Description:
• Heat is generated during times of low electricity demand (and/or excess generation) and stored for use when heating is required.
• Smart controls are used to change charging patterns of storage heaters and/or district heating schemes*. These smart controls can react to price changes, excess generation or calls for demand reduction from the network operator.
*The use case description states ‘storage in homes’ but we feel that similar control technologies can be applied to district
storage as well so have included it in UC8. We’ve reserved UC9 for storage with CHP district heating.
NINES system architecture. [23]

DNV GL © 2016
Use Case 8: Network level coordinated thermal storage used for local balancing
68
Investment case:
• Smart electrical thermal storage heaters can result in cost savings of 25% when compared to traditional night storage heaters. [37]
• Case study: the Green Way and Glen Dimplex have piloted smart electrical thermal storage heaters in 140 homes in Dublin. The project saved occupants €264 per home per year, or about 30%. [29] No information was presented on network system savings.
• Case study: the NINES project utilized district and in-home storage and smart heating technologies to manage fluctuations in heat demand and utilize the potential of renewable energy. The project implemented an active network management system and one of the first UK smart grids. This is an ongoing trial that includes 734 domestic properties in the Shetland Islands and will run until 2016. [23]
User benefits:
• Consuming cheaper electricity leads to lower energy bills for the consumer. • Smart systems can react to price changes or demand peaks and charge accordingly.
Grid drivers for installation and adoption:
• Smart systems (storage heaters and/or district heating schemes) can interact with the grid to utilize excess or inexpensive power to generate heat.
• Storage can be used to mitigate the intermittent power generation often associated with renewables. • Smart storage heating schemes reduce peak demand and can be used to balance the grid. Network operators can
curtail the consumption when needed. • Conversely, smart storage heating schemes can store renewable energy as heat and reduce the need for curtailment
of renewables.

DNV GL © 2016
Value Streams - Use Case 8: Network level coordinated thermal storage used for local balancing
69
Network level coordinated thermal
storage
End User
Purchase energy at times of lower prices (based on price signals rather than
times as in UC6)
Distribution Network Operator
Constraint management
Demand side response
Avoid/defer reinforcement
Transmission System Operator
Avoid renewable curtailment
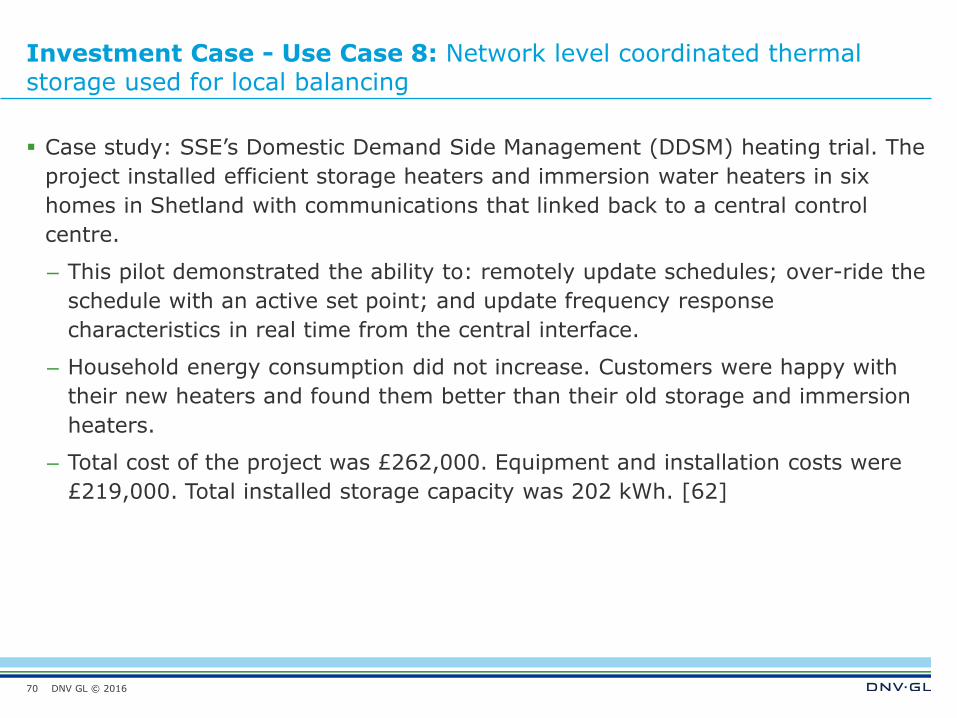
DNV GL © 2016
Investment Case - Use Case 8: Network level coordinated thermal storage used for local balancing
Case study: SSE’s Domestic Demand Side Management (DDSM) heating trial. The
project installed efficient storage heaters and immersion water heaters in six
homes in Shetland with communications that linked back to a central control
centre.
– This pilot demonstrated the ability to: remotely update schedules; over-ride the
schedule with an active set point; and update frequency response
characteristics in real time from the central interface.
– Household energy consumption did not increase. Customers were happy with
their new heaters and found them better than their old storage and immersion
heaters.
– Total cost of the project was £262,000. Equipment and installation costs were
£219,000. Total installed storage capacity was 202 kWh. [62]
70

DNV GL © 2016
Does this currently meet network needs?
Peak Shaving
Yes. Advanced control systems can communicate with the grid operator and insure the system is not charging during times of peak energy use. These advanced controls can also help avoid the early morning peak that traditional night storage heaters can generate.
Network Investment Deferral
Somewhat. Storage will reduce the consumption of energy used for heating during peak times but does not reduce the overall consumption.
Avoiding Renewables Curtailment
Yes. Advanced control systems can communicate with the grid and charge the heat store during times of excess generation, such as unutilized renewables. This means renewables do not need to be curtailed since the heating system provides load.
Optimal System Balancing
Yes. Network operators can control the amount of smart heating systems that are charging and therefore use smart heat networks as a demand response mechanism.
Use Case 8: Network level coordinated thermal storage used to balance locally
71

DNV GL © 2016
How could the use case be optimized? (Future looking.)
Peak Shaving
It should be noted that there are very few smart grid installations in the UK capable of the kinds of controls listed on the previous page. The first step towards network level coordinated projects is to develop suitable smart grid applications. All of the benefits listed on the previous slide are possible with currently available technology but unfortunately this has not been widely implemented. As a result, it is hard to determine exactly how the use case could be optimized, although we present some possible ideas below. Pilots like the NINES project will provide much needed experience that can applied to storage, smart grids and network lever coordination. • Need to determine how to move this technology from a pilot test case into
the ‘real world’. Establish smart grids and advanced controls as business as usual for network operators.
• As these smart networks are more widely deployed, the intelligent control systems will develop based on learnings.
Network Investment Deferral
Avoiding Renewables Curtailment
Optimal System Balancing
Use Case 8: Network level coordinated thermal storage used to balance locally
72

DNV GL © 2016
Use Case 9: Thermal storage and CHP serving district heating
73
Use Case 9
Use Case 9
S S
Residential
EM
S S
Residential
EM
S
Residential
HM
S
GM
S
S EM
Business (SME/I&C)
S S
Business (SME/I&C)
S S
HM
Business (SME/I&C)
S
HM
GM
GM
Heat Meter
Electricity Meter
Gas Meter
Thermal Storage
Water Storage
Residential
EM GM
CHP Combined Heat and PowerCHP
DNOGasDNO
Heat
Electricity
Gas
EM
EM
EM
Residential
EM GM
Heat
Electricity
Gas
HM EM
S
HeatDNO
CustomerSupplier

DNV GL © 2016
Use Case 9: Thermal storage and CHP serving district heating.
74
Attributes required to deliver the primary use case:
• A collection of residences and/or businesses physically close enough to each other to utilize district heating.
How well do existing technologies meet this specification?
• Many of the CHP plants in the UK are installed in industrial settings that utilize process heating, where the load is more stable than domestic heating. Domestic heat networks with CHP have unique needs and should be considered separately.
• In Denmark, almost all district heat networks with CHP include storage. [38] • However, only about 7% of the UK’s heat networks utilize thermal storage. [38] The technology exists but has not
been widely adopted here. • Calder Hall nuclear power plant provided heat in addition to electricity since 1956 but is now closed. There is an
opportunity for nuclear waste heat and storage to serve district heating schemes but there is also a negative public view of nuclear heat. [39]
Description:
• A district heating scheme with CHP utilizes the heat from an electricity generating turbine to heat homes and/or businesses.
• Thermal storage can ‘save’ heat when the turbine is generating electricity but there isn’t a demand for heat. This heat can then be deployed later when it is needed but the turbine isn’t running since there isn’t a demand for electricity.
• While this use case mainly focuses on CHP, it should be noted that the waste heat can come from other applications such as industrial processes, heat pumps or nuclear plants as well. [25]
• In this UC, a large heat pump could also replace the CHP as a het source.
Thermal storage in a district heating CHP plant.
[38] • Buyers/consumers for both the electricity and heat generated by the CHP plant. • Variable heat demand. If heat demand is constant, storage is less beneficial.

DNV GL © 2016
Use Case 9: Thermal storage and CHP serving district heating
75
Investment case:
• Only about 4% of UK buildings are currently connected to heat networks. Studies have estimated that as much as 20% of the heat demand in the UK could be provided by heat networks. [38] There are great opportunities to expand.
• The cost of adding a thermal store is about £1,000 per m3; associated instrumentation is about £3,500. [38] • One study found the use of a thermal store more than doubles the return on investment for district heat systems with
CHP. [40] • This kind of thermal store is generally custom manufactured for a given plant and therefore cost information is not
readily available but one 2007 study claimed a 3 year payback period for the addition of a thermal store to a district heating CHP plant. [40]
• Case study: a district heating scheme at Pimlico was built in the 1950s and uses a 2,500 m3 water store to provide a short term balancing function for a CHP system that supplies homes, businesses and schools. [3, 10]
• Denmark leads the way in district heating with 63% of Danish households being connected to a heat network. [77]
User benefits:
• Centralized heat production allows for greater efficiency and less time spent on maintenance. This leads to lower costs; these savings can be passed on to the consumer.
• A CHP system is effectively using ‘waste’ heat from a turbine generating electricity; procuring two value streams from one fuel source reduces costs and emissions. Again, this means lower cost heating for the consumer.
• Adding storage to a district heat CHP system can also reduce the cycling (and therefore losses) of the gas turbine since the heat store can compensate for daily heating load variations. This leads to increased comfort and lower fuel use.
Grid* drivers for installation and adoption:
• For district heating CHP applications, there will be times where there is a need for electricity produced by the system but not for the heat. This heat can be stored and deployed later: when demand for heat is high but electricity demand is low or when the CHP plant cannot meet the heat demand alone.
• Without storage, the gas engine either is sized to meet the minimum heat demand or is stopped/modulated in order to avoid dumping the extra heat. Storage can enable larger CHP installations without wasting heat.
• Adding storage to district heating and CHP system can increase the system’s flexibility and increase earnings by allowing the system to run when energy prices are highest.
*We use the term ‘grid drivers’ here to be consistent with other slides but it should be noted that a more applicable title
might be ‘micro-grid’ where we are looking at benefits from the perspective of the operator of the CHP system.
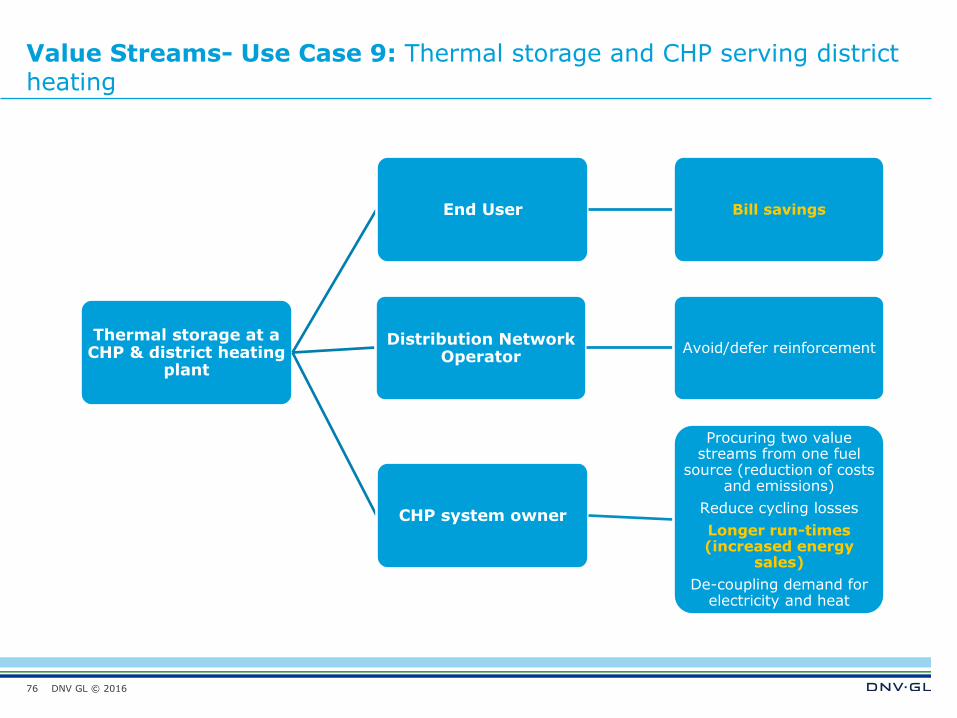
DNV GL © 2016
Value Streams- Use Case 9: Thermal storage and CHP serving district heating
76
Thermal storage at a CHP & district heating
plant
End User Bill savings
Distribution Network Operator
Avoid/defer reinforcement
CHP system owner
Procuring two value streams from one fuel
source (reduction of costs and emissions)
Reduce cycling losses
Longer run-times (increased energy
sales)
De-coupling demand for electricity and heat

DNV GL © 2016
Investment Case - Use Case 9: Thermal storage and CHP serving district heating
Case study: EnergyPro model of a district heating CHP plant with and without a
thermal store. [20] The figure below shows the income increase due to adding a
heat sore for two scenarios (21,030 and 18,030 MWh/year heat loads). Larger
heat sores result in greater revenue.
77

DNV GL © 2016
Investment Case - Use Case 9: Thermal storage and CHP serving district heating
Adding a 200 m3 store to the 21,030 MWh/year heat load case results in an
additional annual revenue of approximately £25,000.
The cost of adding a thermal store is about £1,000 per m3; associated
instrumentation is about £3,500. [38] Using this logic, a 200 m3 store would cost
approximately £203,500.
This would result in a payback of about 8 years (solely based on additional
revenue for the CHP operator).
A case study on the Pimlico district heating scheme estimates that CHP and heat
store can reduce customer bills by at least 10% [63]
A district heat and power scheme in Islington provides heat for 850 homes and
several commercial properties and cost £3.8 million to build. It includes a 1.9
MWe CHP engine and 115 m3 thermal store. [40]
78
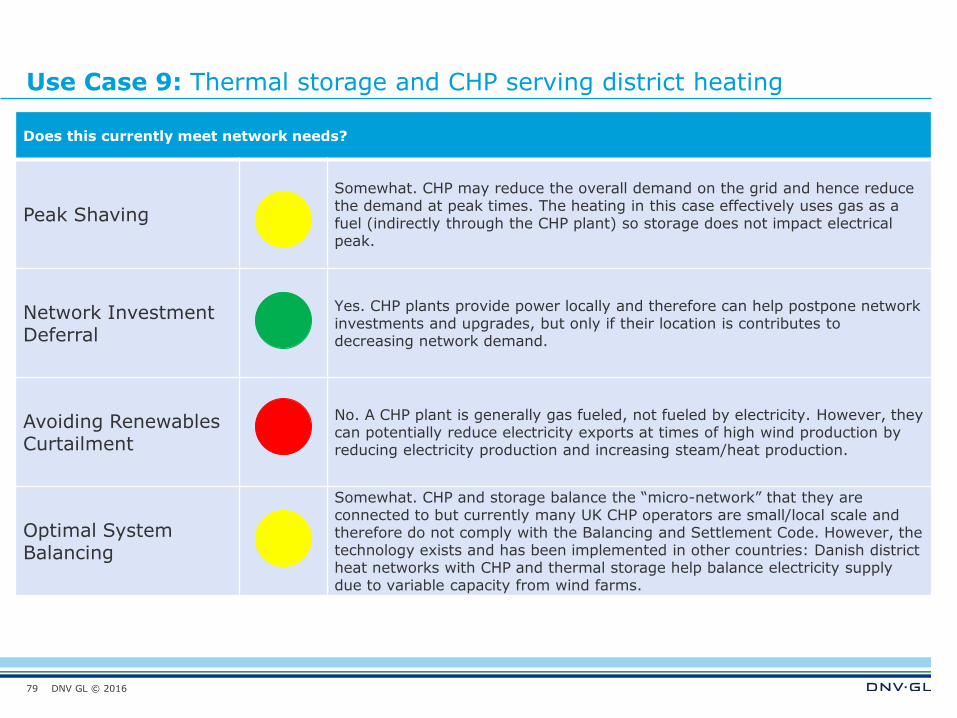
DNV GL © 2016
Use Case 9: Thermal storage and CHP serving district heating
79
Does this currently meet network needs?
Peak Shaving
Somewhat. CHP may reduce the overall demand on the grid and hence reduce the demand at peak times. The heating in this case effectively uses gas as a fuel (indirectly through the CHP plant) so storage does not impact electrical peak.
Network Investment Deferral
Yes. CHP plants provide power locally and therefore can help postpone network investments and upgrades, but only if their location is contributes to decreasing network demand.
Avoiding Renewables Curtailment
No. A CHP plant is generally gas fueled, not fueled by electricity. However, they can potentially reduce electricity exports at times of high wind production by reducing electricity production and increasing steam/heat production.
Optimal System Balancing
Somewhat. CHP and storage balance the “micro-network” that they are connected to but currently many UK CHP operators are small/local scale and therefore do not comply with the Balancing and Settlement Code. However, the technology exists and has been implemented in other countries: Danish district heat networks with CHP and thermal storage help balance electricity supply due to variable capacity from wind farms.

DNV GL © 2016
Use Case 9: Thermal storage and CHP serving district heating
80
How could the use case be optimized? (Future looking.)
Peak Shaving
A district heating plant with CHP and storage will not change consumers’ energy consumption habits but it does reduce the capacity requirements and amount of electricity required by the grid. Running the turbine to produce electricity during times of peak load will reduce the strain on the grid but it does not shave the peak consumption of end users.
Network Investment Deferral
There is a great opportunity for district heating with CHP and storage to replace network investments. Installations in other European countries show that this is proven technology. However it is not widespread in the UK. This may require an incentive or outside technical assistance.
Avoiding Renewables Curtailment
CHP plants will not directly avoid the curtailment of renewables since they do not use electricity as their fuel source. It may be possible to produce less electrical output and increase the steam/heat output (into storage) during high wind periods. Additionally, they can utilize biofuels or other renewable fuel sources. However, heat pumps could be used with future district heating schemes to utilize renewable energy that would otherwise be lost. The heat produced by the heat pump could then be stored for later use when there is heat demand.
Optimal System Balancing
Utilize methods used elsewhere (such as in Denmark). Additionally, complying with the Balancing and Settlement Code is often cost-prohibitively expensive for small CHP plants. [38] This may require an incentive or outside technical assistance for small installations. CHP may support local balancing under certain operating modes.

DNV GL © 2016
Summary: Does this meet network needs?
Network Need
UC
6
UC
7
UC
8
UC
9
Peak Shaving
Network Investment Deferral
Avoiding Renewables Curtailment
Optimal System Balancing
81
• Use Case 6: How thermal
storage can be used to time
shift domestic energy usage
• Use Case 7: Industrial and
commercial thermal storage
used to time shift energy
usage seasonally
• Use Case 8: Network level
coordinated thermal storage
used for local balancing
• Use Case 9: Thermal storage
and CHP serving district
heating

DNV GL © 2016
Summary: Could the use case be optimized? (Future looking)
Network Need
UC
6
UC
7
UC
8
UC
9
Peak Shaving
Network Investment Deferral
Avoiding Renewables Curtailment
Optimal System Balancing
82
• Use Case 6 : How thermal
storage can be used to time
shift domestic energy usage
• Use Case 7 : Industrial and
commercial thermal storage
used to time shift energy
usage seasonally
• Use Case 8 : Network level
coordinated thermal storage
used for local balancing
• Use Case 9 : Thermal storage
and CHP serving district
heating
DNV GL © 2016
Summary
83
Further research into the use case development should include:
– Defining more explicit boundaries between the relatively broad use case
definitions.
– Additional cases may need to be added, or existing use cases split.
– Define applicable technology within each use case. This will help clarify the
intent of each case and allow more specific conclusions to be drawn.
– Regulatory obligations and impact.
– Commercial models and economic evaluations.
– Define specific storage ownership models.
– Carry out more detailed modelling of the current and future business models
and investment cases for storage technology.
– Consider hybrid scenarios between heat and energy storage technologies.

DNV GL © 2016
Examples of Energy Storage and Use Case Interactions
84

DNV GL © 2016
Examples of storage Use Case interactions
Interaction definition
– An interaction is defined as the impact of actions of one UC on the actions of
another UC either positive or negative.
Examples of UC interactions
– Electricity storage used to firm up intermittent generation can also be used to
support the network (UC3) and provide ancillary services (UC5).
– Behind the meter electricity storage (UC1 and UC2) may contribute to using
DNO storage (planned for network reinforcement) (UC3) if not actively
scheduled at the best periods for the DNO BUT this may conflict with messages
from the energy market
– Electricity storage (UC1, UC2 and UC3) may deplete storage for bulk energy
storage that was designed for provision of system services (UC5)
– Medium/low grade heat from CHP (within UC9) output may not be stored if heat
storage is full – need to ensure co-ordination across disparate elements
85

DNV GL © 2016
Applications of energy storage - #1
86
Application Observations
Energy arbitrage
Energy Arbitrage relies on the ratio of the base load to peak wholesale energy prices so that storage can buy power during lower price periods and sell when the price is high, maximizing revenue – requires storage aggregators for domestic level storage, dynamic control of large numbers of devices and maintaining the base/peak price ratio as the generation pattern changes, complex trading and forecasting decision are needed – ToU tariffs will influence the demand pattern and change (flatten) the ratio, relevant for electricity and heat storage from electricity and some cases of CHP offtakes. Heat UCs can benefit from consuming energy at times of low price but as there is no sale back to the gird, they are not able to benefit form periods of high price.
Peak reduction
Peak reduction relies on demand to charge the storage during low demand periods and discharge at the peak periods so avoiding peak energy prices, dynamic pricing and smart metering would be needed to achieve domestic savings (UC1), I&C customers need multi rate tariffs (UC2) with links to the wholesale market (UC5) to make the necessary decisions, applicable to all UCs at varying level of importance. Peak reduction relating to network perspective is discussed below.
Ancillary service provision
Provision of services such as Fast Frequency Response (FFR), Enhanced Frequency Response (EFR) and Demand Management (FCDM) are complex to control and manage so can only practically be delivered by aggregators or large scale facilities. BSC compliance is costly and complex for smaller players. Relevant to all electricity UCs but none of the heat UCs (other than potentially CHPs operations and time shifting heat demand).
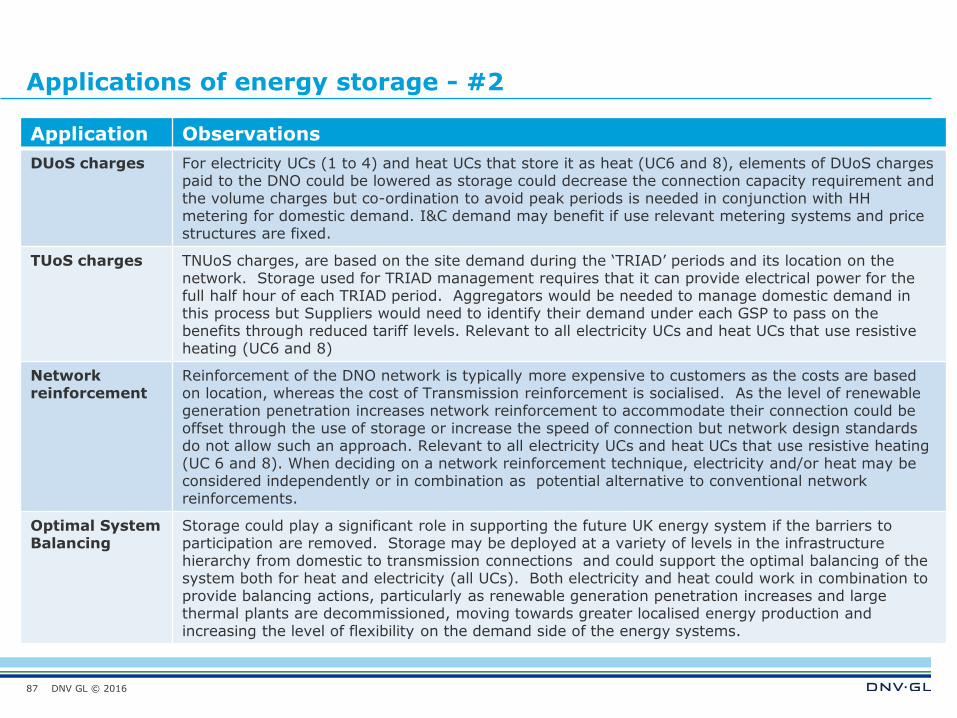
DNV GL © 2016
Applications of energy storage - #2
87
Application Observations
DUoS charges For electricity UCs (1 to 4) and heat UCs that store it as heat (UC6 and 8), elements of DUoS charges paid to the DNO could be lowered as storage could decrease the connection capacity requirement and the volume charges but co-ordination to avoid peak periods is needed in conjunction with HH metering for domestic demand. I&C demand may benefit if use relevant metering systems and price structures are fixed.
TUoS charges TNUoS charges, are based on the site demand during the ‘TRIAD’ periods and its location on the network. Storage used for TRIAD management requires that it can provide electrical power for the full half hour of each TRIAD period. Aggregators would be needed to manage domestic demand in this process but Suppliers would need to identify their demand under each GSP to pass on the benefits through reduced tariff levels. Relevant to all electricity UCs and heat UCs that use resistive heating (UC6 and 8)
Network reinforcement
Reinforcement of the DNO network is typically more expensive to customers as the costs are based on location, whereas the cost of Transmission reinforcement is socialised. As the level of renewable generation penetration increases network reinforcement to accommodate their connection could be offset through the use of storage or increase the speed of connection but network design standards do not allow such an approach. Relevant to all electricity UCs and heat UCs that use resistive heating (UC 6 and 8). When deciding on a network reinforcement technique, electricity and/or heat may be considered independently or in combination as potential alternative to conventional network reinforcements.
Optimal System Balancing
Storage could play a significant role in supporting the future UK energy system if the barriers to participation are removed. Storage may be deployed at a variety of levels in the infrastructure hierarchy from domestic to transmission connections and could support the optimal balancing of the system both for heat and electricity (all UCs). Both electricity and heat could work in combination to provide balancing actions, particularly as renewable generation penetration increases and large thermal plants are decommissioned, moving towards greater localised energy production and increasing the level of flexibility on the demand side of the energy systems.

DNV GL © 2016
Energy Storage Enablers
88

DNV GL © 2016
Energy storage enablers and relevant Use Cases – #1
89
Enablers UCs
New Business models - New and innovative business models are required to make storage projects attractive, behind the meter models may evolve where the developer or technology provider, retains ownership of the storage asset while sharing revenues from energy sales and services with the provider of the location. The development of new business models potentially generates new IP and commercial incentives which may disrupt traditional models and approaches.
1,2,4,5,6,7,8
Commercial arrangements - National Grid ancillary services are contracted for relatively short time periods (two to four years), extending the contract length would encourage more participants but may preclude new entrants, improvements to rules around the Capacity Market could encourage greater storage participation. There is scepticism in the investor community in investing in a new technology such s electricity storage without longer term contracts in place.
1,2,3,4,5, 8
Clarification of policy - Clear policy relating to storage and its role in UK energy strategy will promote storage as an investment opportunity and help financial institutes in developing financial models and contracts. Regulatory framework and market arrangements need to be updated to accommodate storage market needs and provide protection to consumers. Consideration should be given to whether a storage license or a definition in UK legislation would help drive or slow down the growth of storage in the UK.
All

DNV GL © 2016
Energy storage enablers and relevant Use Cases - #2
90
Enablers UCs
New classification of storage assets - Electricity storage installations are not classed as generation or demand assets, however, as they are able to inject on to the network their use by DNOs is constrained, a new class for electricity storage assets and an approach for their treatment should be considered a potential route forward.
3
Enable market signals and industry co-ordination – Clearly define the roles and objectives of storage participants and counterparties in energy markets, industry frameworks and as service providers. Future stakeholder interaction should consider wider system benefits, for example co-ordination between the Supplier and the network operator could provide the lowest cost to the consumer while running the system efficiently. Identify frameworks to establish clear price signals from central and decentralised energy markets, system services and network usage. Ofgem has launched a programme to investigate how system flexibility could be improved and how the role of a DNOs will evolve to that of the more active DSO to actively manage networks and promote the provision of flexible services by end users.
All
Decision support and control – New intelligent control systems and decision support algorithms are needed to determine and issue instructions to operate storage assets in response to a wide range of technical and commercial requirements and to co-ordinate the responses. Uncoordinated responses may maximise revenue and cost reductions for a single asset from a range of potentially conflicting price signals but may also conflict with other system responses and requirements.
All

DNV GL © 2016
Future Considerations
BEIS should consider quantifying non energy/cost benefits to deploying storage, e.g. the carbon impact of a
DNO deferring conventional reinforcement with distributed storage.
The development of new business models potentially generates new IP and commercial incentives which
may disrupt traditional models and approaches.
Determining the optimal level of storage at various points in the system hierarchy to maximise value.
Stakeholder interaction (for example between network operators and suppliers ) and how this resulted in
added value for the consumer.
Combining traditional storage units with advance controls and smart meters in a smart grid or smart city
environment will lead added value to the consumer and across the supply chain.
Consider various ways electric vehicles can supply services to the grid.
Understanding the value storage can contribute to security of supply.
Quantifying the value of flexibility potential of storage in the UK.
Understanding technology gaps in the storage market based on findings and discussions from the Use Case
work.
91

DNV GL © 2016
Sources
92

DNV GL © 2016
Sources
Author Title Date Link
1 Department of Energy and Climate Change
Feed-in Tariff Statistics February 2015
https://www.gov.uk/government/collections/feed-in-tariff-statistics
2 IRENA Battery Storage For Renewables: Market Status And Technology Outlook
January 2015
http://www.irena.org/documentdownloads/publications/irena_battery_storage_report_2015.pdf
3 WPD Innovation SoLa Bristol 2012 http://www.westernpowerinnovation.co.uk/Projects/SoLa-Bristol
4 Green Tech Media
Sonnenbatterie Launches Solar-Plus-Storage Storage System for $10,645
November 2015
http://www.greentechmedia.com/articles/read/sonnenbatterie-launches-solar-plus-storage-storage-system-for-10645
5 Good Energy Energy storage trial with Moixa 2014 http://www.goodenergy.co.uk/moixa-trial
6 Tesla Motors Tesla Energy 2015 https://www.teslamotors.com/en_GB/presskit/teslaenergy
7 SmartEnergyGB Is it Time? Consumers and time of use tariffs
March 2015
http://www.smartenergygb.org/sites/default/files/UCL%20research%20into%20time%20of%20use%20tariffs.pdf
8 Centre for Sustainable Energy
Investigating the potential impacts of Time of Use (TOU) tariffs on domestic electricity customers Report to Ofgem
April 2014
https://www.ofgem.gov.uk/publications-and-updates/investigating-potential-impacts-time-use-tariffs-domestic-electricity-customers-smarter-markets-programme
93

DNV GL © 2016
Sources
Author Title Date Link
9 Baringa and UKPN
Smarter Network Storage - business model consultation
July 2013
https://www.ukpowernetworks.co.uk/internet/en/community/documents/Smarter-Network-Storage-Business-model-consultation.pdf
10 SSEPD Shetland Smart Grid January 2016
http://www.ninessmartgrid.co.uk/our-trials/shetlands-smart-grid/
11 Energy Network Association
Distributed Generation Connection Guide
June 2014
http://www.energynetworks.org/modx/assets/files/electricity/engineering/distributed%20generation/DG%20Connection%20Guides/July%202014/G59%20Summary%20June%202014%20v3_Updated.pdf
12 Poyry and UKPN
Electricity Storage in GB: SNS 4.7 Recommendations for regulatory and legal framework (SDRC 9.5)
October 2015
http://innovation.ukpowernetworks.co.uk/innovation/en/Projects/tier-2-projects/Smarter-Network-Storage-(SNS)/Project-Documents/Report+9.5+19Oct_v2.1_(Final+Photos).pdf
13 Hussein Ibrahim and Adrian Ilinca
Techno-Economic Analysis of Different Energy Storage Technologies
January 2013
http://www.intechopen.com/books/energy-storage-technologies-and-applications/techno-economic-analysis-of-different-energy-storage-technologies
94

DNV GL © 2016
Sources
Author Title Date Link
14 UKPN Flexible Plug and Play Close Down Report 2015_v1.0
2015 http://innovation.ukpowernetworks.co.uk/innovation/en/Projects/tier-2-projects/Flexible-Plug-and-Play-(FPP)/Project-Documents/Close-Down-Report_Final.pdf
15 WPD Statement Of Methodology And Charges For Connection To Western Power Distribution (South West) Plc’s Electricity Distribution System
Nov 2015
https://www.westernpower.co.uk/docs/connections/Charging-Statements/Connections-South-West-Nov-2014.aspx
16 Solar Choice Pty Ltd
Key Considerations For Energy Storage System Size Selection
July 2015
http://onestepoffthegrid.com.au/press-release/key-considerations-for-energy-storage-system-size-selection/
17 National Grid Performance Reports June 2015
http://www2.nationalgrid.com/UK/Industry-information/Electricity-transmission-operational-data/Report-explorer/Performance-Reports/
18 Renault Zoe – Battery and Charging 2015 https://www.renault.co.uk/vehicles/new-vehicles/zoe/battery-and-charging.html
19 KEMA Energy and Sustainability
Potential for Smart Electric Thermal Storage
Feb 2013
http://www.dimplex.co.uk/assets/Downloads_PDF/Kema_Report.pdf
20 Tyndall Centre for Climate Research
The Potential for Thermal Storage to Reduce the Overall Carbon Emissions from District Heating Systems
Jan 2013
http://www.tyndall.ac.uk/sites/default/files/twp157.pdf
95

DNV GL © 2016
Sources
Author Title Date Link
21 UK Energy Research Centre
The Future Role of Thermal Energy Storage in the UK Energy System
Nov 2014 www.ukerc.ac.uk/asset/82664E2B-6533-4019-BF5140CEB7B9894D
22 Aikaterini Fragakia, Anders N. Andersen & David Toke
Exploration of economical sizing of gas engine and thermal store for CHP plants in the UK
Dec 2007 http://www.sciencedirect.com/science/article/pii/S0360544208001370
23 SSE NINES Project Website Accessed Dec 2015
http://www.ninessmartgrid.co.uk/
24 Interseasonal Heat Transfer (ICAX)
ICAX Website Accessed Dec 2015
http://www.icax.co.uk/
25 Bela J. Csik & Juergen Kupitz
Nuclear power applications: Supplying heat for homes and industries
Feb 1997 https://www.iaea.org/sites/default/files/publications/magazines/bulletin/bull39-2/39205082125.pdf
26 IEA-ETSAP and IRENA
Thermal Energy Storage Technology Brief
Jan 2013 https://www.irena.org/DocumentDownloads/Publications/IRENA-ETSAP%20Tech%20Brief%20E17%20Thermal%20Energy%20Storage.pdf
27 Solar District Heating (SDH)
Solar district heating guidelines Aug 2012 http://solar-district-heating.eu/Portals/0/Factsheets/SDH-WP3_FS-7-2_Storage_version3.pdf
28 City West Homes Pimlico District Heating Undertaking
Accessed Dec 2015
http://www.cwh.org.uk/locations/churchill-gardens/the-pimlico-district-heating-undertaking-pdhu-/
96

DNV GL © 2016
Sources
Author Title Date Link
29 Glen Dimplex Glen Dimplex Group Launches Revolutionary Quantum Heating System
Accessed Dec 2015
http://www.glendimplex.com/news/view/glen_dimplex_group_launches_revolutionary_quantum_heating_system
30 Cool Power Products
Cool Power Products Home Accessed Dec 2015
http://coolpowerproducts.com/
31 John West Renewables
Solar Thermal Image Accessed Dec 2015
http://www.johnwestrenewables.co.uk/
32 Dimplex Quantum Heater Information Page Accessed Dec 2015
http://www.dimplex.co.uk/products/domestic_heating/installed_heating/quantum/homeowner/running_cost_comparisons.htm
33 The Green Age Can I get a grant to replace my storage heaters?
Accessed Dec 2015
http://www.thegreenage.co.uk/can-i-get-a-grant-to-replace-storage-heaters/
34 Google Google shopping results for query ‘manual storage heater’
Accessed Dec 2015
https://www.google.co.uk/shopping
35 Energy Savings Trust
Air source heat pumps Accessed Dec 2015
http://www.energysavingtrust.org.uk/domestic/air-source-heat-pumps
36 ICAX, Edward Thompson
Integration of Renewable Technologies, Where are the synergies?
2011 http://www.gshp.org.uk/GroundSourceLive2011/EdwardThompson_Integration_gsl.pdf
97

DNV GL © 2016
Sources
Author Title Date Link
37 Schmidt T & Miedaner
Solar district heating guidelines, Fact sheet 7.2 Storage
2012 www.solardistrict-heating.eu
38 Energy Savings Trust
Ground Source Heat Pumps Accessed Dec 2015
http://www.energysavingtrust.org.uk/domestic/ground-source-heat-pumps
39 UK Energy Research Partnership
The future role for energy storage in the UK
Jun 2011 http://erpuk.org/wp-content/uploads/2014/10/52990-ERP-Energy-Storage-Report-v3.pdf
40 Islington Council Bunhill Heat and Power Case Study 2012 http://www.isep.org.uk/wp-content/uploads/BUNHILL-case-study-2013.pdf
41 Energy Storage Operators Forum
State of Charge of GB October 2015 http://www.eatechnology.com/products-and-services/create-smarter-grids/electrical-energy-storage/energy-storage-operators-forum
42 Eunomia Investing in Electricity Storage January 2016 http://www.eunomia.co.uk/reports-tools/investing-in-uk-electricity-storage/
43 A. Nourai, V.Kogan, and C.M. Schafer
Load levelling reduces T&D line losses, IEEE Transactions on , Power Delivery, vol. 23, no. 4, pp. 2168-2173
2008 http://ieeexplore.ieee.org/xpl/login.jsp?tp=&arnumber=4487074&url=http%3A%2F%2Fieeexplore.ieee.org%2Fiel5%2F61%2F4626339%2F04487074.pdf%3Farnumber%3D4487074
98

DNV GL © 2016
Sources
Author Title Date Link
44 KPMG report for REA
Development of decentralised energy and storage systems in the UK
January 2016 http://www.r-e-a.net/upload/rea_kpmg_report_decentralised_energy_and_storage_january_2016_3.pdf
45 The World Energy Council
E-storage: Shifting from cost to value Wind and solar applications
January 2016 https://www.worldenergy.org/wp-content/uploads/2016/01/Resources-E-storage-2016.01.14_final__version.pdf
46 BEIS Delivering UK Energy Investment: Networks
January 2015 https://www.gov.uk/government/uploads/system/uploads/attachment_data/file/394509/DECC_Energy_Investment_Report_WEB.pdf
47 SSEPD LCNF Tier 1 Closedown Report, Low Voltage Connected Energy Storage, SSET1008
2014 https://www.ofgem.gov.uk/sites/default/files/docs/2014/08/sset1008_lv_connected_batteries_closedown_2nd_submission_0.pdf
48 National Grid
Monthly Balancing Services Summary
March 2015 and September 2015
http://www2.nationalgrid.com/UK/Industry-information/Electricity-transmission-operational-data/Report-explorer/Services-Reports/
49 National Grid Enhanced Frequency Response 2016 http://www2.nationalgrid.com/Enhanced-Frequency-Response.aspx
99

DNV GL © 2016
Sources
Author Title Date Link
50 National Grid TNUoS Tariff Forecasts and Condition 5
2016 http://www2.nationalgrid.com/UK/Industry-information/System-charges/Electricity-transmission/Approval-conditions/Condition-5/
51 Elexon System Balancing Prices 2015 https://www.elexonportal.co.uk
52 ICAX Borehole Thermal Energy Storage Accessed February 2016
http://www.icax.co.uk/Borehole_Thermal_Energy_Storage.html
53 National Grid Technical Guidance and Testing Procedure for Static and Dynamic Demand Response and Battery Storage Providers of Frequency Balancing Services
February 2015
http://www2.nationalgrid.com/uk/services/balancing-services/service-guides/
54 Energy Storage Association
Compressed Air Energy Storage (CAES)
2015 http://energystorage.org/compressed-air-energy-storage-caes
55 U.S. Energy Information Administration
Electricity storage technologies can be used for energy management and power quality
December 2011
http://www.eia.gov/todayinenergy/detail.cfm?id=4310
56 RES Res marks its first energy storage project in the uk
January 2016 http://www.res-uk.com/news/latest-news/latest-news/res-marks-its-first-energy-storage-project-in-the-uk
100

DNV GL © 2016
Sources
Author Title Date Link
57 National Grid Power Responsive 2015 http://www.powerresponsive.com/
58 Jeff St. John Energy Storage on the Grid Edge November 2013
http://www.greentechmedia.com/articles/read/energy-storage-on-the-grid-edge
59 Business electricity Prices
Unit kWh Prices for Business Electricity
2015 http://www.businesselectricityprices.org.uk/cost-per-kwh/#typical-kwh-prices
60 Business Energy Business Electricity - Contract and Pricing Information
2015 http://www.businessenergy.com/electricity/
61 Ofgem Making the electricity system more flexible and delivering the benefits for consumers
September 2015
https://www.ofgem.gov.uk/publications-and-updates/position-paper-making-electricity-system-more-flexible-and-delivering-benefits-consumers
62 SSE Power Distribution
LCNF Tier 1 Close-Down Report: Trial evaluation of domestic demand side management
October 2012 https://www.ssepd.co.uk/Search/?q=Report%20on%20Domestic%20Demand%20Side%20Management%20trial
62a
Department of Energy and Climate Change
Solar Photovoltaics deployment 31 March 2016
https://www.gov.uk/government/statistics/solar-photovoltaics-deployment
101
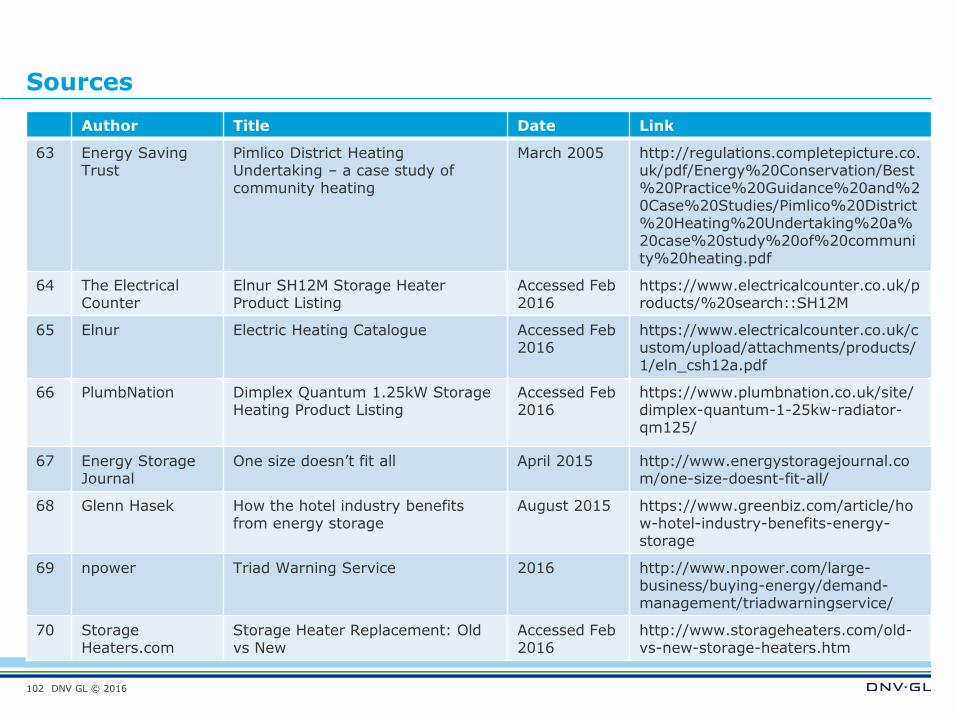
DNV GL © 2016
Sources
Author Title Date Link
63 Energy Saving Trust
Pimlico District Heating Undertaking – a case study of community heating
March 2005 http://regulations.completepicture.co.uk/pdf/Energy%20Conservation/Best%20Practice%20Guidance%20and%20Case%20Studies/Pimlico%20District%20Heating%20Undertaking%20a%20case%20study%20of%20community%20heating.pdf
64 The Electrical Counter
Elnur SH12M Storage Heater Product Listing
Accessed Feb 2016
https://www.electricalcounter.co.uk/products/%20search::SH12M
65 Elnur Electric Heating Catalogue Accessed Feb 2016
https://www.electricalcounter.co.uk/custom/upload/attachments/products/1/eln_csh12a.pdf
66 PlumbNation Dimplex Quantum 1.25kW Storage Heating Product Listing
Accessed Feb 2016
https://www.plumbnation.co.uk/site/dimplex-quantum-1-25kw-radiator-qm125/
67 Energy Storage Journal
One size doesn’t fit all April 2015 http://www.energystoragejournal.com/one-size-doesnt-fit-all/
68 Glenn Hasek How the hotel industry benefits from energy storage
August 2015 https://www.greenbiz.com/article/how-hotel-industry-benefits-energy-storage
69 npower Triad Warning Service 2016 http://www.npower.com/large-business/buying-energy/demand-management/triadwarningservice/
70 Storage Heaters.com
Storage Heater Replacement: Old vs New
Accessed Feb 2016
http://www.storageheaters.com/old-vs-new-storage-heaters.htm
102

DNV GL © 2016
Sources
Author Title Date Link
71 Dimplex Quantum. Low running costs. Total control.
Accessed Feb 2016
http://www.dimplex.co.uk/products/domestic_heating/installed_heating/quantum/index.htm
72 NREL TMY3 Weather Data Accessed Feb 2016
http://rredc.nrel.gov/solar/old_data/nsrdb/1991-2005/tmy3/by_state_and_city.html#O
73 Kenneth Hoffmann MSc and David Forbes Pearson MInstR
Ammonia Heat Pumps for District Heating in Norway – a case study
2011
http://www.ammonia21.com/web/assets/link/Hoffman7thApril2011London%20colour.pdf
74 BEIS Heat Pumps in District Heating 2016 https://www.gov.uk/government/uploads/system/uploads/attachment_data/file/502500/DECC_Heat_Pumps_in_District_Heating_-_Final_report.pdf
75 F. Ochs, et al. Solar Assisted District Heating System with Seasonal Thermal Energy
2008 http://www.itw.uni-stuttgart.de/dokumente/Publikationen/publikationen_08-10.pdf
76 T. Schmidt, et al. The Central Solar Heating Plant with Aquifer Thermal Energy
2000 http://www.itw.uni-stuttgart.de/dokumente/Publikationen/publikationen_00-09.pdf
77 Frederika Whitehead
Lessons from Denmark: how district heating could improve energy security
2014 http://www.theguardian.com/big-energy-debate/2014/aug/20/denmark-district-heating-uk-energy-security
103

DNV GL © 2016
SAFER, SMARTER, GREENER
www.dnvgl.com
Electricity Storage and Heat Storage Use Case Specifications
104
Alan Birch [email protected]
Matthew Rowe [email protected]
Elizabeth Steele [email protected]


