Engineering Practicum Baltimore Polytechnic Institute M. Scott Pendulum Lab Data Analysis Objective: 1.Review Pendulum Lab Data Analysis, Error/Uncertainty 2.Review Pendulum Lab Grades, Marks, and Lessons Learned
Transcript
Engineering Practicum Baltimore Polytechnic Institute M. Scott
Pendulum Lab Data Analysis
Objective:1. Review Pendulum Lab Data Analysis,
Error/Uncertainty2. Review Pendulum Lab Grades, Marks, and
Lessons Learned
Engineering Practicum Baltimore Polytechnic Institute M. Scott
Pendulum Lab Objectives• To support the theory that the relationship between the
period of oscillation, T, and the length, l, of a simple pendulum (see Figure 1) is of the form .
• To deduce the value of the constant, C, in the equation for the period of oscillation of a simple pendulum. In effect, we will prove that the constant is equal to 2p.
• To observe the null effect of the mass, m, on the period of oscillation.
• To observe the effect of varying the amplitude on the period (for angles less than 22o, the amplitude effect is null).
lT
Reword these as hypotheses…
Engineering Practicum Baltimore Polytechnic Institute M. Scott
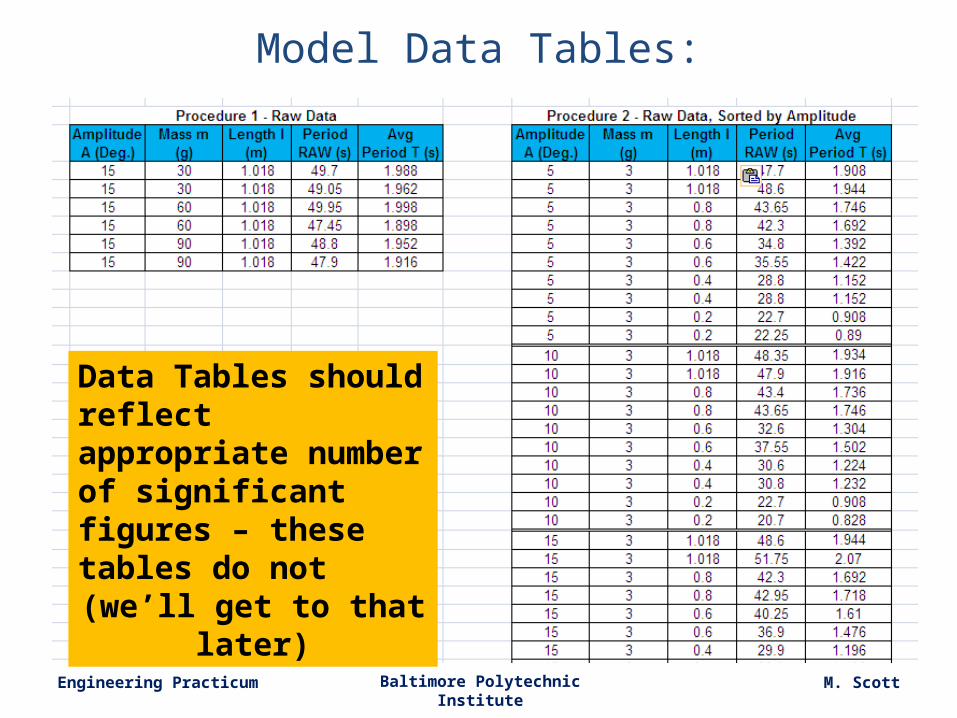
Model Data Tables:
Data Tables should reflect appropriate number of significant figures – these tables do not
(we’ll get to that later)
Engineering Practicum Baltimore Polytechnic Institute M. Scott
Equipment Subsection
Engineering Practicum Baltimore Polytechnic Institute M. Scott
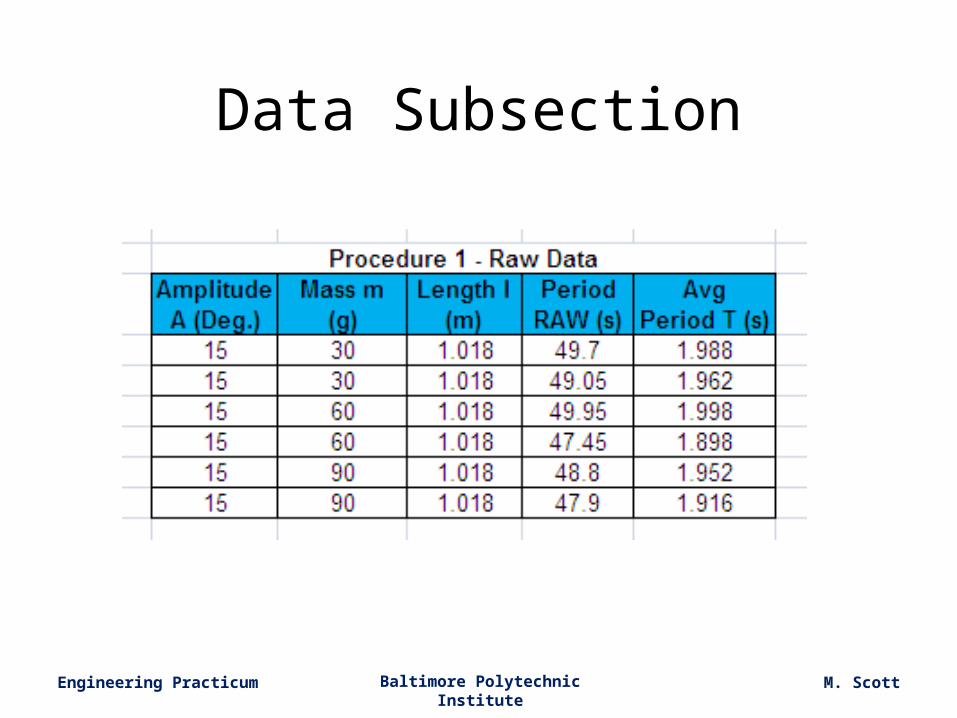
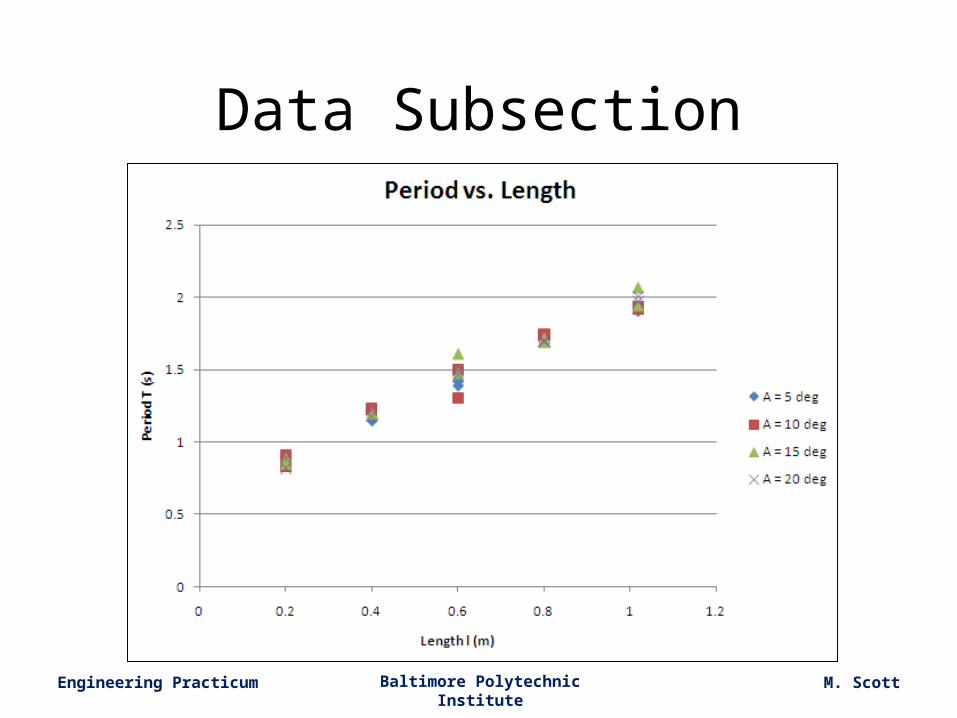
Data Subsection
Engineering Practicum Baltimore Polytechnic Institute M. Scott
Data Subsection
Engineering Practicum Baltimore Polytechnic Institute M. Scott
Data Subsection
Engineering Practicum Baltimore Polytechnic Institute M. Scott
Data Analysis Subsection
Engineering Practicum Baltimore Polytechnic Institute M. Scott
Data Analysis Subsection
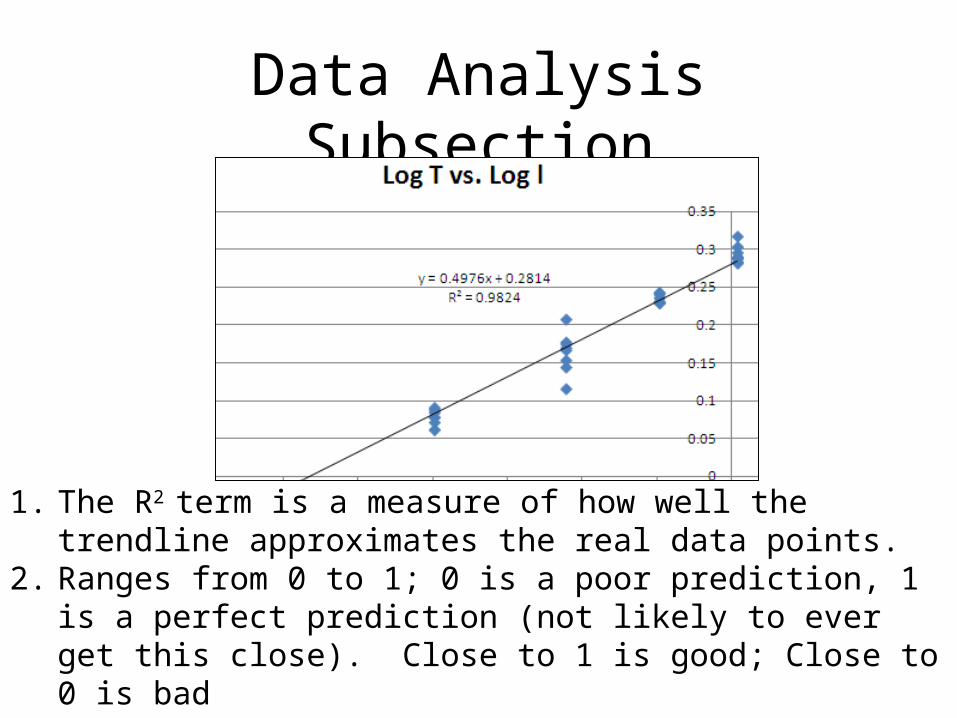
1. The R2 term is a measure of how well the trendline approximates the real data points.
2. Ranges from 0 to 1; 0 is a poor prediction, 1 is a perfect prediction (not likely to ever get this close). Close to 1 is good; Close to 0 is bad
3. An R2 of 0.8 indicates that 80% of the change in one variable is explained by a change in the other
Engineering Practicum Baltimore Polytechnic Institute M. Scott
– Obj 1
• Prediction based on derivation:
y = m * x
lTlT
Engineering Practicum Baltimore Polytechnic Institute M. Scott
C = 2p – Obj 2
If
Then
g
lCT
l
gTC
Engineering Practicum Baltimore Polytechnic Institute M. Scott
C = 2p – Obj 2
Engineering Practicum Baltimore Polytechnic Institute M. Scott
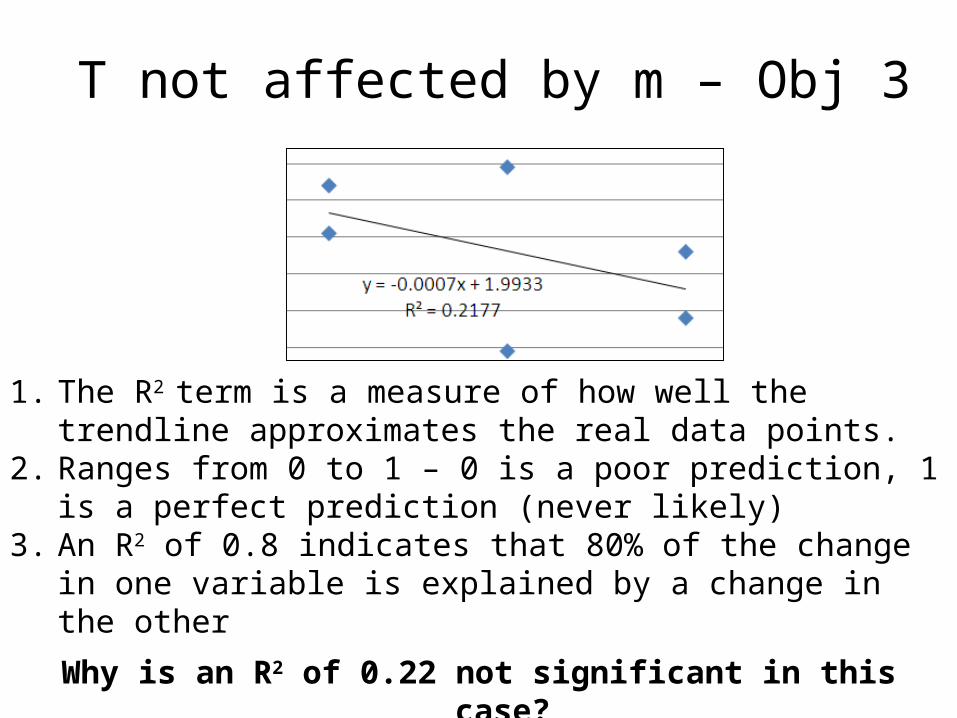
T not affected by m – Obj 3
Engineering Practicum Baltimore Polytechnic Institute M. Scott
1. The R2 term is a measure of how well the trendline approximates the real data points.
2. Ranges from 0 to 1 – 0 is a poor prediction, 1 is a perfect prediction (never likely)
3. An R2 of 0.8 indicates that 80% of the change in one variable is explained by a change in the other
Why is an R2 of 0.22 not significant in this case?
T not affected by m – Obj 3
Engineering Practicum Baltimore Polytechnic Institute M. Scott
T not affected by A – Obj 4
Engineering Practicum Baltimore Polytechnic Institute M. Scott
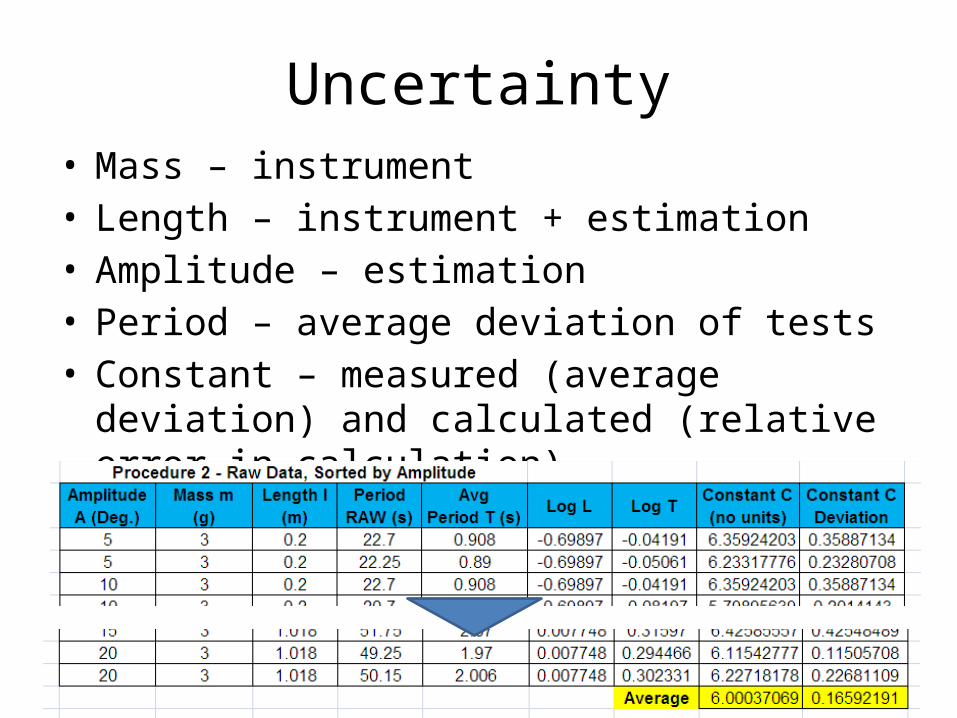
Uncertainty• Mass – instrument • Length – instrument + estimation• Amplitude – estimation • Period – average deviation of tests• Constant – measured (average deviation) and
calculated (relative error in calculation)
Engineering Practicum Baltimore Polytechnic Institute M. Scott
Error
• With most school experiments, the accepted value is known.
• Error calculations are based on comparison between measured values and accepted values.
Cmeasured = 6.0 + 0.2
Ctheory = 6.2831…
What’s the error in the measured value?
Engineering Practicum Baltimore Polytechnic Institute M. Scott
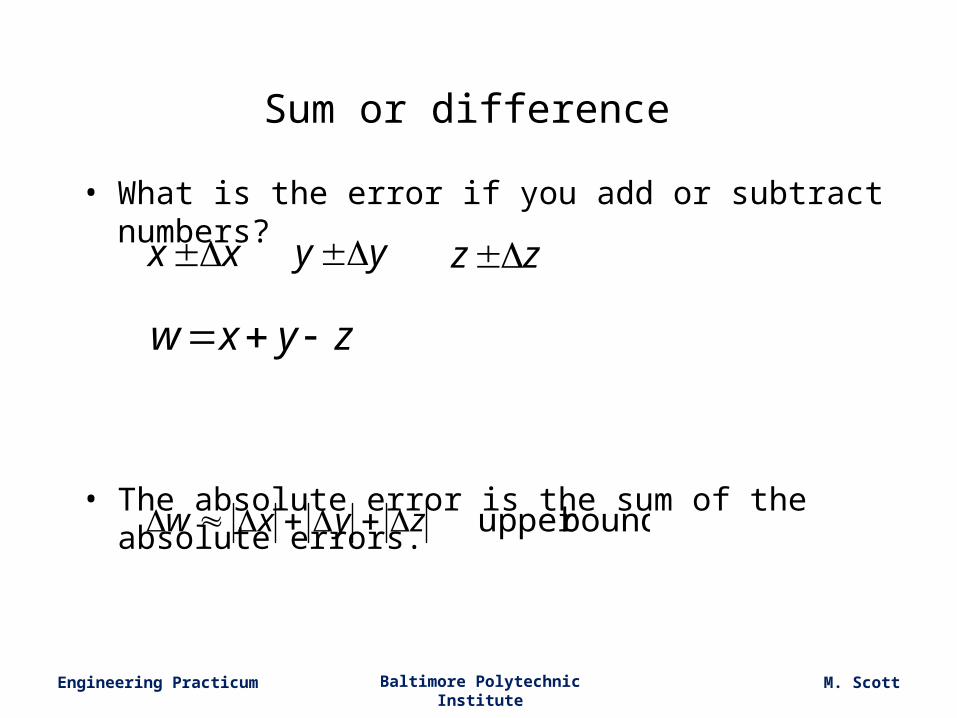
Sum or difference
• What is the error if you add or subtract numbers?
• The absolute error is the sum of the absolute errors.
xx yy zz
zyxw
boundupper zyxw
Engineering Practicum Baltimore Polytechnic Institute M. Scott
Product or quotient
• What is error if you multiply or divide?
• The relative error is the sum of the relative errors.
z
yxw
boundupper z
z
y
y
x
x
w
w
xx yy zz
zz
yyxxw
)()(
Engineering Practicum Baltimore Polytechnic Institute M. Scott
Multiply by constant
• What if you multiply a variable x by a constant B?
• The error is the constant times the absolute error.
Bxw
xBw
Engineering Practicum Baltimore Polytechnic Institute M. Scott
Powers and exponents
• What if you square or cube a number?
• The relative error is the exponent times the relative error.
nxw
x
xn
w
w
Engineering Practicum Baltimore Polytechnic Institute M. Scott
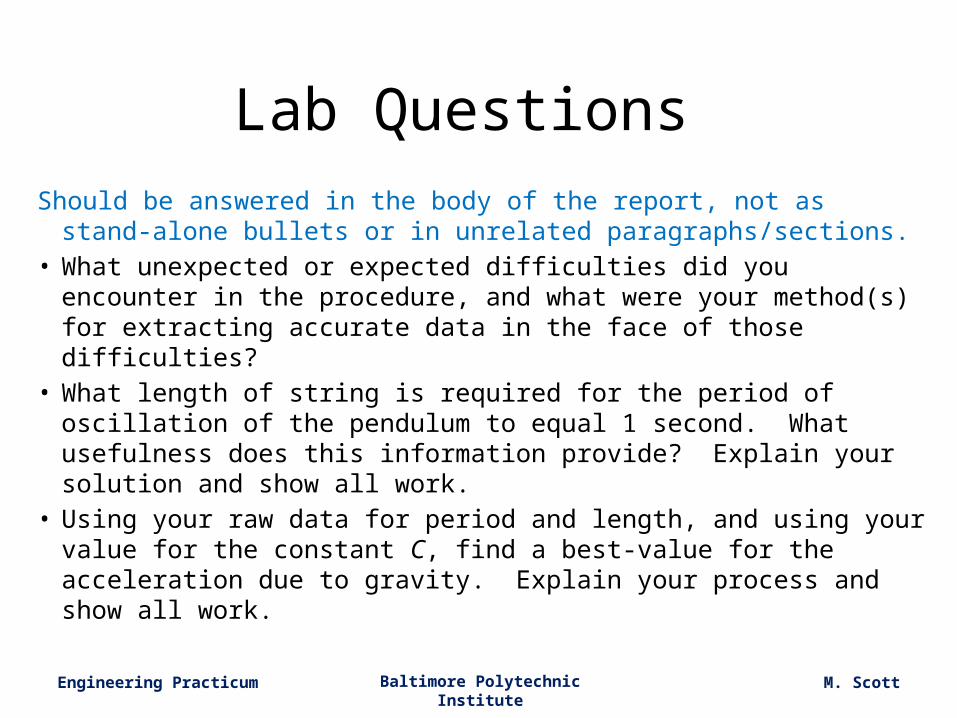
Lab Questions Should be answered in the body of the report, not as stand-alone
bullets or in unrelated paragraphs/sections.• What unexpected or expected difficulties did you encounter in
the procedure, and what were your method(s) for extracting accurate data in the face of those difficulties?
• What length of string is required for the period of oscillation of the pendulum to equal 1 second. What usefulness does this information provide? Explain your solution and show all work.
• Using your raw data for period and length, and using your value for the constant C, find a best-value for the acceleration due to gravity. Explain your process and show all work.
Engineering Practicum Baltimore Polytechnic Institute M. Scott
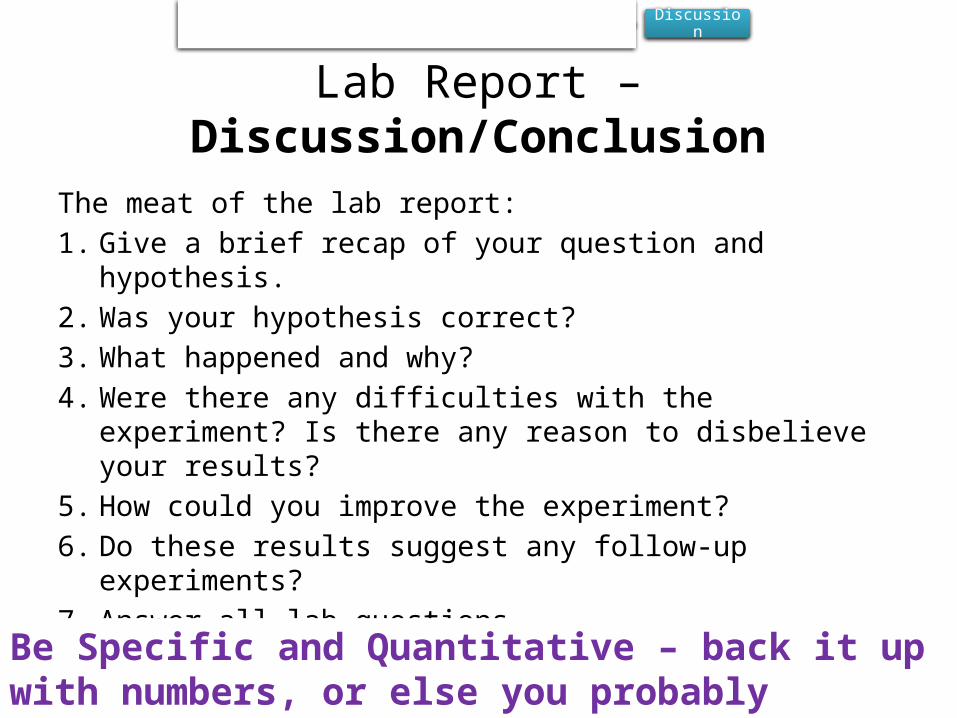
Lab Report – Discussion/Conclusion
The meat of the lab report:1. Give a brief recap of your question and hypothesis.2. Was your hypothesis correct?3. What happened and why?4. Were there any difficulties with the experiment? Is
there any reason to disbelieve your results?5. How could you improve the experiment?6. Do these results suggest any follow-up experiments?7. Answer all lab questions.
Be Specific and Quantitative – back it up with numbers, or else you probably shouldn’t say it
Introduction Procedure Results Discussion
Engineering Practicum Baltimore Polytechnic Institute M. Scott
With your partner…• Add notes to your “lessons from mistakes” sheet in your
notebook. – What new insights into technical reports have you gotten from
these lectures?– What will you never again do in a lab report that you did in your
pendulum lab report?– What will you always do in a lab report that you hadn’t thought of
before?• Who will be revising which part, and by when will the report be:
– Complete– Proofread by each group member– Submitted to another group for proofreading (schedule this now