67
Engineering Psychology Mgr. Ing. Jakub Jura, Ph.D. Ing. Pavel Trnka Ing. Matouˇ s Cejnek L´ ea Reverdy 2018

Engineering Psychology
Mgr. Ing. Jakub Jura, Ph.D.Ing. Pavel Trnka
Ing. Matous CejnekLea Reverdy
2018

Engineering Psychology
Mgr. Ing. Jakub Jura, Ph.D., Ing. Pavel Trnka, Ing. Matous Cejnek,Lea Reverdy
Czech Technical University in PragueFaculty of Mechanical EngineeringDepartment of Instrumentation and Control EngineeringDivision of Automatic Control and Engineering Informatics
Version 1.5.22018, Prague
Contents
1 Engineering Psychology 3
2 Laboratories 4
3 LAB 1. Negative AfterimageEmmert’s Law Verification 9
4 LAB 2. Eye tracking method for Analysis of Human Com-puter Interaction 14
5 LAB 3. Measurement of Reaction Time (RT) 22
6 LAB 4. Fechner’s Law Verification 27
7 LAB 5. Weber’s Law Verification 31
8 LAB 6. Measurement ofElectro-Dermal Activity (EDA) 35
9 LAB 7. Influence of Phone Use on Driving Performance 40
10 LAB 8. Haptic Sensitivity 44
11 LAB 9. Readability of Different Kinds of Indicators 48
12 LAB 11. Emotion Recognition from Speech 51
13 Application of Engineering Psychology Today 55
2

Engineering Psychology
Introduction
Engineering psychology is an applied psychology discipline and is naturallyinterdisciplinary. Engineering psychology lies at the intersection of the hu-manities, science and technology. In general, it is possible to say that En-gineering psychology is about the use of psychological pieces of knowledgein the field of engineering. For this purpose, Engineering psychology usesknowledge primarily from general and experimental psychology. Moreover,Engineering psychology uses psychological principles and naturally developsits own methods and adapts the old ones to the new field of use.
The general aim of Engineering psychology is to help people use, pro-duce and design technical systems efficiently with full respect to capabilities,limits and inner lawfulness of human user (operator). Formerly, Engineeringpsychology was put into the context of army psychology and transportationpsychology; nowadays there are more adequate connections to artificial in-telligence, informatics and computer and cognitive science. The connectionswith work psychology, ergonomics and human factors steadily remain.
Note: Of course, there is a fundamental difference between teachingthis subject in a psychology study program (where students usually knowmany things about psychology, but almost nothing about technology) andin a technical university (where the situation is quite the opposite). Thisis the reason why the first part of the laboratory exercises is devoted toexperiments from general psychology (and our aim is to introduce generaland experimental psychology to students). The tasks belonging to this partare experiments with afterimages or galvanic skin reaction, verification ofWeber and Fechner’s laws, and reaction time measurement. The second partis primarily focused on Engineering psychology tasks and contains proving ofthe influence of mobile phone use on a driver’s capabilities, then evaluationof the influence of the type of indicator on memory functions and evaluationof different types of indicators (their legibility).
3
Laboratories
In this chapter is described what is common for all laboratory tasks. Labo-ratory task specific description will be covered in the next chapters.
Laboratory experiment report
Laboratory task report is mandatory to complete the class successfully. Re-ports have to contain all important information about the process of exper-iment. Reports could be completed during the lab, or could be finished athome. The structure of a report should be organized as follows:
1. Name of the task
2. Names of the experimentalists and experimental person
3. Tools
4. Theoretical background
5. Description of the task
6. Measured data
7. Evaluation
8. Results
9. Conclusion
As a source for the theoretical background part of the report, you coulduse this handbook or other literature, or internet. The sources should bereferenced.
4
Laboratory experiment record list
The record list is a mandatory part of the laboratory report and it can beobtained only during the lab class. Measurement protocols have to containthe following items:
• All measured and obtained values.
• Notes about used tools (and their description).
• Notes about physiological and psychological state of experimental per-son
• Time and date of experiment
• Important notes about used tools
• Schema of experiment
A suggested Measurement protocol (the part common for all experi-ments) ready to print is on the following page.
Every lab task has also a record list apendix. The apendix lists ready toprint are placed in the chapters of experimental tasks.
5
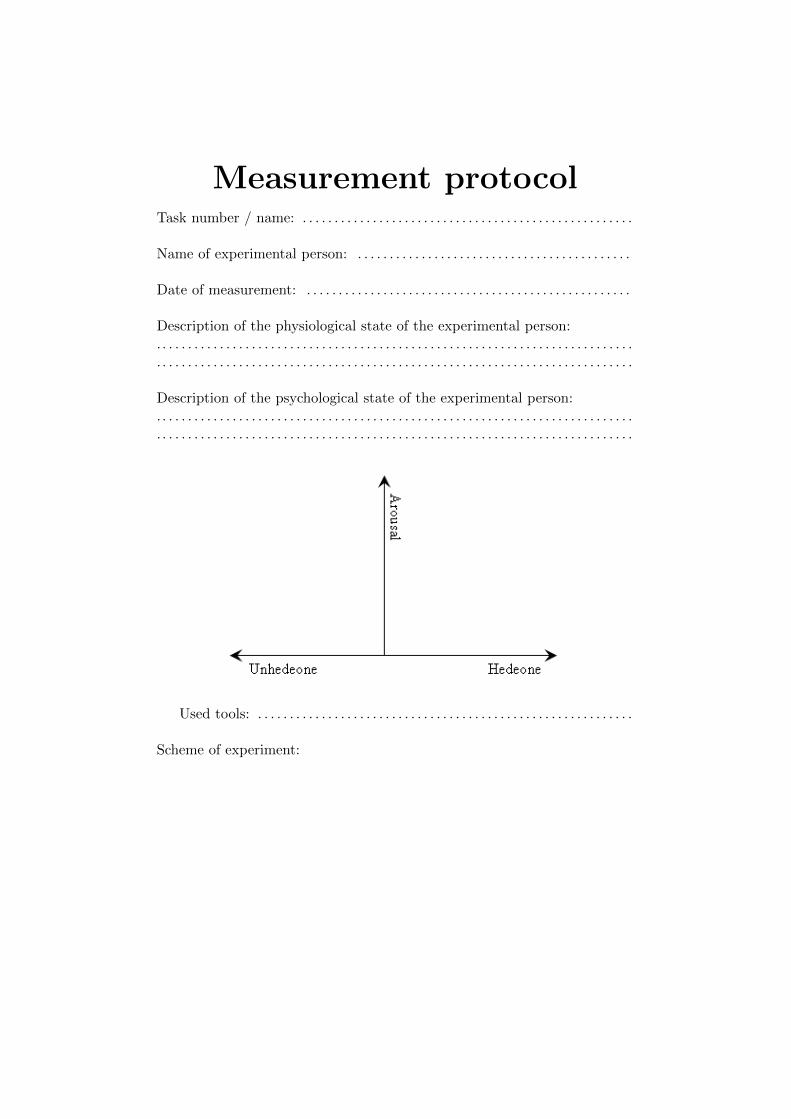
Measurement protocolTask number / name: . . . . . . . . . . . . . . . . . . . . . . . . . . . . . . . . . . . . . . . . . . . . . . . . . . . .
Name of experimental person: . . . . . . . . . . . . . . . . . . . . . . . . . . . . . . . . . . . . . . . . . . .
Date of measurement: . . . . . . . . . . . . . . . . . . . . . . . . . . . . . . . . . . . . . . . . . . . . . . . . . . .
Description of the physiological state of the experimental person:. . . . . . . . . . . . . . . . . . . . . . . . . . . . . . . . . . . . . . . . . . . . . . . . . . . . . . . . . . . . . . . . . . . . . . . . . . .. . . . . . . . . . . . . . . . . . . . . . . . . . . . . . . . . . . . . . . . . . . . . . . . . . . . . . . . . . . . . . . . . . . . . . . . . . .
Description of the psychological state of the experimental person:. . . . . . . . . . . . . . . . . . . . . . . . . . . . . . . . . . . . . . . . . . . . . . . . . . . . . . . . . . . . . . . . . . . . . . . . . . .. . . . . . . . . . . . . . . . . . . . . . . . . . . . . . . . . . . . . . . . . . . . . . . . . . . . . . . . . . . . . . . . . . . . . . . . . . .
Used tools: . . . . . . . . . . . . . . . . . . . . . . . . . . . . . . . . . . . . . . . . . . . . . . . . . . . . . . . . . . .
Scheme of experiment:

Data evaluation
Today a big variety of data evaluation tools exists - from open-source toolslike Python and Octave to commercial softwares like Matlab and Excel.
Functions needed for the labs will be described in the following subsec-tions. Working examples of functions usage will be demonstrated on exam-ples in Python - programming language designed by Guido by Rossum.
Mean value
For the purpose of the labs we use arithmetic mean. Its evaluation is de-scribed in the following equation
mean(x) =x1 + x2 + ... + xn
n, (2.1)
where x stands for array of measured values and n stands for length ofarray x.
Estimation of the arithmetic mean value of an array could be done withPython as easy as it is shown in the following snippet:
x = [ 1 5 , 18 , 2 , 36 , 12 , 78 , 5 , 6 , 9 ]mean value = sum( x ) / f loat ( len ( x ) )
or it could be done with Numpy library even more easily:
import numpyx = [ 1 5 , 18 , 2 , 36 , 12 , 78 , 5 , 6 , 9 ]mean value = numpy . mean( x )
In Excel you can obtain the mean value with command AVERAGE (inczech localization it is PRUMER).
Standard deviation
Standard deviation describes the amount of variation of dispersion from theaverage. Low standard deviation means that the measured data is closeto average. We can obtain standard deviation according to the followingequation
std(x) =
√√√√ n∑i=1
(xi −mean(x))2. (2.2)
Estimation of standard deviation with Python is simply achievable withNumpy library. In the following snippet you can see how to do that:
import numpyx = [ 1 5 , 18 , 2 , 36 , 12 , 78 , 5 , 6 , 9 ]s t d v a l u e = numpy . std ( x )
7
In Excel you can obtain the standard deviation value with commandSTD (in czech localization it is SMODCH).
Polynomial regression
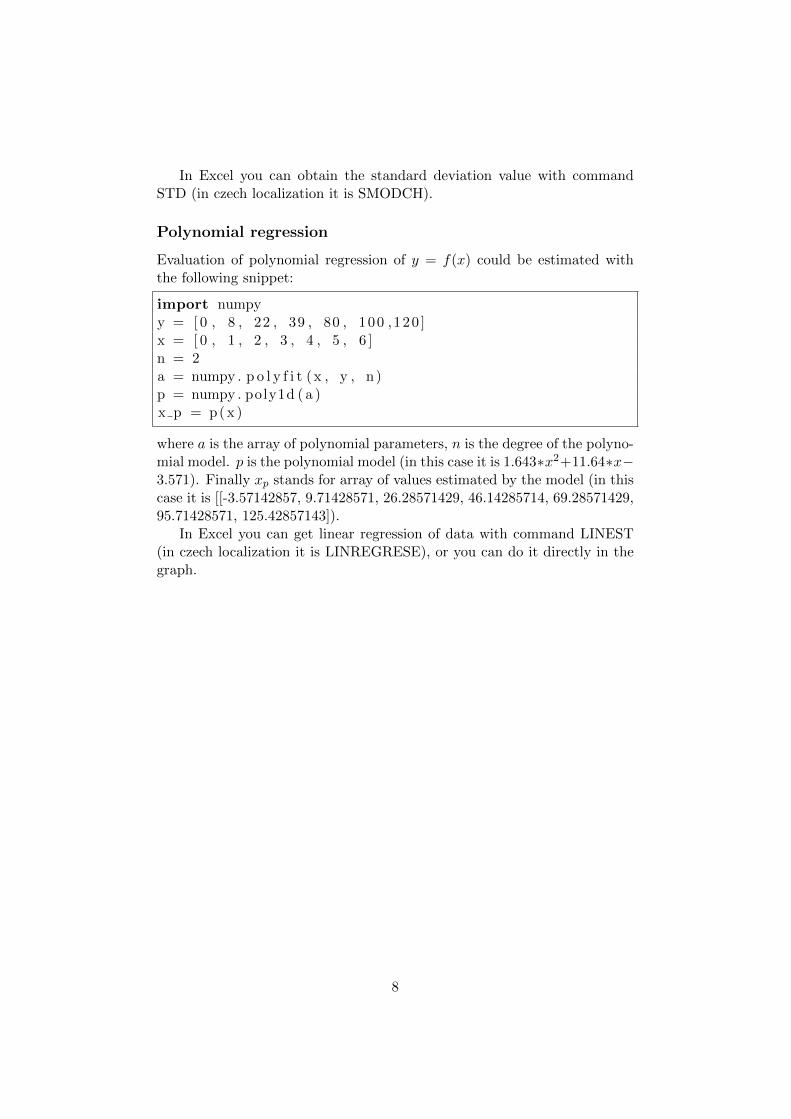
Evaluation of polynomial regression of y = f(x) could be estimated withthe following snippet:
import numpyy = [ 0 , 8 , 22 , 39 , 80 , 100 ,120 ]x = [ 0 , 1 , 2 , 3 , 4 , 5 , 6 ]n = 2a = numpy . p o l y f i t (x , y , n )p = numpy . poly1d ( a )x p = p( x )
where a is the array of polynomial parameters, n is the degree of the polyno-mial model. p is the polynomial model (in this case it is 1.643∗x2+11.64∗x−3.571). Finally xp stands for array of values estimated by the model (in thiscase it is [[-3.57142857, 9.71428571, 26.28571429, 46.14285714, 69.28571429,95.71428571, 125.42857143]).
In Excel you can get linear regression of data with command LINEST(in czech localization it is LINREGRESE), or you can do it directly in thegraph.
8
LAB 1. Negative AfterimageEmmert’s Law Verification
Goal
Confirm Emmert’s law by a series of experiments with afterimages. Drawthe dependence of the size of the afterimage seen by an observer on thedistance of the observer from it.
Theory
Emil Emmert (1844 - 1911)One of the basic functions of our perceptual system is a conservation of theconstancies of perceived object . The real object has for example constantsize, shape and color. But the sensory image of the given object (e.g. reti-nal image) can obtain a lot of forms. It depends on the distance, angle ofobservation or color of the lighting. The after image in itself is a byproductof the process of the filtering of a constant lighting color. This process isrealized on the retina. In general it is the process of habituation to a steadystimulus. Or it is possible to say that the afterimage is the consequence ofthe adaptation process of the retina to different lighting color. This adap-tation takes some time (about 10 seconds) and after this time it’s possibleto observe an afterimage (similar image in the opposite color), as a residueof the adaptation process (It is related to the Yellow-Blue and Red-Greenrecording of the visual channel).
The size of a primary afterimage is the same as the one of the stimulus.But if we change the distance between the observer and place for afterimageprojection, then the size of the afterimage changes. Emil Emmert discoveredthat ”The size of an afterimage changes proportionally to its distance fromthe observer” (Figure 3.1 and formula 3.1) [9].
9

l′
a′=
l
a(3.1)
Figure 3.1: Emmert’s law principle
Practical application
There is a problem when we talk about the practical use of this principle –whether the emergence of afterimages or their size changes. We can see thisphenomenon for example in the situation of a longtime intensive observationof one given point (e.g. pointer of indicator). And we usually have intent toeliminate this disturbing phenomenon. Positive use of the afterimage effectis possible to see in the field of visual art or hypnosis induction.
Tools
MeterColor templateComparison raster
The procedure of the experiment
1. Experimental person (EP) stands on the line which is marked on thefloor in a fixed distance from the color template. Experimentalist (E)measures real distance between EP’s eye and the template and recordsit into table.
10
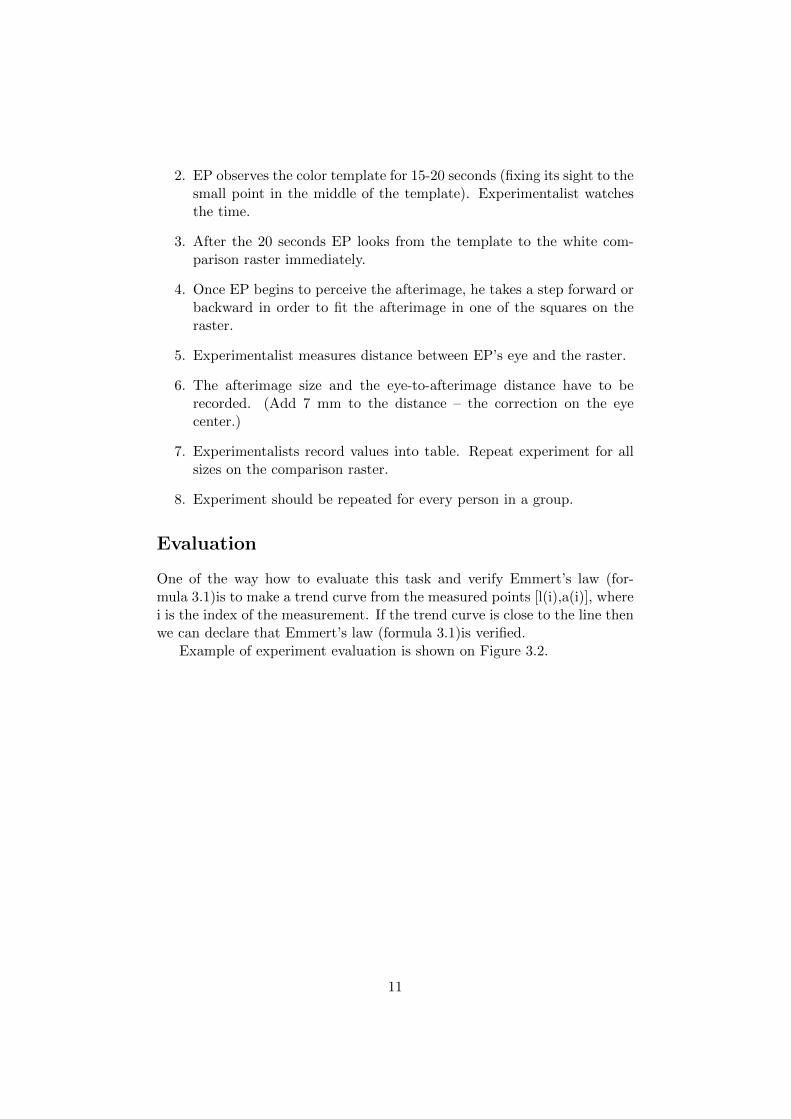
2. EP observes the color template for 15-20 seconds (fixing its sight to thesmall point in the middle of the template). Experimentalist watchesthe time.
3. After the 20 seconds EP looks from the template to the white com-parison raster immediately.
4. Once EP begins to perceive the afterimage, he takes a step forward orbackward in order to fit the afterimage in one of the squares on theraster.
5. Experimentalist measures distance between EP’s eye and the raster.
6. The afterimage size and the eye-to-afterimage distance have to berecorded. (Add 7 mm to the distance – the correction on the eyecenter.)
7. Experimentalists record values into table. Repeat experiment for allsizes on the comparison raster.
8. Experiment should be repeated for every person in a group.
Evaluation
One of the way how to evaluate this task and verify Emmert’s law (for-mula 3.1)is to make a trend curve from the measured points [l(i),a(i)], wherei is the index of the measurement. If the trend curve is close to the line thenwe can declare that Emmert’s law (formula 3.1)is verified.
Example of experiment evaluation is shown on Figure 3.2.
11

Figure 3.2: Example of the evaluation of an experiment
12

Measurement protocol appendix
Task: Negative Afterimage
Table for person 1:
Experiment number Original image Negative afterimage
[1] Size [cm] Distance [cm] Size [cm] Distance [cm]
1 5 2.5
2 5 5
3 5 7.5
4 5 10
5 5 15
Table for person 2:
Experiment number Original image Negative afterimage
[1] Size [cm] Distance [cm] Size [cm] Distance [cm]
1 5 2.5
2 5 5
3 5 7.5
4 5 10
5 5 15
Table for person 3:
Experiment number Original image Negative afterimage
[1] Size [cm] Distance [cm] Size [cm] Distance [cm]
1 5 2.5
2 5 5
3 5 7.5
4 5 10
5 5 15
LAB 2. Eye tracking methodfor Analysis of Human Com-puter Interaction
Goal
Discover how various HMI designs influence the operator performance andbehavior and speed and reliability of human machine interaction.
Theory
Analysis of the perception process is very old aim at the field of humanfactors and especially at the field of human machine interaction. Nowadaysmethod of computer science and artificial intelligence allow us to automat-ically identify point at the screen which is currently observed by the user.Saccades Principles of Graphic Design
Practical application
When designing a human machine interface, it is important to know basicway of the operator cognition. Know what the operator do during he/shefinding given graphical element (e.g. button, checkbox, indicator map etc.)of HMI screen. How is possible to help him/her to find given element inshorter time and higher reliability. Slow and unreliably using of HMI causesthe time of our intervention to be longer and in a situation where we haveonly a very short time to act it can have fatal consequences.
An appropriate HMI is important, for example for machine operatorslike airplane pilots, car and train drivers, power station operators in controlroom, production line operators etc. A lot of studies on readability of in-dicator features exist (readability of small displays [10], in-vehicle displays
14

features comparison [8, 14]).
Tools
1. Computer with the Ogama software [15]
2. The Eye Tribe device (Gazepoint GP3 eye tracker)
• 0.5 – 1 degree of visual angle accuracy
• 60 Hz
• 25cm (horizontal) x 11cm (vertical) movement
• ±15 cm range of depth movement
Figure 4.1: Gaze control
15
The procedure of the experiment
Preparation
This should be done only once at beginning of the lab (once for whole group).
1. Start the driver for the camera Gaze control (located on desktop). Itshould open window, where is possible to see data from the cameraand both eyes have to be recognizable here. This software have to stayturned on for the duration of your using of the program (providingdata from the camera to the analysis software like an Ogama or GazaAnalyser). Here you should adjust position between eye camera anduser. Well distance is market by the small green circle up the pictureof the face (Figure 4.1).
2. Start Ogama (located on desktop). Ogama is software for preparing,realising and analysing experiments with eye trackers.
3. If Ogama dialog window Error occurred ... occurs, hit the Continue.
4. Next select project: screen-of-numbers-v2 in directory screen-of-numbers-v2-resolution.
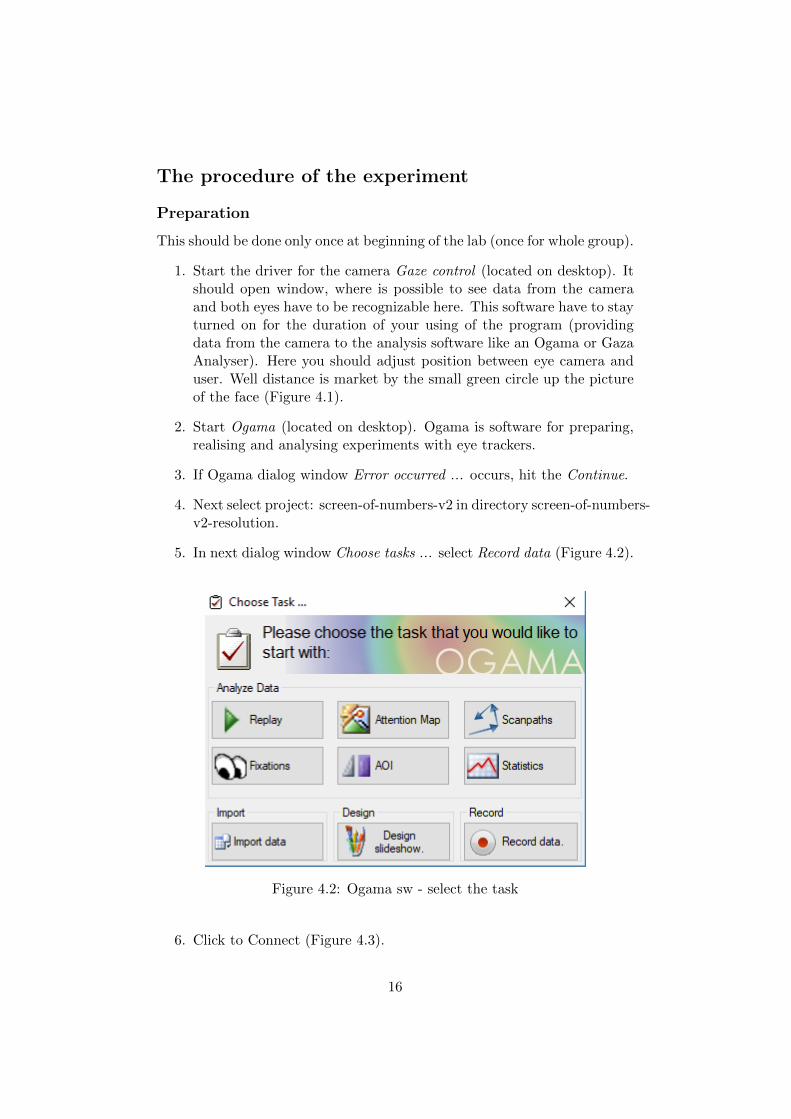
5. In next dialog window Choose tasks ... select Record data (Figure 4.2).
Figure 4.2: Ogama sw - select the task
6. Click to Connect (Figure 4.3).
16

Figure 4.3: Ogama sw - Process of data recording
Experiment
This should be repeated for every person in group.
1. Hit button Subject and insert your name in dialog windows that ap-pears (Figure 4.3).
2. Move your head in front of EyeTribe device till the red box becomegreen with image of eyes in middle. If an black box with label Devicenot connected is there instead of red box or green box, use Show onpresentation screen button.
3. Hit button Calibrate a follow the calibration instructions. If the cali-bration results are not good, repeat the process.
4. Record the data. Only experimental person (and anybody others fromgroup can not see screens with experiment)
5. Continue with next experimental person (make an evaluation aftereverybody pass the experiment)
Figure 4.4: Ogama sw - data analysis
Evaluation
For evaluation use analysis modules of Ogama. Especially Replay Moduleand Attention map or others.
17
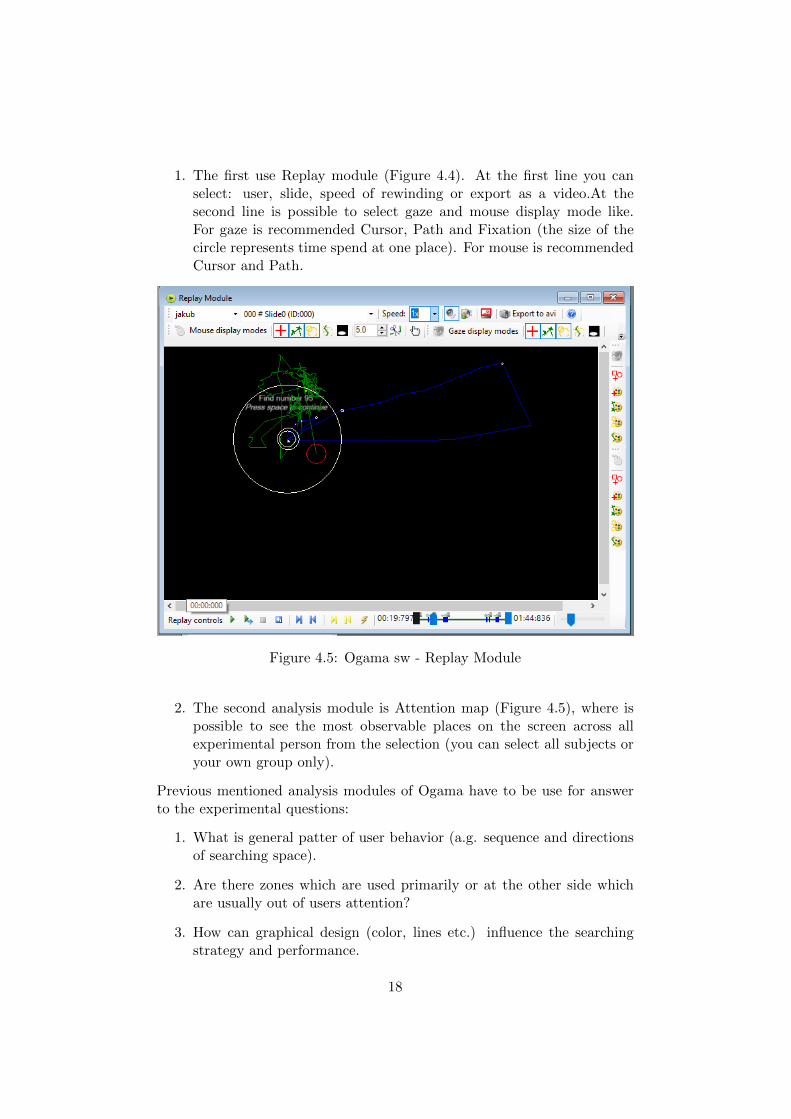
1. The first use Replay module (Figure 4.4). At the first line you canselect: user, slide, speed of rewinding or export as a video.At thesecond line is possible to select gaze and mouse display mode like.For gaze is recommended Cursor, Path and Fixation (the size of thecircle represents time spend at one place). For mouse is recommendedCursor and Path.
Figure 4.5: Ogama sw - Replay Module
2. The second analysis module is Attention map (Figure 4.5), where ispossible to see the most observable places on the screen across allexperimental person from the selection (you can select all subjects oryour own group only).
Previous mentioned analysis modules of Ogama have to be use for answerto the experimental questions:
1. What is general patter of user behavior (a.g. sequence and directionsof searching space).
2. Are there zones which are used primarily or at the other side whichare usually out of users attention?
3. How can graphical design (color, lines etc.) influence the searchingstrategy and performance.
18

Figure 4.6: Ogama sw - Attention Map Module
4. Describe individual failures.
Optional task
Optional task is to record and analysis behavior of the user on the givenweb page. Don’t use Ogama, but use the GP Analyser for this purpose.Here is possible to record desktop. User can open any web site and startsearching them, or finding specified information at this web site. Then usercan analyses his/her own record and choice suitable visualization (Figure4.7 and 4.8).
19
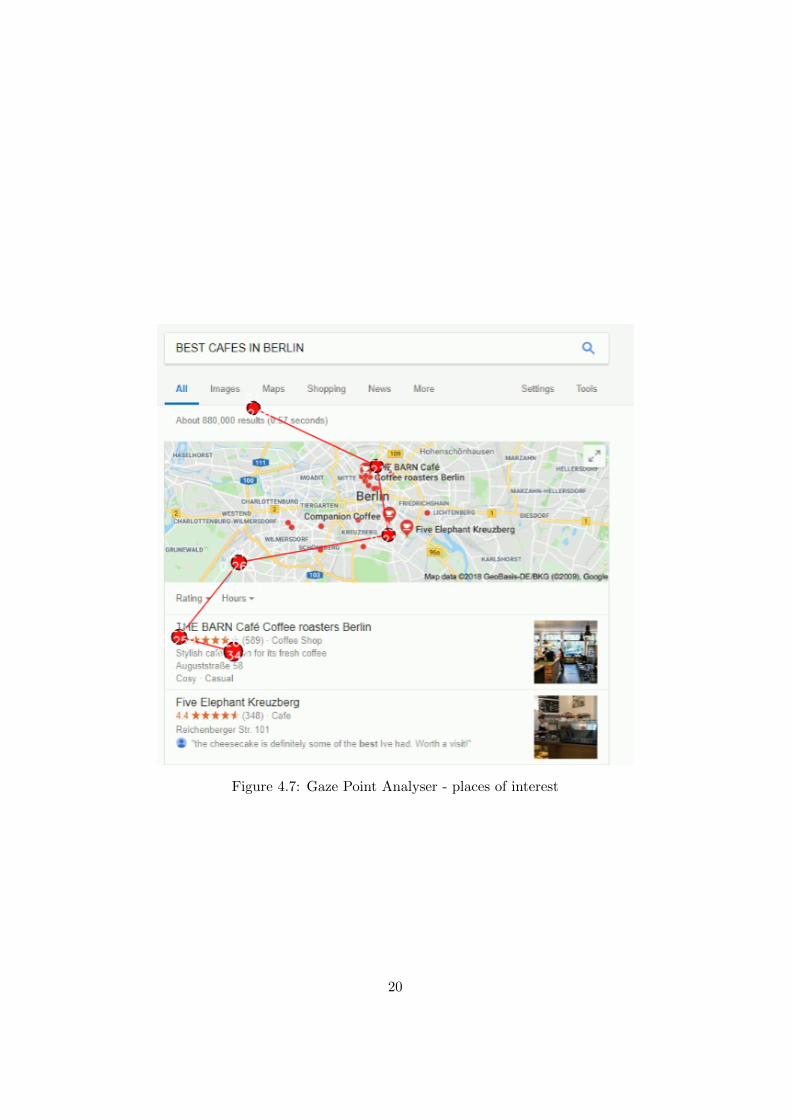
Figure 4.7: Gaze Point Analyser - places of interest
20
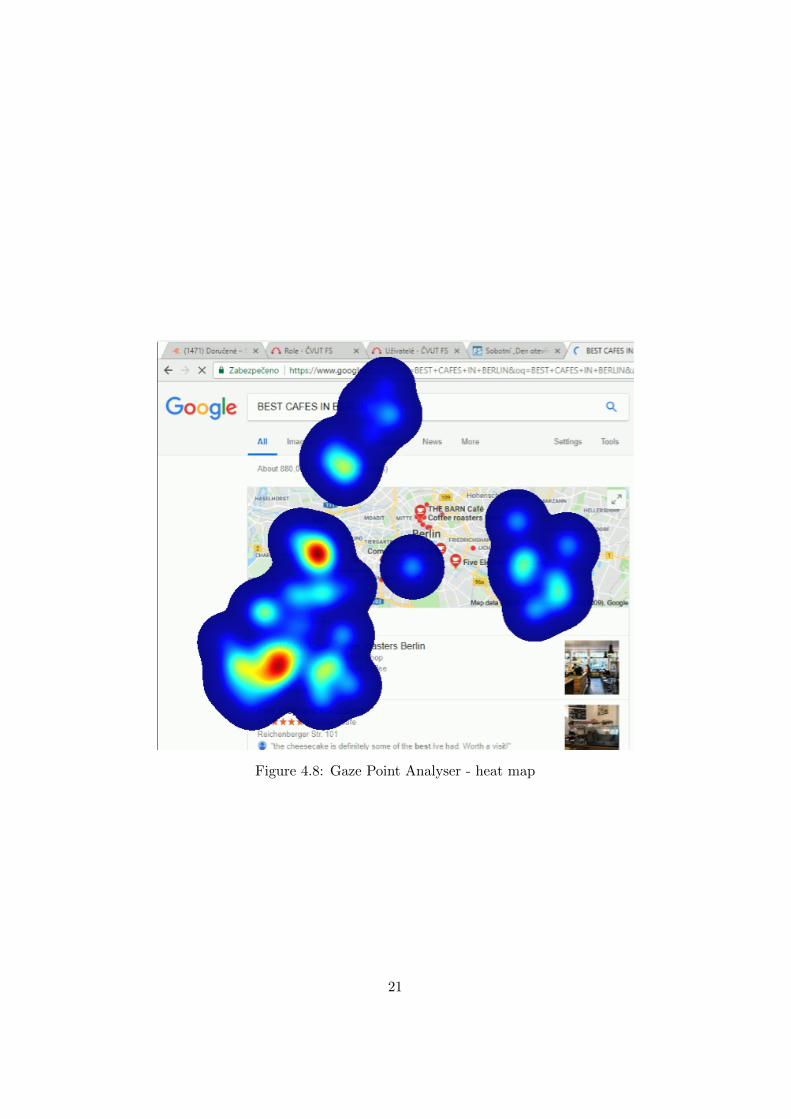
Figure 4.8: Gaze Point Analyser - heat map
21

LAB 3. Measurement of Re-action Time (RT)
Goal
Measure personal value of four types of reaction time (RT).
1. Basic reaction time
2. Reaction time for simple clear two choice decisions.
3. Reaction time for confused two-choice decisions.
4. Basic reaction time with attention divided into two tasks.
Theory
Reaction time RT is the amount of time it takes to prepare the movement.Reaction time is primarily a physiological variable that is determined by thespeed of the neural signal on the way from a sensor (e.g. retina) to an actu-ator (usually muscle). It depends on the quality of the neural system of theexperimental person and also her/his psycho-physiological state. This sim-ple reaction time is usually about 200 ms and increases a little bit with theeducation level. Also parasite Toxoplasma gondii influences longer reactiontime [6]. [On the other side – the reaction time with choice is a little bitmore psychological and one decision (which is needed to do) usually takesabout 50 ms extra time. The first rigorous measurement of reaction time wasmade by Sir Francis Galton [1] . From the psychological point of view, theattention process has three sub-processes - scanning, filtering and watching.The last one is as essential for the task as reaction time measurement is.
22
Practical application
The amount of choices and their complexity can hugely influence the reactiontime of an operator. Everytime a fast reaction time is needed in industry, itis necessary to simplify the human machine interface to a maximal possiblelevel. You can also see the effect of the confused information on the reactiontime of the operator. And you can imagine the effect of this in the field oftransportational psychology (e.g. in aviation).
Tools
HW system for measurement of RT
• PLC (programmable logic controller) TC 500 from TECO Kolin Com-pany with uploaded code for measurement of time.
• two switches (red and green)
• two pilot lamps (red and green)
Procedure of experiment
Measure personal value of the defined types of RT to a visual stimulus.Measure it for all persons in your group.
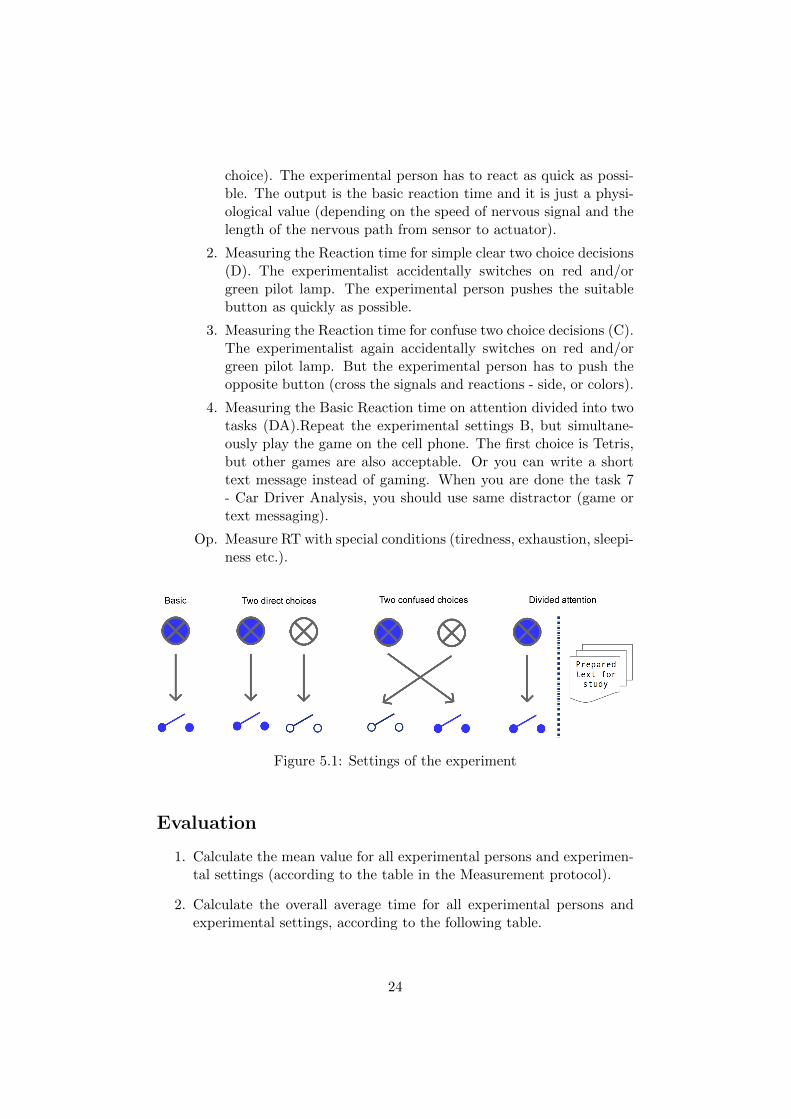
• Experimentalist can use the HW system (its control is on Figure 5.2)to measure the time of reaction.
• Experimentalist prepares his/her finger on button F1 (or F2) whichhe/she will use to switch on the lamp.
• Experimental person cannot see F1 and F2 buttons.
• Experimental person prepares (places) his/her fingers on the button.If he/she needs to use two buttons, then she should use the same fingeron both hands.
• Experimental person reacts as quickly as possible to the given signaland the given way (describe below).
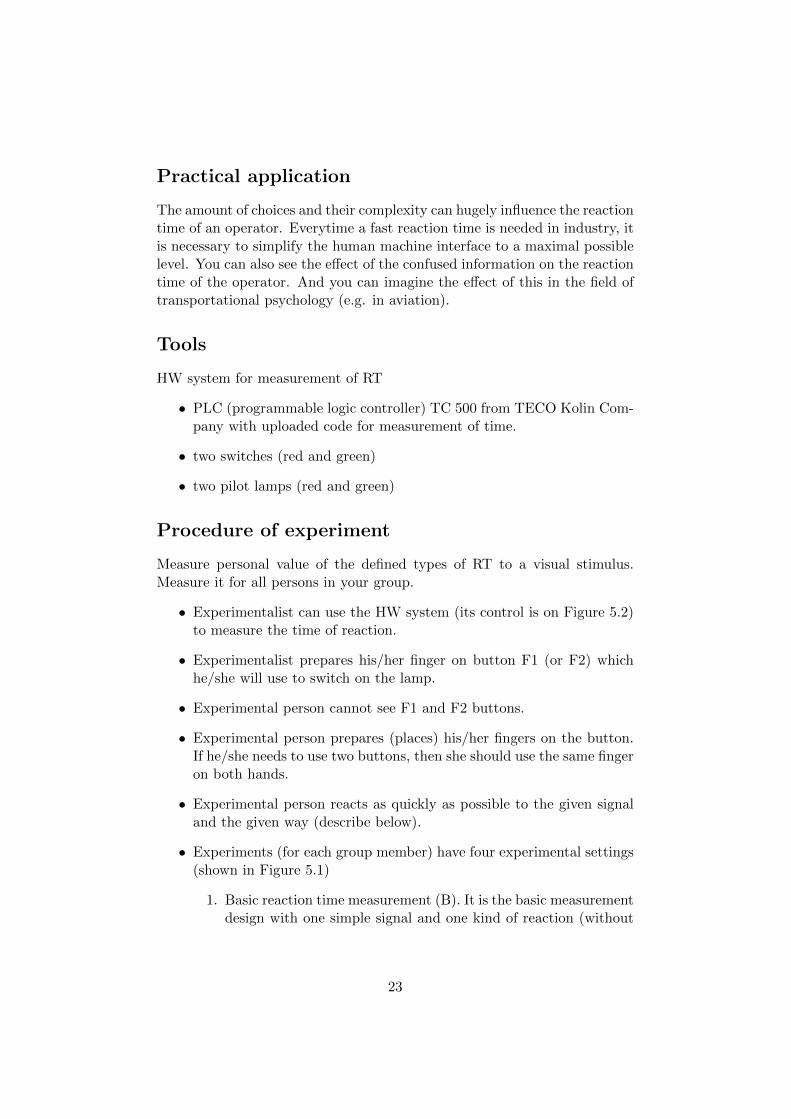
• Experiments (for each group member) have four experimental settings(shown in Figure 5.1)
1. Basic reaction time measurement (B). It is the basic measurementdesign with one simple signal and one kind of reaction (without
23
choice). The experimental person has to react as quick as possi-ble. The output is the basic reaction time and it is just a physi-ological value (depending on the speed of nervous signal and thelength of the nervous path from sensor to actuator).
2. Measuring the Reaction time for simple clear two choice decisions(D). The experimentalist accidentally switches on red and/orgreen pilot lamp. The experimental person pushes the suitablebutton as quickly as possible.
3. Measuring the Reaction time for confuse two choice decisions (C).The experimentalist again accidentally switches on red and/orgreen pilot lamp. But the experimental person has to push theopposite button (cross the signals and reactions - side, or colors).
4. Measuring the Basic Reaction time on attention divided into twotasks (DA).Repeat the experimental settings B, but simultane-ously play the game on the cell phone. The first choice is Tetris,but other games are also acceptable. Or you can write a shorttext message instead of gaming. When you are done the task 7- Car Driver Analysis, you should use same distractor (game ortext messaging).
Op. Measure RT with special conditions (tiredness, exhaustion, sleepi-ness etc.).
Figure 5.1: Settings of the experiment
Evaluation
1. Calculate the mean value for all experimental persons and experimen-tal settings (according to the table in the Measurement protocol).
2. Calculate the overall average time for all experimental persons andexperimental settings, according to the following table.
24
3. Calculate and compare the difference between the mean value of non-choice RT (B - basic) and all other experimental settings (C - confusedchoices, D - direct choices, DA - divided attention). Also estimate B -D, B - C and B - DA.
B D C DA D - B C - B DA - B
[ms] [ms] [ms] [ms] [ms] [ms] [ms]
Person A
Person B
Person C
mean
Figure 5.2: User interface of RT measurement
25

Measurement protocol appendix
Task: Measurement of Reaction Time (RT)
Table for results:
Person 1 Person 2 Person 3
No. B D C DA B D C DA B D C DA
[1] [ms] [ms] [ms] [ms] [ms] [ms] [ms] [ms] [ms] [ms] [ms] [ms]
1
2
3
4
5
6
7
8
9
10
std
B - basic reaction timeD - reaction time with two direct choicesC - reaction time with two confused choicesDA - reaction time with divided attention
Discusion
Compare results (especially from 1. and 4. subtask – basic reaction time(B) and reaction time with distraction (DA)) with results of the laboratorytask 7 – Car Driver Analysis. Discus similarity and differences.

LAB 4. Fechner’s Law Verifi-cation
Goal
Verify Fechner’s law in the field of acoustic. Make this verification for threegiven ranges.
Theory
Gustav Theodor Fechner (1801–1887) was a German scientist, psycho-physicistand E. H. Weber descendant.
Fechner’s law [16] description:
• The dependence of sense impression on the intensity of stimulus islogarithmic.
• The sense impression is proportional to the logarithm of the stimulusintensity.
• The sense impression increases according to arithmetic series whereasthe stimulus has to increase according to geometric series.
p = k · log(S), (6.1)
where the p stands for percept (sense impression), k for constant and S forintensity of stimulus.
The principle of Fechner’s and Weber’s laws are integrated into We-ber–Fechner law, which is directly used in acoustics. Weber–Fechner lawcan have the form of a differential equitation
dp = kdS
S, (6.2)
27
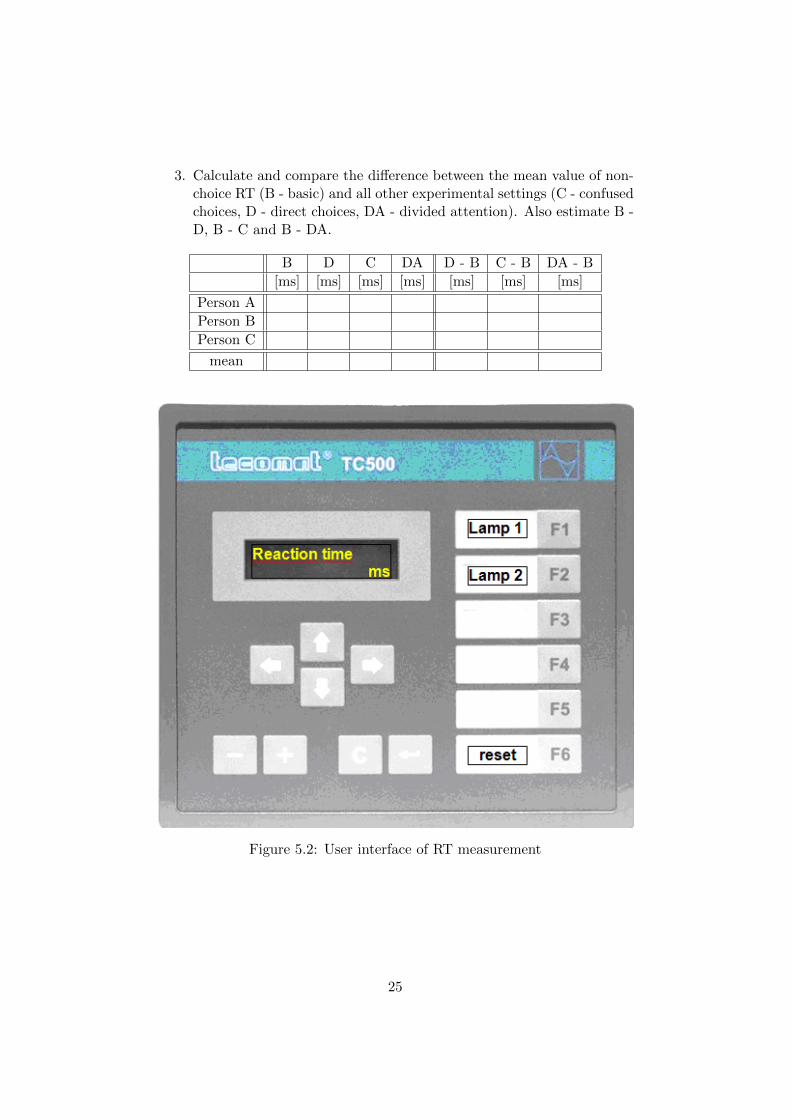
and after its resolution we obtain the equitation in the form of:
p = k · ln(S
S0), (6.3)
Where S0 is the absolute threshold of the stimulus (minimal perceived valueof the stimulus).
Figure 6.1: Dependence of sense impression on the intensity of stimulus
Practical application
Weber-Fechner law is used for evaluating noise level in acoustics, accordingto the Sound Intensity Level [5] (LI , measured in db) equation
LI = 10 · log10I
I0, (6.4)
where I is the sound intensity, measured in Wm−2 and I0 is the referencesound intensity, measured in Wm−2.
Tools
PC with LabViewLoudspeaker
The procedure of the experiment
1. Start the LabView program.
28

2. Try to change values (using potentiometers) in LabView applicationform to create a sequence of acoustic signals where all samples havean equal volume distance from the previous and the next sample (theincrement of intensity should sound constant).
Note : If it’s not clear enough, here’s a step by step description of theprocedure :
Before you begin, the difference of volume between 1 and 2 will alreadybe set. Therefore, your task will be to change the volumes of samples3 to 8. Listen to the sequence (only 1 and 2 at first) and try to setthe volume of 3 so that the increment in volume sounds constant toyou (i.e. the increment in volume is the same between 2 and 3 andbetween 1 and 2). Repeat this step for the next samples (until youreach number 8) In the end, the increase of the volume should soundlinear to you throughout the whole sequence.
3. Everyone in the group will set three sequences:
• The first of them is from 0 to 1/10 of maximum.
• The second one is from 0 to 1/3 of maximum.
• And the third is from 0 to maximum.
4. Export data to MS Excel.
Evaluation
Measured data should be evaluated accordingly:
1. Draw a suitable regression curve (with minimal error) for each range.It should be similar to figure 6.1.
2. Obtain the regression curve (and identify parameters of Fechner’s lawequation).
3. Discuss the differences dependent on the range.
29
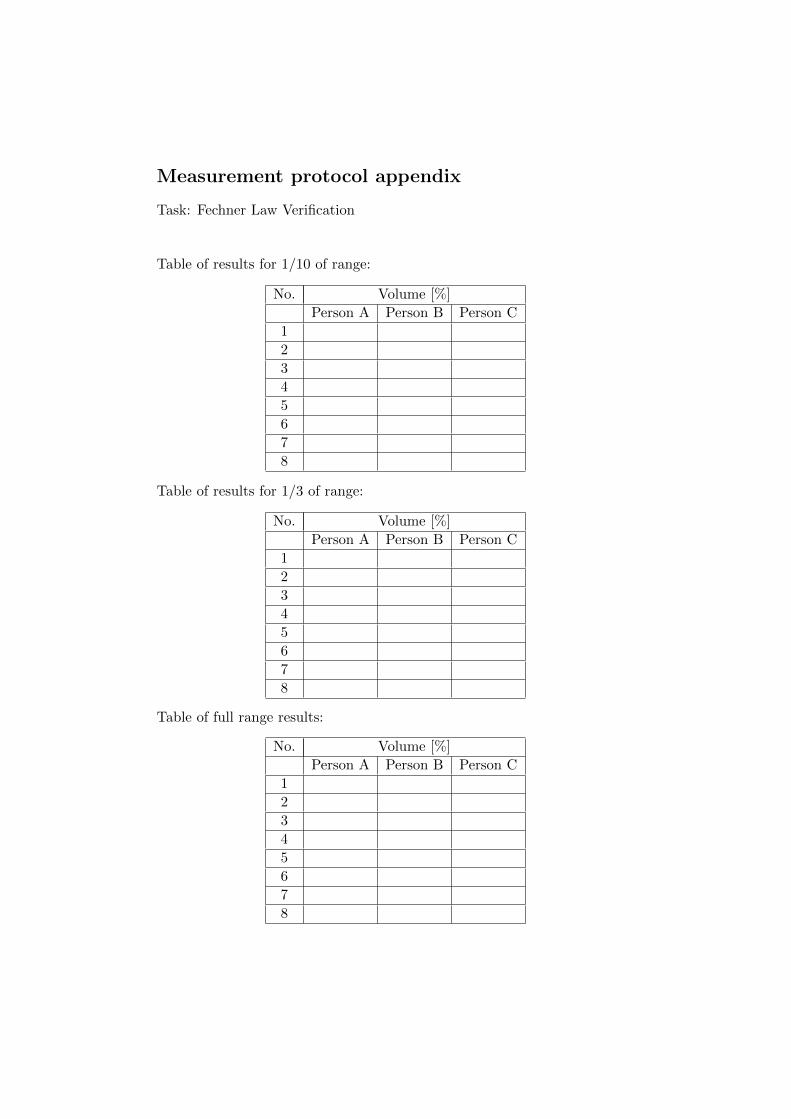
Measurement protocol appendix
Task: Fechner Law Verification
Table of results for 1/10 of range:
No. Volume [%]
Person A Person B Person C
1
2
3
4
5
6
7
8
Table of results for 1/3 of range:
No. Volume [%]
Person A Person B Person C
1
2
3
4
5
6
7
8
Table of full range results:
No. Volume [%]
Person A Person B Person C
1
2
3
4
5
6
7
8

LAB 5. Weber’s Law Verifi-cation
Goal
Draw the dependence of total weight and discrimination threshold graphi-cally and solve the kw constant by the minimal square method (use Excel).Calculate the measurement error.
Theory
Ernest Heinrich Weber (1795–1878) was a German physician who is con-sidered one of the founders of experimental psychology. Weber’s law statesthat the just-noticeable difference JND between two stimuli is proportionalto the magnitude of the stimuli [16]. That means that the Just-NoticeableDifference (JND) between two weights is approximately proportional to themass of the weights as follows:
∆I = kw · I, (7.1)
where I is a base intensity (Total weight), ∆I is the discrimination thresh-old (Weight difference) and kw is constant (Weber Fraction). The relationbetween Weber’s law and Fechner’s Law was described in Fechner’s Law.
Practical application
Control panels using different sound or light volumes as a part of indicationmust use volume differences that are bigger than the JND. Otherwise thepassed information will not be understandable.
31

Tools
Web application for the measurement of the Weber fraction in the field ofacousticsDigital scalePlateSet of base weights BW (metal cylinders)Set of difference weights (metal circles)
The procedure of the experiment
1. The experimental person (EP) holds a given base weight BW (plateand metal cylinders) in hands with eyes closed.
2. The experimentalist (E) adds and removes the small weight units(metal circles) called difference weights and EP has to decide if theweight increases or decreases.
3. The experiment starts at the minimal value of the difference weight(smallest circles) and continues by increasing the difference weight (ad-d/remove bigger weight units /or more biggest weight units togetherif needed/ when E fails to detect correctly the change 3 times in row).
4. The aim is to find out the discrimination threshold (minimal recogniz-able weight difference) for every base weight BW.
5. Minimal recognizable weight difference has to be confirmed repeatedly(at least three times in row).
6. Three different base weights BW (plate with 2, 4 and 6 metal cylinders)are used.
7. Experiment should be repeated for every person in a group.
8. Experiment results have to be recorded and evaluated in a suitablesoftware.
Notes
• EP should stand and his/her elbows should not touch the body, legsor furniture.
• E should start weight addition with smallest circle and continue withbigger one only if it is sure that EP is unable to recognize the differencecorrectly.
• E should test the discrimination threshold from the lowest value (small-est circles) up to bigger circles, not in the opposite order!
32
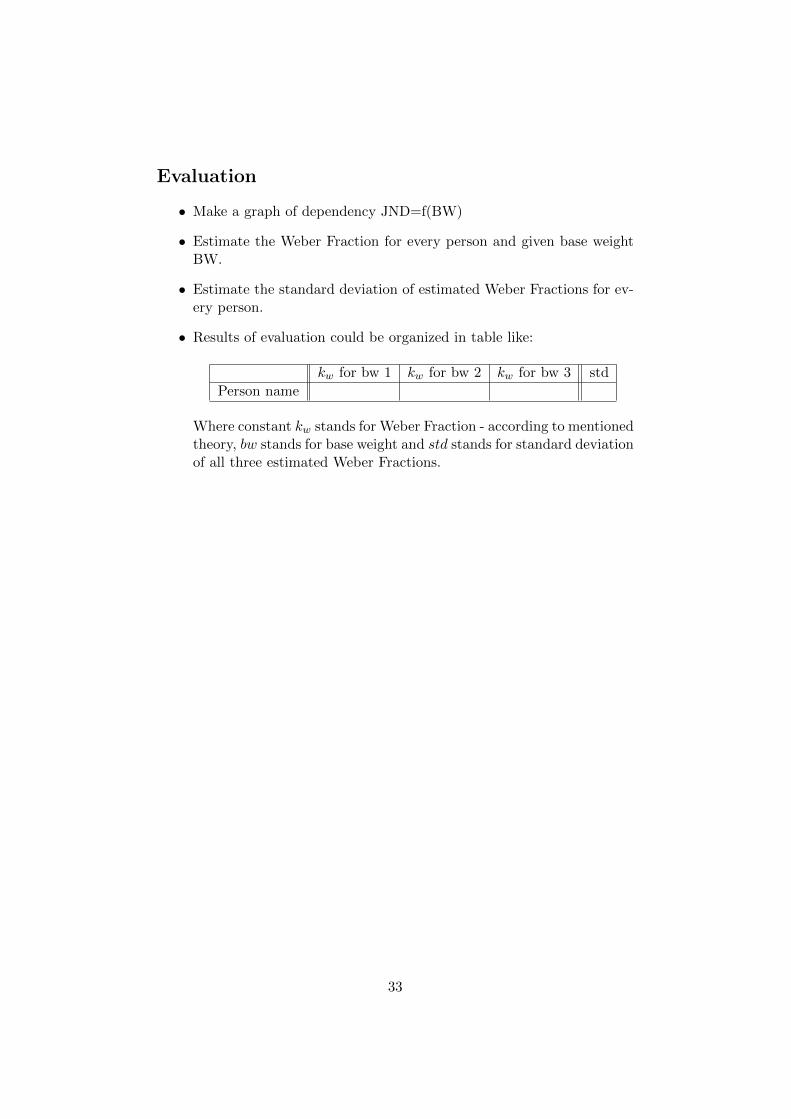
Evaluation
• Make a graph of dependency JND=f(BW)
• Estimate the Weber Fraction for every person and given base weightBW.
• Estimate the standard deviation of estimated Weber Fractions for ev-ery person.
• Results of evaluation could be organized in table like:
kw for bw 1 kw for bw 2 kw for bw 3 std
Person name
Where constant kw stands for Weber Fraction - according to mentionedtheory, bw stands for base weight and std stands for standard deviationof all three estimated Weber Fractions.
33

Measurement protocol appendix
Task: Weber Law
Tables for measured data:
∆w for bw 1 [g] ∆w for bw 2 [g] ∆w for bw 3 [g]
Person 1
Person 2
Person 3
Person 4
Note: bw stands for base weight.
Base weight 1 Base weight 2 Base weight 3
Weight [g]

LAB 6. Measurement ofElectro-Dermal Activity (EDA)
Goal
Find out the difference in the GSR/SRL (galvanic skin reaction / skin resis-tance level) in different mental states (relaxation, stress etc.). Used devicePolygraph Bio allow you to use others bio-physiological indicators like abody temperature, pulse and breathing.
Theory
Our skin on the fingers is very sensitive to an actual mental state. HighSRL values correlate with high arousal [4]. According to the same study,the SRL values also correlate with a given task difficulty and frustration(level of mental stress).
It happens because skin responds with opening and closing its poreswhen the mental state changes. This effect causes the skin resistance (con-ductivity) to change. The skin response is time delayed. You can measureonly the states that you can induce yourself before. States sugested for thistask can be: sleepiness (or relaxation), solving of a complicated mental task,tiredness (after hard work) etc.
The types of electro-dermal activitiy are: SRR – skin resistance response,SRL – skin resistance level, SCR – skin conductance response, SCL – skinconductance level, SPR – skin potential response, SPL – skin potential level.Our experiment is designed for the measurement of SLR. At others physio-logical indicators of mental state you can evaluate:
1. Breathing - frequency, ration breath-in to breath-out (1:1 strong stress,1:9 relaxation), irregularities
2.
3.
35
Practical application
The measurement of electro-dermal activity is widely used for the evaluationof the psychological state of operators with high responsibility.
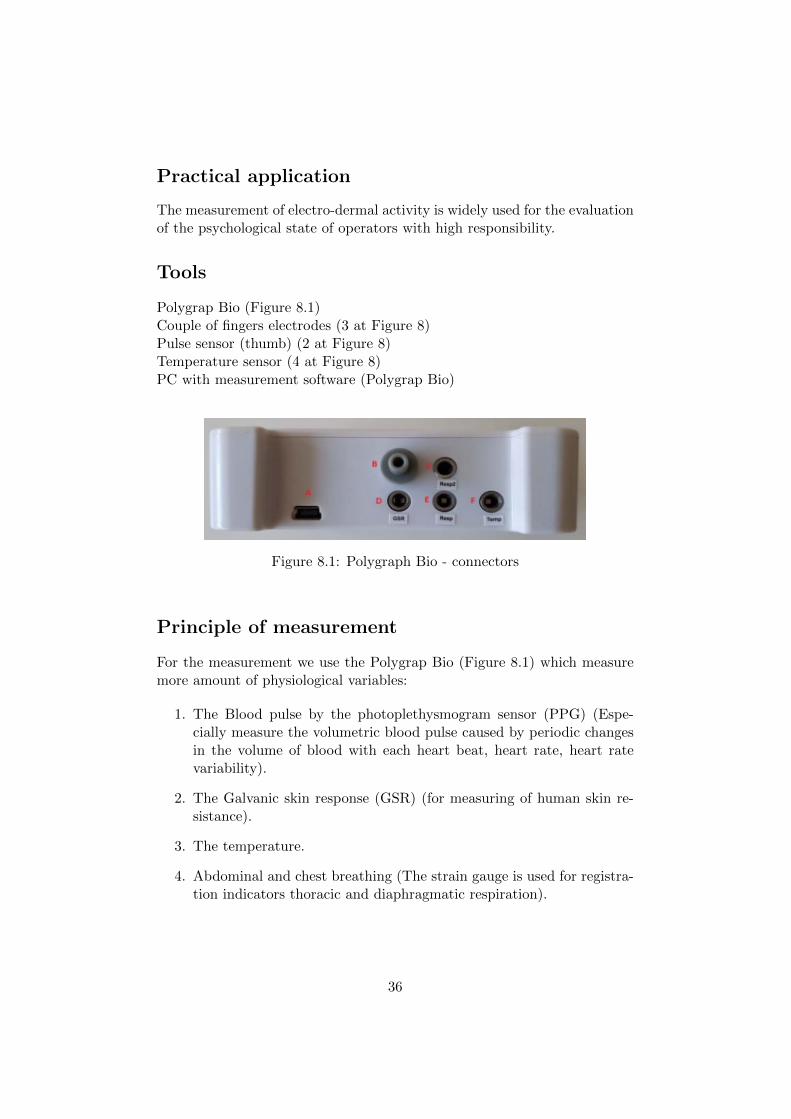
Tools
Polygrap Bio (Figure 8.1)Couple of fingers electrodes (3 at Figure 8)Pulse sensor (thumb) (2 at Figure 8)Temperature sensor (4 at Figure 8)PC with measurement software (Polygrap Bio)
Figure 8.1: Polygraph Bio - connectors
Principle of measurement
For the measurement we use the Polygrap Bio (Figure 8.1) which measuremore amount of physiological variables:
1. The Blood pulse by the photoplethysmogram sensor (PPG) (Espe-cially measure the volumetric blood pulse caused by periodic changesin the volume of blood with each heart beat, heart rate, heart ratevariability).
2. The Galvanic skin response (GSR) (for measuring of human skin re-sistance).
3. The temperature.
4. Abdominal and chest breathing (The strain gauge is used for registra-tion indicators thoracic and diaphragmatic respiration).
36

beginfigure[h!]
The procedure of the experiment
1. Start the program SkinResistancePolygrap Bio (Figure ??).
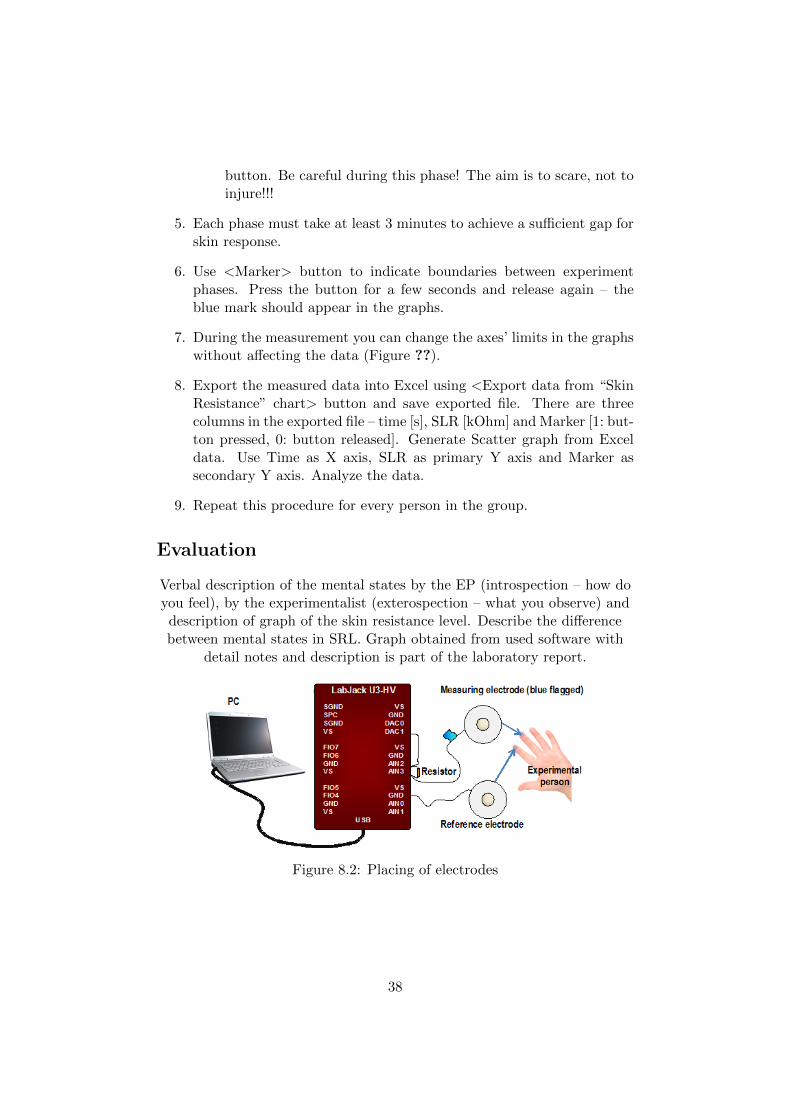
2. Place the electrodes on the experimental person’s (EP) fingertips (Fig-ure 8.2), check the proper contact of the electrodes.
3. EP should not to see the computer screen with the graphs during theexperiment!
4. Measure the skin resistance level (SRL) in the following phases :
a Reference state - non affected (your actual state - sitting with noeffort).
b Relaxation state (close your eyes, think of something pleasant. . . ).
c During the resolution of tests on imagination capabilities (i.e.shape composing), executive functions (i.e. trial making or U-drawing) or attention (i.e. Bourdon). There are good resultswith SUDOKU solving.
d During physical activity (ten squats or jumps).
e Scare state. EP closes his eyes. Experimentalist pinches or pokesEP with a pencil (gently!) suddenly at random intervals. The re-action should occur very quickly, just before the physical contact.You can mark each “attack” in the graph using the <Marker>
37
button. Be careful during this phase! The aim is to scare, not toinjure!!!
5. Each phase must take at least 3 minutes to achieve a sufficient gap forskin response.
6. Use <Marker> button to indicate boundaries between experimentphases. Press the button for a few seconds and release again – theblue mark should appear in the graphs.
7. During the measurement you can change the axes’ limits in the graphswithout affecting the data (Figure ??).
8. Export the measured data into Excel using <Export data from “SkinResistance” chart> button and save exported file. There are threecolumns in the exported file – time [s], SLR [kOhm] and Marker [1: but-ton pressed, 0: button released]. Generate Scatter graph from Exceldata. Use Time as X axis, SLR as primary Y axis and Marker assecondary Y axis. Analyze the data.
9. Repeat this procedure for every person in the group.
Evaluation
Verbal description of the mental states by the EP (introspection – how doyou feel), by the experimentalist (exterospection – what you observe) anddescription of graph of the skin resistance level. Describe the differencebetween mental states in SRL. Graph obtained from used software with
detail notes and description is part of the laboratory report.
Figure 8.2: Placing of electrodes
38

Measurement protocol appendix
Task: Measurement of Electro-Dermal Activity (EDA)Table for one person: . . . . . . . . . . . . . . . . . . . . . . . . . . . . . . . . . . . . . . . . . . . . . . . . . . . .
The marker description column should also contain the information,whether the marker time is related to one event, or the beginning of a
state.
State Time Marker description
LAB 7. Influence of PhoneUse on Driving Performance
Goal
Quantitatively and qualitatively evaluate the influence of phone use ondriving abilities. Discover the quantitative difference in driving
performance with/without distraction. Qualitatively find out what theoperator (driver) does do during the mobile phone ring and when he/she
telephones.
Theory
Divided attention, Automatic controlled processes
Practical application
Machine operators have only a given amount of attentional capacity. Iftheir task is complicated, their attention should not be occupied by other
unnecessary processes.
Tools
Car driving simulator2 accounts (cvut 111, cvut 109) and headsets, phone (able to accept SMS
or email)Video with recording
40
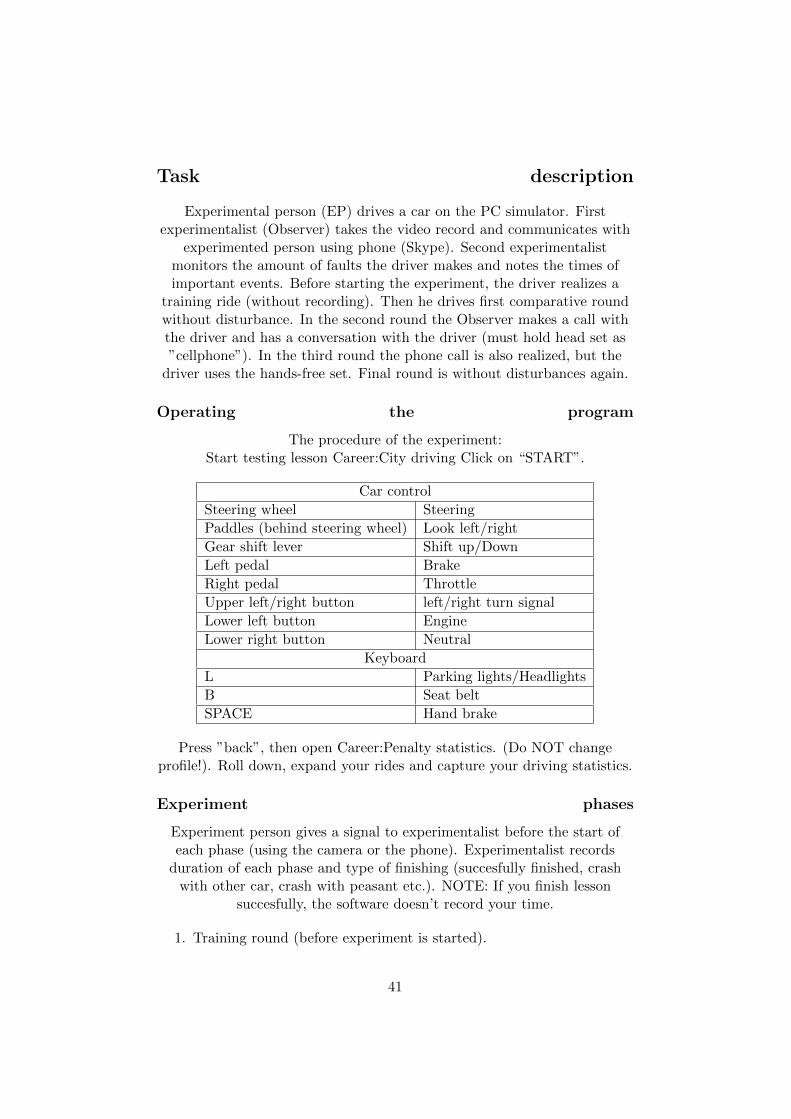
Task description
Experimental person (EP) drives a car on the PC simulator. Firstexperimentalist (Observer) takes the video record and communicates with
experimented person using phone (Skype). Second experimentalistmonitors the amount of faults the driver makes and notes the times ofimportant events. Before starting the experiment, the driver realizes a
training ride (without recording). Then he drives first comparative roundwithout disturbance. In the second round the Observer makes a call withthe driver and has a conversation with the driver (must hold head set as”cellphone”). In the third round the phone call is also realized, but the
driver uses the hands-free set. Final round is without disturbances again.
Operating the program
The procedure of the experiment:Start testing lesson Career:City driving Click on “START”.
Car control
Steering wheel Steering
Paddles (behind steering wheel) Look left/right
Gear shift lever Shift up/Down
Left pedal Brake
Right pedal Throttle
Upper left/right button left/right turn signal
Lower left button Engine
Lower right button Neutral
Keyboard
L Parking lights/Headlights
B Seat belt
SPACE Hand brake
Press ”back”, then open Career:Penalty statistics. (Do NOT changeprofile!). Roll down, expand your rides and capture your driving statistics.
Experiment phases
Experiment person gives a signal to experimentalist before the start ofeach phase (using the camera or the phone). Experimentalist records
duration of each phase and type of finishing (succesfully finished, crashwith other car, crash with peasant etc.). NOTE: If you finish lesson
succesfully, the software doesn’t record your time.
1. Training round (before experiment is started).
41

2. One round without distraction. (Record your roud time. Leave lesssonand start again in order to record your statistics.)
3. One round with a call without hands-free (EP holds the phone inhand). (Record your roud time. Leave lessson and start again inorder to record your statistics.)
4. One round with a call using hands-free (experimentalist holds thephone next to EP’s ear). (Record your roud time. Leave lessson andstart again in order to record your statistics.)
5. One round with a writing short text message with your full homeaddress. When you are done the task 3 - Measurement of ReactionTime (RT), you should use same distractor (game or text messaging).(Record your roud time. Leave lessson and start again in order torecord your statistics.)
6. One round without distraction (for comparison). (Record your roudtime. Leave lessson in order to record your statistics.)
Evaluation
Watch the recorded video and fill the table according to it. Makequalitative observations (what you noticed on the video). It is useful to
focus your attention on the movements of the driver’s eyes when he makesa mistake. Also analyze the quantitative results (relation between the use
of phone with/without handset and the number of faults made by thedriver).
Discussion
Compare your results with results of the laboratory task 3 – Measurementof Reaction Time (RT). Especially with subtask 1. and 4.– basic reaction
time (B) and reaction time with distraction (DA).
42
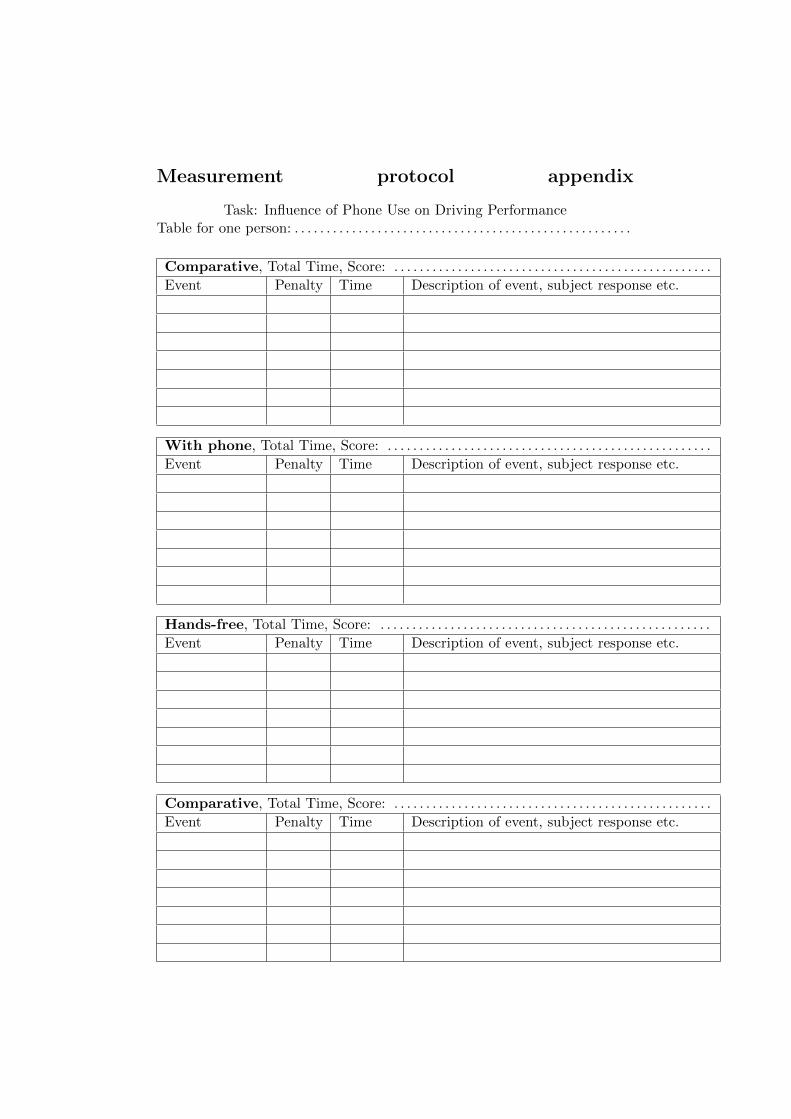
Measurement protocol appendix
Task: Influence of Phone Use on Driving PerformanceTable for one person: . . . . . . . . . . . . . . . . . . . . . . . . . . . . . . . . . . . . . . . . . . . . . . . . . . . . .
Comparative, Total Time, Score: . . . . . . . . . . . . . . . . . . . . . . . . . . . . . . . . . . . . . . . . . . . . . . . . . .
Event Penalty Time Description of event, subject response etc.
With phone, Total Time, Score: . . . . . . . . . . . . . . . . . . . . . . . . . . . . . . . . . . . . . . . . . . . . . . . . . . .
Event Penalty Time Description of event, subject response etc.
Hands-free, Total Time, Score: . . . . . . . . . . . . . . . . . . . . . . . . . . . . . . . . . . . . . . . . . . . . . . . . . . . .
Event Penalty Time Description of event, subject response etc.
Comparative, Total Time, Score: . . . . . . . . . . . . . . . . . . . . . . . . . . . . . . . . . . . . . . . . . . . . . . . . . .
Event Penalty Time Description of event, subject response etc.
LAB 8. Haptic Sensitivity
Goal
Check the difference in skin sensitivity on different parts of the body.
Theory
The skin surface feeling is projected into the human brain (cortex) [7] atthe gyrus postcentralis. Here the tactile feeling becomes conscious. Moresensitive parts of the human body take a larger area of cerebral cortexsurface and vice versa. The largest areas of cortex are devoted to the
hands and face. Neural density is very similar on the whole given gyrus.
Practical application
Tools
Tactile compassesRuler
The procedure of the experiment
1. One measurement starts at the minimal distance (0 mm) and endswhen the experimental person (EP) feels two separated points.
2. Measure and record the resulting distance.
3. Repeat ten times on one body part with one EP.
4. Repeat steps 1) till 3) for different body parts (at least 4).
5. The whole experiment should be repeated for each person in a group.
44

6. Draw a bar graph (or a pie chart) of the haptic (tactile) sensitivityon the different body parts you tested (for individual persons and formean values of all experimental persons).
7. On one given part of the body, make a measurement for open andclosed eyes.
Figure 10.1: Dependence between the skin surface and the brain surface –gyrus postcentralis
Evaluation
Discuss individual and common differences in skin sensitivities. Discussthe influence of the open/closed eyes on skin sensitivity and express thisdifference in percentage. Make a bar graph of results (like example graph
Figure 10.2).
45
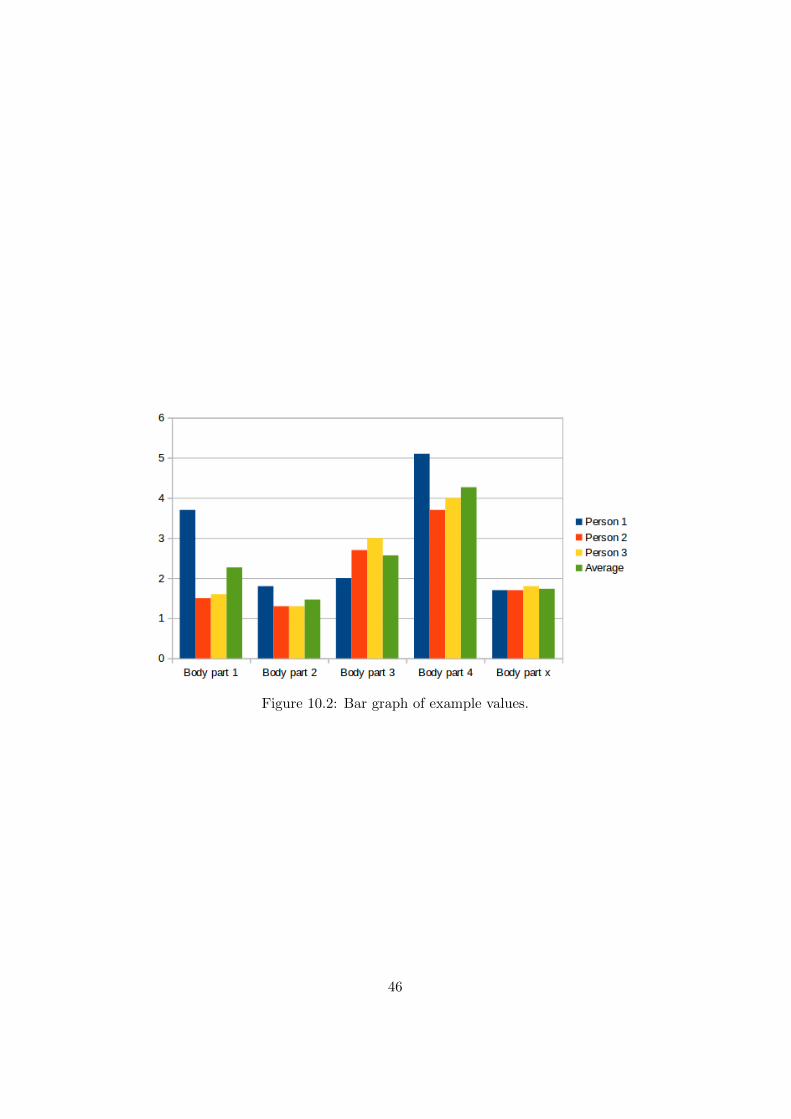
Figure 10.2: Bar graph of example values.
46

Measurement protocol appendix
Task: Haptic SensitivityTable for one person:
No Body part 1 Body part 2 Body part 3 Body part 4 Body part 1closed eyes
1
2
3
4
5
6
7
8
9
10
mean
std
Body part 1: . . . . . . . . . . . . . . . . . . . . . . . . . . . . . . . . . . . . . . . . . . . . . . . . . . . . . . . . . . . .Body part 2: . . . . . . . . . . . . . . . . . . . . . . . . . . . . . . . . . . . . . . . . . . . . . . . . . . . . . . . . . . . .Body part 3: . . . . . . . . . . . . . . . . . . . . . . . . . . . . . . . . . . . . . . . . . . . . . . . . . . . . . . . . . . . .Body part 4: . . . . . . . . . . . . . . . . . . . . . . . . . . . . . . . . . . . . . . . . . . . . . . . . . . . . . . . . . . . .Body part 5: . . . . . . . . . . . . . . . . . . . . . . . . . . . . . . . . . . . . . . . . . . . . . . . . . . . . . . . . . . . .
LAB 9. Readability of Differ-ent Kinds of Indicators
Goal
Find out which type of indicator is the most readable.
Theory
The readability of indicators has been an issue in engineering psychologysince its beginning and is still relevant. Choosing the most suitable
indicator for a given task can be a really complex problem - and from thevisual perception point of view it is discussed in [17]. One of the criteria is
the amount of time the operator needs to correctly get the informationfrom the indicator.
Practical application
The ability to read values from an indicator and do it under time stresssituation is very important in the field of operator control. Misreading theindicator can have huge consequences. Although the reading is always an
outcome of an interaction between the operator and the interface – and theside of the operator is impossible to skip – we only deal with the interfacepart in this lab task. It justifies the fact that the look of the interface can
have an influence in the process of designing technical systems.
Tools
Tachistoscop (electronically controlled exposition time by the camerashutter) with range 1/1000–1 second.
48
The set of instruments - displays, clocks and theirs equivalents realized bycomputer interface and SCADA HMI Reliance - ??. (Start program
Reliance 4 – Design, open Project1, Run project – F9)Power pack and potentiometer.
The procedure of the experiment
Preparation
The value displayed on the given instrument (clock etc.) is shown by theexperimentalist to the experimental person for a very short time. Arrange
the observed instrument in front of the curtain (cardboard box withcamera) in order to see it comfortably. Use the “B” shutter setting
(permanently open) for this purpose.
Experiment
Experimentalist sets the value on the observed instrument. He changes thevalue whenever the experimental person tries to read the value (also whenthe experimental person doesn’t recognize the value). Experimental personsets the shutter time. Use shutter time 1/1000, 1/500, 1/125, 1/30 and 1/4only. Measure with every shutter time ten times! Measure for all members
of your group!
Evaluation
Make a graph of the mean value of reading errors for all devices andexposition times (x-axis: exposition time, y-axis: reading error). E.g. 11.1Make a verbal interpretation of the information from the graph. And on
this basis evaluate specific properties of each given indicator type.
49
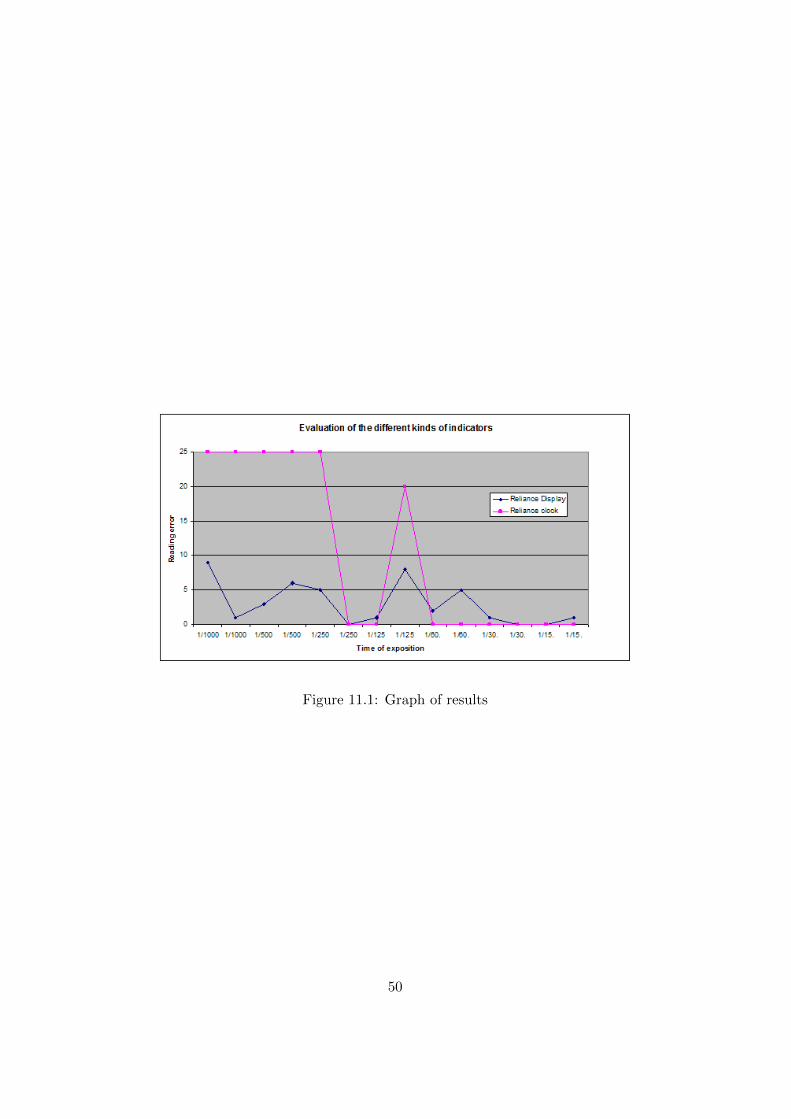
Figure 11.1: Graph of results
50

LAB 11. Emotion Recogni-tion from Speech
Goal
The main goal will be to understand how it is possible to recognizeemotion in speech (automatically). In order to do so, we will use
EmoVoice, an already existing framework from the University of Augsburg.To understand the process better, and test its accuracy, you will execute
the following steps :a) Check the efficiency of a model using previously recorded speech ; b)Build a user-specific model and test it ; c) Evaluate emotion recognition
from speech by a human operator.
Theory
As we saw in LAB. 6 with skin sensitivity, our body can react differentlydepending on our mental state. It is known that one’s voice changes withthe emotions felt. For instance, we can sometimes hear a tremble in a sadperson’s voice. For a few decades now, scientists have tried to find which
features of speech characterize emotions. A review of studies regarding thismatter can be found in section � Emotion recognition from speech �. The
method used could be simplified as follows :• From an extract of oral speech, find out which acoustic parameters seemto give information on the emotion felt at the time ; Note : In addition to
acoustic features, it’s also possible to use other speech features such aslinguistic or discourse information.
• Build a classifier with these parameters ;• Create an � emotional speech database � to train and evaluate theclassifier (an emotional speech database is basically an ensemble of
sentences that will induce specific emotions when read) ;
51

Nowadays, with the results of this studies it is possible to find programsreaching a significant accuracy in emotion recognition from speech. In thislab, you will use EmoVoice, a framework with a very user-friendly design.It’s important to note that in this case we consider only acoustic features.
For further information on how EmoVoice is built (for example whichalgorithms are used), please refer to section � EmoVoice � in the textbook.
Practical application
Like the measurement of electro-dermal activity, this technology could beused to evaluate the mental state of operators with high responsibilities.Furthemore, a wide range of applications can benefit from it, for instance
it could lead to the improvement of voice-operated services.
Tools
PC with EmoVoice Microphone
The procedure of the experiment
Note : See Fig. 1 and Fig. 2 for indications with ”n°”. a) Check theefficiency of a model using previously recorded speech An emotional speechdatabase is already built in EmoVoice. The stimulus (sentences inducingemotions in the speaker) can be chosen in German, English, French orItalian. A recording of the German pack of sentences has already beenmade. You will use it to evaluate and train a model and then check its
efficiency. The output you will get using this database is a positiveemotion or negative emotion label. 1. In the EmoVoice interface, select
project’ emovoice’ (n°1), user‘user’and double-click on recording‘2013-10-16 07-35-48.’You can see it’s now loaded in the View panel. 2. In
the Model panel (n°3), select the Evaluation (n°4) tab. Selectmethod‘ev-bayes’(check box‘re-extract features’on the far right) and run
Evaluate Model. You can then see the result of the evaluation in thedisplay box. Note : We choose to use the‘ev-bayes’in our lab because it
works better than the‘ev-svm’method for real-time recognition. 3. In theTrain/Run tab (n°5), click on Train Model. The model is now ready to
use. In the next step, you will check its efficiency. 4. You will now test themodel AND a human operator. You need to be prepared to say 20sentences in the microphone. Everytime you will say one sentence,
EmoVoice will display the label it has assigned to your speech (negative orpositive). At the same time, please note the label you chose and ask your
partner to write down the label he would choose, for each occurrence. Note: If you need some ideas for the sentences can choose them from the
52

examples in the last page of the lab (try to choose 10 negative and 10positive). 5. Once you are ready for the test, select the trained model andstart Run Selected Model. Say your sentences one by one and be careful to
check that a label is displayed by EmoVoice after each time your read asentence before moving on to the next one. 6. Write down or copy the
results from EmoVoice.b) Build a user-specific model and test it 1. In the EmoVoice interface,
select project‘emovoice’(n°1) and create a new user with your name. 2. Inthe Record panel (n°2), chose the language of the stimuli you want to use.3. Click on Start Recording. The stimuli slides will begin to be displayed,
start reading them. The recording will stop once you have read all thesentences. 4. Now it is necessary to extract the features from your speechrecording to evaluate and train a new model with it. Select the recording
you just made and repeat steps 2. to 6. from the instructions in paragrapha).
c) Evaluate emotion recognition from speech by a human operator. Youcan notice that this step was already realised during the tests in a) and b).
You will use the notes of your partner as results for the evaluation.FIG.1FIG.2
Evaluation
Of course, we will assume that the accuracy of the label chosen by theperson whose speech is evaluated is 100%, it is our reference. Therefore,our reference is not absolute, it is user-related. In our lab, we only usedbasic labels for emotions (negative or positive). However, in the case of
more complex emotions, it can be hard to describe the feelings in one word(for an external person and even for the person who’s expressing the
emotions). To test your self-evaluation in a given situation, you can trythis test, created by a research group from the University of Geneva :https://www.unige.ch/fapse/emotion/demo/TestAnalyst/GERG/apache/htdocs/index.php Now, with the results obtained in
a) and b), evaluate the accuracy of the models and the human operator (in%). Compare the results and comment.
Note : if the stimuli you chose has an output of more than 2 labels(positive-passive, positive-active, negative-passive, negative-active), you
can consider only the � positive � and � negative � part, since the alreadyexisting model was trained with only positive and negative.
Measurement protocol appendix
Example of a table of results for one model :
53

TABLE
Measurement protocol appendix
Task: Negative AfterimageTable for person 1:
Experiment number Original image Negative afterimage
[1] Size [cm] Distance [cm] Size [cm] Distance [cm]
1 5 2.5
2 5 5
3 5 7.5
4 5 10
5 5 15
Examples of sentences
This is so unfair! Get out of here! You really get on my nerves. I couldnever imagine being so angry! I can’t believe I’m always so unlucky!That’s such bad luck! She makes me so mad! I don’t want to see you
again! My life is so tiresome. It often seems that no matter how hard I try,things still go wrong. Everybody is so friendly to me! I feel enthusiasticand confident now! This is the best movie I have ever seen! This is the
best movie I have ever seen! I’m very content about my life. I got the newjob! Isn’t it beautiful? It’s a great book! Blue is such a comforting colour.
Never mind, keep going!
54
Application of EngineeringPsychology Today
Design of HMI with cognitive model
This chapter is based on article [11]. The method deals with HumanMachine Interface (HMI) and its design, which is based on the cognitive
model of the HMI user. Designing a Human Machine Interface (HMI) is aprocess that is mastered routinely – especially in the case of the interfacebetween a user and his personal computer, in its day-to-day use. In this
paper, the approach which supports the design of a very special interface isoutlined. This interface considers particular human attributes such as
creativity. The global aim of this effort is to generalize this procedure andobtain a universal method for HMI design.
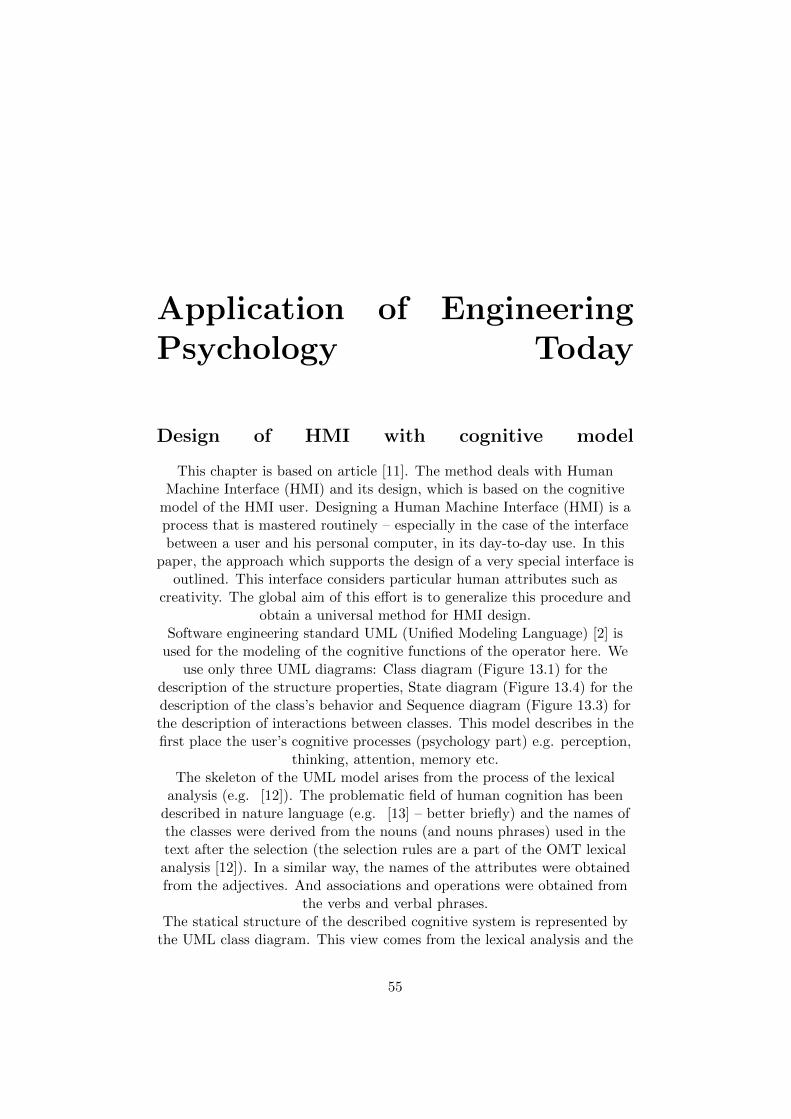
Software engineering standard UML (Unified Modeling Language) [2] isused for the modeling of the cognitive functions of the operator here. We
use only three UML diagrams: Class diagram (Figure 13.1) for thedescription of the structure properties, State diagram (Figure 13.4) for thedescription of the class’s behavior and Sequence diagram (Figure 13.3) forthe description of interactions between classes. This model describes in thefirst place the user’s cognitive processes (psychology part) e.g. perception,
thinking, attention, memory etc.The skeleton of the UML model arises from the process of the lexical
analysis (e.g. [12]). The problematic field of human cognition has beendescribed in nature language (e.g. [13] – better briefly) and the names ofthe classes were derived from the nouns (and nouns phrases) used in thetext after the selection (the selection rules are a part of the OMT lexicalanalysis [12]). In a similar way, the names of the attributes were obtainedfrom the adjectives. And associations and operations were obtained from
the verbs and verbal phrases.The statical structure of the described cognitive system is represented by
the UML class diagram. This view comes from the lexical analysis and the
55
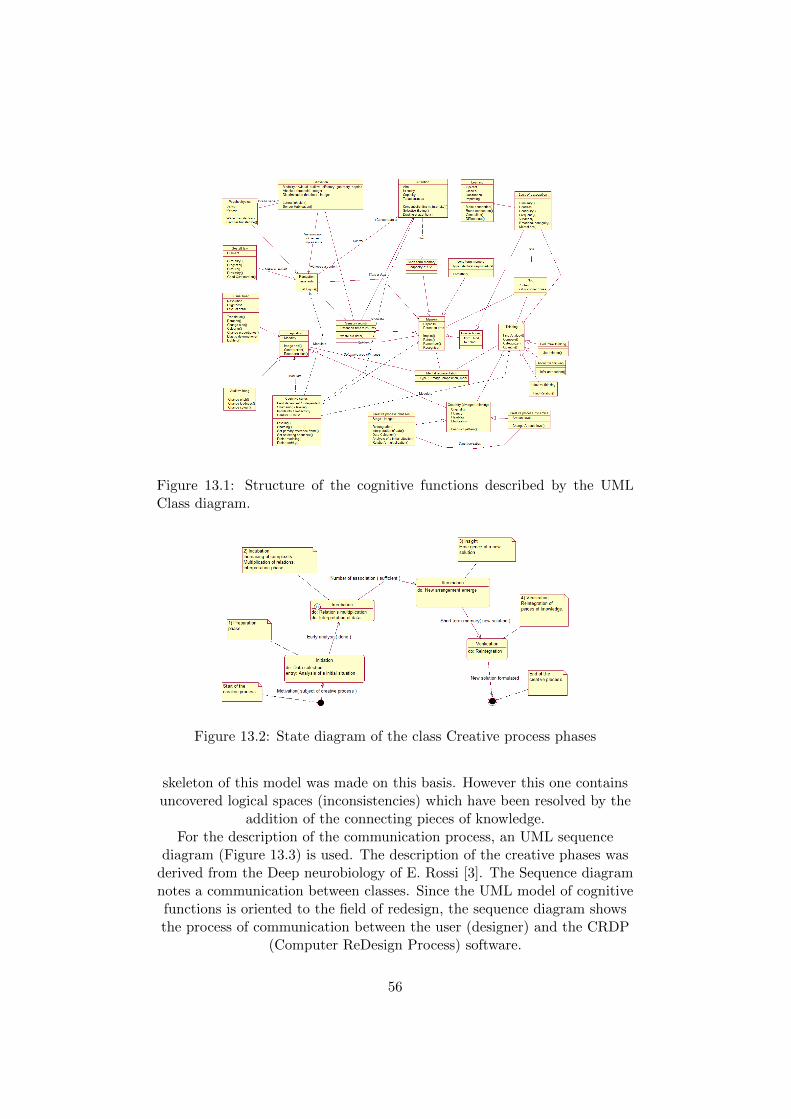
Figure 13.1: Structure of the cognitive functions described by the UMLClass diagram.
Figure 13.2: State diagram of the class Creative process phases
skeleton of this model was made on this basis. However this one containsuncovered logical spaces (inconsistencies) which have been resolved by the
addition of the connecting pieces of knowledge.For the description of the communication process, an UML sequence
diagram (Figure 13.3) is used. The description of the creative phases wasderived from the Deep neurobiology of E. Rossi [3]. The Sequence diagramnotes a communication between classes. Since the UML model of cognitivefunctions is oriented to the field of redesign, the sequence diagram showsthe process of communication between the user (designer) and the CRDP
(Computer ReDesign Process) software.
56

Figure 13.3: An example of sequence diagram - communication between user(designer) and CRDP software.
57

The cognitive method helps the Human Machine Interface (HMI) designerto develop the interface with respect to complex mental functions. The
designer can allocate the cognitive functions displayed on the model to thearising interface and assure the usability of his HMI system for human
operator.
Figure 13.4: The interaction between proponed interface and model of hu-man cognitive system.
The designer (of HMI) uses the cognitive model to see and to use thehuman natural capabilities (which are expressed for example as an
operation and properties of the given classes). And in the process ofdescription of the communication between user and HMI (computer), the
designer can deeply elaborates the cognitive model, according to theincorporation of the new cognitive parts in the sequence model. The
universal technique of HMI design can arise by the generalization of theabove mentioned principles of the drafted method.
58

Emotion recognition from speech
Knowing the mental state of somebody could be useful for a lot ofapplications. For instance, we already stated in LAB. 6 that the
measurement of the EDA was used for the evaluation of the psychologicalstate of operators with high responsibilities.
It is also known that one’s voice changes depending on their state. That iswhy there have been a lot of experiments in this field and some of themare still ongoing. The main goal of these works would be to be able tobuild a model of emotion recognition from speech, which hasn’t been
effectively done yet.This kind of knowledge could then be used for different applications, for
example :
• Improvement of voice command (for a better understanding of voicecommands made by the user to the machine) ;
• Improvement of synthetic voice (so that it seems more human) ;
• Improvement of the service given by call centers ;
• New acting methods/tips for actors ;
• Communication for people in the autistic spectrum or with communi-cation disabilities (for a better understanding of other people or cre-ation of a new way to communicate feelings to others) ;
• Better understanding of some brain malfunctions ;
• Detection of stress and tiredness in operators (for example in conver-sations between pilots and control on the ground) ;
• ...
The situation today
In the following paragraphs, we’ll detail further the results of some of theexperiments that have been lead on the subject until now.
What are the methods used to figure out emotions in speech?
In the research papers reviewed, the experiments have been done on givenextracts of oral speech, that can be from recorded conversations, actors’work, etc. Therefore, emotions are either simulated (by actors), forced
(induced by the context) or natural.One of the main problems is to find the acoustic features of speech that
could be used as efficient parameters to decipher emotions, since the list isvery long, as shown in Fig. 12.5.
59
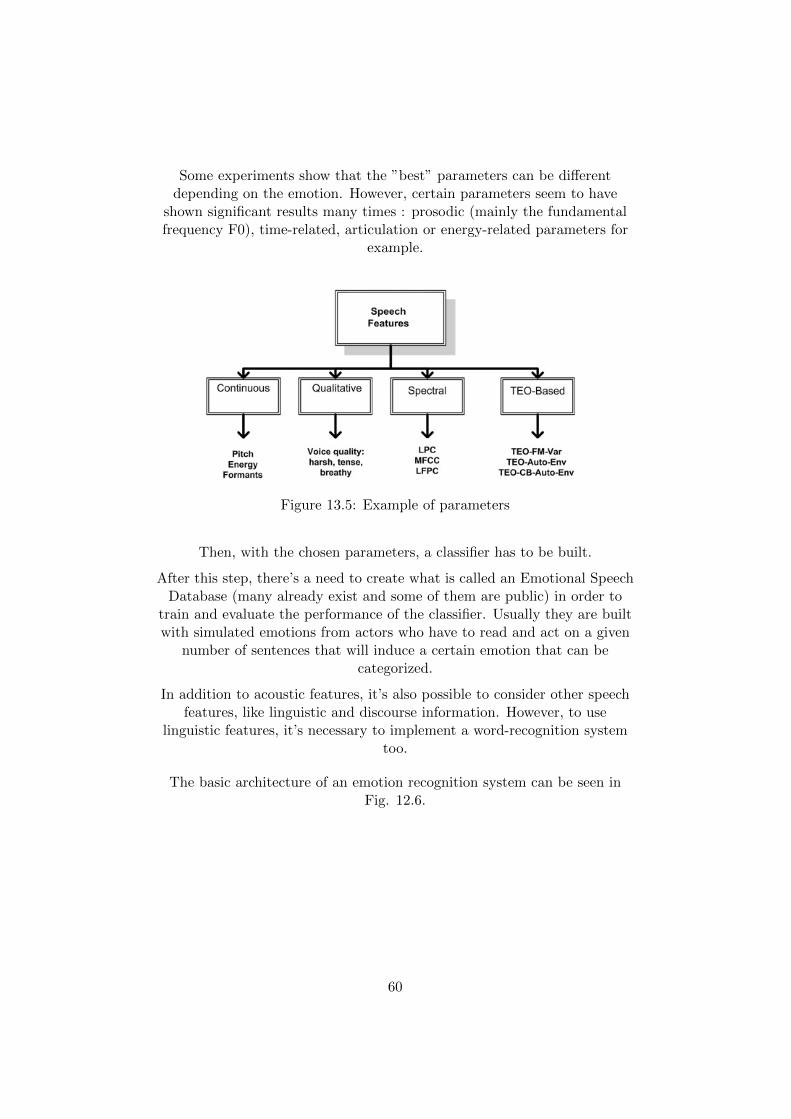
Some experiments show that the ”best” parameters can be differentdepending on the emotion. However, certain parameters seem to have
shown significant results many times : prosodic (mainly the fundamentalfrequency F0), time-related, articulation or energy-related parameters for
example.
Figure 13.5: Example of parameters
Then, with the chosen parameters, a classifier has to be built.
After this step, there’s a need to create what is called an Emotional SpeechDatabase (many already exist and some of them are public) in order to
train and evaluate the performance of the classifier. Usually they are builtwith simulated emotions from actors who have to read and act on a given
number of sentences that will induce a certain emotion that can becategorized.
In addition to acoustic features, it’s also possible to consider other speechfeatures, like linguistic and discourse information. However, to use
linguistic features, it’s necessary to implement a word-recognition systemtoo.
The basic architecture of an emotion recognition system can be seen inFig. 12.6.
60

Figure 13.6: Architecture of a speech emotion recognition engine combiningacoustic and linguistic information
Furthermore, note that the whole process can be done ”off-line” or in realtime (then it is called automatic).
Remarks
Nowadays, we can see from the experiments that it is not possible to reacha total accuracy for now. Furthermore, the efficiency will be significantlylower if the recognition is automatic and if the emotions analyzed are not”basic” ones (because the boundaries between subtle emotions is blurry).
It also seems that acoustic features are the reference over linguisticinformation (maybe because the efficiency of the latest is lowered by the
imprecision of word-recognition systems).However, some simple solutions for emotion recognition in speech havebeen developed and made accessible to a broad audience. For instance,
many Matlab algorithms have been written and put online (it is possible tofind or ask for source codes of some of them on YouTube). Universities orresearch centers working on the subject have sometimes also made theirwork available. In the next paragraphs, we’ll take a closer look at one
platform in particular, called EmoVoice, a project from the University ofAugsburg.
61
EmoVoice
In the words of its creators, EmoVoice is ”a framework for emotionalspeech corpus and classifier creation and for offline as well as real-time
online speech emotion recognition”. It is built in a very user-friendly way :its interface is designed in way that enables non-experts to build their own
emotion recognition system.
How does it work?
The emotion recognition system in EmoVoice uses only acousticinformation and its basic architecture is similar to the one described in the
last paragraphs and Fig. ? (without linguistic information). Theemotional speech database is built with the help of the Velten moodinduction technique. A set of sentences that should elicit a specific
emotion in the reader is included. Also, EmoVoice already contains adatabase built with this sentences, made with the help of some students,
but it is possible for the user to use this set (or even write other sentences)to create a new database. The emotions induced can be labelled as follow :
positive-active, positive-passive, negative-active, negative-passive. Theseare designed from four emotions : joy, satisfaction, anger and frustration.
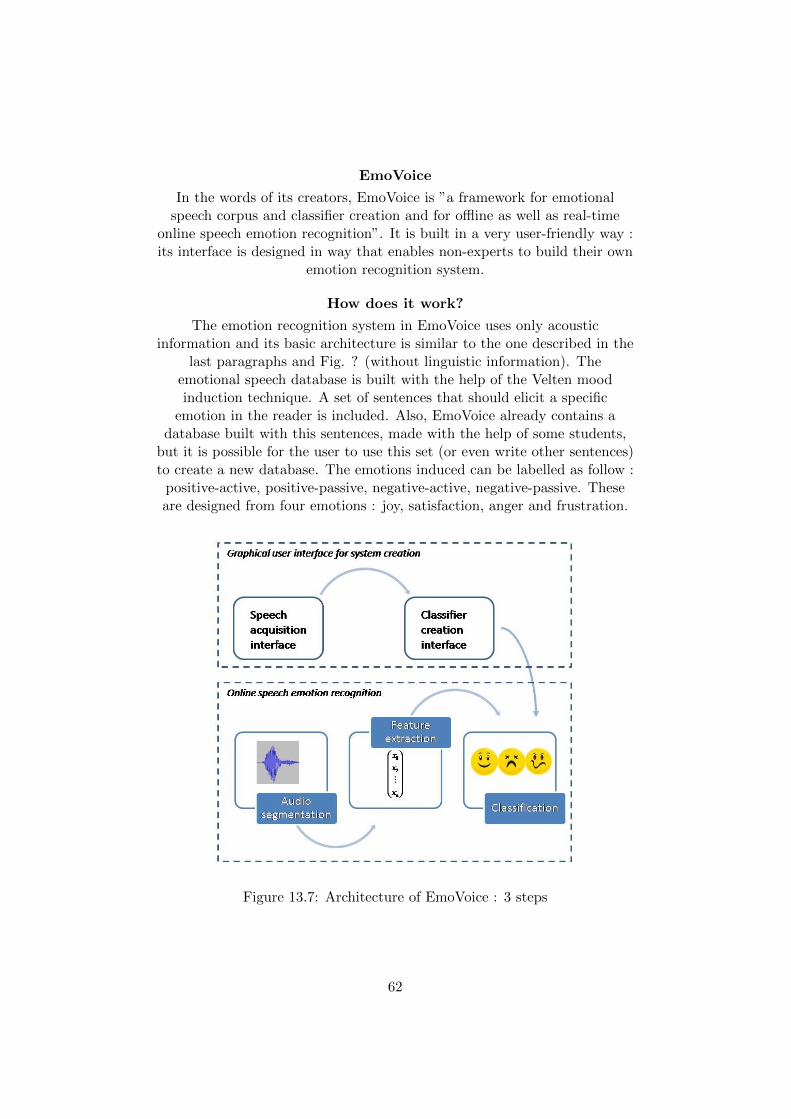
Figure 13.7: Architecture of EmoVoice : 3 steps
62

As seen in Fig. 12.7, there are three steps to fulfill for emotion recognitionin speech :
Audio segmentation
Firstly, the speech extract has to be cut into segments that will be used asmeaningful classification units. Since EmoVoice doesn’t use linguistic
information, there’s no need to use a word-recognition software and theunits don’t necessary have to be words or utterances.
For this purpose, a voice activity detection (VAD) algorithm is used. Thistechnique is used to detect the presence or absence of speech, and helps
cutting the signal into segments that contain pauses of 200 ms maximum.This method has had positive results in similar contexts, it is fast and itseems there can be no change of emotion in the duration of one segment.
Feature extraction
The aim of this step is to find out which derived values from the acousticsignal are going to give useful information on the emotion expressed in onesegment, so that the number of properties to use can be reduced : it will
prevent the use of redundant properties or non informative ones.
Classification
There are two classification algorithms in EmoVoice : a Naıve Bayes (NB)classifier and a Support Vector Machine (SVM) classifier. The later has ahigher classification rate and is widely used for offline emotion recognition
but can only be used in real-time with a significant reduction of thenumber of features used, whereas the former works fast even with a high
number of features.
External applicationsEmoVoice can also be integrated into other applications, for instance in ahumanoid robot or a virtual agent. For further information on this, please
visit the project’s page on the website of the University of Augsburg.
Sources - to writehttp://www.sciencedirect.com/science/article/pii/S0031320310004619
http://ict.usc.edu/pubs/Towardhttp://blogs.univ-tlse2.fr/robert-ruiz/files/2012/02/Synthhttps://www.informatik.uni-
augsburg.de/lehrstuehle/hcm/publications/2008-PIT-Vogt/Vogtetal-PIT08.pdf http://hcm-lab.de/projects/ssi/ +
Manual
63

Bibliography
[1] Galton , Francis. An instrument for measuring reaction time. Reportof the British Association for the Advancement of Science, 59:784 5,1889.
[2] OMG Object Management Group . Unified modeling language: UMLresource page.
[3] Rossi , E.L. The deep psychobiology of psychotherapy. In Handbookof Innovative Therapy. 2ed Edition, pages 155–165, NY: Wiley, 2007.
[4] Anders Drachen, Lennart E. Nacke, Georgios Yannakakis, and Anja LeePedersen. Correlation between heart rate, electrodermal activity andplayer experience in first-person shooter games. In Proceedings of the5th ACM SIGGRAPH Symposium on Video Games, Sandbox ’10, pages49–54, New York, NY, USA, 2010. ACM.
[5] Frank Fahy. Sound intensity. E & FN Spon, London, 1995.
[6] Jaroslav Flegr, Marek Preiss, and Jirı Klose. Toxoplasmosis-associateddifference in intelligence and personality in men depends on their rhesusblood group but not abo blood group. PloS one, 8(4):e61272, 2013.
[7] Stuart Ira Fox. Perspectives on human biology. Wm. C. Brown Pub-lishers, Dubuque, IA, 1991.
[8] J. D. Hoffman, J. D. Lee, and D. V. McGehee. Dynamic display of in-vehicle text messages: The impact of varying line length and scrollingrate. Proceedings of the Human Factors and Ergonomics Society AnnualMeeting, 50(4):574–578, October 2006.
[9] R. J. Irwin. EMMERTS LAW AS A CONSEQUENCE OF SIZE CON-STANCY. Perceptual and Motor Skills, 28(1):69–70, February 1969.
[10] James F. Juola, Alp Tiritoglu, and John Pleunis. Reading text pre-sented on a small display. Applied Ergonomics, 26(3):227–229, June1995.
64

[11] Jakub Jura and Jirı Bıla. Model of cognitive functions for descriptionof the creative design process with computer support: Improving of theinterpretation method for the computer conceptual re-design. In AliSanayei, Ivan Zelinka, and Otto E. Rossler, editors, ISCS 2013: Inter-disciplinary Symposium on Complex Systems, volume 8, pages 163–171.Springer Berlin Heidelberg, Berlin, Heidelberg, 2014.
[12] Andrea C Schalley. Cognitive modeling and verbal semantics a rep-resentational framework based on UML. Mouton de Gruyter, Berlin,2004.
[13] Robert J Sternberg, Karin Sternberg, and Jeffery Scott Mio. Cognition.Wadsworth/Cengage Learning, Belmont, Calif., 2012.
[14] Derek Viita and Alexander Muir. Exploring comfortable and acceptabletext sizes for in-vehicle displays. In Proceedings of the 5th InternationalConference on Automotive User Interfaces and Interactive VehicularApplications, AutomotiveUI ’13, pages 232–236, New York, NY, USA,2013. ACM.
[15] Adrian Voßkuhler. Ogama description (for version 2.5) : A softwareto record, analyze and visualize gaze and mouse movements in screenbased environments. pages 1–33, Freie Universitat Berlin, 2010. FreieUniversitat Berlin.
[16] Ernst Heinrich Weber, Ernst Heinrich Weber, Ernst Heinrich Weber,Helen E Ross, David J Murray, and Experimental Psychology Society.E.H. Weber on the tactile senses. Erlbaum (UK) Taylor & Francis,Hove, 1996.
[17] Christopher D. Wickens. An introduction to human factors engineering.Pearson Prentice Hall, Upper Saddle River, N.J, 2nd ed edition, 2004.
65

CVUT v Praze
2015
66


