WMRC Reports Waste Management and Research Center Enhancement of BTEX Biodegration Rates Unde Iron-Reducing Conditions Walton R. Kelly, Michael L. Machesky, Illinois State Water Survey RR·E80 January 1997 Electronic Version
Transcript
WMRC ReportsWaste Management and Research Center
Enhancement of BTEX Biodegration Rates Unde Iron-Reducing Conditions
Walton R. Kelly, Michael L. Machesky,
Illinois State Water Survey
RR·E80 January 1997
Electronic Version
About WMRC's Electronic Publications:
This document was originally published in a traditional format.
It has been transferred to an electronic format to allow faster and broader access to important information and data.
While the Center makes every effort to maintain a level of quality during the transfer from print to digital format, it is possible that minor formatting and typographical inconsistencies will still exist in this document.
Additionally, due to the constraints of the electronic format chosen, page numbering will vary slightly from the original document.
The original, printed version of this document may still be available.
Please contact WMRC for more information:
WMRC One E. Hazelwood Drive Champaign, IL 61820 217·333·8940 (phone)
www.wmrc.uiuc.edu
[J; WMRC is a division of the Illinois Department of Natural !~~!2;~
NATURAL ResourcesRESOURCES
WMRC ReportsOne E. Hazelwood Drive, Champaign, Illinois
EnhancementofBTEX Biodegration Rates Under Iron-Reducing Conditions
Walton R. Kelly Michael L. Machesky Illinois State Water Survey
JanuaryRR-aOe1997 ' Printed on Recycled Paper
RR-80
EnhancementofBTEX Biodegradation Rates
Under Iron-Reducing Conditions
Walton R. Kelly Michael L. Machesky
Illinois State Water Survey
Prepared for
Illinois Waste Management and Research Center One E. Hazelwood Drive
Champaign, Illinois 61820
Printed by the Authority of the State of Illinois 97/250
This report is part ofWMRC's Rechnical Report Series and has been subject to external scientific peer review. Mention of trade names or commercial products does not constitute endorsement or recommendation for use.
Table 6. Calculated Michaelis-Menten rate constants for all experiments. . . 37
Table A-I. Experimental data for sole-substrate experiments started in Jan/Feb, 1995. . ..... 47
1995. . 48
Table A-3. Experimental data for sole-substrate experiments started in March, 1995. . ..... 49
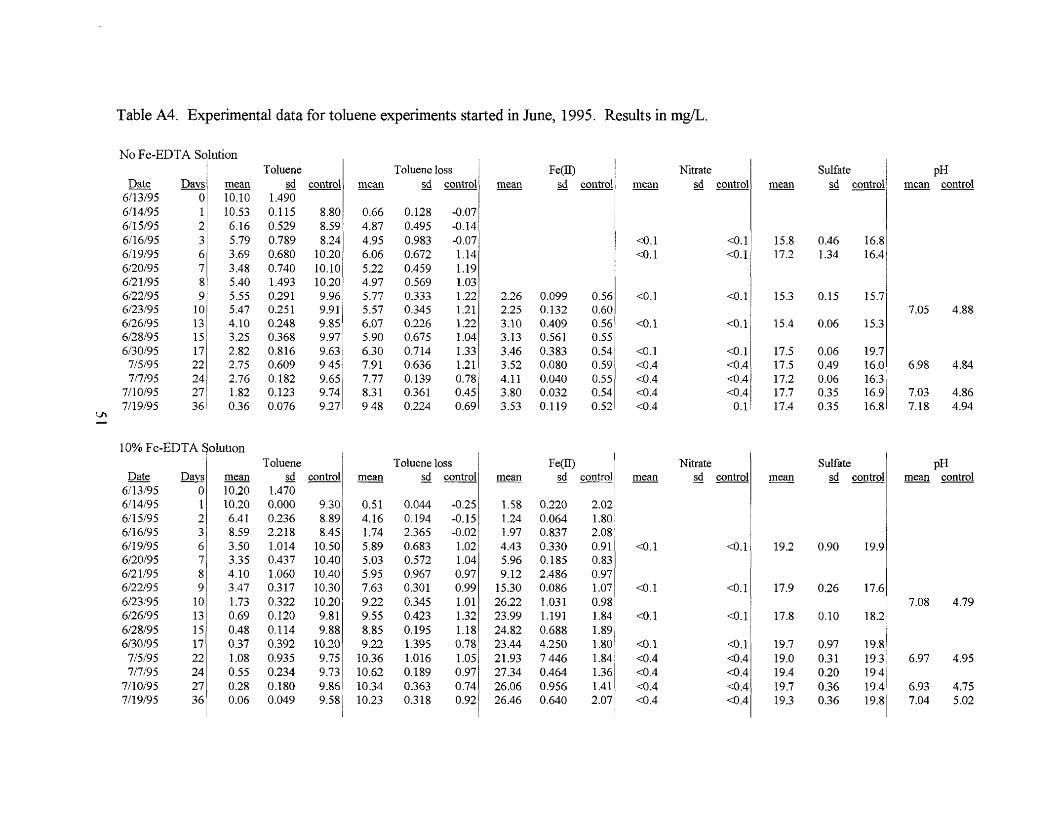
Table A-4. Experimental data for toluene experiments started in June, 1995. ..... . ..... 51
v
LIST OF FIGURES
Figure 1. Benzene and ferrous iron concentrations for live bottles from experiments started January 1995. .. . . . . . . . . . . . . . . . . . . . . . . . . . . . . . . . . . . . . .. . .. 14
Figure 2. Toluene and ferrous iron concentrations for live bottles from experiments started January 1995. . . . . . . . . . . .. 14
Figure 3. Ethylbenzene and ferrous iron concentrations for live bottles from experiments started January 1995. . . . . . . . . .. . 15
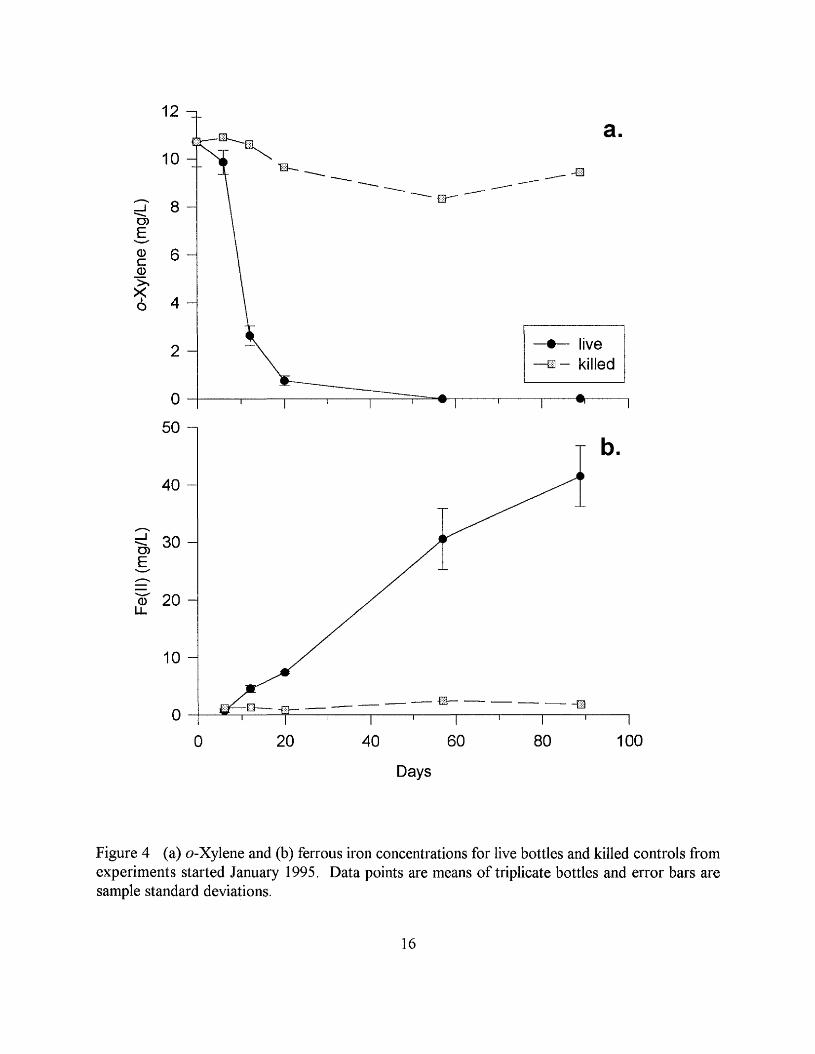
Figure 4. (a) o-Xylene and (b) ferrous iron concentrations for live bottles and killed controls from experiments started January 1995. . . . . . . . . . . . . . 16
Figure 5. Toluene and ferrous iron concentrations for syringe experiments February 1995. .. 18
Figure 6. (a) Benzene and (b) ferrous iron concentrations for live bottles and killed controls from experiments started March 1995. " 19
Figure 7. (a) Toluene and (b) ferrous iron concentrations for live bottles and killed controls from experiments started March 1995. . 20
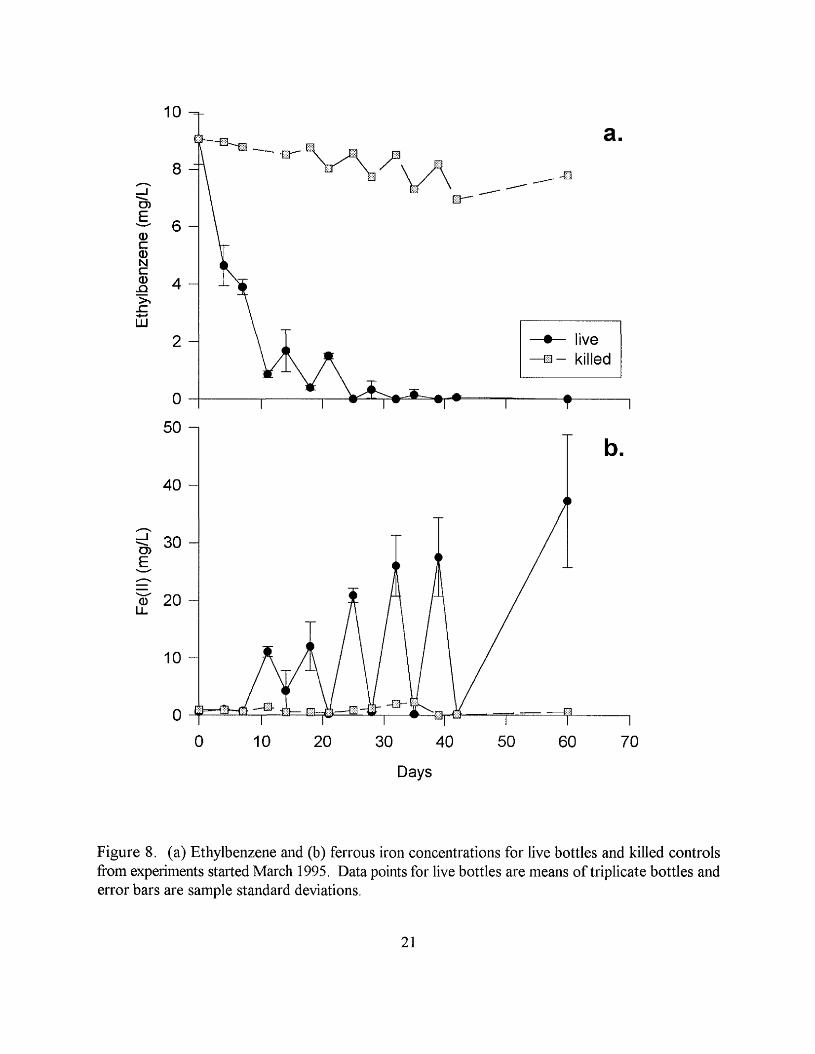
Figure 8. (a) Ethylbenzene and (b) ferrous iron concentrations for live bottles and killed controls from experiments started March 1995. .. . . .. . 21
Figure 9. (a) o-Xylene and (b) ferrous iron concentrations for live bottles and killed controls from experiments started March 1995. . 22
Figure 10. Toluene concentrations for live bottles and killed controls from Aged 100% Fe-EDTA solution experiments started June 1995 , 25
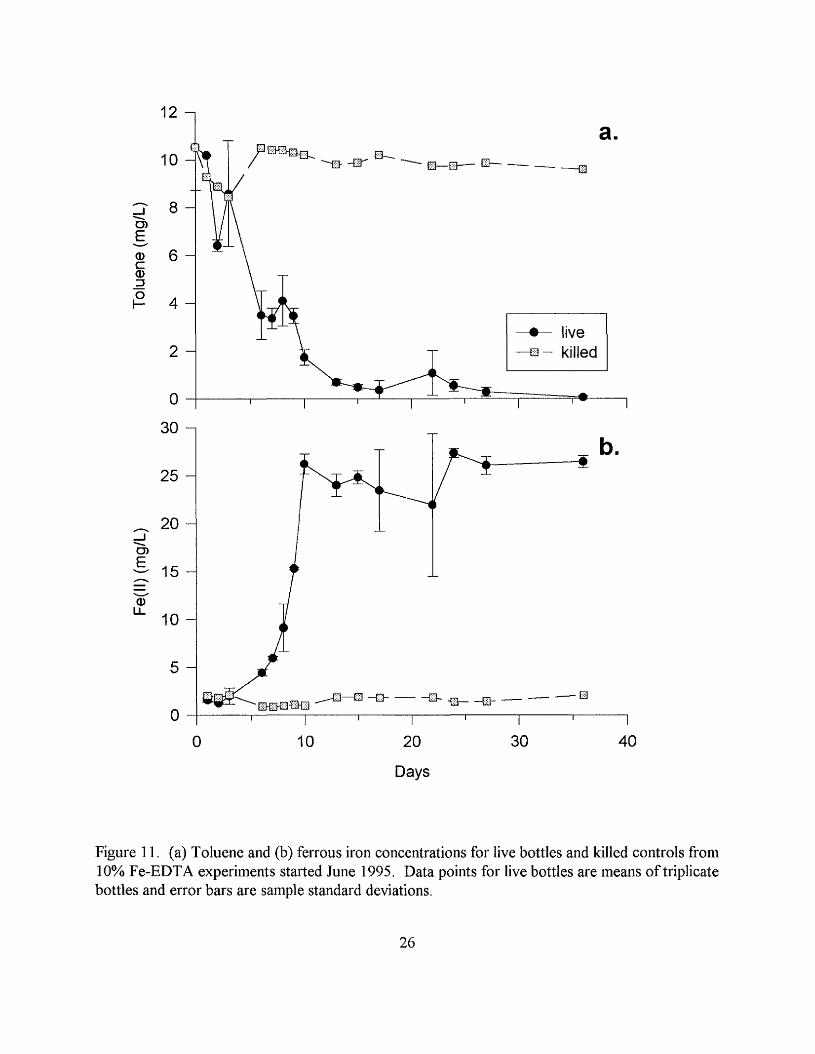
Figure 11. (a) Toluene and (b) ferrous iron concentrations for live bottles and killed controls from 10% Fe-EDTA experiments started June 1995. . 26
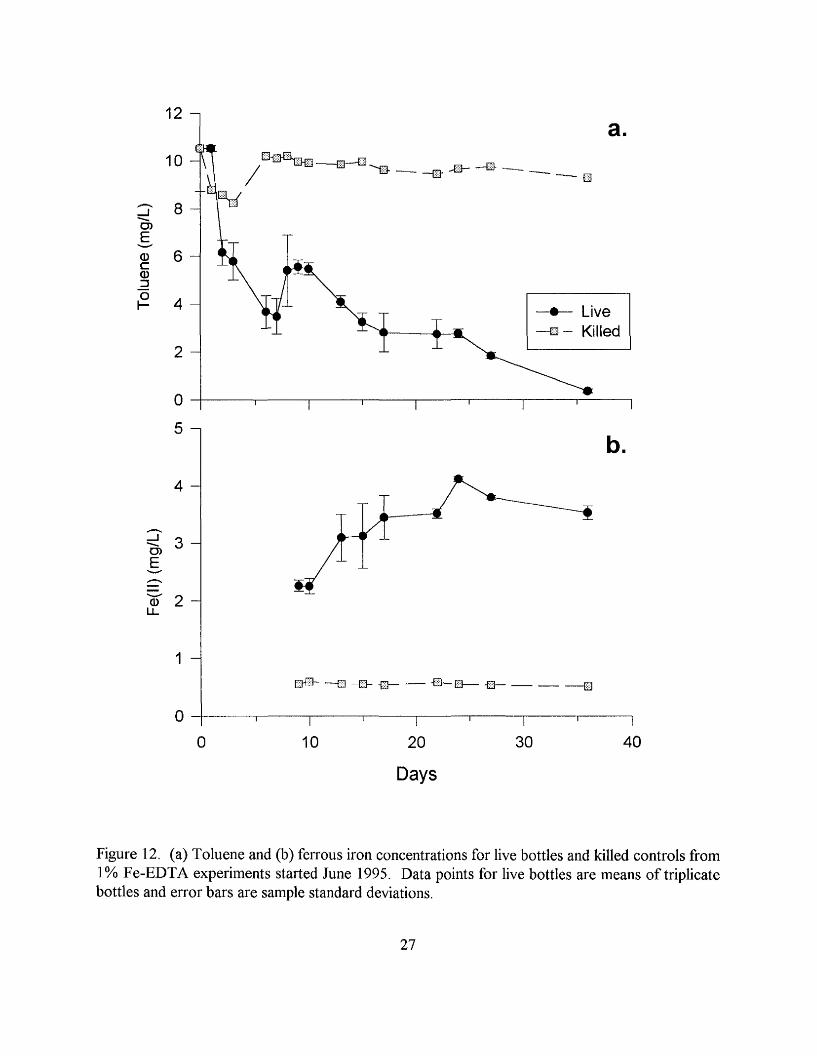
Figure 12. (a) Toluene and (b) ferrous iron concentrations for live bottles and killed controls from 1% Fe-EDTA experiments started June 1995. 27
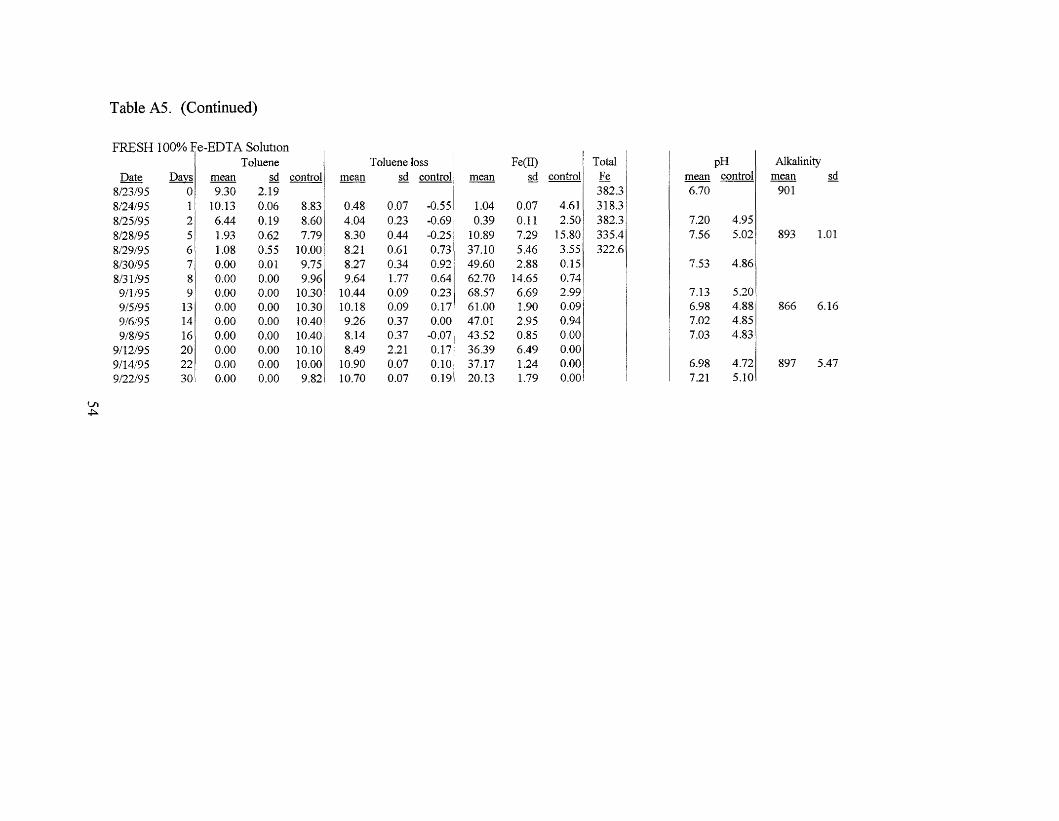
Figure 13. (a) Toluene and (b) ferrous iron concentrations for live bottles and killed controls from Fresh 1000/0 Fe-EDTA experiments started August 1995 , 29
Figure 14. (a) Toluene and (b) ferrous iron concentrations for live bottles and killed controls from Aged 100% Fe-EDTA experiments started August 1995. . . . .. .,. . 30
Vi
Figure 15. (a) Toluene and (b) ferrous iron concentrations for live bottles and killed controls from No Fe-EDTA experiments started August 1995. .. .. . 31
Figure 16. Benzene, toluene, ethylbenzene, and a-xylene concentrations for live bottles from mixed substrate High Fe-EDTA experiments started November 1995. .. . .. 33
Figure 17. Toluene concentrations as a function of time in experiments using various media (from Saliga, 1996). . . . .. . . . . . . . . . . .. 33
Figure 18. End-product distribution Of 14C (from Saliga, 1996). . 35
Vll
ACKNOWLEDGMENTS
A number ofpeople made important contributions to the successful completion of this project. Mark Saliga did much of the microcosm preparation, sampling, and Fe(II) analysis, in addition to a related thesis project. Dr David Freedman, Mark's advisor, provided valuable help in interpreting some of the data, especially with regards to the bioenergetics model. A number of analysts were involved at one time or another. David Green, Dan McGinness, and Jack Cochran performed the BTEX analyses at HML. Joe Karny performed most of the alkalinity titrations. Dan Webb, Lauren Sievers, and Saada Hamdy, under the direction ofLoretta Skowron, performed inorganic analyses in the ISWS analytical laboratories. Dr. Marvin Piwoni ofHl\1L provided laboratory space at HML and also helped with some early sampling problems. Bryan Coulson directed the drilling at the field site. Special thanks to Rick Frendt ofEngineering-Science, Inc, for permission to sample at the field site. Three anonymous reviewers provided helpful comments that improved the report.
viii
ABSTRACT
This project was designed to examine the efficacy of stimulating iron-reducing bacteria to biodegrade BTEX in situ. We prepared a series of anoxic microcosms using samples taken from a contaminated aquifer to investigate reaction processes and rates in the laboratory. Bacterial culture and the compound of interest were added to an enrichment solution that had been filtered and sparged ofOl . Three live bottles and one killed control were sampled at each time step.
All four compounds degraded under the experimental conditions of this study. Calculated rate constants give relative disappearance rates of: Toluene> ethylbenzene > a-xylene> benzene.
In most of the experiments, the degradation was accompanied by increases in Fe(II) concentrations, strong circumstantial evidence for bacterial iron reduction. Production of Fe(I1) tended to lag behind the degradation ofthe compound by a few days. The amount ofFe(Il) produced was positively correlated with the relative degradation rates of the compounds; i.e, the amount of Fe(I!) produced was toluene> ethylbenzene > a-xylene> benzene.
However, in some of the experiments, little or no Fe(Il) production was observed. In these experiments, BTEX degradation occurred more slowly, and lower redox anaerobes, possibly fermenters, were presumed to be responsible.
Based on the results of this study, the monoaromatic hydrocarbons, benzene, toluene, ethylbenzene, and a-xylene, biodegrade under iron-reducing conditions, and EDTA is effective at keeping ferric iron in solution and available to microorganisms In situ biodegradation of these compounds coupled with iron reduction appears to be a promising bioremediation technique.
IX
1 INTRODUCTION
1.1 Statement of Problem
Some of the most common organic pollutants found in ground water are the monoaromatic hydrocarbons, including benzene, toluene, ethylbenzene, and the xylene isomers (BTEX) (Barker et al., 1987). Sources include spillage or leakage of gasoline, leachate from landfills and hazardous waste sites, and contamination from storage or disposal facilities at industrial sites. All of these compounds are known or suspected carcinogens and are regulated by the U S. Environmental Protection Agency (Federal Register, 1987; 1991) (Table 1). The fate of monoaromatic compounds in the environment is thus of considerable consequence.
A number of remediation strategies have been applied at sites where the subsurface has been contaminated by organic compounds. One technique that has shown considerable promise in recent years is in situ bioremediation (Nyer, 1992) The basic concept of in situ bioremediation is to establish conditions in the subsurface that are favorable to bacteria capable of degrading the contaminants of interest. The injection ofelectron acceptor compounds (compounds that are reduced as organic chemicals are oxidized) and essential nutrients which may be lacking in the subsurface environment is often done to promote biodegradation reactions.
Most of the BTEX compounds are known to biodegrade rapidly under aerobic conditions (e.g., see Ribbons and Eaton, 1982). Unfortunately, oxygen is almost always absent in aquifers contaminated with significant amounts of organic compounds. The direct introduction of oxygen to a contaminated aquifer to stimulate aerobic biodegradation is inefficient because the solubility of oxygen in water is low «10 mgIL at typical ground-water temperatures) Attempts to increase the
Table 1. Maximum contaminant levels (MCLs) promulgated by the USEPA and aqueous solubilities for monoaromatic hydrocarbon compounds. Values in mg/L. Solubility data from Verschueren, 1983
compound-J MCL Aq Solubility (20°C)
Benzene 0005 1780
Toluene 1 515
Ethylbenzene 0.7 152
Xylenes (total) 10 175*
* v-xylene
amount ofoxygen available for bacteria by injecting hydrogen peroxide (H20 2) have met with limited success due to negative side effects, including H20 2 toxicity to microorganisms at fairly low concentrations, decomposition of H20 2 by bacteria thus inhibiting its transport, and oxidation of dissolved iron, causing iron oxides to precipitate, clogging the screens ofwells used for injection (Lee et al , 1988; Pardieck et aI., 1990).
The use ofanaerobic electron acceptors avoids the solubility and toxicity limitations inherent in the use of oxygen. A number of researchers and operators have added nitrate to contaminated systems to enhance denitrii)ring conditions (e.g., Downs et aI., 1989; Lemon et aI., 1989). However, results have been mixed. Some compounds, such as toluene, respond well to this treatment and are rapidly removed. Other compounds, including benzene and ethylbenzene, are often recalcitrant under these conditions There are some reported field situations where these recalcitrant compounds degrade under denitrifying conditions (e.g, Major et aI., 1988), but in most laboratory and field cases no decrease in concentrations for one or more of these compounds are reported (e.g, Evans et al., 1991; Hutchins et aI., 1991, Acton and Barker, 1992; Barbaro et aI., 1992; Patterson et aI., 1993). An additional drawback to using nitrate is that it itself is a ground-water contaminant.
An alternative to oxygen and nitrate for the terminal electron acceptor that has received little attention is ferric (Fe(III» iron Ferric oxyhydroxide minerals and mineral coatings are abundant in many aquifers and iron-reducing bacteria are known to be active in both contaminated and uncontaminated aquifers where oxygen is depleted (e g , Fischer, 1988, Chapelle and Lovley, 1992; Baedecker et aI., 1993; Albrechtsen and Christensen, 1994). The reduction of iron is a relatively energetic reaction mediated by microbes in ground water (less energetic than oxygen reduction and denitrification; more energetic than sulfate reduction and methanogenesis). Recent work has suggested that pure cultures of iron-reducing bacteria are able to degrade some monoaromatic compounds (Lovley and Longeran, 1990; Lovley et aI., 1994). There is also evidence that BTEX degrades in conjunction with iron reduction at some contaminated sites. Baedecker et ai. (1993) present evidence that benzene and toluene are completely degraded under iron-reducing conditions in a contaminated aquifer in Minnesota. Borden et aI. (l995) also observed the disappearance of BTEX in a zone where iron reducing bacteria were active in an aquifer contaminated with petroleum.
A major obstacle to enhancing iron-reducing conditions in situ is the unavailability and immobility ofmost forms offerric iron. While the majority of ferric iron is present in the solid phase as oxyhydroxides, it can be present in more mobile and available forms. For example, significant amounts of iron in colloidal form may be present in many ground waters (Stumm, 1993). In some systems, certain types of iron colloids may be transported at rapid rates (Gschwend et aI., 1990; PuIs et aI., 1993). Chelating agents such as ethylenediaminetetraacetic acid (EDTA) which are often found at waste disposal sites, readily complex ferric iron as well as other metals and these complexes are generally transported at more rapid rates than unchelated metal ions (Jardine et aI., 1993). EDTA is fairly long-lived in subsurface environments (Palumbo et aI., 1994) Recent research has demonstrated that NTA and especially EDTA chelated ferric iron significantly enhance aromatic hydrocarbon degradation rates compared to solid forms of ferric iron (Lovely et ai, 1994; 1996).
2
1.2 Thermodynamic and Bioenergetic Considerations
T·he mineralization, i.e. complete degradation to CO2, of the monoaromatic compounds involves the transfer ofbetween 30 (benzene) and 42 (ethylbenzene and xylene) electrons under ironreducing conditions. The overall mineralization reaction for toluene is'
(1)
Thus for every mole of toluene mineralized under iron-reducing conditions, 36 moles offerric iron should be reduced to ferrous iron. Note also that a considerable quantity of protons are produced by the reaction, thus there is the potential for a significant decrease in pH.
Biodegradation reactions are never 100 percent efficient, however. At least some of the carbon liberated during degradation is converted into biomass and waste products. Because biodegradation reactions are actually a series of reactions in which intermediate organic compounds are produced, these intermediate compounds may persist in solution and limit the overall reaction rate In addition, anaerobic biodegradation tends to be much less efficient that aerobic biodegradation, with intermediates tending to be more persistent.
One intermediate compound that has been observed during biodegradation of toluene under iron-reducing conditions is benzoate (Lovley and Lonergan, 1990). Conversion of toluene to benzoate requires a fraction ofthe electron transfer (one-sixth assuming same percentage of biomass formed) needed for complete mineralization:
(2)
The disappearance oftoluene implies only that it has been converted to some intermediate compound, not necessarily to CO2, For this reason and the fact that some biomass and waste products are produced, we would expect the production of ferrous iron to be less than that predicted by reaction (1). In addition, because we used a mixed culture in our study and did not preclude the use of electron acceptors other than iron, it is possible that other electron acceptors were utilized for parts of the reaction sequence, further limiting the amount ofFe(II) produced.
A more realistic model for estimating microbially mediated reaction stoichiometries is the bioenergetic model first proposed by McCarty (1975). The bioenergetic model incorporates cell growth and maintenance in addition to chemical thermodynamics. Reaction (1) written in terms of the bioenergetic model would be'
(3)
3
where the stoichiometric coefficients i, j, and k are a function of how much carbon is transferred to biomass during the reaction.
The bioenergetic model monitors total electron use and assumes that for every electron equivalent (eeq, transfer ofan electron in a half-reaction) from an electron donor (usually the organic substrate) used for cell synthesis, a certain number (A) ofeeq is used in respiration. This value A can be determined using thermodynamic free energy relations along with several assumptions, and from this a reaction yield and amount of electron acceptor required to produce this yield can be calculated. A complete discussion of the model and its inherent assumptions is contained in McCarty (l975).
The amount of ferric iron needed to oxidize a mole of the aromatic compounds calculated using the bioenergetics model is less than one-half that predicted by reaction (1) and its equivalents for the other aromatic compounds (Table 2). The significance of the stoichiometric coefficients reported in Table 2 is that these are the quantities of Fe(II) we should expect to observe being produced ifthe compounds are degraded under iron-reducing conditions alone and none of the Fe(II) produced precipitates out of solution.
1.3 Objectives
This project was designed to examine the efficacy of stimulating iron-reducing bacteria to biodegrade BTEX in situ. The overall research objective was to determine ifbacteria cultured from a contaminated aquifer could biodegrade BTEX under iron-reducing conditions. We hypothesized that naturally occurring bacteria in ground water pre-exposed to BTEX are capable of degrading BTEX under iron-reducing conditions (e.g., see Baedecker et aI., 1993) and that reaction rates can be optimized by addition of ferric iron compounds (Fe-EDTA) and nutrients. In order to evaluate this hypothesis, we prepared a series ofanoxic microcosms using samples taken from a contaminated aquifer to investigate reaction processes and rates in the laboratory
Table 2 Amount of Fe(II) production required to oxidize BTEX as determined by the bioenergetics model.
~-
Compound mol Fe(II)
produced per mol compound
mgIL Fe(II) produced per
mgIL compound f----------
Benzene 12.5 8.92
Toluene 17.7 9.30
Ethylbenzene 17.8 9.35
v-Xylene 15.2 9.20
4
2 METHODOLOGY
2.1 Field Sampling
The bacterial inoculant used in the experiments was taken from aquifer material collected from the anoxic zone at a site contaminated with BTEX. The field site is located near Kankakee where an underground gasoline pipeline break occurred several years ago, releasing tens of thousands of gallons of petroleum into the subsurface. At the site, a thin layer of sand between 6 and 8 feet thick underlies the soil and overlies fractured dolomite bedrock. The lower portion of the sand is normally under saturated conditions. A considerable amount of remediation work has been done at the site, which is located in a farm field "Land farming," in which contaminated soil and aquifer material is exposed at the sutface in order to enhance volatilization and biodegradation of petroleum products, was done over a large section of the field.
A number of monitoring wells have been completed in both the surficial aquifer and the dolomite bedrock in order to define the extent of the plume and monitor its movement and the effect ofremediation efforts Each well contains a dedicated bailer. Preliminary water samples were taken on September 8, 1994, from five wells. Three were located within the main body of the plume (wells 4, 28, and 33), one was in an area near the edge of the plume (8), and one was a background well (18). The samples from the wells in the plume had very high levels ofBTEX, in some instances over 100 mg/L (Table 3). These samples also exhibited more reducing conditions than the background sample, as evidenced by higher concentrations of reduced species (Fe2+, Mn2
+, NH4+) and lower concentrations of oxidized species (N03-, 8°4
2-). Alkalinity concentrations were at least five times
greater than background in the contaminated samples, suggesting that production of CO2 and possibly organic acids due to biodegradation of organic contaminants was occurring. Other differences in aqueous chemistry in the contaminated samples compared to the background chemistry include elevated levels of Ca, Mg, Na, CI, total dissolved solids (TDS), Si, Ni, Zn, and non-volatile organic carbon (NVOC) and decreased levels ofP.
Both water-quality and qualitative evidence indicate that iron reduction occurs in the contaminated portion of the aquifer. Dissolved iron concentrations in samples from contaminated wells were approximately 25 to 200 times higher than in the background well (Table 3) In addition, the dedicated bailers in wells located in the contaminant plume were stained with iron oxyhydroxide precipitates. This suggests iron reduction in the aquifer followed by re-oxidation due to influx of O2
into the well bores and precipitation of ferric iron onto the bailers.
Drilling and core sampling were done at the field site using a hydraulic push rig on November 8, 1994. Ten holes were drilled in one area near a contaminated well. Samples were collected in plastic core tubes whose ends were immediately wrapped in plastic and sealed to prevent oxygen contamination. All samples were collected from the surficial sand aquifer, which is approximately 6.5 feet thick in the drilled area. Upon return to the Water Survey, the core samples were stored under a nitrogen atmosphere before being transferred to mason jars in the glove box the following morning. Only inner sections of the core material were saved, outer sections were removed and discarded.
5
Table 3. Water chemistry results from Kankakee field site, August 31, 1994. Concentrations in mg/L except pH (pH units)
WELL #
Constituent 33 04 28 08 18
Ca 111 766 133 906 193
Mg 45 1 35.4 44.5 370 8.21
Na 773 403 247 340 3.82
K 321 314 313 328 459
CI 189 210 415 161 35
804 123 21 165 597 237
Alkalinity (CaC03) 458 327 521 328 680
N03-N 003 <.0.02 0.09 <002 3.35
NOl-N <003 <0.03 <003 <003 <0.03
NH4 016 003 043 013 <002
F <01 o 1 <0.1 <01 <01
Fe 0332 1 52 262 103 0014
Mn 0.637 0098 1 11 0.187 0002
Al 0.218 0015 0.012 0014 0018
As <005 <005 <0 05 <0 05 <0,05
Ba 0074 0044 0.143 0.055 0019
B 0053 0.006 0.030 0.016 0029
Cd <0004 <0,004 <0004 <0004 <0004
Cr 0.010 0005 0003 0003 0004
Cu 0010 <0,003 <0 003 <0003 0004
Pb <0014 <0014 <0014 <"0014 <0,014
Hg <002 <"002 <002 <002 <0.02
Ni 0029 0021 0.010 0010 <0008
Se <"0 OS <0 OS <0.05 <005 <005
8i 774 547 683 5.28 462
Ag <0002 <0 002 <0 002 <0 002 <0002
Zn 0487 0136 0025 0032 0016
Be <0001 <0001 <0 001 <0001 <0001
Co <0004 <0004 <0004 <0.004 <0004
Li 0006 <0003 <0003 <0003 <0 003
Mo <0007 <0007 <0.007 <0007 <0007
P <009 <009 <0.09 <009 028
8 823 4.48 108 227 114
Sb <011 <011 <011 <011 <011
8n <002 <0.02 <002 <0 02 <002
Sr 0134 0078 0220 0085 0050
Ti <0002 <0 002 0002 <0.002 <0002
TI <013 <013 <013 <013 <013
V <0002 <0002 <0002 <0002 <0002
pH (lab) 740 749 680 679 727
TDS 510 365 614 427 143
NVOC 148 70 13.3 18 1.7
benzene 990 182 9.96 <0 0005 <0 OOOS
toluene 148 ISS 787 00266 <00005
ethylbenzene 421 705 1.81 00018 <00005
"ylenes 179 301 7 18 00057 <0001
6
2.2 Laboratory Methods
2 2.1 Preparation ofExperimental Solutions
2.2.1.1 Enrichment Solutions
The enrichment solutions are the solutions containing inorganic salts, nutrients, and Fe-EDTA as the Fe(III) source that were prepared for the experiments. All other solutions were made from this starting solution Three concentrations of Fe-EDTA in the enrichment solutions were used during this project: (1) concentration stoichiometrically required for complete mineralization ('" 6 mM) of the aromatic compounds (identified as 100% Fe-EDTA solution), (2) 10% of this concentration, and (3) no Fe-EDTA present. Complete chemical analyses of these solutions are reported in Table 4. The chemical composition of the 100% Fe-EDTA solution was modified from Lovley and Phillips (1988) The composition of the 100/0 Fe-EDTA and No Fe-EDTA solutions is identical to the 1000/0 Fe-EDTA solution except that they contain one-tenth the amount of Fe-EDTA or no Fe-EDTA, respectively The solution pH was well buffered by high levels of bicarbonate and phosphate
Solutions were made by dissolving high-purity salts in deionized water (DIW). Salts were weighed out on a balance and added to the appropriate quantity of DIW. A magnetic stir bar was placed in the solution container and the solution was stirred for at least 48 hours prior to the start of experiments. In general, fresh enrichment solution was prepared prior to the start of a set of experiments, but on occasion, "aged" 100% Fe-EDTA solution (6 weeks or older) was used. Because the age ofthe solution did appear to affect reaction rates (see below), we refer to the older solution as Aged 100% Fe-EDTA solution.
Prior to using enrichment solutions for experiments or preparing other solutions, the solution was passed through a 0 2 Jlm filter and then sparged with high purity N2 gas (99.999% pure). The solution was sparged 45 minutes per L, which has been shown to be sufficient to remove all dissolved O2 (DO) (Butler et aI., 1994) Measurement ofDO after sparging using a DO meter supported this finding. Sparging expelled CO2 from solution, causing the pH to rise from approximately 6.70 to between 8.20 and 8.40. The pH was returned to approximately 6.70 by adding concentrated HCI, generally less than 5 mL per 2 L of solution. At this point, the solutions were transferred to the glove box, where all subsequent manipulations took place Before working in the glove box, it was evacuated by vacuum and filled with N2 gas passed over a high capacity gas purifier (Supe1co 2·3800) to remove trace amounts of 02' Evacuation and re-filling were done three times. After the final evacuation, the box was re-filled with N2 prior to experimental manipulations.
2.2.1.2 Saturated Solutions
Saturated solutions are solutions to which one ofthe aromatic organic compounds was added so that the concentration of that compound in the solution approached its aqueous solubility (Table 1). These solutions were prepared prior to a set of experiments using the appropriate enrichment solution. Pure aromatic compound was added to between 100 and 1000 mL of pre-reduced
7
enrichment solution in a volumetric flask in the glove box in an amount that exceeded that compound's aqueous solubility by 2 to 3 times The solution was stirred with a magnetic stirrer
Table 4. Composition of experimental solution for BTEX experiments under iron-reducing conditions. Concentrations in mmol/L
Constituent 100%
Fe-EDTA 10%
Fe-EDTA No
Fe-EDTA
Ca 0.687 0687 0.687
Mg 0.122 0.122 0.122
Na 40.48 34.90 34.28
K 1 34 1.34 1.34
CI 30.95 30.95 30.95
S04 0408 0.185 0.160
HC03 29.76 29.76 29.76
Fe(III) 6.20 0.620 0.0
Fe(II) 0.0036 00036 0.0036
EDTA 6.20 0.620 0.0
Mn 0.027 0.027 0.027
HZP04 4.35 435 4.35
NH4 28.04 28.04 28.04
AI 0.00032 0.00032 0.00032
B 0.0016 0.0016 00016
Co 0.011 0011 0011
eu 0.00052 000052 0.00052
Mo 0.0012 0.0012 00012
Ni 0.0010 0001 0.001
Zn 0.0068 0.0068 0.0068
8
between 60 and 72 hours in the glove box. After stirring, the flasks were allowed to sit to allow all free product to rise to the surface This free product was then carefully removed with a syringe. Aqueous samples were taken for analysis and the remaining solution put into glass bottles or syringes with no head space A dilution factor was calculated based on the measured compound concentration. The saturated solutions were diluted with the appropriate enrichment solution to obtain the desired initial compound concentration for the experiments. Initial concentrations are reported in the appendix. A separate bottle of saturated solution was sacrificed for each dilution to avoid volatilization losses.
2.2.1.3 Bacterial Culture Solution
The bacterial culture solution is enrichment solution that was inoculated with bacteria from the field site and used as the source ofbacteria in the microcosms. This was originally done by adding contaminated aquifer material to enrichment solution along with one of the aromatic compounds. These solutions were replenished by adding solution remaining in experimental bottles after they were sacrificed for analysis.
2.2.2 Preparation ofMicrocosms
All manipulations were performed in a glove box. Saturated solutions were prepared for each aromatic compound used in a particular experiment. Experiments were started by adding 2 mL of bacterial culture solution to each 60-mL bottle (4 mL per 120-mL bottles). Experimental solution was prepared by diluting the saturated solution with filtered, sparged enrichment solution in aIL volumetric flask to give a final compound concentration in solution of approximately 15 mgIL. During experimental preparation, volatilization losses reduced initial concentrations to less than this value, but typically> 10 mgIL. A sample was taken from the volumetric flask for analysis after manual mixing. Sequentially numbered serum bottles were then completely filled with the experimental solution (no head space), capped with a Teflon-lined septa, and crimp sealed. The volumetric flask was stoppered when not being poured. After eight 60-mL bottles (or four 120-mL bottles) were filled and sealed, another sample was taken from the volumetric flask for compound analysis. Then the process was repeated, with a third sample from the 1 L flask taken for compound analysis after another set ofbottles was filled Any solution remaining in the flask was then discarded. The purpose of the multiple samples was to monitor volatilization losses as headspace increased in the volumetric flask so that initial concentrations in individual serum bottles could be accurately estimated. Experimental solution was repeatedly prepared in the 1 L volumetric flask until all serum bottles were filled and sealed. Bottles were stored at room temperature out of the glove box until sampled
Killed controls were prepared by adding 2 mL of formaldehyde to each bottle before adding the enrichment solution.
Combined substrate experiments were those in which all four monoaromatic compounds were added to each experimental bottle. Saturated solutions were prepared in the same manner as
9
described above and added to produce initial concentrations between 20 and 30 percent of the concentrations in the sole-substrate experinlents.
Compound and solution identities for all of the experiments are listed in Table 5.
22.3 Most Probable Number Analysis
We originally intended to make direct bacterial counts on stained samples to estimate biomass production. However, the microscope that we had received permission to use was out of service for the duration of this study due to laboratory renovations. In lieu of direct counts, we elected to
Table 5. Experimental conditions "Aged" Fe-EDTA solutions were at least 6 weeks old; other solutions made less than 2 weeks prior to onset of experiments
Start Date Aromatic Substrate Experimental Solution
1/23/95 Benzene 100% Fe-EDTA
1/24/95 Toluene -
100% Fe-EDTA
2/7/95 Ethylbenzene 100% Fe-EDTA
2/8/95 a-Xylene 100% Fe-EDTA
2/14/95 Toluene 100% Fe-EDTA
3/8/95 Benzene 100% Fe-EDTA
3/9/95 Toluene 100% Fe-EDTA
3/9/95 Ethylbenzene 100% Fe-EDTA
3/9/95 a-Xylene 100% Fe-EDTA
6/13/95 Toluene Aged 100% Fe-EDTA
6/13/95 Toluene 10% Fe-EDTA
6/13/95 Toluene No Fe-EDTA
8/23/95 Toluene Aged 100% Fe-EDTA
8/23/95 Toluene 100% Fe-EDTA
8/23/95 Toluene No Fe-EDTA
1115/95 All four compounds 100% Fe-EDTA
10
perform some most probable number (MPN) analyses to estimate the number of iron-reducing bacteria in the experimental bottles. MPN analysis was done for the Fresh 100% Fe-EDTA experiments started in August 1995. A modification of the methods of Tiedje (1982) and Essaid et al. (1995) was used. Culture solution was filtered and sparged in the previously described manner and 9 mL was added aseptically to thirty sterilized test tubes in the glove box. One mL of sample from a live serutn bottle was added to each offive replicate test tubes to make a 10-1 dilution, and the suspensions were mixed with a vortex mixer. One mL from each of these suspensions were added to five more test tubes to make a 10-2 dilution. A total of six serial dilutions of five replicate test tubes each were done in this manner. After the dilutions were completed, 0.02 JlL of toluene were added to each test tube, which were immediately sealed with a Teflon-lined cap and mixed The test tubes were then stored in the dark. NrPN sets were prepared twice, at the beginning of the experiments and after 9 days, at which point toluene was below detection and Fe(II) concentrations were almost 70 mgIL. The MPN tubes were sampled for Fe(II) analysis after a two-week incubation period. Concentrations ofFe(II) greater than 2 mgIL (controls were approximately 1 5 mgIL) were considered to be positive, and bacterial numbers were determined using Cochran's (1950) tables.
2.2 4 Sampling and Analysis
Three live bottles and one control were sacrificed at each time step in the glove box. The bottle cap was removed with a decrimper, and solution immediately poured into an 8-mL glass vial with no head space for aromatic compound analysis. Samples were then taken for Fe(II) analysis by removing about 10 mL of sample via a glass syringe with steel needle and passing the sample through a 0.45 Jlm syringe filter into a 8-mL glass vial containing 200 ilL of concentrated HC!.
Samples for additional analyses were taken on a non-routine basis. pH analyses were done directly in the opened bottle by inserting a pH electrode that had been calibrated with pH = 7 and pH = 4 buffers. Samples for nitrate and sulfate analysis were taken by glass syringe and passed through a 045 Jlm syringe filter into a 8-mL glass vial with no preservative. Solution was poured directly into 30- or 60-mL bottles for alkalinity titrations. All samples were kept at 4 °C until analysis.
Samples for organic compound analysis were given to the HML analytical technician immediately after sampling was completed. The aromatic compounds were analyzed at HML by purge-and-trap gas chromatography (GC). Between 0.5 and 6 mL of sample were diluted to 100 mL with nanopure DIW, then poured into 40-mL VOA vials with no head space. Analysis was usually performed the same day samples were taken. When that was not possible, the VOA vials were refrigerated overnight. Samples, blanks, check standards, and spikes were loaded into a Tekmar ALS 2050 autosampler, which kept samples at 4°C. Five mL of sample was fed into a Tekmar LSC purge-and-trap unit, where it was mixed with an internal standard (fluorobenzene) and purged for 7 5 minutes onto the trap. The trap was heated to 245°C, and the flow of helium was reversed through the trap for one minute Sample was then transferred to a Hewlett-Packard 5890 GC, which had a 75-m long column with 0 543-mm inside diameter (J & W DB624) The detector was a photoionization detector. Data were collected on a workstation using Waters Maxima 820 chromatography software.
11
Fe(ll) samples were refrigerated until analysis, which was almost always done within 7 days. Fe(II) concentrations were determined by a modified version of Standard Method 315 B (Amer. Public Health Assoc., 1993.). Six hundred I-lL of 10/0 phenanthroline solution and 1 mL ofNH4
acetate buffer were added to between 1 and 5 mL of sample, then DIW was added to a final volume of 10 mL. Equilibrium calculations indicated that Fe-EDTA complexes were not stable in the presence of the phenanthroline reagent Standards were made with the same solutions used in the experiments. Developed color was measured on a Hitachi U-2000 double beam spectrophotometer at a wavelength of 510 nm. The detection limit was approximately 0.05 mglL.
Total iron and EDTA analyses were performed on separate aliquots from the Fe(I!) sample vials. Total iron analyses were performed using flame atomic absorption at a wavelength of 248 nm. The matrix included 0.3% HN03 and 2 x 10⁻⁴ M EDTA EDTA was analyzed spectrophotometrically using the method ofBhattacharyya and Kundu (1971). Absorbance values were measured at 305 and 263 nm
Analysis for nitrate and sulfate was performed using ion chromatography at the ISWS analytical laboratories by ISWS technicians. Analysis was done within 48 hours of sampling. Detection limits were either 0 1 or 0.4 mglL for N03-N and 0.9 mglL for sulfate.
Alkalinity titrations were performed by an ISWS technician using a modified gran analysis technique. Ionic strength adjustor (IN NaCl) was added to between 30 and 60 mL of sample (depending on amount available) in a ratio of 1 mL per 100 mL of sample A calibrated pH electrode was placed into the sample, which was continuously stirred, and a pH reading taken. Acid (0.25 N HCI) was titrated into the sample in suitable increments and the resulting pH readings recorded. Acid was added until a final pH of approximately 3.0 was reached.
Compound disappearance data from the experiments were fit to the Michaelis-Menten model, which is an empirical model of substrate removal commonly used for biodegradation reactions:
dS vmaxS - = (4)dt K + S
where S is the substrate (organic compound) concentration, t is time, V is the maximum substrate max
removal rate, and Km is a half-saturation constant. The constants V and K were calculated using max m
the nonlinear regression module in the graphical software SigmaPlot®, version 2.0. SigmaPlot® uses the Marquardt-Levenberg algorithm to determine the coefficients that give the "best fit" between the model and the data
Aqueous speciation and mineral saturation states were evaluated using the thermodynamic geochemical computer code MINTEQA2 (Felmy et aI., 1984).
2.2 5 Additional Experiments
Additional experiments to help interpret results were performed at the University of Illinois
12
Environmental Engineering laboratories as part ofthe thesis research ofMark Saliga, master's degree candidate in that department. Complete methods and results are reported in his thesis (Saliga, 1996). Experiments he performed that will be reported herein include microcosms using various solution compositions, principally to investigate sulfate reduction reactions, and an experiment using radiolabeled toluene to determine the end-product distribution of the biodegraded carbon.
3 RESULTS
Each set of experiments is reported in a separate section below Complete analytical results are reported in the Appendix
3.1 Sole-Substrate Serum Bottle Experiments (started January 1995)
A set ofbottles was prepared for each compound (benzene, toluene, ethylbenzene, o-xylene) as sole substrate in this set ofexperiments. Samples were taken approximately every two weeks For the B, T, and E bottles, controls were prepared by not adding bacterial culture to the bottles. However, it became apparent during sampling and analysis that compounds were disappearing in many of the controls. Killed controls (adding formaldehyde) were prepared for the o-xylene experiments to prevent the possibility of biodegradation in the controls
Results for this set of experiments are shown in Figures 1 through 4. Points for the live experiments are the means of the triplicate samples and the error bars represent the sample standard deviation
All four compounds degraded to below detectable levels «0 05 mgIL) after approximately 2 months Toluene degraded especially rapidly, being absent at the first sample time about 2 weeks after preparation of the microcosms. Ethylbenzene and a-xylene were degraded by more than 90% after about 3 weeks. Benzene degradation rates were the slowest.
Rate constants could not be calculated for toluene because it had disappeared at the first sampling time. The largest calculated rate constant (vrnaJ was for ethylbenzene (~l 6 mgIL/day). Values ofvmax for the a-xylene and benzene experiments were approximately 0.89 and 0.86 mgIL/day, respectively.
The degradation ofthe compounds was accompanied by an increase in Fe(II) concentrations. Fe(II) concentrations rose rapidly for the toluene experiments and more gradually for the ethylbenzene and a-xylene experiments. The mean concentration ofFe(II) once these compounds were no longer detected was between approximately 30 and 40 mgIL (Figures 2 through 4). This is equivalent to between approximately 5 and 6 moles of iron reduced per mole of substrate degraded, less than half that predicted by the bioenergetic model (Table 2)
The production of Fe(II) in the benzene experiments was erratic After 3 weeks, Fe(II) concentrations in excess of25 mglL were observed, but at later sampling dates lower concentrations
Figure 1. Benzene and ferrous iron concentrations for live bottles from experiments started January 1995. Data points are means of triplicate bottles and error bars are sample standard deviations.
14
12
--.. 10 ...J ....... 0'> E 8 Q) cQ) 6 :J 0 I 4
2
0
----jill
-'1---
Toluene Fe(ll) _ _
-1'
50
40
-- 30
20
--.. ...J ....... 0'> E ----..
--<D LL
10
0
800 10 20 30 40 50 60 70
Days
Figure 2. Toluene and ferrous iron concentrations for live bottles from experiments started January 1995. Data points are means of triplicate bottles and error bars are sample standard deviations.
14
-----
14
12
- 10 '.'
....J--0> /' t --/' '--------E--- 8CD / ---c CD /N c 6 /'CD .n >. r W ..c 4...... w ___ Ethylbenzene
-0- Fe(ll)2
0
a 20 40 60 80
Days
100
50
40
....J30 0> -E
CD20 --u.
10
0
Figure 3. Ethylbenzene and ferrous iron concentrations for live bottles from experiments started January 1995. Data points are means of triplicate bottles and error bars are sample standard deviations
Figure 4 (a) a-Xylene and (b) ferrous iron concentrations for live bottles and killed controls from experiments started January 1995. Data points are means of triplicate bottles and error bars are sample standard deviations.
Because toluene disappeared so rapidly in the initial set of experiments, we decided to do a short-term (2 week) experiment using large glass syringes Using the syringes would allow for samples to be taken from the same vessel for the duration of the experiment, eliminating uncertainties inherent in sacrificial bottles The major drawback is the limited number of samples that can be taken.
Solutions with approximately 9 mgIL toluene were poured into 50-mL syringes, then approximately 2 mL of culture solution was pulled into the syringes. Killed controls were prepared by adding formaldehyde Any head space was removed by depressing the syringe plunger and a Teflon syringe valve on the syringe tip was closed Two live and two killed experiments were prepared and stored in the glove box under an N2 atmosphere. Samples were taken for toluene analysis every one to five days by opening the syringe valve and depressing the plunger, injecting solution directly into vials Because of sample size limitations, samples for Fe(II) was only taken at the end of the experiments, which ended after two weeks, when the solutions had been used up.
At the end of two weeks, the toluene had disappeared in the live samples (Figure 5). Degradation was seen within 2 days, when the first samples were taken. An average Vrnax of approximately 1 6 mg/L/day was calculated for the two live experiments Fe(II) concentrations were approximately 80 mgIL after 2 weeks, significantly higher than any concentrations observed in the January experiments. The ratio of Fe(II) produced to toluene degraded was about 16 to 1, approximately that predicted by the bioenergetic model (Table 2).
3.3 Sole-Substrate Serum Bottle Experiments (started March 1995)
A second set of serum bottle experiments using the same aromatic compounds as the first was started in early March, 1995. Because degradation appeared to be occurring fairly rapidly, we wanted to sample more frequently. In addition, we wanted to run a complete set with successful controls and perform other chemical analyses, including sulfate, nitrate, alkalinity, pH, and EDTA A total of 39 live (21 60-mL, 18 120-mL) and 13 control bottles (7 60-mL, 6 120-mL) were prepared for each compound. Two different sized bottles were used so that more solution would be available for the additional analyses.
Results are shown in Figures 6 through 9. Again, we observed a decrease in the concentrations ofall the compounds with toluene degrading most rapidly. Toluene was completely removed after 7 days and was never detected in any subsequent samples. Ethylbenzene and v-xylene were gone after about 6 weeks Benzene again degraded the slowest
The largest rate constant (vrnaJ was calculated for toluene (~1.3 mgIL/day). Values ofvrnax for the ethylbenzene, v-xylene, and benzene experiments were approximately 1.1, 0 91, and 0.88 mgIL/day, respectively.
Figure 5. Toluene and ferrous iron concentrations for syringe experiments February 1995. Each curve represents samples from one 50-mL syringe
18
14 a.
12
--.. 10 ....J ....... 0> E 8.......... Q) c Q) 6N C Q) en
4
2
0
--- live -----G - killed
4 b.
~ 3 I \ --.. ....J ...... 0> E .......... --.. .......... Q) u.
2 ), I \
\ \ \
1 / \
J _ ----0
o 10 20 30 40 50 60 70
Days
Figure 6. (a) Benzene and (b) ferrous iron concentrations for live bottles and killed controls from experiments started March 1995. Data points for live bottles are means of triplicate bottles and error bars are sample standard deviations.
19
12 a.
10
- 8...J ...... 0> E .......... Q) 6 c Q) ::J 0
4.....
2
0
--- live --{]] killed
80
60
-...J ...... 0> E-- 40
.......... Q) LL
20
b.
o 10 20 30 40 50 60 70
Days
Figure 7. (a) Toluene and (b) ferrous iron concentrations for live bottles and killed controls from experiments started March 1995. Data points for live bottles are means of triplicate bottles and error bars are sample standard deviations.
20
----10
a. - -rn-~if.. A b ?~::. __ --08
.......... -.J :.::
0 ....... 0> E
"'--" 6 Q) c Q) N C
~ 4 >. .c +oJ
UJ -e- live2
0
---0- killed
50 b.
40
.......... -.J ....... 0> E
"'--"
::::::.. Q) u.
30
20
10
o 10 20 30 40 50 60 70
Days
Figure 8. (a) Ethylbenzene and (b) ferrous iron concentrations for live bottles and killed controls from experiments started March 1995. Data points for live bottles are means of triplicate bottles and error bars are sample standard deviations.
21
12 a.
10
........... 8-I--.
0> E
'--'"
Q) 6c Q)
>. ~ 40
2
0
--- live -----D - killed
20
........... -I--. 0> E
'--'" ...........
'--'" Q)
LL.
12
8
4
o 10 20 30 40 50 60 70
Days
Figure 9. (a) a-Xylene and (b) ferrous iron concentrations for live bottles and killed controls from experiments started March 1995. Data points for live bottles are means of triplicate bottles and error bars are sample standard deviations.
22
The Fe(Il) production for this set ofexperiments was generally less than observed for the first two sets. In fact, Fe(Il) levels did not increase in the benzene experiments over the six weeks of the experiments. High levels ofFe(Il) (> 70 mglL), approximately that predicted by the bioenergetic model, were observed for the toluene experiments a few days after all the toluene had disappeared, but levels gradually decreased after that, to less than 40 mgIL after two months. Fe(Il) concentrations were quite erratic for ethylbenzene; very low concentrations ofFe(Il) alternated with increasingly higher levels. The low levels correspond to 120-mL bottles and the high levels to 60-mL bottles. Why this is so remains unclear. We believe we have ruled out sampling or storage procedures as sources ofthe problem. Perhaps the most likely explanation is that O2 leaked into the 120-mL bottles.
Results from the other chemical analyses were not particularly illuminating. Samples were taken for sulfate and nitrate analysis after three weeks Neither solute appeared to change from initial or control concentrations, suggesting denitrification and sulfate reduction reactions were not significant. Sulfate reduction, however, cannot be ruled out because the samples were not preserved in a manner to prevent the oxidization of any produced sulfide back to sulfate. In addition, there is evidence that Fe-EDTA chemically oxidizes reduced sulfur species (Verma et ai, 1994) Initial nitrate concentrations were less than 0.5 mgIL and initial sulfate between 40 and 50 mg/L.
Measurement ofpH was done at two sampling times near the end of the experiments. After five weeks, pH values were higher than the initial pH of approximately 6.70. Values measured after 6 weeks were generally between 7.0 and 8.0. Highest values were for a-xylene and lowest for benzene Controls had fairly low pH values (between 4 0 and 5.0) due to the presence of formaldehyde.
No change with time was observed for EDTA concentrations. However, because EDTA was present in such large concentrations, samples had to be diluted by a considerable amount, thus small changes in EDTA concentrations could not be detected.
Alkalinity was measured as a rough estimate of CO2 production. However, the presence of large concentrations of EDTA and phosphate in the solutions strongly affected alkalinity measurements, which confounds the interpretation of the results. EDTA accounts for approximately 40% of the alkalinity in the 1000/0 Fe-EDTA solutions. Samples were taken for alkalinity titrations after one, two, and three weeks. Highest concentrations were consistently measured for toluene. Alkalinity concentrations in both the benzene and toluene experiments increased with time, while it was fairly stable or showed a slight decrease with time in the ethylbenzene and a-xylene experiments. The lowest alkalinity values were measured for the first two sample times of the benzene experiments, but the alkalinity from the ethylbenzene experiments was lowest at the last sample time.
3.4 Toluene Serum Bottle Experiments (June 1995)
Because of its reactivity in our experiments, toluene was chosen for experiments examining differences in solution chemistry. In this set of experiments, three solutions were used: (1) 1000/0
23
Fe-EDTA, (2) 10% Fe-EDTA, and (3) No Fe-EDTA (see Table 4). Nitrate, sulfate, and pH were measured at various times to determine if other electron acceptors were being utilized and if the pH was decreasing as predicted by reactions (1) and (2).
Results are shown in Figures 10 through 12. Toluene was removed in all three systems, most rapidly in the 10% Fe-EDTA solution and least rapidly in the 100% Fe-EDTA solution. The values calculated forvrna;!: were approximately 1.2 and 0.45 mgIL/day for the 10% Fe-EDTA and 100% FeEDTA solutions, respectively. Considerable Fe(II) was produced in the 10% Fe-EDTA solutions (approximately 25 mg/L at experiment end), although lower than previous 1000/0 Fe-EDTA experiments Small amounts ofFe(II) were produced in the No Fe-EDTA solution bottles (between 3 and 4 mg/L), but none in the 100% Fe-EDTA solution bottles.
The small amount ofFe(II) produced in the No Fe-EDTA solutions may be due to the fact that the bacterial culture solution added to the bottles had an undetermined amount ofFe-EDTA in it, which we estimated to be between 2 and 4 mgiL Fe(III); the culture solution was saved from previous experiments where 100% Fe-EDTA solution was used We thus rename the solution from these experiments 1% Fe-EDTA solution.
The 1000/0 Fe-EDTA solution was approximately three months old at the start of the experiments, and was not stored in the dark. Photochemical degradation of Fe(III)-EDTA to Fe(II)EDTA has been reported to be an efficient process (Karametaxas et aI., 1995; Xue et aI., 1995). Analyses for EDTA and total Fe were performed in order to determine if there had been a decrease in their concentrations. However, there was no significant loss of these components. In addition, Fe(II) was not detected in any samples from the Aged 100% Fe-EDTA solution bottles.
Nitrate was below detection in all samples from the 1% and 10% Fe-EDTA solution bottles. There was a slight decrease in nitrate levels in the 100% Fe-EDTA solutions compared to control bottles, although the decrease was generally less than 0.5 mgIL. It thus appears that denitrification is negligible in this system Sulfate concentrations in the sample bottles never varied significantly from control samples. This would suggest sulfate reduction was not occurring, but because we did not prevent potential re-oxidation of sulfide in the samples, we cannot rule out sulfate reduction.
The initial pH of all solutions was approximately 6.70. The first time pH was measured in the samples was 9 or 10 days after preparation of the microcosms The pH was slightly greater than 7 for all three solutions, and did not change substantially or in anyone direction for the duration of the experiments
This set ofexperiments was designed to compare aged and fresh 100% Fe-EDTA solutions. The aged solution was the same as used in the June experiments. The fresh solution was prepared the day before the microcosms were constructed and the concentration ofFe-EDTA was the same as for what was initially prepared for the aged solution. In addition to these two solutions, a No Fe
24
14
12
10-....J ~
0)
E 8 --(J) c (J) 6::J 0 I
4
2
0
-.- live -0 - killed
0 10 20 30 40
Days
Figure 10. Toluene concentrations for live bottles and killed controls from Aged 100% Fe-EDTA solution experiments started June 1995. Data points for live bottles are means of triplicate bottles and error bars are sample standard deviations.
25
--
12
10
- 8--ICJ) -EQ) 6 c Q) ::J
I-0
4
2
0
30
25
--- live ----{] killed
a.
b.
- 20 --ICJ) -
0 10 20 30 40
Days
E 15----Q)
LL 10
5
0
Figure 11. (a) Toluene and (b) ferrous iron concentrations for live bottles and killed controls from 10% Fe-EDTA experiments started June 1995. Data points for live bottles are means of triplicate bottles and error bars are sample standard deviations.
26
12
10
---. 8-J-.... 0> E '-"" Q) 6 c Q) ::J 0
4I
2
0
a.
-e- Live -0 - Killed
5 b.
4
---. ~ 3 0> E '-""
Q) 2 LL
1
Q-l------.-----.---.-----..------.----,---r----,
o 10 20 30 40
Days
Figure 12. (a) Toluene and (b) ferrous iron concentrations for live bottles and killed controls from 1% Fe-EDTA experiments started June 1995. Data points for live bottles are means of triplicate bottles and error bars are sample standard deviations.
27
EDTA solution was again prepared, and this time a culture solution containing less than 0.5 mgIL ferric iron, as Fe-EDTA, was used for these bottles. Nitrate and sulfate were measured in some of the No Fe-EDTA bottles and pH and alkalinity were measured at various times for all three solutions
Toluene and Fe(II) results are shown in figures 13 through 15. Again, toluene was removed in all three solutions, most rapidly from the Fresh 100% Fe-EDTA solution bottles and slowest from the Aged 100% Fe-EDTA solution bottles. Considerable Fe(II) was produced in the Fresh 100% FeEDTA solution, peaking at approximately 70 mgIL a few days after complete toluene disappearance, which was close to that predicted by the bioenergetic model (Table 2), then gradually decreasing afterwards to approximately 20 mgIL after one month. There was no significant increase in Fe(Il) in the Aged 1000/0 Fe-EDTA solution A small amount ofFe(II) was produced in many of the No Fe-EDTA bottles, usually just above the detection limit (005 mglL). A small amount ofFe-EDTA was introduced to the No Fe-EDTA culture solution when a small amount of culture was transferred from the 100% Fe-EDTA culture solution bottle to the No Fe-EDTA culture solution bottle.
The loss of toluene in the Aged 100% Fe-EDTA and No Fe-EDTA solutions cannot be explained by iron reduction. Clearly there is some other mechanism responsible for their removal. Nitrate was below detection in all samples and sulfate concentrations in live bottles were not significantly different from controls for the No Fe-EDTA bottles. Again, however, we took no precautions to prevent potential re-oxidation of sulfide to sulfate in samples
The values calculated for Vm.1X were approximately 1 3 and 0.63 mg/L/day for the Fresh 100% Fe-EDTA and Aged 100% Fe-EDTA solutions, respectively.
MPN results suggest that there was not significant growth in bacterial numbers during the experiments Initial iron-reducing bacteria concentrations were calculated to be 6 9 x 10⁴ cells/mL, and after 9 days, 3 7 x 10⁴ cells/mL
The pH jumped from approximately 6.70 to around 7 50 after one to seven days for all solutions After about nine days, the pH began to decline in all the bottles After three weeks, the average pH had dropped to 6.81 (Aged 1000/0 Fe-EDTA), 6 98 (Fresh 1000/0 Fe-EDTA), and 7 15 (No Fe-EDTA). The pH was between Oland 0 2 pH units higher at the final sampling time eight days later
Alkalinity values did not show any trends for any of the solutions However, the alkalinity values in the Aged 100% Fe-EDTA solution were much lower (by about 500 mg/L) than in the Fresh 100% Fe-EDTA solution
3.6 Combined Substrate Results (November 1995)
Microcosms containing all four aromatic compounds were prepared using Fresh 100% FeEDTA solution were prepared in order to investigate if biodegradation rates were affected by substrate competition. Contrary to expectations, and despite preparing fresh solution, no Fe(II) was
28
12 a.
-e- live ----[J - killed
10
-- 8....J--. 0> E --()) 6 c ()) ::l "0
4I
2
0
20
60
80
--....J--. 0>
.s 40
o 5 10 15 20 25 30 35
Days
Figure 13. (a) Toluene and (b) ferrous iron concentrations for live bottles and killed controls from Fresh 100% Fe-EDTA experiments started August 1995. Data points for live bottles are means of triplicate bottles and error bars are sample standard deviations.
29
12 i ~ m---~ -0- -
10
-- 8....J-... 0> E
"'"-'" Q) 6 c Q) :J
~ 4
2
0
I ~
1.0
0.8
.... -- ~ ~ ....J-... 0.60> ~\
Q- D--~~ ---/II a.
-.-live --{J killed
b.
,--E /
..I" \"'"-'"
I \"'"-'" 0.4 / \ LL Q)
II \.. ~ \ tr' ~ 0.2 I ~
~ I ~
0.0
0 5 10 15 20 25 30 35
Days
Figure 14. (a) Toluene and (b) ferrous iron concentrations for live bottles and killed controls from Aged 100% Fe-EDTA experiments started August 1995. Data points for live bottles are means of triplicate bottles and error bars are sample standard deviations
30
---
12 a.
10
........... 8....J-... C)
E---Q) 6 c Q) ::J 0
4.....
2
0
---- live -0- killed
1.0 b.
0.8
...........
....J-... 0.6C)
E...........
Q) --- 0.4 LL
0.2
0.0
o 5 10 15
Days
Figure 15. (a) Toluene and (b) ferrous iron concentrations for live bottles and killed controls from No Fe-EDTA experiments started August 1995. Data points for live bottles are means of triplicate bottles and error bars are sample standard deviations
20 25 30 35
31
produced during these experiments. All of the compound eventually degraded, at rates considerably slower than those for experiments where Fe(II) production was observed, with relative removal rates ofethylbenzene > toluene> benzene> a-xylene (Figure 16). The V for toluene was similar to that max
for the Aged 100% Fe-EDTA experiments.
3.7 Investigations of Toluene Biodegradation by Non-Iron-Reducing Bacteria
The disappearance of toluene in microcosms where either Fe(I1) was not produced or there was no Fe(III) source indicate the existence of an electron acceptor other than Fe(III). Experiments reported in Saliga (1996) were done in order to investigate these reactions Microcosms containing toluene were prepared using four different solution compositions. (1) Fresh 100% Fe-EDTA, (2) EDTA at the same concentration as for (1) but no Fe(III), (3) Fe(III) added as FeCl3 instead ofFeEDTA, and (4) neither Fe(IIl) or EDTA.
Toluene concentrations as a function of time are shown in Figure 17 for each solution composition Only in the 100% Fe-EDTA microcosm was Fe(II) produced (approximately 110 mg/L at the end of the experiment). In the solution containing no Fe(III) or EDTA, toluene degraded at a rate similar to that found in the Aged 100% Fe-EDTA microcosms, suggesting a similar type of metabolism in those two experiments.
Toluene was not degraded when EDTA but no Fe(III) source was present. There was some degradation oftoluene in the FeCl3 solution, but rates were significantly slower than for both the FeEDTA solution and the no Fe(III)/no EDTA solution. This slow rate and the lack of Fe(II) production suggest that iron-reducing bacteria active in these experiments cannot adequately use FeCl3 as an electron acceptor. It should be noted that when the FeC! solutions were prepared, a light-colored floc precipitated out of solution, presumably a ferric oxyhydroxide. The lack of or slow degradation of toluene in the EDTAlno Fe(III) and FeCl3 solutions suggest that EDTA and, to a lesser extent FeCI3, inhibit the bacteria responsible for the degradation of toluene under non-ironreducing conditions.
The activity of sulfate-reducing bacteria (SRB) was further investigated by using resazurin. Resazurin is a dye that is commonly used as a redox indicator, and it was used in these experiments as a qualitative test for whether sulfate reducing conditions existed. Resazurin turns a solution from pink to clear at approximately 200 mV, ie, if the solution is clear, then conditions are suitable for sulfate reduction.
Resazurin was added to a culture bottle containing no Fe(III)/no EDTA that had undergone complete toluene degradation. The solution turned pink about 5 minutes after addition, then turned clear overnight and remained clear from then on, indicating that reduced anaerobic conditions existed in the bottles. On the other hand, both fresh and aged (in the dark) Fe-EDTA solutions remained pink, consistent with formation ofFe(II) (although to different extents).
A molybdate inhibition experiment was performed in an attempt to shut down SRB, to
Figure 16. Benzene, toluene, ethylbenzene, and o-xylene concentrations for live bottles from mixed substrate 100% Fe-EDTA experiments started November 1995. Data points are means of triplicate bottles and error bars are sample standard deviations.
12 --- fresh Fe-EDTA
10 -R- EDTA only .. A FeCI3 only
...
...J-0> E .........
8 . -w- no Fe, no EDTA ~~'.~~~~--~-~ ~~--~
.'A .... '&'\'" -. ~~~-IllI
'" '\'A ····Ia ..... A Q) c (]) :J a ~
6
4
,
\ ·L... ·····A W
"'\
.'V- ---v__ .~
··· .. IA· l;.. · A
2 --~ \ "'\7-. - -w.- ---v .- -e__
0 '1.. --- -
0 5 10 15 20 25 Days
Figure 17. Toluene concentrations as a function of time in experiments using various media (from Saliga, 1996).
33
determine if they were indeed active in the system. The presence of molybdate has been shown to inhibit SRB activity (e g., Bagley and Gossett, 1990) Experiments were prepared with five different molybdate concentrations between 1 and 100 roM for both 100% Fe-EDTA and no Fe(III)/no EDTA solutions. Concentrations of 10 mM have been shown previously to be sufficient to inhibit both Groups I and II SRB (Bagley and Gossett, 1990).
Only for the highest molybdate concentration was toluene degradation inhibited, and it was inhibited in both solutions, suggesting it inhibited not only SRB, but also iron reducers and whatever other bacterial reactions might have been occurring. Fe(I1) concentrations could not be determined because the molybdate interfered with the analysis.
Resazurin was added to all the bottles used in the molybdate experiments. At low molybdate concentrations (:::;; 10 mM), the color changes generally indicated that iron reducers were responsible for toluene degradation in the Fe-EDTA solutions (pink) and lower redox anaerobes were responsible in the no Fe(III)/no EDTA solutions (clear).
3.8 Carbon Balance Results
14C-ring labeled toluene (1.2 x6 10 dpm) was added along with unlabeled toluene (approximately 10 mgIL) to examine the fate of this compound when it was biodegraded under ironreducing conditions, i e., by using fresh 100% Fe-EDTA solutions (Saliga, 1996). When the toluene was completely degraded (approximately 2 weeks), the distribution of 14C was determined (Figure 18). Less than 10% of the initial 14C added was lost during incubation Of the amount remaining, the distribution of 14C was as follows (± one standard deviation): 70 3~4 CO2 (±2.5%), 17.8% (±1.6%) nonvolatile residue that was retained by a 0 45 Jlm filter (presumptively cell associated), 5.7% (±O.l%) nonvolatile and soluble residue (presumptively soluble microbial products), and 6.2% (±4. 1%) unaccounted for. Confirmation that the nonvolatile residue was indeed associated with cell biomass was obtained by recovering a large fraction as 14C-Iabeled protein Thus, the majority of the toluene was mineralized, and the next most significant fraction was used for cell synthesis. These results indicate that the predominant metabolites from toluene biodegradation under iron reducing conditions are environmentally benign
4 DISCUSSION
4.1 Aromatic Compound Identity
All four compounds (benzene, toluene, ethylbenzene, a-xylene) degraded under the experimental conditions of this study. Toluene degraded especially rapidly, with approximately 10 mgIL being removed in less than one week whenever Fresh 100% Fe-EDTA solution was used. Ethylbenzene and a-xylene degraded to below detection over several weeks, and benzene took slightly longer to degrade. Calculated rate constants give relative disappearance rates of: Toluene > ethylbenzene > a-xylene> benzene This order of degradation rates is comparable to that found in other studies done under anoxic conditions; toluene is typically the most easily degraded and
34
I dpm injected into bottle
~ total dpm in bottle = 89.34% of injectedat time of analysis
~ total dpm measured during analysis
total dpm in bottle at time of analysis = 93.58%
1.02 x 10 6
dpm/bottle= 1.09 x 10
6 dpm/bottle
! 1.09 x 10
6 dpm/bottle
non-soluble NSR
18.01%
soluble NSR
5.74%
other/not recovered
6.1 %
cell associated non-soluble NSR
2.48%
other nonsoluble NSR
15.53%
Figure 18 End-product distribution of 14C (from Saliga, 1996). NSR refers to non-strippable and non-volatile residue.
35
benzene is often the most recalcitrant of the monoaromatic compounds under anoxic conditions. The order of degradation found in the single substrate experiments was also found in the combined substrate experiment, except that a-xylene was more recalcitrant than benzene.
Michaelis-Menten rate constants for all of the experiments are reported in Table 6, except for the No and 1%1 Fe-EDTA experiments, where the model solution did not converge. It should be noted that the Michaelis-Menten equation, used to calculate rate constants, was developed for systems in which there is no significant growth of the bacterial species involved in the reaction. While we were unable to make any direct bacterial counts, results from the MPN analysis suggest that there was no increase in numbers throughout the experiments. In addition, the fact that there was typically no observable lag period prior to biodegradation suggests that sufficient numbers of bacteria were present at the start of the experiment so that an initial growth period was not necessary.
In most of the experiments, the degradation was accompanied by increases in Fe(II) concentrations, strong circumstantial evidence for bacterial iron reduction. Production of Fe(II) tended to lag behind the degradation ofthe aromatic compound by a few days. This observation may indicate that the initial step(s) in the degradation pathway are occurring relatively rapidly but reducing relatively small amounts ofFe(III) and subsequent steps leading to mineralization are occurring more slowly The initial disappearance ofthe aromatic compound may reflect alteration to an intermediate, when a relatively small amount of iron is reduced. No peaks other than those for BTEX were ever observed on the chromatograms; however, the analytical method was not suited for measuring typical metabolites of aromatic hydrocarbons, and thus their persistence cannot be ruled out (I. Cozzarelli, pers comm.) A more likely explanation is that the lag in Fe(ll) production represents an increase in cell decay and thus release of Fe(Il) into solution once the primary organic substrate has disappeared from solution.
The amount ofFe(II) produced was positively correlated with the relative degradation rates of the compounds, ie, the amount of Fe(II) produced was toluene> ethylbenzene > o-xylene > benzene. The peak amount of Fe(II) produced in all of the Fresh 100% Fe-EDTA toluene experiments was approximately that predicted by the bioenergetic model (Table 2). Saliga (1996) found slightly higher levels of Fe(II) produced than predicted in some of his experiments. Fe(II) production in the ethylbenzene and o-xylene experiments was less than half that predicted by the model. In all cases, however, the amount ofFe(II) produced was much closer to the values predicted by the bioenergetics model (Reaction (3» as opposed to the thermodynamic stoichiometric model (Reaction (1».
The inconsistency regarding Fe(II) production between the January and March 1995 sets of experiments for benzene most likely reflects variabilities in the inoculum. There is certainly considerable variability in the data, which is commonly seen in biodegradation studies in which serum bottles are used and sacrificed at each time step There are always inherent compositional differences among the bottles which would be expected to produce variable reaction rates. Still, we expected to see some Fe(II) production in the experiments started in March 1995, based on the results of the January 1995 set. We thus conclude that iron reduction was not occurring in the March 1995
36
Table 6. Calculated Michaelis-Menten rate constants for all experiments. Standard errors (S.E.) are in parentheses
* Insufficient data. ** Mathematical solution did not converge adequately.
37
microcosms
The differences in Fe(II) concentrations that were sometimes observed in the 60 and 120-mL bottles in the set of experiments from March 1995, most notably for ethylbenzene, are puzzling. Because all components were added in the same ratios for the different bottle sizes, there is no reason to believe reaction rates should be a function of bottle size. We have investigated possible errors in sampling handling or analysis, but have not discovered any potential cause for these results. It appears that iron reduction was not occurring in the 120-mL ethylbenzene bottles
A possible explanation for the lack ofFe(lI) production in the experiments discussed above is leakage of O2 into the bottles. However, the tests performed using resazurin suggest no oxygen leakage. In addition, the amount of oxygen required to oxidize the amount of compound loss observed would require unrealistically large diffusion rates.
4.2 Solution Composition
Five different solution compositions were used in this study 100% Fe-EDTA, both Fresh and Aged, 10% Fe-EDTA, 1% Fe-EDTA, and No Fe-EDTA Saliga (1996) also used several other solution compositions, including EDTAlno Fe(III), Feel3, and no EDTAlno Fe(III).
Toluene was degraded in all of the solutions, even when no Fe(III) was added to solution. The V values for toluene biodegradation in the Fresh 100% Fe-EDTA and 10% Fe-EDTA solution max
experiments were not significantly different (Table 6) although peak Fe(II) production was considerably less in the 10% Fe-EDTA solution. Increases in Fe(II) in the 1% Fe-EDTA solution experiments suggest that iron reduction did occur Although we were unable to successfully calculate a Vmax value for the 1% Fe-EDTA, on visual inspection it appears that rates were slower compared with the 100% and 10% Fe-EDTA microcosms, especially after the first week (compare Figure 12(a) with Figures I I (a) and I3(a), e.g) In the No Fe-EDTA solutions where we were careful to add culture solution with negligible amounts ofFe-EDTA to the serum bottles, toluene was still observed to degrade. Toluene also degraded in the Aged 100% Fe-EDTA experiments. Fe(II) was not produced in either of these latter two experiments.
The results from the No Fe-EDTA and Aged 1000/0 Fe-EDTA experiments suggest that organisms other than iron-reducers were involved in toluene degradation. Because we used a mixed culture, this was not unexpected. Potential reduction reactions include denitrification, manganese reduction, sulfate reduction, and fermentation. The solutions contained very low concentrations of nitrate and manganese, thus these were considered to be insignificant Nitrate was occasionally measured, and was always below detection (0 4 mgIL as N)
Several experiments were conducted to indirectly evaluate if SRB were active in the microcosms in which toluene disappeared without production of Fe(II). Resazurin indicated that redox levels were low enough in these microcosms to support sulfate reduction. In addition, water chemistry data from the field site where the inoculum was obtained suggests that sulfate reduction
38
occurs there, as evidenced by low levels of sulfate compared to background (Table 3). However, several results from the microcosms suggest that SRB activity was not responsible: (1) Molybdate levels that have proven inhibitory to SRB activity in other studies did not prevent biodegradation of toluene; (2) consumption of sulfate did not occur in microcosms in which toluene was consumed without Fe(II) formation; and (3) not enough sulfate was present to fully account for the amount of toluene consumed.
An alternate explanation for biodegradation of toluene without iron reduction is via fermentation Additional work is needed to confirm this, including measurement of likely products such as organic acids and hydrogen. A number of previous studies have demonstrated fermentation of toluene as well as the other monoaromatics, although at slower rates.
In all experiments reported here and in Saliga (1996), BTEX degradation rates were significantly faster under iron-reducing vs non-iron-reducing conditions, suggesting that the iron reducers outcompete the lower redox anaerobes under our experimental conditions Similar observations were also made by Chapelle and Lovley (1992). In the 10% and 1% Fe-EDTA experiments, it appears that a mixed electron acceptor regime was present. Initially, toluene disappearance rates appear to be similar to 100% Fe-EDTA rates, but then slow down toward the end of the experiments, taking several weeks longer for complete removal of toluene than in the 100% Fe-EDTA solutions. This suggests that initially there was sufficient available Fe(III) in the 10% and 1% Fe-EDTA solutions for degradation of toluene under iron-reducing conditions, but eventually Fe(III) concentrations became a limiting factor, slowing down the reaction rate. After this point, degradation proceeds more slowly, presumably coupled to fermentation
4.3 Source of Fe(III)
The iron-reducing bacteria appear to be very sensitive to the nature and source ofFe(III). The bacteria reduced Fe(III) to Fe(II) rapidly when freshly made solution containing Fe-EDTA was used, but no Fe(II) was produced when FeCl3 was the FeOII) source Other investigators have found similar results (e.g., Lovley et aI., 1994; 1996); i.e., the more soluble the form ofFe(III), the more easily it is microbially reduced.
One ofthe most interesting and perplexing results of this study was the effect of aging of the Fe-EDTA-containing solution on the biodegradation reactions Iron reduction appeared to be shut down in solutions that had been exposed to light for several weeks. However, Saliga (1996) measured some Fe(I!) production in aged solutions that had been stored in the dark. Unfortunately, this experiment was ended prematurely, and thus it is unclear if the amount ofFe(II) produced would be similar to that for fresh solutions. Fe(III)-EDTA is known to photodegrade; however, large increases in Fe(II) concentrations are usually observed as a result ofFe(III)-EDTA photodegradation (e.g., Karametaxas et ai, 1995), and we did not observe any Fe(II) production in microcosms with aged solutions. Karametaxas et ai. (1995) detected formaldehyde as a photodegradation product of Fe(III)-EDTA, which may account for iron reducers being inhibited, but apparently other bacteria were not affected. On the other hand, the presence ofEDTA without Fe(III) apparently did inhibit
39
the other active bacteria. An additional complexity is that for the combined substrate experiment, no Fe(II) was produced even though fresh solution was used
It appears that the use ofFe-EDTA as the Fe(III) source is not straightforward For most of the experiments where fresh solution was used, the Fe(III)-EDTA complex was easily accessed by the iron-reducing bacteria. However, when aged solution was used, somehow something in solution had changed such that the bacteria could no longer readily utilize the Fe(III). This could be an important practical consideration in remediation designs. The possibility that Fe(III) was being replaced by other cations in the EDTA complex and then precipitating out of solution as a ferric oxyhydroxide was suggested when it was noted that more solid material was removed during filtering the aged solution compared to the fresh solution MINTEQA2 results suggest that this should not be the case, i e., that most of the Fe(III) should remain chelated to EDTA In addition, total iron analyses indicated there was no appreciable loss of Fe(III) in solution due to aging. The large decrease in alkalinity concentrations as a result of aging suggests the removal of some of the species that contribute to alkalinity (bicarbonate, EDTA, phosphate). The solution was not supersaturated with respect to any carbonate minerals (e.g, calcite, siderite), but was supersaturated with respect to the phosphate-containing mineral vivianite.
4.4 Fe(II) Sinks
The decrease in Fe(II) with time in the March and August Fresh 100% Fe-EDTA toluene experiments was possibly due to the precipitation of a ferrous containing solid phase. It should be noted that Saliga (1996) did not always observe this decrease in Fe(II) concentrations with time. A floc that had settled on the bottom of the bottles was observed in the August Fresh 1000/0 Fe-EDTA experiments that was not observed in the Aged 100% Fe-EDTA and No Fe-EDTA bottles. Possible ferrous-containing mineral phases that might precipitate include siderite (FeC03), vivianite (FelP04)2'8H20), and/or magnetite (Fe 30,J. Siderite formation has been observed in an aquifer contaminated with petroleum (Cozzarelli and Baedecker, 1992). Lovley et al. (1987) observed microbially-mediated magnetite formation during Fe(III) reduction Simulations using the geochemical thermodynamic code MINTEQA2 indicate that the solutions were supersaturated with respect to magnetite and vivianite but undersaturated with respect to siderite.
Mossbauer spectroscopy was used in an attempt to identify the iron-containing mineral phase(s) in the floc. A sample bottle containing the floc was centrifuged, then most of the supernatant removed by syringe under a N2 atmosphere. The bottle was then vigorously shaken by hand to suspend the floc In the glove box, the bottle was opened and the suspension poured into a sample holder. Once the sample was removed from the glove box, it was immediately immersed in liquid nitrogen, then inserted into the Mossbauer spectrophotometer. Results were inconclusive, but it appeared that the vast majority of the suspension was ferric iron.
5 CONCLUSIONS
Based on the results of this study, we are able to draw the following conclusions'
40
1. The monoaromatic hydrocarbons benzene, toluene, ethylbenzene, and o-xylene, biodegrade under iron-reducing conditions. The relative rates of degradation are toluene> ethylbenzene > 0
xylene> benzene
2. EDTA can effectively keep ferric iron in solution and available to microorganisms. Toluene degradation was limited in experiments in which FeCl3 was used as the iron source instead ofFe-EDTA and no Fe(II) production occurred.
3. The ability ofmicroorganisms to use Fe-EDTA as a source ofFe(III) decreased markedly as the solution aged. The reason for this is not fully understood, but may be due to changes in the Fe(III)-EDTA complex in solution.
4. The peak amount offerrous iron produced was approximately equal to the stoichiometric amount predicted by bioenergetic calculations in the toluene experiments, but was less than that for the other three compounds. The lower than expected formation of Fe(II) production may be due to aging ofthe solution during the slower degradation of these compounds, resulting in a shift towards another type of anaerobic metabolism (e.g., fermentation), or precipitation of ferrous iron out of solution.
5. Electron acceptors other than ferric iron were also utilized in at least some of the experiments, which is not unexpected considering that a mixed culture was used. Several indirect measures suggest that fermentative organisms played a more important role than SRB Iron reducers outcompete lower redox anaerobes if a viable source ofFe(III) is present
6. The biodegradation oftoluene under iron-reducing conditions is an efficient process, with > 70% being converted to CO2 and no intermediate compounds persisting in solution.
6 RECOMMENDATIONS
The rapid biodegradation ofBTEX under iron-reducing conditions was demonstrated in this study. Some interesting results also warrant further study, including the effect of aging on the Fe(III)-EDTA complexes, the potential for EDTA to inhibit certain bacteria, the dynamics ofFe(II) between the solution and solid phases, and the role of other anaerobic organisms in BTEX biodegradation when Fe(III) is unavailable.
The state of Illinois has a large number of sites contaminated with BTEX, from sources such as gasoline spills and leakage ofunderground petroleum storage tanks Once these compounds enter the ground water, they can be very difficult to treat. If in situ biodegradation of these compounds coupled with iron reduction is a viable technique, then many of these sites could be at least partially remediated by enhancing iron-reducing conditions This project provides some important baseline data evaluating the pertinent processes and reaction rates.
41
REFERENCES
Acton, D.W , and J.F Barker, 1992 "In Situ Biodegradation Potential of Aromatic Hydrocarbons in Anaerobic Groundwater." J. Contam. Hydro/. 9(4):325-352.
Albrechtsen, H -J., and T H. Christensen, 1994. "Evidence for Microbial Iron Reduction in a Landfill Leachate-Polluted Aquifer (Vejen, Denmark)" Appl. Environ. Microbiol. 60(11):3920-3925.
American Public Health Association, 1993 Standard Methods for the Examination of Water and Wastewater, 18th ed. Washington, DC: American Public Health Association.
Baedecker, MJ , I.M. Cozzarelli, R.P Eganhouse, D.L Siegel, and PC Bennett, 1993. "Crude Oil in a Shallow Sand and Gravel Aquifer--III. Biogeochemical Reactions and Mass Balance Modeling in Anoxic Groundwater." Appl. Geochem. 8(6).569-586
Bagley, D.M, and J M Gossett (1990) TetracWoroethene transformation to trichloroethene and cis1,2-dichloroethene by sulfate-reducing enrichment cultures Appl. Environ. Microbial., 56, 2511
Barbaro, JR., J.F Barker, L.A. Lemon, and C.I. Mayfield, 1992. "Biotransformation of BTEX under Anaerobic, Denitrifying Conditions: Field and Laboratory Observations." J Contam. Hydro!. 11(3/4) 245-272
Barker, J.F., G C. Patrick, and D Major, 1987. "Natural Attenuation of Aromatic Hydrocarbons in a Shallow Sand Aquifer." Ground Wat. Monitor. Rev. 7(1) 64-71
Bhattacharyya, S N , and K P. Kundu, 1971. "Spectrometric Determination of EDTA" Talanta 18(4).446-449.
Borden, R.C, C.A. Gomez, and M T, Becker, 1995 "Geochemical Indicators of Intrinsic Bioremediation." Ground Wat. 33(2)'180-189
Bulter, LB., M.A.A. Schoonen, and D. T Rickard, 1994. "Removal of Dissolved Oxygen from Water: A Comparison of Four Common Techniques." Talanta 41(2):211-215.
Chapelle, F H., and D.R. Lovley, 1992 "Competitive Exclusion of Sulfate Reduction by Fe(III)Reducing Bacteria. A Mechanism for Producing Discrete Zones of High-Iron Ground Water." Ground Wat. 30(1 )'29-36
Cochran, W.G., 1950 "Estimation ofBacterial Densities by Means of the 'Most Probable Number. '" Biometrics 6(1): 105-116.
Cozzarelli, LM., and MJ. Baedecker, 1992. "Oxidation of Hydrocarbons Coupled to Reduction of
42
Inorganic Species in Groundwater" pp. 275-278. IN Kharaka, Y.K., and A.S Maest, eds. Proceedings of the 7th International Symposium on Water-Rock Interactions, Park City, UT.
Downs, W.C, S.R. Hutchins, IT Wilson, R.H. Douglas, and D J. Hendrix, 1989. "Pilot Project on Biorestoration ofFuel-Contaminated Aquifer Using Nitrate: Part I--Field Design and Groundwater Modeling" pp. 219-233. IN Proceedings of the Conference on Petroleum Hydrocarbons and Organic Chenlicals in Groundwater: Prevention, Detection and Restoration, Houston, TX, Nov. 15-17, 1989.
Essaid, H.I., B A. Bekins, E.M. Godsy, E. Warren, MJ. Baedecker, and I.M. Cozzarelli, 1995. "Simulation of Aerobic and Anaerobic Biodegradation Processes at a Crude-Oil Spill Site." Draft U.S Geological Survey Report, Menlo Park, CA, May 22, 1995.
Evans, P.l, D T. Mang, and L Y Young, 1991 "Degradation of Toluene and m-Xylene and Transformation of o-Xylene by Denitrifying Enrichment Cultures." Appl. Environ. Microbiol. 57(2):450-454.
Federal Register, 1987. "Volatile Synthetic Organic Chemicals. Final Rule." Fed Reg., 52 130:23690 (July 8, 1987).
Federal Register, 1991. "National Primary Drinking Water Regulations. Synthetic Organic Chemicals and Inorganic Chemicals, Monitoring for Unregulated Contaminants~ National Primary Drinking Water Regulations Implementation, National Secondary Drinking Water Regulations. Final Rule" Fed Reg., 56 20 3600 (Jan. 30, 1991).
Fe1my, A.R., D.C. Girvin, and E A. Jenne, 1984. "MINTEQ' A Computer Program for Calculating Aqueous Geochemical Equilibria" NTIS PB84-157148, EPA-600/3-84-032, National Technical Information Service, Springfield, VA.
Fischer, W.R., 1988 "Microbiological Reactions of Iron in Soils" PP 715-748. IN Stucki, IW., B.A. Goodman, and U. Schwertmann, eds Iron in Soils and Clay Minerals, D Reidel Pub Co., Dordrecht
Gschwend, P.M, D.A. Backhus, J.K. MacFarlane, and A.L Page, 1990. "Mobilization of Colloids in Groundwater Due to Infiltration of Water at a Coal Ash Disposal Site." J. Contam. Hydro. 6(4):307-320.
Hutchins, S.R., G.W. Sewell, D.A Kovacs, and GA. Smith, 1991. "Biodegradation of Aromatic Hydrocarbons by Aquifer Microorganisms under Denitrifying Conditions." Environ. Sci. Techno/. 25(1):68-76.
Jardine, P.M., G.K. Jacobs, and J.D. O'Dell, 1993. "Unsaturated Transport Processes in Undisturbed Heterogeneous Porous Media: II. Co-contaminants." Soil Sci. Soc. Am. J. 57(4) 954-962.
43
Karametaxas, G., S l Hug, and B. Sulzberger, 1995. "Photodegradation ofEDTA in the Presence ofLepidocrocite." Environ. Sci. Techno!. 29(12).2992-3000.
Lee, MD., J.M Thomas, R C. Borden, P.B Bedient, C.R Ward, and IT. Wilson, 1988. "Biorestoration of Aquifers Contaminated with Organic Compounds." CRC Crit. Rev. Environ. Control 18(1):29-89.
Lemon, L,A, lR. Barbaro, and J F. Barker, 1989. "Biotransformation ofBTEX under Anaerobic Denitrifying Conditions Evaluation of Field Observations" IN Proceedings of the FOCUS Conference on Eastern Regional Groundwater Issues. Kitchner, Ontario, Canada.
Lovley, D.R., and DJ. Longeran, 1990. "Anaerobic Oxidation of Toluene, Phenol, andp-Cresol by the Dissimilatory Iron-Reducing Organism, GS-15." Appl. Environ. Microbiol. 56(6): 1858-1864
Lovley, n.R., and E lP Phillips, 1988. "Novel Mode of Microbial Energy Metabolism. Organic Carbon Oxidation Coupled to Dissimilatory Reduction of Iron or Manganese" Appl. Environ. Microbial. 54(6) 1472-1480
Lovley, D.R., J.F Stolz, G L. Nord, Jf., and E lP. Phillips, 1987. "Anaerobic Production of Magnetite by a Dissimilatory Iron-Reducing Microorganism." Nature 330(6145):252-254.
Lovley, D.R, lC. Woodward, and F H Chapelle, 1994 "Stimulated Anoxic Biodegradation of Aromatic Hydrocarbons using Fe(IIl) Ligands" Nature 370(6485).128-131.
Lovley, DR., J C. Woodward, and F.R. Chapelle, 1996. "Rapid Anaerobic Benzene Oxidation with a Variety of Chelated Fe(III) Forms." Appl. Environ. Microbiol. 62(1).288-291.
Major, D W., C I. Mayfield, and IF Barker, 1988. "Biotransfonnation ofBenzene by Denitrification in Aquifer Sand" Ground Wat. 26(1 ):8-14.
McCarty, PL., 1975. "Stoichiometry ofBiological Reactions." Progr. Water Techno!. 7(1):157172.
Nyer, E.K., 1992. Groundwater Treatment Technology, 2nd ed NY: Van Norstrand Reinhold
Palumbo, A.V , S.Y. Lee, and P. Boerman, 1994 "The Effect of Media Composition on EDTA Degradation by Agrobacterium sp" Appl. Biochem. Biotech. 45/46:811-822
Pardieck, D L., EJ. Bouwer, and T.L. Stone, 1990. "Hydrogen Peroxide as a Source of Oxidant Capacity for the Biotransformation ofBenzene, Toluene, and Xylene in Biofilm." IN Environmental Engineering Proceedings ofthe 1990 Specialty Conference. NY American Society ofEngineers.
Patterson, B.M., F. Pribac, C. Barber, G.B. Davis, and R. Gibbs, 1993. "Biodegradation and
44
Retardation ofPCE and BTEX Compounds in Aquifer Material fi'om Western Australia using LargeScale Columns." J. Contam. Hydrol. 14(3/4):261-278.
PuIs, R.W., C.l Paul, and D A. Clark, 1993. "Surface Chemical Effects on Colloid Stability and Transport through Natural Porous Media." Colloids Sll~f A: Physicochem. Eng. Aspects 73(1):287300.
Ribbons, D.W., and R.W. Eaton, 1982. "Chemical transformations of aromatic hydrocarbons that support the growth of microorganisms", pp. 59-84 IN Chakrabarty, A.M., ed. Biodegradation and Detoxification ofEnvironmental Pollutants Boca Raton, FL CRC Press, Inc
Saliga, M.P., 1996. "Enhanced Bioremediation of Toluene under Iron-Reducing Conditions." M.S. Thesis, Department of Environmental Engineering in Civil Engineering, University of Illinois at Urbana-Champaign
Stumm, W. 1993 "Aquatic Colloids as Chemical Reactants Surface Structure and Reactivity." Colloids Sw1 A: Physicochem. Eng. Aspects 73(1): 1-18
Tiedje, IM, 1982. "Denitrification" pp 1011-1026. IN Page, A.L., R.H Miller, and D.R Keeney, eds. Methods ofSoil Analysis: Part 2, Chemical andMicrobiological Properties, 2nd ed Madison, WI: American Society of Agronomy, Inc., and Soil Science Society of America, Inc.
Verma, P.S., T.V. Rao, A. Jayaraman, P.S.N Murthy, and G C. Joshi, 1994 "Potentiometric Estimation of Sulfide Ion using the Fe(III)-EDTA Complex." J Analyt. Chenl. 348(11):742-744
Verschueren, K., 1983. Handbook of Environmental Data on Organic Chemicals. NY. Van Nostrand Reinhold
Xue, H., L Sigg, and F.G. Kari, 1995 "Speciation of EDTA in Natural Waters: Exchange Kinetics ofFe-EDTA is River Water" Environ. Sci. Techno!. 29(1).59-68.
45
APPENDIX
Complete experimental data
46
Table AI. Experimental data for sole-substrate experiments started in January or February, 1995. Results in mgIL.
date days
1/23/95 0
2/6/95 14
2/14/95 22
2/20/95 28
2/28/95 36
4/6/95 73
5/8/95 105
date days
1/24/95 0
2/6/95 13
2/14/95 21
4/6/95 72
date days
2/7/95 0
2/14/95 7
2/20/95 13
2/28/95 21
4/6/95 58
5/8/95 90
date days
2/8/95 0
2/14/95 6
2/20/95 12
2/28/95 20
4/6/95 57
5/8/95 89
control
109
106
9.65
834
9.44
mean
11 81
27.21
16 19
076
1039
1509
mean
3628
2804
37.02
mean
9.42
18.46
18.19
3670
2753
mean
076
454
735
3057
41 47
Fe(II)
sd
306
1.73
388
0.02
1279
13 49
Fe(II)
sd
11.58
338
7.34
Fe(II)
sd
1.18
203
1 05
4.43
1392
Fe(I!)
sd
032
060
020
527
5.30
control
054
049
051
097
2.09
Iili
776
lili
796
Iili
8.01
a-Xylene loss
live control
1 20 I 20
8.15 1 32
932 083
876 2.46
957 I 79
mean
12.79
308
2 17
1 27
207
000
000
mean
10.70
0.00
000
000
Benzene
sd
1.45
0.88
0.41
020
0.71
0.00
000
Toluene
sd
222
000
000
000
Ethylbenzene
mean
12.11
3 91
1.54
0.24
0.00
000
mean
10.72
987
263
075
000
000
sd
1 70
1 12
013
009
000
000
o-Xylene
sd
1.04
0.50
042
0.21
000
000
47
Table A2. Experimental data for toluene experiments in 50-mL glass syringes started in February, 1995. Results in mg/L.
Toluene Fe(II)
Date days live-I live-2 killed-I killed-2 live-I live-2 killed-I killed-2
Table A3. Experimental data for sole-substrate experiments started in March, 1995. Results in mgIL except EDTA, which is mmoVL. 120-mL bottles sampled on bold date; 60-mL bottles sampled on other dates. (nd = not determined)
Benzene
date
3/8/95
3/13/95
3/16/95
3/20/95
3/23/95
3/27/95
3/30/95
4/3/95
4/6/95
4/10/95
4/13/95
4/17/95
4120/95
5/8/95
date
3/9/95
3/13/95
3/16/95
3/20/95
3/23/95
3/30/95
4/3/95
4/6/95
4/10/95
4/13/95
4/17/95
4/20/95
5/8/95
days mean sd
0 11 76 1 27
863 0.115
8 628 012
12 348 0.41
15 4.37 1.01
19 1 48 0.43
22 380 036
26 o 10 o16
29 200 067
33 0.00 0.00
36 1 16 008
40 000 000
43 1.08 061
61 0.00 000
Toluene
days mean sd
0 9.37 1 10
4 313 051
7 0.00 000
000 0.0011
14 0.00 000
21 0.00 0.00
25 000 0.00
28 0.00 000
32 nd nd
35 nd nd
39 nd nd
42 000 0.00
60 000 0.00
control
1220
11 50
nd
11 40
11 80
10 80
600
952
11.90
10 80
11 30
997
11 40
control
950
9 18
nd
899
867
885
8.10
nd
nd
nd
982
8.18
mean
063
0.66
064
068
0.82
0.20
016
069
0.60
0.86
008
061
021
004
mean
086
067
6672
2333
7467
6881
31 15
54 16
3281
51 21
42.63
41.60
3533
Fe(II)
sd
008
006
001
014
0.01
o 11
002
001
o 13
002
0.50
001
008
Fe(II)
sd
003
546
1 78
281
449
1.11
2.53
259
1 61
3 18
622
631
control
093
063
092
085
061
047
046
1 42
1 84
327
248
026
033
047
control
079
081
071
098
088
039
1 05
1 19
3 13
353
034
1 73
1 02
Benzene
loss
3.13
6.38
848
799
971
874
453
8 14
976
993
11 27
9.69
12.73
Toluene
loss
541
8.83
8.98
859
9.11
7.02
798
7.58
9.54
894
829
963
pH
mean
7 16
769
pH
mean
754
7.57
Alkalinity (CaC03)
mean sd
364.31 2.10
357.03 94.54
56876 695
Alkalinity (CaC03)
mean sd
58825 4.11
57479
661 88 378
49
Table A3. (Continued)
Ethylbenzene
date days mean sd control
3/9/95 a 906 0.88
3/13/95 4 464 070 895
3/16/95 7 390 0.27 878
3/20/95 11 086 o 12 nd
3/23/95 14 1 67 0.73 8.51
3/27/95 18 039 008 875
3/30/95 21 I 50 010 803
4/3/95 25 000 000 8.56
4/6/95 28 0.33 030 7.75
4/10/95 32 000 000 851
4/13/95 35 015 o 19 731
4/17/95 39 0.00 000 8.18
4/20/95 42 005 005 695
5/8/95 60 000 000 779
a-Xylene
date days mean sd control
3/9/95 0 969 0.83
3/13/95 4 629 025 950
3/16/95 7 509 0.61 921
3/20/95 11 308 o18 nd
3/23/95 14 358 047 923
3/27/95 18 221 039 9.38
3/30/95 21 2.02 0.30 886
4/3/95 25 055 067 9 14
4/6/95 28 1 42 086 848
4/10/95 32 000 000 9.06
4/13/95 35 1 04 044 744
4/17/95 39 000 0.00 nd
4/20/95 42 1 22 028 729
5/8/95 60 000 000 861
mean
059
097
074
11 as 422
1200
o18
20.85
058
2602
0.18
2753
0.20
3727
mean
0.77
073
064
072
027
066
0.74
335
252
7.61
6.32
629
281
1680
Fe(II)
sd control
0.93
008 091
0.03 064
0.88 1 45
356 052
4.22 052
003 042
1 24 084
003 1 19
5 31 I 99
004 230
684 001
001 009
11 53 0.59
Fe(II)
sd control
087
010 097
002 071
001 113
006 0.16
027 052
006 036
0.96 1 17
134 1 39
1 75 419
0.65 380
1.04 005
021 0.21
1.30 0.59
E-benz
loss
410
463
839
694
777
800
7.38
8.10
674
8.21
735
8 11
7.60
o-Xyl
loss
392
457
6.99
606
765
8.28
874
791
871
879
962
908
1006
pH
mean
761
779
pH
mean
7.92
783
Alkalinity (CaC03)
mean sd
52678 074
49758 4615
47736 3 16
Alkalinity EDTA
mean sd live control
593 581
560.40 5860
493 15 10 91
593 569
57547 328
575
587 560
584
561 561
50
Table A4. Experimental data for toluene experiments started in June, 1995. Results in mgIL.